Article

Remote Sensing and Spatial Analysis for Land-Take Assessment in Basilicata Region (Southern Italy)

1
CNR IMAA, C.da Santa Loja, Zona Industriale, Tito Scalo, 85050 Potenza, Italy
2
School of Engineering, University of Basilicata, 10 Viale dell’Ateneo Lucano, 85100 Potenza, Italy
*
Author to whom correspondence should be addressed.
Remote Sens. 2022, 14(7), 1692; https://doi.org/10.3390/rs14071692
Submission received: 1 March 2022 / Revised: 23 March 2022 / Accepted: 27 March 2022 / Published: 31 March 2022

Abstract

:
Land use is one of the drivers of land-cover change (LCC) and represents the conversion of natural to artificial land cover. This work aims to describe the land-take-monitoring activities and analyze the development trend in test areas of the Basilicata region. Remote sensing is the primary technique for extracting land-use/land-cover (LULC) data. In this study, a new methodology of classification of Landsat data (TM–OLI) is proposed to detect land-cover information automatically and identify land take to perform a multi-temporal analysis. Moreover, within the defined model, it is crucial to use the territorial information layers of geotopographic database (GTDB) for the detailed definition of the land take. All stages of the classification process were developed using the supervised classification algorithm support vector machine (SVM) change-detection analysis, thus integrating the geographic information system (GIS) remote sensing data and adopting free and open-source software and data. The application of the proposed method allowed us to quickly extract detailed land-take maps with an overall accuracy greater than 90%, reducing the cost and processing time.

1. Introduction

Land take is represented by the growth of areas with artificial cover. It is associated with soil loss, defined as a change from non-artificial to artificial soil cover. In literature, soil change from natural to artificial cover is indicated in many ways, such as land take, land consumption, soil sealing, impermeable soil, etc. [1,2,3,4]. Knowing the changes in land use and land cover from natural to artificial is essential to understanding the interactions between human activities and the environment. The characteristics and consequences of land take are well known in the scientific literature [5,6,7]. In the European Union (EU), most of the population lives in cities, towns, and suburbs, and further urbanization is expected [8]. Built-up areas have mainly expanded to the detriment of agricultural land, and in recent decades, urban expansion has not matched population growth [9,10,11]. The National System of Environmental Protection (SNPA) monitors land take, and the Superior Institute for the Protection and Environmental Research (ISPRA) every year elaborates a study of the state of the art of land take in Italy [12]. The urban transformations of recent years have changed the relationship between urban centers and rural areas with the increase in territorial fragmentation [13,14,15,16,17]. In fact, in many territorial contexts, such as Basilicata Region, urban sprawl is strongly present, with consequent extensive waterproofing of the territory [18,19,20]. On a national scale, land take is constantly increasing; in fact, monitoring data show that artificial cover in Italy has been estimated at 21,430 km2 and about 316 km2 in Basilicata [12].
Nowadays, remotely sensed data with high spatial and spectral resolution have become increasingly available to quantify and monitor land-use and land-cover change from a local to a global and urban scale [21,22]. Remote sensing data provide detailed information and an overview of landscape features and changes in urban and rural areas. Land-cover mapping and assessment are among the main fields of remote sensing applications [23,24]. Numerous studies have addressed this issue using different applications, multispectral data, and classification methods [25,26,27].
Appropriate classification techniques are essential to derive reliable information from satellite data effectively. The careful choice of the classification method influences the land-use/-cover mapping [28,29]. Several classification methods have been developed for satellite image processing in recent years. A general overview of such methods includes both non-supervised classification algorithms (i.e., K-means algorithms, Isodata, etc.) and traditional supervised classification algorithms (i.e., maximum likelihood) and machine learning algorithms, such as support vector machines (SVM), k-Nearest Neighbors (kNN), decision trees (DT), and random forest (RF) [30,31]. Haydary et al. [32,33,34] used Landsat images applying several classification algorithms (kNN, SVM, and Artificial Neural Network) to compare the accuracy of results obtained using different classifiers’ and sampling methods’ heterogeneity of images and distribution of classes in space [35].
This research concerns a practical study on land-take time series, carried out through remote sensing data by the Landsat Mission, aiming to provide accurate information for selected sample area in Basilicata Region from 1994 to 2014. Analyzing land take starting from 2014 and then continuing backward in time is mainly related to updating the cartography present on the regional geo-topographic database. The information layers of the GTDB relating to urban/impermeable areas represent the ancillary reference data of our work with which to compare, using map algebra, the map obtained from the classification process.
Landsat images were classified using an automatic classifier. All process steps were developed integrating Geographical Information System (GIS) and remote sensing and adopting free and open-source software QGIS [35]. This work aims to create and use an expeditious methodology for classifying multitemporal Landsat imagery, using the semi-automatic classification algorithm in a GIS environment for mapping land use. The method developed has the potential of SVM based on machine learning theory to produce a synthetic map of land take that provides valuable and detailed information to improve the accuracy of land-cover mapping in complex landscapes and environments, such as urban peri-urban areas. The rest of the paper is organized as follows: Section 2 describes the study areas, datasets, and methodology. Section 3 demonstrates the results. The results are discussed in Section 4, and the conclusions are presented in Section 5.

2. Materials and Methods
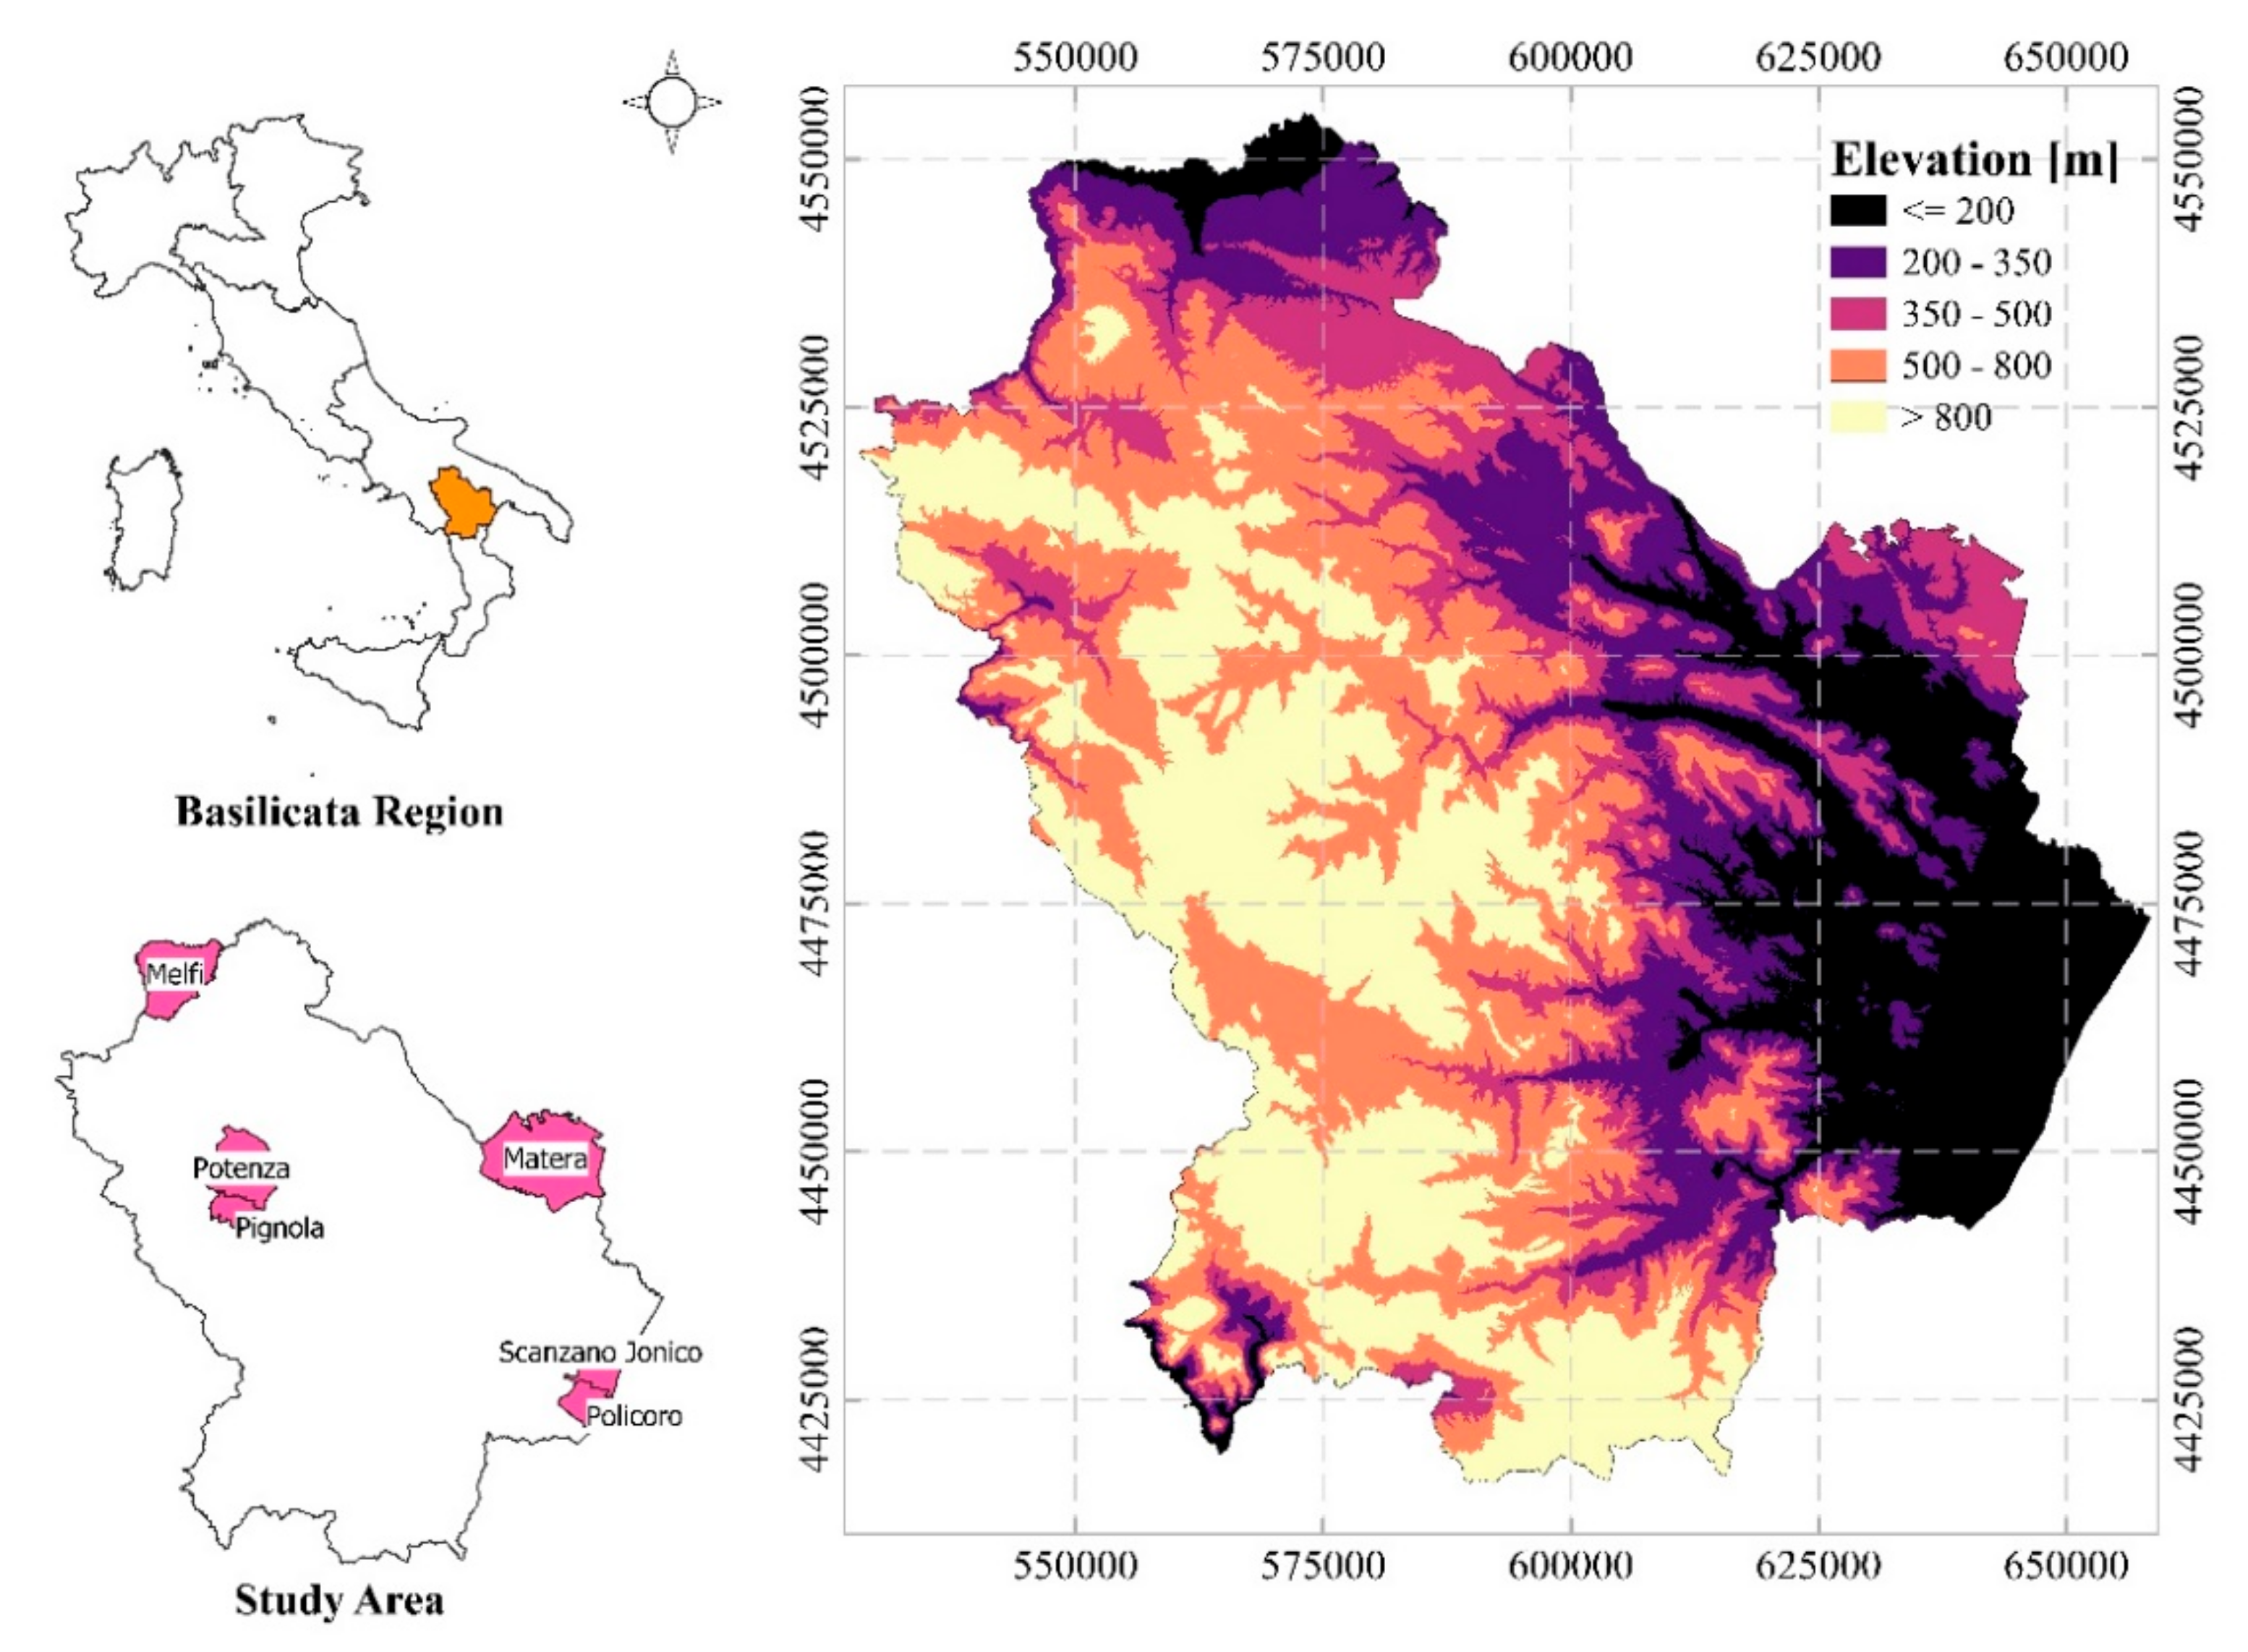
2.1. Study Area

The morphology of the Basilicata Region is predominantly mountainous and hilly, with a single, more extended plain in the area of the Metapontum (Ionian coast) and four valleys raising from the major rivers from the south to the northern part of the region. Urban centers are mainly located in the higher areas of the region for historically defensive reasons. They are generally surrounded by large uninhabited areas and sparse houses or small civil or industrial aggregates. Thirty percent of the territory is affected by areas subject to environmental constraints; these data further highlight the need for prudent and more sustainable use of natural soil.
Basilicata is among the Italian regions with a high rate of depopulation; according to the Italian National Statistical Office (ISTAT) [36], the resident population in the region decreased from approximately 600,000 in 2000 to about 547,500 inhabitants in 2021. The soil consumed per capita, which represents an essential indicator for estimating land take, in Italy in 2020 is about 359 m2 per inhabitant. In Basilicata, this value is about 571 m2 land take per inhabitant [12].
In recent years, a slow transformation from rural areas to suburban and urban areas occurred in all Italian regions. The Basilicata region was among those to show the most significant changes.
The provinces of Potenza and Matera have the highest land-take per capita values. Potenza has 626 m2 per inhabitant and Matera 470 m2 per inhabitant; the national average is 359 m2 per inhabitant [12]. The first three municipalities with high land take based on their surface are Potenza (10.7%), Melfi (8.6%), and Policoro (8.4%). In terms of absolute values of land consumed in 2020, the municipalities with the highest values are Matera (21,850 m2), Potenza (18,690 m2), and Melfi (17,590 m2) [12]. Considering the information elaborated by ISPRA, the historical trend of land take in the municipalities with the highest values was analyzed. The municipal areas investigated are Potenza and Matera and the municipalities of Pignola, Melfi, Policoro, and Scanzano Jonico (Figure 1).
Potenza is the main town located in the central-western part of the territory. The municipal area has an extension of about 175 km2; the morphology is mainly mountainous. The capital city, with about 65,000 inhabitants, is the political and administrative center of the region. Despite being the fulcrum of the administrative and commercial life of the region, it too suffers, like the whole region, from depopulation; the resident population has decreased by about 3000 in the last seven years. Over the years, urban expansion has taken place in a disorderly and uncontrolled way towards peripheral areas combined with a decline in population density.
Pignola is a small municipality (approximately 56 km2 of territorial extension) of about 7000 inhabitants and is close to Potenza. It is one of the municipalities with the most significant interaction with the city, as the territorial development of the two municipalities is often shared. Matera, the other provincial capital, is located in the region’s eastern part, on the border with the Apulia Region. As it was invested with the role of European Capital of Culture 2019, it is interesting to evaluate an increase in tourist flows and a potential increase in accommodation facilities and infrastructures to outline a trend of land take. The city is one of the few urban centers in the region to show a constant growth in a resident population (in 2021, about 60,000 inhabitants). The morphology of the city of Matera is purely hilly, characterized by the karst gorge carved into the limestone by the Gravina stream and the presence of evident surface karst forms; it is one of the largest municipalities in the region (388 km2). Policoro (which is the third most populous municipality of the Basilicata Region, with about 18,000) and Scanzano Jonico (about 7600 inhabitants) are located in the Ionian area of Basilicata in the fertile plain of Metapontum Area; their territorial extension is approximately 67 km2 and 71 km2. The coastal area, characterized by solid tourist pressure, especially in the summer season with the opening of bathing establishments, constitutes one of the most relevant areas to analyze land-use changes. Indeed, both municipalities show significant touristic flows in the summer, with consequent increase in land take linked to the construction of touristic infrastructures.
In recent years, the resident population has shown a positive trend, probably due to increased commercial activities linked to the strong tourist presence. The municipality of Melfi (about 204 km2) is located in the northern part of the region, on the border with the Puglia Region. The city is another critical urban center of great interest for the territorial evolution linked to the construction of the Stellantis industrial cars district, whose production started in 1994. It is characterized by a settlement structure based on two main components: the historic town surrounded by post-Second World War residential expansion and a vast industrial area where the most important Italian Stellantis production plant was established. A series of supporting activities have developed around the plant, leading to a significant increase in land take in recent decades. The rest of the municipal territory is characterized by a solid agricultural vocation and diffuse areas of high natural and environmental value already fragmented by three railway lines and a high-speed road. After undergoing a slight increase in the decades 1990–2000, the resident population has recorded a negative trend with a slight decrease in inhabitants.

2.2. Data Set and Preprocessing

Highly appropriate for the evaluation and monitoring of land take is the use of multispectral and multitemporal satellite images with medium and high spatial resolution. Landsat 4-5 TM and Landsat 8 OLI images, for the years 1994, 2004, and 2014, were used for classifying the LULC classes and for deriving urban land use. The historical Landsat (years 1994, 2004, and 2014) dataset was downloaded from the United States Geological Survey (USGS) [37,38], and images were selected based on cloud-cover conditions. The scan line error of Landsat ETM+ sensors affected data availability in the 2000s. Orthophoto produced by aerial images were made available by the national geoportal of the Ministry of the Environment and the Italian Military Geographic Institute (IGMI) [39]. These images were used as a dataset for defining the classification training areas and the accuracy assessment. Geo-topographic regional database (GTDB) of Regional Spatial Data Infrastructure Basilicata Region (RSDI) [40] represents ancillary data used for the implementation of urban areas. These data sources are open and generally provide basic information; this approach enables the study’s replicability in other territorial contexts. The processing and analysis of the collected data were carried out in QGIS software [35].
The satellite images used in this research come from Landsat 4–5 and Landsat 8 missions-based, cloud-free data. The chosen images concern the month of May in 1994, 2004, and 2014. The downloaded remote sensing images were provided as L2-level data and were clipped with the mask of the municipal boundaries of each test area, and then, a check was made to realign any saturated pixels. The reference system used is UTM projection (zone 33 N). Landsat data provide thirty-year time-series data, helpful in achieving an accurate temporal analysis. Landsat-4 and Landsat-5 Missions equipment a multi-spectral scanner and a Thematic Mapper, with spatial resolution at 30 m, while the Landsat-8 has an OLI sensor and a thermal sensor, the first with a resolution of 30 m and the second at 100 m. The bands used for this study are summarized in the following table (Table 1).
The images for each year are then prepared by layer stacking the relevant bands of Landsat images and further cropped to the study areas for image classification using Semi-automatic Classification Plugin (SCP) [41].

2.3. Support Vector Machine (SVM) and Classification Methodology

The satellite images classification process allows identifying pixels with similar spectral responses and grouping them into categories representing the classes recognized on the soil. The techniques of classification can be divided into supervised and non-supervised. The non-supervised classification does not require the a priori knowledge of the elements to be discriminated. Still, it is based only on the reflectance of the image pixels. In contrast, supervised classification implies the role of the operator who chose an a priori number of test areas (“training areas”) representative of the “regions of interest.” Input spectra can be obtained from region of interest (ROIs) carefully identified with the help of GIS techniques from technical or thematic cartography of the investigation area in the same reference system and superimposed on the image. Support vector machines (SVM) is a supervised automatic algorithm based on machine learning theory for data analysis [42].
The DZETSAKA plug-in is a powerful classification plugin for QGIS software [35] that supports several classification algorithms (e.g., Random Forest, kNN) and SVM [43].
The SVM classifier was selected for the land-cover classification of Landsat time-series data. This algorithm has proven to be a potent tool to handle a segmented raster input, or a standard image SVM can map the original data input into a higher-dimensional feature space. The algorithm finds the optimal hyperplanes: subspace capable of identifying distinct classes with minimum classification errors [44]. For this purpose, the training sample was selected at the class distribution margins in an n-dimensional space [45]. It is possible to use SVM to achieve high classification accuracy using a small number of training areas. Several previous studies showed that SVM could generalize unseen data with a small training dataset [31,46]. Therefore, using the SVM algorithm allows managing high-dimensional data with a limited training area set [46]. A detailed description of the SVM algorithm can be found in Burges [47].
Many aspects allow evaluating the classification result of a satellite image, e.g., the visualization of the map output, the query of the data on the GIS desktop, and the use of accuracy algorithms. The analytical procedure adopted in this work is oriented to discriminate the change detection of land take based on differences in territorial patches at different dates. The overall methodology of the study is described in Figure 2. The Landsat images were classified using an SVM algorithm to derive land-use and land-cover maps of 1994, 2004, and 2014. The training areas mainly include four typical classes: built-up (including roads, buildings, quarry, dump, and artificial areas), vegetation (including cultivated areas, forest, etc.), bare soils, and water. To facilitate the identification of the ROIs, ancillary data from the GTDB (Geo-Topographic Database) of the Basilicata Region [40] and orthophotos were used. GTDB is composed of different classes of information layers in shapefile format. Informative layers related to traffic (roads, railways, cycle paths, etc.), buildings, and artificial areas (buildings, quarries, support works, landfills, etc.) were adopted in this study. All the elements present in these informative layers were merged in a single vector layer and then converted into a binary raster with a spatial resolution of 30 × 30 m, whose pixels represent the artificial areas. The analytical approach is characterized by a backward process starting from the 2014 data (available in Basilicata Region GTDB and considered the most accurate datasets on urbanized features) and comparing it with previous information ranging from 2004 and 1994.

3. Results

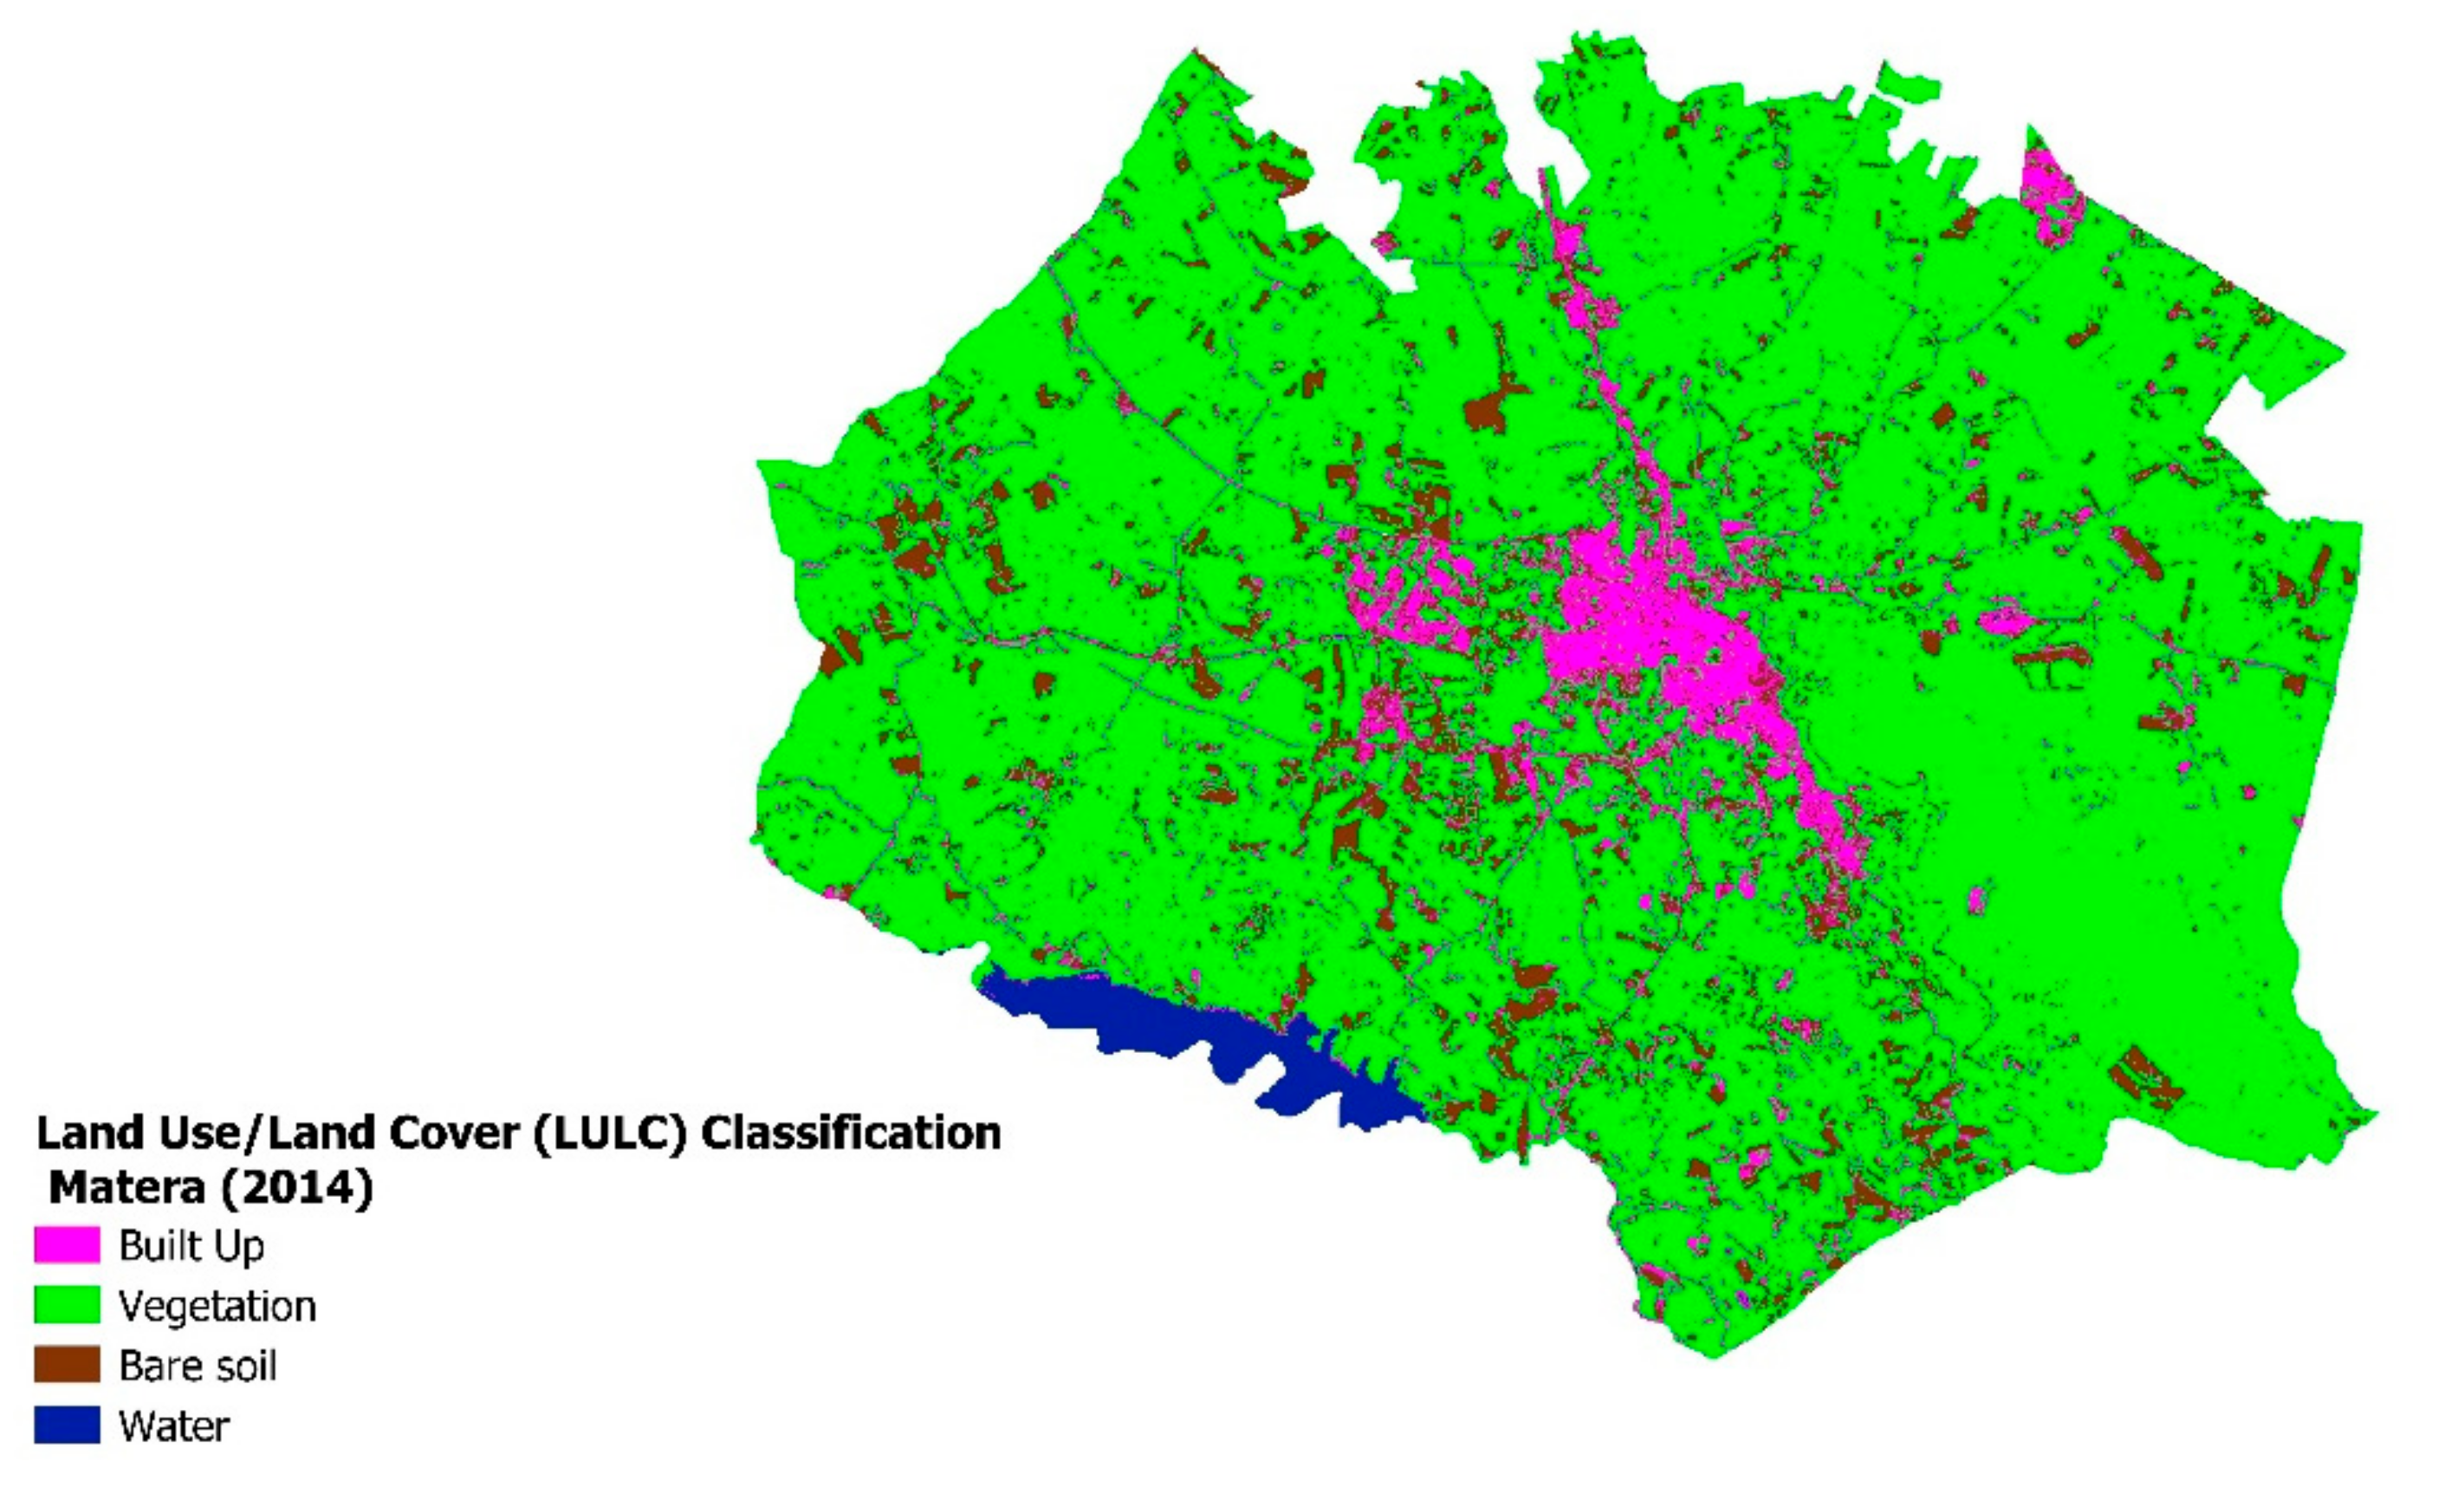
3.1. Land-Use/Land-Cover (LULC) Classification

Applying supervised classification with the integration of ancillary data (orthophotos, ground truth data), we created the land-cover map subsequently used as inputs for estimating land consumption in test areas. The land-cover map was finalized to obtain four classes: built-up, vegetation, bare soil, and water (Figure 3, Table 2).
The ROIs were defined by identifying these four macro-categories, called macro-classes/identifier (MC_ID), associated with them (Table 2). The geographical areas under consideration are particularly large; therefore, it was necessary to define a large number of homogeneously distributed ROI on the entire image to obtain a better response in terms of classification.
Once the classification was obtained, to assess the accuracy of the classification, the “Accuracy” tool of the SCP plug-in was used in a GIS environment [41]. In the SCP plug-in, several statistics are calculated: overall accuracy, user’s accuracy, producer’s accuracy, and kappa hat coefficient. In particular, these statistics are calculated according to the area-based error matrix, where each pixel represents the estimated area proportion of each class. This allows for evaluating the user’s accuracy and producer’s accuracy, the unbiased area of classes according to reference data, and the standard error of area estimates. The confusion matrix confirms the results’ reliability with overall accuracy values greater than 92% and K coefficient just below 0.93 (Table 3). Accuracy indicates the number of correctly classified pixels according to the soil classes. The accuracy matrix is generally composed of overall accuracy, user accuracy, producer accuracy, and kappa coefficient. Overall accuracy indicates the number of correctly classified pixels divided by the total number of pixels analyzed.
User’s accuracy is the ratio between correctly classified pixels in the considered class and the total number of pixels assigned to that class. The user accuracy indicates the probability that a pixel assigned to a given class corresponds to that class. Producer’s accuracy is the ratio between the number of pixels correctly classified in the considered class and the total number of reference pixels in that class. The kappa coefficient provides a parameter that considers that the correct part of the classification is due to chance or compares the error generated by the classification obtained with that of a classification performed in a completely random manner. The kappa coefficient has a value between 0 and 1; the more significant the agreement between real data and classified data, the closer the value of the coefficient will be to the value 1 [48].
The image classification was achieved with an overall classification accuracy of about 90% during 1994 and 2004 and >92% during 2014. Usually, in literature, an overall classification accuracy of 85% is considered acceptable for scientific use [49]. Image classification accuracy depends on the methodology classification, the quality of the data, the spatial resolution of the satellite images, and the study’s aim. The urban landscape of the six areas studied is more heterogeneous, and our methodology satisfies our objective and is suitable for the 30-m spatial resolution of Landsat images. Overall, Landsat OLI data had a better performance compared to Landsat ETM + data and achieved satisfactory land-cover classification results in this study.
The LULC images consist of four classes, such as agricultural land, built-up land, vegetation, bare soil, and water bodies. The area of each land-use class is displayed in Figure 3 based on the SVM algorithm.
Subsequently, the 2014 land-cover map thus classified was analyzed and compared with ancillary data, orthophotos, etc., paying particular attention to class 1 (built-up).
The GTDB of the Basilicata Region (dated 2014) comprises multiple information layers (urban areas, buildings, roads, and other anthropic objects) in vector format, representing important ancillary data used to validate the built-up class in the maps obtained. GTDB vector layers relating to urban/impermeable areas were rasterized in a binary map 0—1 (1, impermeable soil; 0, rest of land) (Figure 4). To compare the binary map thus obtained with the LULC map obtained from identifying the training areas, both maps must have the same spatial resolution; for this reason, the GTDB vector layers’ rasterized map was assigned the same spatial resolution as the LULC map of 30 m.
This map is essential to identify and eliminate, using map algebra, any class 1 pixels that are incorrectly classified by the SVM. In this way, the 2014 map represents the footprint of land take that delimits the area within which to develop analyses for previous years.
The classification system used by ISPRA and SNPA [12] provides a subdivision of land take into two categories: permanently land take and reversibly land take. The classes of irreversible land take are linked to the soil-sealing processes, such as constructing new buildings, streets, airports, etc. The chosen method assumes that sealed soil does not change into permeable soil over the years. This concept is not always true because this can happen in some rare cases. Starting from this concept, from 2014, we proceeded backward in analyzing 2004 and 1994, comparing this information with previous cartography and orthophotos. This comparison with the orthophotos, available as Web Map Service (WMS) on the National Geoportal of the Ministry of the Environment [39], allowed us to construct the spatial time-series analysis based on the aero-photogrammetric surveys.
The built-up areas extracted from the 2014 LULC layer (Figure 5) were used as the impermeable base map and used as a comparison and reference in the analyses carried out for 1994 and 2004 for Landsat.

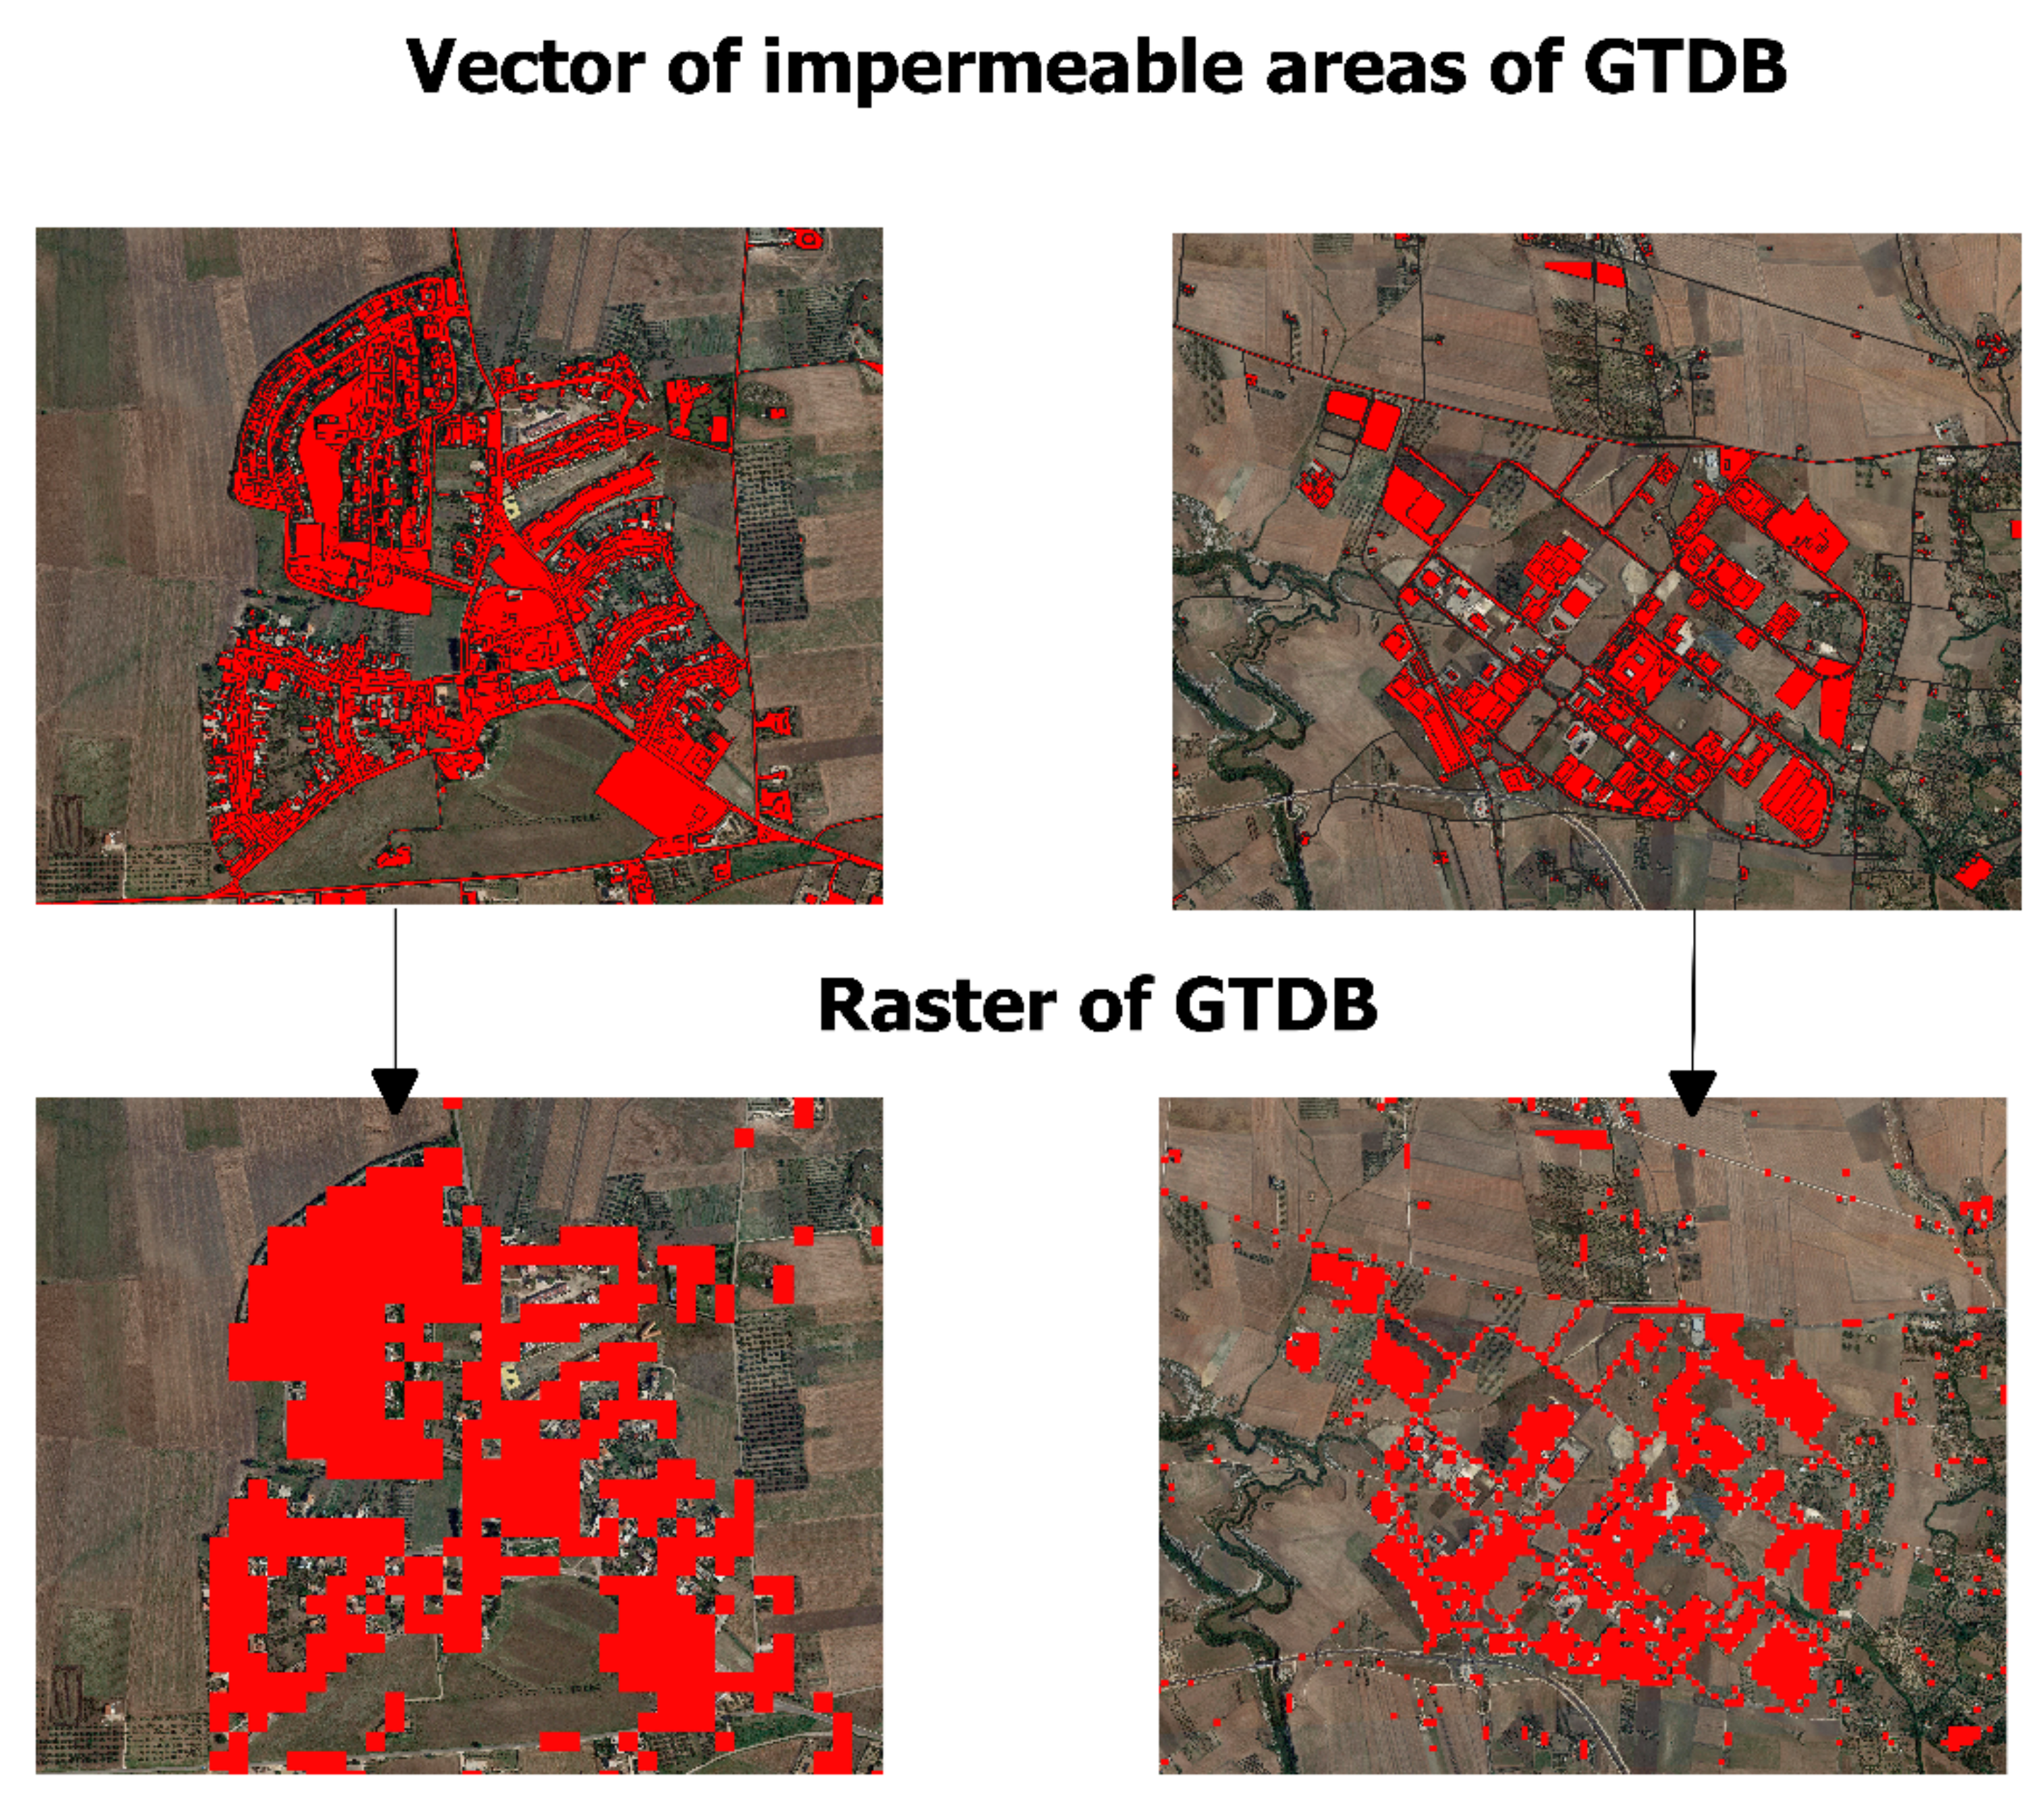
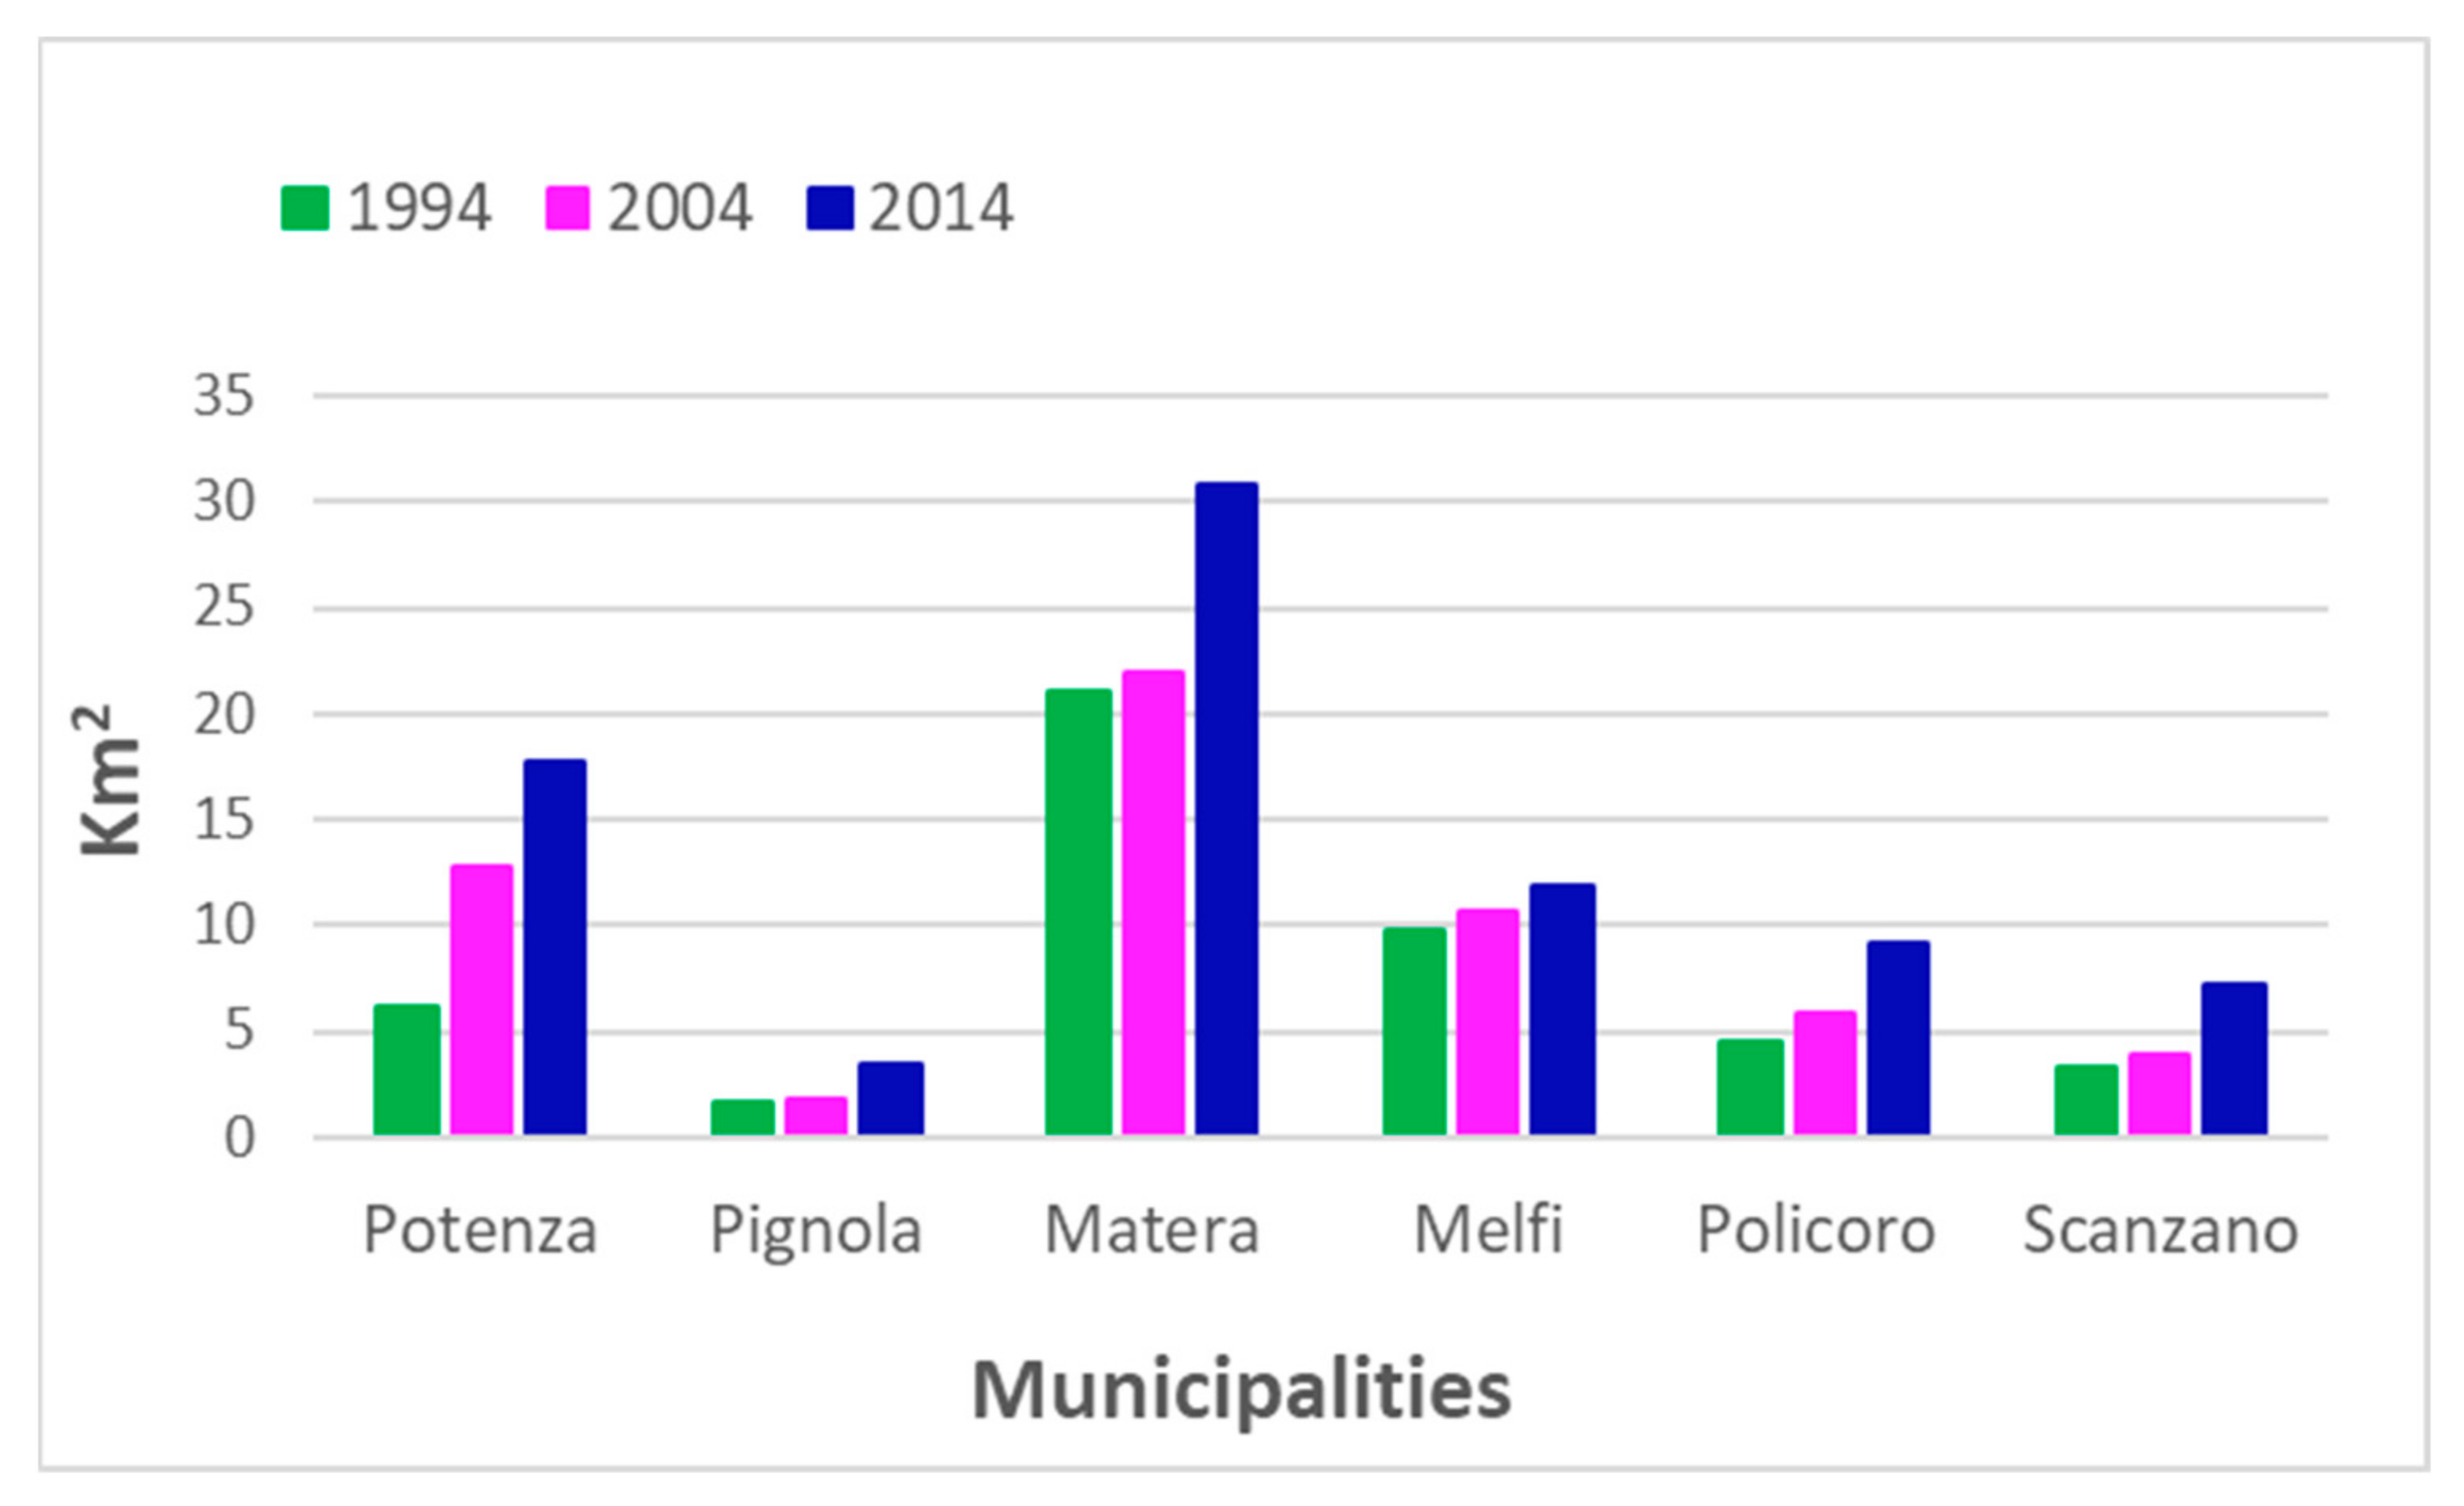
3.2. Land Take Classification

The results show that the growth of impermeable areas (built-up areas) occurred mainly in areas away from the city center, mostly near industrial and rural areas.
In the six municipalities described above, the historical evolution of land take due to increased impermeable surfaces (built-up/urbanized) was analyzed. A gradual intensification process of urbanized areas has emerged by analyzing and comparing the binary maps of land take obtained in the three different reference years (1994, 2004, and 2014). The results show that the municipalities analyzed underwent an evident territorial transformation in the twenty years considered, characterized by a steady increase in land take.
The graph in Figure 6 represents the increasing growth rate of the overall built-up municipalities analyzed. The most significant amount of land take occurred between 2004 and 2014 in all municipalities investigated, suggesting that both the socio-economic and natural features drive the urbanization of these areas.
The municipalities of Potenza, Pignola, and Melfi show slow growth in land take. Potenza and Pignola have a relevant settlement spread characterized by disordered urban sprawl. Specifically, during the twenty years analyzed, the land take in the capital city involved expanding commercial and residential areas near the historic center. It is also relevant to note the development and construction of new infrastructures and roads. In the area of the municipality of Pignola, the significant increase in land take occurred mainly with the construction of residential structures along the main provincial road that connects the town with the capital and neighboring municipalities (Figure 7a,b).
The land take in the area of the municipality of Melfi is closely linked to industrial and urban expansion; as shown in Figure 8, the areas that have more significant growth of impermeable soil are located in the industrial area of the Stellantis plant and its induced factories and in the urban area, where there has been a growth of the city. In addition, several roads connecting the urban center with the peripheral and industrial areas have been built and expanded (Figure 8a,b).
Policoro and Scanzano Jonico municipalities, such as Potenza and Pignola, have a solid territorial and socio-economic relation; they present a substantial settlement diffusion on the whole municipal territory, but the land take follows the territorial road structure (Figure 9a,b). The growth of the land-take phenomenon in the two municipalities on the Ionian coast could be linked to the increase in tourist flows in the area in recent decades.
Furthermore, in this case, indeed, most of the impermeable soil is located near the inhabited centers that have developed close to the main road that connects the area with the neighboring regions (Puglia and Calabria). The area of the two municipalities is characterized by a solid anthropic tourism pressure along the coasts, occurring in recent years, following the construction of tourist infrastructure; this has resulted in an essential waterproofing of the entire Ionian coast. The area considered is also intensively cultivated by different crops ranging from vegetables to crops of valuable fruits; over the years, we have witnessed the gradual construction of greenhouses and roads of relevance that have contributed to the increase of land take in agricultural and rural areas.
Matera has an evident urban sprawl similar to the case of Policoro and Scanzano Jonico: new buildings are mainly located along the main roads. The construction of new buildings has been haphazard both close to the urban center and in the suburbs. Additionally, in the case of Matera, an essential percentage of the increase of impermeable soil is linked to the presence of infrastructures. Matera, in 2019, was the European Capital of Culture. Consequently, in previous years, many services and infrastructures were realized throughout the municipality, increasing the phenomenon of soil sealing (Figure 10a,b).
The analysis of the maps shows the pixels that have changed over the past decades, highlighting an expansion of the area urban to areas that once belonged to the open territory. This confirms that the part of the municipalities analyzed and their neighborhoods have undergone substantial changes in recent decades.

4. Discussions

This study presents an innovative supervised classification approach to detect land-use and land-cover change from natural to impervious areas.
The classification results for Landsat TM and Landsat OLI, presented with SVM, exhibit an accuracy performance more significant than 92%. The land-use and land-cover maps obtained from the classification were validated with an overall accuracy greater than 92% and a kappa hat coefficient greater than 0.90 (Table 3) and represent the evolution of land take in the areas considered.
The results of this study are in line with those of previous studies [22,28,31,45,46,50,51,52,53,54]. SVM algorithm maintains the spatial features of such landscapes, such as fragmentation, and is the most appropriate algorithm in classifying the land-cover analysis of an urban environment.
Ghayour et al. [25] used and evaluated several algorithms, such as like Support Vector Machine (SVM), Artificial Neural Network (ANN), Maximum Likelihood Classification (MLC), Minimum Distance (MD), and Mahalanobis (MH), and compared them to generate a LULC map using data from Landsat 8 satellites. They assessed that the SVM classifier produced the highest overall accuracy of 94%, with performance better than other methods. Agapiou [55], for his study on the city of Larnaca (Cyprus), used the CORONA satellite image and performed, using the SVM, a land-cover classification. It selected five main land-cover classes: land, water, salt lake, vegetation, and urban areas. The results show classification accuracy > 85 and kappa coefficient of 0.91. In another study, Adam et al. [56] used two machine learning algorithms, SVM and Random Forest, to create the LULC map of a region on the East African coast using the high-resolution RapidEye image. Using the training data, they ranked the region with an overall SVM accuracy of 91.80%. Jia et al. [30] classified land cover in Beijing by comparing Landsat 7 and Landsat 8 images using supervised MLC and SVM algorithms. With an overall accuracy of 91.03% and kappa coefficient of 0.89, the SVM algorithm is more accurate than the MLC algorithm. Therefore, the SVM algorithm performs better than other algorithms applied in other studies because it requires fewer training areas, reducing the possibility of classification error. The values of the overall accuracy of each classification are always greater than 92%. The satellite image classification process can produce errors. These classification errors are mainly due to the detection of water (lake, reservoir) or bare soil (rocky outcrops with the perennial absence of vegetation cover). On the contrary, the errors of omission correspond to some mixed urban and vegetational models, such as residential subdivisions, where the vegetation is particularly dense, or even to the different types of vegetation present.
These limitations are mainly due to the spatial and spectral resolution of the Landsat OLI and TM sensors. Both have a spatial resolution of 30 m; each pixel has, therefore, an extension of 900 m2. Moreover, both sensors are multispectral and not hyperspectral, which involves limitations in detecting some spectral signatures.
In Figure 11, the observed changes are mainly identified as pixel blocks in urban areas representing urban growth.
The change detection analysis showed an increase in impermeable areas and a decrease in other natural areas from 1994 to 2014. Although the land-take process is generally non-reversible, rare cases of reversibility can be recognized. Therefore, the model is suitable to detect such areas; an example of this reverse transformation process was identified from impermeable land (housing and roads) in 1994 to permeable land in 2014, following a landslide event (Figure 12 and Figure 13).
In this study, both TM and OLI images were acquired in the same month to obtain a low margin of error in classification. The month of May, in fact, at these latitudes represents the period of the year when the vegetation is at its maximum vegetative development. Thus, using the Landsat OLI images, the methodology presented here provided the most accurate spatial shape and conformity of the classes regardless of the input classification settings. The algorithm achieved better accuracy for Landsat OLI images for the same classes and the same training and validation data. In contrast, Landsat TM image classification maps were less accurate and required more ROIs. Some confusion between the classes also existed in OLI results but not as much as in the case of TM. At the same time, the separation of bare soil and impermeable areas (artificial vs. natural) was performed with greater precision. It should be highlighted that the aim of the work is not to monitor the changes in land cover in the area but to identify the waterproofed areas in the years analyzed. In conclusion, by analyzing medium-resolution imagery provided by Landsat TM and OLI using advanced methods, such as SVM and change-detection analyses, it is possible to achieve highly accurate classification maps.
The layers of the impermeable areas present in the dataset used in this work are updated to 2014, and no future updates are expected. This represents a limitation for studying the historical evolution of land take in Basilicata, as this dataset constitutes the fundamental reference data of the impermeable areas in the classification process.

5. Conclusions

Nowadays, land-use and land-cover maps and the use of the information contained in them are crucial for territorial planning. The use of satellite imagery and appropriate classification algorithms, such as SVM, applied in this work, represent the most appropriate strategy for creating land-take maps at detailed scales.
Satellite data have proven to help edit an accurate, diachronic analysis of land take and impermeable soils. The integration between remote sensing and spatial data allows for detailed monitoring of anthropic territorial transformation.
The methodology here presented allowed synthesis maps helpful in analyzing the land-use changes and interpreting the evolution of urbanized areas (in terms of growth) and the natural and semi-natural surfaces (generally decreasing in extension). The use of satellite imagery (Landsat TM 4-5 and Landsat OLI 8) and remote sensing techniques in a GIS environment allowed to define of spatial parameters through supervised classification to discriminate urban areas from other land-use classes.
This work confirmed that the SVM algorithm and the exposed methodology are the proper LULC classification instrument. Analyzing and comparing different years, the process of urban intensification was observed, and the increase of urbanized areas was revealed.
The methodology adopted highlights a possible way to check land take using free data and software. The great advantage is that such a methodology can enormously improve planning processes at any scale. The information obtained in this work for the analysis of built-up development defines a fragmented picture of the study area. Though applied to urban areas, the methodology can be used in any other land-cover-classification topic.
Landsat data are notoriously suitable for historical mapping and diachronic analyses of land take, as they present a vast historical availability of images at a spatial resolution of 30 m. In the future, the use of Sentinel 2 data is indicated for monitoring urbanized areas and for estimating urban areas as a more detailed classification of the LULC to reduce uncertainty in the survey of urban areas and estimation of impermeability. Future developments will also concern hyperspectral images, such as PRISMA ones [57]. Hyperspectral remote sensing is very promising and significant in the remote sensing community in recent times. In hyperspectral data, hundreds of contiguous bands provide detailed spectral information for each pixel, which is helpful for mapping and classification studies, which are more accurate. Practical applications of hyperspectral imaging also include urban processes land-cover mapping.

Author Contributions

All authors contributed equally to this work. Experiment design and writing of the manuscript was developed jointly by all authors. All authors have read and agreed to the published version of the manuscript.

Funding

This research was funded by Farbas—Fondazione Ambiente Ricerca Basilicata—Regione Basilicata with in MEV-CSU Project (MEtodologie avanzate per la Valutazione del Con-sumo di SUolo connesso ai processi di sviluppo del sistema insediativo, relazionale e naturali-stico ambientale della Regione Basilicata); Collaboration Agreement signed between CNR-IMAA and FARBAS (Fondazione Ambiente Ricerca Basilicata) on 7 August 2018.

Acknowledgments

This research has been supported by the Environmental Observatory Foundation of Basilicata Region (FARBAS).

Conflicts of Interest

The authors declare no conflict of interest. The funders had no role in the design of the study; in the collection, analyses, or interpretation of data; in the writing of the manuscript, or in the decision to publish the results.

References

  1. Marquard, E.; Bartke, S.; Font, J.G.I.; Humer, A.; Jonkman, A.; Jürgenson, E.; Marot, N.; Poelmans, L.; Repe, B.; Rybski, R.; et al. Land Consumption and Land Take: Enhancing Conceptual Clarity for Evaluating Spatial Governance in the EU Context. Sustainability 2020, 12, 8269. [Google Scholar] [CrossRef]
  2. Seto, K.C.; Güneralp, B.; Hutyra, L.R. Global forecasts of urban expansion to 2030 and direct impacts on biodiversity and carbon pools. Proc. Natl. Acad. Sci. USA 2012, 109, 16083–16088. [Google Scholar] [CrossRef] [PubMed] [Green Version]
  3. Yuan, Y.; Chen, D.; Wu, S.; Mo, L.; Tong, G.; Total, D.Y.-S. Undefined Urban Sprawl Decreases the Value of Ecosystem Services and Intensifies the Supply Scarcity of Ecosystem Services in China; Elsevier: Amsterdam, The Netherlands, 2019. [Google Scholar]
  4. Santarsiero, V.; Nolè, G.; Lanorte, A.; Tucci, B.; Baldantoni, P.; Murgante, B. Evolution of Soil Consumption in the Municipality of Melfi (Southern Italy) in Relation to Renewable Energy. Lect. Notes Comput. Sci. 2019, 11621, 675–682. [Google Scholar] [CrossRef]
  5. Richardson, H.W.; Bae, C.H.C. Urban Sprawl in Western Europe and the United States; Routledge: London, UK, 2017; pp. 1–325. [Google Scholar] [CrossRef]
  6. Fiorini, L.; Zullo, F.; Marucci, A.; Romano, B. Land take and landscape loss: Effect of uncontrolled urbanization in Southern Italy. J. Urban Manag. 2019, 8, 42–56. [Google Scholar] [CrossRef]
  7. Romano, B.; Zullo, F.; Fiorini, L.; Marucci, A.; Ciabò, S. Land transformation of Italy due to half a century of urbanization. Land Use Policy 2017, 67, 387–400. [Google Scholar] [CrossRef]
  8. World Urbanization Prospects—Population Division—United Nations. Available online: https://population.un.org/wup/ (accessed on 3 November 2021).
  9. van Vliet, J.; Eitelberg, D.A.; Verburg, P. A global analysis of land take in cropland areas and production displacement from urbanization. Glob. Environ. Chang. 2017, 43, 107–115. [Google Scholar] [CrossRef]
  10. Annual Activity Reports 2016|European Commission. Available online: https://ec.europa.eu/info/publications/annual-activity-reports-2016_en (accessed on 18 March 2022).
  11. Imbrenda, V.; Quaranta, G.; Salvia, R.; Egidi, G.; Salvati, L.; ProkopovÃ, M.; Coluzzi, R.; Lanfredi, M. Land degradation and metropolitan expansion in a peri-urban environment. Geomat. Nat. Hazards Risk 2021, 12, 1797–1818. [Google Scholar] [CrossRef]
  12. ISPRA Institute. Consumo di Suolo, Dinamiche Territoriali e Servizi Ecosistemici Edizione 2021 Rapporto ISPRA SNPA; ISPRA Institute: Rome, Italy, 2021; ISBN 9788844810597. [Google Scholar]
  13. Saganeiti, L.; Favale, A.; Pilogallo, A.; Scorza, F.; Murgante, B. Assessing Urban Fragmentation at Regional Scale Using Sprinkling Indexes. Sustainability 2018, 10, 3274. [Google Scholar] [CrossRef] [Green Version]
  14. Puertas, O.L.; Henríquez, C.; Meza, F. Assessing spatial dynamics of urban growth using an integrated land use model. Application in Santiago Metropolitan Area, 2010–2045. Land Use Policy 2014, 38, 415–425. [Google Scholar] [CrossRef]
  15. Saganeiti, L.; Mustafa, A.; Teller, J.; Murgante, B. Modeling urban sprinkling with cellular automata. Sustain. Cities Soc. 2021, 65, 102586. [Google Scholar] [CrossRef]
  16. Scorza, F.; Pilogallo, A.; Saganeiti, L.; Murgante, B. Natura 2000 Areas and Sites of National Interest (SNI): Measuring (un)Integration between Naturalness Preservation and Environmental Remediation Policies. Sustainability 2020, 12, 2928. [Google Scholar] [CrossRef] [Green Version]
  17. Saganeiti, L.; Pilogallo, A.; Scorza, F.; Mussuto, G.; Murgante, B. Spatial Indicators to Evaluate Urban Fragmentation in Basilicata Region. Lect. Notes Comput. Sci. 2018, 10964, 100–112. [Google Scholar] [CrossRef]
  18. Amato, F.; Maimone, B.A.; Martellozzo, F.; Nolè, G.; Murgante, B. The Effects of Urban Policies on the Development of Urban Areas. Sustainability 2016, 8, 297. [Google Scholar] [CrossRef] [Green Version]
  19. Nolè, G.; Lasaponara, R.; Lanorte, A.; Murgante, B. Quantifying Urban Sprawl with Spatial Autocorrelation Techniques using Multi-Temporal Satellite Data. Int. J. Agric. Environ. Inf. Syst. 2014, 5, 19–37. [Google Scholar] [CrossRef] [Green Version]
  20. Baldantoni, P.; Nolè, G.; Lanorte, A.; Tucci, B.; Santarsiero, V.; Murgante, B. Trend Definition of Soil Consumption in the Period 1994–2014—Municipalities of Potenza, Matera and Melfi. Lect. Notes Comput. Sci. 2019, 11621, 683–691. [Google Scholar] [CrossRef]
  21. Abuelaish, B.; Teresa, M.; Olmedo, M.T.C. Scenario of land use and land cover change in the Gaza Strip using remote sensing and GIS models. Arab. J. Geosci. 2016, 9, 1–14. [Google Scholar] [CrossRef] [Green Version]
  22. Joshi, N.; Baumann, M.; Ehammer, A.; Fensholt, R.; Grogan, K.; Hostert, P.; Jepsen, M.R.; Kuemmerle, T.; Meyfroidt, P.; Mitchard, E.T.A.; et al. A Review of the Application of Optical and Radar Remote Sensing Data Fusion to Land Use Mapping and Monitoring. Remote Sens. 2016, 8, 70. [Google Scholar] [CrossRef] [Green Version]
  23. Schatz, E.-M.; Bovet, J.; Lieder, S.; Schroeter-Schlaack, C.; Strunz, S.; Marquard, E. Land take in environmental assessments: Recent advances and persisting challenges in selected EU countries. Land Use Policy 2021, 111, 105730. [Google Scholar] [CrossRef]
  24. Rahman, A.; Kumar, S.; Fazal, S.; Siddiqui, M.A. Assessment of Land use/land cover Change in the North-West District of Delhi Using Remote Sensing and GIS Techniques. J. Indian Soc. Remote Sens. 2012, 40, 689–697. [Google Scholar] [CrossRef]
  25. Ghayour, L.; Neshat, A.; Paryani, S.; Shahabi, H.; Shirzadi, A.; Chen, W.; Al-Ansari, N.; Geertsema, M.; Amiri, M.P.; Gholamnia, M.; et al. Performance Evaluation of Sentinel-2 and Landsat 8 OLI Data for Land Cover/Use Classification Using a Comparison between Machine Learning Algorithms. Remote Sens. 2021, 13, 1349. [Google Scholar] [CrossRef]
  26. Birdi, P.K.; Kale, K.V. Accuracy Assessment of Classification on Landsat-8 Data for Land Cover and Land Use of an Urban Area by Applying Different Image Fusion Techniques and Varying Training Samples. Lect. Notes Electr. Eng. 2018, 521, 189–198. [Google Scholar] [CrossRef]
  27. Aung, H.P.P.; Aung, S.T. Analysis of Land Cover Change Detection Using Satellite Images in Patheingyi Township. Adv. Intell. Syst. Comput. 2018, 744, 364–373. [Google Scholar] [CrossRef]
  28. Friedl, M.; Brodley, C. Decision tree classification of land cover from remotely sensed data. Remote Sens. Environ. 1997, 61, 399–409. [Google Scholar] [CrossRef]
  29. Lu, D.; Weng, Q. A survey of image classification methods and techniques for improving classification performance A survey of image classification methods and techniques for improving classification performance. Int. J. Remote Sens. 2007, 28, 823–870. [Google Scholar] [CrossRef]
  30. Jia, K.; Wei, X.; Gu, X.; Yao, Y.; Xie, X.; Li, B. Land cover classification using Landsat 8 Operational Land Imager data in Beijing, China. Geocarto Int. 2014, 29, 941–951. [Google Scholar] [CrossRef]
  31. Shao, Y.; Lunetta, R.S. Comparison of support vector machine, neural network, and CART algorithms for the land-cover classification using limited training data points. ISPRS J. Photogramm. Remote Sens. 2012, 70, 78–87. [Google Scholar] [CrossRef]
  32. Heydari, S.S.; Mountrakis, G. Effect of classifier selection, reference sample size, reference class distribution and scene heterogeneity in per-pixel classification accuracy using 26 Landsat sites. Remote Sens. Environ. 2018, 204, 648–658. [Google Scholar] [CrossRef]
  33. Kwan, C.; Ayhan, B.; Budavari, B.; Lu, Y.; Perez, D.; Li, J.; Bernabe, S.; Plaza, A. Deep Learning for Land Cover Classification Using Only a Few Bands. Remote Sens. 2020, 12, 2000. [Google Scholar] [CrossRef]
  34. Naushad, R.; Kaur, T.; Ghaderpour, E. Deep Transfer Learning for Land Use and Land Cover Classification: A Comparative Study. Sensors 2021, 21, 8083. [Google Scholar] [CrossRef]
  35. Afrin, S.; Gupta, A.; Farjad, B.; Ahmed, M.R.; Achari, G.; Hassan, Q.K. Development of Land-Use/Land-Cover Maps Using Landsat-8 and MODIS Data, and Their Integration for Hydro-Ecological Applications. Sensors 2019, 19, 4891. [Google Scholar] [CrossRef] [Green Version]
  36. Popolazione Residente al 1 Gennaio: Basilicata. Available online: http://dati.istat.it/Index.aspx?QueryId=18564 (accessed on 23 November 2021).
  37. USGS (United States Geological Survey). Available online: https://earthexplorer.usgs.gov (accessed on 10 June 2017).
  38. USGS Landsat Missions Home Page. Available online: https://www.usgs.gov/core-science-systems/nli/landsat (accessed on 14 December 2021).
  39. Home—Geoportale Nazionale. Available online: http://www.pcn.minambiente.it/mattm/ (accessed on 24 November 2021).
  40. RSDI. Available online: https://rsdi.regione.basilicata.it/ (accessed on 24 November 2021).
  41. QGIS Python Plugins Repository. Available online: https://plugins.qgis.org/plugins/SemiAutomaticClassificationPlugin/ (accessed on 16 December 2021).
  42. Di Palma, F.; Amato, F.; Nolè, G.; Martellozzo, F.; Murgante, B. A SMAP Supervised Classification of Landsat Images for Urban Sprawl Evaluation. ISPRS Int. J. Geo-Inf. 2016, 5, 109. [Google Scholar] [CrossRef] [Green Version]
  43. GitHub—Nkarasiak/Dzetsaka: Dzetsaka: Classification Plugin for Qgis. Available online: https://github.com/nkarasiak/dzetsaka (accessed on 24 November 2021).
  44. Nolè, G.; Murgante, B.; Calamita, G.; Lanorte, A.; Lasaponara, R. Evaluation of urban sprawl from space using open source technologies. Ecol. Inform. 2015, 26, 151–161. [Google Scholar] [CrossRef]
  45. Zheng, B.; Myint, S.W.; Thenkabail, P.S.; Aggarwal, R.M. A support vector machine to identify irrigated crop types using time-series Landsat NDVI data. Int. J. Appl. Earth Obs. Geoinf. 2015, 34, 103–112. [Google Scholar] [CrossRef]
  46. Plaza, A.; Benediktsson, J.A.; Boardman, J.W.; Brazile, J.; Bruzzone, L.; Camps-Valls, G.; Chanussot, J.; Fauvel, M.; Gamba, P.; Gualtieri, A.; et al. Recent advances in techniques for hyperspectral image processing. Remote Sens. Environ. 2009, 113, S110–S122. [Google Scholar] [CrossRef]
  47. Burges, C.J.C. A Tutorial on Support Vector Machines for Pattern Recognition. Data Min. Knowl. Discov. 1998, 2, 121–167. [Google Scholar] [CrossRef]
  48. Paoletti, M. Sistematica Molecolare e Coevoluzione Parassita-Ospite, in Specie del Genere Contracaecum (Namatoda: Anisakidae), Parassite di Uccelli Ittiofagi. Ph.D. Thesis, University of Tuscia, Viterbo, Italy, 2009. [Google Scholar]
  49. A Land Use and Land Cover Classification System for Use with Remote Sensor Data-James Richard Anderson-Google Libri. Available online: https://pubs.usgs.gov/pp/0964/report.pdf (accessed on 24 November 2021).
  50. Poursanidis, D.; Chrysoulakis, N.; Mitraka, Z. Landsat 8 vs. Landsat 5: A comparison based on urban and peri-urban land cover mapping. Int. J. Appl. Earth Obs. Geoinf. 2015, 35(Pt. B), 259–269. [Google Scholar] [CrossRef]
  51. Classification Method, Spectral Diversity, Band Combination and Accuracy Assessment Evaluation for Urban Feature Detection|Elsevier Enhanced Reader. Available online: https://reader.elsevier.com/reader/sd/pii/S0303243411002030?token=5D340853EB3DB0D18D8E4C96A5543D4DDA456DA3B314EB1A6DC1644B79C4FD641F9BA530562A24BF187764C97A466176&originRegion=eu-west-1&originCreation=20211222151310 (accessed on 22 December 2021).
  52. Kadavi, P.R.; Lee, C.-W. Land cover classification analysis of volcanic island in Aleutian Arc using an artificial neural network (ANN) and a support vector machine (SVM) from Landsat imagery. Geosci. J. 2018, 22, 653–665. [Google Scholar] [CrossRef]
  53. Eskandari, S.; Jaafari, M.R.; Oliva, P.; Ghorbanzadeh, O.; Blaschke, T. Mapping Land Cover and Tree Canopy Cover in Zagros Forests of Iran: Application of Sentinel-2, Google Earth, and Field Data. Remote Sens. 2020, 12, 1912. [Google Scholar] [CrossRef]
  54. Eskandari, S. Mapping the land uses and analysing the landscape elements in south-western Iran: Application of Landsat-7, field data, and landscape metrics Identification of suitable lands for wood farming by Eucalyptus in Khuzestan Province View project. Int. J. Conserv. Sci. 2020, 11, 557–564. [Google Scholar]
  55. Agapiou, A. Land Cover Mapping from Colorized CORONA Archived Greyscale Satellite Data and Feature Extraction Classification. Land 2021, 10, 771. [Google Scholar] [CrossRef]
  56. Adam, E.; Mutanga, O.; Odindi, J.; Abdel-Rahman, E.M. Land-use/cover classification in a heterogeneous coastal landscape using RapidEye imagery: Evaluating the performance of random forest and support vector machines classifiers. Int. J. Remote Sens. 2014, 35, 3440–3458. [Google Scholar] [CrossRef]
  57. Pignatti, S.; Acito, N.; Amato, U.; Casa, R.; Castaldi, F.; Coluzzi, R.; De Bonis, R.; Diani, M.; Imbrenda, V.; Laneve, G. Environmental Products Overview of the Italian Hyperspectral Prisma Mission: The SAP4PRISMA Project; IEEE: New York, NY, USA, 2015; pp. 3997–4000. [Google Scholar]
Figure 1. Location map of study areas.
Remotesensing 14 01692 g001
Figure 2. Flowchart of classification methodology.
Remotesensing 14 01692 g002
Figure 3. Landsat 8 OLI image with ROIs and LULC map 2014 obtained with the SVM (support vector machine) algorithm (Example of classification referred to Matera Municipality).
Remotesensing 14 01692 g003
Figure 4. Example of rasterization process of GTDB vector layers relating to urbanized areas (built-up areas).
Remotesensing 14 01692 g004
Figure 5. Correlation between LULC Map representative of all classes identified in 2014 in the Municipality of Matera and the Binary Map regarding impermeable areas (built-up).
Remotesensing 14 01692 g005
Figure 6. Observed built-up growth in square kilometers in the studies areas from 1994 to 2014.
Remotesensing 14 01692 g006
Figure 7. (a) Observed built-up growth in square kilometers in the studies areas from 1994 to 2014 in the Municipalities of Potenza and Pignola. (b) In green, land take in 1994; in pink, land take in 2004; and in blue, land take in 2014.
Remotesensing 14 01692 g007
Figure 8. (a) Observed built-up growth in square kilometers in the studies area from 1994 to 2014 in the Municipality of Melfi. (b) In green, land take in 1994; in pink, land take in 2004; and in blue, land take in 2014.
Remotesensing 14 01692 g008
Figure 9. (a) Observed built-up growth in square kilometers in the studies area from 1994 to 2014 in the Municipalities of Scanzano and Policoro. (b) In green, land take in 1994; in pink, land take in 2004; and in blue, land take in 2014.
Remotesensing 14 01692 g009aRemotesensing 14 01692 g009b
Figure 10. (a) Observed built-up growth in square kilometers in the studies area from 1994 to 2014 in the Municipality of Matera. (b) In green, land take in 1994; in pink, land take in 2004; and in blue, land take in 2014.
Remotesensing 14 01692 g010aRemotesensing 14 01692 g010b
Figure 11. Change Detection (1994 to 2014) of Land Take in Matera. Overview of the whole area and zoom view of black-squared area.
Remotesensing 14 01692 g011
Figure 12. In reverse transformation: from impermeable soil to permeable. In red, in 1994 and 2004, it is possible to see the urban agglomerate destroyed in 2013 due to a landslide (Bosco Piccolo Street, Potenza Municipality).
Remotesensing 14 01692 g012
Figure 13. Detail of the urban agglomeration (Bosco Piccolo Street, Municipality of Potenza) destroyed by the 2013 landslide. In blue are the information layers of the GTDB of the Basilicata region regarding the waterproof areas.
Remotesensing 14 01692 g013
Table 1. Landsat 4–5 and Landsat 8 bands used.
Landsat 4–5 TMLandsat 8 OLI
Band1—Blue (0.45–0.52 µm)Band2—Blue (0.450–0.51 µm)
Band2—Green (0.50–0.60 µm)Band3—Green (0.53–0.59 µm)
Band3—Red (0.63–0.69 µm)Band4—Red (0.64–0.67 µm)
Band4—Near Infrared (NIR) (0.76–0.90 µm)Band5—Near Infrared (NIR) (0.85–0.88 µm)
Band5—Shortwave Infrared (SWIR) (1.55–1.75 µm)Band6—Shortwave Infrared (SWIR) (1.57–1.65 µm)
Band6—Mid-Infrared (MIR) (2.08–2.35 µm)Band10—Thermal Infrared (TIR) (10.6–11.19 µm)
Table 2. Class definition for training areas.
MC_IDDefinitionDescription
1UrbanBuilt-up, Streets, Industrial Buildings
2VegetationForest, Cultivated Areas, Grassland
3Bare SoilRocks
4WaterLake, River
Table 3. Example of accuracy statistics for the pixel-based classification algorithm of Matera LULC Classification (2014).
Overall Accuracy (%)Kappa Hat
Coefficient
Classes User Accuracy (%)Producer Accuracy (%)
94.28%0.9281Class 1 (Built-up)89.21392.989
Class2 (Vegetation)94.23795.660
Class 3 (Bare Soil)93.43491.735
Class 4 (Water)10099.759
Publisher’s Note: MDPI stays neutral with regard to jurisdictional claims in published maps and institutional affiliations.

