
Concurrent Climate Extremes and Impacts on Ecosystems in Southwest China

 ,
,  , ,
, , 
Abstract
:1. Introduction
2. Materials and Methods
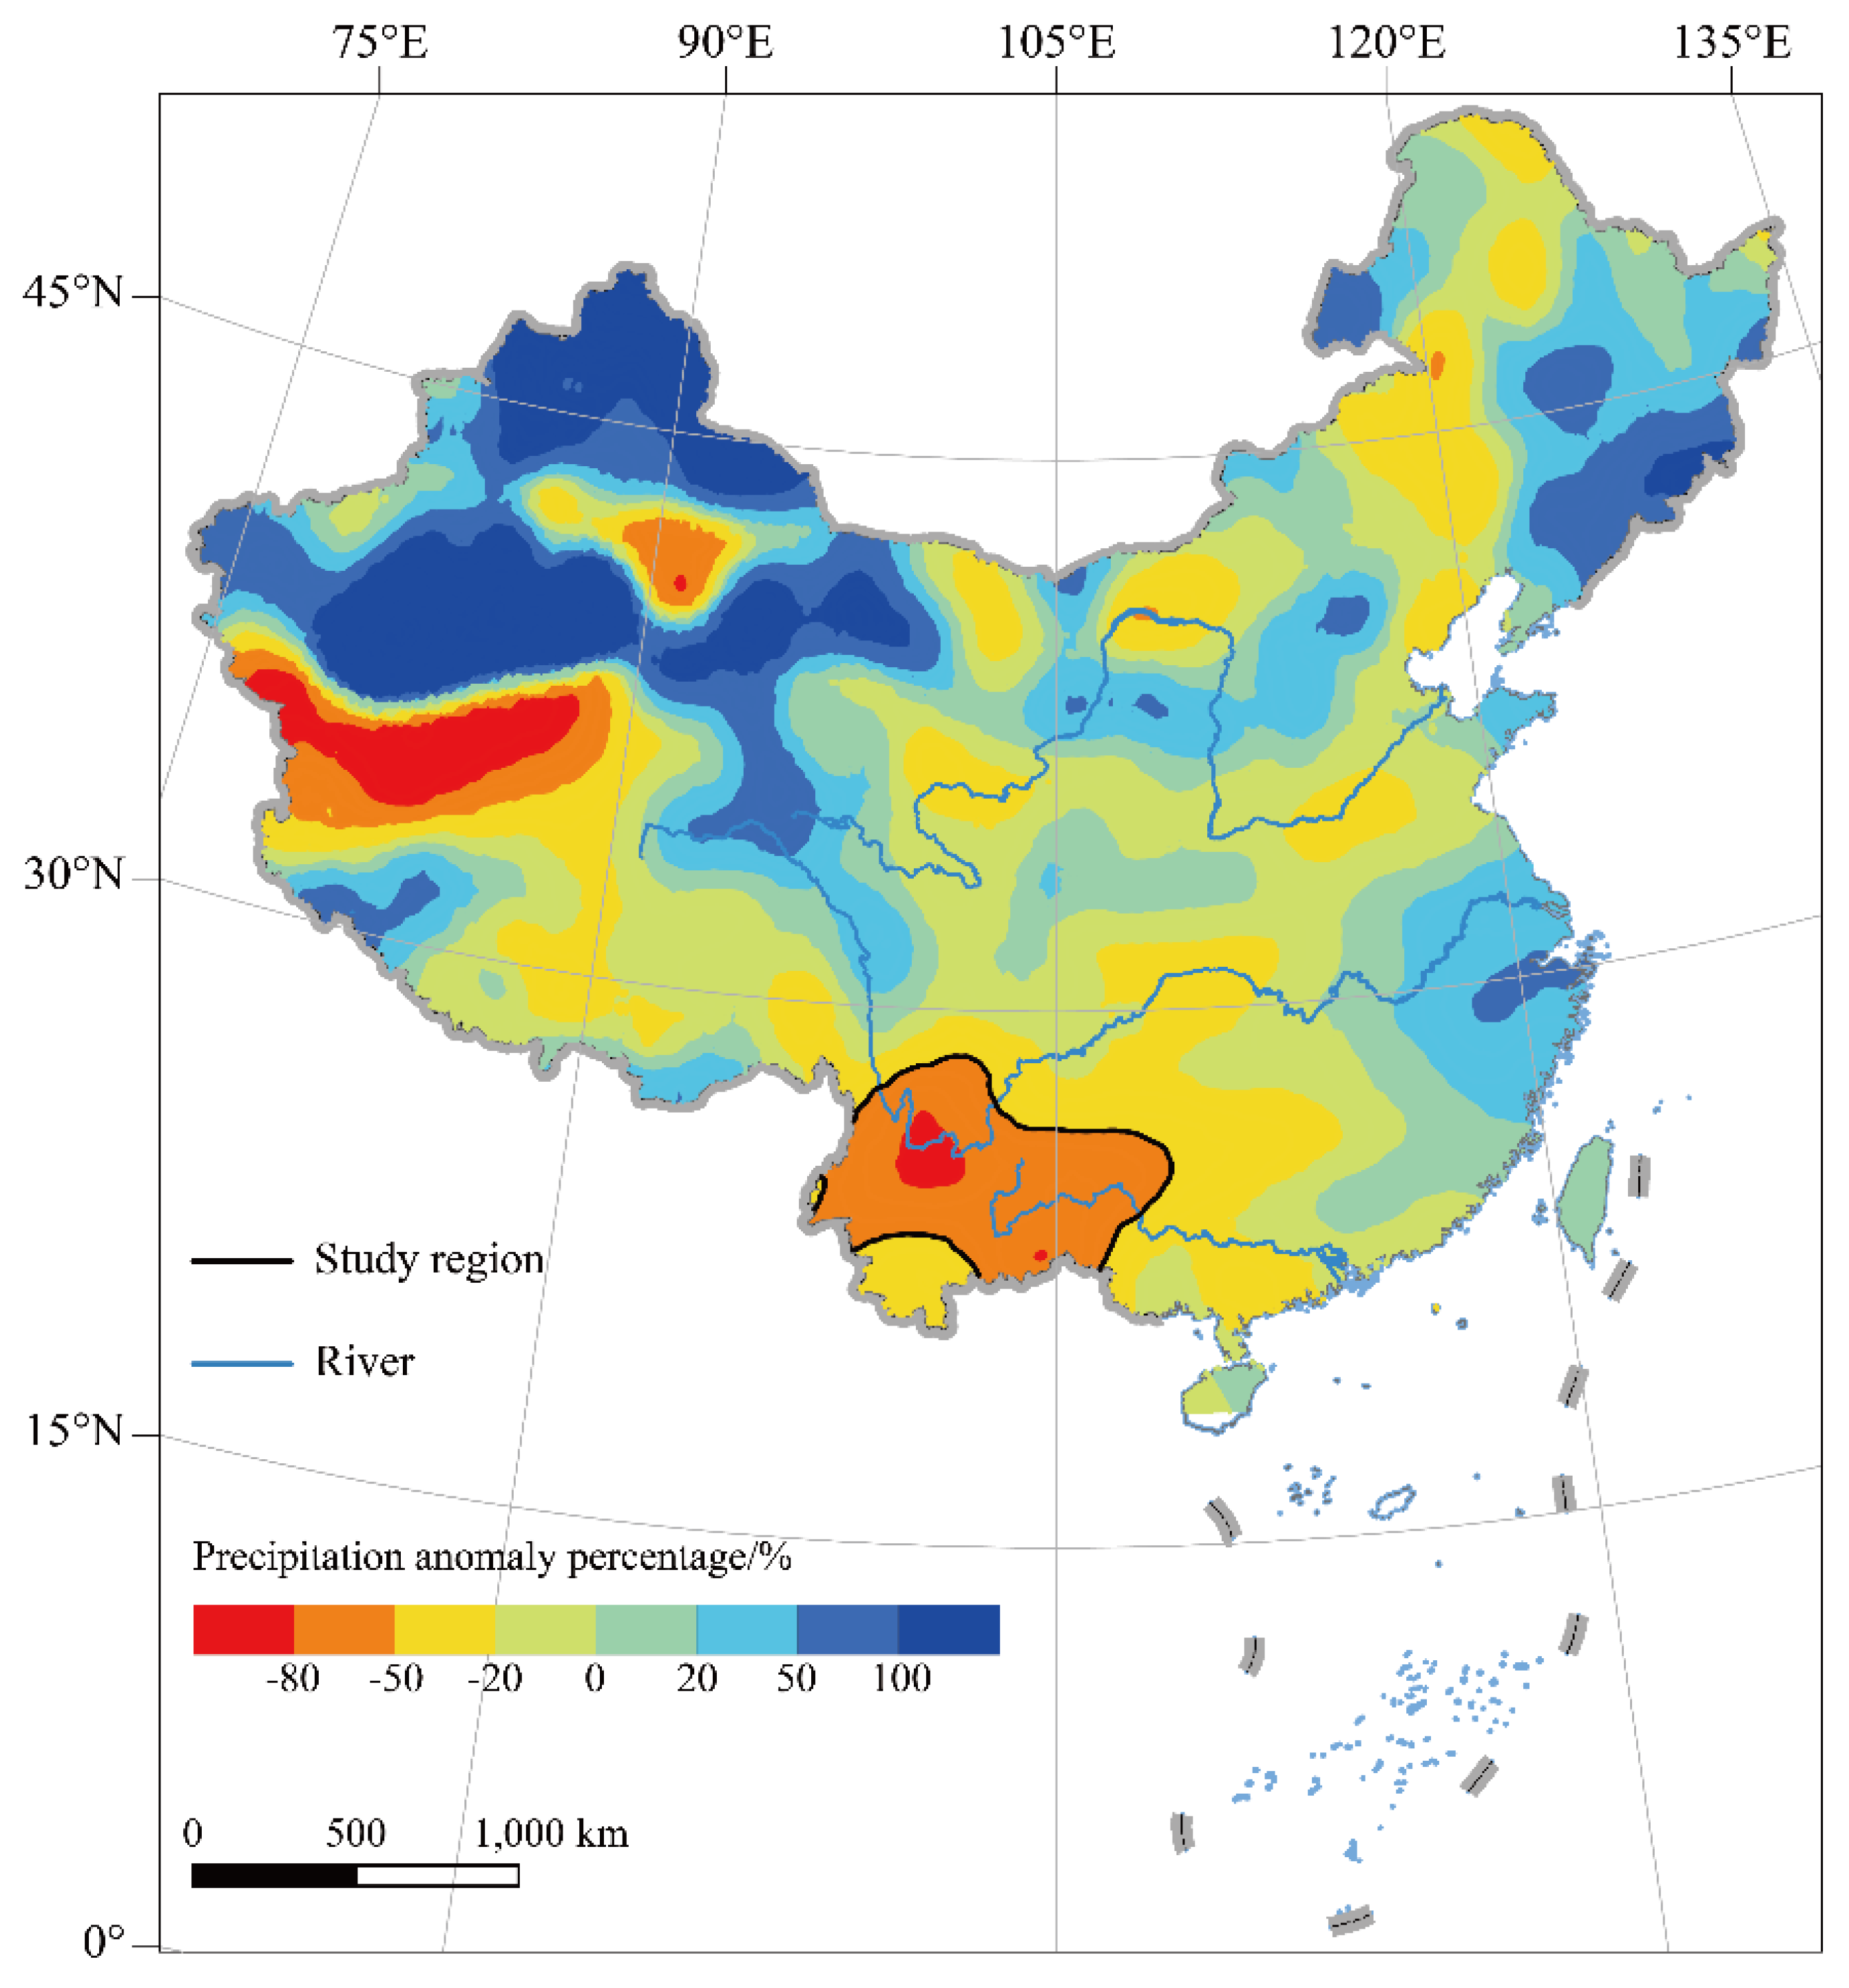
2.1. Study Region
2.2. Data
2.3. Methods
2.3.1. Accuracy Measurement Indicator and Method
2.3.2. Return Period Analysis of Concurrent Climate Extremes
2.3.3. Impact of Concurrent Events on the Ecosystem
3. Results
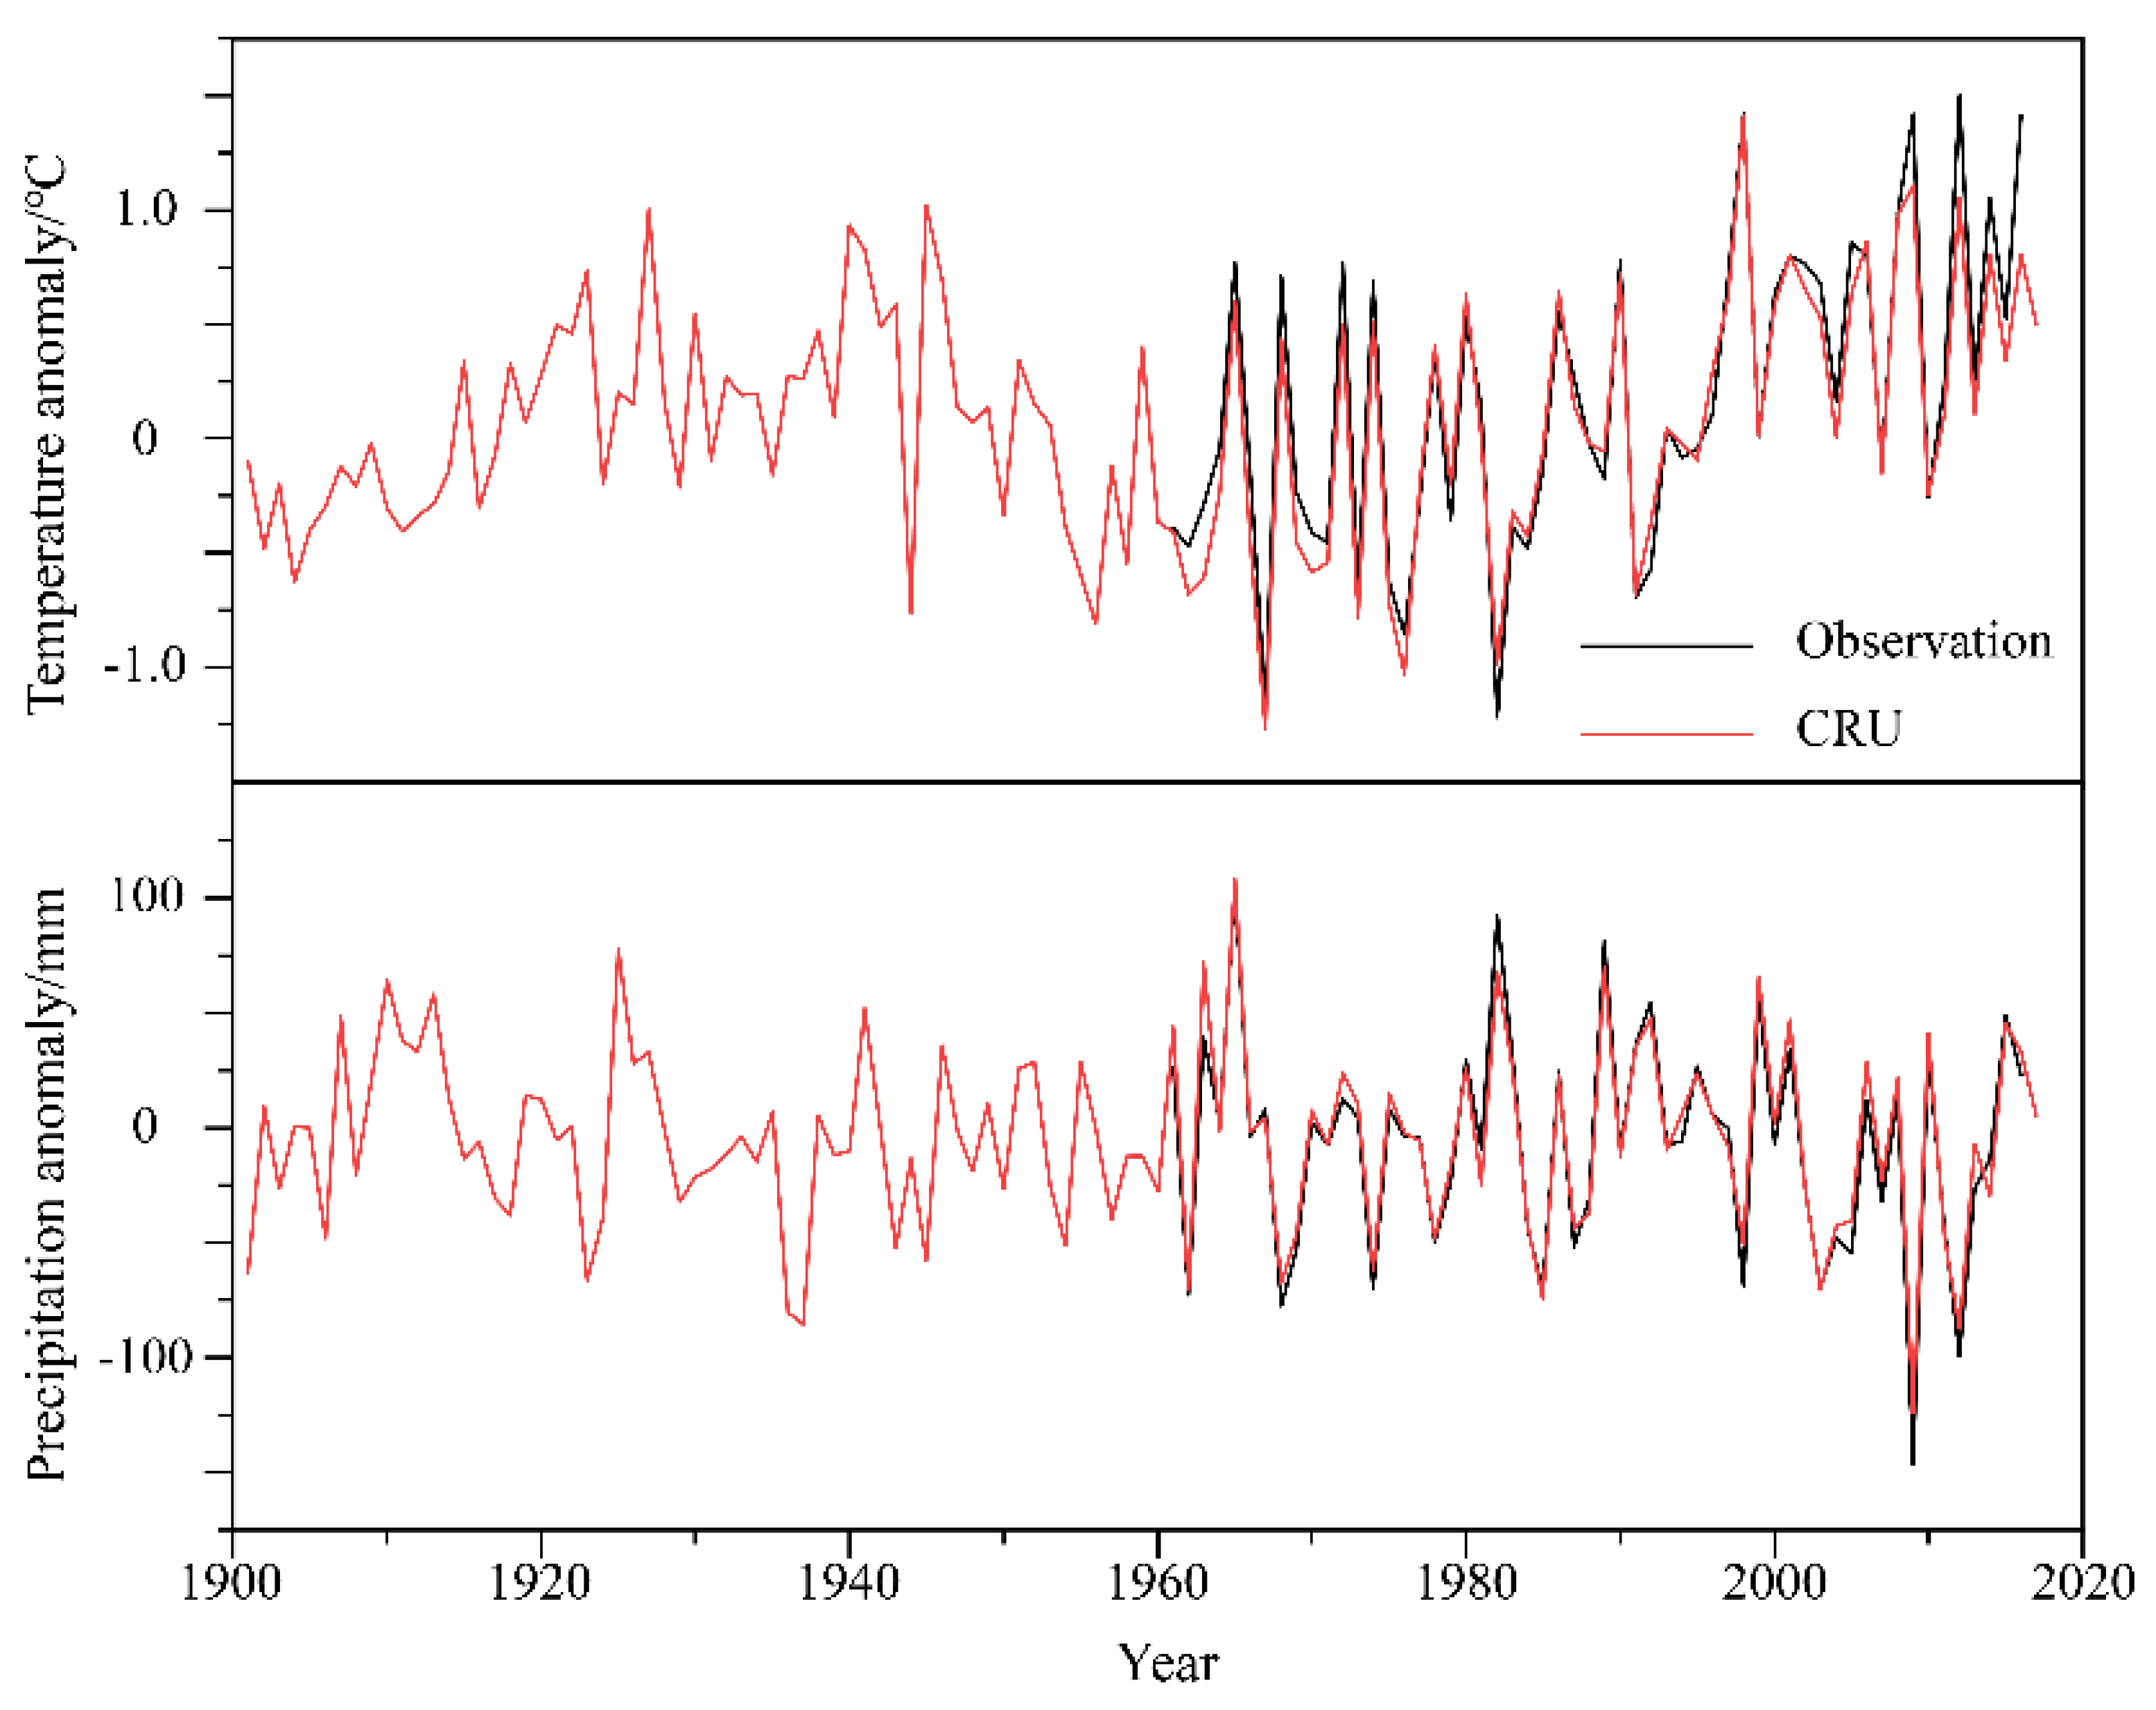
3.1. Accuracy Measurement of CRU TS Datasets
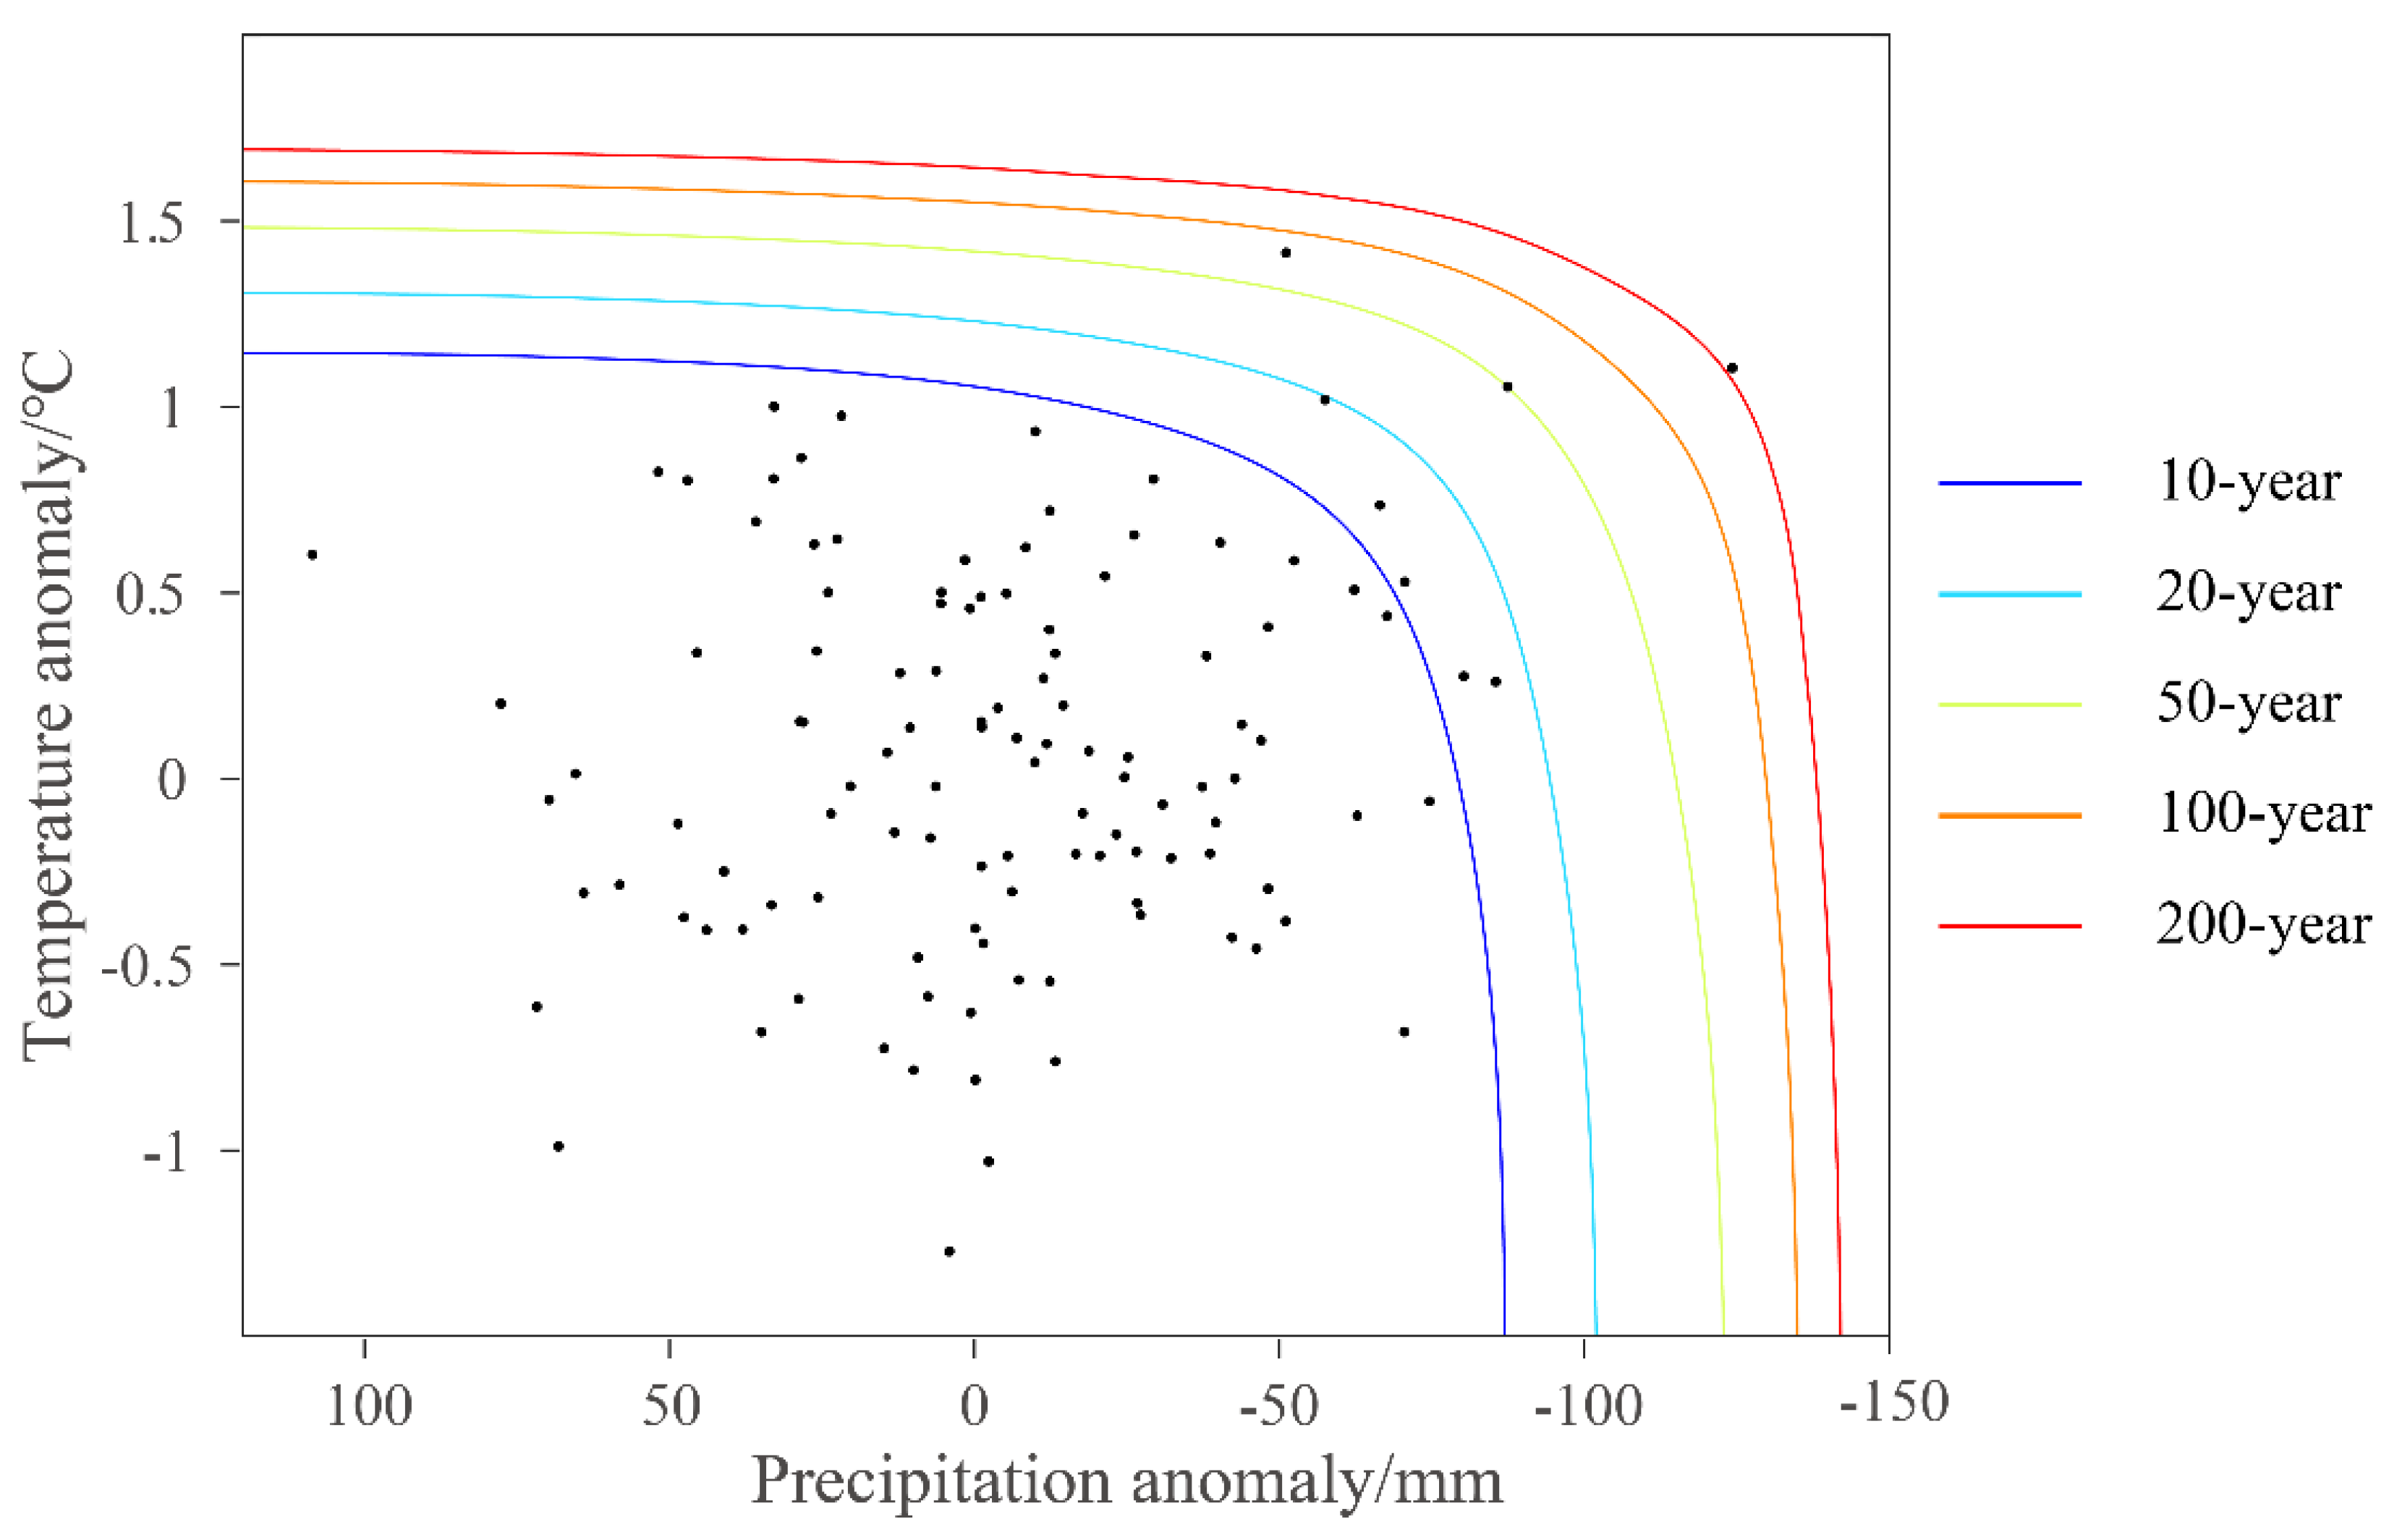
3.2. Return Period of Concurrent Events of Precipitation Deficit and Extreme Temperature
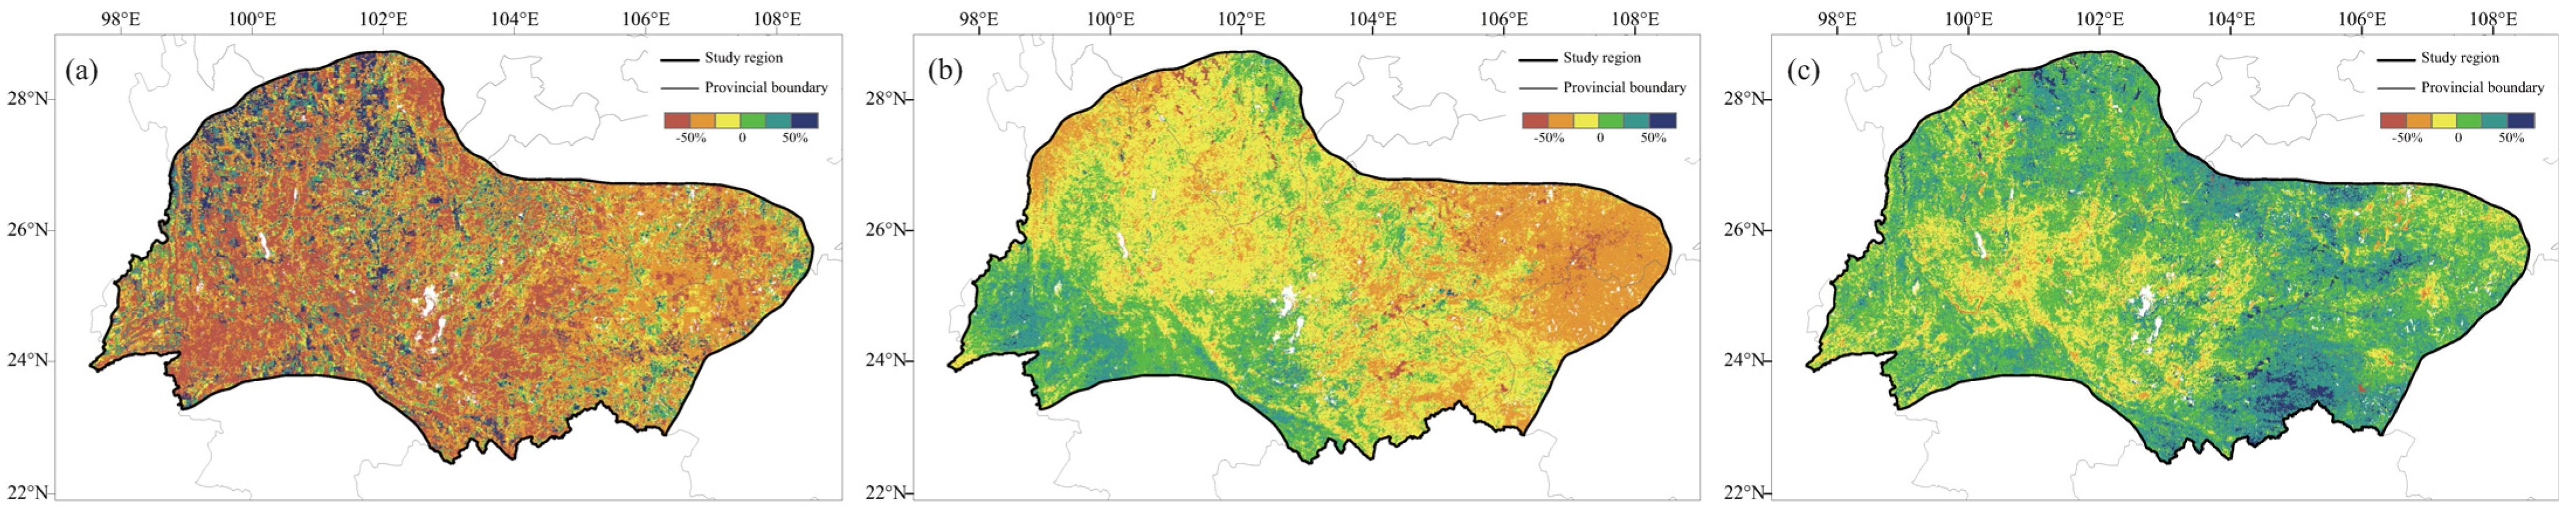
3.3. Impact of Concurrent Events on the Ecosystem
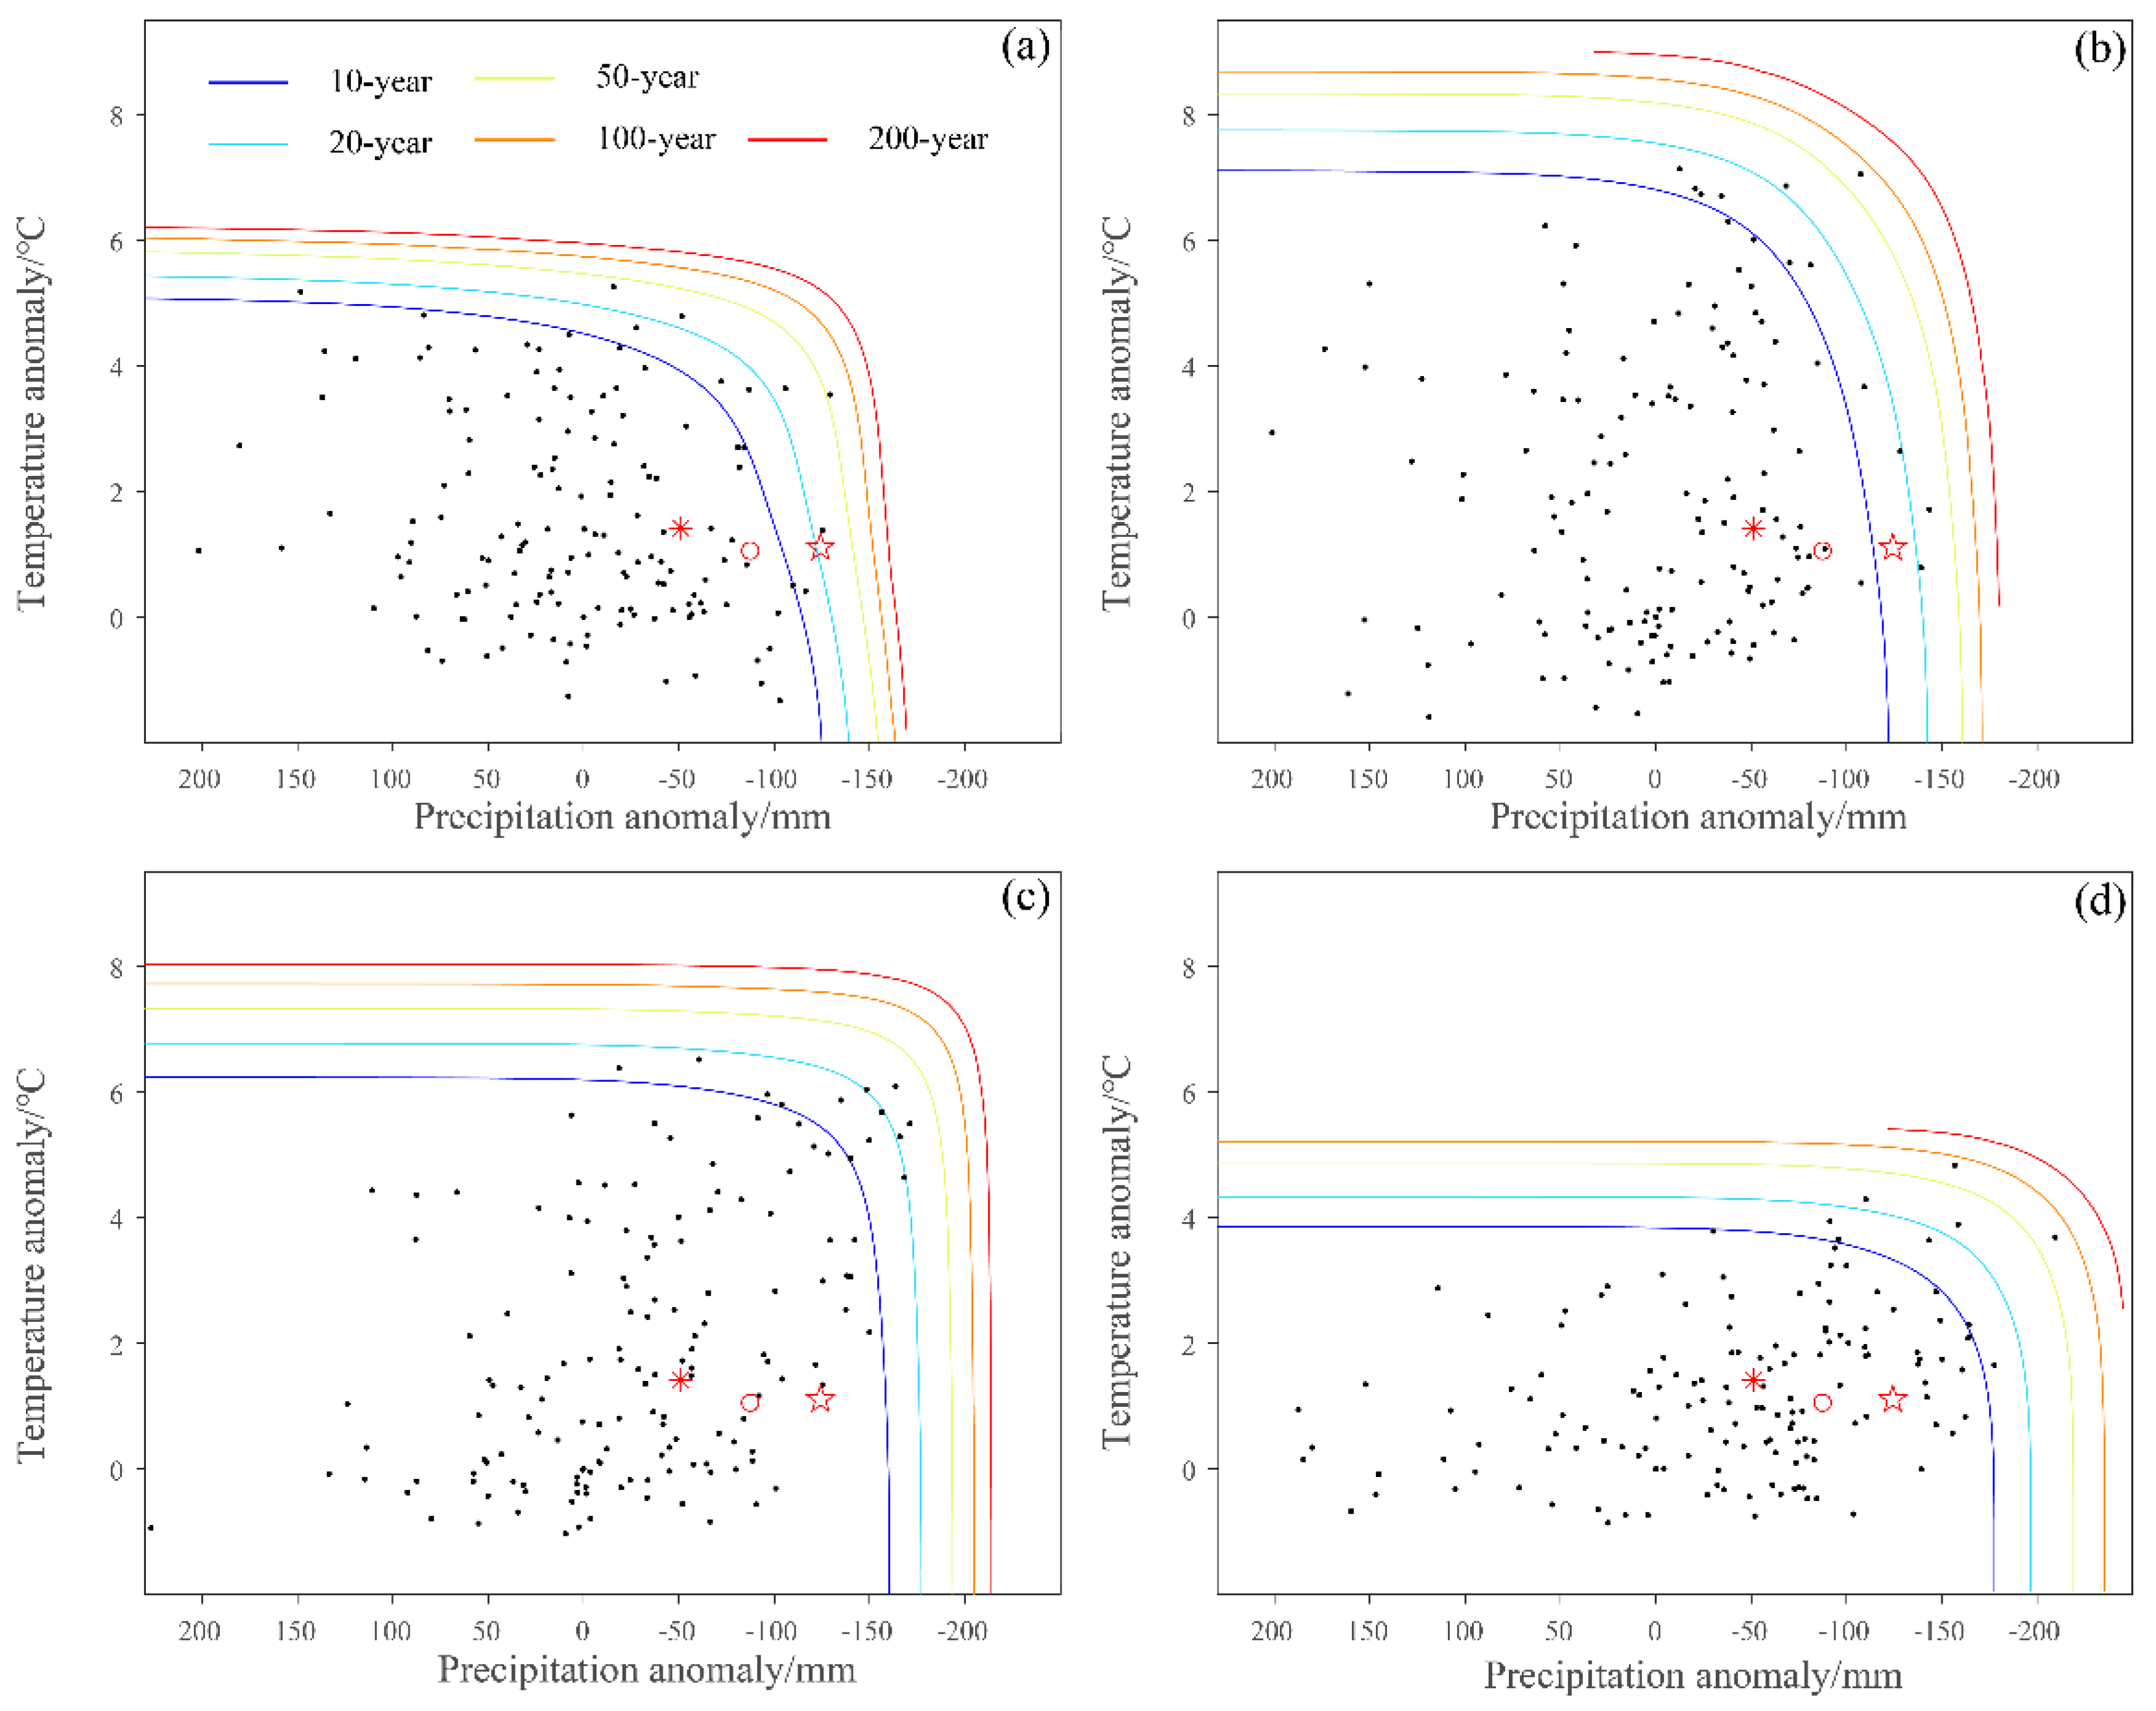
3.4. Return Period of Concurrent Events under RCP Scenarios
4. Discussion
5. Conclusions
Supplementary Materials
Author Contributions
Funding
Institutional Review Board Statement
Informed Consent Statement
Data Availability Statement
Acknowledgments
Conflicts of Interest
References
- Jonas, S.; Fronczyk, K.; Pratt, L. A Framework to Understand Extreme Space Weather Event Probability. Risk. Anal. 2018, 38, 1534–1540. [Google Scholar] [CrossRef]
- Jehanzaib, M.; Sattar, M.; Lee, J.; Kim, T. Investigating effect of climate change on drought propagation from meteorological to hydrological drought using multi-model ensemble projections. Stoch. Environ. Res. Risk Assess. 2020, 34, 7–21. [Google Scholar] [CrossRef]
- Cardell, M.F.; Amengual, A.; Romero, R.; Ramis, C. Future extremes of temperature and precipitation in Europe derived from a combination of dynamical and statistical approaches. Int. J. Climatol. 2020, 40, 4800–4827. [Google Scholar] [CrossRef]
- Cohen, J.; Fink, D.; Zuckerberg, B. Avian responses to extreme weather across functional traits and temporal scales. Glob. Chang. Biol. 2020, 26, 4240–4250. [Google Scholar] [CrossRef]
- Weilnhammer, V.; Schmid, J.; Mittermeier, I.; Schreiber, F.; Jiang, L.; Pastuhovic, V.; Herr, C.; Heinze, S. Extreme weather events in europe and their health consequences–A systematic review. Int. J. Hyg. Environ. Health 2021, 233, 113688. [Google Scholar] [CrossRef]
- Nanzad, L.; Zhang, J.; Tuvdendorj, B.; Yang, S.; Rinzin, S.; Prodhan, F.; Sharma, T. Assessment of Drought Impact on Net Primary Productivity in the Terrestrial Ecosystems of Mongolia from 2003 to 2018. Remote Sens. 2021, 13, 2522. [Google Scholar] [CrossRef]
- Li, J.; Wang, Y.; Liu, L. Responses of the Terrestrial Ecosystem Productivity to Droughts in China. Front. Earth Sci. 2020, 8, 59. [Google Scholar] [CrossRef] [Green Version]
- Guerrero-Meseguer, L.; Marin, A.; Sanz-Lazaro, C. Heat wave intensity can vary the cumulative effects of multiple environmental stressors on Posidonia oceanica seedlings. Mar. Environ. Res. 2020, 159, 105001. [Google Scholar] [CrossRef]
- Ainsworth, T.D.; Hurd, C.L.; Gates, R.D.; Boyd, P.W. How do we overcome abrupt degradation of marine ecosystems and meet the challenge of heat waves and climate extremes? Glob. Chang. Biol. 2020, 26, 343–354. [Google Scholar] [CrossRef]
- He, B.; Liu, J.; Guo, L.; Wu, X.; Xie, X.; Zhang, Y.; Chen, C.; Zhong, Z.; Chen, Z. Recovery of ecosystem carbon and energy fluxes from the 2003 drought in Europe and the 2012 drought in the United States. Geophys. Res. Lett. 2018, 45, 4879–4888. [Google Scholar] [CrossRef]
- Rustad, L.E. The response of terrestrial ecosystems to global climate change: Towards an integrated approach. Sci. Total Environ. 2008, 404, 222–235. [Google Scholar] [CrossRef]
- Jones, C.; Lowe, J.; Liddicoat, S.; Betts, R. Committed terrestrial ecosystem changes due to climate change. Nat. Geosci. 2009, 2, 484–487. [Google Scholar] [CrossRef]
- Ding, Z.; Liu, Y.; Wang, L.; Chen, Y.; Yu, P.; Ma, M.; Tang, X. Effects and implications of ecological restoration projects on ecosystem water use efficiency in the karst region of Southwest China. Ecol. Eng. 2021, 170, 106356. [Google Scholar] [CrossRef]
- Li, S.; Liu, C.; Chen, J.; Wang, S. Karst ecosystem and environment: Characteristics, evolution processes, and sustainable development. Agric. Ecosyst. Environ. 2021, 306, 107173. [Google Scholar] [CrossRef]
- Phillips, J.D. Biogeomorphology and contingent ecosystem engineering in karst landscapes. Prog. Phys. Geogr.-Earth Environ. 2016, 40, 503–526. [Google Scholar] [CrossRef]
- Guo, F.; Jiang, G.; Yuan, D.; Polk, J.S. Evolution of major environmental geological problems in karst areas of Southwestern China. Environ. Earth Sci. 2013, 69, 2427–2435. [Google Scholar] [CrossRef]
- Li, M.; Yin, L.; Zhang, Y.; Su, X.; Liu, G.; Wang, X.; Au, Y.; Wu, X. Spatio-temporal dynamics of fractional vegetation coverage based on MODIS-EVI and its driving fac-tors in Southwest China. Acta Ecol. Sin. 2021, 41, 1138–1147. [Google Scholar]
- Zhang, M.; He, J.; Wang, B.; Wang, S.; Li, S.; Liu, W.; Ma, X. Extreme drought changes in Southwest China from 1960 to 2009. J. Geogr. Sci. 2013, 23, 3–16. [Google Scholar] [CrossRef]
- Zhang, W.; Jin, F.; Zhao, J.; Qi, L.; Ren, H. The possible influence of a nonconventional El Niño on the severe autumn drought of 2009 in Southwest China. J. Clim. 2013, 26, 8392–8405. [Google Scholar] [CrossRef]
- Li, X.; Li, Y.; Chen, A.; Gao, M.; Slette, I.; Piao, S. The impact of the 2009/2010 drought on vegetation growth and terrestrial carbon balance in Southwest China. Agric. For. Meteorol. 2019, 269, 239–248. [Google Scholar] [CrossRef]
- Brunetti, M.; Maugeri, M.; Nanni, T. Changes in total precipitation, rainy days and extreme events in northeastern Italy. Int. J. Climatol. 2001, 21, 861–871. [Google Scholar] [CrossRef]
- England, J., Jr.; Salas, J.; Jarrett, R. Comparisons of two moments-based estimators that utilize historical and paleoflood data for the log Pearson type III distribution. Water Resour. Res. 2003, 39, 1243. [Google Scholar] [CrossRef]
- Ayantobo, O.; Li, Y.; Song, S.; Yao, N. Spatial comparability of drought characteristics and related return periods in mainland China over 1961–2013. J. Hydrol. 2017, 550, 549–567. [Google Scholar] [CrossRef]
- Gräler, B.; Van Den Berg, M.; Vandenberghe, S.; Petroselli, A.; Grimaldi, S.; Baets, B.; Verhoest, N. Multivariate return periods in hydrology: A critical and practical review focusing on synthetic design hydrograph estimation. Hydrol. Earth Syst. Sci. 2013, 17, 1281–1296. [Google Scholar] [CrossRef] [Green Version]
- Li, Y.; Ren, F.; Li, Y.; Wang, P.; Yan, H. Characteristics of the regional meteorological drought events in Southwest China during 1960–2010. J. Meteorol. Res. 2014, 28, 381–392. [Google Scholar] [CrossRef]
- Huang, Y.; Xu, C.; Yang, H.; Wang, J.; Jiang, D.; Zhao, C. Temporal and spatial variability of droughts in Southwest Cina from 1961 to 2012. Sustainability 2015, 7, 13597–13609. [Google Scholar] [CrossRef] [Green Version]
- Wang, L.; Chen, W.; Zhou, W.; Huang, G. Drought in Southwest China: A Review. Atmos. Ocean. Sci. Lett. 2015, 8, 339–344. [Google Scholar]
- Huang, R.; Liu, Y.; Wang, L.; Wang, L. Analyses of the Causes of Severe Drought Occurring in Southwest China from the Fall of 2009 to the Spring of 2010. Chin. J. Atmos. Sci. 2012, 36, 443–457. [Google Scholar]
- Wang, L.; Chen, W.; Zhou, W. Assessment of future drought in Southwest China based on CMIP5 multimodel projections. Adv. Atmos. Sci. 2014, 31, 1035–1050. [Google Scholar] [CrossRef]
- Tang, H.; Wen, T.; Shi, P.; Qu, S.; Zhao, L.; Li, Q. Analysis of Characteristics of Hydrological and Meteorological Drought Evolution in Southwest China. Water 2021, 13, 1846. [Google Scholar] [CrossRef]
- Harris, I.; Osborn, T.; Jones, P.; Lister, D. Version 4 of the CRU TS monthly high-resolution gridded multivariate climate dataset. Sci. Data 2020, 7, 1–18. [Google Scholar] [CrossRef] [PubMed] [Green Version]
- Warszawski, L.; Frieler, K.; Huber, V.; Piontek, F.; Serdeczny, O.; Schewe, J. The inter-sectoral impact model intercomparison project (ISI–MIP): Project framework. Proc. Natl. Acad. Sci. USA 2014, 111, 3228–3232. [Google Scholar] [CrossRef] [PubMed] [Green Version]
- Chen, P.; Shang, J.; Qian, B.; Jing, Q.; Liu, J. A new regionalization scheme for effective ecological restoration on the Loess Plateau in China. Remote Sens. 2017, 9, 1323. [Google Scholar] [CrossRef] [Green Version]
- Huang, L.; Ning, J.; Zhu, P.; Zheng, Y.; Zhai, J. The conservation patterns of grassland ecosystem in response to the forage-livestock balance in North China. J. Geogr. Sci. 2021, 31, 518–534. [Google Scholar] [CrossRef]
- Jiao, K.; Gao, J.; Liu, Z. Precipitation Drives the NDVI Distribution on the Tibetan Plateau While High Warming Rates May Intensify Its Ecological Droughts. Remote Sens. 2021, 13, 1305. [Google Scholar] [CrossRef]
- Zhao, Y.; Zhu, J.; Xu, Y. Establishment and assessment of the grid precipitation datasets in China for the past 50 years. J. Meteorol. Sci. 2014, 34, 414–420. [Google Scholar]
- Gupta, H.V.; Kling, H.; Yilmaz, K.K.; Martinez, G.F. Decomposition of the mean squared error and NSE performance criteria: Implications for improving hydrological modelling. J. Hydrol. 2009, 377, 80–91. [Google Scholar] [CrossRef] [Green Version]
- Gilewski, P. Impact of the Grid Resolution and Deterministic Interpolation of Precipitation on Rainfall-Runoff Modeling in a Sparsely Gauged Mountainous Catchment. Water 2021, 13, 230. [Google Scholar] [CrossRef]
- AghaKouchak, A.; Cheng, L.; Mazdiyasni, O.; Farahmand, A. Global warming and changes in risk of concurrent climate extremes: Insights from the 2014 California drought. Geophys. Res. Lett. 2014, 41, 8847–8852. [Google Scholar] [CrossRef] [Green Version]
- Sklar, A. Random variables, distribution functions, and copulas: A personal look backward and forward. Lect. Notes-Monogr. Ser. 1996, 28, 1–14. [Google Scholar]
- Salvadori, G.; Durante, F.; De Michele, C. Multivariate return period calculation via survival functions. Water Resour. Res. 2013, 49, 2308–2311. [Google Scholar] [CrossRef]
- Hossain, M.; Abufardeh, S. A New Method of Calculating Squared Euclidean Distance (SED) Using pTree Technology and Its Performance Analysis. EPiC Ser. Comput. 2019, 58, 45–54. [Google Scholar]
- Nelsen, R. An Introduction to Copulas; Springer: New York, NY, USA, 2007. [Google Scholar]
- Zhang, L.; Xiao, J.; Li, J.; Wang, K.; Lei, L.; Guo, H. The 2010 spring drought reduced primary productivity in southwestern China. Environ. Res. Lett. 2012, 7, 045706. [Google Scholar] [CrossRef] [Green Version]
- IPCC. Managing the Risks of Extreme Events and Disasters to Advance Climate Change Adaptation: A Special Report of Working Groups I and II of the Intergovernmental Panel on Climate Change; Cambridge University Press: New York, NY, USA; Cambridge, UK, 2012. [Google Scholar]
- Liu, M.; Xu, X.; Sun, A.; Wang, K.; Liu, W.; Zhang, X. Is southwestern China experiencing more frequent precipitation extremes? Environ. Res. Lett. 2014, 9, 064002. [Google Scholar] [CrossRef] [Green Version]
- Song, L.; Li, Y.; Ren, Y.; Wu, X.; Guo, B.; Tang, X.; Shi, W.; Ma, M.; Han, X.; Zhao, L. Divergent vegetation responses to extreme spring and summer droughts in Southwestern China. Agric. For. Meteorol. 2019, 279, 107703. [Google Scholar] [CrossRef]
- Zhou, J.; Ma, M.; Xiao, Q.; Wen, J. Vegetation Dynamics and Its Relationship with Climatic Factors in Southwestern China. Remote Sens. Technol. Appl. 2017, 32, 966–972. [Google Scholar]
- Shao, H.; Zhang, Y.; Gu, F.; Shi, C.; Miao, N.; Liu, S. Impacts of climate extremes on ecosystem metrics in southwest China. Sci. Total Environ. 2021, 776, 145979. [Google Scholar] [CrossRef]
- IPCC. Climate Change 2014: Impacts, Adaptation, and Vulnerability; Cambridge University Press: New York, NY, USA; Cambridge, UK, 2014. [Google Scholar]
- Gao, J.; Jiao, K.; Wu, S.; Ma, D.; Zhao, D.; Yin, Y.; Dai, E. Past and future effects of climate change on spatially heterogeneous vegetation activity in China. Earth’s Future 2017, 5, 679–692. [Google Scholar] [CrossRef] [Green Version]
- Wu, S.; Liu, L.; Gao, J.; Wang, W. Integrate Risk from Climate Change in China Under Global Warming of 1.5 and 2.0 °C. Earth’s Future 2019, 7, 1307–1322. [Google Scholar] [CrossRef] [Green Version]


| Indicator | RMSE | R | MAE | MAPE |
|---|---|---|---|---|
| Temperature | 0.18 | 0.96 * | 0.14 | 0.45% |
| Precipitation | 10.47 | 0.98 * | 8.03 | 1.26% |
Publisher’s Note: MDPI stays neutral with regard to jurisdictional claims in published maps and institutional affiliations. |
© 2022 by the authors. Licensee MDPI, Basel, Switzerland. This article is an open access article distributed under the terms and conditions of the Creative Commons Attribution (CC BY) license (https://creativecommons.org/licenses/by/4.0/).
Share and Cite
Liu, L.; Jiang, Y.; Gao, J.; Feng, A.; Jiao, K.; Wu, S.; Zuo, L.; Li, Y.; Yan, R. Concurrent Climate Extremes and Impacts on Ecosystems in Southwest China. Remote Sens. 2022, 14, 1678. https://doi.org/10.3390/rs14071678
Liu L, Jiang Y, Gao J, Feng A, Jiao K, Wu S, Zuo L, Li Y, Yan R. Concurrent Climate Extremes and Impacts on Ecosystems in Southwest China. Remote Sensing. 2022; 14(7):1678. https://doi.org/10.3390/rs14071678
Chicago/Turabian StyleLiu, Lulu, Yuan Jiang, Jiangbo Gao, Aiqing Feng, Kewei Jiao, Shaohong Wu, Liyuan Zuo, Yuqing Li, and Rui Yan. 2022. "Concurrent Climate Extremes and Impacts on Ecosystems in Southwest China" Remote Sensing 14, no. 7: 1678. https://doi.org/10.3390/rs14071678
APA StyleLiu, L., Jiang, Y., Gao, J., Feng, A., Jiao, K., Wu, S., Zuo, L., Li, Y., & Yan, R. (2022). Concurrent Climate Extremes and Impacts on Ecosystems in Southwest China. Remote Sensing, 14(7), 1678. https://doi.org/10.3390/rs14071678