Technical Note

Comparing Fire Extent and Severity Mapping between Sentinel 2 and Landsat 8 Satellite Sensors

Department of Planning and Environment, Science, Economics and Insights Division, Alstonville, NSW 2477, Australia
*
Author to whom correspondence should be addressed.
Remote Sens. 2022, 14(7), 1661; https://doi.org/10.3390/rs14071661
Submission received: 25 February 2022 / Revised: 28 March 2022 / Accepted: 29 March 2022 / Published: 30 March 2022

Abstract

:
Mapping of fire extent and severity across broad landscapes and timeframes using remote sensing approaches is valuable to inform ecological research, biodiversity conservation and fire management. Compiling imagery from various satellite sensors can assist in long-term fire history mapping; however, inherent sensor differences need to be considered. The New South Wales Fire Extent and Severity Mapping (FESM) program uses imagery from Sentinel and Landsat satellites, along with supervised classification algorithms, to produce state-wide fire maps over recent decades. In this study, we compared FESM outputs from Sentinel 2 and Landsat 8 sensors, which have different spatial and spectral resolutions. We undertook independent accuracy assessments of both Sentinel 2 and Landsat 8 sensor algorithms using high-resolution aerial imagery from eight training fires. We also compared the FESM outputs from both sensors across 27 case study fires. We compared the mapped areas of fire severity classes between outputs and assessed the classification agreement at random sampling points. Our independent accuracy assessment demonstrated very similar levels of accuracy for both sensor algorithms. We also found that there was substantial agreement between the outputs from the two sensors. Agreement on the extent of burnt versus unburnt areas was very high, and the severity classification of burnt areas was typically either in agreement between the sensors or in disagreement by only one severity class (e.g., low and moderate severity or high and extreme severity). Differences between outputs are likely partly due to differences in sensor resolution (10 m and 30 m pixel sizes for Sentinel 2 and Landsat 8, respectively) and may be influenced by landscape complexity, such as terrain roughness and foliage cover. Overall, this study supports the combined use of both sensors in remote sensing applications for fire extent and severity mapping.

1. Introduction

Remote sensing enables efficient monitoring of fire extent and severity across broad landscapes over time, providing unprecedented opportunities for ecological research, biodiversity conservation and fire management [1,2,3]. These products can be used to explore drivers of fire behaviour [4,5], and to inform prescribed burning regimes, which are widely used in the management of fire susceptible ecosystems [3,6]. They can also be used to plan and monitor restoration and recovery efforts [7,8], and to predict post-fire risks of biodiversity loss [9,10], ecosystem change [11], erosion [12,13] or subsequent wildfire [14]. Monitoring changes in landscape fire patterns over longer timeframes is especially pertinent in contemporary climate change research [15,16]. Flannigan et al. [17] noted the expanding role of satellite sourced data in building accurate fire history datasets on a global scale to underpin an enhanced understanding of fire and climate change.
Using recent developments in remote sensing, fire extent and severity can be mapped retrospectively through the application of modern machine learning approaches to historical satellite imagery. Algorithms using pre-fire and post-fire image differencing across a range of spectral indices, and trained on manually verified fire observation data, can be used to classify levels of canopy scorch and consumption (and thus, map fire extent and severity), at high levels of accuracy [18,19,20]. By compiling imagery from various satellite missions, it is possible to create a comprehensive history of fire extent and severity over recent decades. However, due to the differences in available satellite imagery over time, which are captured at varying resolutions and by different sensor types, it is important to ensure that modelling outputs are comparable between sensors.
The New South Wales (NSW) Fire Extent and Severity Mapping (FESM) program uses a Random Forest algorithm to produce maps of burned area and severity at a state-wide scale. Random Forest, a supervised classification machine learning model, is commonly used for remote sensing of fire within Australia [18,19,20] and internationally [21,22]. The NSW FESM program has been developed for application on both Sentinel 2 and Landsat imagery. For the 2017–2018 fire year to current and ongoing fire years, Sentinel 2 imagery is used, while Landsat imagery is used for historical mapping (1989–1990 to 2016–2017). The NSW FESM program recently completed state-wide mapping of the 2016–2017 fire year, using Landsat 8. Other fire years that have been reported (2017–2018 to current) were mapped using Sentinel 2 [23]. Due to differences between sensors (Table 1), FESM algorithms have been trained separately for each sensor type.
While both models use an equivalent supervised classification method and produce analogous severity outputs, the comparison of outputs between sensors has not been comprehensively assessed. Although Sentinel 2 and Landsat 8 sensors cover similar spectral wavelengths, there are inherent differences that may impact remote sensing applications to various degrees [24,25,26]. For example, Sentinel 2 has a higher resolution (10 m pixel size) compared to Landsat 8 (30 m pixel size), while Landsat 8 has several bands with more narrow spectral coverage compared to Sentinel 2 (e.g., Red, NIR and SWIR1). Several studies have compared reflectance values for equivalent spectral bands between these two sensors [24,25,26], and small-scale studies have compared the effects of sensor type on fire extent and severity mapping [27,28]. These studies suggest that both sensors can reliably be used interchangeably in some applications.
In this study, we aimed to test the robustness of an operationalised fire extent and severity mapping application to different sensor types at a broad scale. We compared the Sentinel 2 and Landsat 8 FESM algorithms through independent accuracy assessments across 8 training fires. Differences in the proportion of fire area mapped in each severity class, and the statistical agreement between FESM outputs were also compared between algorithms across 27 study fires.

2. Materials and Methods

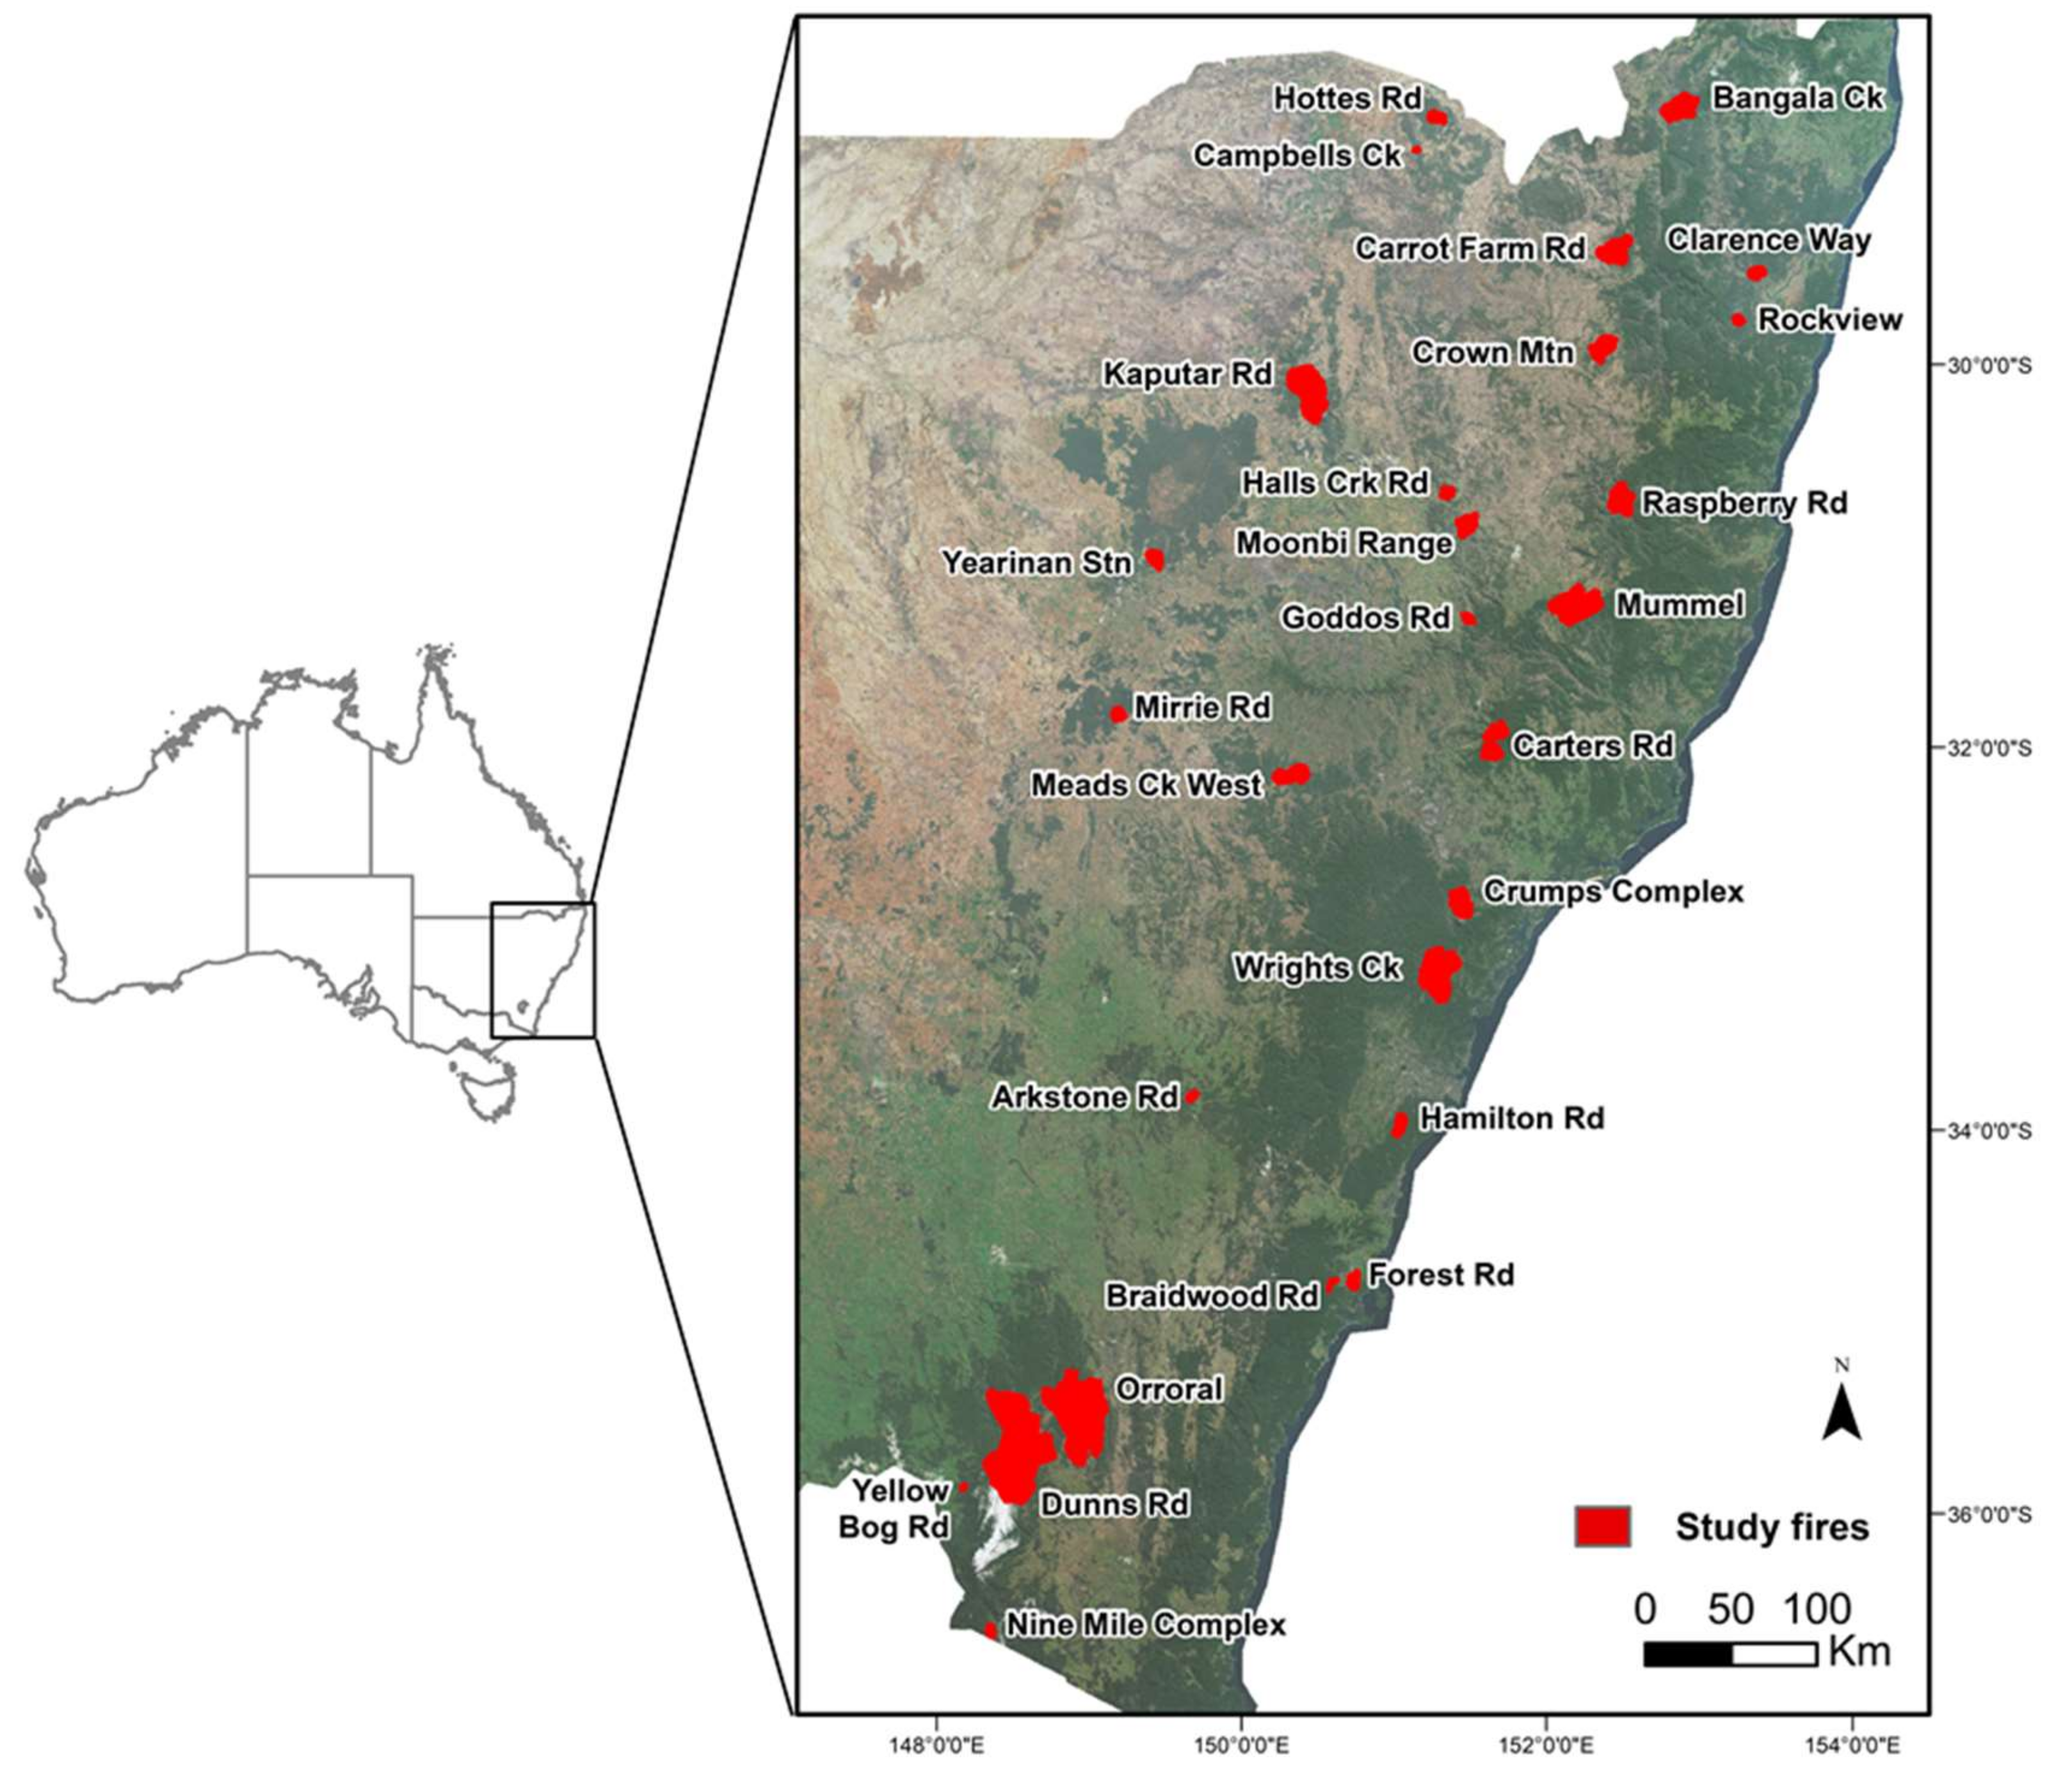
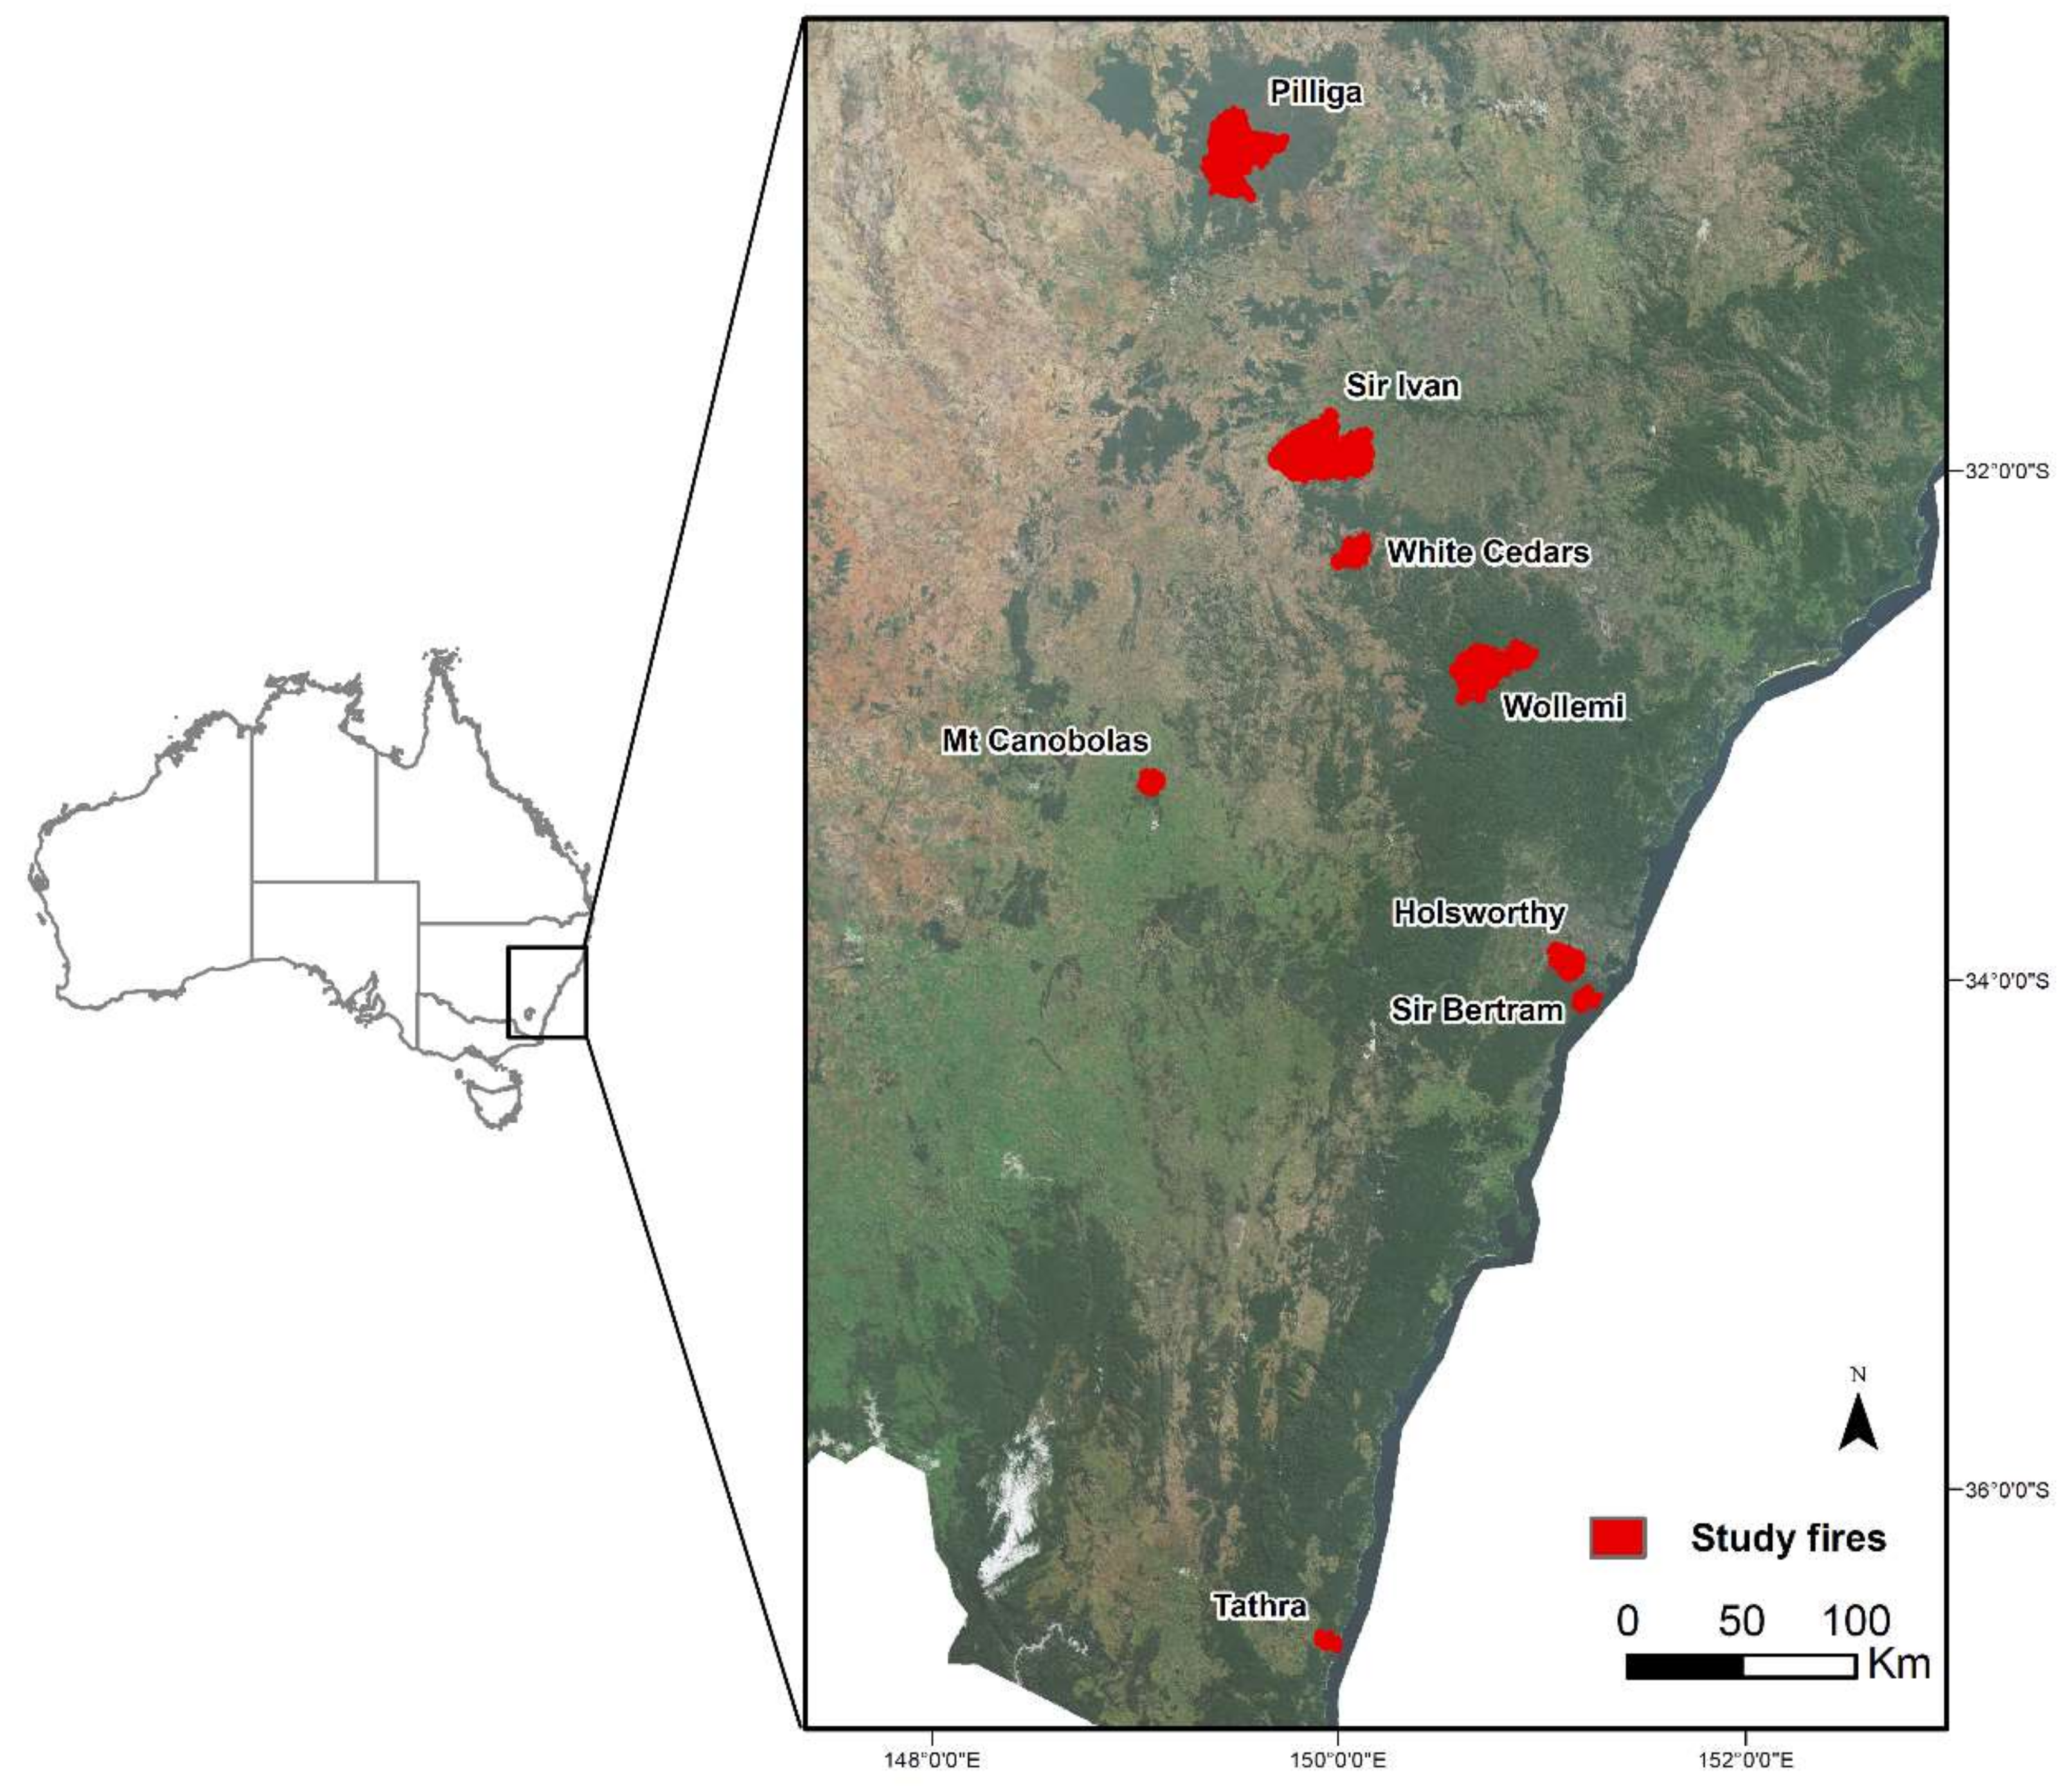
2.1. Study Area and Fire Selection

The study focused on 27 case study wildfires in the state of New South Wales (NSW), in south-eastern Australia (Figure 1). Study fires were selected from previously mapped fires occurring between 2018 and 2021, where Sentinel 2 and Landsat 8 availability overlaps. Study fires were selected to cover a wide range of geographic locations, landscape settings and fire severity patterns.

2.2. Imagery Pre-Processing

Landsat OLI tiles were downloaded from USGS (https://www.usgs.gov/core-science-systems/nli/landsat/landsat-data-access, accessed on 30 January 2022) and Sentinel 2 tiles were downloaded from the Copernicus Hub (https://www.copernicus.gov.au/, accessed on 30 January 2022), as level 1 C products, which represent orthorectified, top-of-atmosphere reflectance. The images were then processed to represent standardised surface reflectance with a nadir view angle and incidence angle of 45° (i.e., Nadir BRDF-Adjusted Reflectance (NBAR) at 45° [29]). This corrected for variations due to atmospheric conditions and the bi-directional reflectance distribution function (BRDF), which also accounted for topographic variations using a 30 m digital surface model (DSM) derived from the Shuttle Radar Topography Mission digital elevation models [30,31]. These corrections minimise the differences between scenes caused by different sun and view angles. Fractional cover products were generated for each image using a fractional cover model, which calculates for each pixel, the proportion of photosynthetic (green) vegetation, non-photosynthetic (‘non-green’, dead or senescent vegetation) and bare ground cover [32].
For each fire, cloud-free pre-fire and post-fire images were selected from both sensors, within six weeks from the fire start and end date, with less than two weeks between matched sensor images (mean = 4.0 days, SD = 3.2). Fire start and end dates and selected imagery are provided in Table S1 (Supplementary Material).

2.3. Fire Severity Mapping

Fire severity was mapped for all 27 case study fires (Figure 1) using the NSW Fire Extent and Severity Mapping process, documented in Gibson et al. [18]. Fire severity classes (Table 2) discriminate varying levels of vegetation scorch and consumption in canopy and understory layers with strong correlations to field-based measures of fire severity [3,33,34].
FESM algorithms have been trained separately for each sensor type. Both use a supervised classification Random Forest algorithm with 12 input indices that are sourced from satellite imagery reflectance bands. These include dNBR (differenced Normalised Burn Ratio), RdNBR (Relativised differenced Normalised Burn Ratio) and fractional cover (photosynthetic and bare cover fractions), along with various texture indices derived from dNBR and bare cover fractions (see Table S2, Supplementary Material, for a full description of indices and formulas used for index calculation). For each sensor type, the Random Forest model was trained to classify fire severity from the supplied indices by learning on training data that consisted of fire severity maps that were developed by manually classifying high resolution aerial imagery (as described below in Section 2.4). The index-based modelled predictions can then be projected onto novel fires, wherever pre-fire and post-fire satellite imagery is available, to create fire extent and severity maps. The Landsat 8 algorithm was trained on 8 fires, while the Sentinel 2 algorithm was trained on 18 fires (the same 8 fires as Landsat 8, plus an additional 10 fires following the recent 2019–2020 fires where post-fire aerial photography was captured). This represents the algorithms in operational use in NSW government fire extent and severity mapping. While differences in training data volume are not ideal for attempting to isolate differences between sensors, we used these algorithms to examine differences in mapping being produced in the NSW operational fire extent and severity mapping program.
The trained Random Forest algorithms were used to predictively map fire severity for each of the 27 case study fires using the selected pre-fire and post-fire imagery from both sensors (Table S1, Supplementary Material), with identical prediction areas for each fire. Model training and predictions were undertaken using the caret package in R [35]. The number of trees was 500 and number of predictor variables at each node was the square root of the number of variables used in the model (i.e., default values [36]).

2.4. Independent Accuracy Assessment

To compare the difference in accuracy due to the Sentinel 2 and Landsat 8 sensors, Random Forest models were trained and tested using sampling data derived from high resolution aerial photograph interpretation (API) of fire severity classes from eight training fires (Figure 2). Available digital aerial photography had a resolution of 50 cm or less, across 4 bands (blue, green, red and NIR), and was captured within 38 days of the end date for each fire (Table S3, Supplementary Material). Using established interpretation protocols for false colour infra-red aerial photos [3,18,19], fire severity was hand digitised in ArcMap v10.4 across each of the fire footprints. Ground truthing in the field has shown this method to be at least 94% accurate in mapping fire extent and severity [3]. Severity classification was based on degrees of post-fire change to foliage cover (Table 2), which have been found to correlate to field-based fire severity observations [3,33].
A minimum of 3000 random points were sampled from each training fire (Table S4, Supplementary Material). Random Forest input indices (Table S2, Supplementary Material) were extracted from pre-fire and post-fire imagery for each sensor type at each sampling location for each fire. An independent cross-validation assessment was conducted for each sensor type, whereby each fire was iteratively excluded from training the model, and then used to independently test the model performance against the API severity classes.

2.5. Area Comparisons

Pixel counts were used to calculate the area of each severity class within fire extent and severity output images from both Sentinel 2 and Landsat 8. The proportional mapped area of each severity class was compared between sensors for each of the 27 case study fires.

2.6. Statistical Agreement

Random sampling points were generated within the extent of the FESM output for each of the 27 case study fires, at a rate of one point per 5 hectares. At each point, the severity classes were extracted from both the Sentinel 2 and Landsat 8 FESM outputs and a confusion matrix was computed for the full dataset, which contained 111,994 data points. Within each Sentinel 2 severity class, the percentage of points in each Landsat 8 severity class was calculated.
Extracted data points for each sensor were also given numeric scores (where unburnt = 0, low = 1, moderate = 2, high = 3 and extreme = 4) which were used to compute a Kappa statistic. Due to the ordinal nature of the data, a weighted Kappa statistic was calculated, which penalises major disagreement (severity classes that are separated by more than one class, e.g., unburnt vs. extreme severity) to a larger degree than minor disagreement (adjacent severity classes, e.g., high vs. extreme severity). As suggested by Vanbelle [37], a linear weighted Kappa score is reported, which applies an equal additional penalty for each sequential class of disagreement. Statistically, this compares the mean distance between the scores from each sensor to the mean distance expected by chance [37]. Linear Kappa statistics were also generated separately for each fire. All sampling and statistical analyses were undertaken in R v4.1.1 [38].

2.7. Factors Influencing Similarity between Sensors

Several candidate factors (Table 3) were investigated to determine their potential influence on the similarity of outputs between different sensors. The Terrain Ruggedness Index (TRI) is a standard index defined as the mean difference between a central pixel and its surrounding cells [39], which is a measure of topographic complexity indicating relatively flat areas (TRI values near 1) or steep areas (higher TRI values) [40]. The TRI was derived from the 1 s Shuttle Radar Topography Mission (SRTM) Digital Elevation Model (DEM, 30 m pixel size). Foliage projective cover (FPC) is an indicator of long-term canopy density (robust to seasonal variation) and was developed from a model, calibrated to ground-based measurements using fractional cover transects and validated against LiDAR data [41]. A high-resolution version of FPC developed by Fisher et al. [42] was used, which is calculated from SPOT5 satellite imagery across four consecutive summers (2008–2011).
Linear regression models were used to examine the relationship between each candidate factor and the weighted Kappa scores across the suite of 27 case study fires. Statistical analyses were undertaken in R v4.1.1 [38].

3. Results

3.1. Independent Accuracy Assessment

The independent accuracy assessment results indicate Sentinel 2 and Landsat 8 algorithms have very similar levels of accuracy across severity classes. The unburnt class had the highest accuracy for both Sentinel 2 (0.98) and Landsat 8 (0.96), followed by extreme severity (0.91 and 0.89, respectively). The largest difference between sensors was for the high and low severity classes (−0.03 and 0.05, respectively). Sentinel 2 had slightly higher accuracy for high severity class compared to Landsat 8 (0.84 vs. 0.79), while Landsat 8 had slightly higher accuracy for low severity compared to Sentinel 2 (0.86 vs. 0.83). The mean difference in accuracy between sensor algorithms ranged between 0.01 and 0.05 across severity classes (Table 4). Balanced accuracy for the eight individual training fires ranged from 0.67 to 0.90 for Sentinel 2 (mean = 0.80, SD = 0.06) and from 0.63 to 0.94 for Landsat 8 (mean = 0.81, SD = 0.10) (Table S4, Supplementary Material). The mean difference in accuracy between Sentinel 2 and Landsat 8 for individual fires was less than 0.10 (mean = 0.09, SD = 0.10).

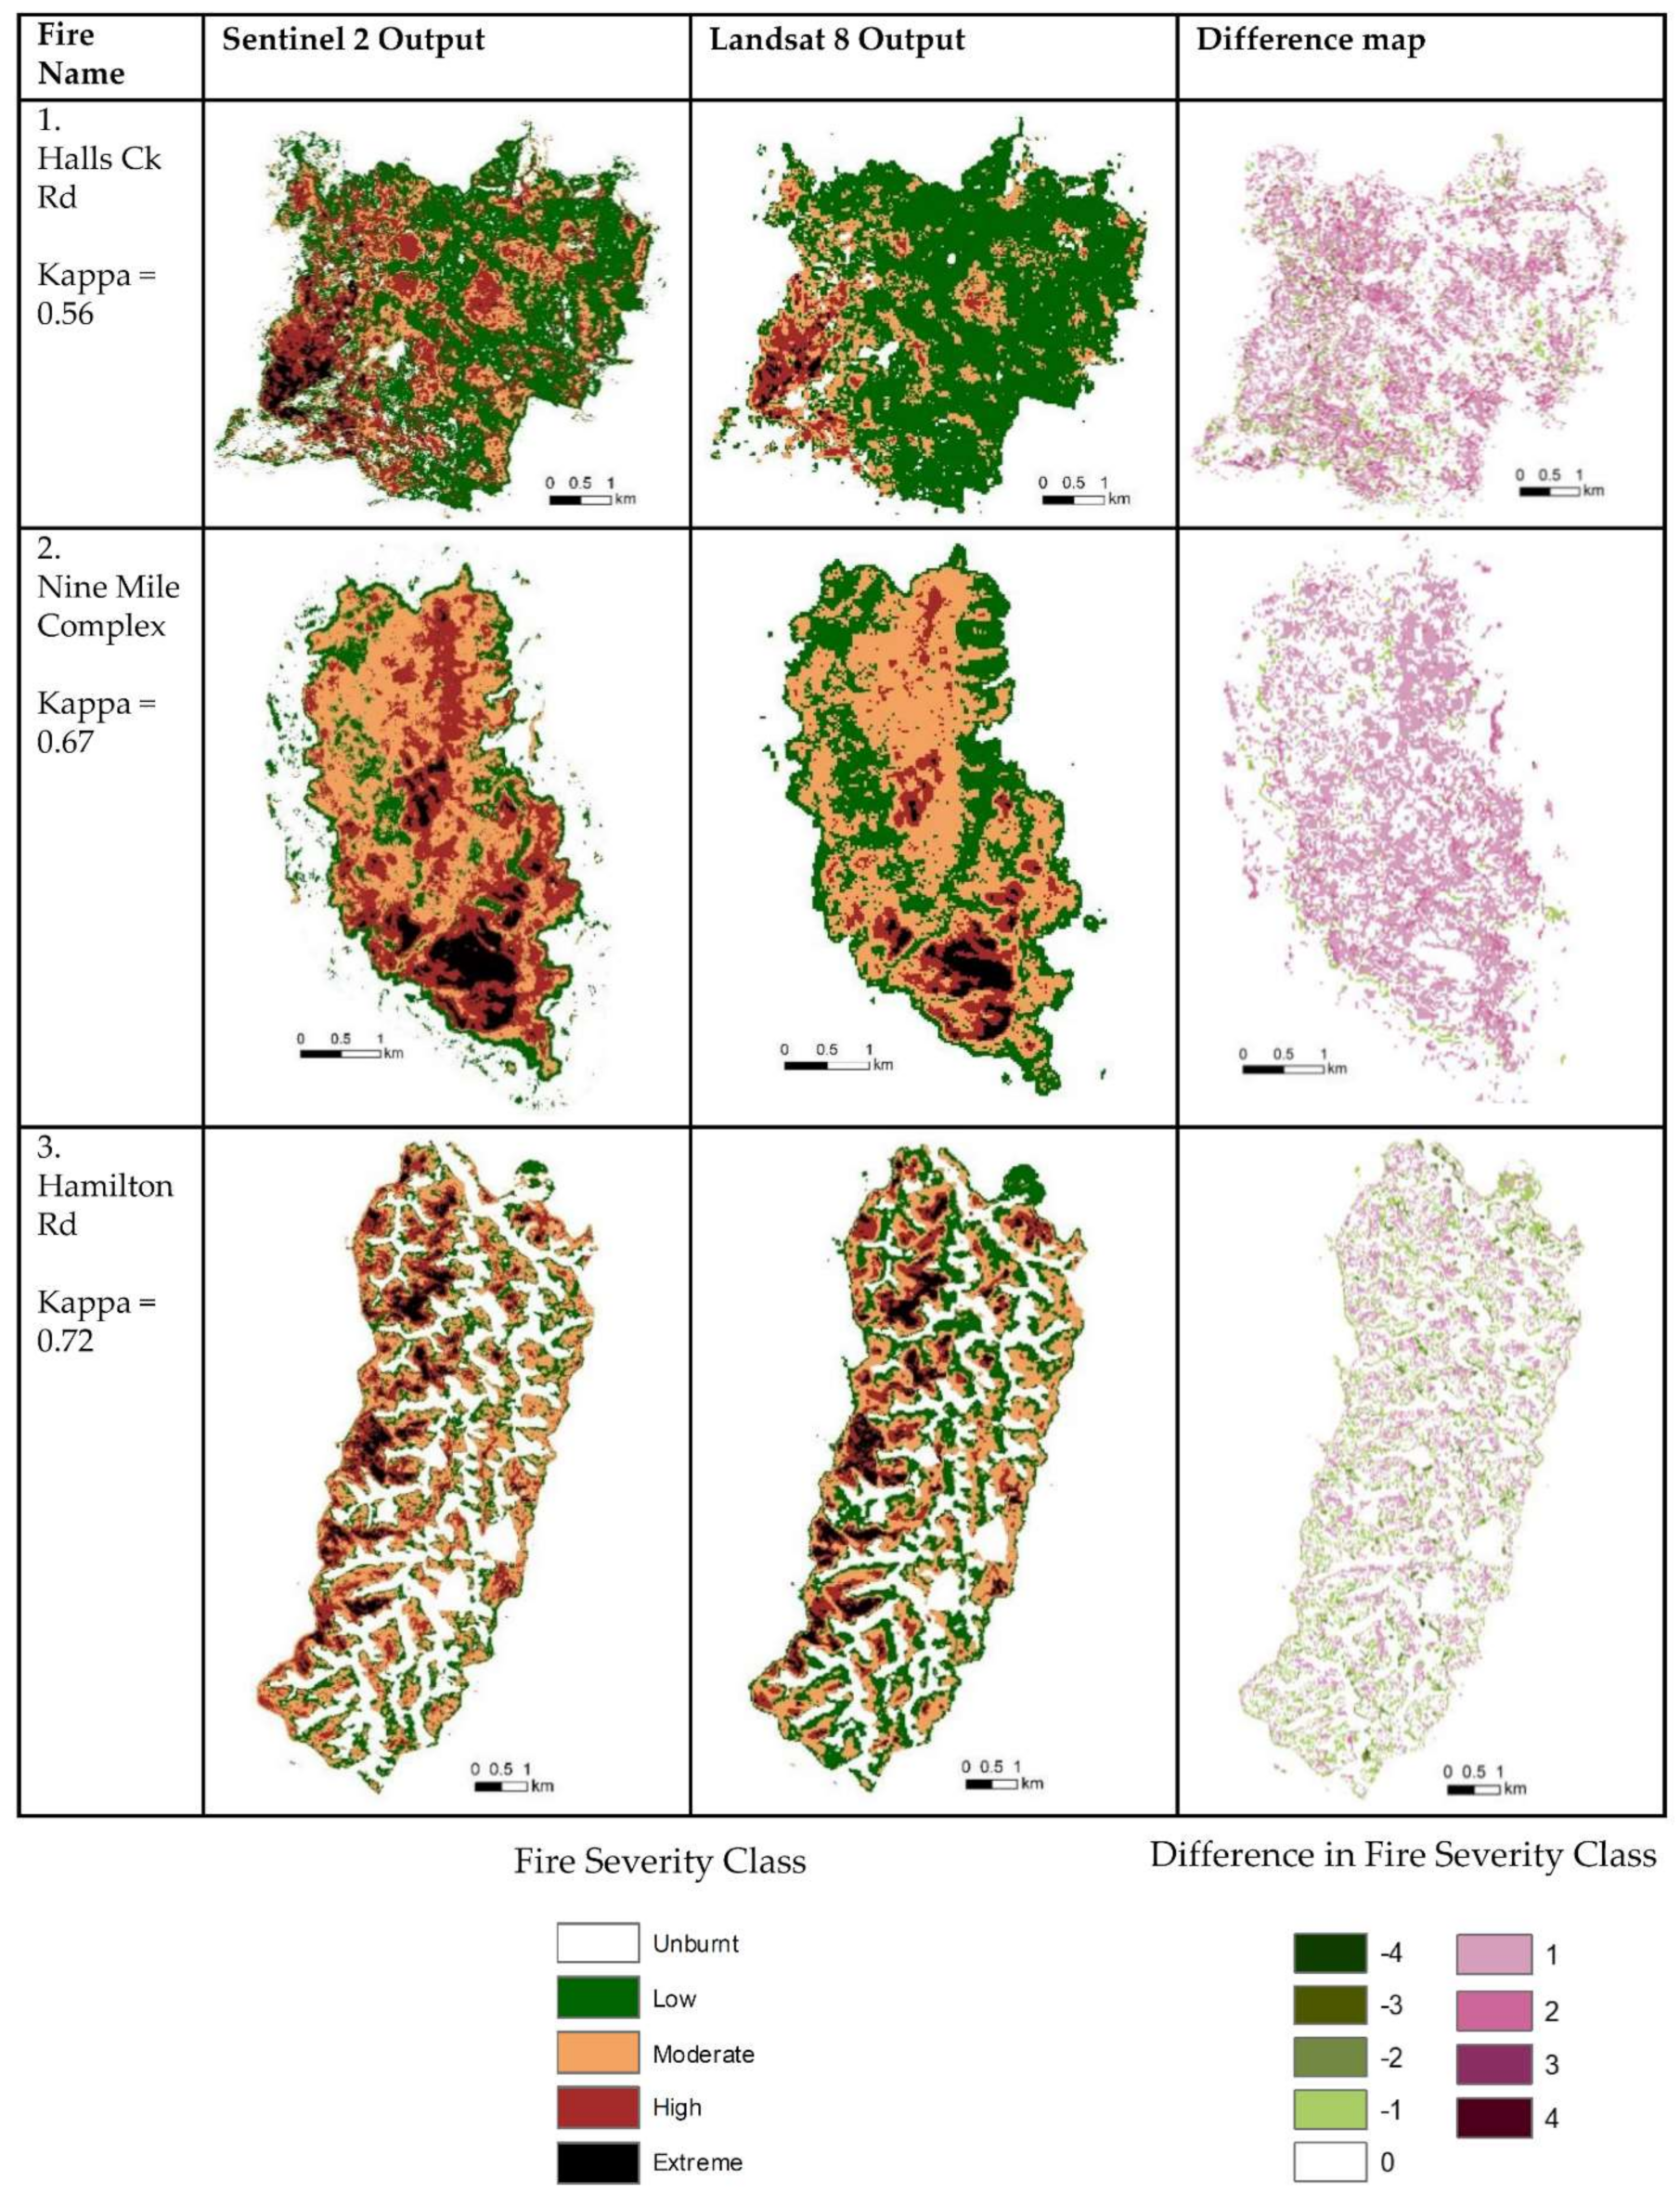
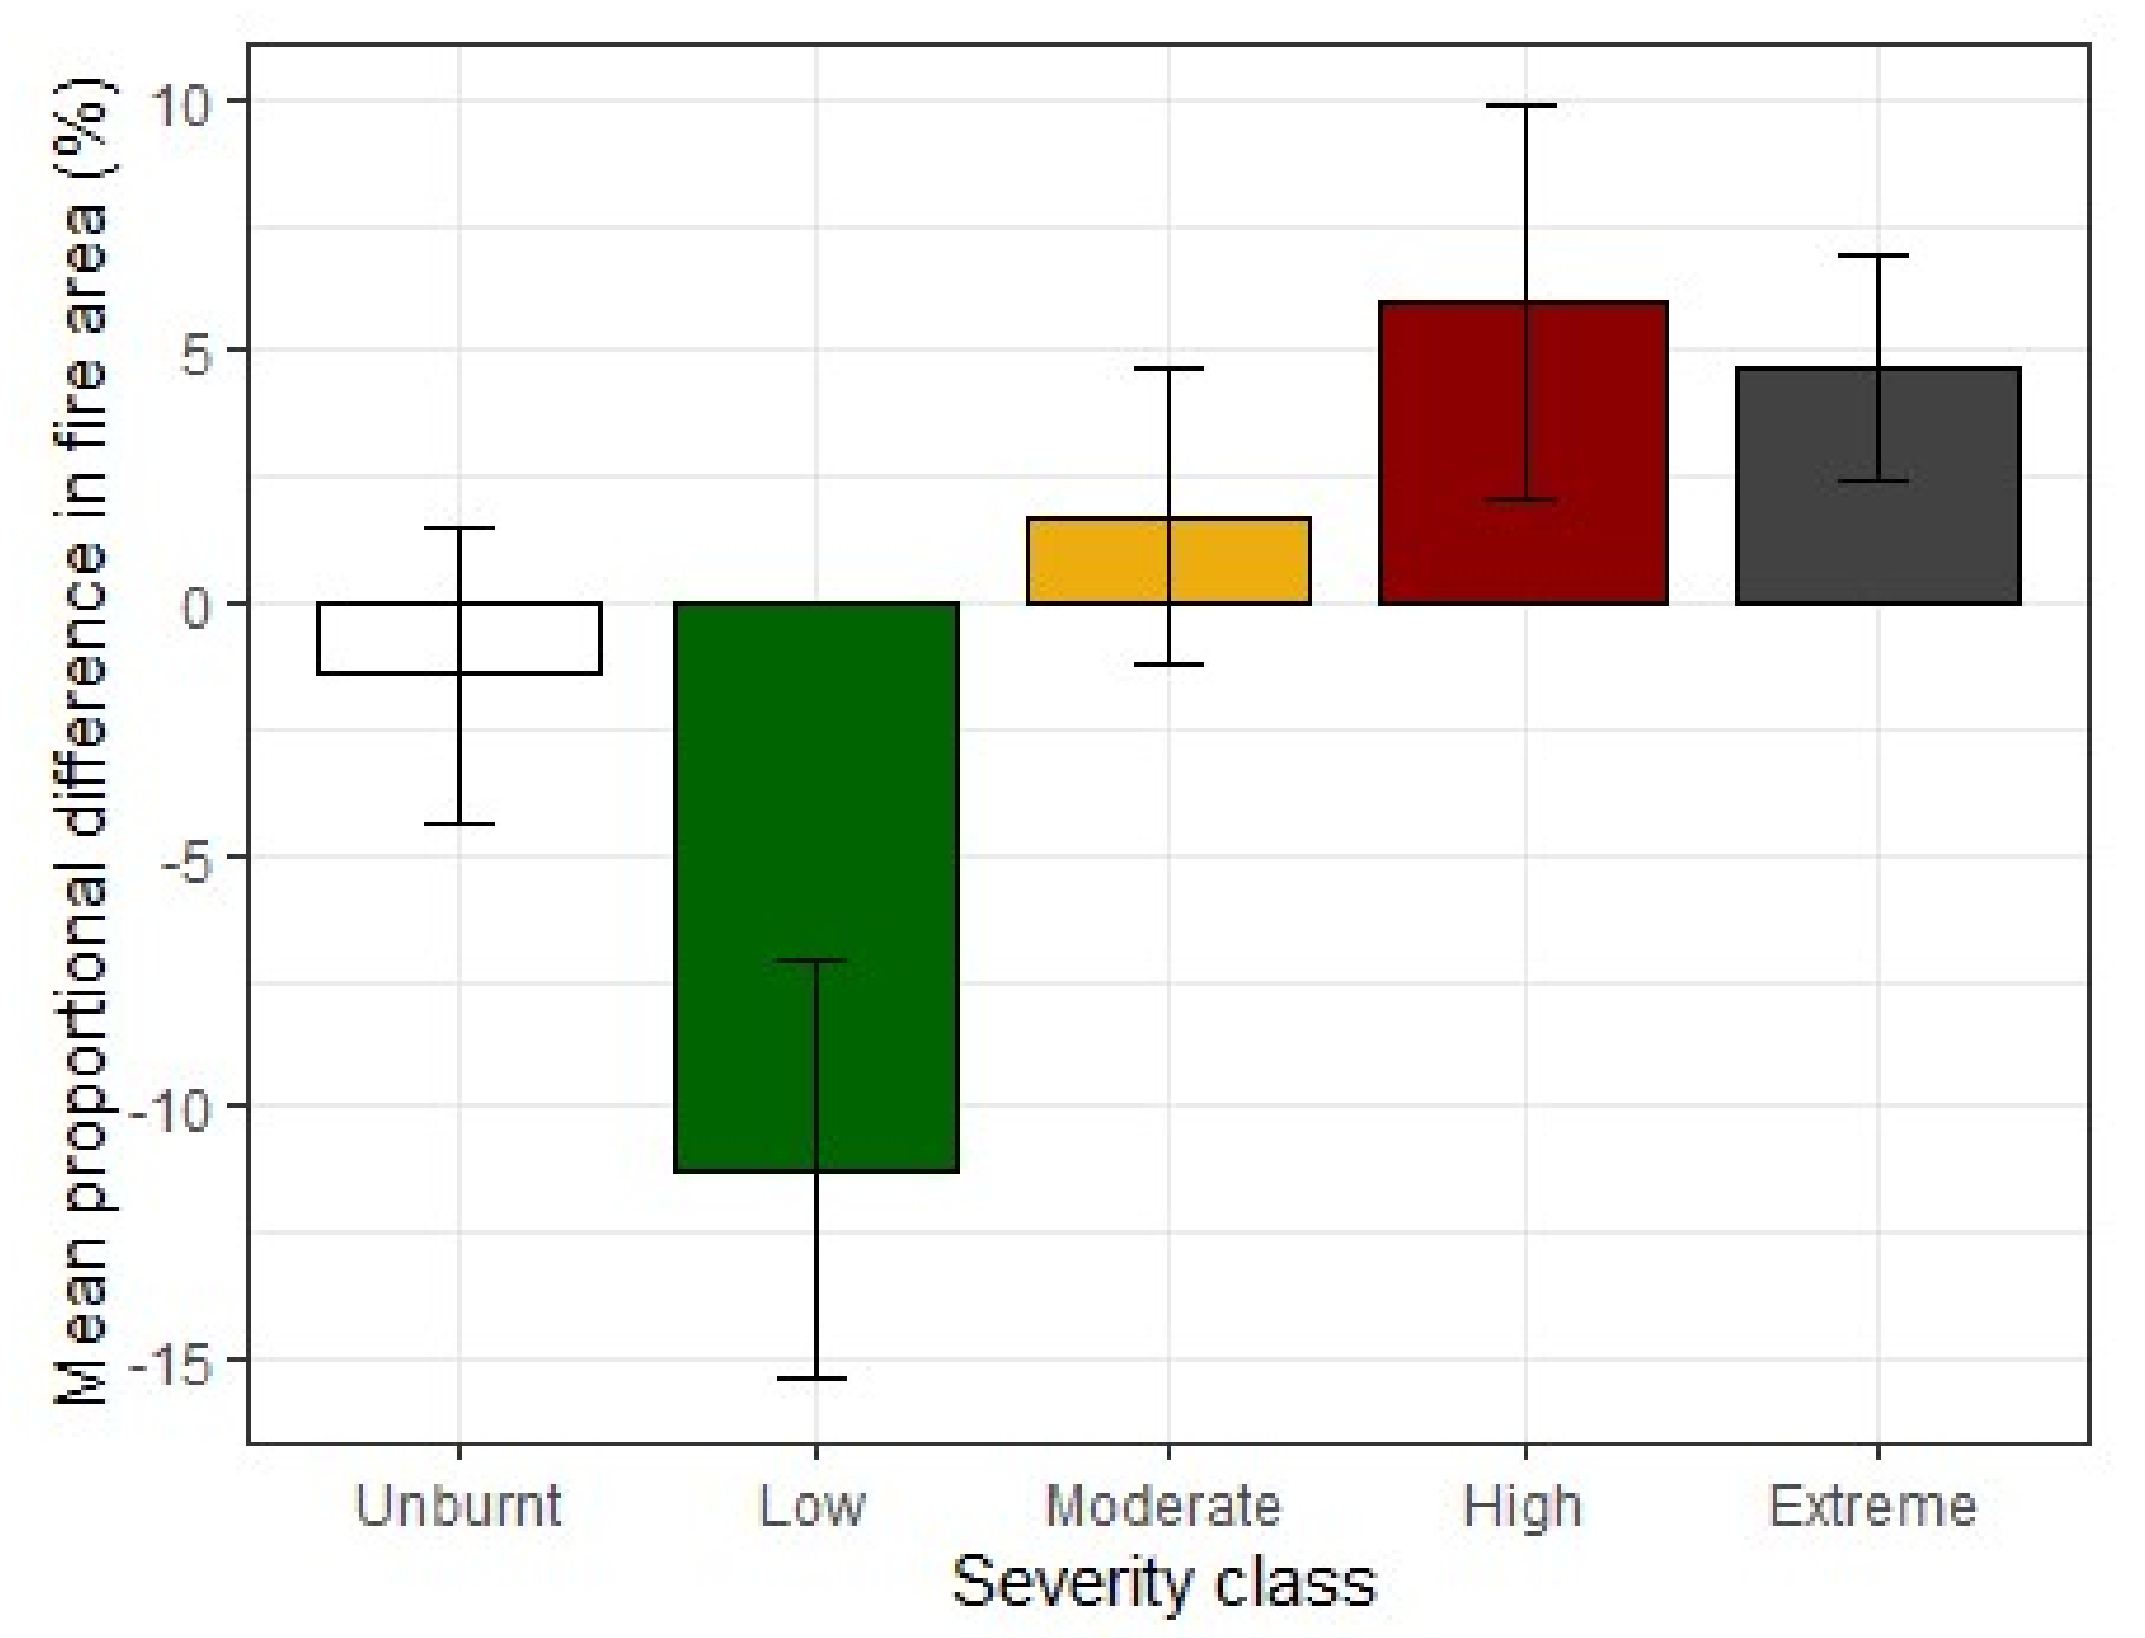
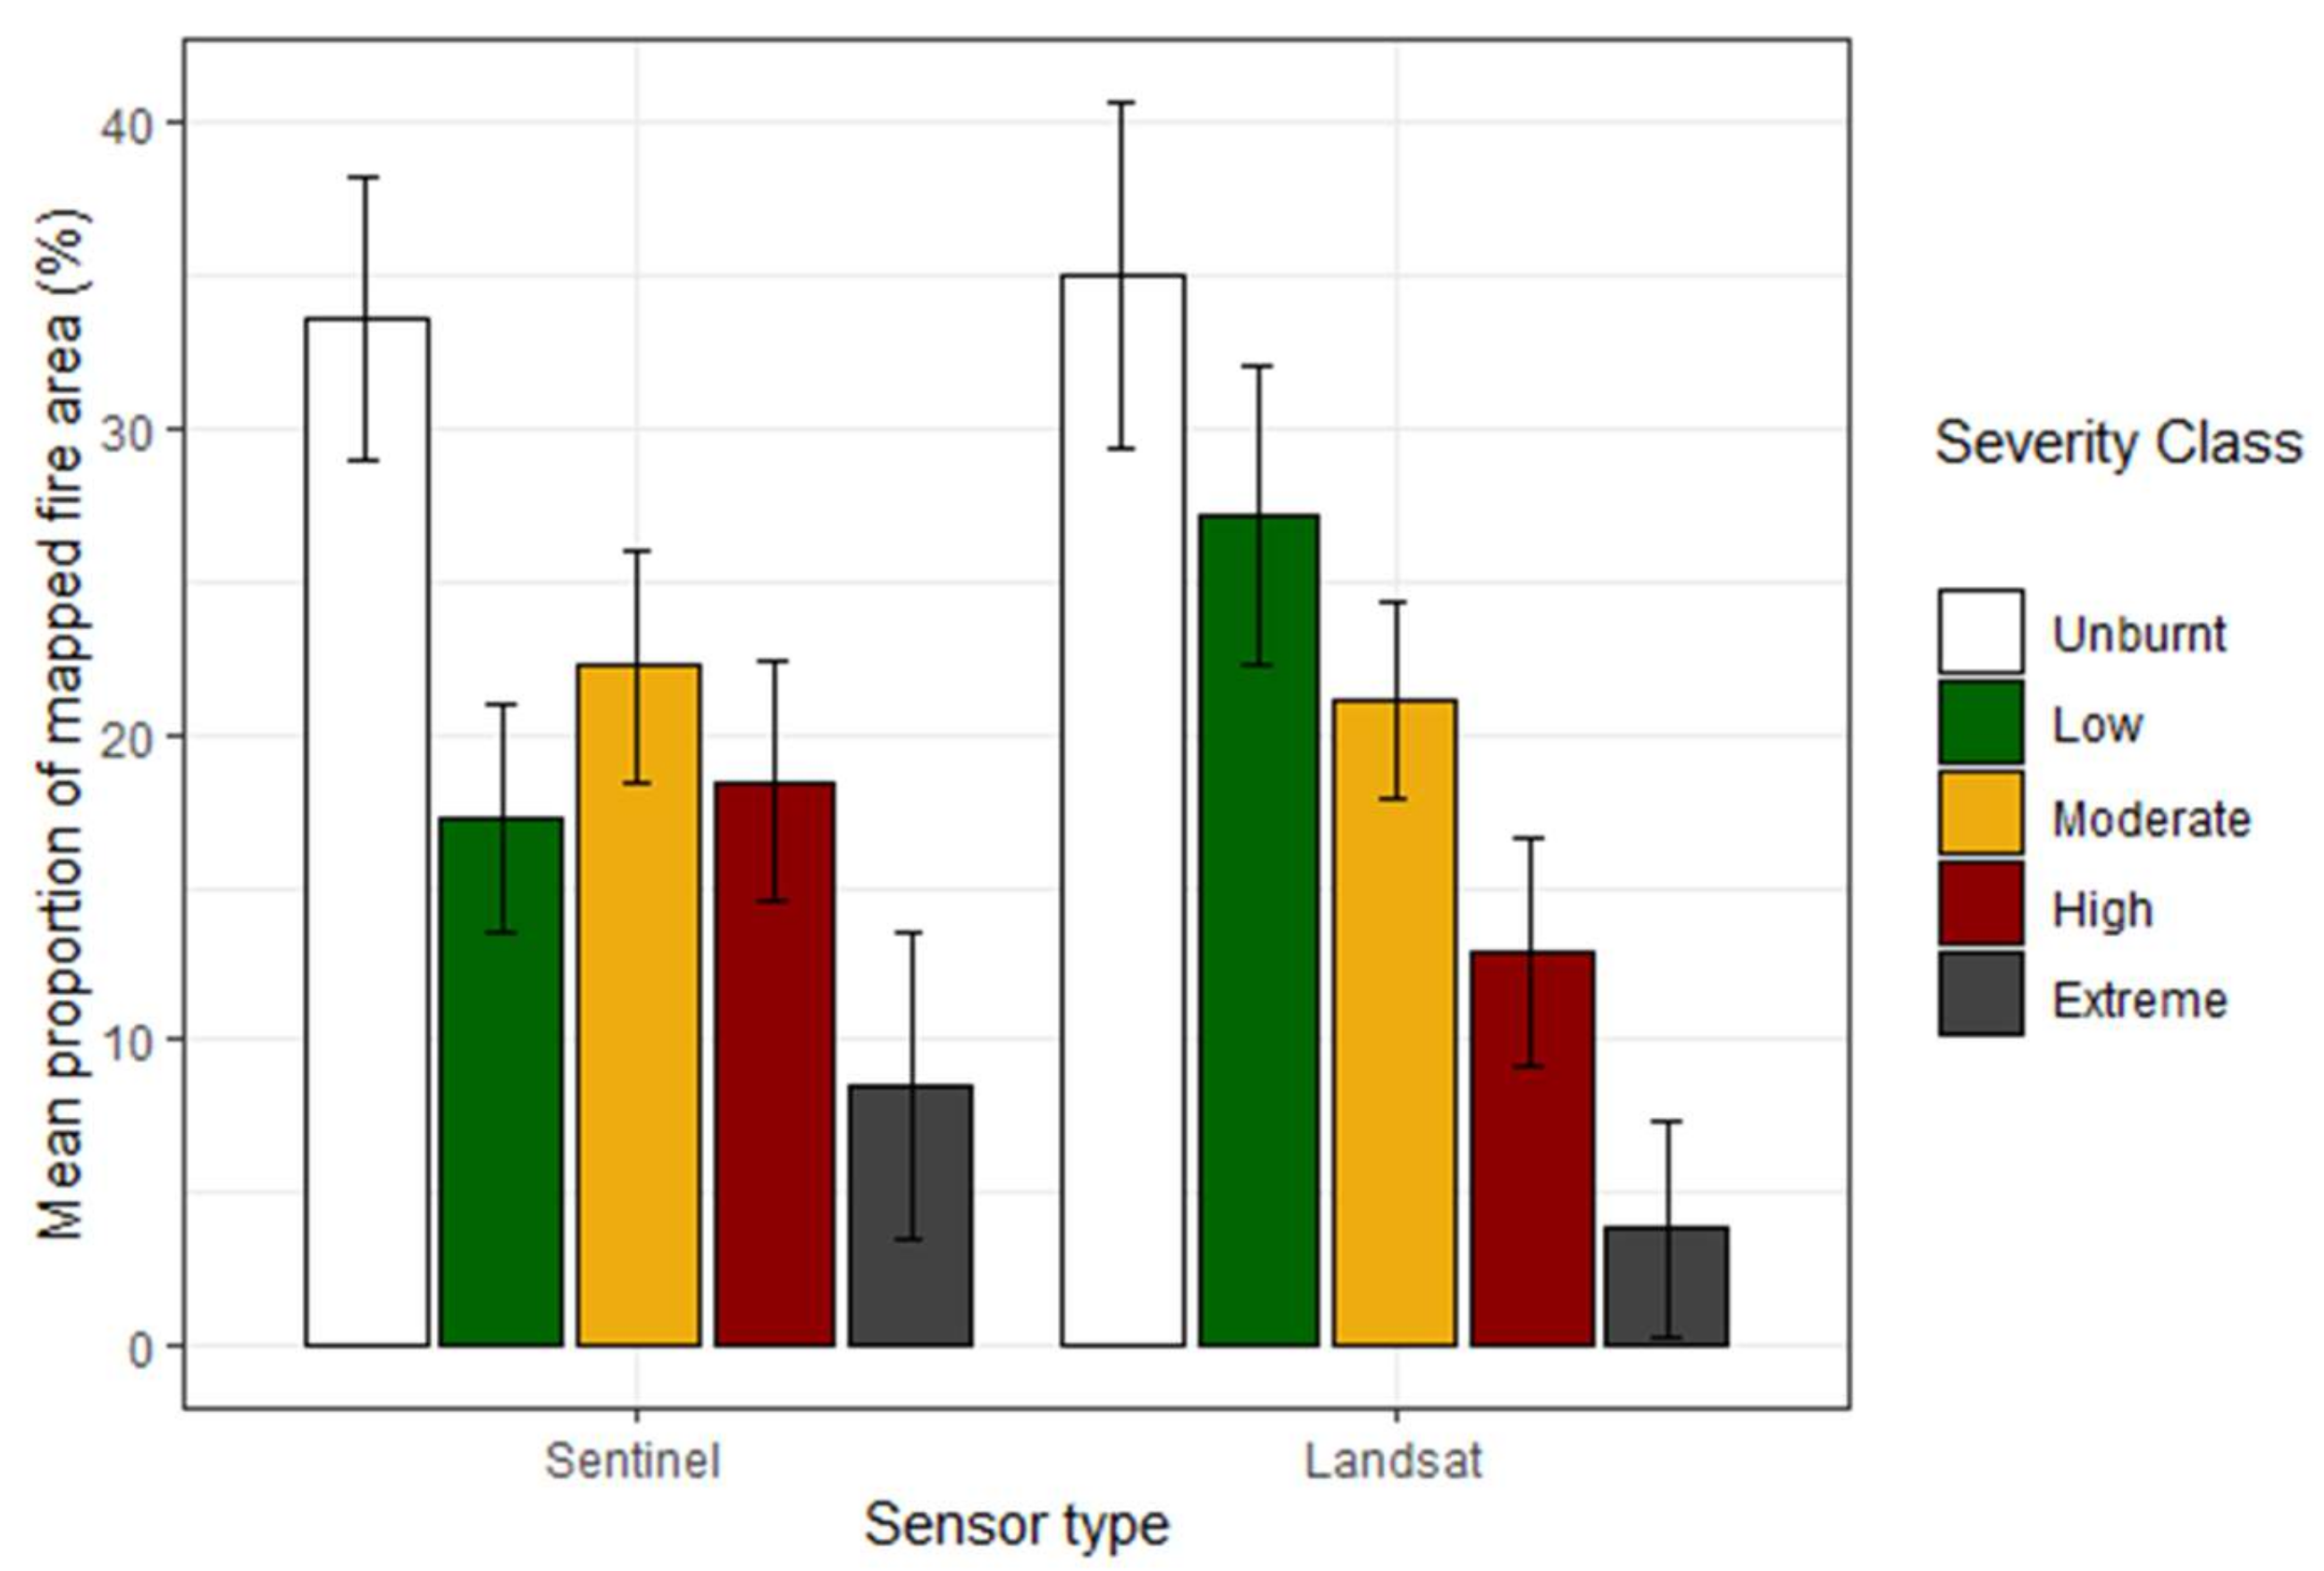
3.2. Area Comparisons

The FESM outputs between sensor types for the 27 case study fires were generally similar (e.g., Figure 3). Overall, there was less than 5% difference in the average percent of total fire area mapped as unburnt, moderate and extreme severity between sensors (Figure 4). For low severity, the average percent of total fire area was approximately 11% lower with the Sentinel 2 algorithm than the Landsat 8 algorithm, while for high severity, the average percent of total fire area was approximately 6% higher with the Sentinel 2 algorithm than the Landsat 8 algorithm. When the proportions of each severity class were compared directly, the Sentinel 2 algorithm on average mapped 0.96, 0.64, 1.10, 1.44 and 2.24 times the area of unburnt, low, moderate, high and extreme classes respectively, compared to the Landsat 8 algorithm (Figure 5).

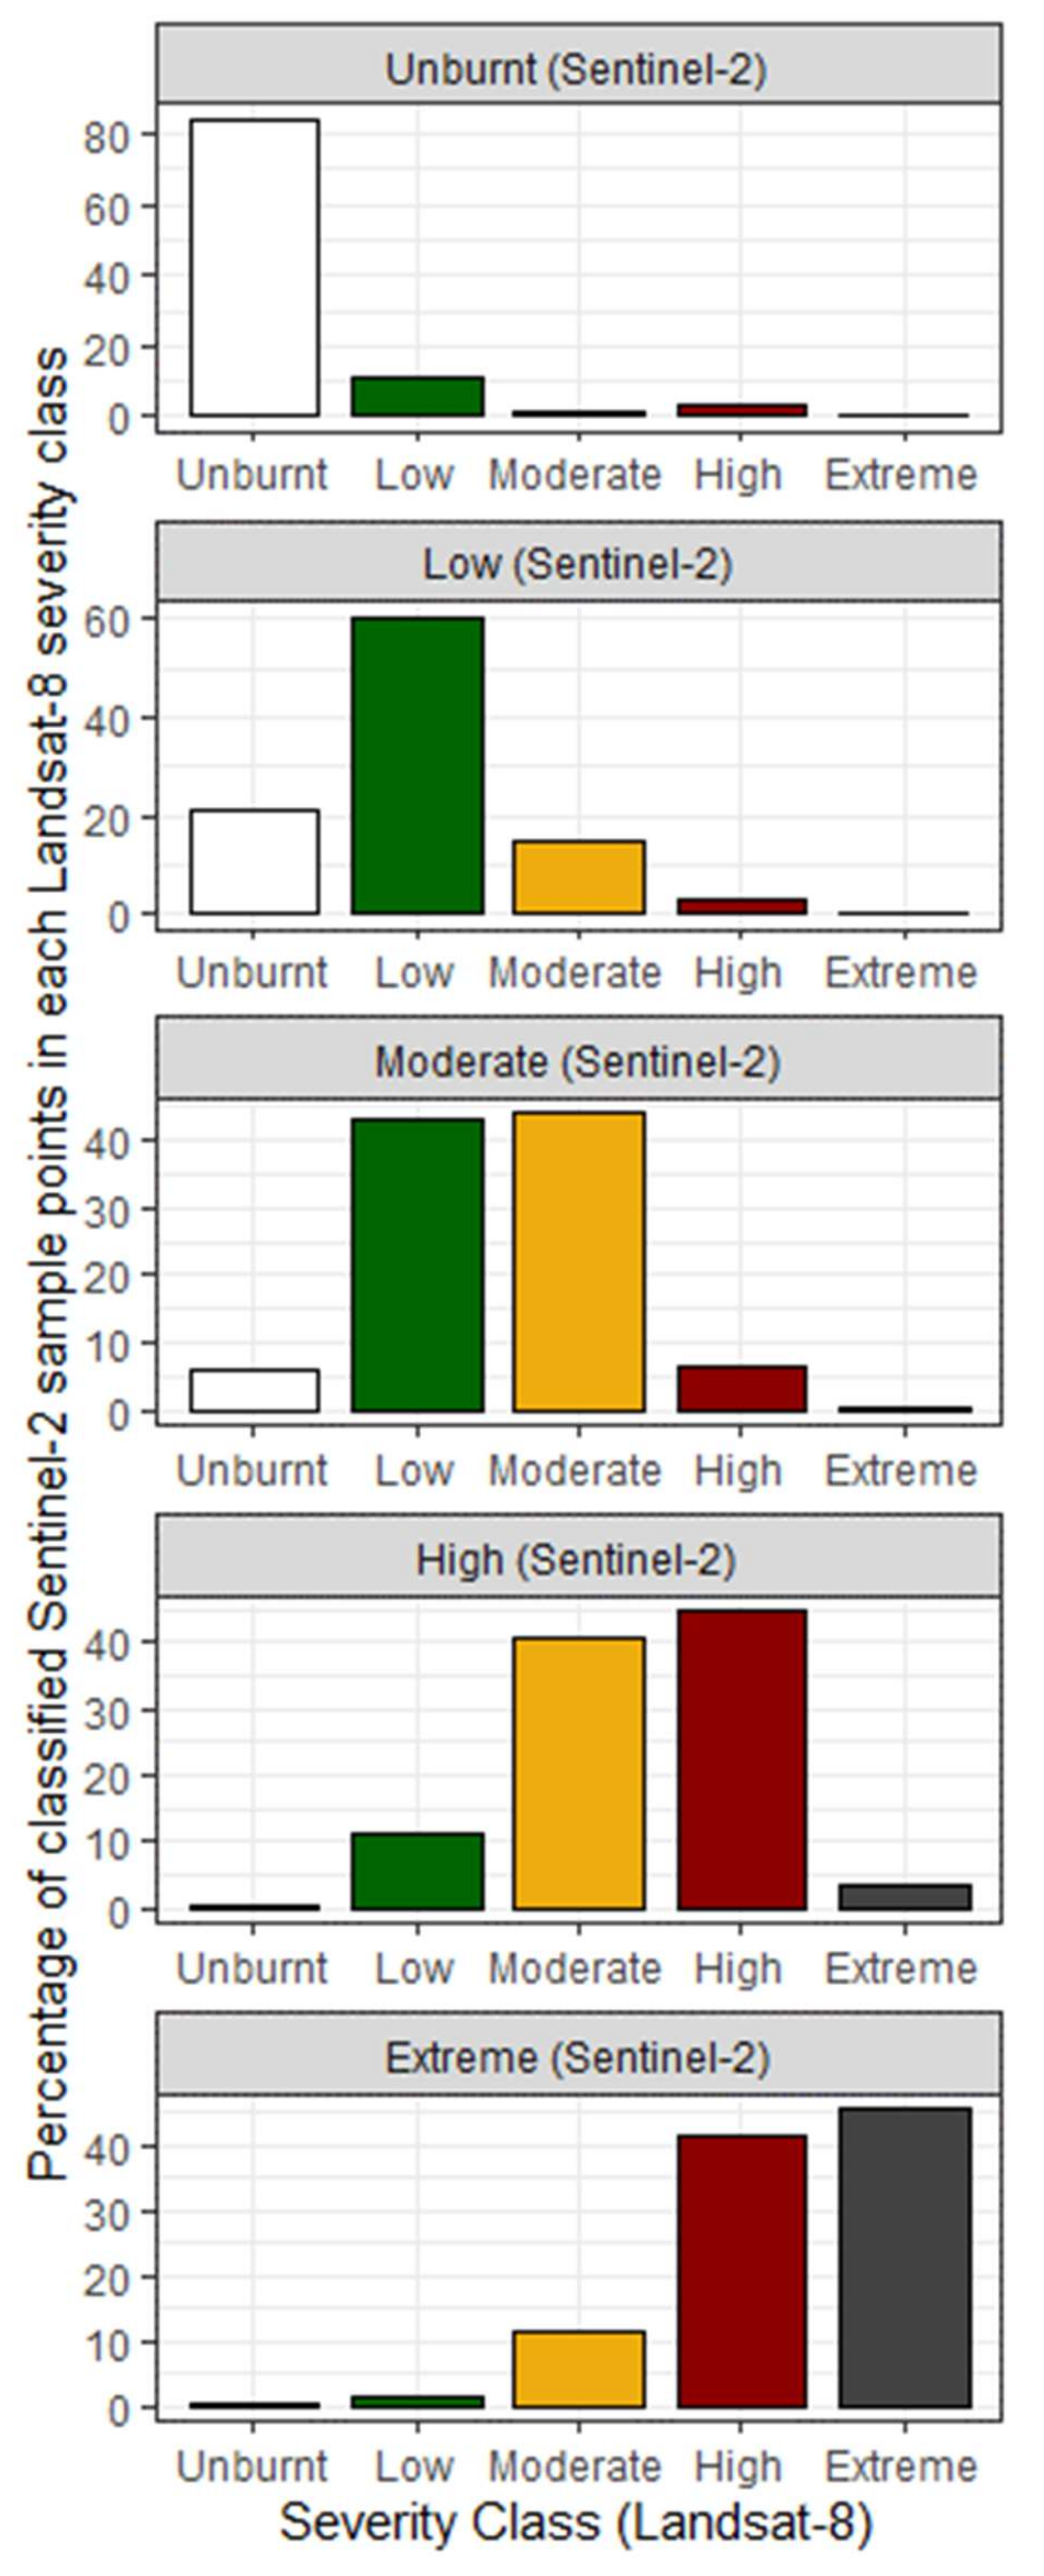
3.3. Statistical Agreement

The overall linear weighted Kappa score for the full dataset was 0.68, indicating a substantial level of agreement in Sentinel 2- and Landsat 8-derived outputs across the 27 case study fires [43] (Table 5). Scores for individual fires ranged from 0.42 (moderate agreement) up to 0.76 (substantial agreement). Out of the 27 study fires, 16 showed substantial agreement, while 11 showed moderate agreement.
The confusion matrix for the full dataset indicated that 57% of sample points were classified in agreement between the two sensors, while 92% of sample points were classified either in agreement or within an adjacent severity class (Table 6). There were high levels of agreement between the sensors for the unburnt class (Table 6, Figure 6). Within burnt classes, there was a tendency for Landsat 8 to score a proportion of pixels as a lower severity than Sentinel 2; however, this was typically only by one severity class (Table 6, Figure 6).

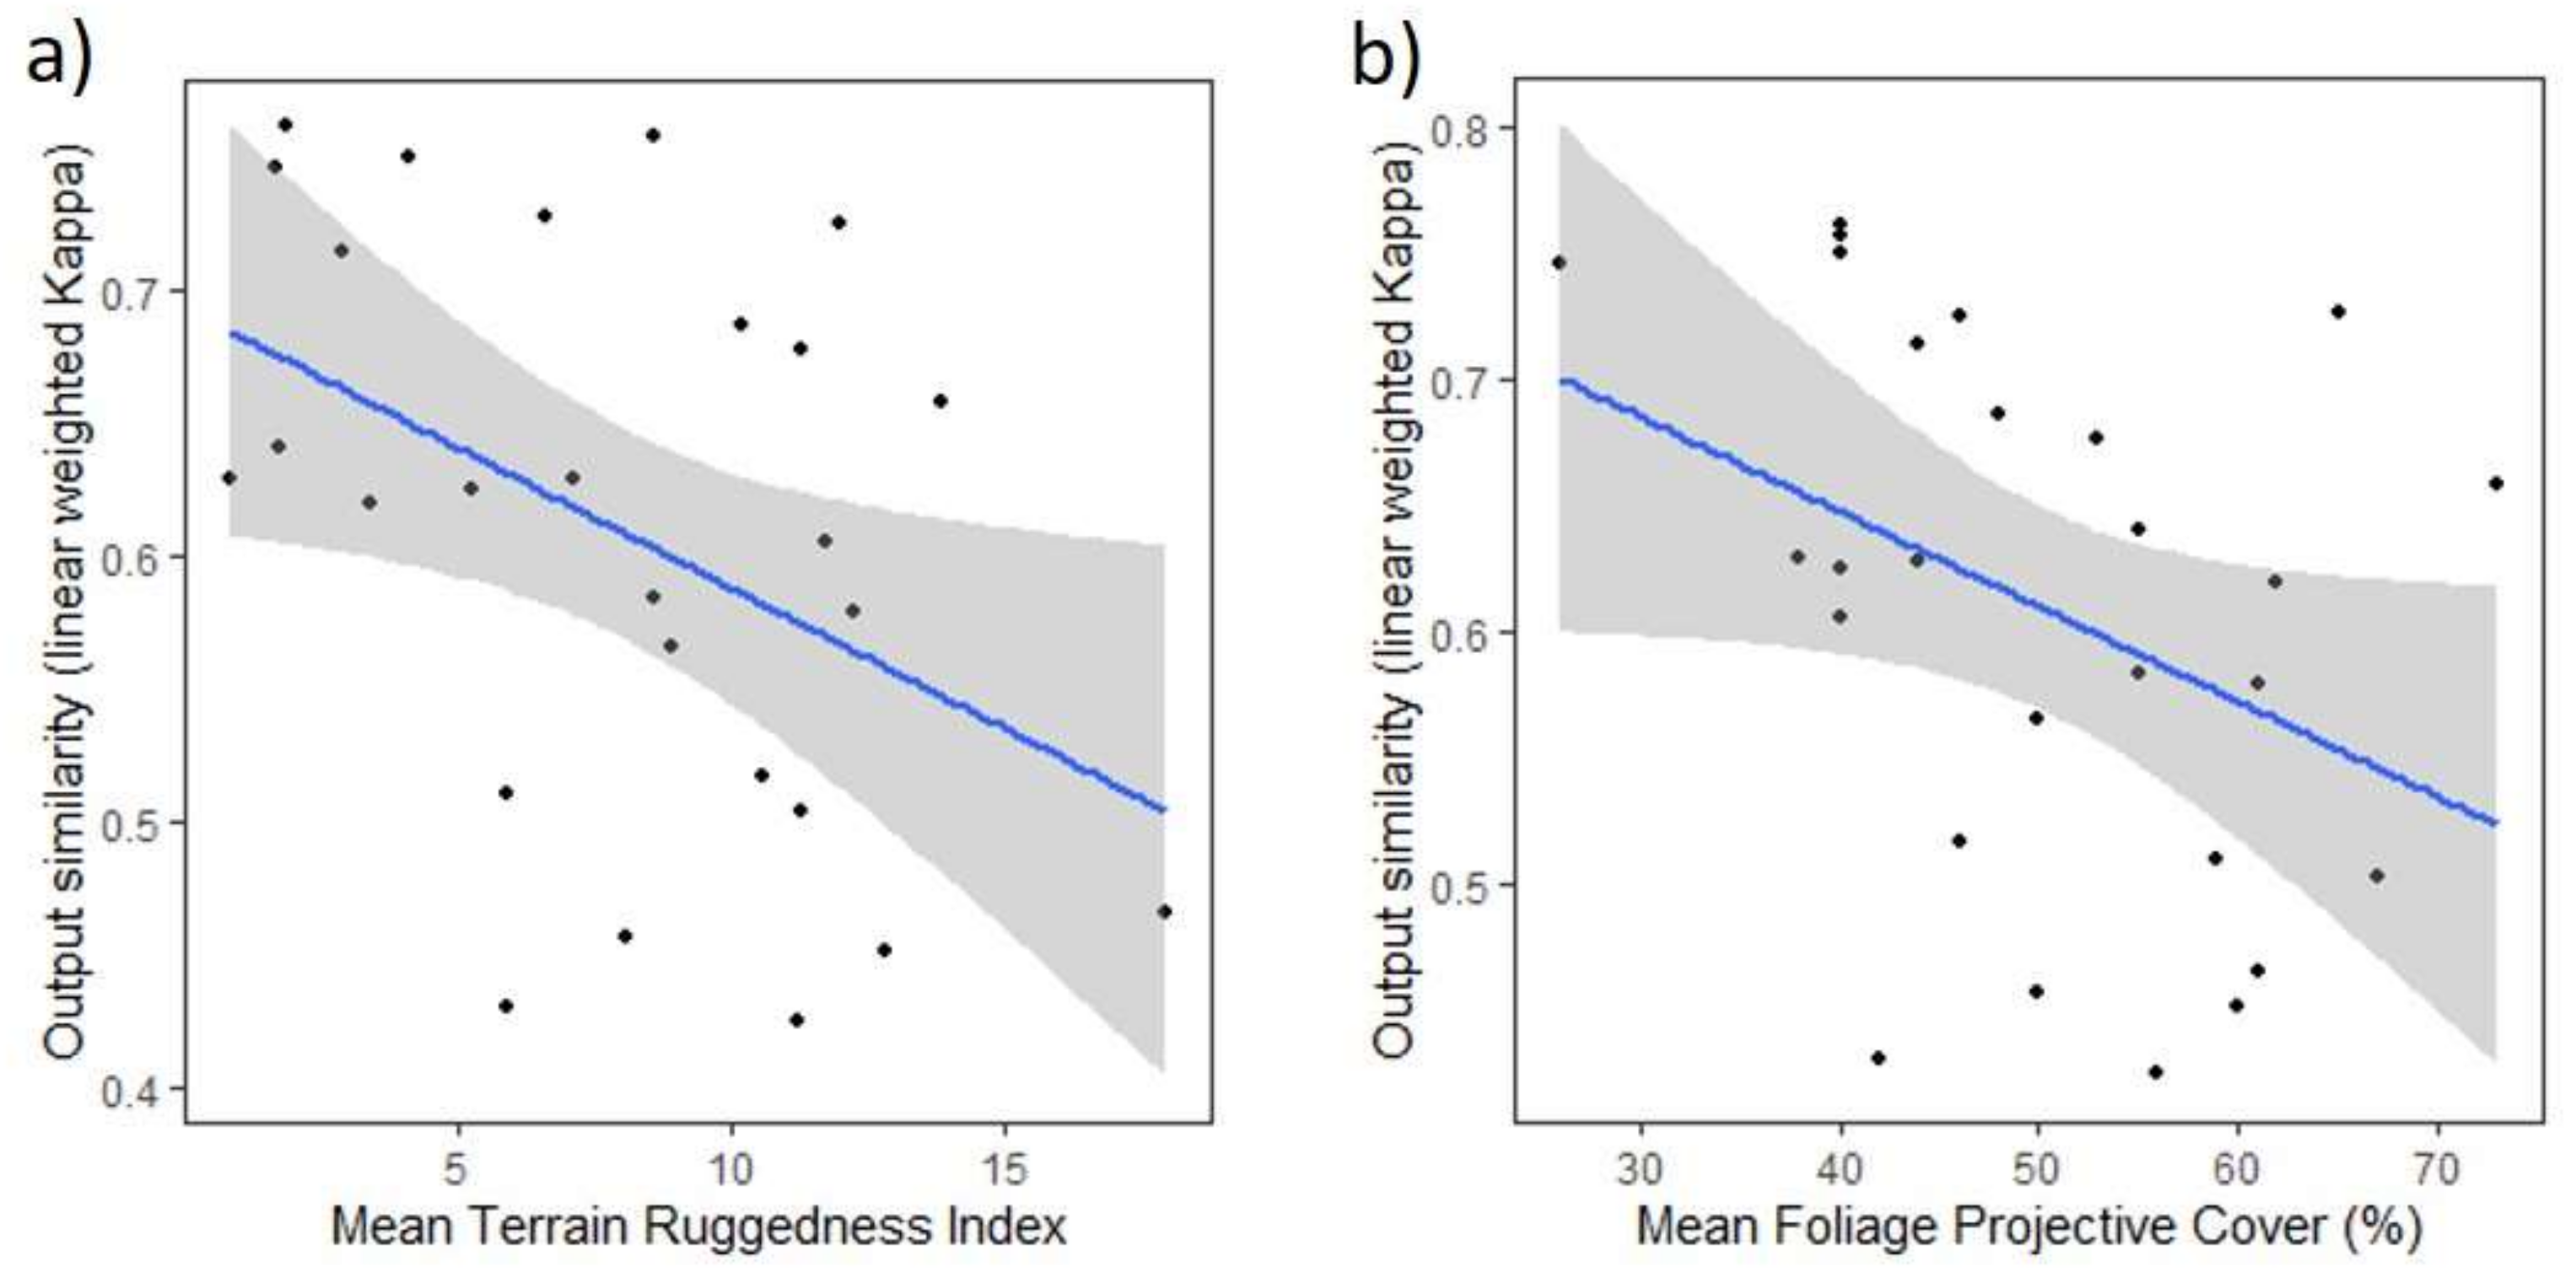
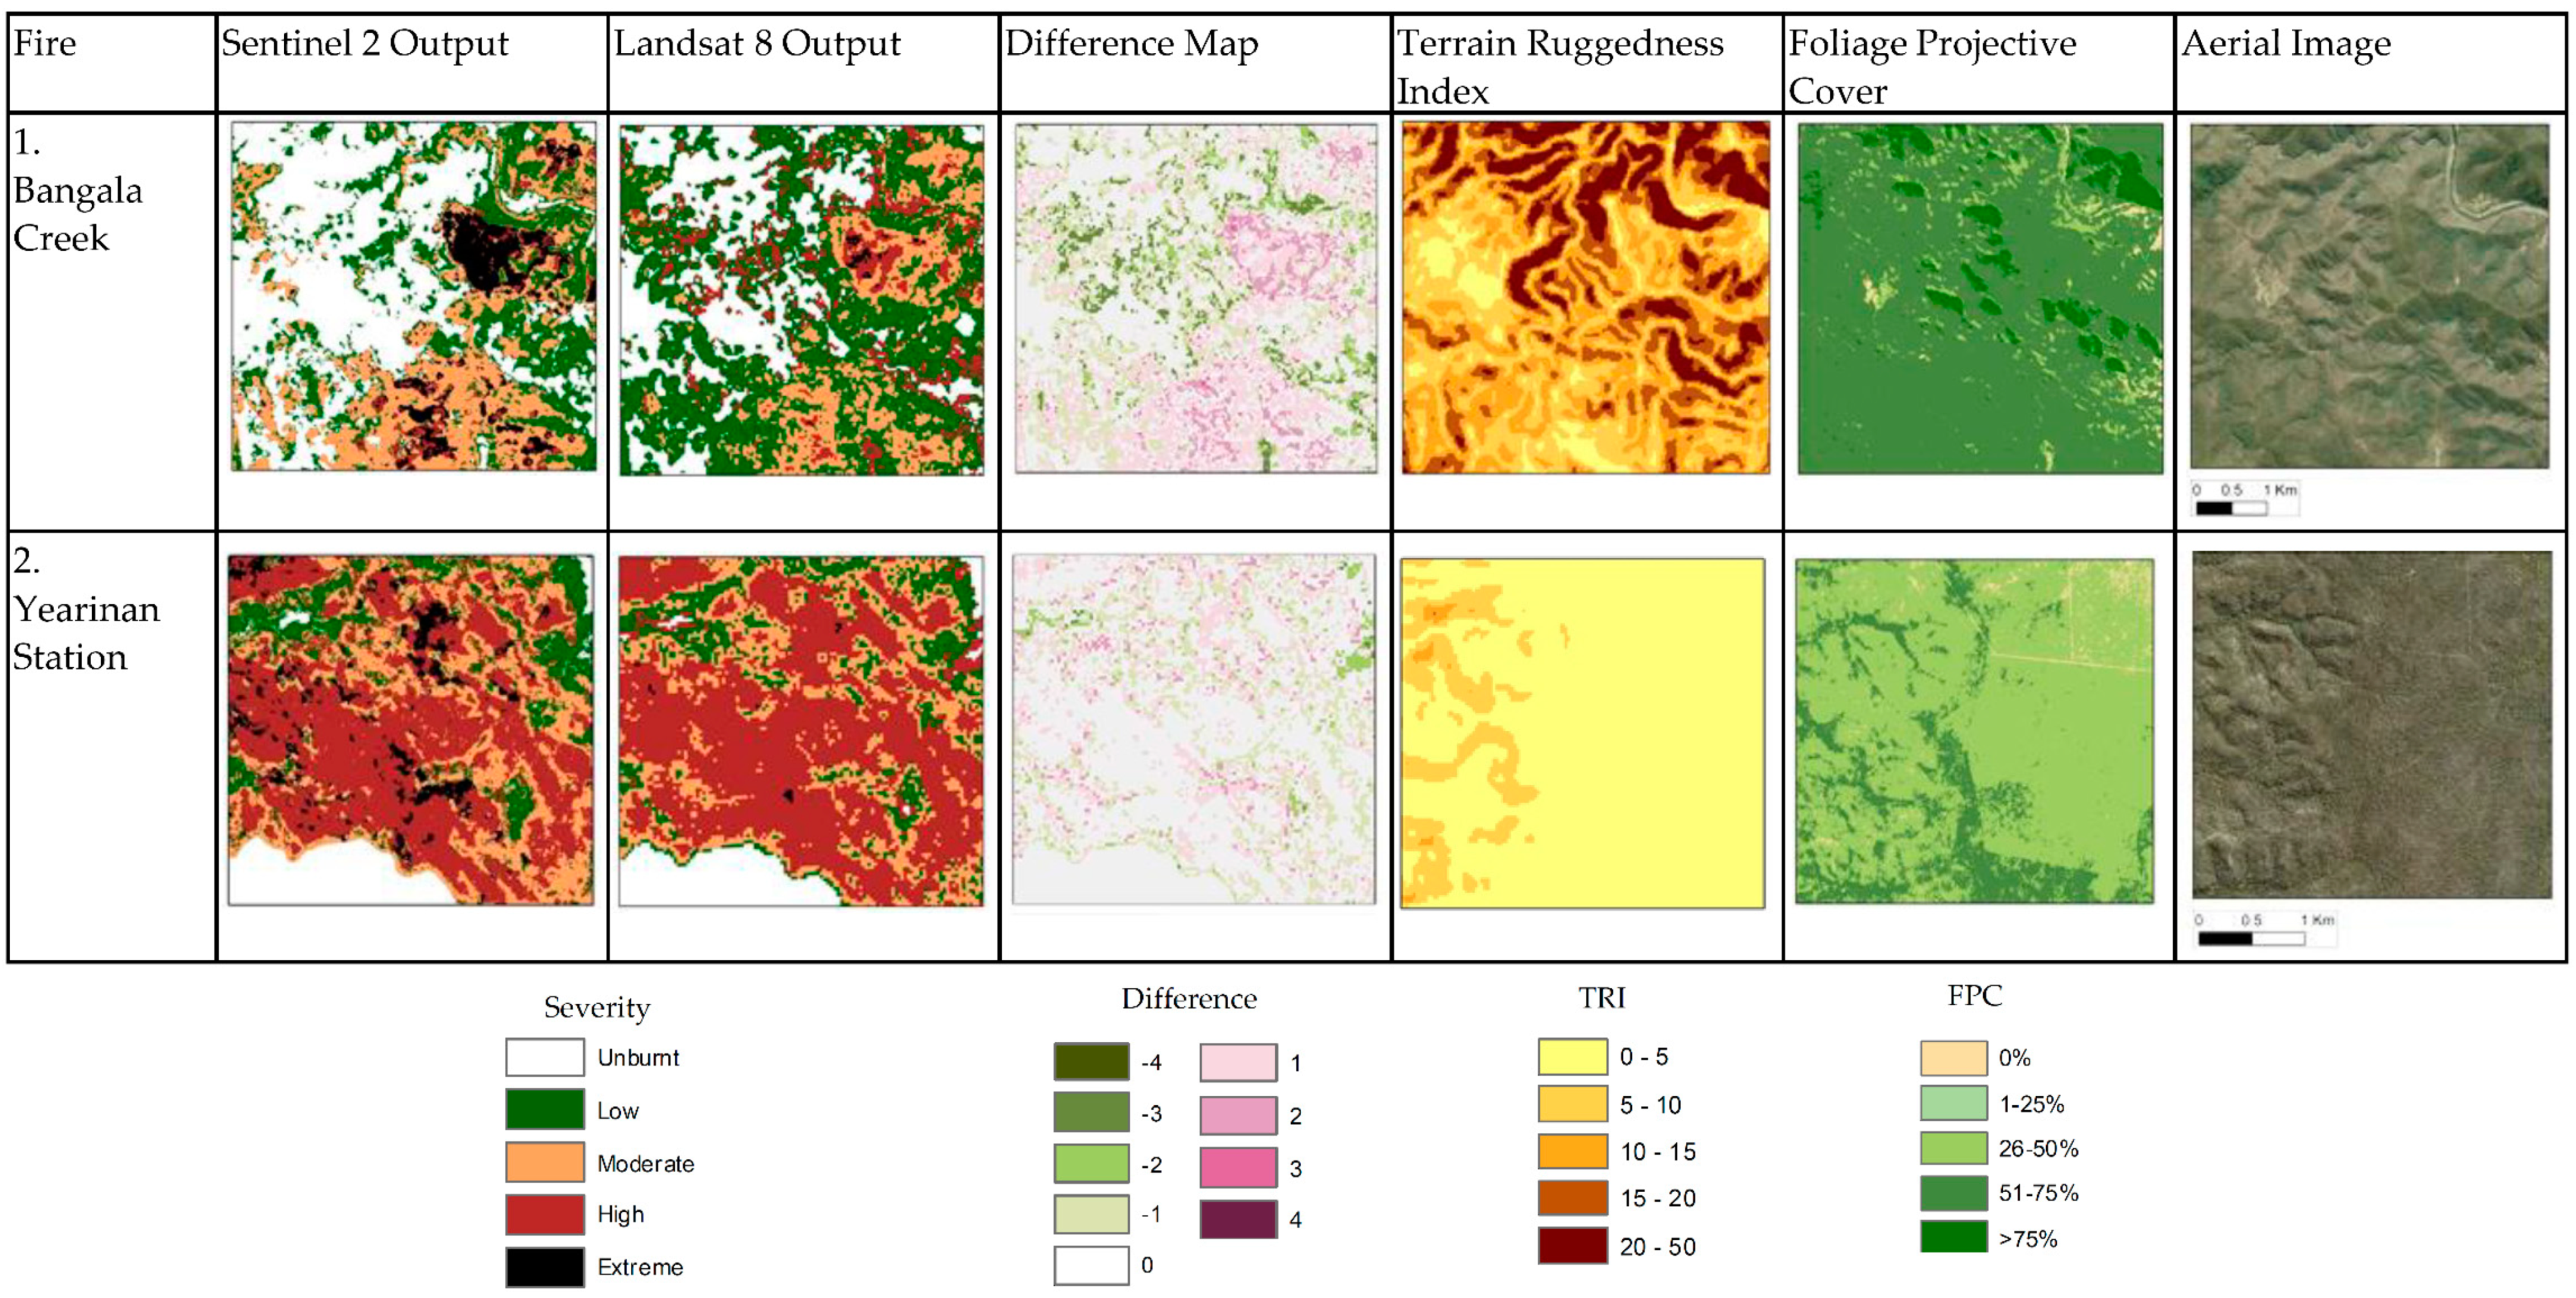
3.4. Factors Influencing Similarity between Sensors

There was a significant negative relationship between mean TRI and the similarity between sensors for study fires, where higher TRI (i.e., steeper and more complex terrain) corresponded with lower Kappa scores (p = 0.026, R2 = 0.18, Figure 7a). Fires with substantial agreement according to Kappa scores had a mean TRI of 6.4 (SE = 1.1), while those with moderate agreement had a mean TRI of 10.3 (SE = 1.0). There was also a marginally significant negative relationship between mean FPC and similarity between sensors, where higher FPC tended towards lower Kappa scores (p = 0.049, R2 = 0.15, Figure 7b). Fires with substantial agreement according to Kappa scores had a mean FPC of 47.3 (SE = 2.9), while those with moderate agreement had a mean FPC of 55.4 (SE = 2.2). Excerpts from two example fires are shown in Figure 8.
There was no significant relationship between the similarity of sensor outputs and the length of time between pre- and post-fire images, or the length of time between matched sensor images, nor was there a significant relationship with fire size, or the distance from either set of training locations.

4. Discussion

4.1. Fire Extent Mapping Similarity between Sensors

Our results demonstrate a very high level of similarity in the detection of fire extent between Sentinel 2 and Landsat 8 sensor algorithms. Assessments of the mean proportion of unburnt area and the confusion matrix of random sampling points from FESM outputs both indicated very high fidelity in the distinction of burnt and unburnt areas between outputs from the two sensors. This aligns with the very high accuracy of both models in the unburnt class. These findings indicate the strong reliability of fire extent products using both sensors interchangeably.

4.2. Fire Severity Mapping Similarity between Sensors

The confusion matrix showed a tendency for the Sentinel 2 algorithm to map some burnt areas as one higher severity class than the Landsat 8 algorithm across the 27 study fires. This was also reflected in the area assessment, where Sentinel 2 produced smaller proportions of low severity and larger proportions of high and extreme severity. In the moderate to extreme severity Sentinel 2 classes, the majority of disagreement resulted from the Landsat 8 model classifying pixels as one level of lower severity. Misclassification between adjacent classes may be expected due to the spectral similarity between adjacent classes, and due to sub-pixel mixing at different resolutions by the two sensors. Sub-pixel mixing at different scales may influence the way an algorithm clumps or separates adjacent fire severity classes which are represented by variable levels of canopy scorch or consumption. Similarly, Munyati [44] found that inherent differences in detail captured at 10 m resolution by Sentinel 2, compared to 30 m resolution by Landsat 8, influenced the interpretation of canopy cover at various densities. Additionally, differences in the outputs across the study fires may have been influenced by the additional training fires in the Sentinel 2 algorithm. However, there was no significant impact on similarity attributed to the distance to training fires that would indicate this as being a major factor. In any case, an understanding of these trends can help to inform the interpretation of severity data compiled using the different sensor algorithms. Overall, our findings indicate that the two models agree on severity classes most of the time, and the incidence of the two models producing severity scores more than one class apart is low. This supports broad compatibility of the two sensors for fire severity modelling.

4.3. Landscape Factors Influencing Similarity between Sensors

Outputs for all individual fires showed at least moderate agreement according to weighted Kappa scores, and most showed substantial agreement, indicating the robustness of the two models across various scales and landscape settings. Our findings indicate that there may be some effect of topographic roughness and canopy density on the similarity of outputs between the sensors, and this could be explained by the different resolutions of the sensors. The higher resolution of Sentinel 2 may capture greater detail in areas of high topographic complexity or high canopy density. By contrast, the same location may be captured within a single pixel due to the coarser resolution of Landsat 8. A study by Mandanici and Bitelli [25] aligns with these results, whereby the correlation between reflectance indices from Sentinel 2 imagery and resampled Landsat 8 imagery decreased over heterogeneous surfaces. Additionally, there may be inherent limitations of remote sensing applications in some landscapes, as Gibson et al. [18] reported that high topographic roughness and foliage cover may reduce the reliability of Sentinel 2-based fire severity mapping, even with the high resolution of Sentinel 2.

4.4. Comparisons with Previous Studies

Our results align with previous studies which suggest that Sentinel 2 and Landsat 8 can be successfully used in combination for long-term monitoring applications, despite some inherent variation between the sensors [24,25,26,44,45,46,47]. Our study expands on the recent findings of smaller scale studies [27,28] which reported comparable outcomes using spectral indices derived from Sentinel 2 and Landsat 8 imagery to map fire extent and severity. Archour et al. [27] reported very similar levels of accuracy between sensors for burnt area detection across two fires, although Sentinel 2 performed slightly better than Landsat 8 and tended to map a marginally larger fire footprint. Mallinis et al. [28] also found that Sentinel 2 derived indices correlated best with field-based measures of severity across a recently burnt fire ground, but concluded that both sensors performed well in discriminating fire severity thresholds. As with our study, they found that the best accuracy from both sensors was in the unburnt and highest severity classes.

5. Conclusions

This study demonstrates that FESM outputs using Sentinel 2 and Landsat 8 are largely comparable. Both sensors showed a similar level of accuracy within each fire severity class when independently assessed across 8 training fires, and weighted Kappa scores suggested substantial overall agreement between fire extent and severity outputs across 27 case study fires. Both sensors showed very high accuracy and fidelity in mapping the spatial extent of burnt areas. The incidence of the two sensor algorithms classifying fire severity as more than one class apart was less than 10%. The data presented here show that the similarity between sensors is likely to be acceptable in the context of the overall accuracy of fire extent and severity modelling [18], and utilising imagery from both sources can meet the pressing need for continuous fire history datasets.
Overall, this study supports the combined use of both sensors in fire extent and severity modelling using machine learning algorithms, enabling a comprehensive history of fire extent and severity to be compiled. This approach has been operationalised at a state-wide scale in NSW, providing enhanced opportunities for fire research and management.

Supplementary Materials

The following supporting information can be downloaded at: https://www.mdpi.com/article/10.3390/rs14071661/s1, Table S1: Details of Sentinel 2 and Landsat 8 imagery used to map the 27 case study fires; Table S2: Spectral and texture indices used in the Random Forest model to map fire extent and severity within the study; Table S3: Details of aerial imagery used to manually classify each of the 8 training fires; Table S4: Balanced accuracy statistics for Sentinel 2 and Landsat 8 FESM algorithms for each of the 8 training fires.

Author Contributions

L.A.W. and R.K.G. equally conceptualised and directed the study. L.A.W. prepared data, undertook analyses, produced the tables and figures and led the writing. R.K.G. contributed to writing and analysis. All authors have read and agreed to the published version of the manuscript.

Funding

This research was funded by NSW Department of Planning and Environment and the New South Wales Rural Fire Service.

Data Availability Statement

The data presented in this study are available on request from the corresponding author.

Acknowledgments

This study was supported by the NSW Department of Planning and Environment. We acknowledge the traditional custodians and knowledge holders of the Country where we conduct our research, walk and live. We pay our respects to Elders past, present and emerging. Anthea L. Mitchell provided helpful comments on an early draft of this manuscript. We thank three anonymous reviewers for their input and suggestions in the revision of the manuscript.

Conflicts of Interest

The authors declare no conflict of interest.

References

  1. Teske, C.; Vanderhoof, M.K.; Hawbaker, T.J.; Noble, J.; Hiers, J.K. Using the Landsat Burned Area Products to Derive Fire History Relevant for Fire Management and Conservation in the State of Florida, Southeastern USA. Fire 2021, 4, 26. [Google Scholar] [CrossRef]
  2. Eidenshink, J.; Schwind, B.; Brewer, K.; Zhu, Z.; Quayle, B.; Howard, S. A Project for Monitoring Trends in Burn Severity. Fire Ecol. 2007, 3, 3–21. [Google Scholar] [CrossRef]
  3. McCarthy, G.; Moon, K.; Smith, L. Mapping fire severity and fire extent in forest in Victoria for ecological and fuel outcomes. Ecol. Manag. Restor. 2017, 18, 54–64. [Google Scholar] [CrossRef]
  4. Parks, S.A.; Holsinger, L.M.; Panunto, M.H.; Jolly, W.M.; Dobrowski, S.Z.; Dillon, G.K. High-severity fire: Evaluating its key drivers and mapping its probability across western US forests. Environ. Res. Lett. 2017, 13, 44037. [Google Scholar] [CrossRef]
  5. Fernandes, P.M.; Guiomar, N.; Rossa, C.G. Analysing eucalypt expansion in Portugal as a fire-regime modifier. Sci. Total Environ. 2019, 666, 79–88. [Google Scholar] [CrossRef] [PubMed]
  6. Loschiavo, J.; Cirulis, B.; Zuo, Y.; Hradsky, B.A.; Di Stefano, J. Mapping prescribed fire severity in south-east Australian eucalypt forests using modelling and satellite imagery: A case study. Int. J. Wildland Fire 2017, 26, 491–497. [Google Scholar] [CrossRef]
  7. Brewer, C.K.; Winne, J.C.; Redmond, R.L.; Opitz, D.W.; Mangrich, M.V. Classifying and Mapping Wildfire Severity. Photogramm. Eng. Remote Sens. 2005, 71, 1311–1320. [Google Scholar] [CrossRef] [Green Version]
  8. Geary, W.L.; Buchan, A.; Allen, T.; Attard, D.; Bruce, M.J.; Collins, L.; Ecker, T.E.; Fairman, T.A.; Hollings, T.; Loeffler, E.; et al. Responding to the biodiversity impacts of a megafire: A case study from south-eastern Australia’s Black Summer. Divers. Distrib. 2022, 28, 463–478. [Google Scholar] [CrossRef]
  9. Gordon, C.E.; Price, O.F.; Tasker, E.M. Mapping and exploring variation in post-fire vegetation recovery following mixed severity wildfire using airborne LiDAR. Ecol. Appl. 2017, 27, 1618–1632. [Google Scholar] [CrossRef] [PubMed]
  10. Walker, R.B.; Coop, J.D.; Downing, W.M.; Krawchuk, M.A.; Malone, S.L.; Meigs, G.W. How Much Forest Persists Through Fire? High-Resolution Mapping of Tree Cover to Characterize the Abundance and Spatial Pattern of Fire Refugia Across Mosaics of Burn Severity. Forests 2019, 10, 782. [Google Scholar] [CrossRef] [Green Version]
  11. French, N.H.F.; Kasischke, E.S.; Hall, R.J.; Murphy, K.A.; Verbyla, D.L.; Hoy, E.E.; Allen, J.L. Using Landsat data to assess fire and burn severity in the North American boreal forest region: An overview and summary of results. Int. J. Wildland Fire 2008, 17, 443–462. [Google Scholar] [CrossRef]
  12. Efthimiou, N.; Psomiadis, E.; Panagos, P. Fire severity and soil erosion susceptibility mapping using multi-temporal Earth Observation data: The case of Mati fatal wildfire in Eastern Attica, Greece. Catena 2020, 187, 104320. [Google Scholar] [CrossRef]
  13. Fox, D.M.; Maselli, F.; Carrega, P. Using SPOT images and field sampling to map burn severity and vegetation factors affecting post forest fire erosion risk. Catena 2008, 75, 326–335. [Google Scholar] [CrossRef]
  14. Coppoletta, M.; Merriam, K.E.; Collins, B.M. Post-fire vegetation and fuel development influences fire severity patterns in reburns. Ecol. Appl. 2016, 26, 686–699. [Google Scholar] [CrossRef] [PubMed]
  15. Hessl, A.E. Pathways for climate change effects on fire: Models, data, and uncertainties. Prog. Phys. Geogr. Earth Environ. 2011, 35, 393–407. [Google Scholar] [CrossRef]
  16. Sommers, W. Fire history, fire regimes, and climate change–integrating information for management and planning. Nat. Preced. 2010. [Google Scholar] [CrossRef] [Green Version]
  17. Flannigan, M.D.; Krawchuk, M.A.; de Groot, W.J.; Wotton, B.M.; Gowman, L.M. Implications of changing climate for global wildland fire. Int. J. Wildland Fire 2009, 18, 483–507. [Google Scholar] [CrossRef]
  18. Gibson, R.; Danaher, T.; Hehir, W.; Collins, L. A remote sensing approach to mapping fire severity in south-eastern Australia using sentinel 2 and random forest. Remote Sens. Environ. 2020, 240, 111702. [Google Scholar] [CrossRef]
  19. Collins, L.; Griffioen, P.; Newell, G.; Mellor, A. The utility of Random Forests for wildfire severity mapping. Remote Sens. Environ. 2018, 216, 374–384. [Google Scholar] [CrossRef]
  20. Dixon, D.J.; Callow, J.N.; Duncan, J.M.A.; Setterfield, S.A.; Pauli, N. Regional-scale fire severity mapping of Eucalyptus forests with the Landsat archive. Remote Sens. Environ. 2022, 270, 112863. [Google Scholar] [CrossRef]
  21. Belenguer-Plomer, M.A.; Tanase, M.A.; Fernandez-Carrillo, A.; Chuvieco, E. Burned area detection and mapping using Sentinel-1 backscatter coefficient and thermal anomalies. Remote Sens. Environ. 2019, 233, 111345. [Google Scholar] [CrossRef]
  22. Montorio, R.; Pérez-Cabello, F.; Borini Alves, D.; García-Martín, A. Unitemporal approach to fire severity mapping using multispectral synthetic databases and Random Forests. Remote Sens. Environ. 2020, 249, 112025. [Google Scholar] [CrossRef]
  23. Department of Planning, Industry and Environment (DPIE). Fire Extent and Severity Mapping-Annual Report for the 2019–2020, 2018–2019 and 2017–2018 Fire Years; Department of Planning Industry and Environment: Parramatta, NSW, Australia, 2020. Available online: https://www.environment.nsw.gov.au/-/media/OEH/Corporate-Site/Documents/Animals-and-plants/Native-vegetation/fire-extent-and-severity-mapping-annual-report-2017-18-2019-20-210180.pdf (accessed on 30 January 2022).
  24. Flood, N. Comparing Sentinel-2A and Landsat 7 and 8 Using Surface Reflectance over Australia. Remote Sens. 2017, 9, 659. [Google Scholar] [CrossRef] [Green Version]
  25. Mandanici, E.; Bitelli, G. Preliminary Comparison of Sentinel-2 and Landsat 8 Imagery for a Combined Use. Remote Sens. 2016, 8, 1014. [Google Scholar] [CrossRef] [Green Version]
  26. Vuolo, F.; Zoltak, M.; Pipitone, C.; Zappa, L.; Wenng, H.; Immitzer, M.; Weiss, M.; Baret, F.; Atzberger, C. Data Service Platform for Sentinel-2 Surface Reflectance and Value-Added Products: System Use and Examples. Remote Sens. 2016, 8, 938. [Google Scholar] [CrossRef] [Green Version]
  27. Archour, H.; Toujani, A.; Trabelsi, H.; Jaouadi, W. Evaluation and comparison of Sentinel-2 MSI, Landsat 8 OLI, and EFFIS data for forest fires mapping. Illustrations from the summer 2017 fires in Tunisia. Geocarto Int. 2021, 1–20. [Google Scholar] [CrossRef]
  28. Mallinis, G.; Mitsopoulos, I.; Chrysafi, I. Evaluating and comparing Sentinel 2A and Landsat-8 Operational Land Imager (OLI) spectral indices for estimating fire severity in a Mediterranean pine ecosystem of Greece. GIScience Remote Sens. 2018, 55, 1–18. [Google Scholar] [CrossRef]
  29. Flood, N.; Danaher, T.; Gill, T.; Gillingham, S. An operational scheme for deriving standardised surface reflectance from Landsat TM/ETM+ and SPOT HRG imagery for eastern Australia. Remote Sens. 2013, 5, 83–109. [Google Scholar] [CrossRef] [Green Version]
  30. Farr, T.G.; Rosen, P.A.; Caro, E.; Crippen, R.; Duren, R.; Hensley, S.; Kobrick, M.; Paller, M.; Rodriguez, E.; Roth, L.; et al. The Shuttle Radar Topography Mission. Rev. Geophys. 2007, 45, RG2004. [Google Scholar] [CrossRef] [Green Version]
  31. Gallant, J.; Read, A. Enhancing the SRTM Data for Australia. In Proceedings of the Geomorphometry, Zurich, Switzerland, 31 August–2 September 2009; Available online: https://geomorphometry.org/gallantread2009 (accessed on 30 January 2022).
  32. Guerschman, J.P.; Scarth, P.F.; McVicar, T.R.; Renzullo, L.J.; Malthus, T.J.; Stewart, J.B.; Rickards, J.E.; Trevithick, R. Assessing the effects of site heterogeneity and soil properties when unmixing photosynthetic vegetation, non-photosynthetic vegetation and bare soil fractions from Landsat and MODIS data. Remote Sens. Environ. 2015, 161, 12–26. [Google Scholar] [CrossRef]
  33. Hammill, K.A.; Bradstock, R.A. Remote sensing of fire severity in the Blue Mountains: Influence of vegetation type and inferring fire intesity. Int. J. Wildland Fire 2006, 15, 213–226. [Google Scholar] [CrossRef]
  34. Hudak, A.T.; Robichaud, P.R.; Evans, J.S.; Clark, J.; Lannom, K.; Morgan, P.; Stone, C. Field validation of burned area reflectance classification (BARC) products for post fire assessment. In Proceedings of the Remote Sensing for Field Users: Proceedings of the Tenth Forest Service Remote Sensing Applications Conference, Salt Lake City, UT, USA, 5–9 April 2004; Available online: https://www.fs.usda.gov/treesearch/pubs/23530 (accessed on 30 January 2022).
  35. Kuhn, M. Classification and Regression Training (Package ‘Caret’). 2019. Available online: https://CRAN.R-project.org/package=caret (accessed on 30 January 2022).
  36. Breiman, L.; Cutler, A. Breiman and Cutler’s Random Forest for Classification and Regression (Package ‘RandomForest’). 2018. Available online: https://CRAN.R-project.org/package=randomForest (accessed on 30 January 2022).
  37. Vanbelle, S. A New Interpretation of the Weighted Kappa Coefficients. Psychometrika 2016, 81, 399–410. [Google Scholar] [CrossRef] [PubMed]
  38. R Core Team. R: A Language and Environment for Statistical Computing; R Foundation for Statistical Computing: Vienna, Austria, 2021; Available online: https://www.R-project.org/ (accessed on 30 January 2022).
  39. Wilson, M.F.J.; O’Connell, B.; Brown, C.; Guinan, J.C.; Grehan, A.J. Multiscale Terrain Analysis of Multibeam Bathymetry Data for Habitat Mapping on the Continental Slope. Mar. Geod. 2007, 30, 3–35. [Google Scholar] [CrossRef] [Green Version]
  40. Amatulli, G.; Domisch, S.; Tuanmu, M.-N.; Parmentier, B.; Ranipeta, A.; Malczyk, J.; Jetz, W. A suite of global, cross-scale topographic variables for environmental and biodiversity modeling. Sci. Data 2018, 5, 180040. [Google Scholar] [CrossRef] [PubMed] [Green Version]
  41. Armston, J.D.; Denham, R.; Danaher, T.; Scarth, P.; Moffiet, T.N. Prediction and validation of foliage projective cover from Landsat-5 TM and Landsat-7 ETM+ imagery. J. Appl. Remote Sens. 2009, 3, 033540. [Google Scholar] [CrossRef]
  42. Fisher, A.; Day, M.; Gill, T.; Roff, A.; Danaher, T.; Flood, N. Large-area, highresolution tree cover mapping with multi-temporal SPOT5 imagery, New South Wales, Australia. Remote Sens. 2016, 8, 515. [Google Scholar] [CrossRef] [Green Version]
  43. Landis, J.R.; Koch, G.G. The Measurement of Observer Agreement for Categorical Data. Biometrics 1977, 33, 159–174. [Google Scholar] [CrossRef] [Green Version]
  44. Munyati, C. The potential for integrating Sentinel 2 MSI with SPOT 5 HRG and Landsat 8 OLI imagery for monitoring semi-arid savannah woody cover. Int. J. Remote Sens. 2017, 38, 4888–4913. [Google Scholar] [CrossRef]
  45. Naegeli, K.; Damm, A.; Huss, M.; Wulf, H.; Schaepman, M.; Hoelzle, M. Cross-Comparison of Albedo Products for Glacier Surfaces Derived from Airborne and Satellite (Sentinel-2 and Landsat 8) Optical Data. Remote Sens. 2017, 9, 110. [Google Scholar] [CrossRef] [Green Version]
  46. Van der Werff, H.; Van der Meer, F. Sentinel-2A MSI and Landsat 8 OLI Provide Data Continuity for Geological Remote Sensing. Remote Sens. 2016, 8, 883. [Google Scholar] [CrossRef] [Green Version]
  47. Korhonen, L.; Hadi Packalen, P.; Rautiainen, M. Comparison of Sentinel-2 and Landsat 8 in the estimation of boreal forest canopy cover and leaf area index. Remote Sens. Environ. 2017, 195, 259–274. [Google Scholar] [CrossRef]
Figure 1. Location and relative size of the 27 study fires used to compare fire extent and severity map outputs in New South Wales, Australia.
Remotesensing 14 01661 g001
Figure 2. Location and relative size of the eight training fires used in accuracy assessments in New South Wales, Australia.
Remotesensing 14 01661 g002
Figure 3. FESM outputs for three study fires mapped with both Sentinel 2 and Landsat 8 imagery. Difference maps show the number of classes higher or lower predicted by Sentinel 2 compared with Landsat 8. See Figure 1 to cross-reference locations of these fires in NSW.
Remotesensing 14 01661 g003
Figure 4. The mean difference in the percent of total fire area in each severity class across all 27 case study fires when mapped with Sentinel 2 compared to Landsat 8.
Remotesensing 14 01661 g004
Figure 5. The mean percent of fire area in each severity class across all 27 case study fires when mapped with Sentinel 2 and Landsat 8 sensors.
Remotesensing 14 01661 g005
Figure 6. The percentage of Landsat 8 severity class scores within each Sentinel 2 severity class, across all random sampling points.
Remotesensing 14 01661 g006
Figure 7. Relationships between Sentinel 2 and Landsat 8 output similarity (linear weighted Kappa score) for study fires and the mean Terrain Ruggedness Index (a) and mean foliage projective cover (b) of the fire area. Note that TRI values close to 1 denote flat areas, while higher values denote increasingly rugged terrain.
Remotesensing 14 01661 g007
Figure 8. Excerpts from Bangala Creek and Yearinan Station study fires, showing the difference between severity outputs and the terrain ruggedness and foliage projective cover of the mapped area. Aerial imagery captured in 2012 showing the typical unburnt condition is also shown.
Remotesensing 14 01661 g008
Table 1. Details of Sentinel 2 and Landsat 8 satellite sensors (adapted from Flood [24]).
Sentinel 2Landsat 8
Imagery availabilityLate 2015–present2013–present
Imagery resolution
(pixel size)
10 m (20 m for SWIR bands)30 m
Sensor revisit timeEvery 5 daysEvery 16 days
Timeframe used for FESM2017–2018 fire year to present2016–2017 fire year and prior
Spectral wavelengths
(nanometers)
Blue:458–522(band 2)Blue:450–510(band 2)
Green:543–578(band 3)Green:530–590(band 3)
Red:650–680(band 4)Red:640–670(band 4)
NIR:785–900(band 8)NIR:850–880(band 5)
SWIR1:1565–1655(band 11)SWIR1:1570–1650(band 6)
SWIR2:2100–2280(band 12)SWIR2:2110–2290(band 7)
NIR = Near Infra-Red, SWIR = Short Wave Infra-Red.
Table 2. Fire severity class labels and definitions [18].
Pixel ColourSeverity ClassDefinition% Foliage Fire Affected
Remotesensing 14 01661 i001UnburntUnburnt0% canopy and understory burnt
Remotesensing 14 01661 i002LowBurnt surface with unburnt canopy>10% burnt understory
>90% green canopy
Remotesensing 14 01661 i003ModeratePartial canopy scorch20–90% canopy scorch
Remotesensing 14 01661 i004HighFull canopy scorch (+/− partial canopy consumption)>90% canopy scorched
<50% canopy biomass consumed
Remotesensing 14 01661 i005ExtremeFull canopy consumption>50% canopy biomass consumed
Table 3. Source data and calculation methods for candidate factors impacting sensor output similarity.
Candidate FactorData SourceCalculation Method
Terrain Ruggedness Index (TRI)DEM-derived terrain ruggedness index [39]Mean value calculated for each study fire FESM output area in ArcGIS (zonal statistics)
Woody Foliage Projective Cover (FPC)NSW Woody Vegetation Extent & Foliage Projective Cover 2011 [42]Mean value calculated for each study fire FESM output area in ArcGIS (zonal statistics)
Time between matched image datesSelected images from each sensor typeMean and maximum difference in days between matched pre- and post-fire images for each study fire
Time between pre- and post-fire image datesSelected images from each sensor typeNo of days between pre- and post-fire imagery, averaged between sensor types
Distance from training locationsTraining data shapefilesDistances from both sets of training fires (Landsat 8 and Sentinel 2) were calculated for each study fire in ArcGIS (near function)
Fire size (Ha)FESM outputsTotal fire extent (Ha) for each fire, calculated from pixel number and size
Table 4. Comparison of the balanced accuracy statistics for each severity class, as well as the Kappa and overall balanced accuracy statistics for Sentinel 2 and Landsat 8 FESM algorithms independently tested across the eight training fires.
Sentinel 2Landsat 8Difference
Unburnt0.980.960.02
Low severity0.830.86−0.03
Moderate severity0.660.67−0.01
High severity0.840.790.05
Extreme severity0.910.890.01
Kappa Score0.720.710.01
Overall Accuracy0.800.82−0.02
Table 5. Kappa score definitions [43].
Kappa ScoreLevel of Agreement
>0.81almost perfect
0.61–0.8substantial
0.4–0.6moderate
0.21–0.4fair
0–0.2slight
<0poor
Table 6. Confusion matrix for 111,994 random sampling points across all 27 case study fires comparing severity classes between Sentinel 2 and Landsat 8 outputs.
Sentinel 2
Landsat 8 UnburntLowModerateHighExtreme
Unburnt24,196308214257623
Low3166877696742574284
Moderate4812131987093852658
High871454149110,3469571
Extreme3449076610,557
Publisher’s Note: MDPI stays neutral with regard to jurisdictional claims in published maps and institutional affiliations.

