Article

Simulating River/Lake–Groundwater Exchanges in Arid River Basins: An Improvement Constrained by Lake Surface Area Dynamics and Evapotranspiration

1
Department of Hydrogeology, Lomonosov Moscow State University, GSP-1, Leninskie Gory, Moscow 119899, Russia
2
Key Laboratory of Water Cycle and Related Land Surface Processes, Institute of Geographic Sciences and Natural Resources Research, Chinese Academy of Sciences, Beijing 100101, China
3
University of Chinese Academy of Sciences, Beijing 100049, China
4
School of Water Conservancy Engineering, Zhengzhou University, 100 Science Avenue, Zhengzhou 450001, China
*
Author to whom correspondence should be addressed.
These authors contributed equally to this work.
Remote Sens. 2022, 14(7), 1657; https://doi.org/10.3390/rs14071657
Submission received: 19 February 2022 / Revised: 26 March 2022 / Accepted: 28 March 2022 / Published: 30 March 2022

Abstract

:
Surface water–groundwater interactions in arid zones are characterized by water exchange processes in a complex system comprising intermittent streams/terminal lakes, shallow aquifers, riparian zone evapotranspiration, and groundwater withdrawal. Notable challenges arise when simulating such hydrological systems; for example, field observations are scarce, and hydrogeological parameters exhibit considerable spatial heterogeneity. To reduce the simulation uncertainties, in addition to groundwater head and river discharge measurements, we adopted remote sensing-based evapotranspiration data and lake area dynamics as known conditions to calibrate the model. We chose the Ejina Basin, located in the lower reaches of the Heihe River Basin in arid northwest China, as the study area to validate our modelling approach. The hydrological system of this basin is characterized by intensive, spatiotemporally variable surface water–groundwater interactions. The areas of the terminal lakes into which all river runoff flows vary significantly depending on the ratio between river runoff and lake evaporation. Simulation results with a monthly time step from 2000 to 2017 indicate that river leakage accounted for approximately 61% of the total river runoff. Our study shows that for areas where surface water and groundwater observations are sparse, combining remote sensing product data of surface water areas and evapotranspiration can effectively reduce the uncertainty in coupled surface water and groundwater simulations.

1. Introduction

Currently, arid territories account for approximately 35% of the Earth’s surface [1]. Due to the ongoing [2] and predicted impacts of climate change, these arid regions are expected to expand, thereby occupying greater surface areas. These arid territories face a serious problem: water resource deficits. The key to solving this problem is the effective management of limited water resources; however, this task is impossible to achieve without quantitatively assessing the interaction between groundwater and surface water.
Recently, various methods for assessing the exchange between groundwater and surface water have been developed and widely used. Examples of these approaches include studying the temperature regime of riverbed sediments, surface water, and groundwater [3,4,5]; estimating the hydraulic properties of riverbed sediments based on falling head permeameter tests [4,6,7]; and performing isotopic and geochemical analyses of surface water and groundwater. However, while these methods permit highly accurate determinations of the direction and magnitude of surface water–groundwater interactions at point or local scales, the results cannot be scaled to the extended sections of river channels. Furthermore, as demonstrated by many recent studies, e.g., [3,4,5,6,7,8,9], even in relatively short sections of river channels (100–300 m in length), there is considerable spatial heterogeneity in the riverbed hydraulic properties, water and riverbed sediment temperatures, and head gradients between surface water and groundwater; therefore, the leakage direction and magnitude are also spatially variable. Thus, to determine the magnitude and direction of leakage at the basin scale, regional coupled surface water–groundwater models should be developed using the results of point-scale studies and monitoring data.
The Ejina Basin, located in the downstream reaches of the Heihe River, is situated within the vast Gobi Desert of northwest China. Under the hyperarid climate conditions with limited precipitation typical of this region, leakage from the Heihe River represents the main source of recharge for the regional shallow aquifer system in which the groundwater level determines the possibility of vegetation growth in the riparian zone. Consequently, the increase in river runoff withdrawal in the middle reaches of the Heihe River over the last 50 years has led to significant ecological problems in its lower reaches, such as the lowering of the groundwater table, the desertification of the Ejina Oasis, and the complete disappearance of terminal lakes [10]. As such, assessing the conditions and parameters of the surface water–groundwater relationship in this area is a key task in solving these environmental problems. Moreover, such an assessment of a specific basin as an example enables the application of this methodology to areas typified by similar natural and climatic conditions.
Several coupled surface water–groundwater models of the Ejina Basin have been developed in recent decades [11,12,13,14]. The main goals of these simulation studies were to investigate the groundwater balance components and to predict the groundwater level changes in the Ejina Basin under different variations in the incoming runoff of the Heihe River. The calculations were performed using the MODFLOW-2005 code [15] with various user interfaces. In addition, the developed models covered different periods of time (from 1988 to 2011), employed various calculation grid sizes (from 500 m × 500 m to 3 km × 3 km), and utilized different packages to simulate the interactions among surface water and groundwater and evapotranspiration.
Nevertheless, these models exhibited some major issues, and several problems can be highlighted: the models failed to consider the anthropogenic stress on groundwater; the simple River (RIV) package [15] was used to simulate the interaction between surface water and groundwater, and the limited Evapotranspiration (EVT) package [15] was applied to simulate evapotranspiration discharge; relatively coarse calculation grids and short calculation periods were adopted; and independent assessments of groundwater discharge via evapotranspiration were lacking. In addition, as indicated by Brunner et al. [16], a paucity of data considerably limits the ability to assess, simulate, and manage surface and groundwater resources, especially in semiarid and arid environments with sparse and insufficient observations. Recent developments in remote sensing have provided opportunities to create spatially distributed input parameter sets for groundwater models and to constrain models during their calibration [16,17]. Doble and Crosbie [18] and Yao et al. [14] emphasized that improvements in the reliability of groundwater models should be based on the validation of evapotranspiration by remote sensing data. For example, Colombani et al. [19] used the retrieved evapotranspiration rates from the Moderate Resolution Imaging Spectroradiometer (MODIS) database as the input values for a numerical groundwater model.
Thus, to address these deficiencies, the objectives of the present study are as follows: (1) to estimate the river leakage patterns during 2000–2017 from a system of connected channels in the lower reaches of the Heihe River using a numerical coupled surface water–groundwater model and considering physically reasonable models of surface water and groundwater interactions and groundwater evapotranspiration; (2) to calibrate and validate the constructed model using complex direct (groundwater levels and river runoff measurements) and indirect (remote sensing data of evaporation from the ground surface and dynamics of terminal lake areas) observations; and (3) to quantify the river runoff that needs to pass every year into the lower Heihe River to stabilize the areas of the three main terminal lakes and to support the vegetation in the riparian zone.

2. Materials and Methods
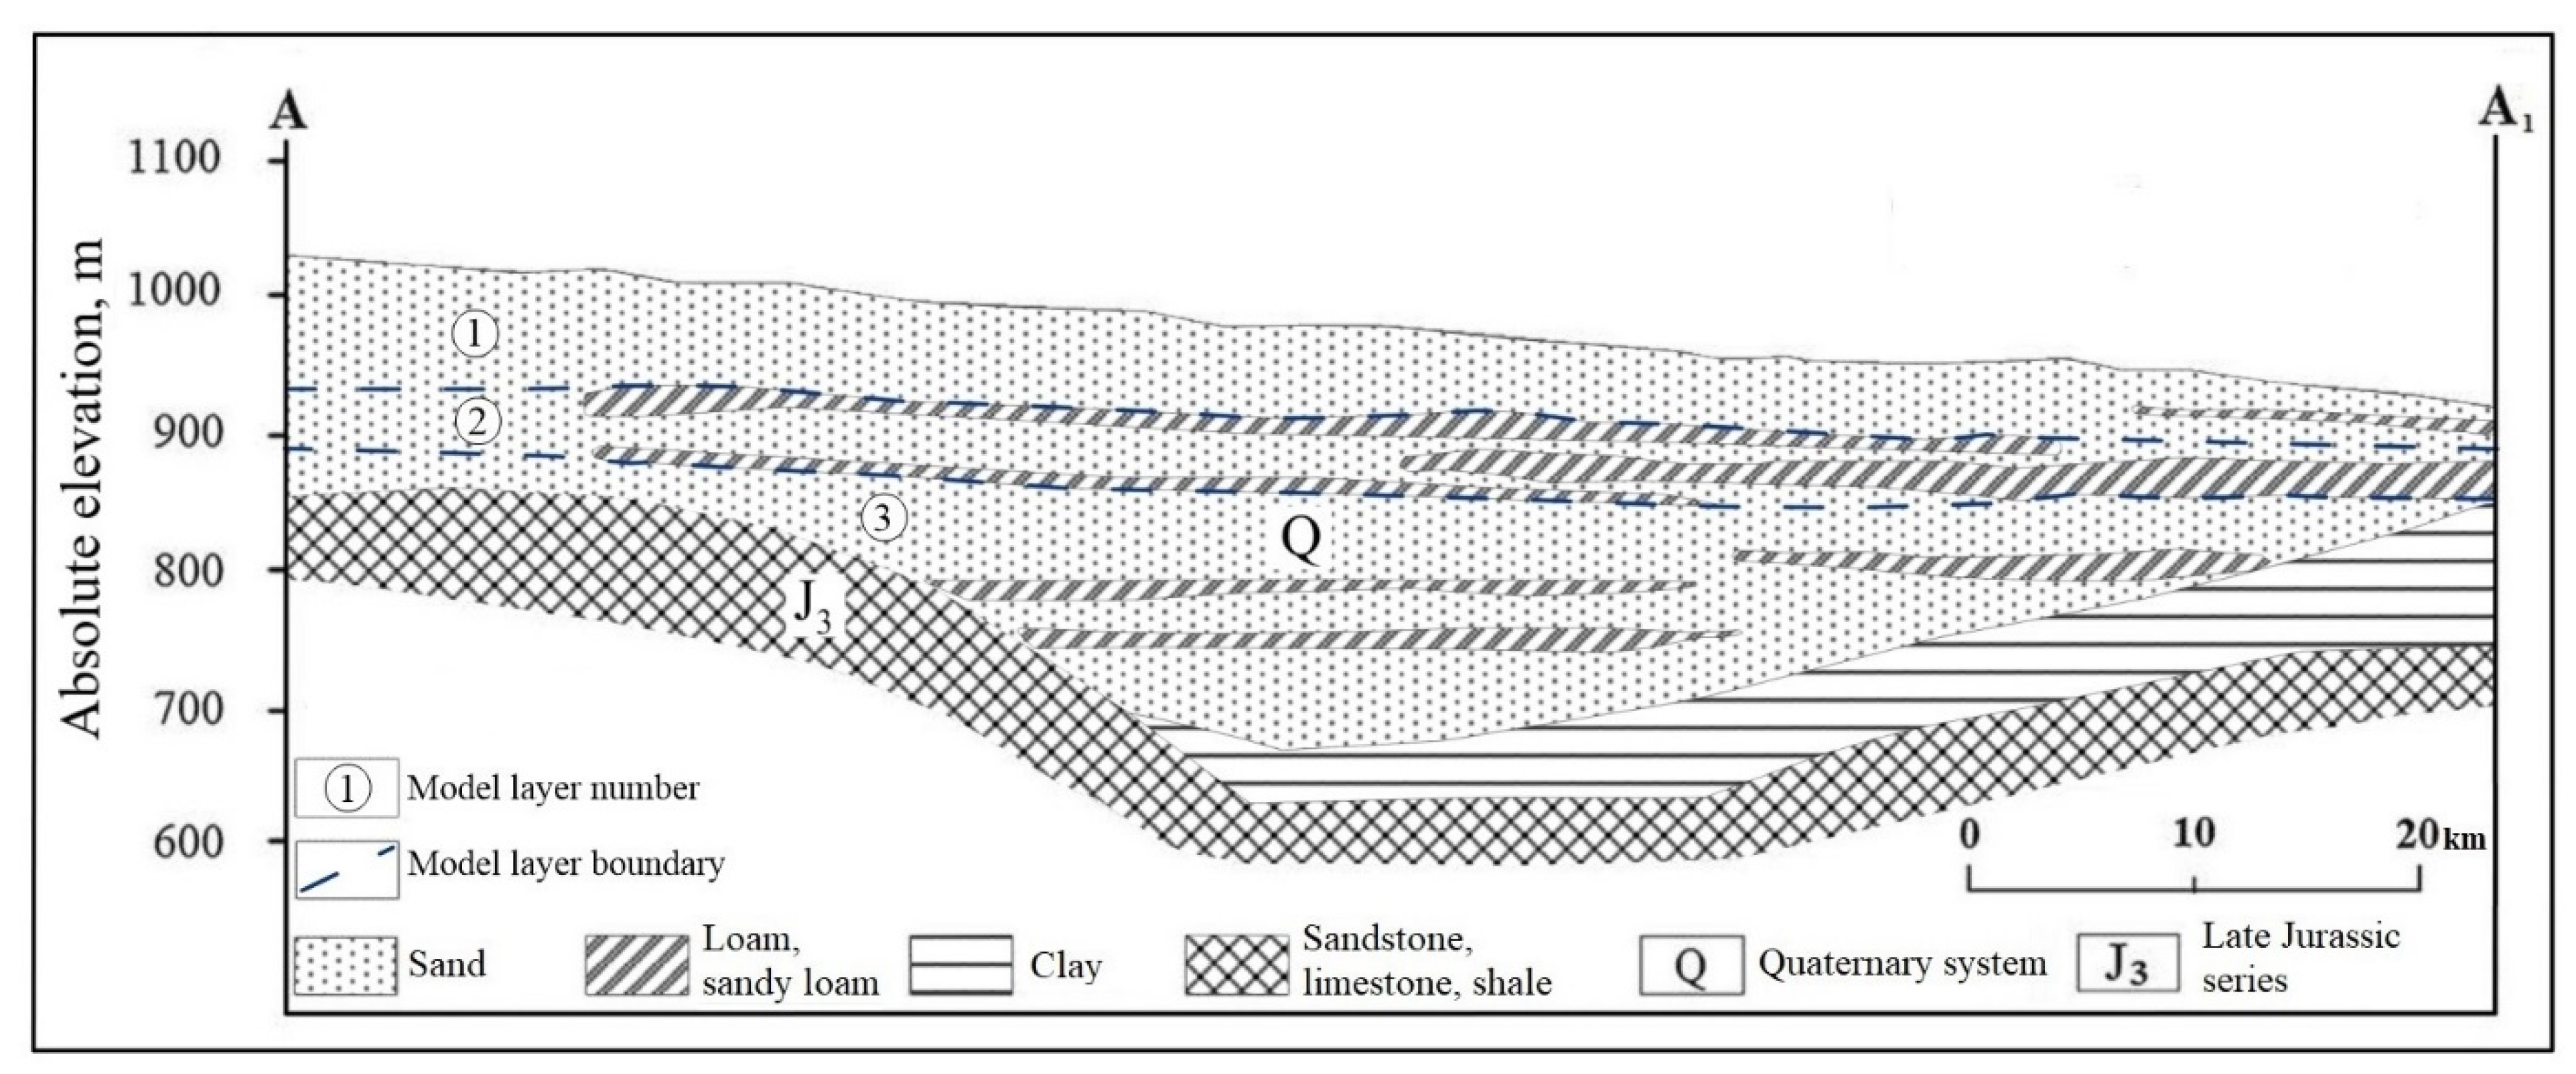
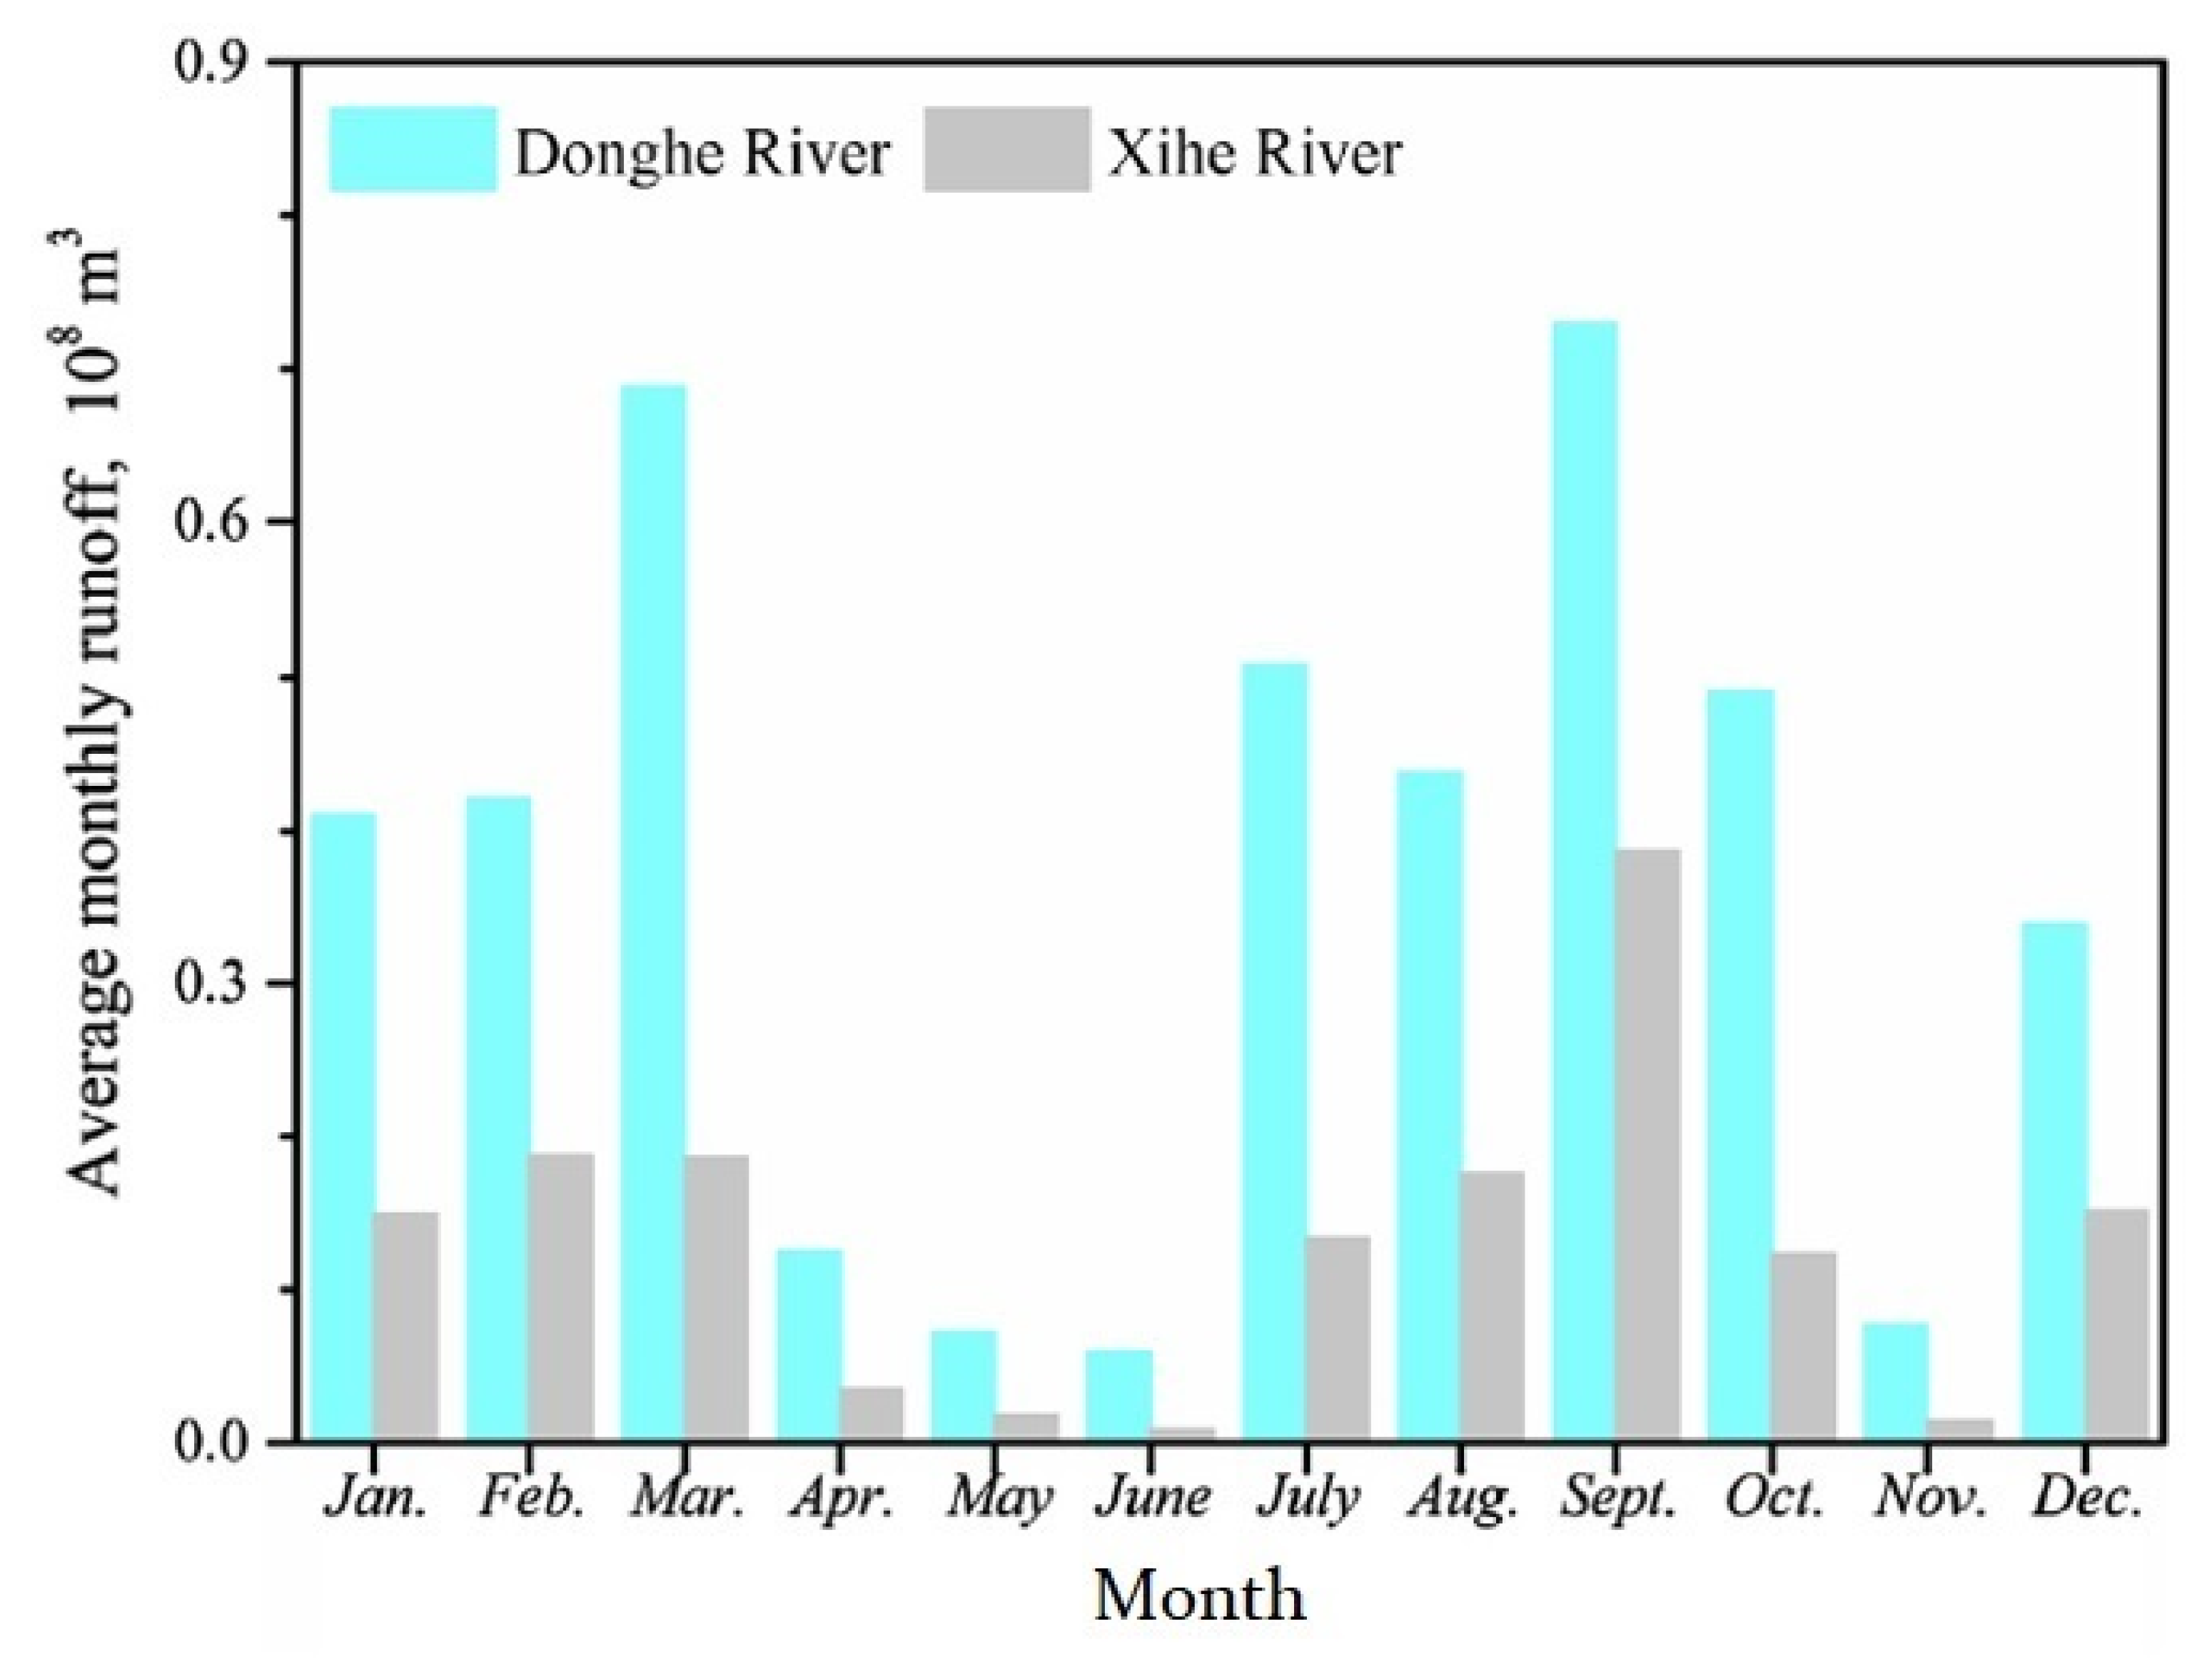
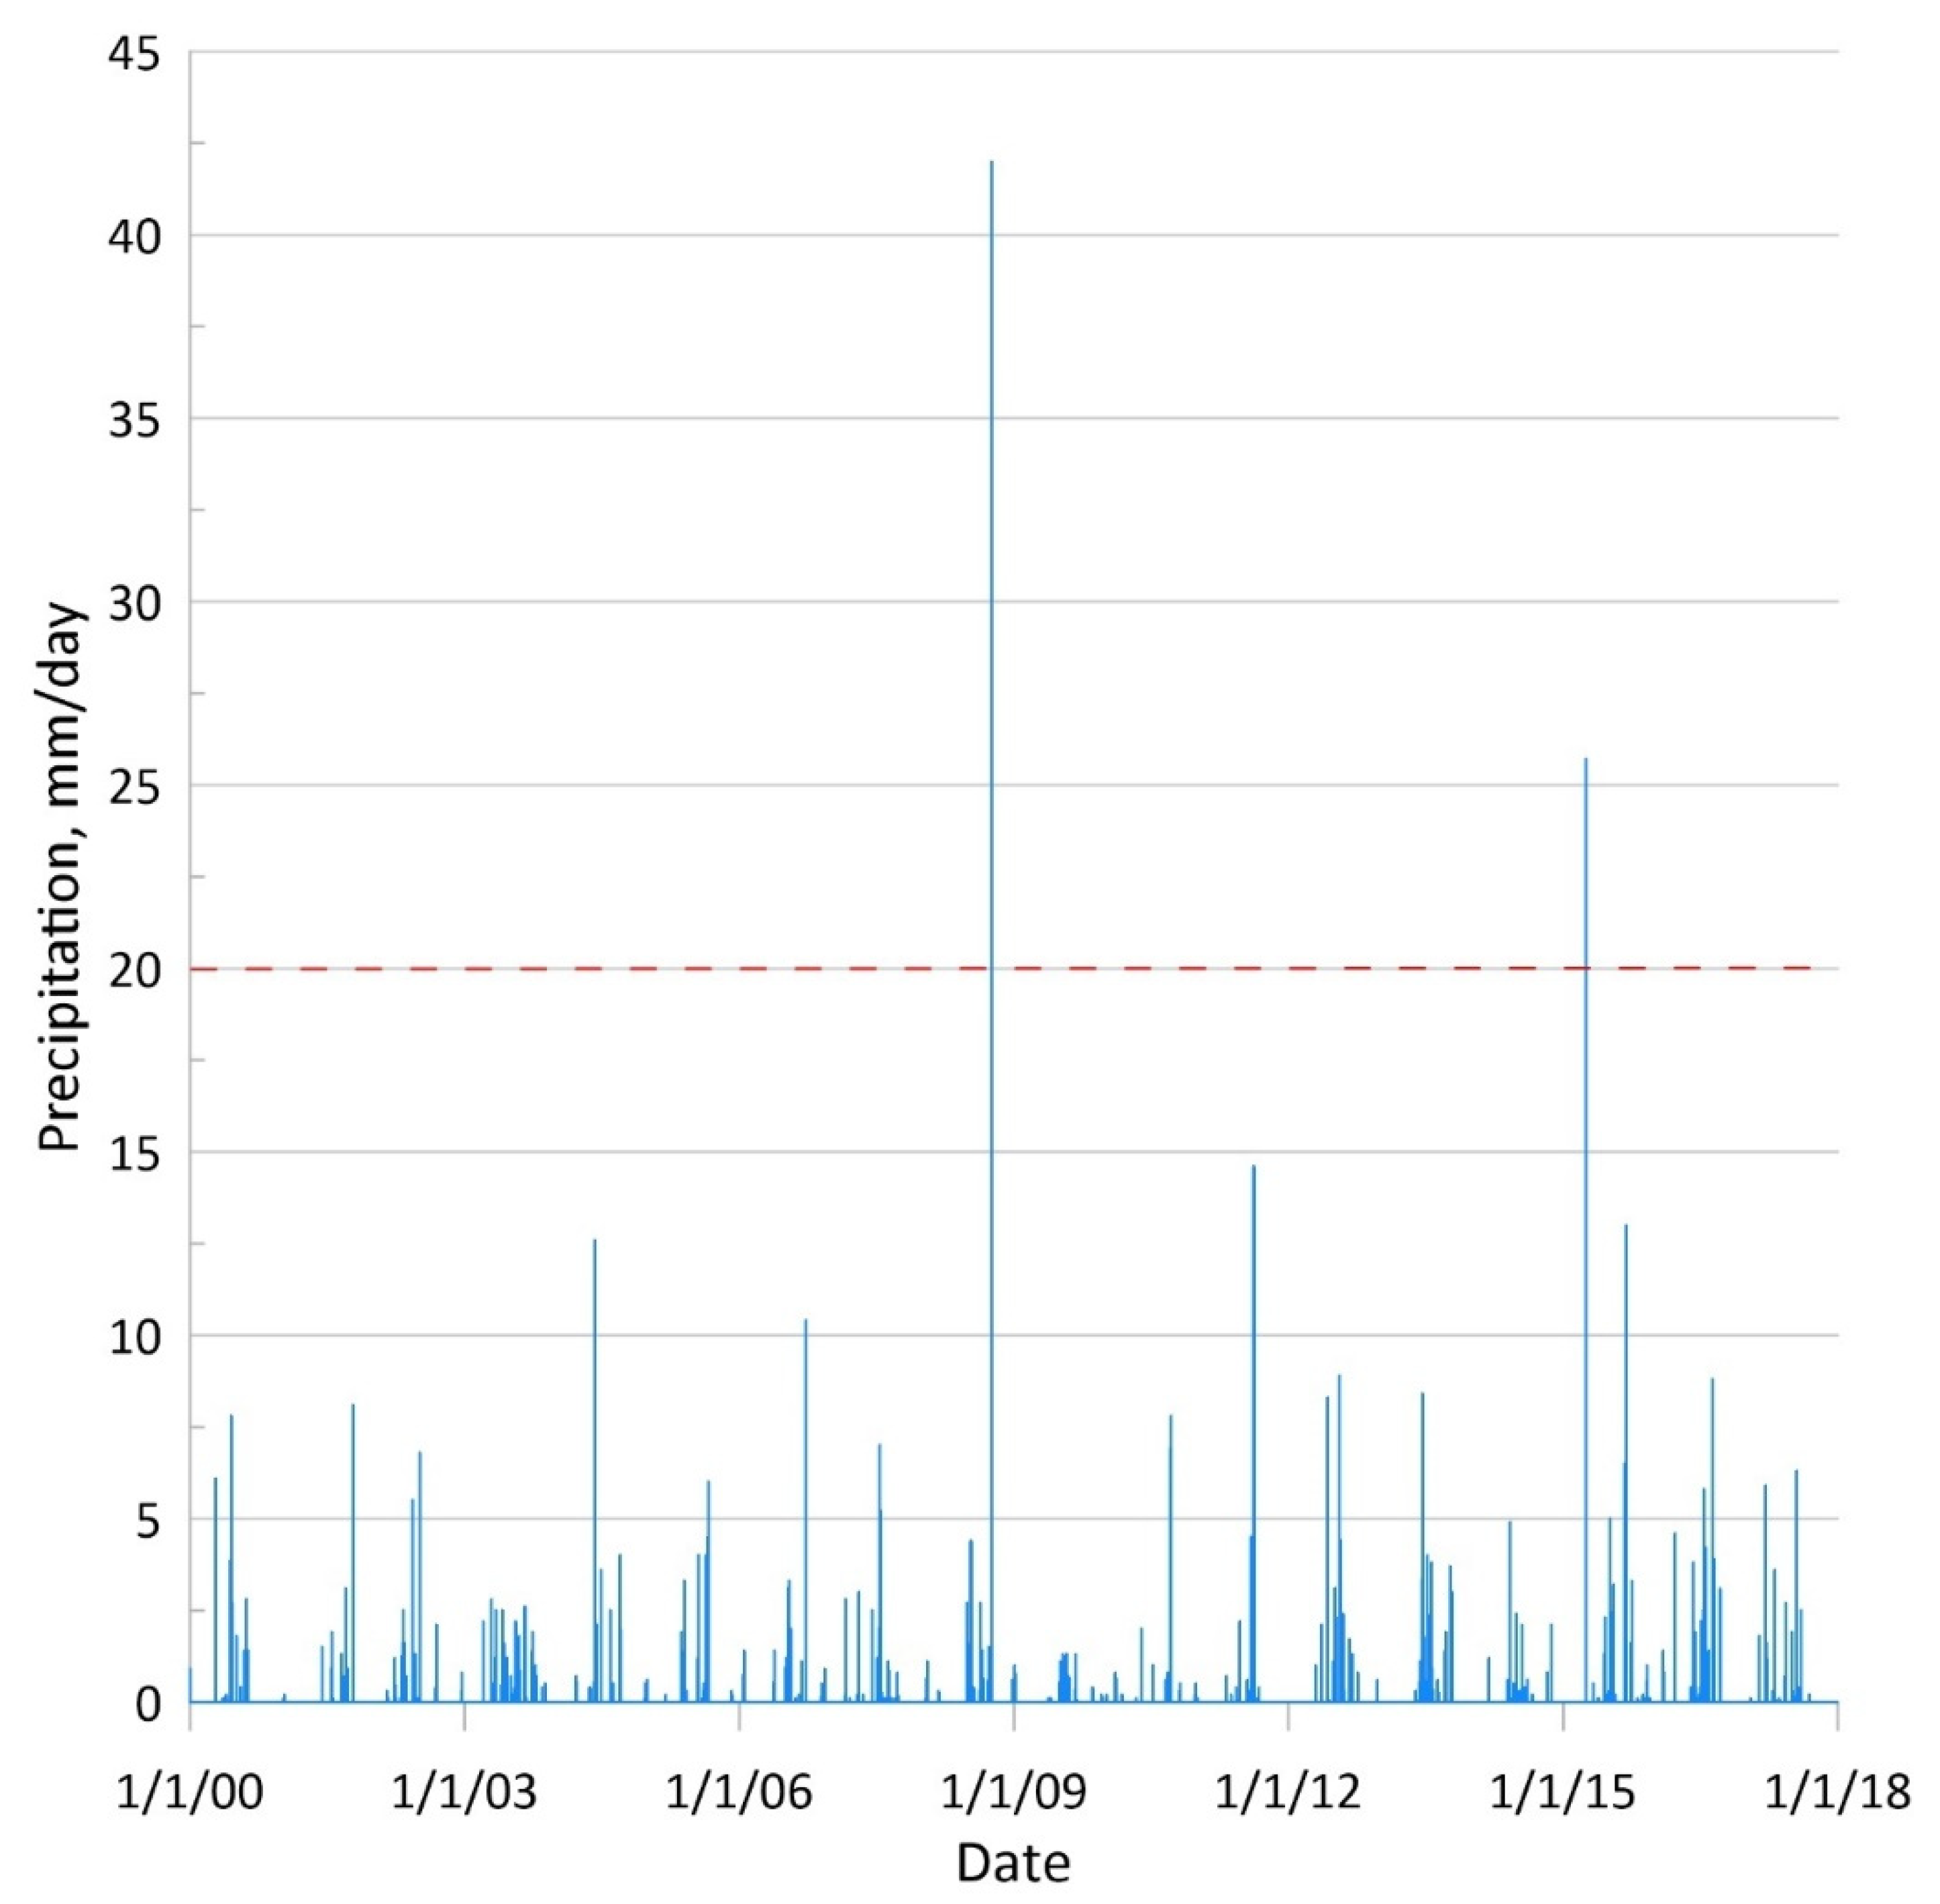
2.1. Study Area

The study area, namely, the Ejina Basin, is located in the lower reaches of the Heihe River (99°30′–102°00′E, 40°00′–42°30′N), is the second largest inland river in northwest China (Figure 1), and is characterized by hyperarid climate conditions. According to the Ejina weather station (Figure 1), the mean annual air temperature for the period from 1961 to 2015 was 9 °C, with maximum and minimum monthly mean air temperatures of 27 °C in July and −11 °C in January, respectively [20]. The average annual precipitation for the abovementioned period was only 35 mm, while the average annual estimated potential evaporation over 2002–2015 was 1471 mm [21]. The average annual wind speed was 3.3 m/s. The vegetation growth period lasts from April to September [21].
The dominant landform in the basin is represented by the Gobi Desert, which is composed of wind-eroded hilly land [22]. Oases constitute less widespread landforms that form narrow strips of riparian vegetation along rivers; specifically, the extensive Ejina Oasis is situated along the lower Donghe River (Figure 1). The main vegetation species are Populus euphratica, Tamarix ramosissima, and Sophora alopecuroides [10].
The study area is located in a basin filled with Quaternary (Q) sediments to a depth of several hundred meters (Figure 2). Genetically, the sediments are of proluvial, alluvial, lacustrine, deluvial, and aeolian types. The basin bedrock is composed of Sinian (Z) and Late Jurassic (J3) formations. From the southwest to the northeast in the study area, the sediments gradually change from coarse sand and gravel–pebble deposits to medium and fine sands [23]. In the northern part of the basin, the sediments are composed of interbedded sands and clays. A complex of hydraulically connected aquifers and local aquicludes is tied to these sediments, forming a single Quaternary aquifer system.
The Heihe River originates from glaciers, snow melt, and abundant rainfall in the Qilian Mountains. At the Langxinshan hydrological station, the Heihe River divides into two losing streams (Donghe and Xihe), which flow through the Gobi Desert before entering the system of terminal lakes (Figure 1). The three largest terminal lakes are East and West Juyan Lakes and Swan Lake. At the Langxinshan hydrological station, the runoff of the Heihe River is distributed to the Donghe and Xihe Rivers by a system of sluices.
According to observations from the Langxinshan hydrological station (Figure 1), the average annual runoff volume from 1988 to 2017 was 5.8 × 10⁸ m3. Approximately 63% of the total runoff was distributed to the Donghe River; the average Donghe runoff was 4.2 × 10⁸ m3/year, and the Xihe runoff was 1.6 × 10⁸ m3/year. The Donghe and Xihe Rivers exhibit intermittent flow, and their runoff is usually released to the lower reaches of the Heihe River during the periods from July to October and December to March (Figure 3).
The streambed of the Heihe River is wide and shallow and composed of fine to coarse sand. A clogging layer is present in the upper part of the bottom sediments in the Donghe River delta. Due to the relatively high vertical hydraulic conductivity of riverbed sediments [6], streambed leakage is the primary source of shallow aquifer recharge [20,22,24]. More detailed descriptions of the study area are presented in the literature [3,22,25].
Increased water withdrawal from the Heihe River for irrigation purposes in the middle reaches of the river since the middle of the twentieth century has caused a number of ecological problems, such as a sharp decline in the groundwater level in the lower reaches of the Heihe River and the resulting degradation of vegetation in the Ejina Oasis [10]. Furthermore, both channels of the lower reaches of the Heihe River have been intermittent streams since the 1960s, and the terminal lakes had completely dried by 1992.
To restore these lakes and the vegetation in the oasis, the Ecological Water Diversion Project was implemented in 2000 to guarantee the delivery of a certain volume of water to the lower reaches of the Heihe River from the middle reaches; an important target of the project was the Donghe River and its corresponding terminal lake, East Juyan Lake [26]. As a result of this project, the groundwater level in the Heihe River delta was locally raised, and the vegetation in the oasis was restored to some extent [10,27].
Nevertheless, any further stable socioeconomic development of the study area directly depends on solving the problems associated with sustainable water use, among which the most important is the exchange of water within a complex system consisting of intermittent streams/terminal lakes, the shallow aquifer system, riparian zone evapotranspiration, and groundwater withdrawal (Figure 4).

2.2. Model Setup and Calibration

The developed model simulates the water exchange processes in a complex intermittent stream/terminal lake–aquifer–riparian zone evapotranspiration–groundwater withdrawal system and includes a series of terminal lakes that receive water from both intermittent streams and groundwater; this water then evaporates. With a priori knowledge of the runoff of the Heihe River at the Langxinshan hydrological station inlet site, this modelling approach makes it possible to fully capture the entire water cycle of the considered basin (Figure 1). In this system, the groundwater balance involves mainly river leakage, which is consumed for evapotranspiration in the riparian zone. Additionally, the shallow aquifer system acts as a buffer reservoir that can accumulate and return water to rivers during dry periods.

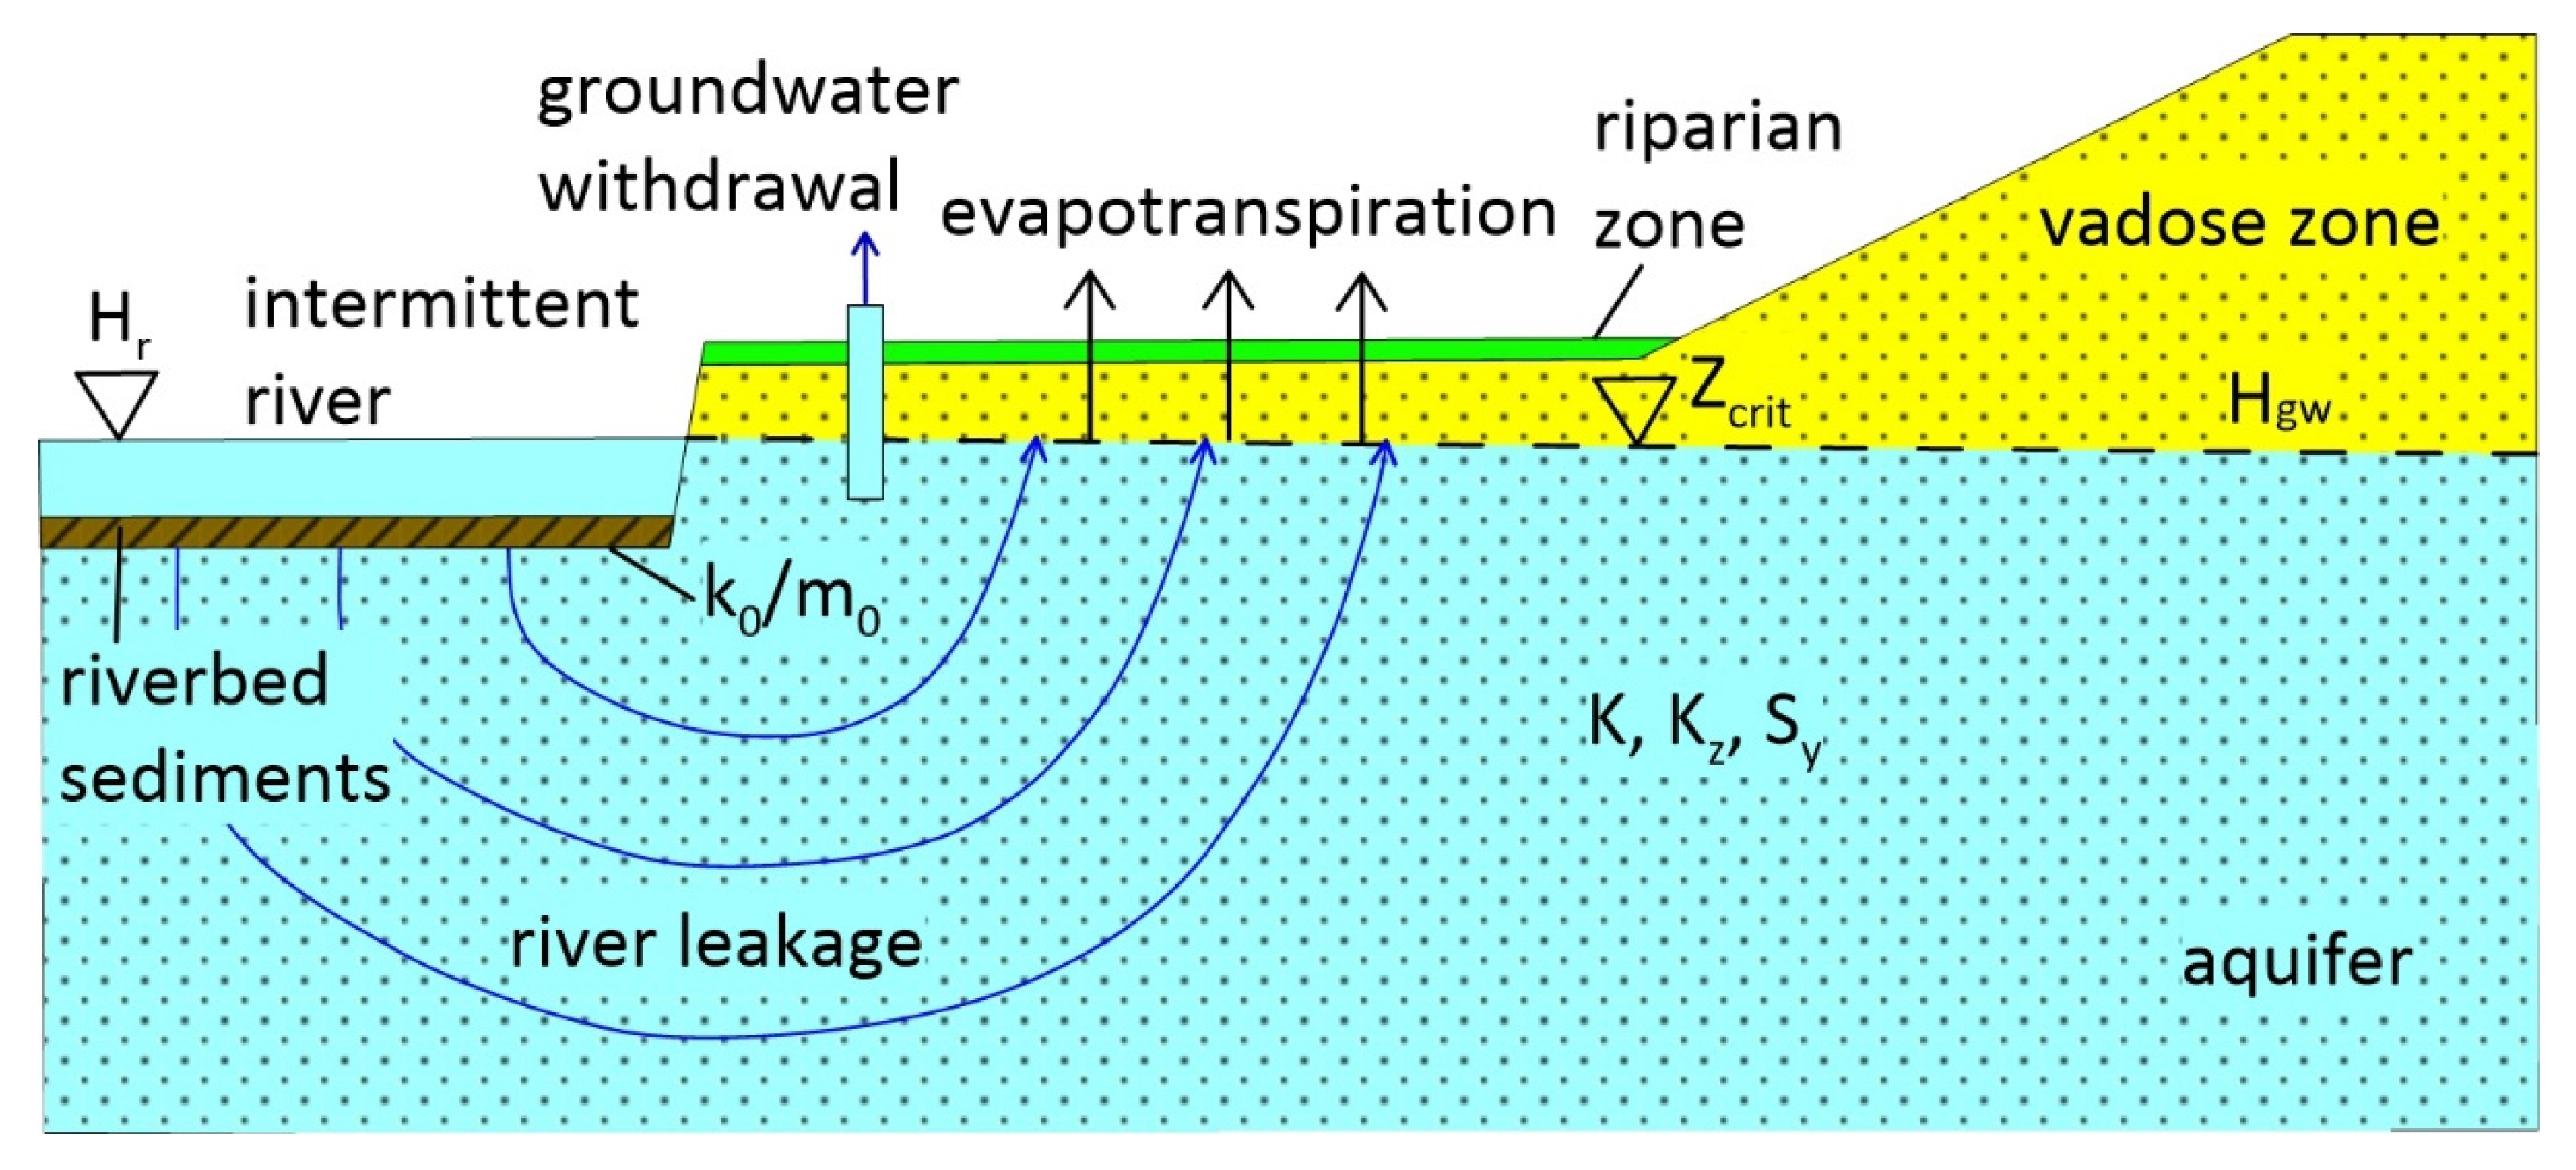
2.2.1. Simulation Domain and Boundary Conditions

The external boundaries of the model match the contours of the basin boundaries (Figure 1). The regional groundwater flow is directed from southwest to northeast towards the discharge area: the Ejina Oasis and the terminal lake system. The model includes both branches of the Heihe River, i.e., the Donghe and Xihe Rivers downstream from the Langxinshan hydrological station and the system of six terminal lakes. At Langxinshan, where the sluice system is located, the runoff of both river branches during 2000–2017 is known with a monthly resolution.
The Quaternary aquifer system considered in the model is divided into three layers with different hydraulic parameters. In particular, the second model layer consists of Quaternary sediments in the northern part of the basin and is characterized by relatively low hydraulic properties (Figure 2). The surfaces of the land and model layers were digitized from a 1:50,000-scale topographic map and drilling data [28].
The lower boundary of the model, which corresponds to the bedrock of the basin, is assumed to be impermeable. The upper boundary corresponds to the land surface, where the evapotranspiration discharge rate is specified. To realize the interactions between adjacent basins, a head-dependent flux boundary is set along the external boundaries of the model using the General Head Boundary (GHB) package [15].
Gates et al. [29] used the chloride mass balance method to demonstrate that recharge in the Badain Jaran Desert area does not exceed 2% of the precipitation therein (recharge is only 1.4 mm/year). Sun et al. [30] obtained similar results from lysimeter experiments in the Dunhuang Desert area in western Hexi (Qilian foothills), where recharge was 1.7% of precipitation. The key factor preventing the infiltration of precipitation into the groundwater was the presence of dry sand layers near the surface with extremely low water contents that acted as a capillary barrier. Thus, precipitation with an intensity of less than 20 mm per day failed to produce groundwater recharge. According to data from the Ejina weather station, only two events produced precipitation of more than 20 mm per day during 2000–2017 (Figure 5), which essentially implies the absence of precipitation-induced groundwater recharge at the study site.

2.2.2. Numerical Simulations

The simulation was performed using the MODFLOW-2005 code [15] with the pre- and postprocessing MODFLOW 10 interface [31]. MODFLOW-2005 is a robust code that has been verified many times and provides a valuable opportunity to simulate the main water exchange processes of the considered system: the intermittent streams and terminal lakes and their water exchanges with the shallow aquifer system are simulated by the modified Streamflow-Routing (SFR2) [32] and Lake (LAK3) [33] packages, respectively; evapotranspiration from the riparian zone is simulated using the Evapotranspiration Segments (ETS1) [34] package; and groundwater withdrawal is simulated by the Well (WEL) package [15]. Moreover, as mentioned in the Introduction, previous simulations of the considered basin were also performed using the MODFLOW-2005 code, which facilitates the convenient comparison and benchmarking of the simulation results. The present model does not consider the unsaturated moisture flux because previous studies have demonstrated that unsaturated moisture flow has a negligible effect on the exchanges between groundwater and surface water in the Gobi Desert [35,36]. Moreover, the main representatives of vegetation in the riparian zone, namely, P. euphratica and T. ramosissima, use mostly groundwater for transpiration [37].
The dimensions of the model were 140 km × 180 km, and the total simulated area was 25,200 km2. The simulated space was meshed with a regular orthogonal grid with a block size of 500 m × 500 m and consisted of 360 rows and 280 columns; the area of active cells was 14,100 km2. The simulation period ranged from 1 January 2000 to 31 December 2017 with a temporal resolution of 1 month, and the model was divided into 216 stress periods at monthly scales (28–31 calendar days).
The SFR2 package [32] was used to simulate surface water–groundwater interactions, which allowed the interactions between lakes and rivers to be modelled. The river channel was set as rectangular, and the river width, which was specified for each stress period as an empirical linear function of the incoming runoff, was selected from remote observations of the river width and known river runoff values. Figure 6 illustrates that from 2000 to 2017, the runoff of the Heihe River at the Langxinshan hydrological station ranged considerably from 0 to 9.4 × 10⁶ m3/day, while the river width also varied widely from almost 0 to 200 m (Table 1).
The terminal lakes were simulated using the LAK3 package [33], which can simulate the water exchanges between lakes, groundwater, and rivers. The lake water level was calculated for each time step using the relationship between lake area and lake water volume, and the latter was calculated based on the water balance equation. Evaporation from lakes and rivers and precipitation on the surface of water bodies were specified directly using the LAK3 and SFR2 packages. Precipitation was specified according to data from the Ejina weather station (Figure 5). The initial water levels in the lakes were set equal to the adjacent land surface elevations (there was no water in the lakes in 2000).
Evapotranspiration was simulated using the ETS1 package [34], which considers the nonlinear dependence of the evaporation rate on the depth of the groundwater table. Groundwater withdrawal by pumping wells was specified using the WEL package [15]. The locations of pumping wells within the simulated area are presented in Figure 1. The total number of model cells with wells was 309. The pumping rate of a single well varied from 182 to 1380 m3/day depending on the irrigation period (May–August), with an average rate of 846 m3/day.
The initial conditions for the simulation were specified by performing a primary run of the model until a steady state was reached where the initial groundwater level was equal to the land surface elevation. Then, the groundwater level obtained at the end of the simulation was set as the initial condition for subsequent calculations.

2.2.3. Model Parameterization

The key parameters of the considered system are evapotranspiration parameters, hydraulic parameters of the aquifer system, and riverbed hydraulic parameters, which primarily determine the surface water–groundwater interactions.
The distribution of hydraulic parameter zones (Figure 7) was set according to hydrogeological research [28] and existing models [12,14]. The initial horizontal hydraulic conductivity (K) varied from 4 to 44 m/day. The anisotropy of the hydraulic conductivity in the vertical direction was considered, and the vertical hydraulic conductivity (Kz) varied from 0.1 to 14 m/day. The initial value of the specific yield was set equal to 0.15 for all parameter zones (Table 2).
Based on previous studies of the hydraulic properties of riverbed sediments [6,7,9], the channels of the Donghe and Xihe Rivers were divided into segments with different k0/m0 ratios, where k0 represents the hydraulic conductivity of the riverbed sediment and m0 represents the riverbed sediment thickness. The division of the river channels into segments is presented in Figure 7. The parameters of each segment, including the width and length of the segment and its k0/m0, are listed in Table 1.
The model considered six terminal lakes (West Juyan, East Juyan, Swan, Monong, Xiala, and Bage). The initial water levels in the lakes were set equal to the land surface (on 1 January 2000, there was no water in the terminal lakes). The initial value of k0/m0 of the lake bottom sediments was set equal to the riverbed sediment k0/m0 of the № 9 segment (Table 1, 0.002 day−1), and k0/m0 was subsequently modified during model calibration.
The simulation domain included two zones with different evapotranspiration parameters, namely, the desert and oasis areas (Figure 1), whose extinction depths of evapotranspiration were assumed to be 4 m [38] and 5 m [25], respectively. Potential evaporation was calculated using the Penman–Monteith method [39] and observations with a monthly resolution from the Ejina weather station for 2000–2017 (Figure 8). The dependence of relative evapotranspiration (ratio of actual evapotranspiration to potential evaporation) on the depth of the groundwater table was assumed according to Wang et al. [25] for the oasis area and Liu [38] for the desert area (Figure 9).

2.2.4. Model Calibration

The model parameters were calibrated using a set of groundwater level observations, river runoff observed at the Dongjuyanhai gauging station, and the dynamic changes in the areas of the terminal lakes. The calibrated parameters were the hydraulic conductivities and specific yields of the aquifer system, k0/m0 values of riverbed and lakebed sediments, conductance of GHB boundaries, and runoff proportions at the river segment boundaries.
The model parameters were calibrated both automatically (using the Parameter Estimation (PEST) program, Chiang et al. [31]) and manually. The hydraulic conductivities and specific yields of the aquifer system were calibrated in two steps: first in automatic mode and then in manual mode. All other parameters were calibrated manually.
A set of groundwater level observations was used to calibrate the hydraulic parameters of the aquifer and the parameters of the GHB package. Values of 1250–2500 m2/d were selected for the remote boundary conductance depending on the model boundary. The calibrated values of the hydraulic parameters for the aquifer system and riverbed are listed in Table 1 and Table 2.
Criteria such as the root mean square error (RMSE), Nash–Sutcliffe efficiency coefficient (NSE) and correlation coefficient [40] were utilized to assess the calibration with respect to the observed groundwater levels. The correlation between the simulated and observed groundwater levels for all monitoring wells during the entire simulation period is presented in Figure 10. The correlation coefficient for all monitoring wells is 0.998, and the RMSE = 2.5 m. In addition, the time series of the observed and simulated groundwater levels are presented in Figure 11. The locations of the observation wells are plotted in Figure 7. The correlation coefficient for a single well varies from 0.61 to 0.94, the RMSE varies from 0.21 to 0.63 m, and the NSE varies from 0.38 to 0.63.
The main criteria for calibrating the k0/m0 values of riverbed and lakebed sediments and the runoff proportions at the river segment boundaries were the observed river runoff from 2000 to 2017 at the Dongjuyanhai gauging station in the downstream reach of the Donghe channel (Figure 1) and the remotely observed dynamic changes in the areas of West Juyan Lake, East Juyan Lake, and Swan Lake [26]. A k0/m0 value of 0.01 day−1 was selected for the lakebed sediments of East Juyan, Swan, Monong, Xiala, and Bage Lakes, while 1 day−1 was chosen for those of West Juyan Lake. The runoff proportions at the river segment boundaries varied from 0.1 to 0.9 depending on the segment and the simulation period. Figure 12 shows a comparison between the simulated and observed dynamics of the cumulative runoff volume at the Dongjuyanhai gauging station. In general, the observed and modelled cumulative runoff volumes coincide with a relative error of less than 20% (except for the first two years of the simulation when, according to observations, river water even did not reach the Dongjuyanhai gauging station). On 31 December 2017, the observed cumulative runoff volume for the 18-year time period at the Dongjuyanhai gauging station was 8.27 × 10⁸ m3, and the simulated volume was 8.35 × 10⁸ m3, yielding a relative error of approximately 1%.
Figure 13 shows the simulated and observed area dynamics of East Juyan, West Juyan, and Swan Lakes. The area dynamics of Xiala, Bage, and Monong Lakes were not considered because their areas did not exceed 5 km2 during 2000–2017 according to observations [26]. In general, the simulated area dynamics of the former three terminal lakes were in agreement with the observed dynamics.

2.2.5. Model Validation with Indirect Data

Remote sensing is broadly recognized as an effective tool for quantifying spatially distributed regional evapotranspiration from the land surface [41]. Indeed, remote sensing-based evapotranspiration data have been successfully used to analyze the effects of the Ecological Water Diversion Project in the Ejina Oasis located in the downstream reaches of the Heihe River [42]. Under hyperarid climate conditions, the evapotranspiration values calculated from the remote sensing data of vegetated areas can be considered a reference for groundwater evapotranspiration discharge.
In the present work, the MODIS Global Evapotranspiration Project (MOD16, [43]) model was utilized to calculate evapotranspiration from the land surface. The evapotranspiration data in the MOD16 database are calculated using the Penman–Monteith method. In addition, daily meteorological data and MODIS-observed eight-day vegetation dynamics data [43] were used as input parameters. MOD16 is a 0.5 km resolution land surface evapotranspiration database for a total area of 109 million km2 with 8-day, monthly, and annual time steps. The data for 2000–2017 are freely available on the internet [44].
Since MOD16 and similar algorithms allow the evapotranspiration from the land surface occupied by vegetation to be estimated, two entirely vegetated sites were selected within the Ejina Oasis to compare the simulated evapotranspiration values with those calculated based on observational data (Figure 14b). The first site covering an area of 18.9 km2 is located along the Xihe River near the Langxinshan hydrological station. The second site, spanning an area of 60.5 km2, is located in the lower reaches of the Donghe River. Moreover, the long-term period (2001–2017), the entire year of 2017 (365 days) and July 2017 (31 days) were selected to compare the simulated evapotranspiration rates plus precipitation with the calculated evapotranspiration rates using observational data (Table 3). According to our algorithm, to compare the evapotranspiration results, we correlated the rates of evapotranspiration provided in the MOD16 database [44] with the rates of evapotranspiration calculated by MODFLOW-2005 from the selected zones plus precipitation using the volume function in Surfer Golden Software, LLC.
Table 3 shows that the MOD16 algorithm-calculated evapotranspiration at the two selected oasis sites was 145 mm/year during 2001–2017; this value falls within the range of estimates from the modified surface energy balance algorithm for land (M-SEBAL) reported by Zhou et al. [42], who obtained an average evapotranspiration of 143–217 mm for the growing season during 2000–2014 in the Ejina Oasis. At the same time, the simulated evapotranspiration (ET plus precipitation and those calculated using observations differed by only 31% for July 2017, 2% for 2017, and 25% for 2001–2017. Note that for the period of 2001–2017, the simulated groundwater ET plus precipitation is still 25% lower than the MOD16 algorithm-calculated ET. This means that ET simulated using groundwater modelling requires further improvement by focusing on the spatial variations between different landscapes, such as the Gobi Desert and the oasis.

3. Results

The simulated groundwater levels of the shallow aquifer system and evapotranspiration discharge for July 2017 are shown in Figure 14a. The simulation indicates that groundwater flows mainly towards the north and northeast, i.e., to the oasis area and the terminal lakes. Likewise, the spatial distribution of the evapotranspiration discharge shows that greater evapotranspiration is focused mainly along the Heihe River channels and in the oasis in the delta of the eastern channel. The evapotranspiration rates in these areas are several times higher than those in the predominant Gobi Desert area.

3.1. Surface Water and Groundwater Balance

The groundwater balance components based on the simulation results are presented in Table 4. From 1 January 2000 to 31 December 2017, the total groundwater recharge was 8.68 × 10⁹ m3; river leakage accounted for 75% of the total recharge, and inflow from the outer boundaries supplied 22%, whereas leakage from lakes accounted for the remaining 3%. The total groundwater discharge was 1.28 × 10¹⁰ m3, 62% of which was groundwater evapotranspiration. In addition, groundwater discharge was slightly distributed into river channels (1%) and terminal lakes (1%), while groundwater exploitation accounted for 5%, and the outflow to external boundaries accounted for the remaining 31% of the total discharge.
Thus, this analysis of groundwater balance components demonstrates that the main source of shallow aquifer system recharge is leakage from river channels and that the main component of discharge is groundwater evapotranspiration, which is consistent with published data [13,14]. The difference between the total groundwater discharge and recharge is 4.08 × 10⁹ m3. This signifies that the overall groundwater level in the Ejina Basin declined; although, the level has increased at a rate of several centimeters per year in the riparian zones and oases. Similar findings have been reported in the literature [13].
Likewise, the components of the surface water balance among West Juyan, East Juyan, and Swan Lakes are presented in Table 5. The main source of terminal lake recharge is surface runoff (91–96% of the total recharge), and the main component of discharge is evaporation (87–94% of the total discharge).

3.2. Surface Water–Groundwater Interactions

According to the simulation results, river leakage was largely dependent on the incoming river runoff (Figure 6). For the whole simulation period, the total cumulative runoff of the Donghe and Xihe Rivers was 1.04 × 10¹⁰ m3, and the river leakage was 6.32 × 10⁹ m3 (61% of the total runoff).
Figure 6 shows that groundwater was discharged into the river channel after the river runoff was reduced to 0 m3/day in May–August, but the discharge rate was approximately one order of magnitude lower than that in the preceding period of river runoff, when leakage from the river recharged the shallow aquifer. This result can be explained by the fact that the riverbank stores water during the high river stage, and when the river runoff shrinks to zero, the water stored in the riverbank is released into the river channel.
The maximum model sensitivity is observed with respect to the riverbed hydraulic parameters, which control the interaction between surface water and groundwater in the SFR2 package [32]. Figure 15 reveals the significant sensitivity of the simulated cumulative runoff volume at the Dongjuyanhai gauging station to the k0/m0 of riverbed sediments. Thus, when the k0/m0 of riverbed sediments is halved, the cumulative volume of river runoff increases by a factor of 1.76.

3.3. Results of the Predictive Simulation

Next, the calibrated model was used to solve the problem of predicting the yearly runoff that needs to be passed into the lower reaches of the Heihe River to stabilize the areas of the three main terminal lakes: East Juyan, West Juyan, and Swan. When river runoff decreases, the surface areas of the terminal lakes correspondingly decrease, and eventually, the lakes completely disappear; in contrast, as river runoff increases, the areas of the terminal lakes increase, and evaporation from their surfaces also increases. Accordingly, for each lake, there is a minimum incoming runoff at which the level (area) of the lake experiences only annual fluctuations, remaining in a stationary mean annual regime (Figure 16).
A predictive simulation was performed for a 5-year period (2018–2022). The potential evaporation and precipitation were assumed for each stress period (month) as their averages over the previous 18 years of simulation. River runoff was specified as the average over the previous 18 years and was varied both upwards and downwards with a 10% step from the average value.
The predictive simulation demonstrated that a volume of 7.7 × 10⁸ m3/year needs to be passed to the downstream reaches of the Heihe River to stabilize the areas of East Juyan, West Juyan, and Swan Lakes. Of the above river runoff volume, approximately 41% reaches the terminal lakes, while the other 59% constitutes leakage that is consumed mainly by riparian evapotranspiration. At the same time, approximately 27% and 73% of runoff need to be distributed to the Xihe channel and the Donghe channel, respectively. Of the runoff entering the Donghe channel, 60% flows into East Juyan Lake, while the remaining 40% flows into Swan Lake. The long-term average stable areas are 6.7 × 10⁷ m2 for West Juyan Lake (the lake was dry in 2021), 7.3 × 10⁷ m2 for East Juyan Lake (30% more than the lake area in 2021), and 6.4 × 10⁷ m2 for Swan Lake (50% more than the lake area in 2021).

4. Discussion

This study sought to modify several modelling techniques that have been used in previous hydrogeological simulations of the lower reaches of the Heihe River. For instance, physically reasonable models of evapotranspiration and groundwater–surface water interactions were used (the ETS1 package [34] and SFR2 package [32], respectively), anthropogenic stress on groundwater was considered (groundwater withdrawal was simulated using the WEL package [15]), groundwater discharge via evapotranspiration was independently assessed using remote sensing observations (which was used to validate the model), and terminal lakes were simulated using the LAK3 package [33]; the dynamics of the lakes were also considered to calibrate the model. Additionally, a finer calculation grid was used (500 m × 500 m), and the simulation period was extended to 18 years (2000–2017), allowing the response of the groundwater level to a rise in incoming river runoff to be observed.
Note that evapotranspiration is a significant component of the water cycle that cannot be observed directly at a large scale. For riparian corridors in arid and semiarid regions, the difficulty in estimating evapotranspiration is strongly associated with the spatial heterogeneity of vegetation and the impacts of anthropogenic activities such as irrigation-induced water depth changes [45]. To reduce the uncertainties in the evapotranspiration simulated with groundwater models, remote sensing data (including evapotranspiration derived from various sensors) have been used to generate input data and calibrate the models [18,46,47,48]. This approach has also been widely applied to improve the modelling of groundwater levels [49,50].
Additionally, as shown in Table 4, lateral groundwater outflow accounts for 30% of the total discharge and thus represents an important component of discharge. However, the parameters implemented in the GHB package, which was set along the external boundaries of the model domain, cannot be determined either directly or indirectly using remote sensing data. The external heads of the GHB were assumed from regional groundwater maps, while the conductance between the boundary of the model and the external boundaries was estimated using the average hydraulic conductivity, saturated thickness of the aquifer, and the distance between the boundaries. Note that when the GHB conductance value is halved, the lateral outflow is divided by a factor of 1.4 (Figure 17). This means that the modelled lateral outflow is considerably sensitive to the GHB conductance; this sensitivity to conductance may be weaker than, for example, the sensitivity of the volume of river leakage to the k0/m0 of riverbed sediments, but uncertainties in the GHB parameters can still cause remarkable uncertainties in the total model water budget.
Therefore, the boundary conditions in the Ejina Basin remain unclear, and the uncertainties associated with the parameters of the external boundaries continue to represent serious challenges in simulating groundwater flow, as mentioned in a previous study [14]. The uncertainty in model boundary conditions, which is sometimes referred to as scenario uncertainty [51,52], is as important as the uncertainties in the model conceptualization, model parameters, and observational data [53]. To reduce these uncertainties in groundwater numerical simulation, field investigations must be conducted to observe the hydrogeological conditions and groundwater level along the model boundary.
The results of the predictive simulation show that 7.7 × 10⁸ m3 of water should be passed every year to the downstream reaches of the Heihe River. This volume is 34% more than the average downstream river runoff measured over the previous 18 years (2000–2017). Nevertheless, the annual runoff of the Heihe River formed in the Qilian Mountains is approximately 3.75 × 10⁹ m3 [54]. Referring to the Heihe River runoff data from the Langxinshan hydrological station, runoff has increased from 2.5 × 10⁸ m3 in 2000 to 6.4 × 10⁸ m3 in 2016 and 9.9 × 10⁸ m3 in 2017 as a result of the Ecological Water Diversion Project implemented in 2000. We are also aware that the increase in river water inflow to the lower Heihe River in recent years is closely related to the increase in precipitation runoff and snowmelt runoff in the upper reaches of the Heihe River. Whether this runoff increase will remain stable under future climate change is still an important question. Thus, the amount of downstream water flow in the future depends strongly on future changes in upstream water resources.
Note that the recommended runoff to the downstream reaches of the Heihe River (7.7 × 10⁸ m3/year) obtained by the predictive simulation coincides with the results of previous forecast assessments: Wu et al. [11] found an optimum discharge of 7.5 × 10⁸ m3/year, and Xi et al. [12] reported a value of 9 × 10⁸ m3/year. At the same time, the results presented herein should be considered more reasonable since the developed model is calibrated and validated using not only groundwater levels and surface runoff data but also remote sensing observations of the dynamic areas of terminal lakes and surface land evapotranspiration.

5. Conclusions

In this study, a coupled surface water–groundwater numerical model of the Ejina Basin is established considering the water exchange processes within the intermittent stream/terminal lake–aquifer–riparian zone evapotranspiration–groundwater withdrawal system. The simulation results demonstrate that river leakage and evapotranspiration in the riparian zone dominate the hydrological processes in the considered hyperarid basin. An 18-year simulation with a monthly step demonstrates that the average river leakage accounts for approximately 61% of the total river runoff. The obtained relationship between leakage from the river channel and incoming runoff allows us to make recommendations for regulating the flow of the lower Heihe River. Specifically, according to the results of a predictive simulation, 7.7 × 10⁸ m3 of water should be passed to the downstream reaches of the Heihe River every year to stabilize the areas of East Juyan, West Juyan, and Swan Lakes and to support the vegetation in the Ejina Oasis. The results of this study provide insight for the effective management of limited water resources in the considered hyperarid basin.
The results of model calibration according to observations of groundwater levels, dynamic changes in the areas of terminal lakes and evaporation from the land surface demonstrate that the developed model corresponds well to natural conditions. This attempt shows that when direct measurements of groundwater and surface water levels and river runoff are scarce, such a hydrogeological model of arid river basins can be effectively calibrated and validated using remote observations of water body area dynamics and land surface evapotranspiration. Nevertheless, the simulated annual evapotranspiration from local oasis zones differs from that calculated using remote observation data. This suggests that remote sensing-based evapotranspiration data can be further used to reduce the uncertainties in simulating groundwater evapotranspiration for particular landscapes, such as the Gobi Desert and oasis.

Author Contributions

Formal Analysis, P.V., T.W. and X.Z.; Investigation, P.V., P.W., T.W. and X.Z.; Writing—Original Draft, P.V.; Conceptualization, P.W. and S.P.; Data Curation, P.W., Y.Z. and X.Z.; Writing—Review & Editing, P.W., S.P. and J.Y.; Funding Acquisition, P.W. and S.P.; Methodology, S.P.; Validation, S.P.; Supervision, S.P.; Software, T.W. All authors have read and agreed to the published version of the manuscript.

Funding

The reported study was funded by grants from the National Natural Science Foundation of China (NSFC) (Nos. 41877165 and 42071042), Russian Foundation for Basic Research (RFBR) (No. 19-35-90014), and NSFC-RFBR (Nos. 21-55-53017 ΓΦEH_a and 42111530027).

Institutional Review Board Statement

Not applicable.

Informed Consent Statement

Not applicable.

Data Availability Statement

The datasets used and/or analyzed during the present study are available from the corresponding author on reasonable request.

Acknowledgments

The authors are grateful to the field team consisting of the staff of the Department of Hydrogeology, Faculty of Geology, Lomonosov Moscow State University, researchers V.A. Lekhov and V.N. Samartsev, as well as graduate students and researchers Lu Kai, Liu Xiao, Li Bei, Yafei Li, Enmin Liu, and Chaoyang Du from the Institute of Geographic Sciences and Natural Resources Research, Chinese Academy of Sciences, for their help in conducting the field work. The authors also thank the anonymous editor and four reviewers for their valuable comments and suggestions, which led to substantial improvements to this paper.

Conflicts of Interest

The authors declare no conflict of interest.

References

  1. Tchakerian, V. Hydrology, Floods And Droughts: Deserts and Desertification. In Encyclopedia of Atmospheric Sciences; Elsevier BV: Amsterdam, The Netherlands, 2015; pp. 185–192. [Google Scholar]
  2. Zhang, P.; Jeong, J.-H.; Yoon, J.-H.; Kim, H.; Wang, S.-Y.S.; Linderholm, H.W.; Fang, K.; Wu, X.; Chen, D. Abrupt shift to hotter and drier climate over inner East Asia beyond the tipping point. Science 2020, 370, 1095–1099. [Google Scholar] [CrossRef] [PubMed]
  3. Yao, Y.; Huang, X.; Liu, J.; Zheng, C.; He, X.; Liu, C. Spatiotemporal variation of river temperature as a predictor of groundwater/surface-water interactions in an arid watershed in China. Appl. Hydrogeol. 2015, 23, 999–1007. [Google Scholar] [CrossRef]
  4. Song, J.; Jiang, W.; Xu, S.; Zhang, G.; Wang, L.; Wen, M.; Zhang, B.; Wang, Y.; Long, Y. Heterogeneity of hydraulic conductivity and Darcian flux in the submerged streambed and adjacent exposed stream bank of the Beiluo River, northwest China. Appl. Hydrogeol. 2016, 24, 2049–2062. [Google Scholar] [CrossRef]
  5. Wang, L.; Jiang, W.; Song, J.; Dou, X.; Guo, H.; Xu, S.; Zhang, G.; Wen, M.; Long, Y.; Li, Q. Investigating spatial variability of vertical water fluxes through the streambed in distinctive stream morphologies using temperature and head data. Appl. Hydrogeol. 2017, 25, 1283–1299. [Google Scholar] [CrossRef]
  6. Min, L.; Yu, J.; Liu, C.; Zhu, J.; Wang, P. The spatial variability of streambed vertical hydraulic conductivity in an intermittent river, northwestern China. Environ. Earth Sci. 2013, 69, 873–883. [Google Scholar] [CrossRef]
  7. Wang, P.; Pozdniakov, S.; Vasilevskiy, P.Y. Estimating groundwater-ephemeral stream exchange in hyper-arid environments: Field experiments and numerical simulations. J. Hydrol. 2017, 555, 68–79. [Google Scholar] [CrossRef]
  8. Kennedy, C.D.; Genereux, D.; Corbett, D.R.; Mitasova, H. Design of a light-oil piezomanometer for measurement of hydraulic head differences and collection of groundwater samples. Water Resour. Res. 2007, 43, wr005904. [Google Scholar] [CrossRef]
  9. Vasilevskiy, P.Y.; Wang, P.; Pozdniakov, S.P.; Davis, P. Revisiting the modified Hvorslev formula to account for the dynamic process of streambed clogging: Field validation. J. Hydrol. 2019, 568, 862–866. [Google Scholar] [CrossRef]
  10. Wang, P.; Yu, J.; Zhang, Y.; Liu, C. Groundwater recharge and hydrogeochemical evolution in the Ejina Basin, northwest China. J. Hydrol. 2013, 476, 72–86. [Google Scholar] [CrossRef]
  11. Wu, X.M.; Chen, C.X.; Shi, S.S. Three-dimensional numerical simulation of groundwater system in Ejina Basin, Heihe River, Northwestern China. J. China Univ. Geosci. 2003, 28, 527–532. [Google Scholar]
  12. Xi, H.; Feng, Q.; Liu, W.; Si, J.; Chang, Z.; Su, Y. The research of groundwater flow model in Ejina Basin, Northwestern China. Environ. Earth Sci. 2009, 60, 953–963. [Google Scholar] [CrossRef]
  13. Xu, Y.; Yu, J.; Zhang, Y.; Wang, P.; Wang, D. Groundwater dynamic numerical simulation in the Ejina Oasis in an ecological water conveyance period. Hydrogeol. Eng. Geol. 2014, 41, 11–18. [Google Scholar]
  14. Yao, Y.; Zheng, C.; Liu, J.; Cao, G.; Xiao, H.; Li, H.; Li, W. Conceptual and numerical models for groundwater flow in an arid inland river basin. Hydrol. Process. 2015, 29, 1480–1492. [Google Scholar] [CrossRef]
  15. Harbaugh, A.W. MODFLOW-2005: The U.S. Geological Survey modular ground-water model—The ground-water flow process. In Techniques and Methods; US Geological Survey: Reston, VI, USA, 2005. [Google Scholar]
  16. Brunner, P.; Franssen, H.-J.H.; Kgotlhang, L.; Bauer-Gottwein, P.; Kinzelbach, W. How can remote sensing contribute in groundwater modeling? Appl. Hydrogeol. 2007, 15, 5–18. [Google Scholar] [CrossRef] [Green Version]
  17. Li, H.; Brunner, P.; Kinzelbach, W.; Li, W.; Dong, X. Calibration of a groundwater model using pattern information from remote sensing data. J. Hydrol. 2009, 377, 120–130. [Google Scholar] [CrossRef]
  18. Doble, R.C.; Crosbie, R. Review: Current and emerging methods for catchment-scale modelling of recharge and evapotranspiration from shallow groundwater. Hydrogeol. J. 2016, 25, 3–23. [Google Scholar] [CrossRef]
  19. Colombani, N.; Gaiolini, M.; Busico, G.; Postacchini, M. Quantifying the Impact of Evapotranspiration at the Aquifer Scale via Groundwater Modelling and MODIS Data. Water 2021, 13, 950. [Google Scholar] [CrossRef]
  20. Wang, P.; Yu, J.; Pozdniakov, S.P.; Grinevsky, S.O.; Liu, C. Shallow groundwater dynamics and its driving forces in extremely arid areas: A case study of the lower Heihe River in northwestern China. Hydrol. Process. 2014, 28, 1539–1553. [Google Scholar] [CrossRef]
  21. Liu, X.; Yu, J.; Wang, P.; Zhang, Y.; Du, C. Lake Evaporation in a Hyper-Arid Environment, Northwest of China—Measurement and Estimation. Water 2016, 8, 527. [Google Scholar] [CrossRef] [Green Version]
  22. Wang, P.; Yu, J.; Zhang, Y.; Fu, G.; Min, L.; Ao, F. Impacts of environmental flow controls on the water table and groundwater chemistry in the Ejina Delta, northwestern China. Environ. Earth Sci. 2011, 64, 15–24. [Google Scholar] [CrossRef]
  23. Wen, X.; Wu, Y.; Su, J.; Zhang, Y.; Liu, F. Hydrochemical characteristics and salinity of groundwater in the Ejina Basin, Northwestern China. Environ. Earth Sci. 2005, 48, 665–675. [Google Scholar] [CrossRef]
  24. Qin, D.; Zhao, Z.; Han, L.; Qian, Y.; Ou, L.; Wu, Z.; Wang, M. Determination of groundwater recharge regime and flowpath in the Lower Heihe River basin in an arid area of Northwest China by using environmental tracers: Implications for vegetation degradation in the Ejina Oasis. Appl. Geochem. 2012, 27, 1133–1145. [Google Scholar] [CrossRef]
  25. Wang, P.; Grinevsky, S.O.; Pozdniakov, S.; Yu, J.; Dautova, D.S.; Min, L.; Du, C.; Zhang, Y. Application of the water table fluctuation method for estimating evapotranspiration at two phreatophyte-dominated sites under hyper-arid environments. J. Hydrol. 2014, 519, 2289–2300. [Google Scholar] [CrossRef]
  26. Li, B.; Zhang, Y.-C.; Wang, P.; Du, C.-Y.; Yu, J.-J. Estimating Dynamics of Terminal Lakes in the Second Largest Endorheic River Basin of Northwestern China from 2000 to 2017 with Landsat Imagery. Remote Sens. 2019, 11, 1164. [Google Scholar] [CrossRef] [Green Version]
  27. Zhang, Z.; Zheng, Y.; Han, F.; Xiong, R.; Feng, L. Recovery of an endorheic lake after a decade of conservation efforts: Mediating the water conflict between agriculture and ecosystems. Agric. Water Manag. 2021, 256, 107107. [Google Scholar] [CrossRef]
  28. Xie, Q. Regional Hydrogeological Survey Report of the People’s Republic of China (1:200,000): Ejina K-47-[24] [R]; Chinese People’s Liberation Army: Jiuquan, China, 1980. [Google Scholar]
  29. Gates, J.B.; Edmunds, W.M.; Ma, J.; Scanlon, B.R. Estimating groundwater recharge in a cold desert environment in northern China using chloride. Appl. Hydrogeol. 2008, 16, 893–910. [Google Scholar] [CrossRef]
  30. Sun, P.; Ma, J.; Qi, S.; Zhao, W.; Zhu, G. The effects of a dry sand layer on groundwater recharge in extremely arid areas: Field study in the western Hexi Corridor of northwestern China. Appl. Hydrogeol. 2016, 24, 1515–1529. [Google Scholar] [CrossRef]
  31. Chiang, E. User Guide for Processing Modflow Version 10—A graphical user interface for MODFLOW, MODPATH, MT3D, PEST, SEAWAT, and ZoneBudget. Simcore Software. 3 January 2020, p. 270. Available online: https://www.simcore.com/files/pm/v10/pm10.pdf (accessed on 31 January 2022).
  32. Niswonger, R.G.; Prudic, D.E. Documentation of the Streamflow-Routing (SFR2) Package to Include Unsaturated Flow Beneath Streams. A Modification to SFR1. U.S. Geological Survey Techniques and Methods 6-A13; 2005; p. 50. Available online: https://pubs.usgs.gov/tm/2006/tm6A13/pdf/tm6a13.pdf (accessed on 31 January 2022).
  33. Merritt, M.L.; Konikow, L.F. Documentation of a Computer Program to Simulate Lake-Aquifer Interaction Using the MODFLOW Ground-Water Flow Model and the MOC3D Solute-Transport Model. U.S. Geological Survey Water-Resources Investigations Report 00-4167; 2000; p. 146. Available online: https://pubs.er.usgs.gov/publication/wri004167 (accessed on 31 January 2022).
  34. Banta, E.R. MODFLOW-2000, the U.S. Geological Survey Modular Ground—Water Model; Documentation of Packages for Simulating Evapotranspiration with a SEGMENTED Function (ETS1) and Drains with Return Flow (DRT1); US Geological Survey, Open-File Report 2000-466; 2000; p. 127. Available online: https://pubs.er.usgs.gov/publication/ofr00466 (accessed on 31 January 2022).
  35. Du, C.; Yu, J.; Wang, P.; Zhang, Y. Analysing the mechanisms of soil water and vapour transport in the desert vadose zone of the extremely arid region of northern China. J. Hydrol. 2018, 558, 592–606. [Google Scholar] [CrossRef]
  36. Guo, X.; Feng, Q.; Si, J.; Xi, H.; Zhao, Y.; Deo, R. Partitioning groundwater recharge sources in multiple aquifers system within a desert oasis environment: Implications for water resources management in endorheic basins. J. Hydrol. 2019, 579, 124212. [Google Scholar] [CrossRef]
  37. Wang, P.; Zhang, Y.; Yu, J.; Fu, G.; Ao, F. Vegetation dynamics induced by groundwater fluctuations in the lower Heihe River Basin, northwestern China. J. Plant Ecol. 2011, 4, 77–90. [Google Scholar] [CrossRef]
  38. Liu, X. The Quantification of Ecological Water Consumption of Ejina Delta in the Lower Reaches of Heihe River and Water Use Efficiency of the Heihe Ecological Water Conveyance Project. Ph.D. Thesis, University of Chinese Academy of Sciences, Beijing, China, 2018. [Google Scholar]
  39. Monteith, J.L. The State and Movement of Water in Living Organism. Symposium of the Society of Experimental Biology; Cambridge University Press: Cambridge, UK, 1965; pp. 205–234. [Google Scholar]
  40. LeGates, D.R.; McCabe, G.J., Jr. Evaluating the use of “goodness-of-fit” Measures in hydrologic and hydroclimatic model validation. Water Resour. Res. 1999, 35, 233–241. [Google Scholar] [CrossRef]
  41. Los, S.; Pollack, N.H.; Parris, M.T.; Collatz, G.J.; Tucker, C.J.; Sellers, P.J.; Malmström, C.M.; DeFries, R.S.; Bounoua, L.; Dazlich, D.A. A Global 9-yr Biophysical Land Surface Dataset from NOAA AVHRR Data. J. Hydrometeorol. 2000, 1, 183–199. [Google Scholar] [CrossRef]
  42. Zhou, Y.; Li, X.; Yang, K.; Zhou, J. Assessing the impacts of an ecological water diversion project on water consumption through high-resolution estimations of actual evapotranspiration in the downstream regions of the Heihe River Basin, China. Agric. For. Meteorol. 2018, 249, 210–227. [Google Scholar] [CrossRef]
  43. Mu, Q.; Zhao, M.; Running, S.W. MODIS Global Terrestrial Evapotranspiration (ET) Product (NASA MOD16A2/A3). Algorithm Theoretical Basis Document. Collection 5. 2013. Available online: https://modis-land.gsfc.nasa.gov/pdf/MOD16ATBD.pdf (accessed on 31 January 2022).
  44. MOD16. Available online: http://files.ntsg.umt.edu/data/NTSG_Products/MOD16/ (accessed on 18 February 2022).
  45. Lurtz, M.R.; Morrison, R.R.; Gates, T.K.; Senay, G.B.; Bhaskar, A.S.; Ketchum, D.G. Relationships between riparian evapotranspiration and groundwater depth along a semiarid irrigated river valley. Hydrol. Process. 2020, 34, 1714–1727. [Google Scholar] [CrossRef]
  46. Milzow, C.; Kgotlhang, L.; Kinzelbach, W.; Meier, P.; Bauer-Gottwein, P. The role of remote sensing in hydrological modelling of the Okavango Delta, Botswana. J. Environ. Manag. 2009, 90, 2252–2260. [Google Scholar] [CrossRef] [PubMed]
  47. Rashid, M.; Ahmed, S. Appraisal of the groundwater balance components from multi-remote sensing datasets in a semi-arid region. Environ. Monit. Assess. 2018, 190, 681. [Google Scholar] [CrossRef]
  48. Yang, X.; Smith, P.L.; Yu, T.; Gao, H. Estimating evapotranspiration from terrestrial groundwater-dependent ecosystems using Landsat images. Int. J. Digit. Earth 2011, 4, 154–170. [Google Scholar] [CrossRef]
  49. Shu, Y.; Li, H.; Lei, Y. Modelling Groundwater Flow with MIKE SHE Using Conventional Climate Data and Satellite Data as Model Forcing in Haihe Plain, China. Water 2018, 10, 1295. [Google Scholar] [CrossRef] [Green Version]
  50. Silva, C.D.O.F.; Manzione, R.L.; Filho, J.L.A. Combining remotely sensed actual evapotranspiration and GIS analysis for groundwater level modeling. Environ. Earth Sci. 2019, 78, 1–15. [Google Scholar] [CrossRef]
  51. Rojas, R.; Kahunde, S.; Peeters, L.; Batelaan, O.; Feyen, L.; Dassargues, A. Application of a multimodel approach to account for conceptual model and scenario uncertainties in groundwater modelling. J. Hydrol. 2010, 394, 416–435. [Google Scholar] [CrossRef] [Green Version]
  52. Ye, M.; Pohlmann, K.F.; Chapman, J.B.; Pohll, G.M.; Reeves, D.M. A Model-Averaging Method for Assessing Groundwater Conceptual Model Uncertainty. Ground Water 2010, 48, 716–728. [Google Scholar] [CrossRef] [PubMed]
  53. Wu, J.; Zeng, X. Review of the uncertainty analysis of groundwater numerical simulation. Chin. Sci. Bull. 2013, 58, 3044–3052. [Google Scholar] [CrossRef] [Green Version]
  54. Gaofeng, Z.; Yonghong, S.; Chunlin, H.; Qi, F.; Zhiguang, L. Hydrogeochemical processes in the groundwater environment of Heihe River Basin, northwest China. Environ. Earth Sci. 2010, 60, 139–153. [Google Scholar] [CrossRef]
Figure 1. Study site location: the lower reaches of the Heihe River.
Remotesensing 14 01657 g001
Figure 2. Geological cross section of the study area from southwest to northeast (Figure 1). Modified from Xi et al. [12].
Remotesensing 14 01657 g002
Figure 3. Average monthly runoff of the Donghe and Xihe Rivers measured at the Langxinshan hydrological station (Figure 1) from 1988 to 2017.
Remotesensing 14 01657 g003
Figure 4. Conceptual diagram of the intermittent stream/terminal lake–aquifer–riparian zone evapotranspiration–groundwater withdrawal system. Zcrit—extinction depth of evapotranspiration; K and Kz—horizontal hydraulic conductivity and vertical hydraulic conductivity, respectively, of the aquifer; Sy—specific yield of the aquifer; k0/m0—ratio of riverbed hydraulic conductivity to riverbed thickness; Hr and Hgw—levels of surface water and groundwater, respectively.
Remotesensing 14 01657 g004
Figure 5. Daily precipitation for the period 2000–2017 recorded at the Ejina weather station. The dashed line represents the minimum precipitation able to form recharge according to Sun et al. [30].
Remotesensing 14 01657 g005
Figure 6. Time series of river runoff at the Langxinshan hydrological station and simulated river water leakage during the period 2000–2017.
Remotesensing 14 01657 g006
Figure 7. Distribution of the aquifer system hydraulic parameter zones (a) and division of river channels into segments (b).
Remotesensing 14 01657 g007
Figure 8. Time series of potential evaporation in the Ejina Basin for the period 2000–2017 calculated using the Penman–Monteith method.
Remotesensing 14 01657 g008
Figure 9. Dependence of relative evapotranspiration on the depth of the groundwater table according to Wang et al. [25] and Liu [38] for oasis and desert areas, respectively.
Remotesensing 14 01657 g009
Figure 10. Simulated and observed groundwater levels over the period 2000–2017.
Remotesensing 14 01657 g010
Figure 11. Time series of the simulated and observed groundwater levels over the period 2000–2017. The locations of the observation wells are plotted in Figure 7.
Remotesensing 14 01657 g011
Figure 12. Simulated and observed cumulative runoff volumes at the Dongjuyanhai gauging station for the period 2000–2017.
Remotesensing 14 01657 g012
Figure 13. Simulated and observed area dynamics of East Juyan, West Juyan, and Swan Lakes for the period 2000–2017.
Remotesensing 14 01657 g013
Figure 14. Simulated groundwater levels (a) and evapotranspiration discharge (b) for July 2017 from a model composed of 500 m × 500 m grid blocks. The red contours represent the areas used to compare the simulated evapotranspiration with the calculated evapotranspiration using remote sensing observations.
Remotesensing 14 01657 g014
Figure 15. Dependence of the simulated cumulative volume of river runoff at the Dongjuyanhai gauging station on the average k0/m0 of riverbed sediments. The red dot represents the median calibrated k0/m0 and the simulated volume of runoff.
Remotesensing 14 01657 g015
Figure 16. Predictive simulations of the terminal lake area changes for the period 2018–2022.
Remotesensing 14 01657 g016
Figure 17. Sensitivity of the model total lateral outflow to the median GHB conductance. The red dot represents the value of the median GHB conductance selected during calibration and the corresponding total lateral outflow.
Remotesensing 14 01657 g017
Table 1. Parameters of the river channel segments (the division of the channels into segments is presented in Figure 7).
Segment №Segment Length, mSegment Width, mk0/m0, day−1
InitialCalibrated
1158,50011–2000.41–0.890.0024–0.0052
270008–900.410.0024
354,0008–900.002–0.550.00001–0.0032
446,0005–600.002–0.550.00001–0.0032
515005–600.410.0024
657,5005–600.002–0.550.00001–0.0032
765,0005–600.002–0.550.00001–0.0032
8240,5004–460.51–0.790.003–0.0046
945008–900.0020.00001
Table 2. Initial and calibrated values of the hydraulic parameters for the Ejina water balance model (The parameter zones are presented in Figure 7).
Zone №Model Layer №Initial ValueCalibrated Value
K, m/DayKz, m/DaySy, -K, m/DayKz, m/DaySy, -
1143140.1539100.20
244140.1539100.20
34410.1539100.20
212590.153480.19
2520.15510.15
3510.151850.15
311860.152460.18
2410.15410.14
340.60.152360.14
411550.151640.17
2620.15510.15
360.50.151640.15
51520.1540.90.15
2520.1540.90.15
350.20.1540.90.15
61410.15510.14
2410.15510.15
360.10.15510.15
Table 3. Comparison between the simulated evapotranspiration (ET) values plus precipitation and those calculated using observational data.
Observation
Period
Simulated ET+ Precipitation, mmCalculated MOD16 ET, mmRelative Error, %
Average annual value for 2001–201710914525
Annual value in 20171471502
Monthly value in July 2017211631
Table 4. Groundwater balance within the model domain from 1 January 2000 to 31 December 2017.
Balance ComponentRechargeDischarge
Volume, m3Proportion of Total, %Volume, m3Proportion of Total, %
1Water exchange with river6.48 × 109751.64 × 1081
2Water exchange with lake2.86 × 10831.68 × 1081
3Evapotranspiration--7.92 × 10962
4Groundwater exploitation- 6.30 × 1085
5Lateral flow1.92 × 109223.88 × 10930
6Total8.68 × 1091001.28 × 1010100
Table 5. Water balance components of West Juyan, East Juyan, and Swan Lakes based on the results of a simulation from 1 January 2000 to 31 December 2017.
LakeWater Volume, m3RechargeDischarge
20002018Volume of Surface Runoff, m3 (Proportion of Total Recharge, %)Volume of Groundwater Runoff, m3 (Proportion of Total Recharge, %)Precipitation, m3 (Part from Total Recharge, %)Evaporation, m3 (Proportion of Total Discharge, %)Leakage, m3 (Proportion of Total Discharge, %)
West Juyan03.09 × 1071.04 × 109 (91)6.65 × 10⁷ (6)2.95 × 10⁷ (3)9.62 × 10⁸ (87)1.5 × 10⁸ (13)
East Juyan01.91 × 1081.44 × 109 (96)2.24 × 10⁷ (2)3.1 × 10⁷ (2)1.23 × 10⁹ (94)7.47 × 10⁷ (6)
Swan01.23 × 1089.07 × 108 (91)7.25 × 10⁷ (7)2.15 × 10⁷ (2)8.20 × 10⁸ (93)6.03 × 10⁷ (7)
Publisher’s Note: MDPI stays neutral with regard to jurisdictional claims in published maps and institutional affiliations.

