Technical Note

Application of Multispectral Remote Sensing for Mapping Flood-Affected Zones in the Brumadinho Mining District (Minas Gerais, Brasil)

1
Department of Earth Sciences, Environment, and Resources, University of Naples, Federico II, Via Vicinale Cupa Cintia 21, 80126 Naples, Italy
2
Natural History Museum, Cromwell Rd, Kensington, London SW7 5BD, UK
*
Author to whom correspondence should be addressed.
Remote Sens. 2022, 14(6), 1501; https://doi.org/10.3390/rs14061501
Submission received: 4 February 2022 / Revised: 11 March 2022 / Accepted: 17 March 2022 / Published: 20 March 2022
(This article belongs to the Special Issue Remote Sensing Solutions for Mapping Mining Environments)

Abstract

:
The collapse of the tailing “Dam B1” of the Córrego do Feijão Mine (Brumadinho, Brasil) that occurred in January 2019 is considered a large socio-environmental flood-disaster where numerous people died and the local flora and fauna were seriously affected, including agricultural areas of the Paraopeba River. This study aims to map the land area affected by the flood by using multispectral satellite images. To pursue this aim, Level-2A multispectral images from the European Space Agency’s Sentinel-2 sensor were acquired before and after the tailing dam collapse in the period 2019–2021. The pre- and post-failure event analysis allowed us to evidence drastic changes in the vegetation rate, as well as in the nature of soils and surficial waters. The spectral signatures of the minerals composing the mining products allowed us to highlight the effective area covered by the flood and to investigate the evolution of land properties after the disaster. This technique opens the possibility for quickly classifying areas involved in floods, as well as obtaining significant information potentially useful for monitoring and planning the reclamation and restoration activities in similar cases worldwide, representing an additional tool for evaluating the environmental issues related to mining operations in large areas at high temporal resolution.

1. Introduction

On the 25th of January 2019, the tailing dam called “Dam B1” of the Córrego do Feijão Mine (Brumadinho Iron Mine), one of the upstream iron tailing dams located around 9 km east of Brumadinho, Minas Gerais, Brazil, collapsed. The catastrophic failure was considered one of the largest environmental disasters in the world [1] and caused a huge flood consisting of more than 11 million m3 of mining waste spreading out about 10 km downhill, destroying mining offices, houses, roads and resulting in the tragic loss of 259 lives. The polluting flood quickly reached the Paraopeba River, a major tributary of the São Francisco River and one of the largest rivers in Brazil. The flood event decisively affected 249.5 thousand m2 of the surrounding area, seriously impacting the local flora and fauna and the Paraopeba River aquatic system, but also involving vegetation and agriculture areas [2,3]. As a result, human and social consequences, including water supply in the municipalities, tourism, and agriculture economy, were seriously compromised [1]. According to [1], the flood event has produced an increase in Paraopeba river turbidity levels due to the high amount of fine flood material, mainly composed of silt-clay particles and higher Fe and Mn content. The water analysis has indicated total heavy metal values up to 21 times above what is deemed acceptable, representing risks to the ecosystem [4]. The environmental impact after the Brumadinho dam disaster has also caused several issues in the surrounding lands. The presence of metals, including iron, aluminum, and manganese, was registered in the affected and unaffected soil samples with values above acceptable thresholds [5]. Even though Brumadinho tailing dam stability has been subject to local systematic monitoring, it collapsed only three years after the end of mining operations. This was due to water accumulation and infiltration through the dam, causing an increase of moisture contents and saturation of the tailings dam. In this contest, the acceleration of the seepage erosion and internal liquefaction processes caused the weakening of the structure of the dam and ending in collapse [3]. Investigation on surficial displacement and subsidence rate measuring during the period before the Dam B1 disaster (2016–2019) has been subjected to several studies based on remote sensing techniques and satellite data [3,6,7,8] such as Advanced Differential Interferometric Synthetic Aperture Radar (A-DInSAR) analysis. These investigations revealed that before the collapse, deformations of the body of the dam started on the eastern side and progressively developed with higher values in the central zone, in relation to anomalous rainy seasons [8].
The current study aims to map and assess land cover affected by the flood due to dam failure by using multispectral satellite data. Spectral sensing quickly allows for classifying materials exposed on the Earth’s surface based on their mineralogy and chemical properties [9,10], in this case making it easier to evaluate the effective area covered by the flood, and to investigate the evolution of land properties after the disaster [11,12,13,14,15]. To pursue this aim, we used Sentinel-2 images [16] obtained from the Europe Space Agency of the Copernicus Program. The potential of multispectral remote sensing, and, more specifically, the use of Sentinel-2 imagery, for geological applications and mine waste monitoring has been widely studied [17,18,19], mainly referring to the VNIR Sentinel-2 bands for the detection of ferric oxides and hydroxides. If compared to other multispectral satellites commonly used in the geology field, Sentinel-2 provides several relatively narrow bands in the VNIR region of the electromagnetic spectrum [18], i.e., band 4, band 8/8A, and band 9 of Sentinel-2 [17,18,19] (centered at 665 nm, 842/865 nm, and 940 nm, respectively) [16], which fit with the iron-bearing oxides and hydroxides diagnostic spectral features associated with the electronic transitions involving Fe3+ [20,21].
Below, we firstly describe the geology, mineralization, and spectral proprieties of the investigated areas. Then, a short description of the data and the multispectral images processing methods is followed by discussion and conclusions.

2. Geological Setting

The Córrego do Feijão mine is located along the ENE–WSW-striking Serra do Curral syncline in the northwest portion of the so-called Quadrilátero Ferrífero area, located on the southern border of the São Francisco craton in the central portion of the Minas Gerais State (northern Brazil) (Figure 1). The Serra do Curral is the host of several iron ore deposits where, together with the Córrego do Feijão mine, the mains are the West-, Central-, and East-Mine of the Usiminas mining complex, the Esperança, Jangada, and the now-exhausted Águas Claras ore deposits [22]. The geology of the Quadrilátero Ferrífero is characterized by the metavolcanic greenstone belt sequence of the Rio das Velhas Supergroup [23,24], and by the Archean granite-gneiss domes which border the metasedimentary units of the Minas Supergroup preserved as synclinal keels [25].
The Minas Supergroup (Siderian to Rhyacian) unconformably overlies the Rio das Velhas Supergroup and is divided into the Caraça, Itabira, Piracicaba, and Sabará Groups [23,26,27,28,29]. The Paleo- (Statherian) to Mesoproterozoic metasedimentary rocks Espinhaço Supergroup and the post-Minas intrusive rocks (i.e., the Borrachudo granite; [30,31] represent the younger sequences in the Quadrilátero Ferrífero area. Two orogenic events affected the area, (1) the Paleoproterozoic Transamazonian orogeny (2.1–1.9 Ga), which caused uplift of the crystalline basement and folding of the Rio das Velhas and Minas Supergroups, and (2) the Neoproterozoic Brasiliano orogeny (0.8–0.6 Ga), which resulted in complex structures superimposed to the previous deformation, leading to the development of a W-verging thrust belt, especially in the eastern portion of the Quadrilátero Ferrífero [22]. Metamorphic grades vary from west to east: greenschist-facies with martite-granoblastic hematite ores characterize the western domain (low-strain domain), while amphibolite-facies with microplaty and specular hematite ores occur in the central and NW parts (high-strain domain) [32,33,34].
High-grade hypogene and supergene iron ores are mostly hosted by the Cauê Formation itabirites (Neoarchean [29]; or Paleoproterozoic [35]), basal unit of the Itabira Group (Minas Supergroup), consisting of up to 300 m-thick metamorphosed BIFs with sericitic and dolomitic phyllites and marbles intercalations. The mineralization is mainly characterized by veins cross-cutting the above-mentioned metamorphosed iron formation (itabirite) of the Itabira Group [36].
Itabirites of the Quadrilátero Ferrífero have been divided into three different types: (1) quartz-itabirite, composed of recrystallized quartz and iron oxides in alternated bands [22,23,37]; (2) dolomite-itabirites, characterized by carbonates-rich layers with hematite micro-inclusions, iron oxides and less quartz [22,38]; and (3) amphibolite-itabirites, which are defined by red carbonates and/or iron oxides with less quartz, similar to the dolomite-itabirite, but they do contain disseminated amphiboles [23,34,39]. The supergene alteration, which occurred mainly in Paleogene, resulted in the development of a deep weathering profile where goethite is present as the main phase, occurring as alteration rims and porosity-filling replacing former iron oxides [22,25].

3. Main Features of the Brumadinho Tailing Dam B1: Structure and Geochemical Characterization

The 86 m-high dam was built in 1976 by Ferteco Mineração using the upstream heightening method and was active until 2015 under operations conducted by Vale S/A. The upstream method consists of vertically building the dam, depositing the tailings through successive uphill accumulation [3,40]. The construction starts with an embankment where the tailings are discharged from the crest of the starter dam and form the first level. This is compacted and then used to form the foundation for subsequent levels of the wall as the dam is raised. As such, the crest of the dam moves upstream with each raising [40,41]. According to [41], the diffusion of this old type of dam is related to economic advantages, as it is the cheapest building method and occupies a smaller area compared to the conventional downstream model, resulting in constructing licenses being easier to obtain [3]. However, the upstream method is considered to be very dangerous and unsafe [40] due to the increasing instability after operation stoppage and dam deactivation [3]. The geochemical characterization of the waste material of the Córrego do Feijão mine released from the Brumadinho Dam B1 collapse [1] revealed that the iron ore tailings are composed, among other elements, of Fe (26.5 wt%), Al (1.1 wt%), Mn (0.5 wt%), and Ti (0.043 wt%), contained in fine particulate material characterized by ~30% sand and ~70% silt-clay fractions, products of the wet processing method used to classify and purify the iron ore. Mineralogical characterization carried out on iron ore tailing dams from similar mines within the Quadrilátero Ferrífero area (i.e., Fundão Dam, Samarco mining company; [42]) showed that the mine waste is composed mainly of quartz and hematite, as main phases, and kaolinite, goethite, and gibbsite present in minor amounts [42,43]. Fe-bearing phases (hematite/magnetite and associated goethite) are classified as ultrafine (about 76% of their particles occurring in the range between 37 μm and 6 μm) and free (up to 88% of the particles) material [43].

4. Methods of Study

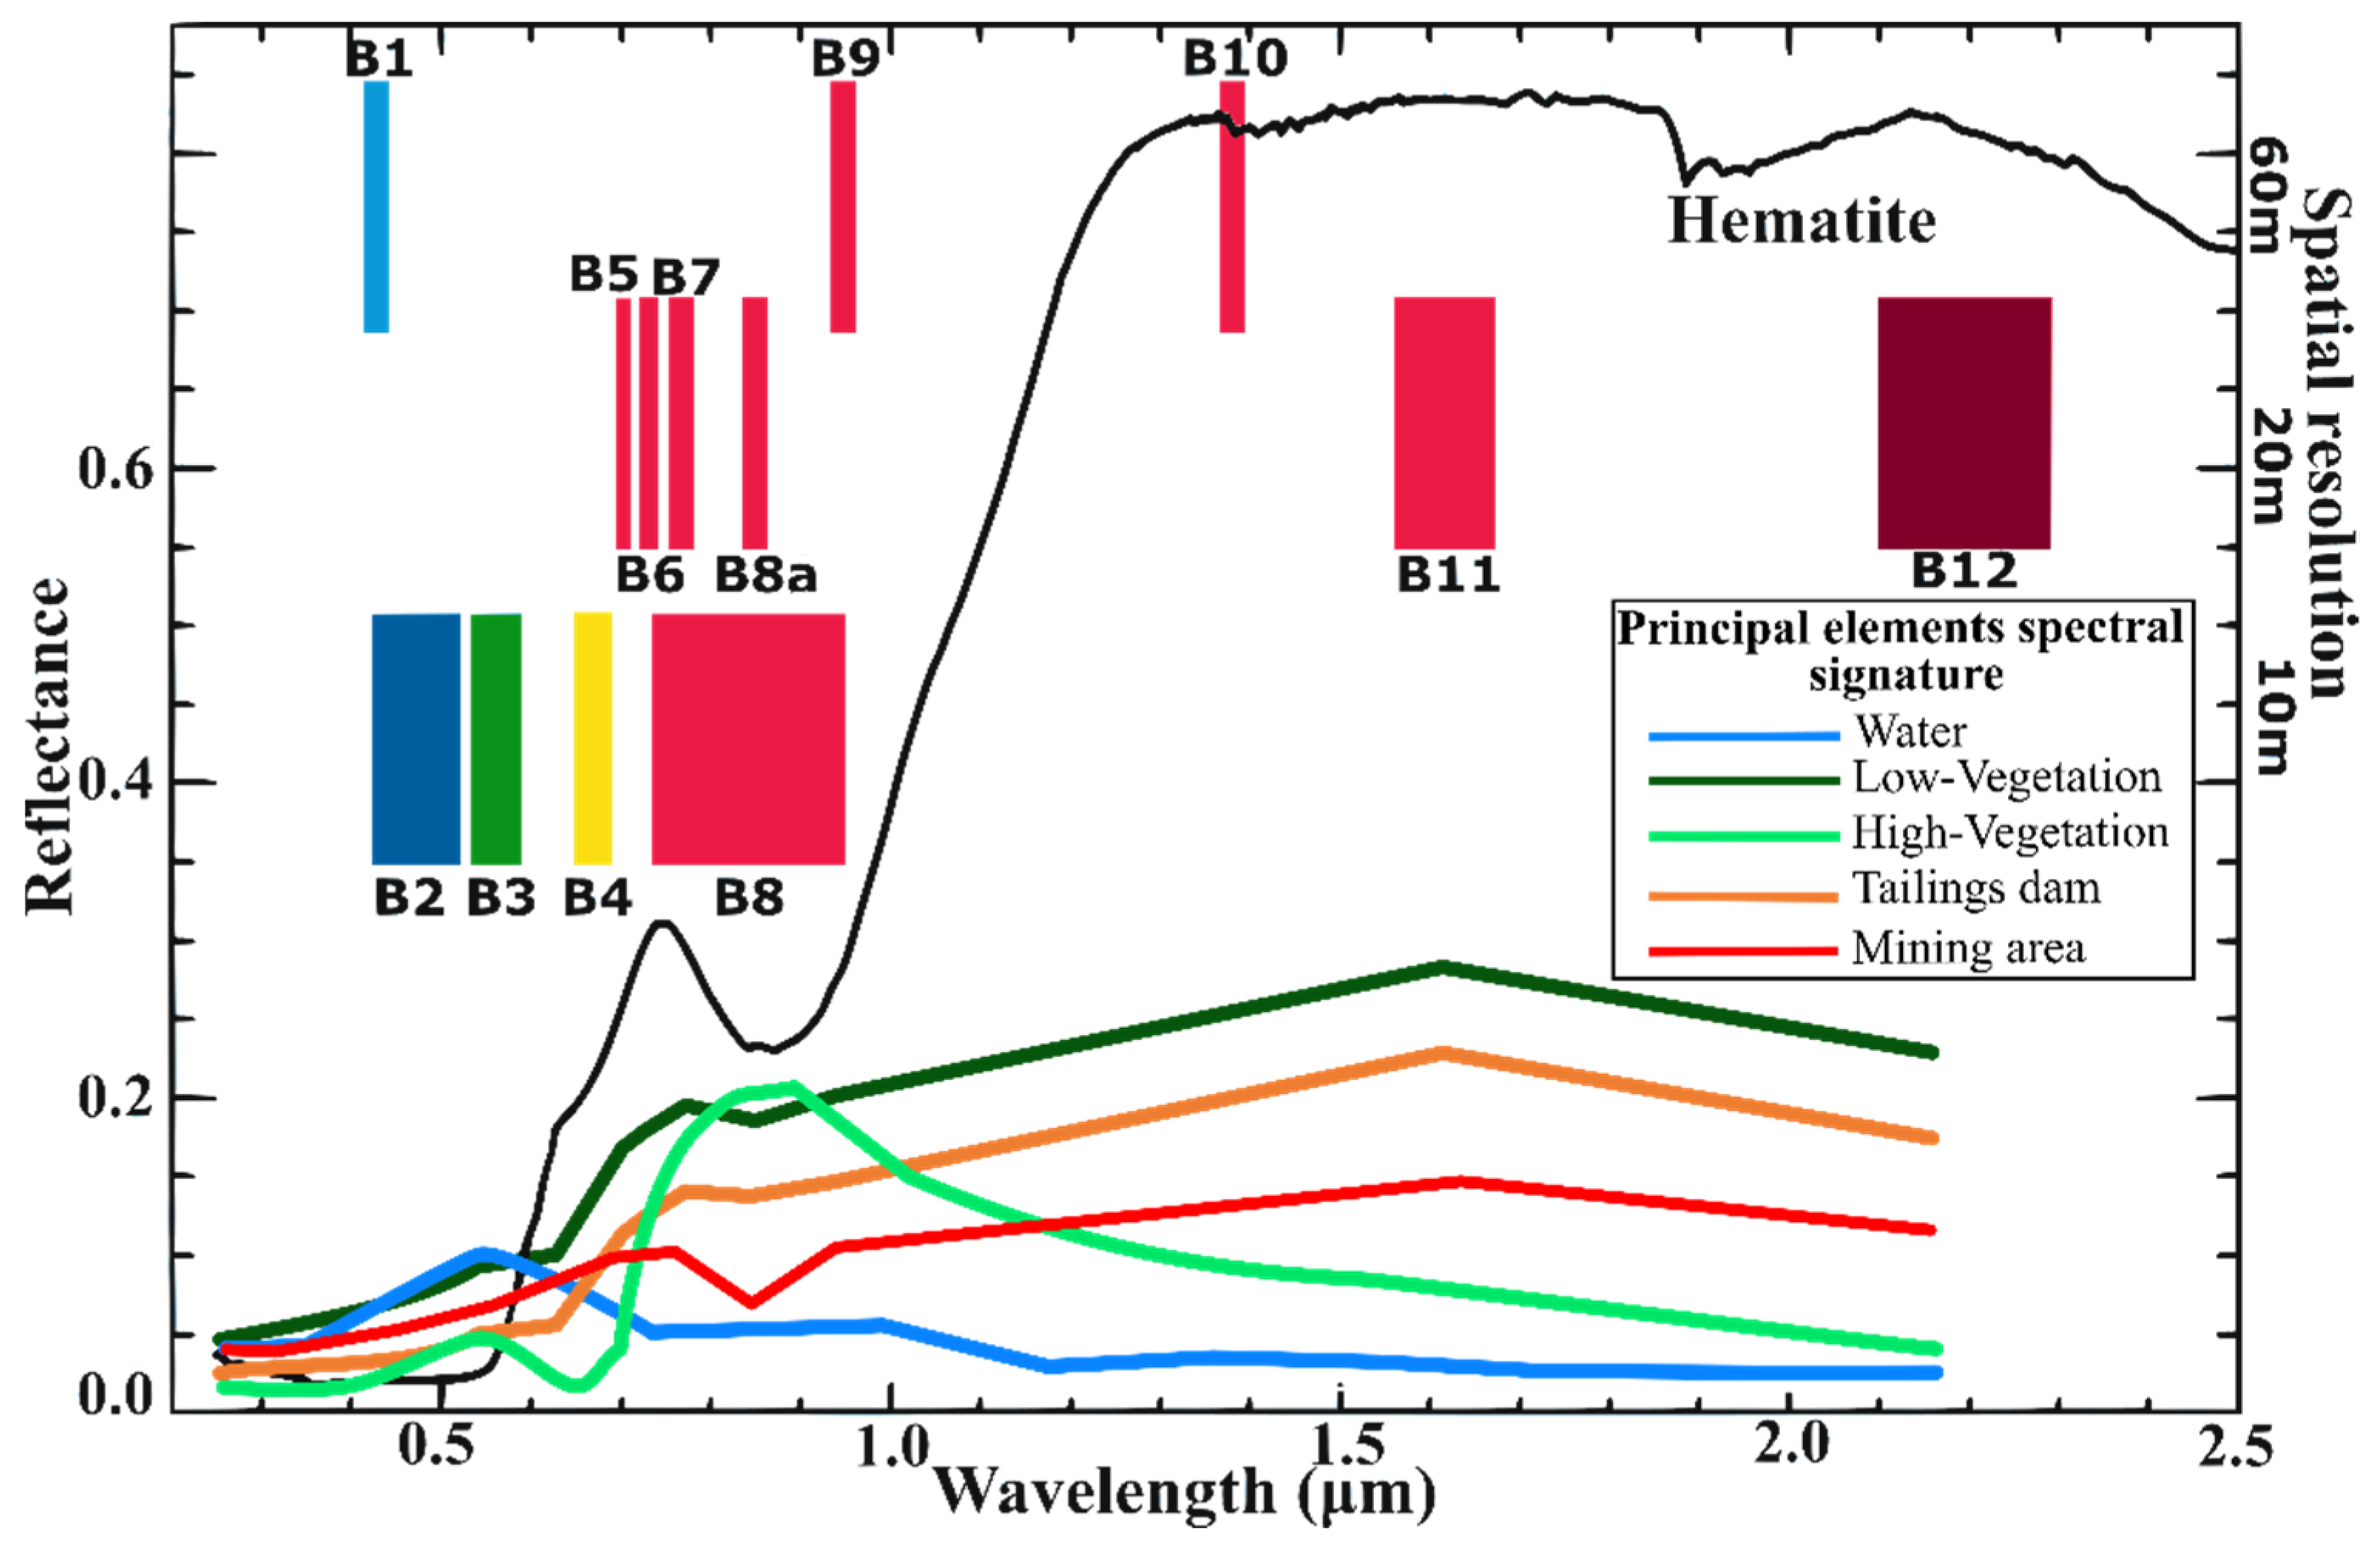
The present study is based on multispectral products acquired by means of the Sentinel-2 Instrument (Multi-Spectral Instrument—MSI) of the European Space Agency [16]. The available images from 2019 to 2021 with cloud coverage <5% were processed. In particular, we focused on 11 January 2019, 14 August 2020, and 10 July 2021. The orthorectified Level-2A Bottom-Of-Atmosphere reflectance product was used. In order to obtain a map of the affected flooded areas, the images were selected, including the Minas Gerais mining district and covering a period before and after the “Dam B1” failure. The thirteen Sentinel-2 bands and their combinations in the visible, Near-Infrared (NIR), and Short-wave Infrared (SWIR) spectral domains served as proxies for identifying geologic features [10], mainly for studying the ferric iron in (hydr-)oxides. The Sentinel-2 data were very useful for studying the ferric oxides and hydroxides minerals because of their spectral absorption in the VNIR region (bands 6, 7, 8, and 8A), particularly regarding the band 8, centered at 842 nm (115 nm bandwidth) [10,17] (Figure 2). The bands were resampled to the spatial resolution of band B2 (10 m) so that all pixels of other bands with 20 × 20 m2 pixel size were used.
The main aim of the data processing techniques adopted in this study was to apply several steps for mapping the flood-affected zones. The work was carried out by using the Sentinel Application Platform (SNAP) developed by the European Space Agency (ESA) [44] and the tool Spectral Unmixing. The materials on the surface are characterized by their diagnostic spectral signatures, called endmembers, and the fractions of each material composing a mixed pixel refer to fractional abundances. The spectral unmixing tool uses the decomposition of reflectance source spectrum into endmembers selected [45]. The result of the spectral unmixing is a measure of the contribution of the individual endmember to the source spectrum. This measure is related to the endmember’s relative abundance. Through the identification in the pre-event map of materials of interest with a spectrally unique signature, which are the so-called principal elements, and of their endmember spectral signatures, the abundance maps were calculated. Therefore, if 30% of a pixel contains the endmember X, 20% of the pixel contains Y, and 50% of the pixel contains endmember Z, the spectrum for that pixel is composed of the sum of 0.30, 0.20, and 0.50 times the single spectra of relative endmembers X, Y, and Z. The fully constrained algorithm is used to obtain the sum of abundances equal to 1 (high abundance) and eliminate the values below zero (low abundance). An RGB color composite map can be produced, assigning the X, Y, and Z abundances, respectively red, green, blue.
For the aim of this work, after the visual analysis of the pre-failure dam image, acquired on the 11 January 2019, we selected as possible principal elements: water, vegetation, and the tailing dams and mining areas (Figure 1 and Figure 2), and the spectral signatures sampled from them were considered to be endmember data for the Spectral Unmixing tool.
Figure 1. Study area. The red zones are the principal elements (see Section 4 below).
Remotesensing 14 01501 g001
Generally, water is characterized by only reflection in the visible light range, with almost no reflection in the near-infrared range. However, the reflectance may increase between 400 and 1000 nm with turbidity showing maxima between 400 and 700 nm, and 800 nm for highly turbid waters [46]. Vegetation is generally characterized by an absorption caused by the chlorophyll in the blue range (450–550 nm), a high reflectance in the near-infrared region (~865 nm), and strong water absorption in the mid-infrared region [47].
The tailing dams and mining areas have the spectral signatures of the ferric oxides and hydroxides. The spectral properties of iron-bearing oxide/hydroxide (i.e., hematite and goethite) have been studied in detail by several authors [21,48]. Hematite and goethite are characterized by diagnostic absorption features in the Visible Near InfraRed (VNIR) region of the electromagnetic spectrum, in the range between 450 nm and 1200 nm, due to electronic processes involving Fe3+ octahedrally bonded to ligands of oxygen (hematite α-Fe2O3) or oxygen and hydroxyl (goethite—α-FeO(OH)) [21]. Specifically, goethite generally exhibits the main spectral absorption ~940 nm, related to energy level changes in the valence electrons (Crystal Field Absorption features—CFA) [20]. Minor absorption features are at 480 nm and 670 nm (Charge Transfer Feature—CTS) [20], and the water-related bands occur close to 1400 nm and 1900 nm. On the other hand, the major CFA feature appears shifted to shorter wavelengths for hematite, occurring at typically ~880 nm [21]. Absorption position displacements to longer wavelengths of the main Fe-bearing oxides/hydroxides feature (~14 nm; [49]) are due to compositional variations related to Al3+ substitution for Fe3+ iron. In the present case study, tailing dams and mining area spectral properties resulted comparably to the hematite signature from the official USGS spectral library [50], detectable through the absorption feature in band 8 of Sentinel-2 (centered in 842 nm), which itself is commonly used to investigate all the iron oxides and hydroxides, i.e., Ferric oxides and hydroxides [17,18,19] (Figure 2).
Thus, only water, vegetation, ferric oxides, and hydroxides were considered as valuable endmembers for mapping the most relevant features occurring in the study area.
Figure 2. The spectral properties of principal elements sampled in the pre-event image. The black line is the official USGS hematite signature [50] compared to Sentinel-2 bands (from B1 to B12) [16].
Remotesensing 14 01501 g002

5. Results

Figure 3 shows the thematic maps in the Brumadinho mining district during the pre-and post-failure event, revealing the relative abundances of selected endmember spectral signatures, i.e., ferric oxides and hydroxides, vegetation, and water. The maps have been characterized using a grayscale color, where the low value indicates that the endmembers are not present, while greater values reveal where the endmembers are present. The water maps allowed for detecting water bodies present in the area, such as the river and the dam, corresponding to the principal elements in Figure 1 and Figure 2. The temporal evolution of vegetation shows a different spectral response due to the decreasing of vegetated areas. The ferric oxides and hydroxides maps display the distribution of open-pit iron mine areas only in 2019, whereas in the years 2020 and 2021 they show an increase of white in the zones where the flood occurred.
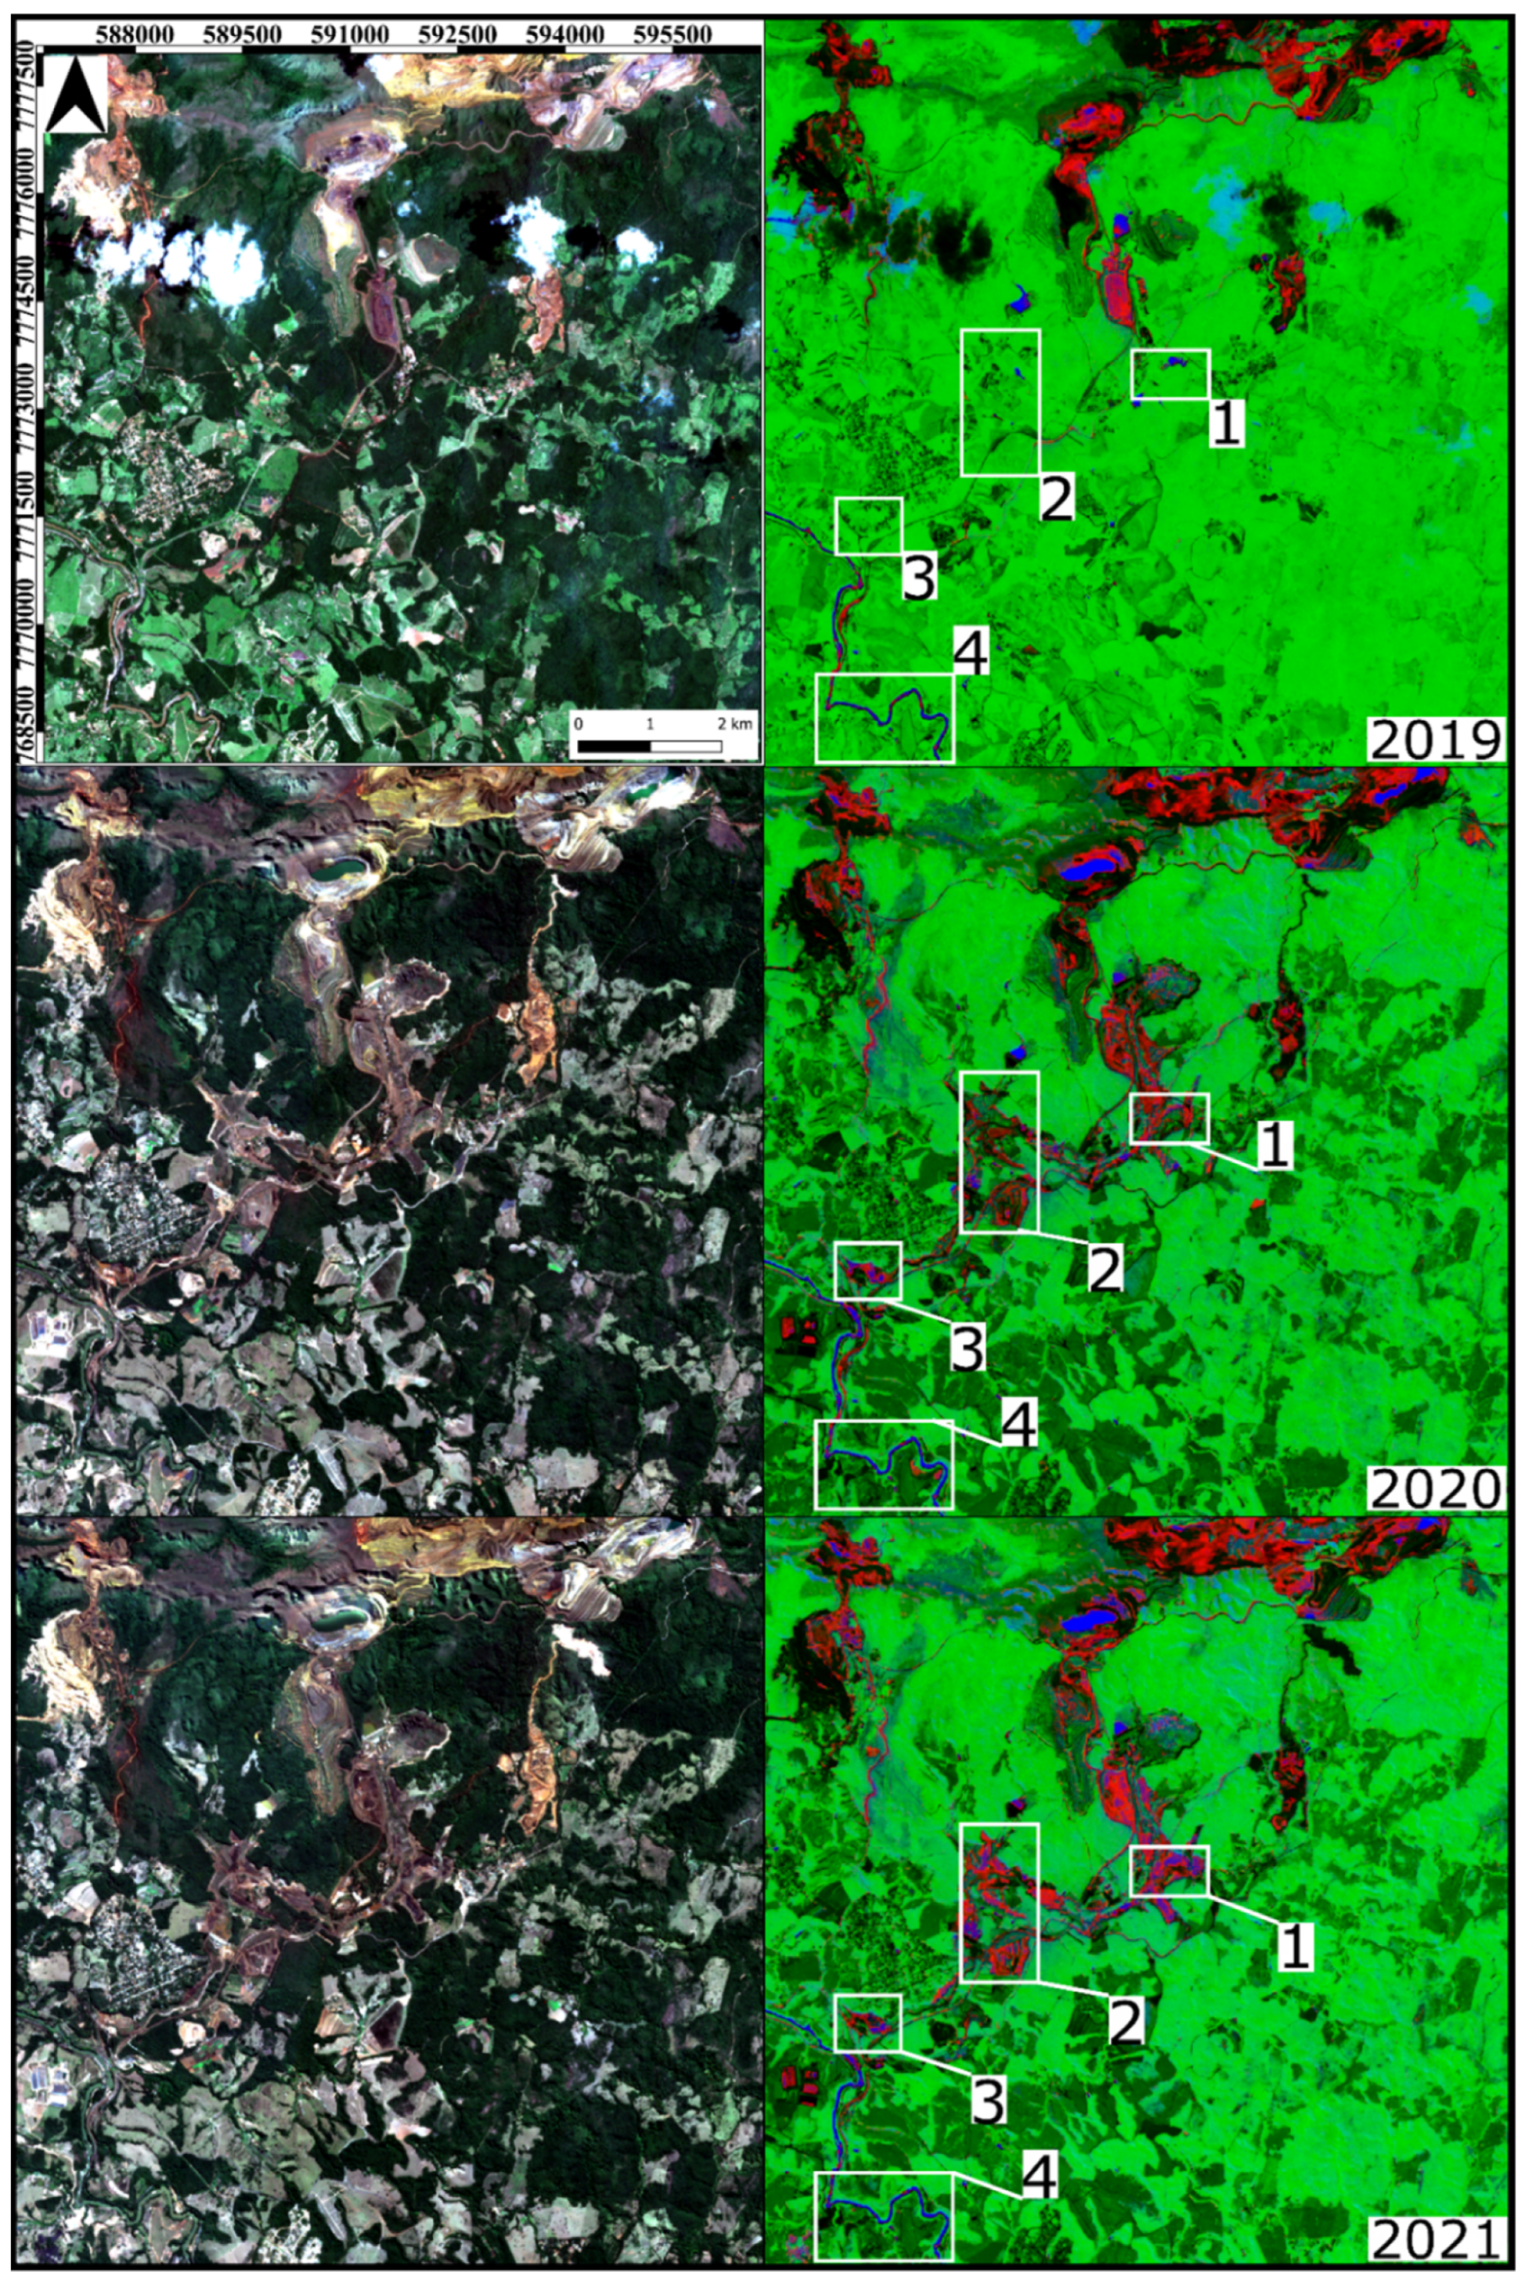
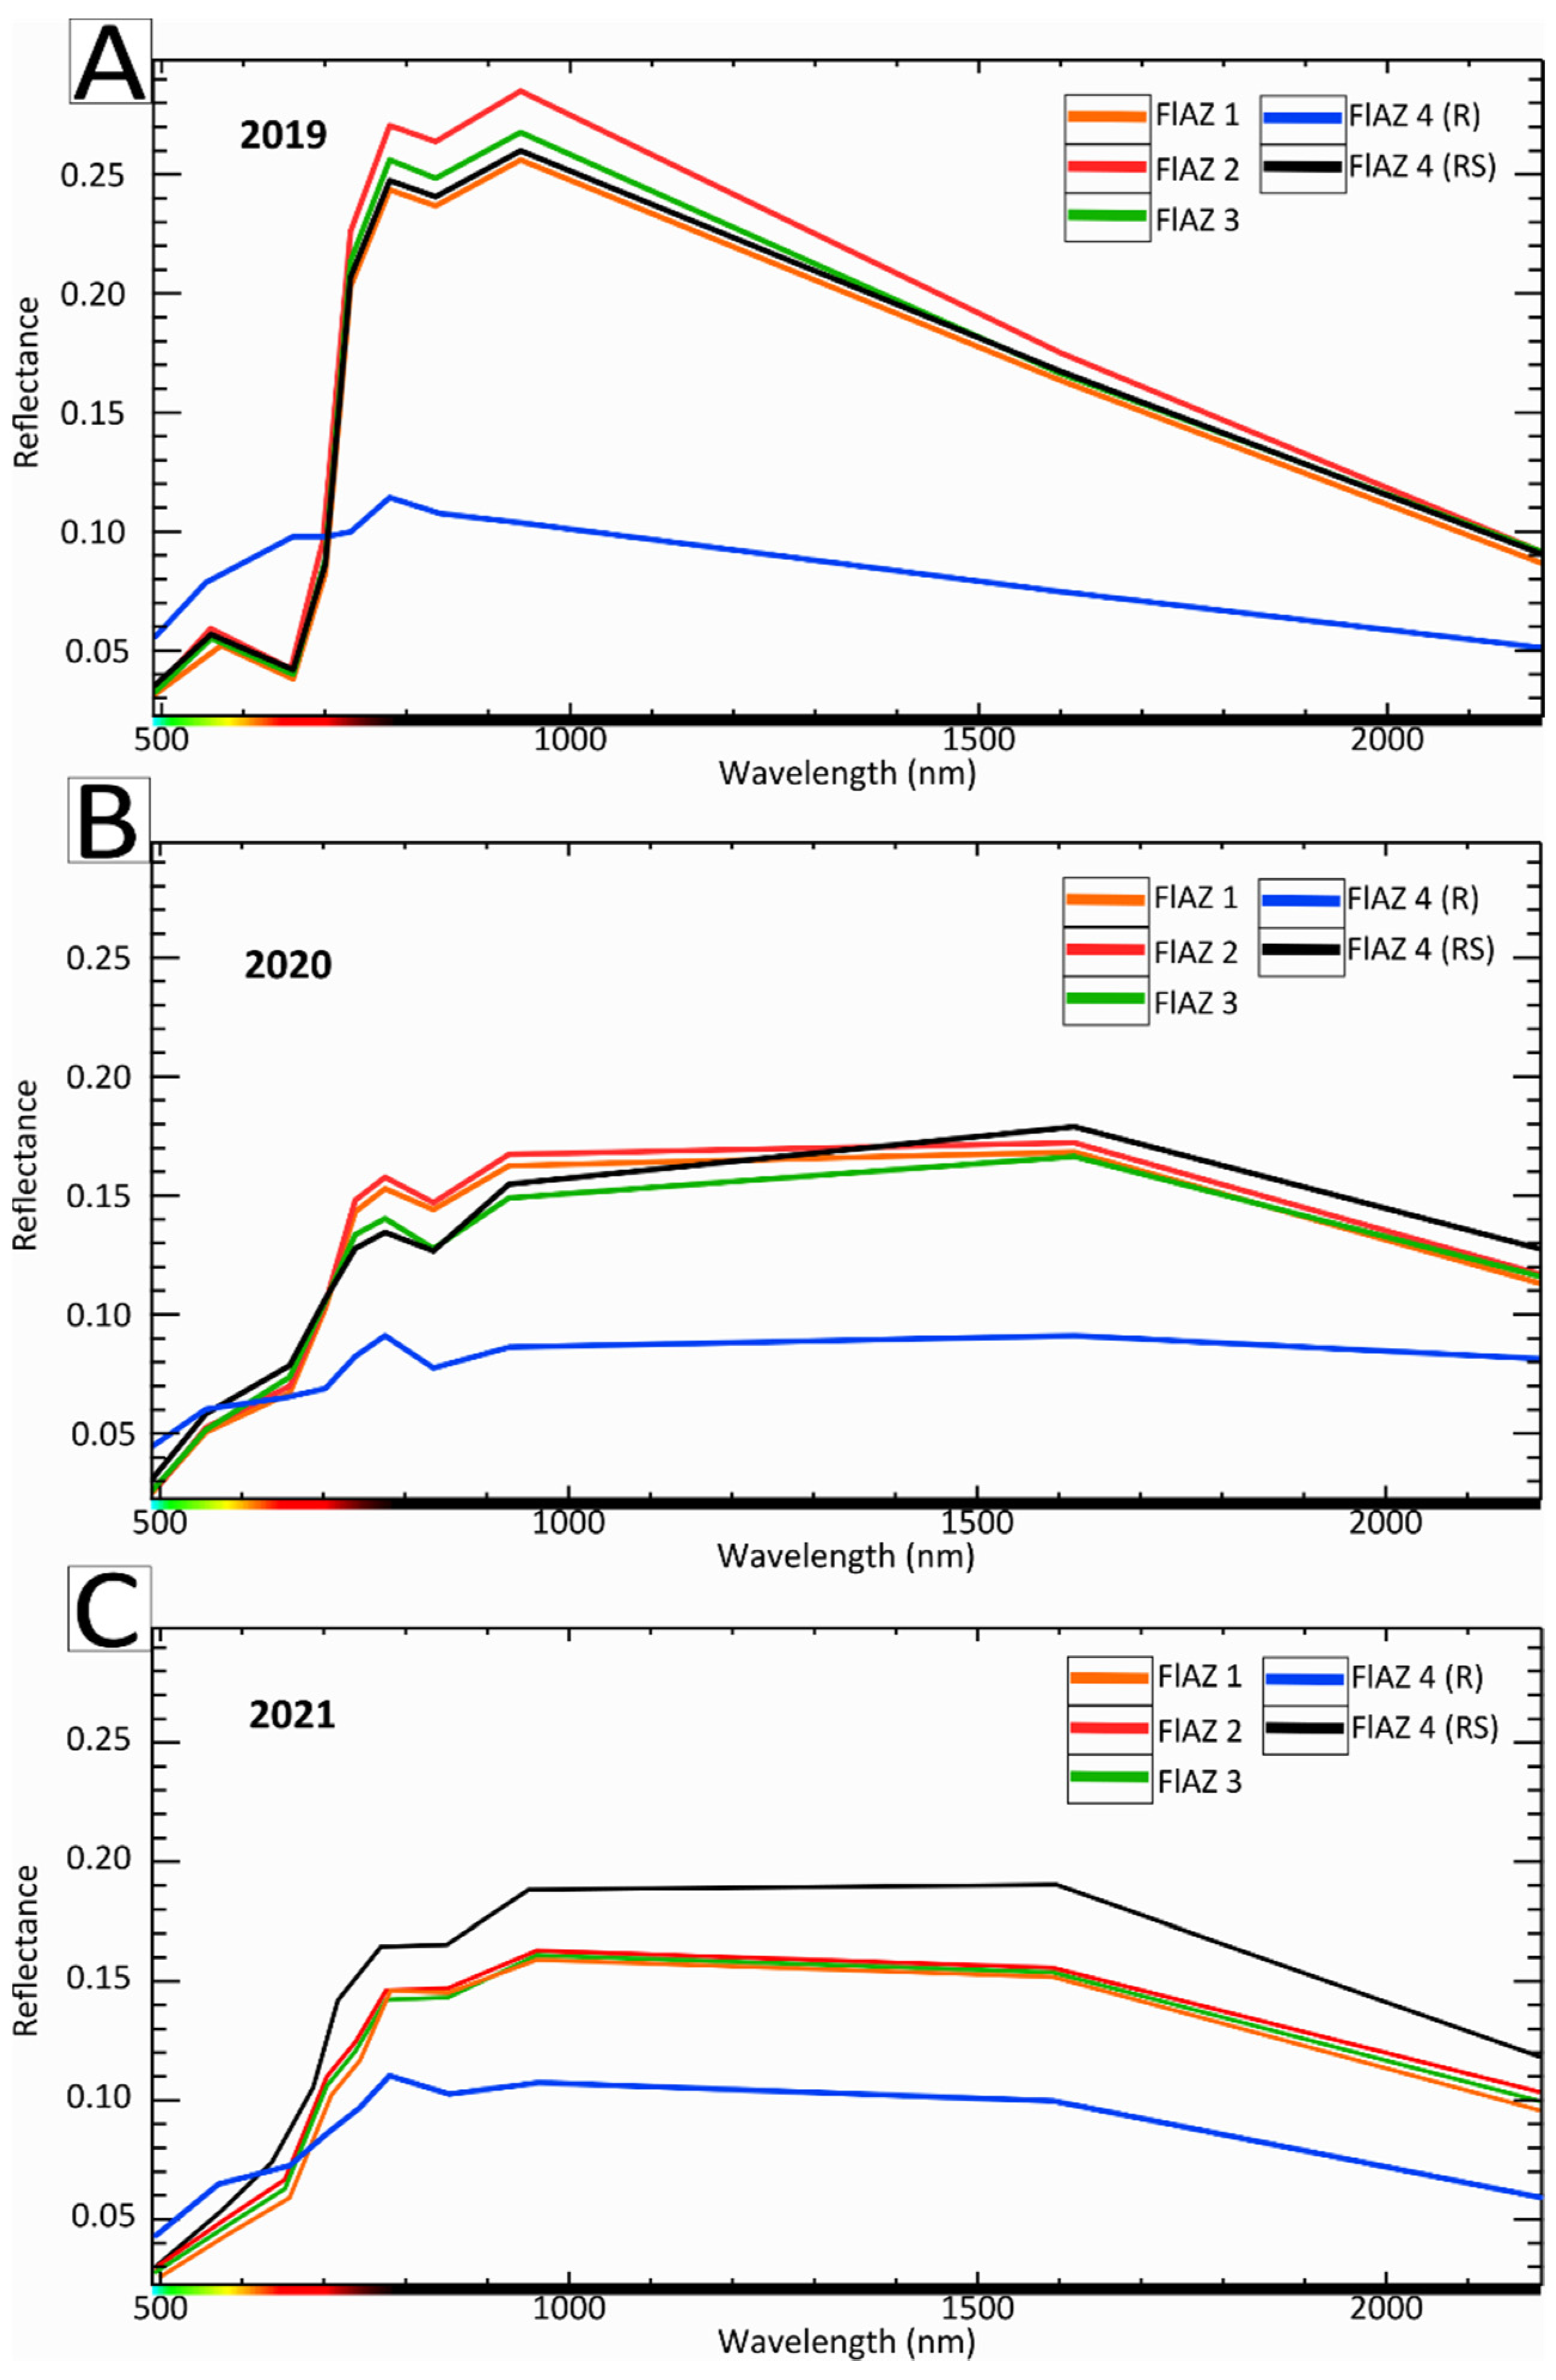
An RGB color composite map was produced, assigning the ferric oxides and hydroxides, vegetation, and water abundances, respectively red, green, and blue. This process was applied for post-event satellite images, using the same training dataset as before (i.e., pre-event image). In the RGB maps (Figure 4), the red-colored ferric oxides and hydroxides-zones allow for better highlighting of the shape of the flooded areas in 2020 and 2021 (post-event) images. In all the images, most of the considered area is covered by vegetation, but in the post-event periods (2020 and 2021), it is possible to observe a decreasing vegetative rate in flood-affected zones. Four zones have been identified as flood-affected zones where a clear change in the soil nature is noted. It is worth pointing out that areas 1, 2, and 3 in the top, center, and bottom of the flooded area were characterized by an increase in the abundance of ferric oxides and hydroxides. In the 4th area, it is possible to detect pixels changing in the riverbed (R) and riverside (RS). Figure 4 shows how in 2020 the affected area was distinguished by an increase in red pixels that are not present in 2019, while a decrease is observed in 2021. Figure 5 shows the mean spectral signatures of the flood-affected zones. The graphs are distinguished for the years 2019, 2020, and 2021, and shown respectively in red, black, green, blue, and orange. It has to be noted that the flood-affected 4th zone was divided into two mean spectra signatures obtained by the riverbed (R) and riverside (RS) features.
In 2019 (Figure 5A), in the Flood-affected zones 1,2,3, and RS, the spectra are characterized by a visible absorption band of about 0.56 µm, corresponding to the chlorophyll peak [51] and evidencing healthier vegetation. The R spectrum was similar to the water signature with absorption from the mid-infrared region forward. After the flood event, 2020 and 2021 spectra change. In particular, in 2020 (Figure 5B), it is possible to note the main spectral absorption ~0.84 µm in the VNIR region characteristic of the ferric oxides and hydroxides [10] that decrease in 2021 (Figure 5C). Figure 5B,C show in blue that the spectral signature achieved in 2020 and 2021 corresponded to the riverbed area, where it is possible to note light absorption in the VNIR region characteristic of the ferric oxides and hydroxides, and an increase in SWIR domains.

6. Discussion

As reported by [3], the Brumadinho flood that occurred in January 2019 resulted in a massive loss of local vegetation and agricultural areas comprising 49% and 24% of the areas most affected by the floods. The dam failure provoked fatalities and infrastructure damage, as well as considerable environmental aftermaths, all of which are still present. This paper aimed to use the potential of multispectral Sentinel-2 data (MSI) to map the flood-affected zones one and two years after the disaster to remotely detect possible signatures still existing in the area. The Spectral Unmixing tool, using the different spectral responses of each material, allowed us to identify areas, called Flood-affected zones, where the ferric oxide and hydroxide signatures were observed.
Satellite Multispectral data have been recently used [52] for studying the Brumadinho dam collapse. Syifa et al. [52], by using artificial intelligence techniques based on the Landsat-8 and Sentinel-2 scenes, defined the pixel classification for the pre-and post-dam failure. The maps produced by using satellite data [52] allowed to divide the study area into seven and five classes, respectively, from the Landsat-8 and the Sentinel-2. [52] used the artificial intelligence classification to differentiate the flood area from other land cover types that could be negatively influenced by the input source data. Differing from [52], we considered for our study a longer time interval (2019, 2020, 2021), and we used the specific spectral signatures of exposed materials (Figure 5). With this study, four areas were selected within the mining district, based on the ferric oxide and hydroxide impacts. Considering that the images were acquired in January, August, and July, the general decrease of the vegetation cover in the district from 2019 to 2021 could be associated with the seasons. However, the influence of ferric oxides and hydroxides related to the dam collapse does not depend on the seasonal vegetation rate.
Figure 5 displays the mean spectral signatures, extracted in the selected zones, as a function of the wavelength band of the satellite. It is possible to notice that one year after the dam failure, the influence of ferric oxides and hydroxides is well defined in all the spectra (Figure 5B), where it is possible to note the ferric oxides and hydroxides absorption feature centered in 833 nm. In 2021, the ferric oxide and hydroxide impact continues to be highlighted by a weak absorption. Spectra collected in the riverbed (Figure 5A) are characterized by spectral properties which may be associated with water turbidity in the visible region. According to [53], the effects of turbidity, due to suspended particles in surface waters, occur in the band range between 700 and 800 nm. Indeed, in 2019, it is possible to note a reflectance maximum at the same wavelength values, diagnostic of turbidity, while in 2020 and 2021 the ferric oxides and hydroxides absorption is notable (Figure 5B,C), suggesting that waste material still occurs in the river. According to [54], the clay minerals in soils show diagnostic absorption features in the shortwave-infrared domain (SWIR), and their reflectance spectra exhibit OH-H2O-related absorptions approximately around 1400 nm and 1900 nm, and Al-OH absorption near 2200 nm, the latter covered by Sentinel-2 in band 12 (2100–2280 nm) [55]. In Figure 5, the signatures obtained in 2020 and 2021 show a spectral absorption feature in the SWIR region, which may be related to clay minerals occurring in the waste material. Indeed, the latter could be associated with the presence of kaolinite composing the silty-clayey fractions of the tailing dam material that after the failure moved in the flood and affected the surrounding areas. This observation is consistent with the mineralogical and geochemical composition of the tailing dam materials, discussed in previous studies on the Córrego do Feijão mine [1] and other tailing dams in the Quadrilatero Ferrifero area (e.g., Fundão Dam, Samarco mining company) [42,43]. According to Almeida et al. [42], hematite occurs as the main phase in the mine waste of the Fundão Dam, followed by goethite, kaolinite, and gibbsite, in line with Vergilio et al. [1], who observed Fe concentrations up to 26.5 wt% and Al up to 1.1 wt% for the fine waste material of the Córrego do Feijão mine. As Sentinel 2 cannot accurately detect the clay mineral content due to the low spectral resolution in the SWIR region, it did not allow us to make use of this observation to produce specific clay distribution maps.

7. Conclusions

In this paper, a multispectral approach was used to determine affected areas by the flood generated after the Brumadinho dam collapsed, which, in 2019, caused the release of tons of toxic sludge, flooding an area of around 5 km2 and affecting the water quality of the Paraopeba River, a major tributary of the São Francisco River. The spectral analysis allowed us to characterize and highlight the flood-affected zones, as the materials released show a spectral behavior comparable to ferric oxides and hydroxides, which are well described by the VNIR bands of the Sentinel-2 Multispectral instrument. By using the Spectral Unmixing tool, the absorption features of the mining products, vegetation, and water were recognized, and land cover maps were produced.
The methodology uses a linear approach to obtain the relative abundance of each material considered. The results achieved were displayed through RGB composite maps which were useful, on the one hand, for quickly detecting the flood-affected zones where the ferric oxides and hydroxides spectra proprieties were noticed; on the other hand, it allowed for evaluating the long-term spectral variations to investigate the temporal evolution of soils after the event.
The method based on multispectral bands of the Sentinel-2 data has proved to be an extremely useful tool for mapping flooded areas. In addition, it allows for obtaining significant information deemed potentially useful for monitoring lands affected by floods related to tailing dam collapse and planning post activities management. To support the study and better examine the environmental impact as essentially as possible, it might be necessary to carry out soil sampling of the flood-affected zones.

Author Contributions

Conceptualization, L.A. and R.C.; methodology, L.A.; software, L.A.; validation, L.A. and R.C.; writing L.A. and R.C.; writing—review and editing, N.M. and D.D.M. Supervision, N.M. Project administration, N.M. All authors have read and agreed to the published version of the manuscript.

Funding

The work was funded by two Ph.D. scholarship: Regional Operational Program (POR) Campania, Italy, financed by the European Social Fund (ESF) 2014–2020, the program operates within the Strategia Europa 2020 strategy framework; Complementary Operational Program (POC) “Research and Innovation 2014–2020”, co-financed by the Italian Ministry of University and Research and European Social Fund (ESF) 2014–2020. Scientific Responsible: Nicola Mondillo.

Institutional Review Board Statement

Not applicable.

Informed Consent Statement

Not applicable.

Conflicts of Interest

The authors declare no conflict of interest.

References

  1. dos Santos Vergilio, C.; Lacerda, D.; de Oliveira, B.C.V.; Sartori, E.; Campos, G.M.; de Souza Pereira, A.L.; de Aguiar, D.B.; da Silva Souza, T.; de Almeida, M.G.; Thompson, F.; et al. Metal Concentrations and Biological Effects from One of the Largest Mining Disasters in the World (Brumadinho, Minas Gerais, Brazil). Sci. Rep. 2020, 10, 5936. [Google Scholar] [CrossRef] [PubMed]
  2. Thompson, F.; de Oliveira, B.C.; Cordeiro, M.C.; Masi, B.P.; Rangel, T.P.; Paz, P.; Freitas, T.; Lopes, G.; Silva, B.S.; Cabral, A.S.; et al. Severe Impacts of the Brumadinho Dam Failure (Minas Gerais, Brazil) on the Water Quality of the Paraopeba River. Sci. Total Environ. 2020, 705, 135914. [Google Scholar] [CrossRef]
  3. Silva Rotta, L.H.; Alcântara, E.; Park, E.; Negri, R.G.; Lin, Y.N.; Bernardo, N.; Mendes, T.S.G.; Souza Filho, C.R. The 2019 Brumadinho Tailings Dam Collapse: Possible Cause and Impacts of the Worst Human and Environmental Disaster in Brazil. Int. J. Appl. Earth Obs. Geoinf. 2020, 90, 102119. [Google Scholar] [CrossRef]
  4. Agência Nacional de Águas; Companhia de Saneamento de Minas Gerais; Serviço Geológico do Brasil; Instituto Mineiro de Gestão das Águas. Informativo N° 32-Informativo Diário Dos Parâmetros de Qualidade Das Águas Nos Locais Monitorados Ao Longo Do Rio Paraopeba, Após o Desastre Na Barragem B1 No Complexo Da Mina Córrego Feijão Da Mineradora Vale/SA de Brumadinho-Minas Gerais. 2019. Available online: http://www.repositorioigam.meioambiente.mg.gov.br/handle/123456789/2971 (accessed on 11 January 2022).
  5. Furlan, J.P.R.; dos Santos, L.D.R.; Moretto, J.A.S.; Ramos, M.S.; Gallo, I.F.L.; de Assis Dias Alves, G.; Paulelli, A.C.; de Souza Rocha, C.C.; Cesila, C.A.; Gallimberti, M.; et al. Occurrence and Abundance of Clinically Relevant Antimicrobial Resistance Genes in Environmental Samples after the Brumadinho Dam Disaster, Brazil. Sci. Total Environ. 2020, 726, 138100. [Google Scholar] [CrossRef] [PubMed]
  6. Du, Z.; Ge, L.; Ng, A.H.-M.; Zhu, Q.; Horgan, F.G.; Zhang, Q. Risk Assessment for Tailings Dams in Brumadinho of Brazil Using InSAR Time Series Approach. Sci. Total Environ. 2020, 717, 137125. [Google Scholar] [CrossRef] [PubMed]
  7. Holden, D.; Donegan, S.; Pon, A.; Dight, P.M. Brumadinho Dam InSAR Study: Analysis of TerraSAR-X, COSMO-SkyMed and Sentinel-1 Images Preceding the Collapse; Australian Centre for Geomechanics: Crawley, Australia, 2020; pp. 293–306. [Google Scholar]
  8. Ammirati, L.; Mondillo, N.; Calcaterra, D.; Di Martire, D. Sentinel-1 Data for Monitoring a Pre-Failure Event of Tailings Dam. In European Workshop on Structural Health Monitoring; Rizzo, P., Milazzo, A., Eds.; Springer International Publishing: Cham, Switzerland, 2021; pp. 140–148. [Google Scholar]
  9. van der Meer, F.D.; van der Werff, H.M.A.; van Ruitenbeek, F.J.A.; Hecker, C.A.; Bakker, W.H.; Noomen, M.F.; van der Meijde, M.; Carranza, E.J.M.; de Smeth, J.B.; Woldai, T. Multi- and Hyperspectral Geologic Remote Sensing: A Review. International J. Appl. Earth Obs. Geoinf. 2012, 14, 112–128. [Google Scholar] [CrossRef]
  10. van der Meer, F.D.; van der Werff, H.M.A.; van Ruitenbeek, F.J.A. Potential of ESA’s Sentinel-2 for Geological Applications. Remote Sens. Environ. 2014, 148, 124–133. [Google Scholar] [CrossRef]
  11. Gläßer, C.; Reinartz, P. Multitemporal and Multispectral Remote Sensing Approach for Flood Detection in the Elbe-Mulde Region 2002. Acta Hydrochim. Et Hydrobiol. 2005, 33, 395–403. [Google Scholar] [CrossRef]
  12. Aamir, M.; Ali, T.; Irfan, M.; Shaf, A.; Azam, M.Z.; Glowacz, A.; Brumercik, F.; Glowacz, W.; Alqhtani, S.; Rahman, S. Natural Disasters Intensity Analysis and Classification Based on Multispectral Images Using Multi-Layered Deep Convolutional Neural Network. Sensors 2021, 21, 2648. [Google Scholar] [CrossRef] [PubMed]
  13. Sharma, V.K.; Azad, R.K.; Chowdary, V.M.; Jha, C.S. Delineation of Frequently Flooded Areas Using Remote Sensing: A Case Study in Part of Indo-Gangetic Basin. In Geospatial Technologies for Land and Water Resources Management; Pandey, A., Chowdary, V.M., Behera, M.D., Singh, V.P., Eds.; Water Science and Technology Library; Springer International Publishing: Cham, Switzerland, 2022; pp. 505–530. ISBN 978-3-030-90479-1. [Google Scholar]
  14. Yan, D.; Zhang, H.; Li, G.; Li, X.; Lei, H.; Lu, K.; Zhang, L.; Zhu, F. Improved Method to Detect the Tailings Ponds from Multispectral Remote Sensing Images Based on Faster R-CNN and Transfer Learning. Remote Sens. 2022, 14, 103. [Google Scholar] [CrossRef]
  15. Kasmaeeyazdi, S.; Braga, R.; Tinti, F.; Mandanici, E. Mapping Bauxite Mining Residues Using Remote Sensing Techniques. Mater. Proc. 2022, 5, 91. [Google Scholar] [CrossRef]
  16. European Space Agency. Sentinel-2 User Handbook; European Space Agency: Paris, France, 2015; Volume 1, pp. 1–64. [Google Scholar]
  17. Ge, W.; Cheng, Q.; Jing, L.; Wang, F.; Zhao, M.; Ding, H. Assessment of the Capability of Sentinel-2 Imagery for Iron-Bearing Minerals Mapping: A Case Study in the Cuprite Area, Nevada. Remote Sens. 2020, 12, 3028. [Google Scholar] [CrossRef]
  18. Van der Werff, H.; Van der Meer, F. Sentinel-2 for Mapping Iron Absorption Feature Parameters. Remote Sens. 2015, 7, 12635–12653. [Google Scholar] [CrossRef] [Green Version]
  19. Mielke, C.; Boesche, N.K.; Rogass, C.; Kaufmann, H.; Gauert, C.; De Wit, M. Spaceborne Mine Waste Mineralogy Monitoring in South Africa, Applications for Modern Push-Broom Missions: Hyperion/OLI and EnMAP/Sentinel-2. Remote Sens. 2014, 6, 6790–6816. [Google Scholar] [CrossRef] [Green Version]
  20. Cudahy, T.J.; Ramanaidou, E.R. Measurement of the Hematite:Goethite Ratio Using Field Visible and Near-infrared Reflectance Spectrometry in Channel Iron Deposits, Western Australia. Aust. J. Earth Sci. 1997, 44, 411–420. [Google Scholar] [CrossRef]
  21. Crowley, J.K.; Williams, D.E.; Hammarstrom, J.M.; Piatak, N.; Chou, I.-M.; Mars, J.C. Spectral Reflectance Properties (0.4–2.5 Μm) of Secondary Fe-Oxide, Fe-Hydroxide, and Fe-Sulphate-Hydrate Minerals Associated with Sulphide-Bearing Mine Wastes. Geochem. Explor. Environ. Anal. 2003, 3, 219–228. [Google Scholar] [CrossRef]
  22. Hensler, A.-S.; Hagemann, S.G.; Rosière, C.A.; Angerer, T.; Gilbert, S. Hydrothermal and Metamorphic Fluid-Rock Interaction Associated with Hypogene “Hard” Iron Ore Mineralisation in the Quadrilátero Ferrífero, Brazil: Implications from in-Situ Laser Ablation ICP-MS Iron Oxide Chemistry. Ore Geol. Rev. 2015, 69, 325–351. [Google Scholar] [CrossRef]
  23. Dorr, J.V.N. Physiographic, Stratigraphic, and Structural Development of the Quadrilatero Ferrifero, Minas Gerais, Brazil. Available online: https://pubs.er.usgs.gov/publication/pp641A (accessed on 11 January 2022).
  24. Chemale, F.; Rosière, C.A.; Endo, I. The Tectonic Evolution of the Quadrilátero Ferrífero, Minas Gerais, Brazil. Precambr. Res. 1994, 65, 25–54. [Google Scholar] [CrossRef]
  25. Hensler, A.-S.; Rosière, C.A.; Hagemann, S.G. Iron Oxide Mineralization at the Contact Zone Between Phyllite and Itabirite of the Pau Branco Deposit, Quadrilátero Ferrífero, Brazil—Implications for Fluid-Rock Interaction during Iron Ore Formation. Econ. Geol. 2017, 112, 941–982. [Google Scholar] [CrossRef]
  26. Guimarães, D. Contribuição Ao Estudo Da Origem Dos Depositos de Minerio de Ferro e Manganez Do Centro de Minas Geraes. 1935. Available online: https://catalog.lib.uchicago.edu/vufind/Record/4095137 (accessed on 11 January 2022).
  27. Alkmim, F.F.; Marshak, S. Transamazonian Orogeny in the Southern São Francisco Craton Region, Minas Gerais, Brazil: Evidence for Paleoproterozoic Collision and Collapse in the Quadrilátero Ferrífero. Precambr. Res. 1998, 90, 29–58. [Google Scholar] [CrossRef]
  28. Klein, C.; Ladeira, E.A. Geochemistry and Petrology of Some Proterozoic Banded Iron-Formations of the Quadrilátero Ferrífero, Minas Gerais, Brazil. Econ. Geol. 2000, 95, 405–427. [Google Scholar] [CrossRef]
  29. Cabral, A.R.; Zeh, A.; Koglin, N.; Gomes, A.A.S., Jr.; Viana, D.J.; Lehmann, B. Dating the Itabira Iron Formation, Quadrilátero Ferrífero of Minas Gerais, Brazil, at 2.65 Ga: Depositional U–Pb Age of Zircon from a Metavolcanic Layer. Precambr. Res. 2012, 204, 40–45. [Google Scholar] [CrossRef]
  30. Rosiere, C.A.; Chemale, F. Genesis of Banded Iron-Formations; Discussion. Econ. Geol. 1996, 91, 466–468. [Google Scholar] [CrossRef]
  31. Baltazar, O.F.; Zucchetti, M. Lithofacies Associations and Structural Evolution of the Archean Rio Das Velhas Greenstone Belt, Quadrilátero Ferrífero, Brazil: A Review of the Setting of Gold Deposits. Ore Geol. Rev. 2007, 32, 471–499. [Google Scholar] [CrossRef]
  32. Herz, N. Metamorphic Rocks of the Quadrilatero Ferrifero, Minas Gerais, Brazil. 1978. Available online: https://pubs.er.usgs.gov/publication/pp641C (accessed on 11 January 2022).
  33. Renger, F.E.; Noce, C.M.; Romano, A.W.; Machado, N. Evolução Sedimentar Do Supergrupo Minas: 500 MA. De Registro Geológico No Quadrilátero Ferrífero, Minas Gerais, Brasil. Geonomos 1994, 2, 1–11. [Google Scholar] [CrossRef]
  34. Pires, F. Textural and Mineralogical Variations during Metamosphism of the Proterozoic Itabira Iron Formation in the Quadrilatero Ferrifero, Minas Gerais, Brazil. An. Acad. Bras. Ciências 1995, 67, 77–106. [Google Scholar]
  35. Babinski, M.; Chemale, F.; Van Schmus, W.R. The Pb/Pb Age of the Minas Supergroup Carbonate Rocks, Quadrilátero Ferrífero, Brazil. Precambr. Res. 1995, 72, 235–245. [Google Scholar] [CrossRef]
  36. Lüders, V.; Romer, R.L.; Cabral, A.R.; Schmidt, C.; Banks, D.A.; Schneider, J. Genesis of Itabirite-Hosted Au–Pd–Pt-Bearing Hematite-(Quartz) Veins, Quadrilátero Ferrífero, Minas Gerais, Brazil: Constraints from Fluid Inclusion Infrared Microthermometry, Bulk Crush-Leach Analysis and U–Pb Systematics. Min. Depos. 2005, 40, 289–306. [Google Scholar] [CrossRef]
  37. Spier, C.A.; de Oliveira, S.M.B.; Rosière, C.A. Geology and Geochemistry of the Águas Claras and Pico Iron Mines, Quadrilátero Ferrífero, Minas Gerais, Brazil. Min. Depos. 2003, 38, 751–774. [Google Scholar] [CrossRef]
  38. Rosière, C.A.; Spier, C.A.; Rios, F.J.; Suckau, V.E. The Itabirites of the Quádrilátero Ferrífero and Related High-Grade Iron Ore Deposits: An Overview; Society of Economic Geologists: Littleton, CO, USA, 2008. [Google Scholar] [CrossRef]
  39. Guild, P.W. Iron Deposits of the Congonhas District, Minas Gerais, Brazil. Econ. Geol. 1953, 48, 639–676. [Google Scholar] [CrossRef]
  40. Kossoff, D.; Dubbin, W.E.; Alfredsson, M.; Edwards, S.J.; Macklin, M.G.; Hudson-Edwards, K.A. Mine Tailings Dams: Characteristics, Failure, Environmental Impacts, and Remediation. Appl. Geochem. 2014, 51, 229–245. [Google Scholar] [CrossRef] [Green Version]
  41. Vick, S.G. Planning, Design, and Analysis of Tailings Dams. Available online: https://open.library.ubc.ca/soa/cIRcle/collections/ubccommunityandpartnerspublicati/52387/items/1.0394902 (accessed on 11 January 2022).
  42. Almeida, C.A.; de Oliveira, A.F.; Pacheco, A.A.; Lopes, R.P.; Neves, A.A.; Lopes Ribeiro de Queiroz, M.E. Characterization and Evaluation of Sorption Potential of the Iron Mine Waste after Samarco Dam Disaster in Doce River Basin–Brazil. Chemosphere 2018, 209, 411–420. [Google Scholar] [CrossRef] [PubMed]
  43. de Souza, A.H.; von Krüger, F.L.; da Silva Araújo, F.G.; Mendes, J.J. Mineralogical Characterization Applied to Iron Ore Tailings from the Desliming Stage with Emphasis on Quantitative Electron Microscopy (QEM). Mat. Res. 2021, 24. [Google Scholar] [CrossRef]
  44. SNAP-Earth Online. Available online: https://earth.esa.int/eogateway/tools/snap (accessed on 1 March 2022).
  45. Keshava, N.; Mustard, J.F. Spectral Unmixing. IEEE Signal Process. Mag. 2002, 19, 44–57. [Google Scholar] [CrossRef]
  46. Doxaran, D.; Froidefond, J.-M.; Lavender, S.; Castaing, P. Spectral Signature of Highly Turbid Waters: Application with SPOT Data to Quantify Suspended Particulate Matter Concentrations. Remote Sens. Environ. 2002, 81, 149–161. [Google Scholar] [CrossRef]
  47. Adam, E.; Mutanga, O.; Rugege, D. Multispectral and Hyperspectral Remote Sensing for Identification and Mapping of Wetland Vegetation: A Review. Wetl. Ecol. Manag. 2010, 18, 281–296. [Google Scholar] [CrossRef]
  48. Curtiss, B. Evaluation of the Physical Properties of Naturally Occurring Iron (III) Oxyhydroxides on Rock Surfaces in Arid and Semi-Arid Regions Using Visible and Near Infrared Reflectance Spectroscopy. Ph.D. Thesis, University of Washington, Seattle, WA, USA, 1985. [Google Scholar]
  49. Scheinost, A.C.; Schulze, D.G.; Schwertmann, U. Diffuse Reflectance Spectra of A1 Substituted Goethite: A Ligand Field Approach. Clays Clay Miner. 1999, 47, 156–164. [Google Scholar] [CrossRef]
  50. Kokaly, R.F.; Clark, R.N.; Swayze, G.A.; Livo, K.E.; Hoefen, T.M.; Pearson, N.C.; Wise, R.A.; Benzel, W.M.; Lowers, H.A.; Driscoll, R.L.; et al. USGS Spectral Library Version 7; Data Series; U.S. Geological Survey: Reston, VA, USA, 2017; Volume 1035, p. 68.
  51. Sanches, I.D.; Filho, C.R.S.; Kokaly, R. Spectroscopic Remote Sensing of Plant Stress at Leaf and Canopy Levels Using the Chlorophyll 680 Nm Absorption Feature with Continuum Removal. ISPRS J. Photogramm. Remote Sens. 2014, 97, 111–122. [Google Scholar] [CrossRef]
  52. Syifa, M.; Park, S.J.; Achmad, A.R.; Lee, C.-W.; Eom, J. Flood Mapping Using Remote Sensing Imagery and Artificial Intelligence Techniques: A Case Study in Brumadinho, Brazil. J. Coast. Res. 2019, 90, 197–204. [Google Scholar] [CrossRef]
  53. Gholizadeh, M.H.; Melesse, A.M.; Reddi, L. A Comprehensive Review on Water Quality Parameters Estimation Using Remote Sensing Techniques. Sensors 2016, 16, 1298. [Google Scholar] [CrossRef] [PubMed] [Green Version]
  54. Fang, Q.; Hong, H.; Zhao, L.; Kukolich, S.; Yin, K.; Wang, C. Visible and Near-Infrared Reflectance Spectroscopy for Investigating Soil Mineralogy: A Review. J. Spectrosc. 2018, 2018, e3168974. [Google Scholar] [CrossRef]
  55. Sekandari, M.; Masoumi, I.; Beiranvand Pour, A.; M Muslim, A.; Rahmani, O.; Hashim, M.; Zoheir, B.; Pradhan, B.; Misra, A.; Aminpour, S.M. Application of Landsat-8, Sentinel-2, ASTER and WorldView-3 Spectral Imagery for Exploration of Carbonate-Hosted Pb-Zn Deposits in the Central Iranian Terrane (CIT). Remote Sens. 2020, 12, 1239. [Google Scholar] [CrossRef] [Green Version]
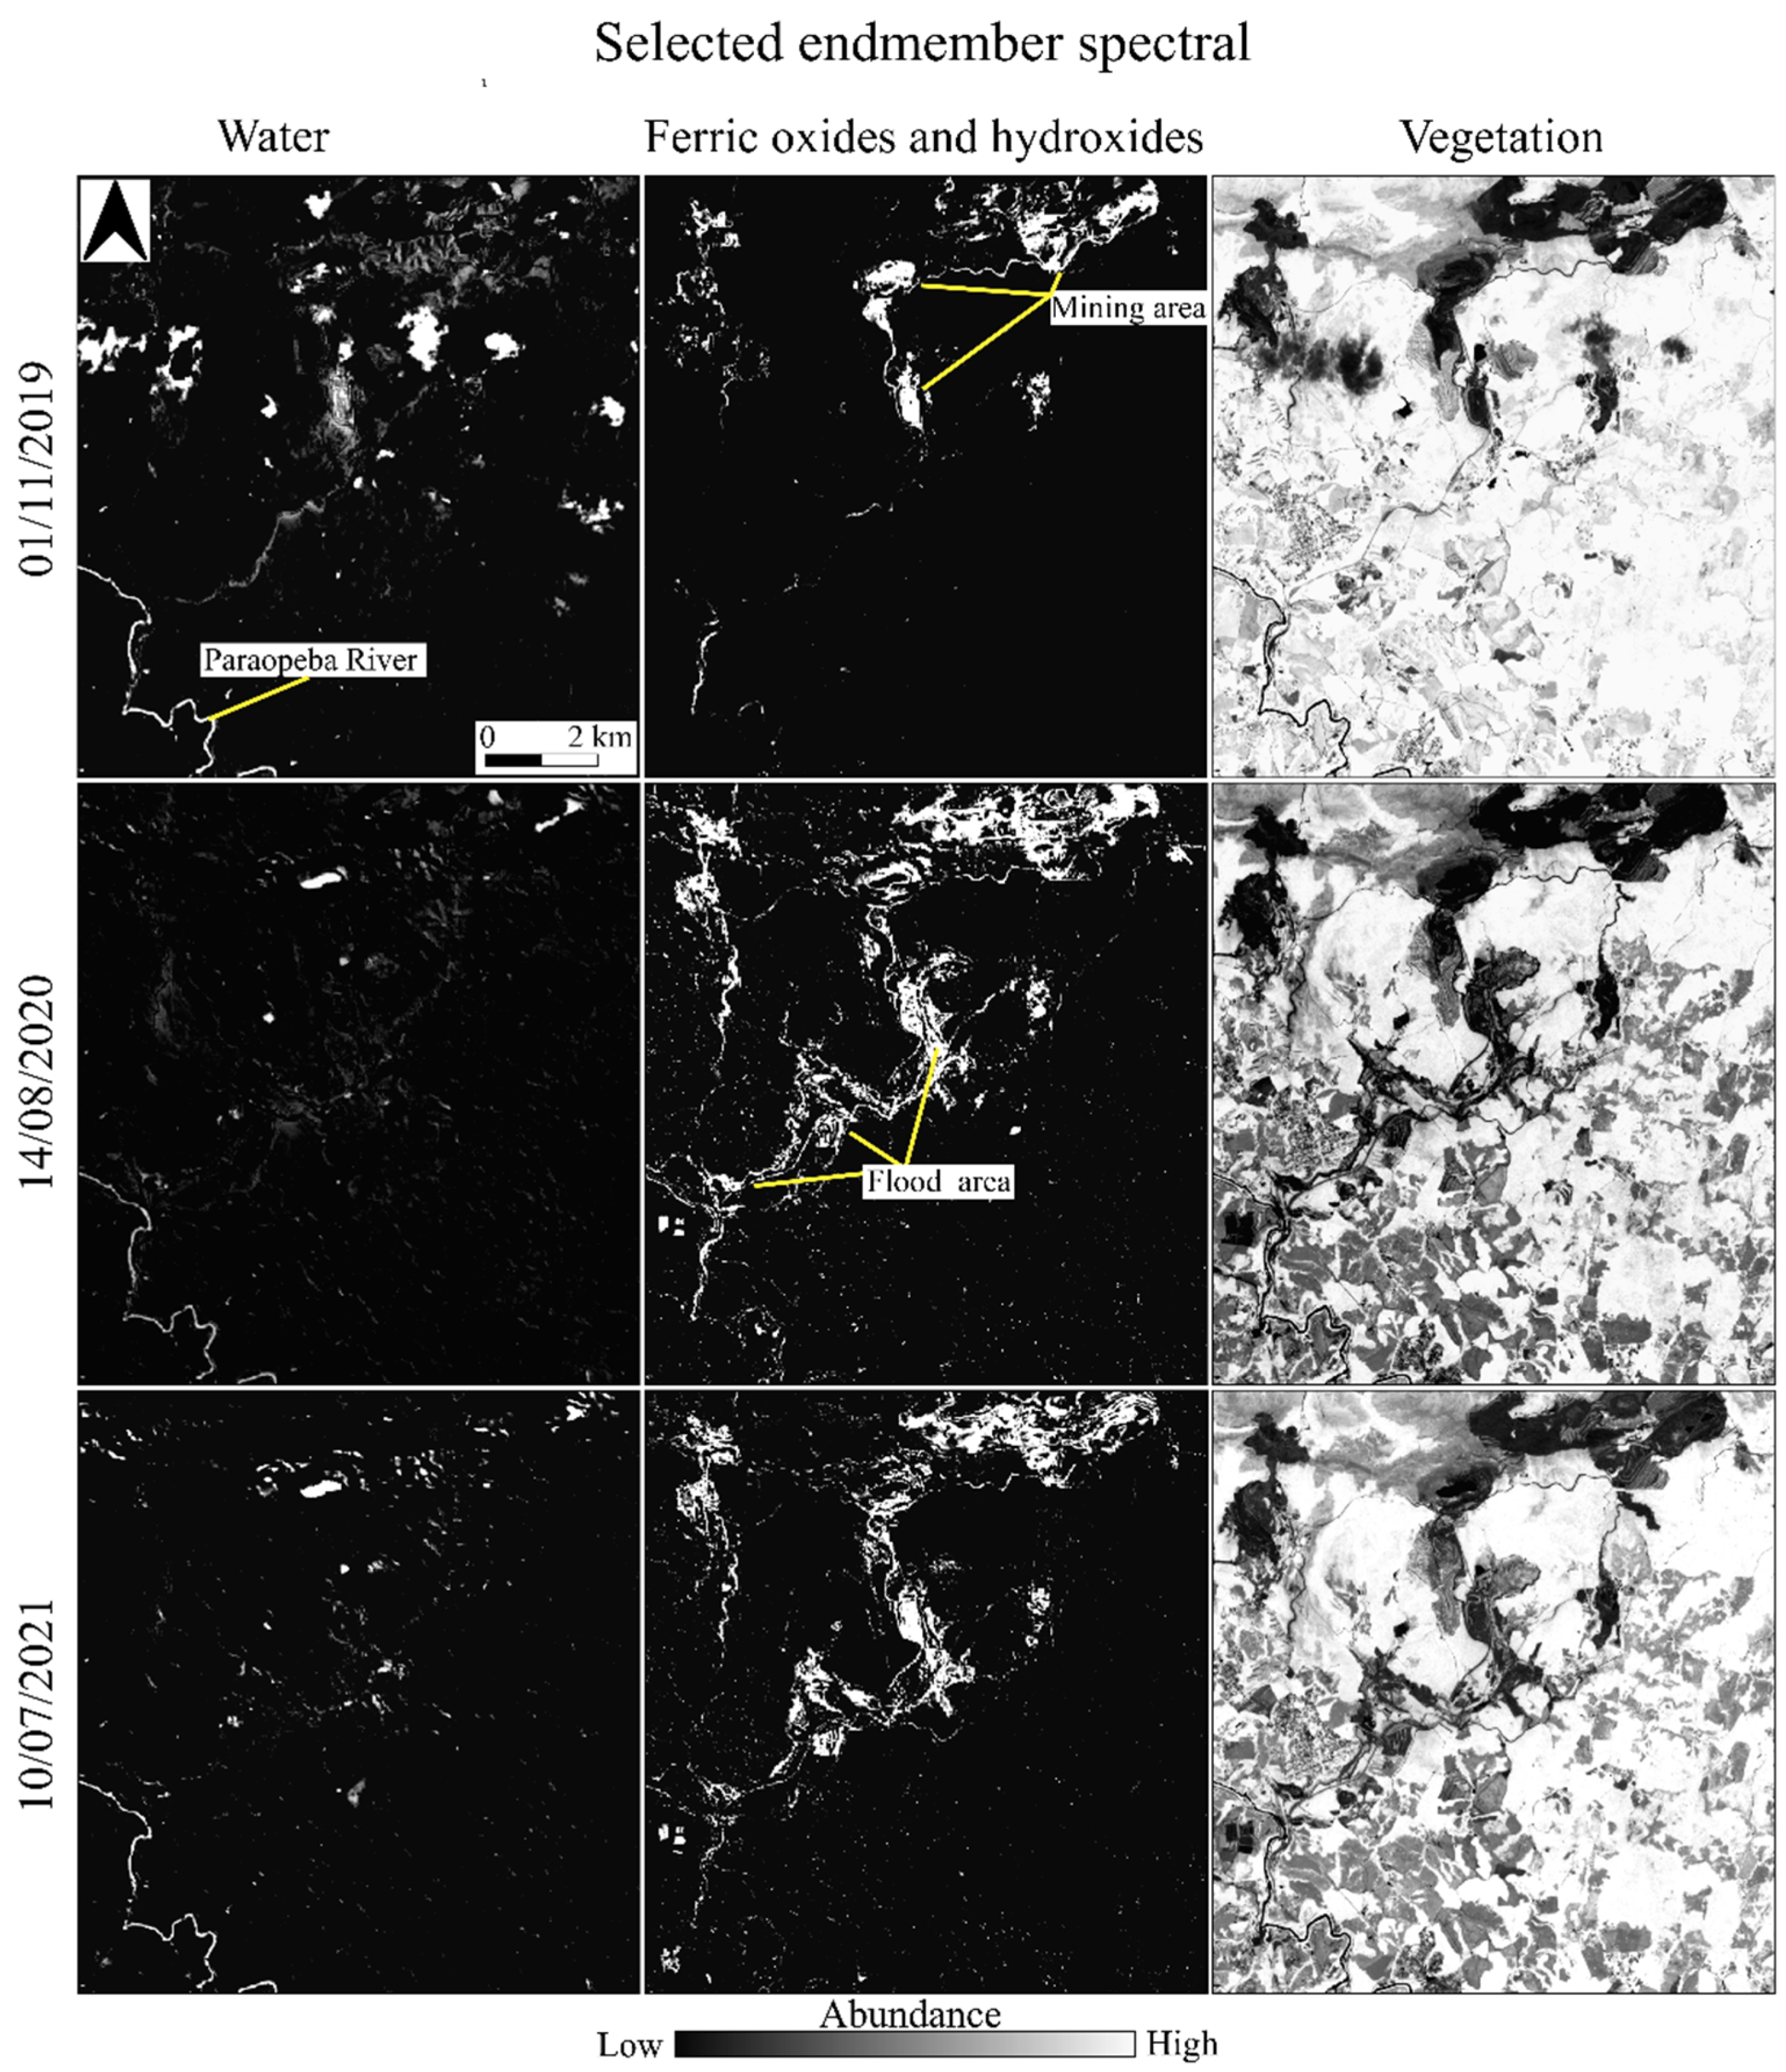
Figure 3. The relative abundance maps of water, ferric oxides and hydroxides, and vegetation endmembers, at different periods.
Remotesensing 14 01501 g003
Figure 4. The RGB true color on left, the RGB (ferric oxides and hydroxides, vegetation, water) composites with endmember abundances on right. The white boxes are the flood-affected zones selected.
Remotesensing 14 01501 g004
Figure 5. Mean spectral signatures obtained by flood-affected zones 1st, 2nd, 3rd and 4th (divided the riverbed (R) and riverside (RS) features) in 2019 (A), 2020 (B), 2021 (C).
Remotesensing 14 01501 g005
Publisher’s Note: MDPI stays neutral with regard to jurisdictional claims in published maps and institutional affiliations.