1. Introduction
Millimeter wave imaging technology is an imaging method based on electromagnetic radiation that has many advantages. Electromagnetic waves are non-ionizing and are less harmful to the human body than X-rays. They can penetrate various optically opaque obstacles, such as walls and clothing, to image targets. Millimeter wave imaging methods have attracted enormous attention in recent years, and are considered as a first choice in numerous applications, such as the detection of tumors [
1,
2,
3,
4] and dangerous goods [
5,
6,
7], through-wall imaging [
8,
9], and vital sign signal measurements [
10,
11]. Imaging systems based on synthetic aperture radar (SAR) [
12], inverse synthetic aperture radar [
13], phased array [
14], and MIMO systems [
15] have been widely studied. Furthermore, imaging algorithms such as back projection [
16,
17] and time reversal [
18,
19] have the advantage of high image quality. The resolution of an imaging system, given in Equation (1), is generally limited by the bandwidth
B, wavelength
λ, range
R, and the effective antenna aperture
Leff of the imaging system.
Imaging methods based on SAR or phased array systems rely on mechanical or electronic scanning to scan the space. Several imaging methods based on cavity–backed metasurface antennas have been proposed in [
20,
21,
22] to scan the space without mechanical or electronic scanning. For example, the antenna designed in [
20] provides low correlated radiation patterns at different frequencies, and scans the space by exciting each port alternately. Then, the sparse reconstruction method is applied to achieve imaging. Inconveniently, the acquisition of the dictionary used in the sparse reconstruction depends on the measurement. To improve the imaging resolution, a metasurface antenna with a larger aperture and bandwidth is still needed. Compared to common ultra-wideband antennas, it is more difficult to design this new type of antenna. This is because it not only requires high radiation efficiency, but also requires low correlated radiation patterns at different frequencies.
Similar to conventional methods, imaging systems based on metasurface antennas still need to convert the echo signals into digital signals. The development of ultra-wideband systems may be restricted by analog-to-digital converters (ADC). The sampling method based on compressed sensing can obtain desired digital signals at a lower sampling rate. However, it can prolong the observation time and requires a specific measurement framework [
23]. To reduce the sampling rate in an easy-to-implement way, we propose an imaging method based on coherent frequency diversity array (FDA) technology. The proposed method divides the system into multiple narrower channels, so it is easier to obtain mature hardware devices following the Nyquist–Shannon sampling theorem, which is also known as the Whittaker–Kotelnikov–Shannon sampling theorem.
In an FDA system, each array element adopts a different carrier frequency. When a linear frequency offset is used between the array elements, the system can scan the space without phase-shifters or rotating antennas [
24]. Additionally, elements in an FDA system radiate electromagnetic waves simultaneously instead of sequentially. Therefore, FDA systems can scan the space more conveniently. The beampattern of an FDA system with uniform inter-element spacing and linear frequency offset is coupled in the range and angle dimensions [
25]. As a result, the range and angle of a target cannot be unambiguously estimated using an FDA system with uniform inter-element spacing and linear frequency offset. Many methods have been proposed to decouple the beampattern of FDA systems in range and angle dimensions, which can be divided into the two most representative methods. The first one is utilizing non-linearly increasing frequency offsets in a ULA system. The other is utilizing linearly increasing frequency offsets in non-uniform array systems, such as the methods proposed in [
26,
27]. In this letter, we adopted the second type of method. The applied FDA system consists of a non-uniform planar array structure, and it employs linear increasing frequency offsets. The applied FDA system can still scan the space without the aid of phase-shifters or rotating antennas.
In the proposed method, we apply an FDA system with non-uniform array structure and linear increasing frequency offsets to scan the space. The received signal of each channel is first demodulated by the reference carrier frequency and then demodulated by each sub-carrier frequency. In other words, each ultra-wideband receive channel is split into multiple sub-channels. As a result, each sub-channel can convert analog signals to digital signals at a lower sampling rate. After the fast Fourier transform of each sub-channel, we perform matched filter processing in the frequency domain to obtain frequency-delay-dependent vectors. On the other hand, we discretize the scan space into a number of grid points and sequentially assume that there is a target at each grid point. Therefore, we can establish a dictionary composed of a series of frequency-delay-dependent vectors corresponding to each grid point. Then, we formulate a convex optimization problem with measured vectors and the prepared dictionary. It has been proven in [
28] that by converting the imaging problem into a convex optimization problem, a resolution that breaks the limit of (1) can be obtained. On this basis, some super-resolution imaging methods based on regularized sparse reconstruction have been proposed [
15,
29,
30,
31]. Based on the regularized
l1 norm constraints, we solve the formulated convex optimization problem with the fast iterative shrinkage threshold algorithm. As a result, super-resolution imaging is achieved. Compared with some existing imaging methods, the main advantages of the proposed method can be summarized as follows:
The sampling rate has been significantly reduced. Hence, the proposed imaging system reduces the requirements for analog-to-digital converters;
The sampling rate is reduced under the premise of following the Nyquist–Shannon sampling theorem, instead of using the compressed sensing sampling method. Therefore, the system structure is mature and easy to implement;
Elements with higher radiation efficiency can be achieved, because the working bandwidth of each transmitting element is only one Nth of the system bandwidth, where N represents the number of transmit elements;
The dictionary used in the reconstruction algorithm can be derived theoretically, and the accuracy can be guaranteed;
Mechanical or electronic scanning components can be economized.
Numerical simulation experiments verified the effectiveness of the proposed method. The proposed method provides a different idea for the development of ultra-wideband imaging systems. In what follows, [∙]T, [∙]*, and [∙]H denote transpose operator, conjugate operator, and conjugate transpose operator, respectively.
2. Proposed Imaging Method
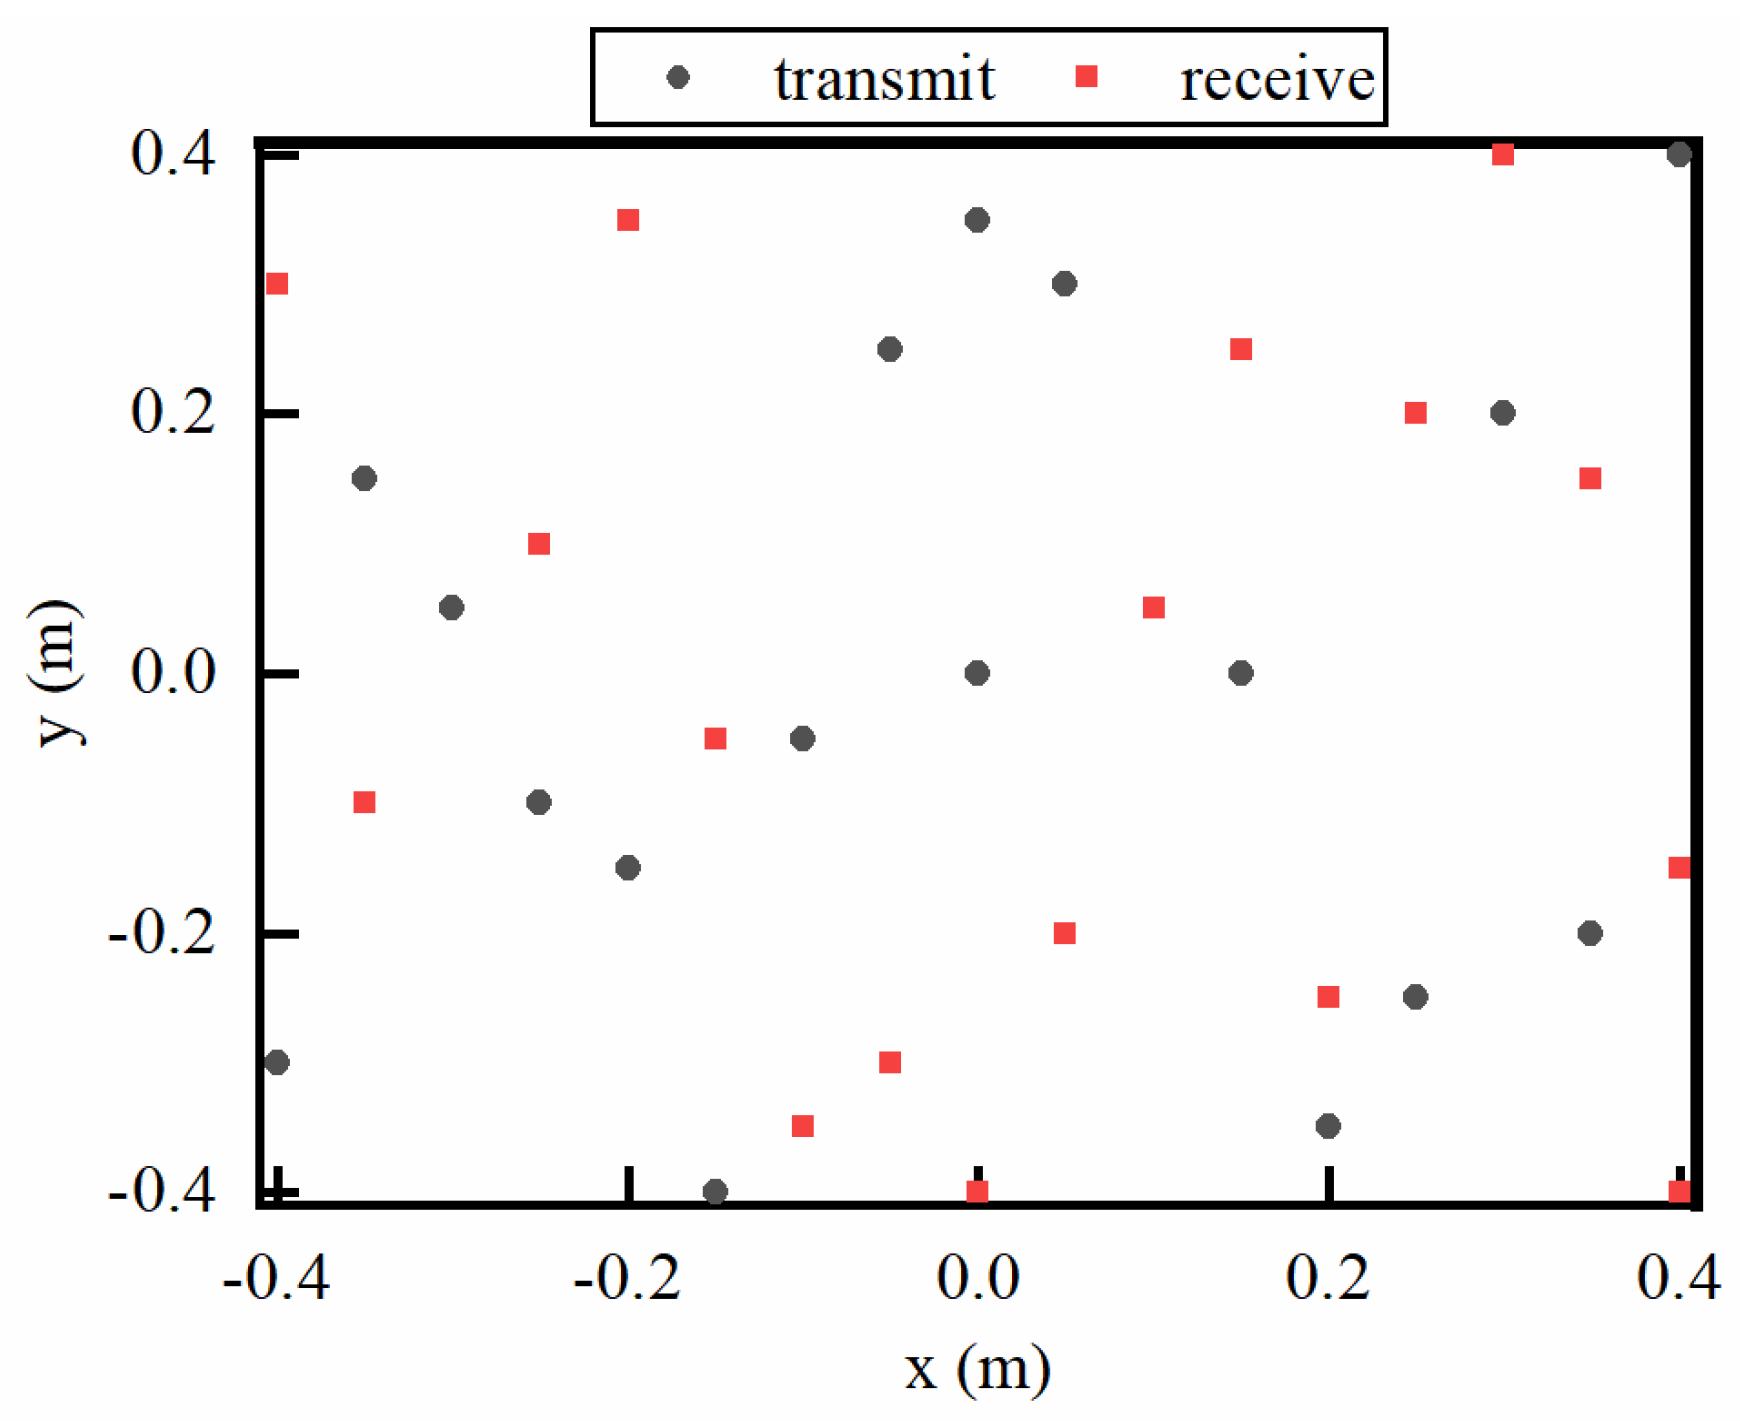
Let us consider an array system in the Cartesian coordinate system with
N transmitting elements and
M receiving elements (
N = 17,
M = 17). The coordinates of the
n-th element (
n = 1, 2, …,
N) and the
m-th element (
m = 1, 2, …,
M) are (
xn,
yn,
zn) and (
xm,
ym,
zm). More specifically, the array elements are randomly arranged in the
z = 0 plane. The minimum distance between two adjacent elements is ∆
xmin = ∆
ymin = 5 cm. The array structure of the imaging system is shown in
Figure 1 and the coordinates (
x,
y, 0) of each element are shown in
Table 1. The
z-axis direction represents the range direction, and the
x-axis and
y-axis denote the horizontal and vertical cross-range dimensions, respectively.
The carrier frequency of the
n-th element is:
fn =
f0 +
n∙∆
f, where
f0 is the reference carrier frequency and ∆
f is the frequency offset between adjacent elements. The transmitted signal of the
n-th element is:
where
g(
t) is a baseband signal with a bandwidth of
Bg. The system bandwidth is
B =
Bg + 2(
N − 1)∆
f. It can be seen that the working bandwidth of each transmitting array element is smaller than the system bandwidth. Therefore, an advantage can be achieved in the transmit end because an element with narrower bandwidth generally provides lower return loss and higher efficiency.
Assuming that targets have
K (
K > 1) scattering points, and the coordinates of the
k-th scattering point are (
xk,
yk,
zk), the echo signal received by the
m-th element can be expressed as:
where
n(
t) denotes additive white Gaussian noise.
τnk and
τmk respectively represent the time delay between element
n and element
m to the scattering point
k:
where
c represents the speed of light in free space. Xu et al. [
32] reported commonly used receiver architectures of FDA systems. We first pass the signal received by element
m through mixer
f0, and then pass the signal through
N sub-carrier mixers. The local oscillator frequency of sub-mixer
n is
n∆
f. When ∆
f >
Bg and the Doppler frequency shift is small, the signal transmitted by each element can be distinguished by sub-carrier mixing and low-pass filtering. Then, virtual aperture expansion can be achieved. If we denote the sub-mixer
n corresponding to the receiving element
m as channel
m-
n, then we obtain:
denotes a baseband signal with the bandwidth of
Bg. Therefore, the required sampling rate according to the Nyquist–Shannon sampling theorem is
. The fast Fourier transform (FFT) result of the sampled signal can be derived as:
where
G(
f) denotes FFT result of
g(
t) and
N(
f) denotes noise in frequency domain.
Conventional imaging systems usually use single carrier mode, that is, the carrier frequency is
f0. The bandwidth of the baseband signal after down conversion is equal to the system bandwidth
B. According to the Nyquist–Shannon sampling theorem, the sampling rate should be
fs = 2
B. It can be seen from Equation (8) that, compared with conventional imaging methods, the proposed method greatly reduces the required sampling rate.
The signal received by the
m-th element in the frequency domain can be written as:
The frequency domain signal after the virtual aperture expansion can be expressed as:
Then, the array steering vector of scattering point
k at frequency
f can be derived as:
The output of matched filters in frequency domain at
f can be derived as Equation (12). The output
y(
f) is an
MN by 1 column vector.
If we divide the imaging scene into
Q discrete points in space, a dictionary
DIC covering the entire imaging scene can be constructed according to the coordinates of discrete points and steering vectors shown in Equation (11).
Then, we can rewrite the output of matched filters at
f as:
where
h is a
Q by 1 column vector. If and only if the scattering point is located at (
xk,
yk,
zk),
h(
k) is a non-zero value that denotes the reflection coefficient of scattering point
k, and the other components are all zero. Then, the imaging problem of the system is transformed into solving a linear system as shown in Equation (14). However, Equation (14) is an underdetermined linear system with either no solution or infinitely many solutions. Normally, targets have only a limited number of strong scattering points. Therefore, when the imaging scene satisfies the sparsity condition, solving Equation (14) is equivalent to solving Equation (15) based on the
l0 norm constraint.
The problem described by Equation (15) is finding the sparse expansion of a signal from a redundant dictionary. When the applied MIMO radar system can unambiguously estimate target parameters, the sparse reconstruction results of Equation (15) represent the target parameters. Unfortunately, the problem shown in Equation (15) is an NP-hard problem. To solve this difficulty, Chen [
33] transformed it into a slightly different problem as shown in Equation (16). More specifically, the relaxation algorithm is applied to convert the
l0 norm constraint to the
l1 norm constraint.
Li [
34] points out that when the model contains noise, the constraints in Equation (16) are no longer applicable. As reported in [
34], in this case, the problem in Equation (16) can be transformed into minimizing the objective function shown in Equation (17) with the regularization method, where
λ is the regularization parameter.
The sparse reconstruction function shown in Equation (17) is widely used in super-resolution imaging systems, such as [
15,
20,
22,
25,
34,
35]. To solve Equation (17), various methods can be adopted, such as matching pursuit algorithm, convex optimization algorithm, Bayesian algorithm, iterative shrinkage threshold algorithm (ISTA), and so on. Among them, the matching pursuit algorithm will become very poor when the coherence of the transformation matrix is not good; the convex optimization algorithm and the Bayesian algorithm are complex and not suitable for engineering applications. The ISTA algorithm only has two matrix operations in each iteration, and the algorithm complexity can be greatly reduced; however, the traditional ISTA algorithm has poor convergence performance. Therefore, the fast iterative shrinkage threshold algorithm (FISTA) [
36] can be used to optimize Equation (17), which can exponentially increase the convergence speed.
In a broadband system, we can select
L frequency points from the working bandwidth
Bg, and obtain the reconstruction result
hl corresponding to
fl. Then, the average reconstruction result within the bandwidth can be calculated as Equation (18).
After rearranging vector
into a matrix, we can obtain imaging results of the desired scene. It is worth noting that there is no order requirement for the calculation of
hl. Parallel processing can be used to calculate different
hl simultaneously to speed up the imaging process. The imaging performance of the proposed system can be evaluated by the reconstruction error [
15,
37], as shown in Equation (19). The smaller the reconstruction error, the better the imaging performance of the system.
3. Numerical Simulation Results
In this section, we use numerical simulation experiments to verify the effectiveness of the designed method. We set the parameters of the system to f0 = 26.5 GHz, B = 5 GHz. The baseband waveform g(t) is a chirp signal with a bandwidth of Bg = 280 MHz.
As reported in [
38], the average transmitting pattern of an array radar system can be derived as Equation (20), where
denotes the power spectral density matrix of transmitted signals at frequency
f,
represents the transmit steering vector, and φ and θ represent the azimuth and elevation, respectively. The simulated average transmitting pattern is shown in
Figure 2. The amplitude value of the normalized transmitting pattern varies between 0.97 and 1 (−0.13 dB~0 dB). Therefore, the transmit array can scan the space almost uniformly. In other words, the employed array can scan space without phase-shifters or rotating antennas.
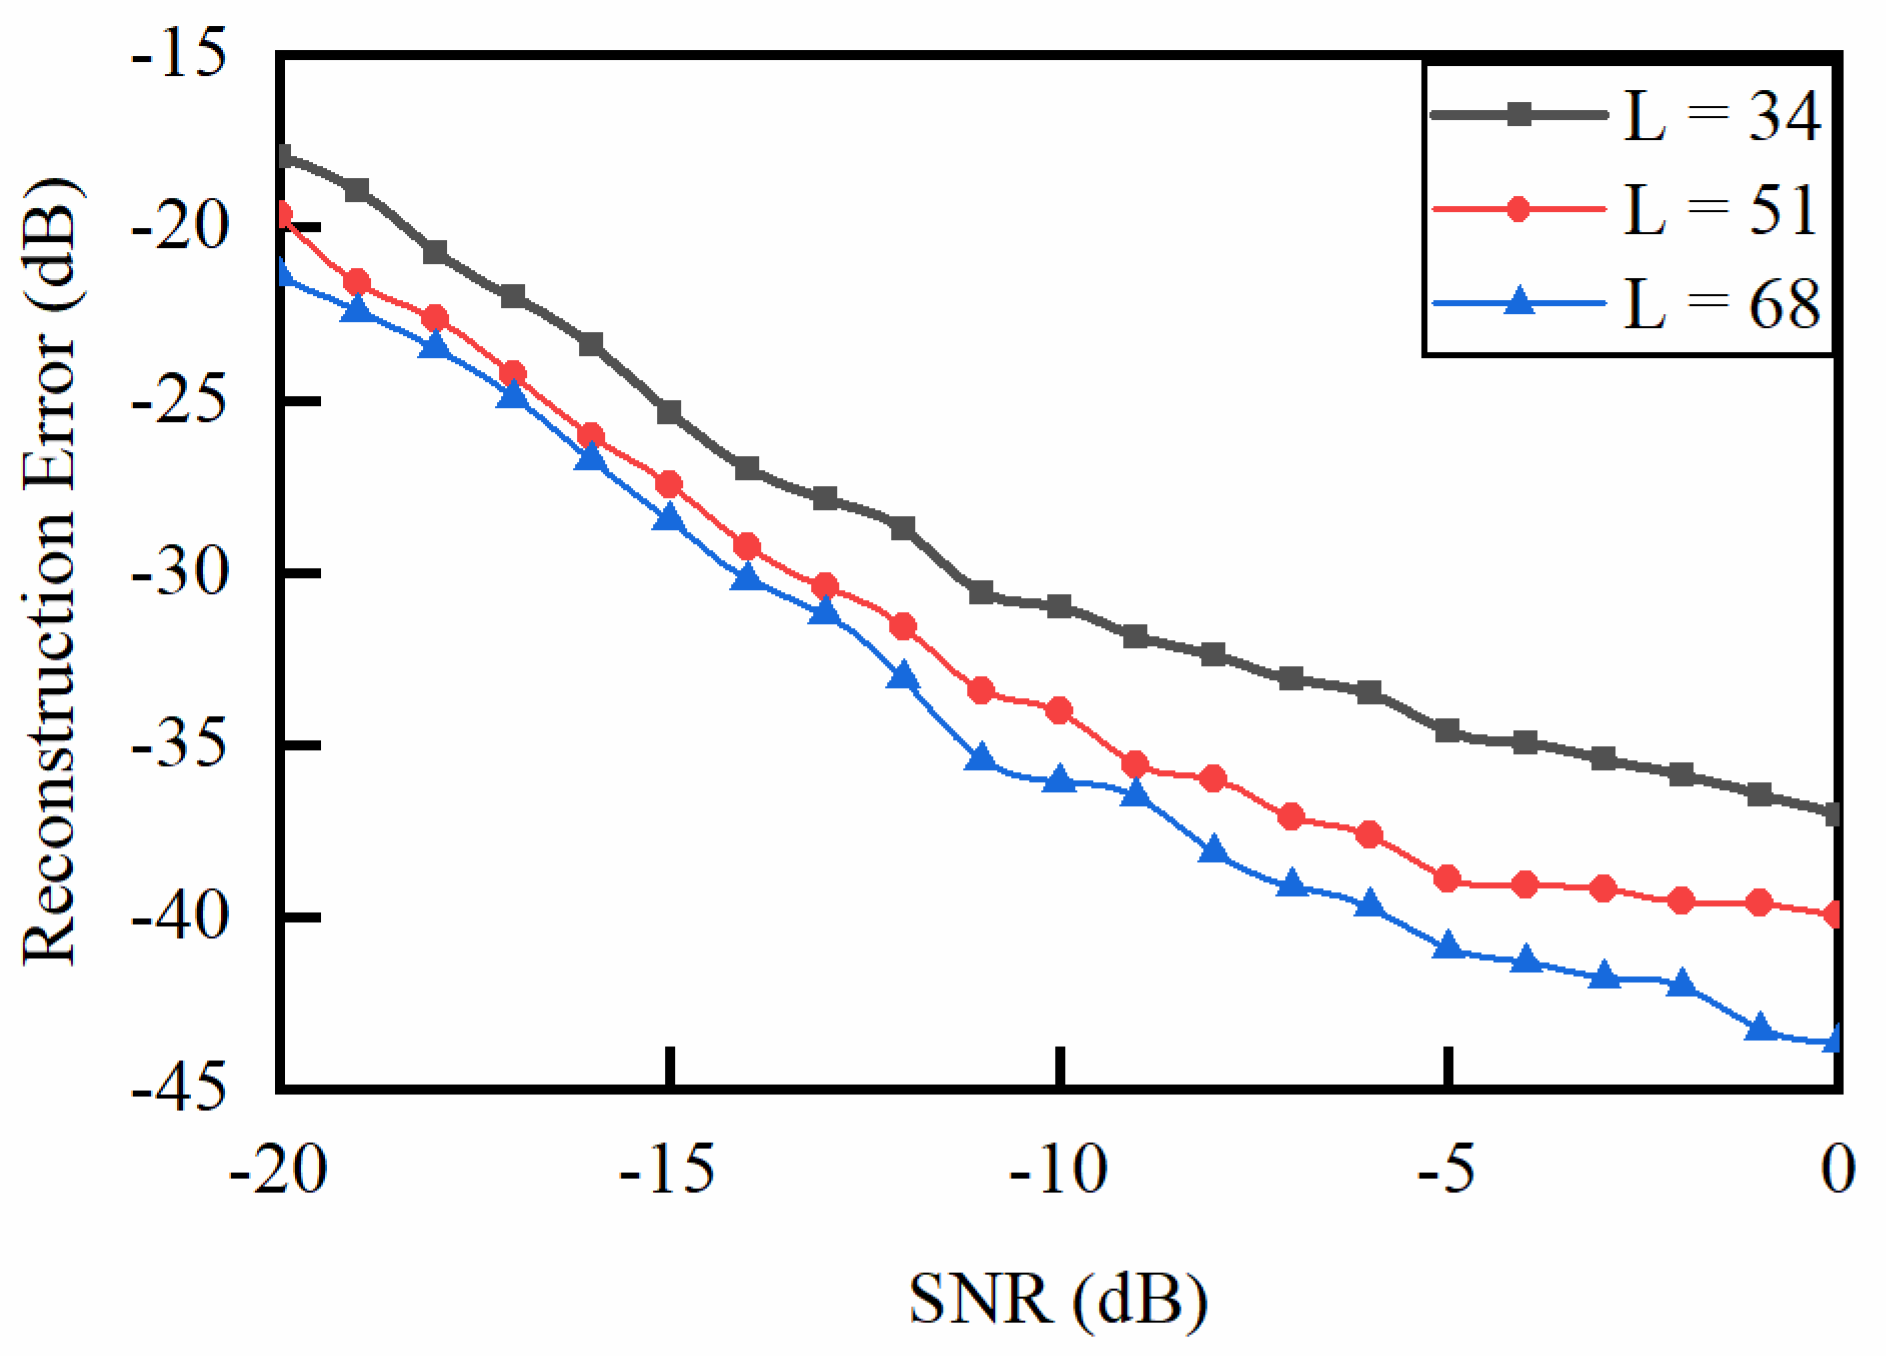
To evaluate the imaging performance of the proposed system, we refined the spatial discrete grid into ∆
z = 1 cm, ∆
x = ∆
y ≈ 2 mm. Then, 100 Monte Carlo experiments were performed under each signal-to-noise ratio (SNR) condition. In each imaging simulation experiment, we randomly generated a point in the observation area as the target. Both the coordinates and reflection coefficients of the point target were random. The obtained reconstruction error vs. SNR curves are shown in
Figure 3. The reconstruction error curves show that the applied system can unambiguously estimate target location. With the improvement of SNR conditions, the smaller the reconstruction error of the system, the closer the imaging results are to the ideal result. If more frequency points are selected, the system will achieve lower reconstruction error and better anti–noise performance.
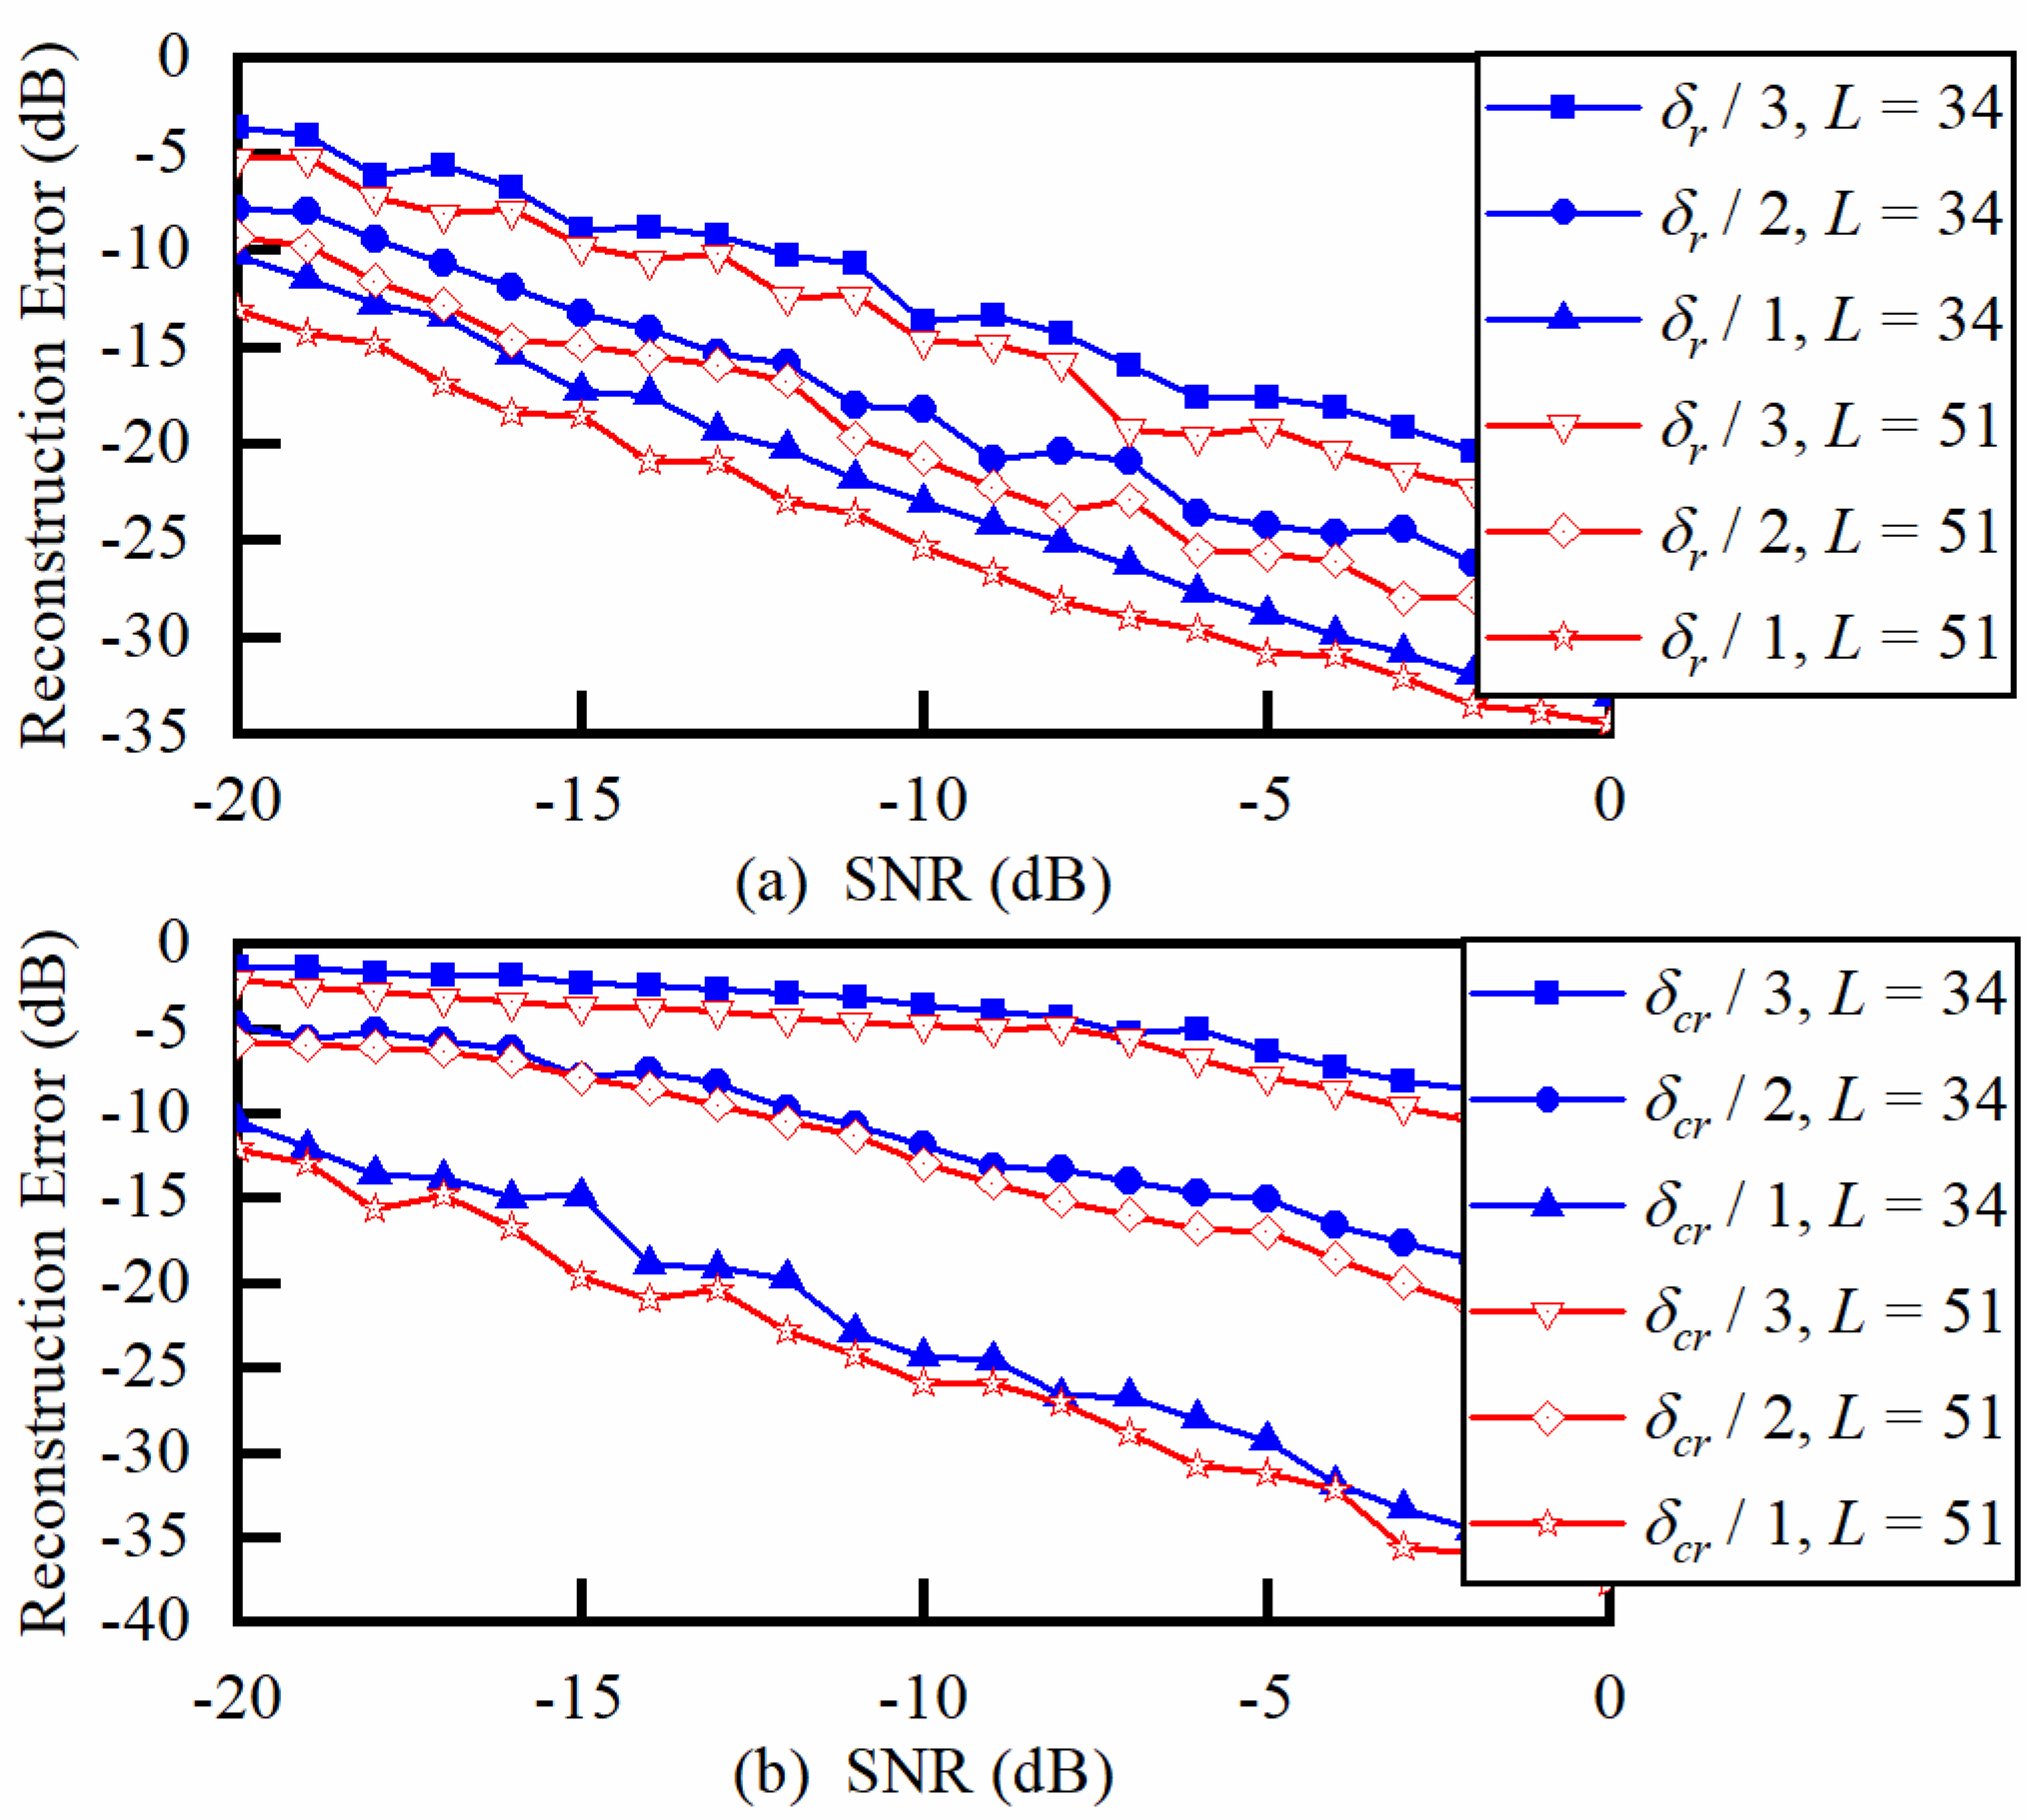
Unlike conventional imaging methods, we cannot use the point spread function to analyze the main lobe width in imaging results directly. In this letter, we use reconstruction errors to indirectly analyze the imaging performance of the designed system. The specific method is as follows: randomly generate two adjacent points in the observation space as targets, and judge whether the proposed method can effectively distinguish and accurately reconstruct these targets by calculating the reconstruction error. We first analyze the minimum range resolution interval of the system. Taking the range resolution
δr determined by Equation (1) as a reference, the reconstruction errors of targets at different intervals are shown in
Figure 4a. If the reconstruction error is less than −10 dB, the system can be considered to have good imaging performance, that is, it can successfully distinguish these targets. It can be seen that when the selected frequency is unchanged, the larger the target interval, the easier it is to distinguish. The better the SNR condition, the easier it is to distinguish adjacent targets. When
L ≥ 51 and SNR ≥ −14 dB, the reconstruction error of the system to adjacent targets separated by 1/3
δr = 1 cm is < −10 dB. Hence, the minimum range resolution interval is one-third that of conventional methods. Then, we analyzed the minimum resolution interval of the system in horizontal and vertical directions. With reference to
δcr determined by Equation (1), when target intervals are
δcr/3,
δcr/2, and
δcr, reconstruction errors are shown in
Figure 4b. When the target interval is equal to
δcr, the system can choose fewer frequency points to achieve low-error reconstruction. The reconstruction error will decrease as the SNR increases or the selected frequency points increase. When
L ≥ 51 and SNR ≥ −10 dB, the minimum cross-range resolution interval that can be achieved is half of that of conventional methods.
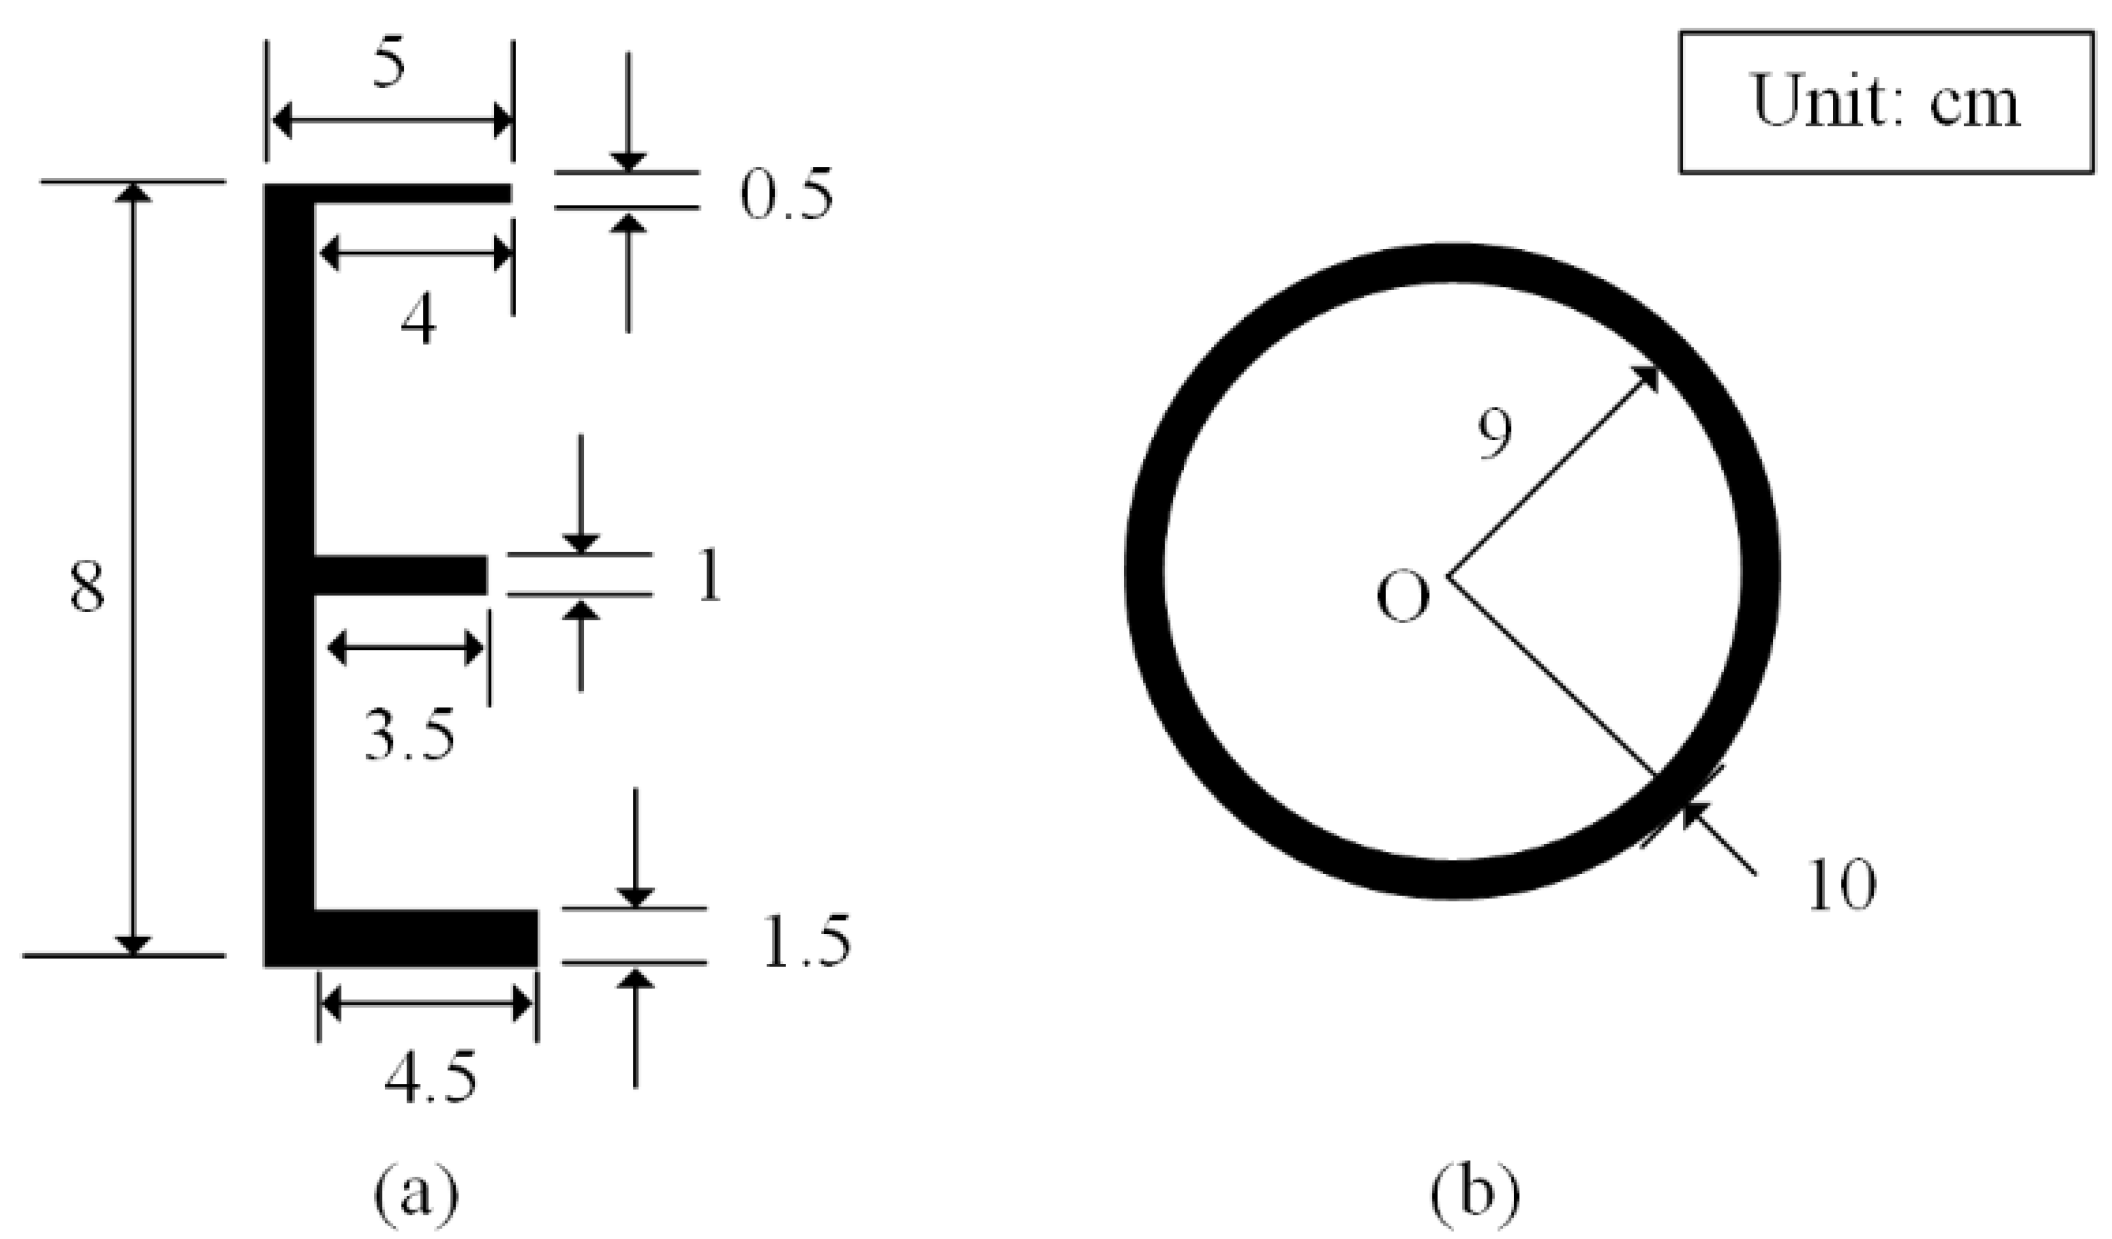
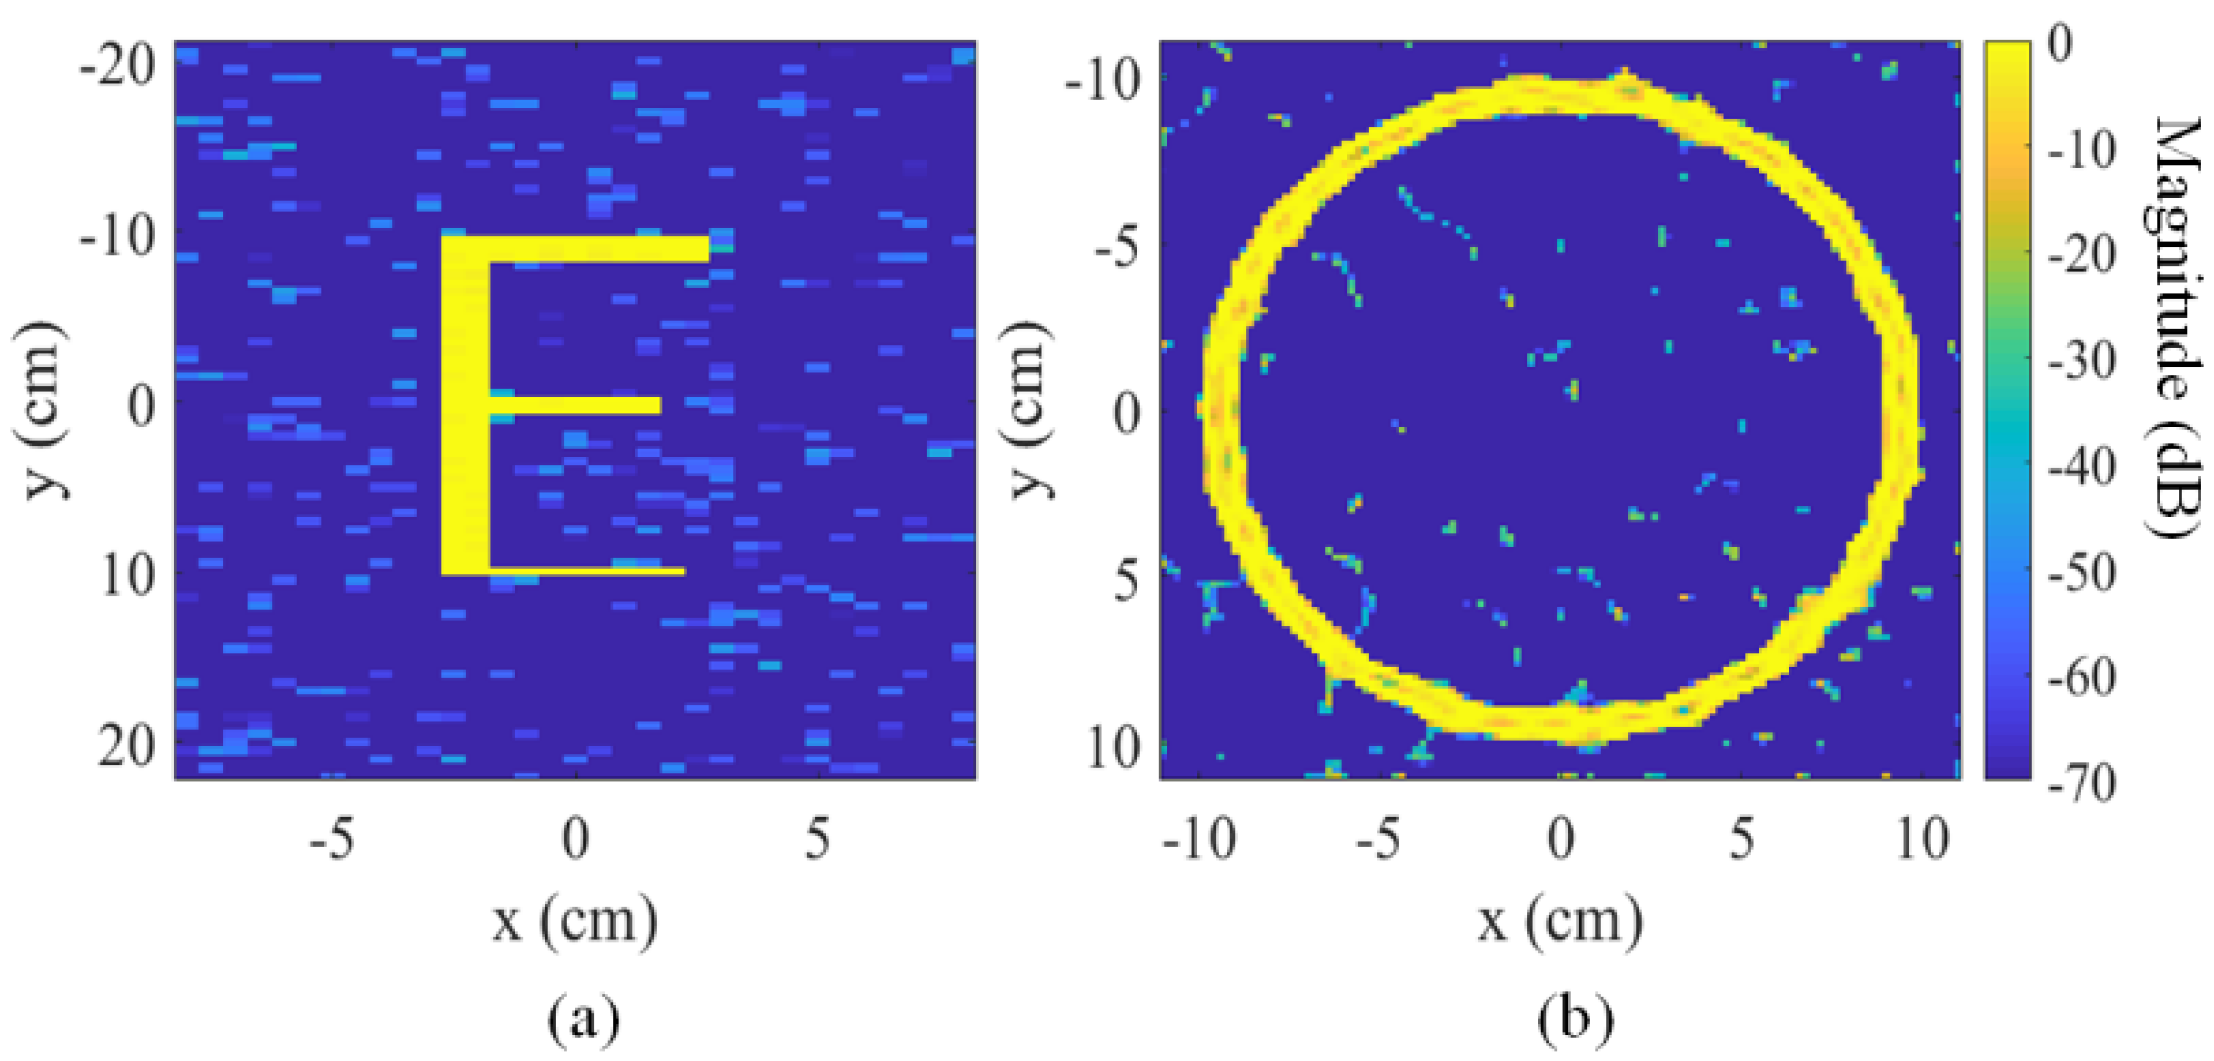
Then, we performed imaging simulation on targets with multiple scattering points. The shape of each target is shown in
Figure 5. Target (a) is “E”-shaped, and the size of each part has been marked. Target (b) is a ring with an outer diameter of 10 cm and an inner diameter of 9 cm. These targets are located in the
z = 1 m plane, and SNR = 0 dB. Normalized imaging results at
L = 51 are shown in
Figure 6. The spatial pixel sizes in the
z = 1 m plane are 5 mm × 5 mm (
Figure 6a) and 2 mm × 2 mm (
Figure 6b).
Figure 6a,b share the same color bar, as shown on the right side of
Figure 6b. The imaging result of target (a) has some noise points with a maximum value of −34 dB, which hardly makes it difficult for us to identify the target. The reconstruction error is −18.66 dB, and the imaging result almost accurately reflects the target contour and the size of each part. Since the method uses discrete space in pixel arrays, the imaging effect of curved contours, as shown in
Figure 6b, is not as realistic as that of linear contours. Compared with
Figure 6a, the noise in
Figure 6b is more obvious, with a maximum value of −18.12 dB. Nevertheless, we can still identify targets’ contour and size.
The performance comparison between the proposed method and some existing imaging methods based on ultra-wideband millimeter-wave systems is shown in
Table 2.
Table 2 shows the relationship between the sampling rate required by different methods and their system bandwidth, as well as the relationship between the obtained resolution and the limit shown in Equation (1). Article [
4] proposed a tomography imaging method, which follows the Nyquist–Shannon sampling theorem and the resolution limit of Equation (1). An imaging method based on ultra-wideband multiple bistatic synthetic aperture radar was reported in [
5]. To remove the blurring effect produced by bitmaps, article [
5] applied the regularized deconvolution algorithm. As a result, smaller resolution intervals were achieved. Different novel antennas were designed in [
6,
20] to construct imaging systems, which employed sparse reconstruction imaging methods. However, since the establishment of the dictionary required for reconstruction relies on experimental measurements rather than theoretical deductions, [
6,
20] have not broken through the resolution limit of Equation (1). A super-resolution imaging method for the UWB array system based on compressive sensing and deep neural network was proposed in [
32]. With the help of compressed sensing and sparse reconstruction technology, a low sampling rate digital signal and smaller resolution intervals can be obtained at the expense of increasing the observation time. In contrast, the proposed method does not require prolonged observation time and complex sampling structure to obtain low sampling rate signals. Although the resolution obtained by the proposed method is not as good as that obtained in [
32], its advantage lies in its simple structure and easy implementation.


