1. Introduction
The Ice, Cloud, and land Elevation Satellite-2 (ICESat-2/IS-2) successfully launched in 2018 and has since provided global elevation measurements to the community across a wide range of scientific disciplines with unprecedented accuracy [
1,
2] and along-track spatial resolution. As the mission nears its third year on-orbit, it will demonstrate the capability of photon-counting space-based lidar for satisfying the prime mission science goals focused on polar ice studies and the cryosphere, in general [
3]. Ultimately, ICESat-2 is a proven resource for the broad NASA Science Mission Directorate strategy to support the full spectrum of Earth science objectives associated with predicting climate, weather, and natural hazards; managing resources; and developing environmental policy. One notable discovery early in the on-orbit lifetime was the revelation that ICESat-2 has the ability to penetrate water and provide bathymetric elevation retrievals to significant depth (~40 m) [
4], thus extending even further the reach of ICESat-2 related science. Since then, the bathymetric accuracy of ICESat-2 has been compared directly to airborne bathymetric lidar and found to have low average uncertainty (between 20–60 cm) [
4,
5,
6]. This realization of global shallow water bathymetry using ICESat-2 opens up significant opportunity in marine science and nearshore benthic habitat mapping applications where previously there was no data or at best, sparse coverage from logistically limited resources. Further, ICESat-2’s seasonal repeat measurement cycle (~91 days) offers the capability to detect bathymetric change at specific temporal epochs at the global scale. This ability is critical to quantifying the multiple geophysical impacts associated with natural hazards, including hurricanes and coastal storms, natural forcings attributed to regional or local wave dynamics and anthropogenic influences [
7,
8,
9]. The idea of utilizing satellite-only observations for coastal process discovery is paramount to scaling the analysis to a global level and further supports the modeling development reliant on observations for more accurate prediction of climate change manifestation in the coastal environment. Additionally, within the context of larger timescales, bathymetric change monitoring is critical for benthic studies, long-term geomorphologic trends and even preservation (e.g., underwater cultural heritage sites) [
10,
11,
12]. Furthermore, in thinking even more broadly, a technique to resolve bathymetric change from orbiting sensors could inform studies for planetary applications in those instances of surface fluids (e.g., Titan).
The effort presented here, to our knowledge, is the first to investigate the potential to use solely satellite observations as a means of qualitative and quantitatively assessing nearshore geomorphological change, due to episodic (i.e., hurricane-induced), medium-term processes and possible tsunami related littoral flash remodeling [
13], for example. The methodology establishes a proof of concept for future application and analysis of bathymetric change at the global scale.
2. Materials and Methods
2.1. Motivation
Space-based remote sensing has emerged as a highly-effective technique for shallow water bathymetry, particularly with systems that provide wide spatial coverage and maintain the ability to resolve sea floor depths at high resolution. A general procedure for creating satellite-derived bathymetry (SDB) makes use of the wavelength-dependence associated with the exponential attenuation of light in the water column (typically modeled using a Beer’s Law relationship) and the corresponding depth-dependent reflectivity for different spectral bands [
14,
15]. In one widely-used approach, ratios of logarithms of two spectral bands (generally, green and blue, due to their relatively high transmittance in most Jerlov water types) are regressed on reference depths (e.g., from airborne bathymetric lidar or ship-based, multi-beam sonar) to enable bathymetry to be generated for an entire scene. Multispectral sensors, such as those aboard Landsat 8 and Sentinel-2, accommodate these types of bathymetric studies [
16,
17]. Additional analysis specific to ICESat-2 within SDB derivation is presented in [
18] as a highlight to the feasibility of using space-based lidar as a global SDB resource in terms of automation and efficiency. As such, ICESat-2 and imagery fusion has proven to be a solution that leverages the wide spatial coverage of the 2D sensor and the vertical accuracy of the laser altimeter. Early on-orbit efforts demonstrated the quality and application opportunities of ICESat-2 supported SDB [
5,
19,
20]. The concept of using spaceborne altimetry for SDB is starting to take hold for science applications; however, the idea of bathymetric change using ICESat-2 in the SDB process has yet to be thoroughly explored. Although airborne sensor deployments in response to natural hazards, or coastal events such as hurricanes is standard, the challenge remains the logistical limitations and expense associated with these localized methods. Using satellite-only observations for SDB change detection creates a different challenge of ensuring the data from each space-based sensor was collected at temporally relevant periods to afford reasonable conflation and accurate determination of the sediment mobilization patterns within the coastal region. In choosing the IS-2/SDB data for this study, we utilized temporal epochs associated with two hurricane events in the Gulf of Mexico: Hurricane Michael in 2018 and Hurricane Sally in 2020 with reasoning that airborne response teams would collect data after each event as an independent reference for bathymetric change. The airborne collections were acquired by the US Army Corps of Engineers (USACE) Joint Airborne Lidar Bathymetry Technical Center of Expertise (JALBTCX) to investigate comparative change detection in the nearshore seafloor topography.
Using uncertainty propagation, it is possible to estimate the uncertainty in IS-2/SDB bathymetric change raster comparisons. Bathymetric change is reported as a cell-by-cell difference between two digital elevation models (DEMs). In this investigation, we focus on those DEMs available during the temporal epochs associated with post-Hurricane Michael in 2018 and post-Hurricane Sally in 2020. These epochs were based on the availability of local data collected with airborne assets. We find the elevation differences of the two surface models using Equation (1).
where
i denotes the
ith grid cell,
t1 is time 1 (in this study, post Hurricane Michael) and
t2 is time 2 (in this study, post Hurricane Sally).
Applying the special law of propagation of variances (SLOPOV), the predicted uncertainty in our bathymetric change grids (sometimes known as a DEM of Difference) is as follows:
If the IS-S/SDB bathymetric grid uncertainty is taken to be the same at
t1 and
t2, then Equation (2) simplifies to the following:
where
.
From [
5,
18,
19,
20], using ICESat-2 ATLAS and Sentinel-2 MSI for SDB results in RSME values of approximately 10% of the depth. Using an approximate maximum depth of ~9.2 m (see
Section 2.2) the σ
Z = ±0.92 m. From Equation (3), we have the following:
The interpretation of Equation (4) is that the uncertainty in the IS-2/SDB bathymetric change grids is ±1.3 m. It could, hence, be inferred that the magnitude of bathymetric change between t1 and t2 must be at least 1.3 m to be detectable, if it is assumed that the level of change must exceed the uncertainty in the change (i.e., to be above the noise floor) to be detectable. However, testing this assumption is one of the goals of this study. We posit that it may be possible to detect spatial patterns of bathymetric change, even if the mean magnitude of bathymetric change is below the estimated uncertainty. Furthermore, the above uncertainty propagation equations assumed random uncertainty. If there is a systematic component to the uncertainty (which we believe is a reasonable assumption), then it may cancel out the process of computing bathymetric change, such that Equation (4) is an overly pessimistic estimate of the bathymetric change uncertainty.
2.2. Study Site
This study focused on the Florida panhandle region—specifically, Santa Rosa Island between Pensacola Beach Park to the west and Santa Rosa Escandia to the east, spanning ~21 km (
Figure 1). The study site is microtidal; based on data from NOAA’s Center for Operational Oceanographic Products and Services (CO-OPS), the Panama City Beach, FL, tide station (NOAA Station ID 8729210), installed on the Russell-Fields Pier ~100 km southeast of our site, has a mean tide range of 0.38 m, while the Pensacola, FL, tide station (NOAA Station ID 8729840), has a mean tide range of 0.37 m. Mean wave heights are in the range of 0.55–0.85 m [
21] although with significant seasonal variability.
Past studies have examined this area as well, citing the poorly understood alongshore variation response to storm surge [
22]. However, the primary analysis was directed at this hotspot of shoreline erosion and morphology associated with the foredune and backbarrier dune dynamics. The Santa Rosa Island is a prime location for studying hurricane events, in particular, as it has been impacted by Hurricane Ivan (2004), Tropical Storm Arlene (2005), Hurricane Dennis (2005), Hurricane Katrina (2005), Hurricane Ida (2009), Hurricane Michael (2018) and Hurricane Sally (2020). The island is a slim sandy Holocene barrier island and the second longest in the U.S. Gulf Coast with a history of formation, erosion and longshore redistribution of sediment [
23]. Evaluation of before-and-after intense hurricane events has detected overwash deposits but has determined that the redistribution of sediment within the littoral region is primarily due to frontal winds [
24]. Most recently, the efforts in [
25] describe the sediment dynamics around natural and anthropogenic forcings using multi-temporal analysis of SDB with validation of the results through comparison to airborne lidar. These results highlight the variability in the ridges and troughs along the coastline as an assessment of the topographic patterns surrounding significant events for two regions in North Carolina. The results of [
20] were relevant to extending SDB application but did not focus on other regions and did not examine SDB control points beyond soundings from NOAA nautical charts, derived from sonar (e.g., single-beam or multibeam echosounder) surveys (
https://www.ngdc.noaa.gov/mgg/bathymetry/multibeam.html, accessed on 6 January 2022). It was also limited to fairly shallow depths, but did confirm a high level of accuracy in the SDB change detection as compared to the reference data. Furthermore, it also provides important assessments as to potential reasons for uncertainty within the measurements and technique of coastal response.
The work documented in [
26] considered evolution of the offshore bathymetry with observations of the characteristic concave profile with semi-regular shore-oblique ridges. Mensuration of the morphology deemed the extent to be on the order of ~1700 km offshore with a depth of ~15 m. Absent of any high-resolution bathymetry data, the post-storm analysis qualitatively determined that these ridges show minimal change from the past storm events but suggest continual examination as storm intensity and frequency increases. Furthermore, it is suggested that understanding more about these shore-transverse ridges features will help predictions of wave energies incident to the coast [
27,
28]. Overall, the analysis and assessment of deepening (erosion) and shoaling (deposition) patterns as a result of natural and anthropogenic factors in this region are important to a comprehensive understanding for coastal engineering, navigation and policy decisions along the Gulf of Mexico.
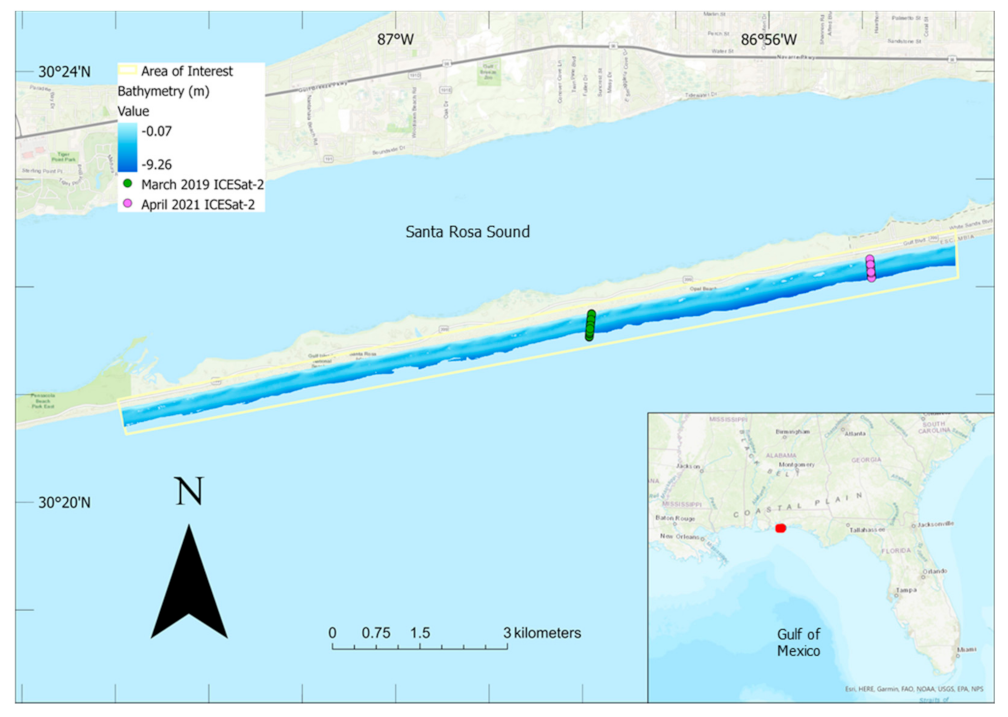
Figure 1 provides the location of the study site along the Florida coast and includes both the airborne lidar data region (yellow box) and the ICESat-2 transects utilized in the study (colored circles). Both data sets will be discussed in the subsequent section.
2.3. Data Sets
The ICESat-2 elevation transects used in this study are Release 004 ATL03 [
29], the Level 2a along-track elevation product. Since the bathymetric capability was not cultivated during pre-launch preparation in terms of algorithm development for sub-surface retrievals, the authors implemented a manual photon extraction tool via labeling each signal photon by surface type (sea surface and sea floor) within theATL03 product. The labeling process mimics the land and vegetation along-track product approach (ATL08) that allows for multi-surface extraction (terrain, canopy, top of canopy) at variable length scales [
30]. Photon classifications were then manually verified and corrected. An example of the resulting photon classifications is shown in
Figure 2, with labels for sea surface (blue) and sea floor (red). A refraction correction is applied, computing horizontal and vertical offsets to seabed photon retrievals [
4]. These data remain at the ATL03 along-track resolution of 0.7 m and across-track resolution of ~11 m [
31].
The ICESat-2 ATL03 Level-2 along-track product used in this study are associated with orbit reference ground tracks 1277 and 538 collected on 22 March 2019 and 29 April 2020, respectively. These data are openly available through the NASA’s Earth Observing system Data and Information System (EOSDIS) Distributed Active Archive Center (DAAC) the National Snow and Ice Data Center (
www.nsidc.org, accessed on 6 January 2022) [
32] and also downloadable from
openaltimetry.org (accessed on 6 January 2022).
The European Space Agency provides open-source imagery from the Sentinel-2 satellite mission. The Sentinel-2 mission is comprised of two observatories: Sentinel-2A and Sentinel-2B launched in 2015 and 2017, respectively. Onboard each of the satellites is a multi-spectral instrument (MSI). These instruments provide spectral observations for 13 bands at a swath width of 290 km. This study relied specifically on the visible green (560 nm) and blue (490 nm) wavelength bands. These data were obtained from the U.S. Geological Survey (USGS) Earth Explorer website.
Data from the Joint Airborne Lidar Bathymetry Technical Center of Expertise (JALBTCX) were used as a reference for validating the surface change derived from the combined IS-2/S2 SDB. The JALBTCX data are available through NOAA’s Office for Coastal Management via the Digital Coast Data Access Viewer (
http://coast.noaa.gov/digitialcoast/data/jalbtcx.html, accessed on 6 January 2022). The data were collected using the Teledyne Optech CZMIL (Coastal Zone Mapping and Imaging Lidar) system. CZMIL is a combination of the SHOALS (Scanning Hydrographic Operational airborne Lidar Survey) system and the Compact Hydrographic Airborne Rapid Total Survey (CHARTS) system [
33]. The SHOALS system operational performance is focused on providing up to 60 m of depth penetration using a 532 nm and 1064 nm wavelength lidar [
34,
35]. The SHOALS nominal vertical accuracy is reported to be ±15 cm using post-processed GNSS-aided inertial navigation system (INS) data to generate aircraft trajectories [
36]. The NCMP lidar surveys provide, on average, 2 points/m
2 across 500–1000 m transects. These data are used to create a trianguled irregular network (TIN) from the points identified as bare earth and then transformed to a 1-m gridded bare-earth DEM. The system was originally developed for topographic and bathymetric survey applications associated with navigation, but it soon revealed its capacity to determine accurate surface models that could satisfy rapid response elevation models from lidar point clouds to determine large scale coastal change between collection epochs that bounded storm events [
37].
The reference data used in this study were collected by the USACE National Coastal Mapping Program (NCMP) to specifically determine changes in elevation both above and below the water surface along the coasts of Alabama, Florida and Mississippi. The surveys were completed post-hurricane to provide an elevation change DEM at 1-m resolution to explore the geomorphological impact of the hurricane events by assessing the coastal change in the aftermath. Surface-to-surface comparisons provide volume change assessments that characterize sediment erosion and deposition along the coastline.
Previously, post-hurricane surveys were performed in 2017 and 2018 (Hurricanes Irma, Maria, Michael and Florence) and resulted in full-scale volume change assessments as a baseline to understanding the patterns of sediment transport post-event [
32]. The survey in response to Hurricane Michael (U.S. landfall on 10 October 2018 along the Florida panhandle) was collected over 14 days between October 2018 and 20 November 2018. Similarly, after Hurricane Sally (16 September 2020), the NCMP rapid response collection occurred between 22 September 2020 and 13 October 2020 across regions of Florida, Alabama and Mississippi (
https://coast.noaa.gov/htdata/lidar3_z/geoid18/data/9200, accessed on 6 January 2022).
2.4. Methods
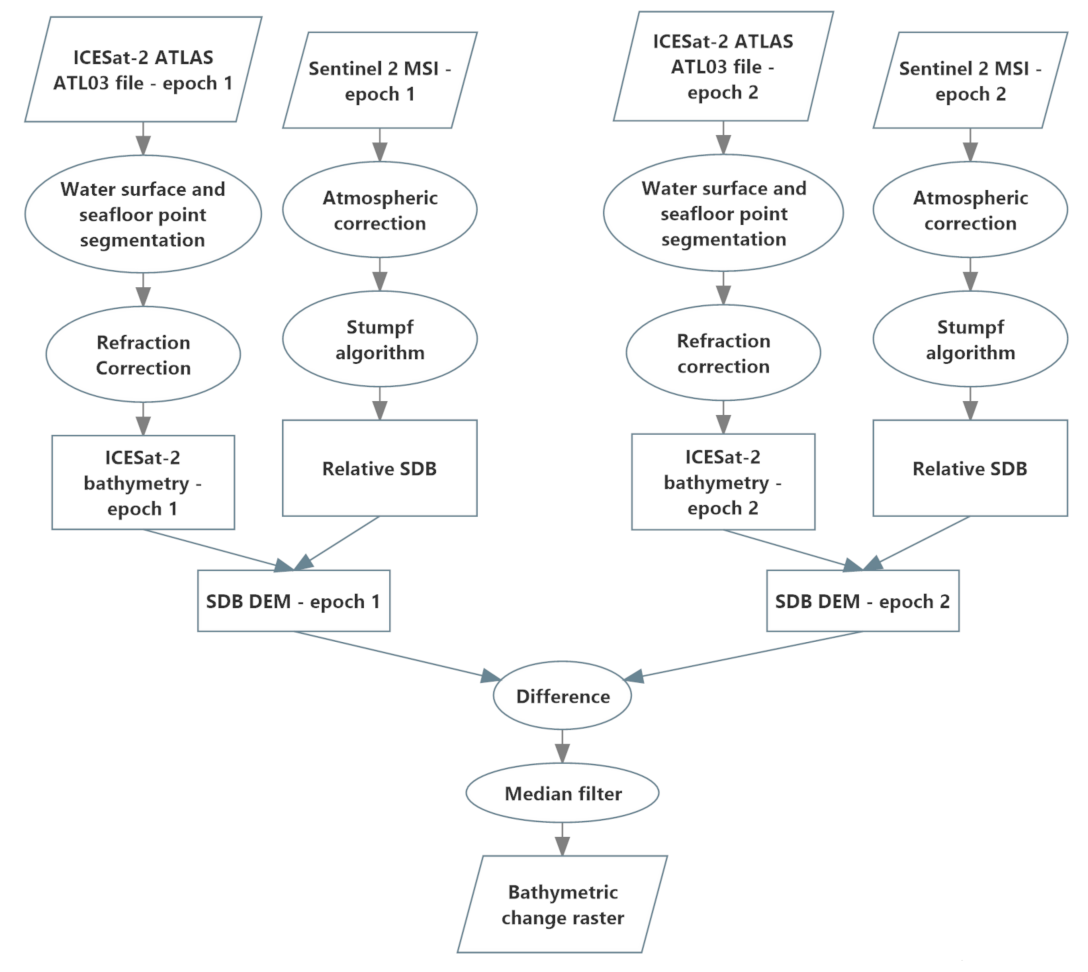
The methods used to derive bathymetric change implemented in this research are depicted graphically in the workflow diagram of
Figure 3. The single-epoch IS-2/SDB workflow is also described in detail in [
18]. The inputs to the process consist of the ICESat-2 ATL03 along-track geolocated photon Level 2 product and Sentinel-2 MSI imagery for the two epochs. For the purposes of this study, we used ±1 month as the maximum temporal separation constraint between the ICESat-2 and multispectral imagery acquisition, and, for hurricane change assessment, both the imagery and lidar were acquired post-storm for the second epoch. Additionally, the image scenes selected were cloud free over the region of interest, well illuminated, and not acquired during times of high turbidity (e.g., following a rain event). The bathymetric elevation retrievals from the ATL03 data are determined using the previously-described custom algorithm for extraction and correction [
4]. Meanwhile, the imagery processing workflow initiates with the atmospheric correction via ACOLITE [
38], a processor developed by the Royal Belgian Institute of Natural Sciences. This correction step follows procedures described in [
17]. Areas outside of the optically shallow bathymetry are masked out manually including the land, optically deep regions and optically shallow regions outside the area of interest (e.g., to the north of the barrier island). Next, the Stumpf algorithm [
15] is implemented to generate relative SDB (rSDB) from the atmospherically-corrected blue and green image bands. The IS-2 bathymetry is then used to compute the parameters of a linear transformation from rSDB to actual bathymetry in physically-meaningful units, and relative to the same vertical datum as the IS-2 bathymetry. The IS-2/SDB DEMs are then differenced to produce the bathymetric change raster. Because the output of the difference operation generally exhibits salt-and-pepper noise, a median filter is applied in the final step to generate the bathymetric change raster.
The ICESat-2 bathymetry was strongly correlated with the relative SDB (ratio of logs), with
R2 values of 0.83 and 0.81 for the post-Michael and post-Sally data sets, respectively (e.g.,
Figure 4).
3. Results
The satellite-derived bathymetric change grids generated using the workflow described above were compared to the JALBTCX rasterized change detection products. To assess the fidelity of detected change from the space-based systems, the specific goals of this comparison were to (a) quantify differences between the space-based change grids and those generated by JALBTCX, and (b) asses the consistency of spatial patterns of change (i.e., patterns of erosion and accretion) detected by the space-based systems and those from JALBTCX, in order to determine whether both would lead to similar conclusions regarding the storm-induced morphological change and/or sediment transport.
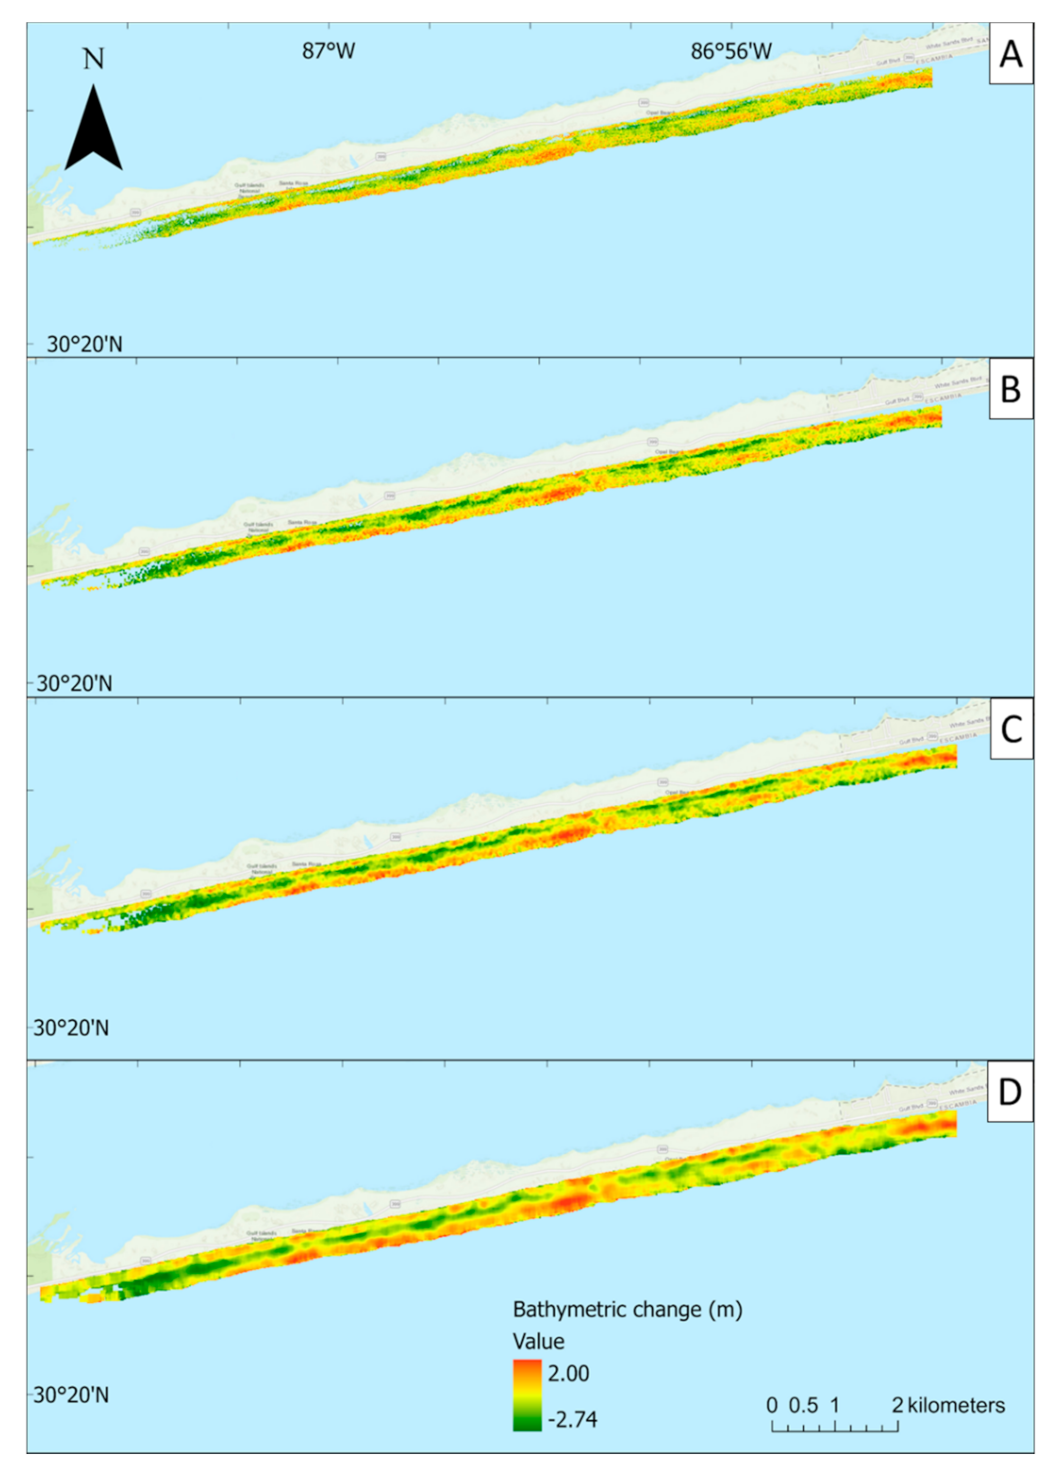
Because the space-based bathymetric change grids were noticeably noisier than those from JALBTCX (as would be expected, due to the higher uncertainty), median filters of various sizes (3 × 3, 5 × 5, and 11 × 11) were tested on the output space-based bathymetric change grids as the last step in the processing workflow. The median filter was chosen over other possible filter types (e.g., Gaussian lowpass filters), due to the salt-and-pepper appearance of the satellite-derived bathymetric change grids, for which a median filter is well suited. The median filter was found to assist in both revealing the spatial patterns of bathymetric change and reducing the salt-and-pepper noise, but with the tradeoff of some amount of smoothing (
Figure 5).
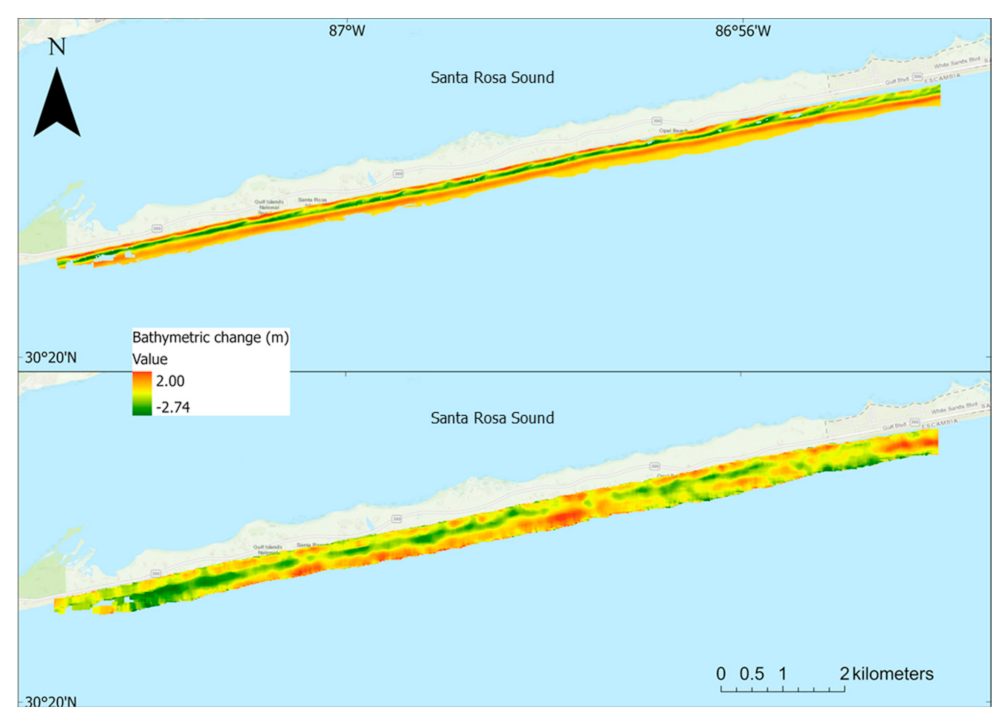
After median filtering, the IS-2/SDB bathymetric change raster was compared to the JALBTCX reference bathymetric change raster, with the differences assessed both visually and quantitatively. The visual assessment results are presented in
Figure 6, which shows the JALBTCX reference bathymetric change raster (top) and the IS-2/SDB bathymetric change raster with the 11 × 11 median filter applied (bottom).
Differences between the space-based bathymetric change grids and those from JALBTCX were computed on a cell-by-cell basis through a raster difference operation implemented in Python and ArcPy (Esri, Inc., Redlands, CA, USA). The differences were then summarized via the root mean square error,
RMSEΔ Z, the mean (or bias),
, and the standard deviation,
, computed using Equations (5)–(7). Here,
is the satellite-derived bathymetric change at grid cell
i,
is the bathymetric change value from the reference data set (in this case, that from JALBTCX) at the same grid cell location, and
N is the total number of overlapping grid cells in the test and reference data sets (
N = 426,140).
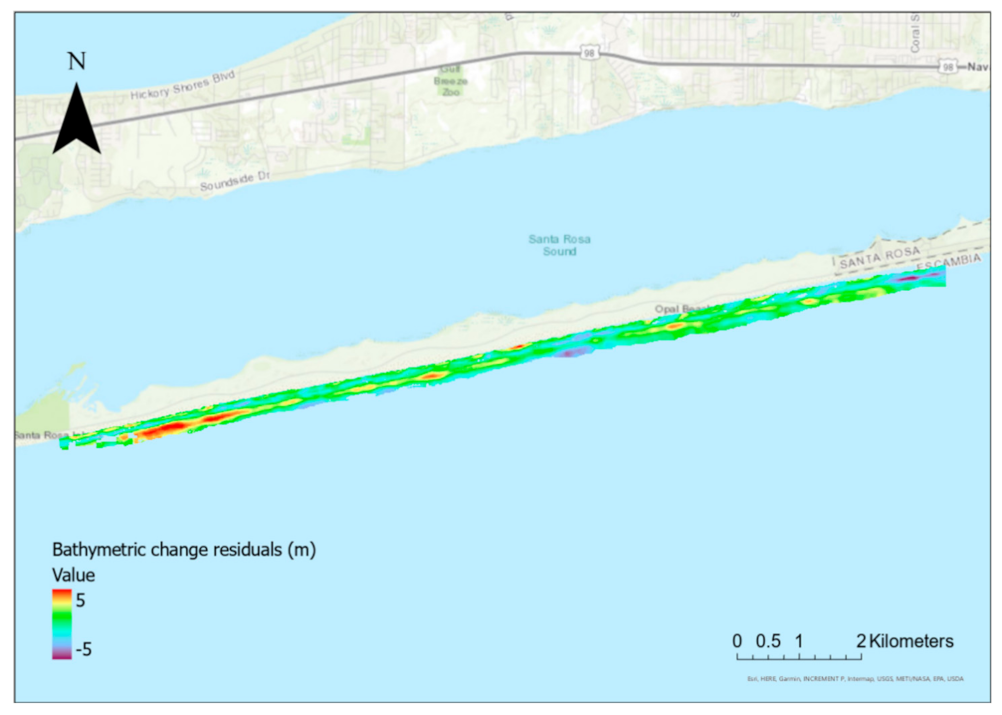
The differences between the bathymetric change grids (i.e., that from JALBTCX and the one produced in this study) are also depicted graphically in
Figure 7.
4. Discussion
Qualitative comparison of the erosion and accretion results for the space-based bathymetric change DEMs and those produced by JALBTCX indicate relatively broad spatial pattern consistency but with localized disagreement within the study site. Both results exhibited distinct change formation as three, roughly shore-parallel bands: a band of erosion extending from the shoreline to ~100 m offshore, a band of accretion ~100 m wide, and finally an erosion band near the offshore limit of the data sets. As seen in
Figure 6, these bands were slightly blurrier in the IS-2/SDB bathymetric change data set than in the JALBTCX data, likely due to the coarser spatial resolution of the Sentinel-2 data, as well as an artifact of the median filtering operation. In general, the median filter was found to qualitatively reduce noise in the space-based bathymetric change grids and quantitatively improved the agreement with the JALBTCX change model reference. However, there is an obvious tradeoff with the increased blurring, or smoothing of the surface geomorphologic change—especially in the case of the larger filter sizes. Filters of size greater than 11 × 11 were not tested, since the amount of smoothing in the 11 × 11 median filter output was found to begin to limit the ability to accurate discern spatial patterns of erosion and accretion.
The general consistency of the spatial-patterning of bathymetric change in the space-based and JALBTCX change DEMs indicates that satellite-only observations are potential contributors in providing general assessment of morphological change dynamics due to hurricanes and other factors (e.g., wave forcing). Due to the relatively long (two-year) period over which the change assessment was performed, it is impossible to attribute the bathymetric change observed by this satellite-based method solely to Hurricane Sally impact. Rather, the two main components of the observed change appear to be long-term erosion of the gulf side of the barrier island [
18,
19] and hurricane-induced nearshore erosion and offshore deposition [
21], both of which result in a distinct spatial pattern described above.
The quantitative results in
Table 1 reveal that the RMSEs were influenced by a positive bias of ~1.5–1.7 m. From visual assessment of the spatial distribution of the bathymetric change differences (
Figure 7), there is a large area near the western end of the data set (shown in red in the figure) exhibiting a positive difference (meaning the bathymetric change in the JALBCX reference data set was larger than the bathymetric change in the IS-2/SDB data for that area) of up to +5 m, that contributed to this positive bias. From
Figure 1, it can be seen that this area is furthest from the two ICESat-2 tracks used in the study. Other areas of large differences can be observed near the outer edges of the data set, and may have been related to edge effects or some uncertainty in clipping the shoreline and optically-deep areas. To explore the impact of possible edge effects, the analysis was repeated using just a region between and coincident to the two ICESat-2 data transects. By narrowing the study site to just that in proximity to the ICESat-2 tracks and using the 11 × 11 mean filter, we improved the results by ~10–15% in each of the statistics evaluated. That is, the RMSE improved from 2.11 m to 1.80 m, the mean difference went from 1.67 m to 1.39 m and the standard deviation decreased from 1.29 m to 1.13 m.
The higher uncertainty in some areas close to the shoreline is consistent with previous studies [
39], which have found SDB uncertainty to increase in and around the surf zone, likely due to the presence of breaking waves, bubbles, foam and surf. Hence, two recommendations for future work are to (a) investigate and carefully consider the maximum distances from the ICESat-2 tracklines in setting the spatial extent of the SDB, and (b) investigate methods of more accurate (and efficient) region clipping along the shoreward and seaward edges of the AOI.
It should also be noted that, while in general, identification and removal of bias in a data set can be difficult in the absence of independent reference data, in the case of bathymetric change data, there are a number of cases in which it may, in fact, be possible. In particular, any areas in the study site that can be reasonably assumed to have experienced little-to-no bathymetric change (e.g., areas of hardbottom or areas furthest from shore and least influenced by nearshore processes) can be used to estimate the bias, which can then be removed. Hence, the last column of
Table 1, the standard deviation, may be viewed as an estimate of the achievable space-based bathymetry change uncertainty—albeit perhaps optimistic, depending on how well the bias-removal can be performed in practice. If the standard deviations in
Table 1 are taken as an estimate of the achievable bathymetric change uncertainty with IS-2/SDB (again, assuming bias removal is possible through the steps discussed above), these results agree well with the predicted bathymetric change uncertainty (Equation (4)). With the largest-sized median filter (11 × 11) applied, the standard deviation was actually a bit better (i.e., smaller) than predicted by Equation (4), possibly indicating pessimistic estimates of the SDB bathymetry uncertainty.
Uncertainty in the reference bathymetric change grid (i.e., that from JALBTCX) also must be considered in interpreting the results. While the JALBTCX bathymetric change product is estimated to be at least four times more accurate than the satellite-derived bathymetric change grid generated in this study, its uncertainty nevertheless cannot be assumed negligible. It is also possible that in the absence of corrections for variable atmospheric conditions and variable turbidity the Sentinel-2 observations could contribute to the disparity between the airborne derived change and the satellite-only solutions [
32,
33]. This is one reason it is recommended that empirical assessments, such as that implemented in this study, be augmented in future work with more rigorous total propagated uncertainty (TPU) models. An understanding of the error sources and their individual contribution to the results will eventually lead to methods for correction strategies similar to those explored previous studies [
17,
40].
5. Conclusions
The results of this study indicate that purely space-based methods of measuring bathymetric change over time can support morphological change assessment. In particular, the similarity in the sediment patterns resolved by the IS-2/SDB change analysis and those determined from airborne observations point to a useful tool for multi-temporal geomorphologic dynamic recovery with potential for regional and global scalability. As the length of the ICESat-2 mission (specifically, the time since launch or since the start of scientific data acquisition) continues to increase, the possibilities for nearshore bathymetric change detection will continue to expand. For example, longer time series will allow us to better decouple seasonal and episodic (e.g., storm-induced) change from longer term trends. Furthermore, rather than relying on end-point change rate methods, multi-epoch time series will enable finer-resolution trend analysis and improved uncertainty analysis. In turn, this enhanced bathymetric change analysis from solely satellite-based systems is anticipated to help support coastal zone management, resilience planning, and habitat (e.g., coral reef and seagrass) restoration initiatives in coastal regions throughout the world.
Going forward, more robust characterization of the satellite-based bathymetric change grids may be achievable by first focusing on better characterization of the single-epoch bathymetric grids from which they are derived. A long-range goal is to develop a rigorous total propagated uncertainty (TPU) model for IS-2/SDB raster products, accounting for all component uncertainties, including both random and systematic measurement uncertainties, as well as model uncertainties. While the development of such a TPU model is a nontrivial task and will require its own dedicated study, once developed, it is anticipated to be relatively straightforward to extend this TPU model to TPU for bathymetric change (e.g., using Equation (3)). An example of the utility of this type of uncertainty model is that it is anticipated to allow assessment of the sensitivities of the bathymetric change uncertainties to environmental conditions (e.g., wave heights, turbidity, substrate and bottom cover type) and, through characterization of the relative magnitudes of systematic and random uncertainty components, to better understand why and under what circumstances the bathymetric change uncertainty might be lower or higher than predicted.
