
Construction Progress and Aviation Flight Test of BDSBAS

Abstract
:1. Introduction
2. Overview of BDSBAS
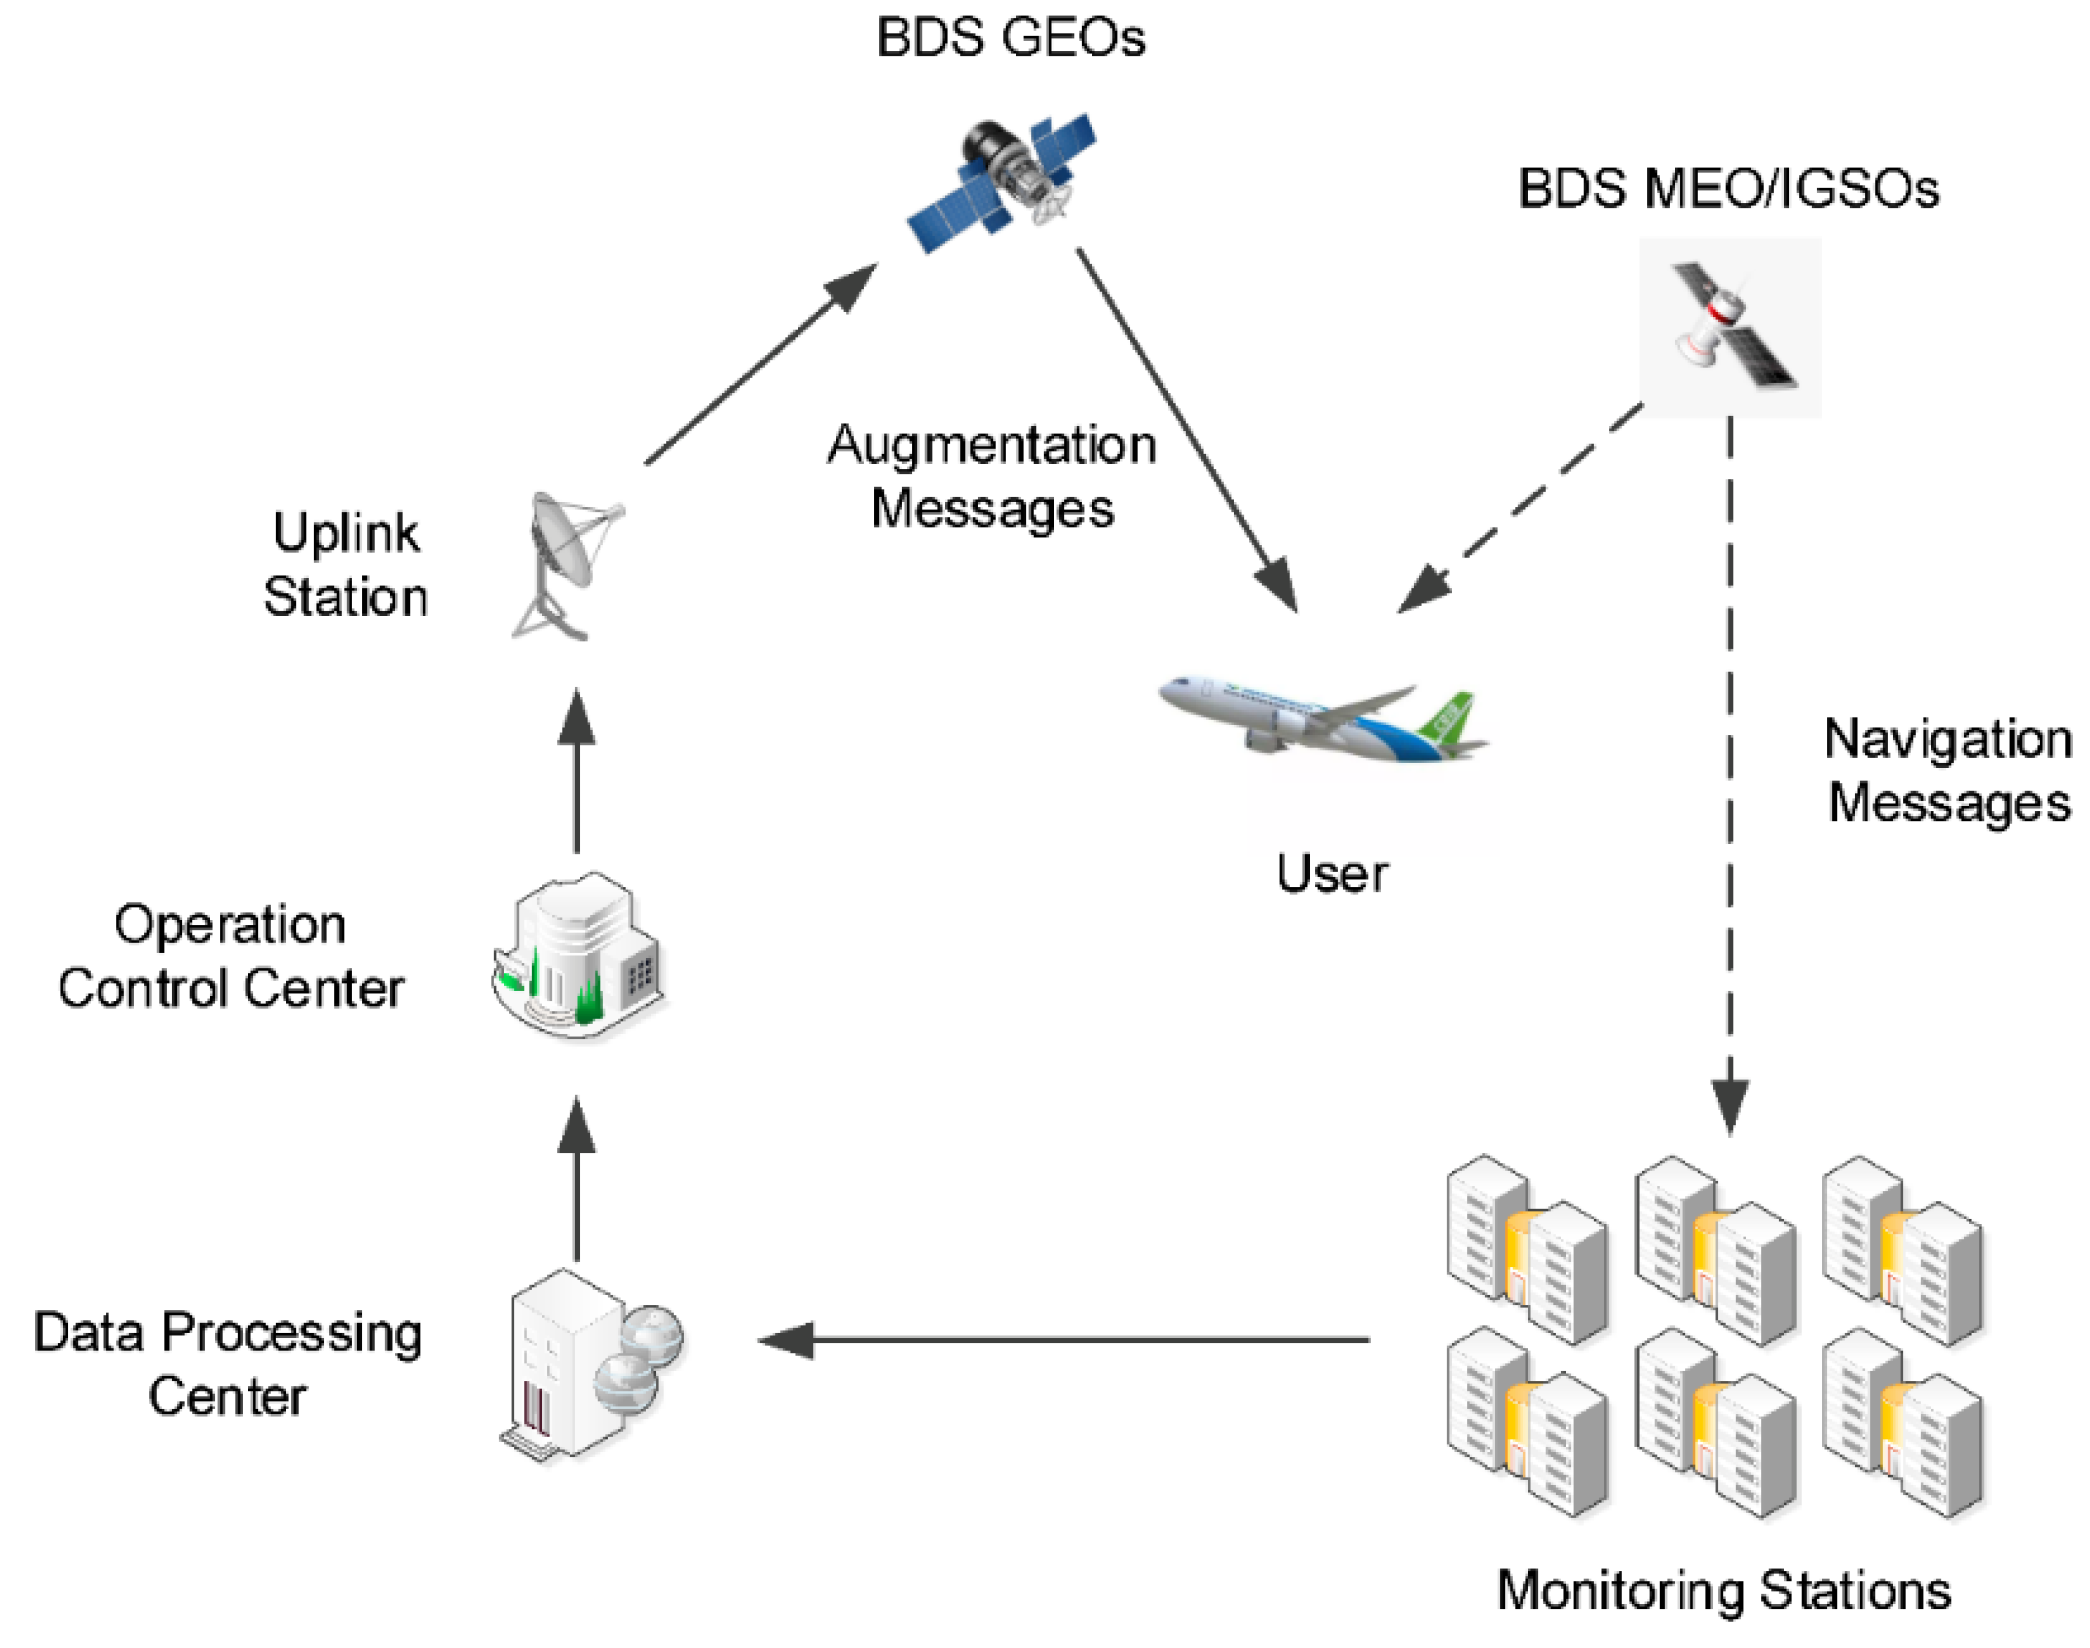
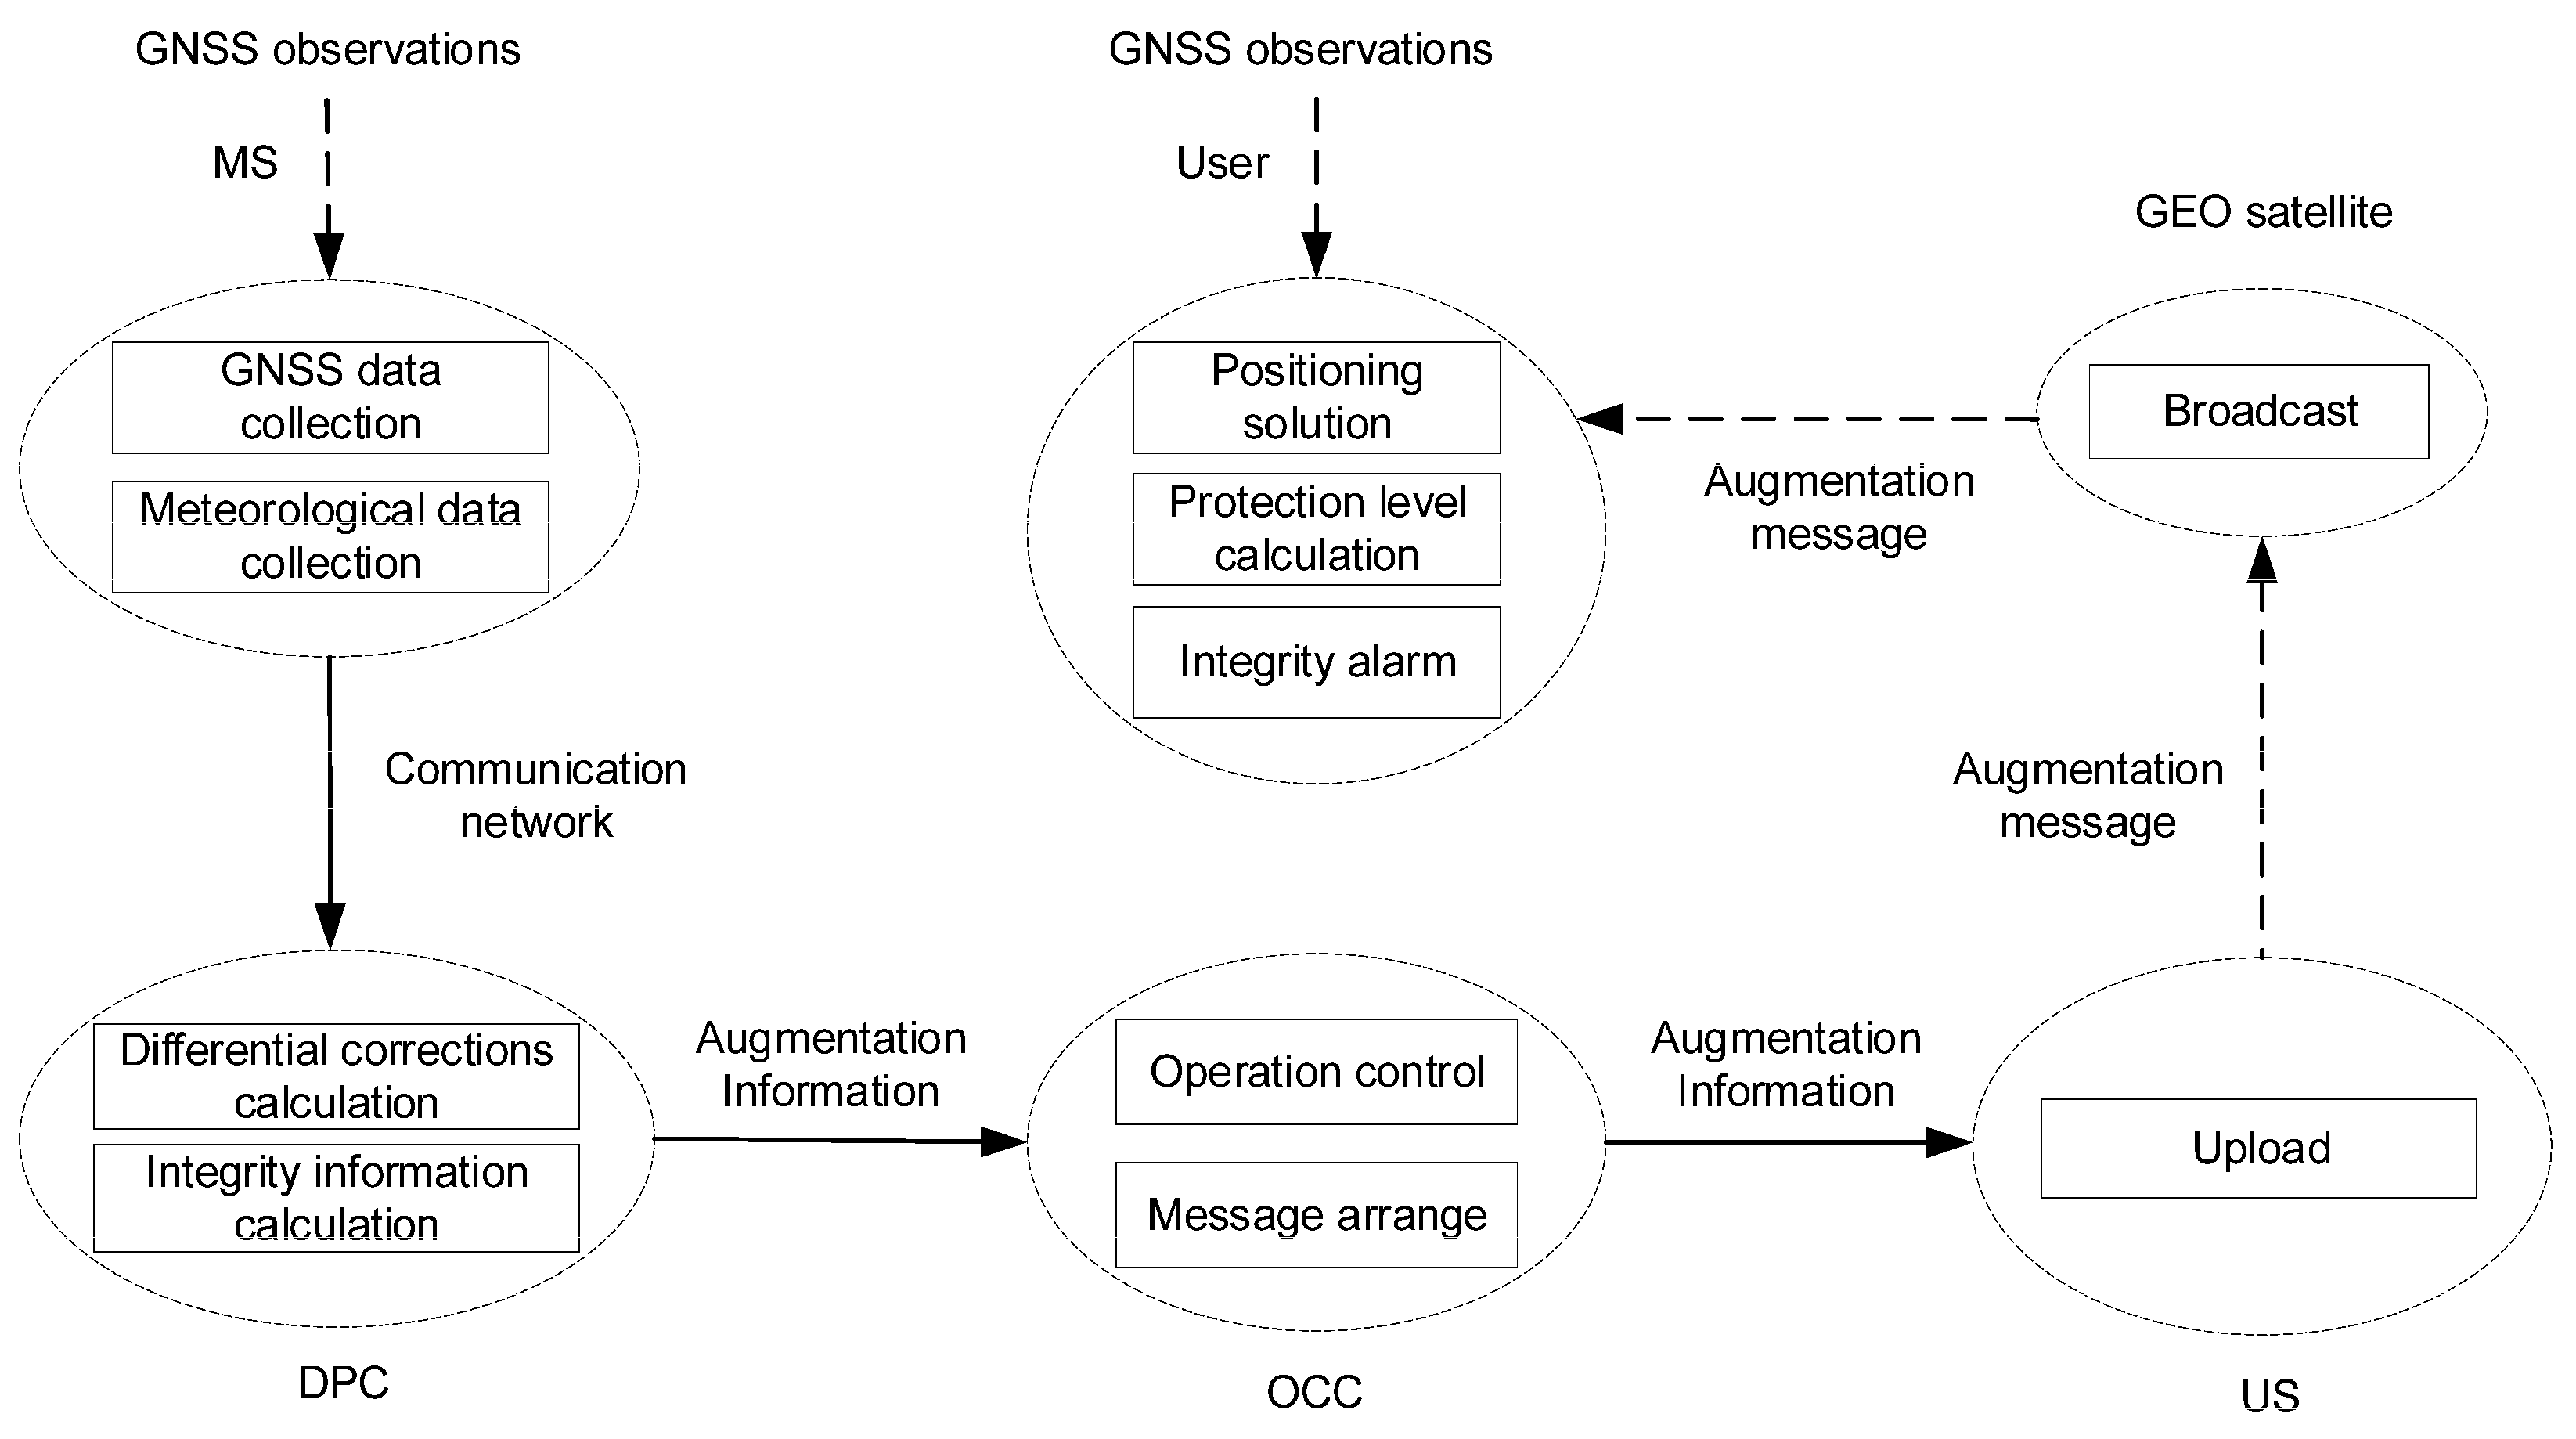
2.1. System Architecture
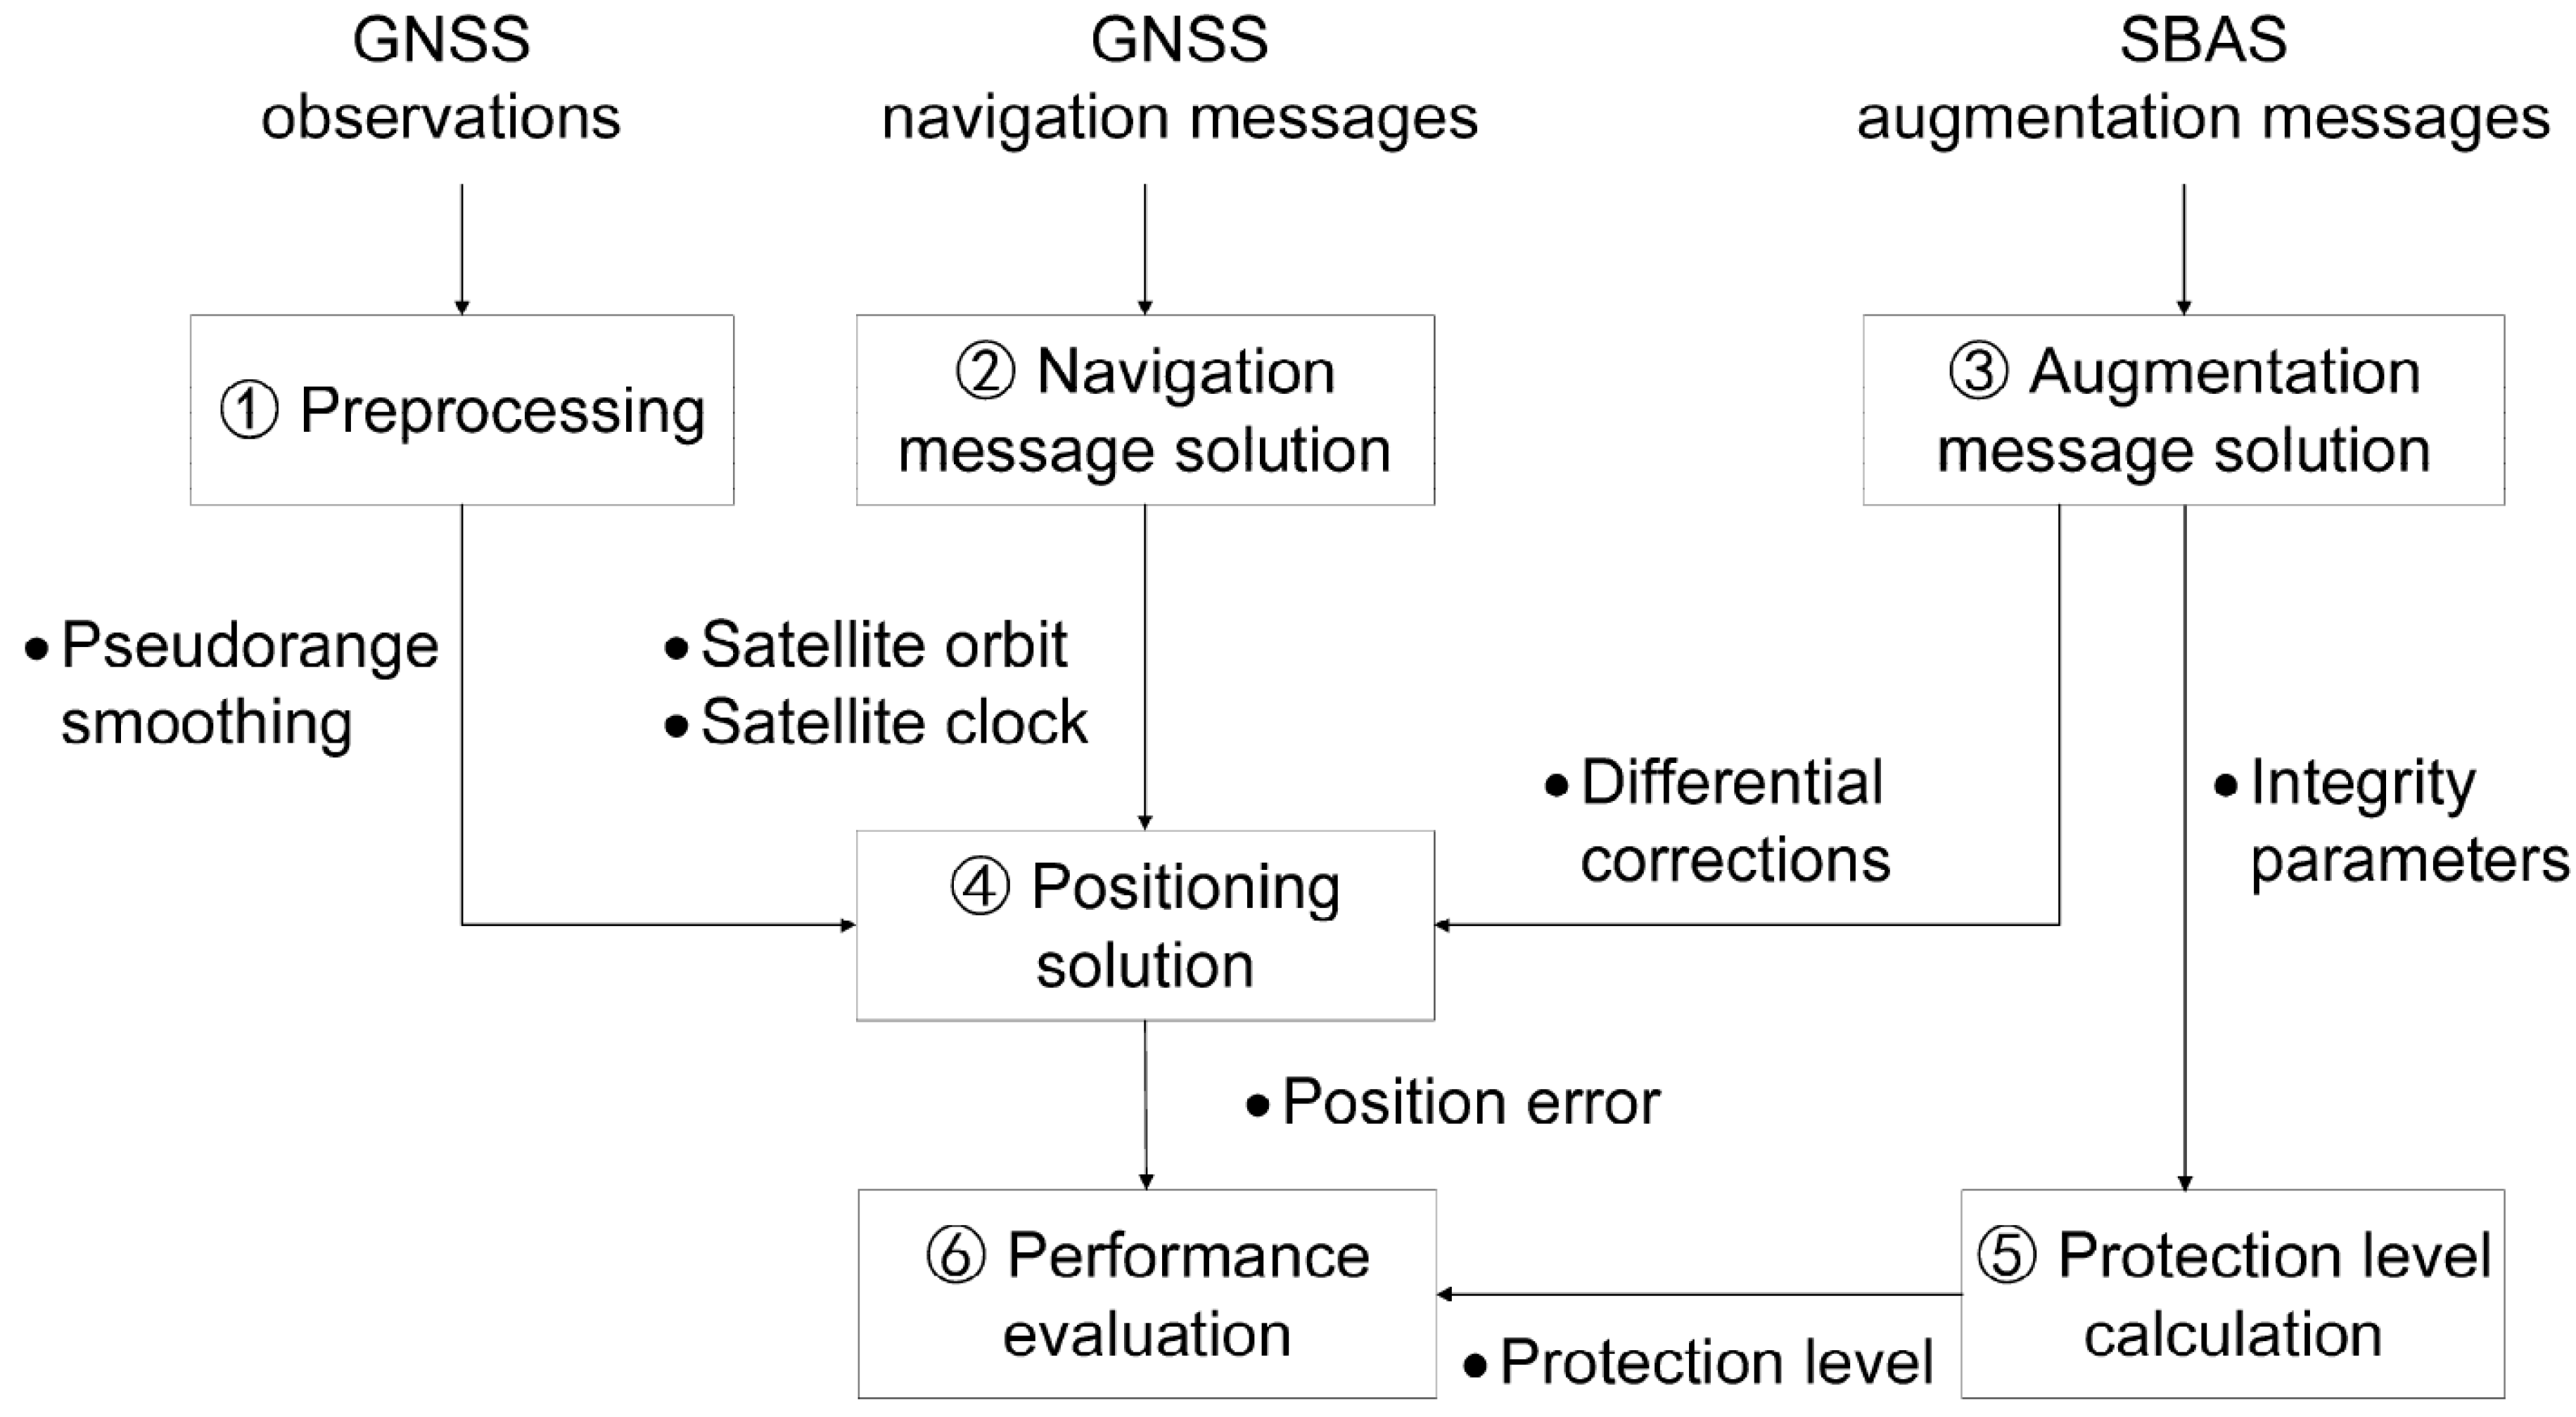
2.2. Operation Flow
2.3. BDSBAS SF Solution
2.3.1. Long-Term Correction and Fast Correction Calculation
Long-Term Correction
Fast Correction
2.3.2. Atmospheric Delay Correction Calculation
Ionospheric Correction
Tropospheric Correction
2.3.3. Degradation Parameter Calculation
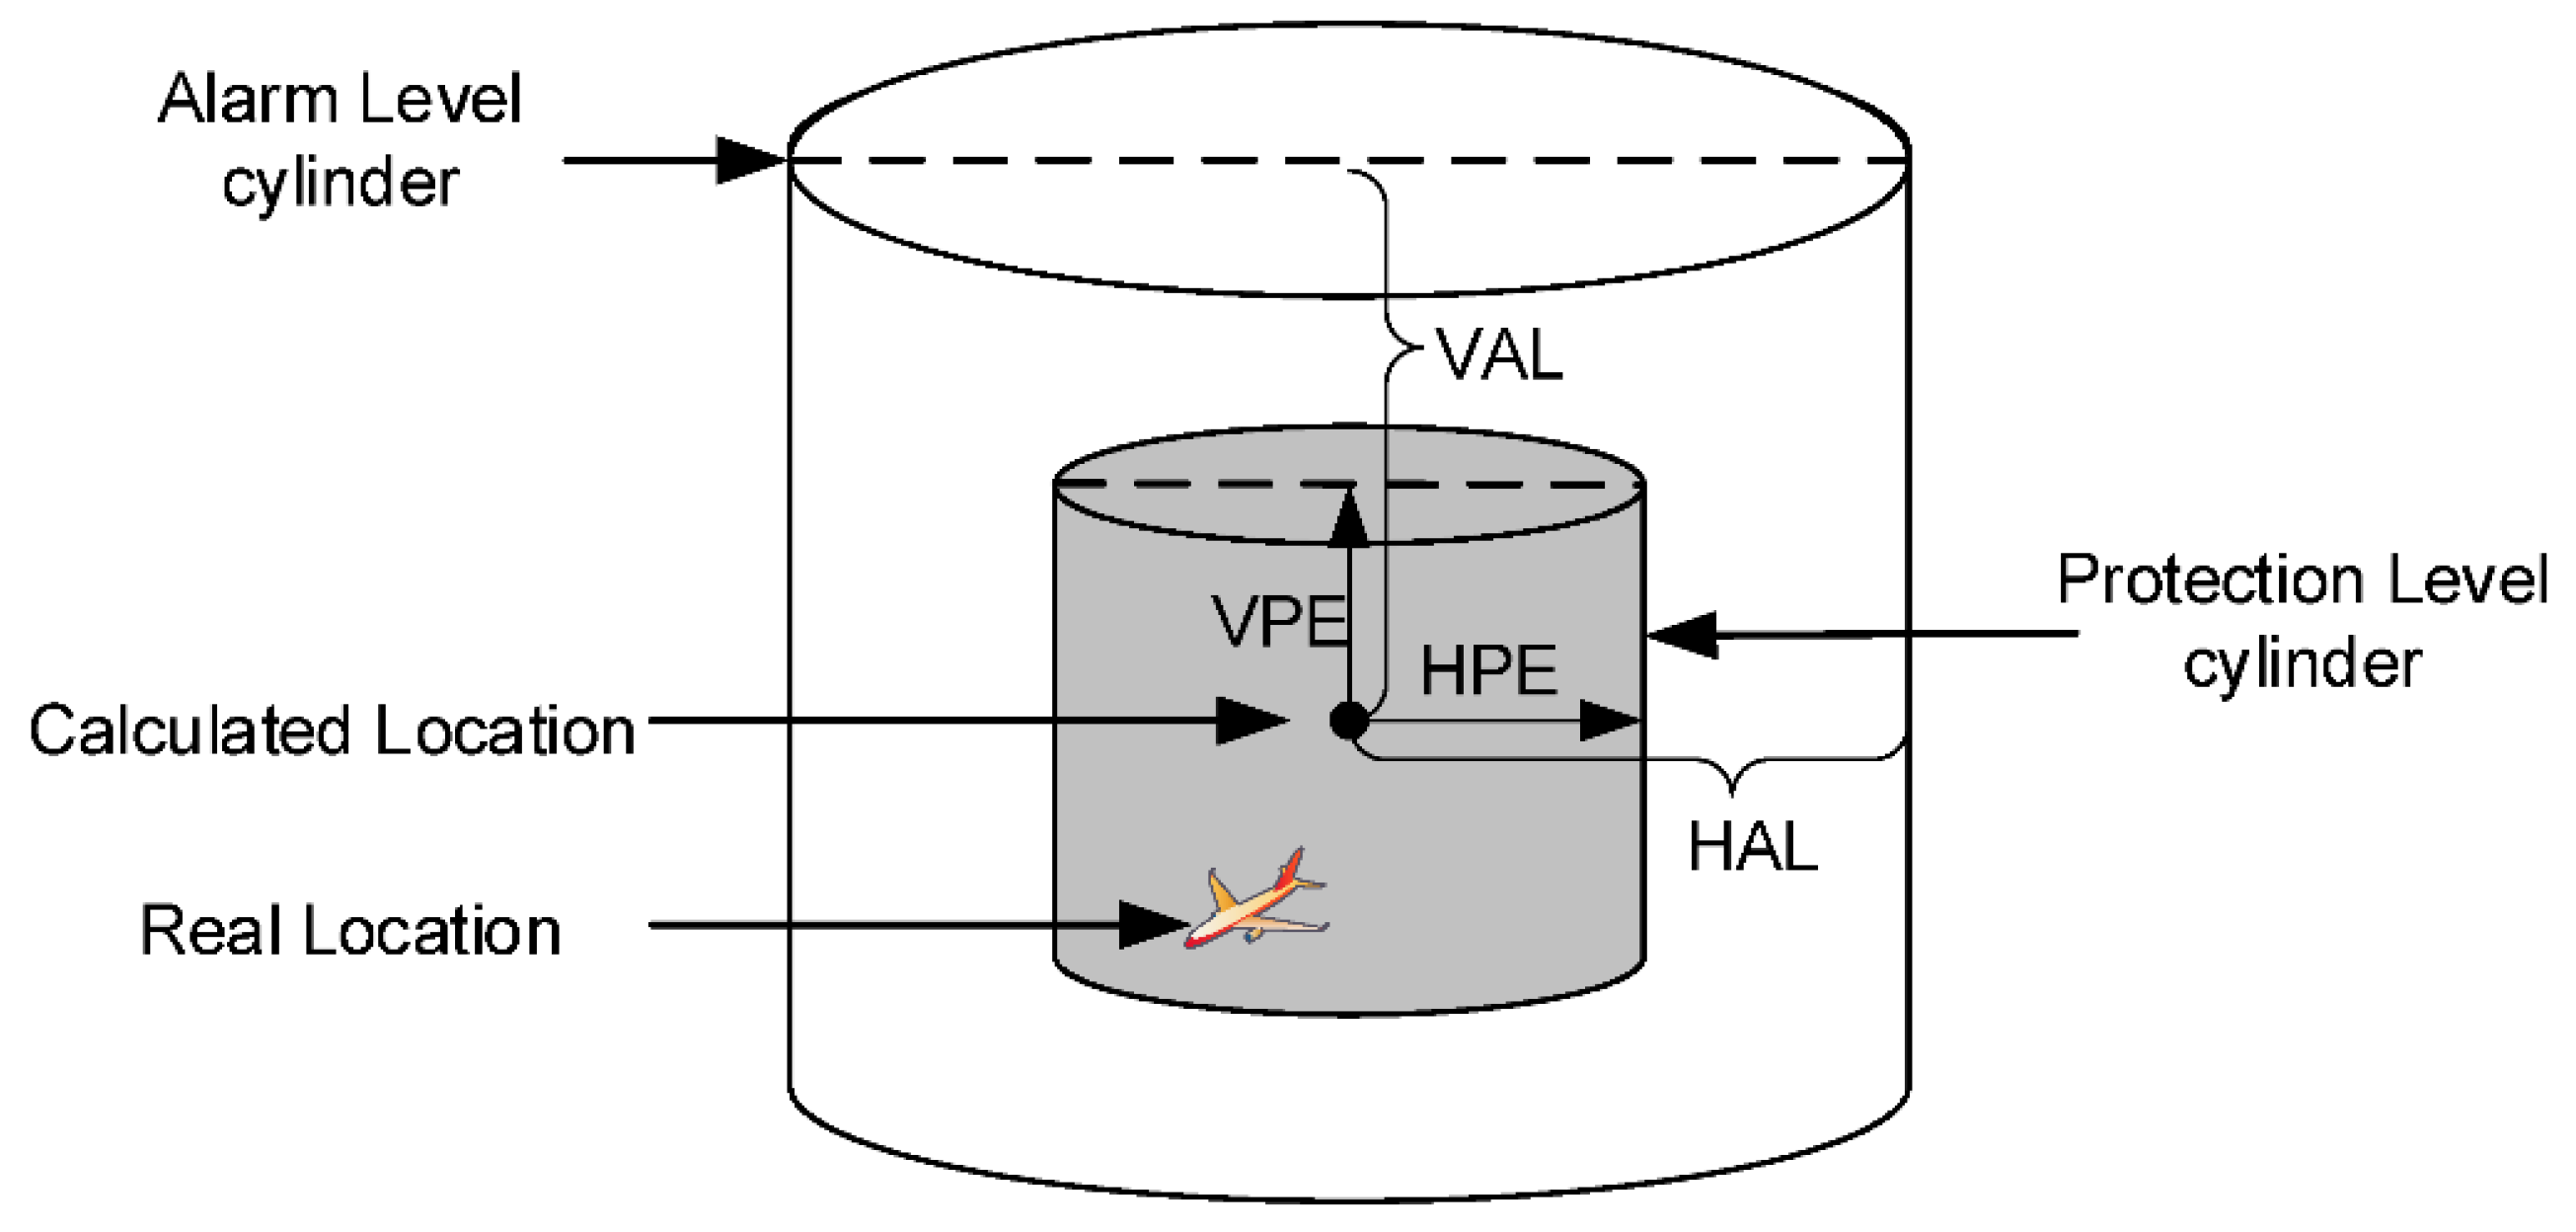
2.3.4. Protection Level Calculation
2.3.5. Carrier Smoothing Pseudo-Range
3. BDSBAS Service Performance Evaluation
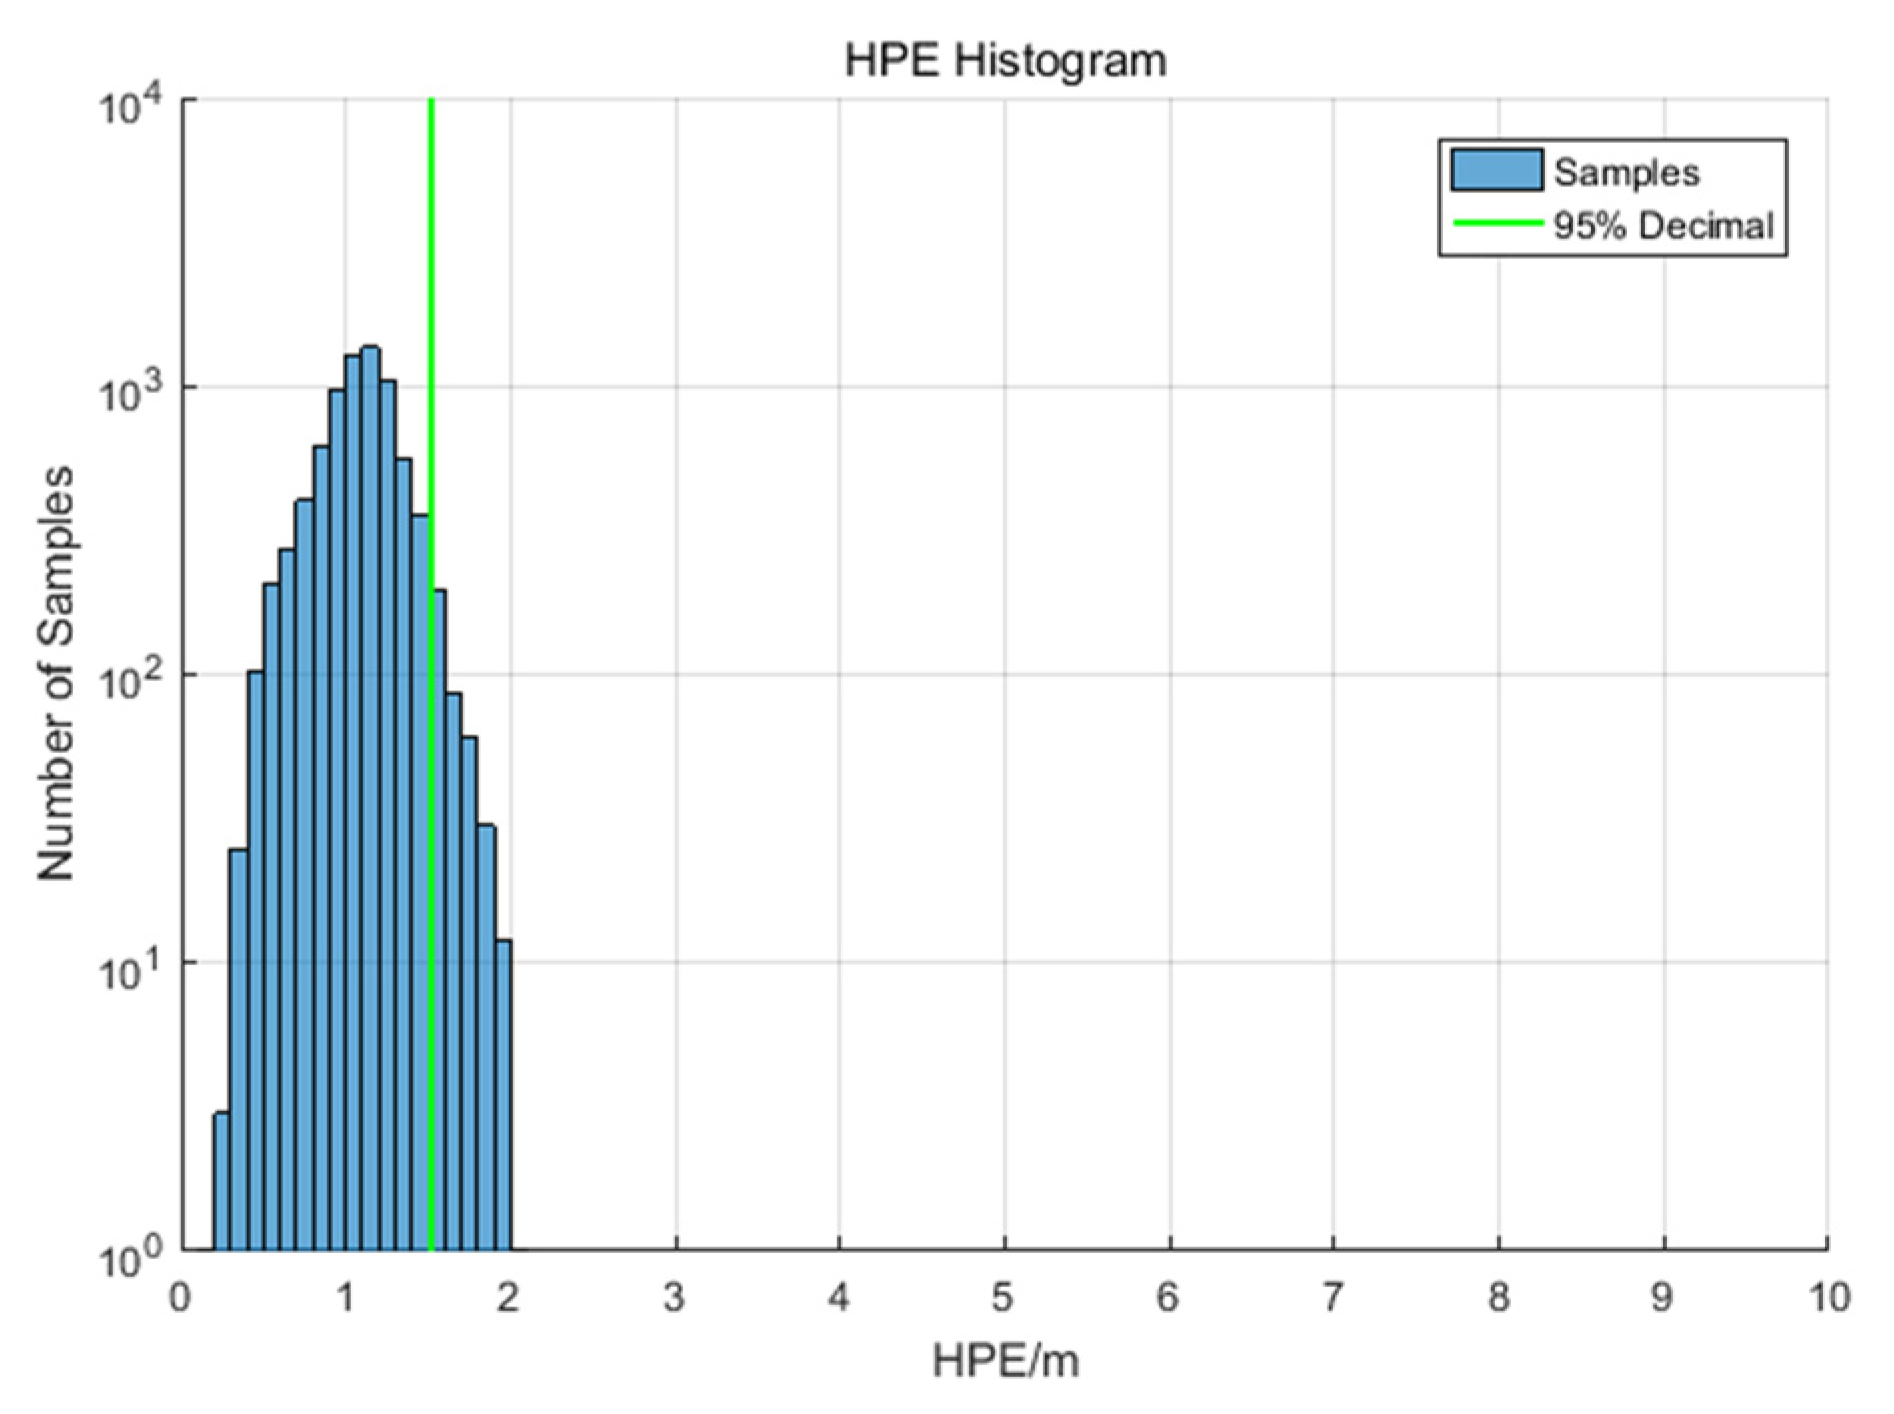
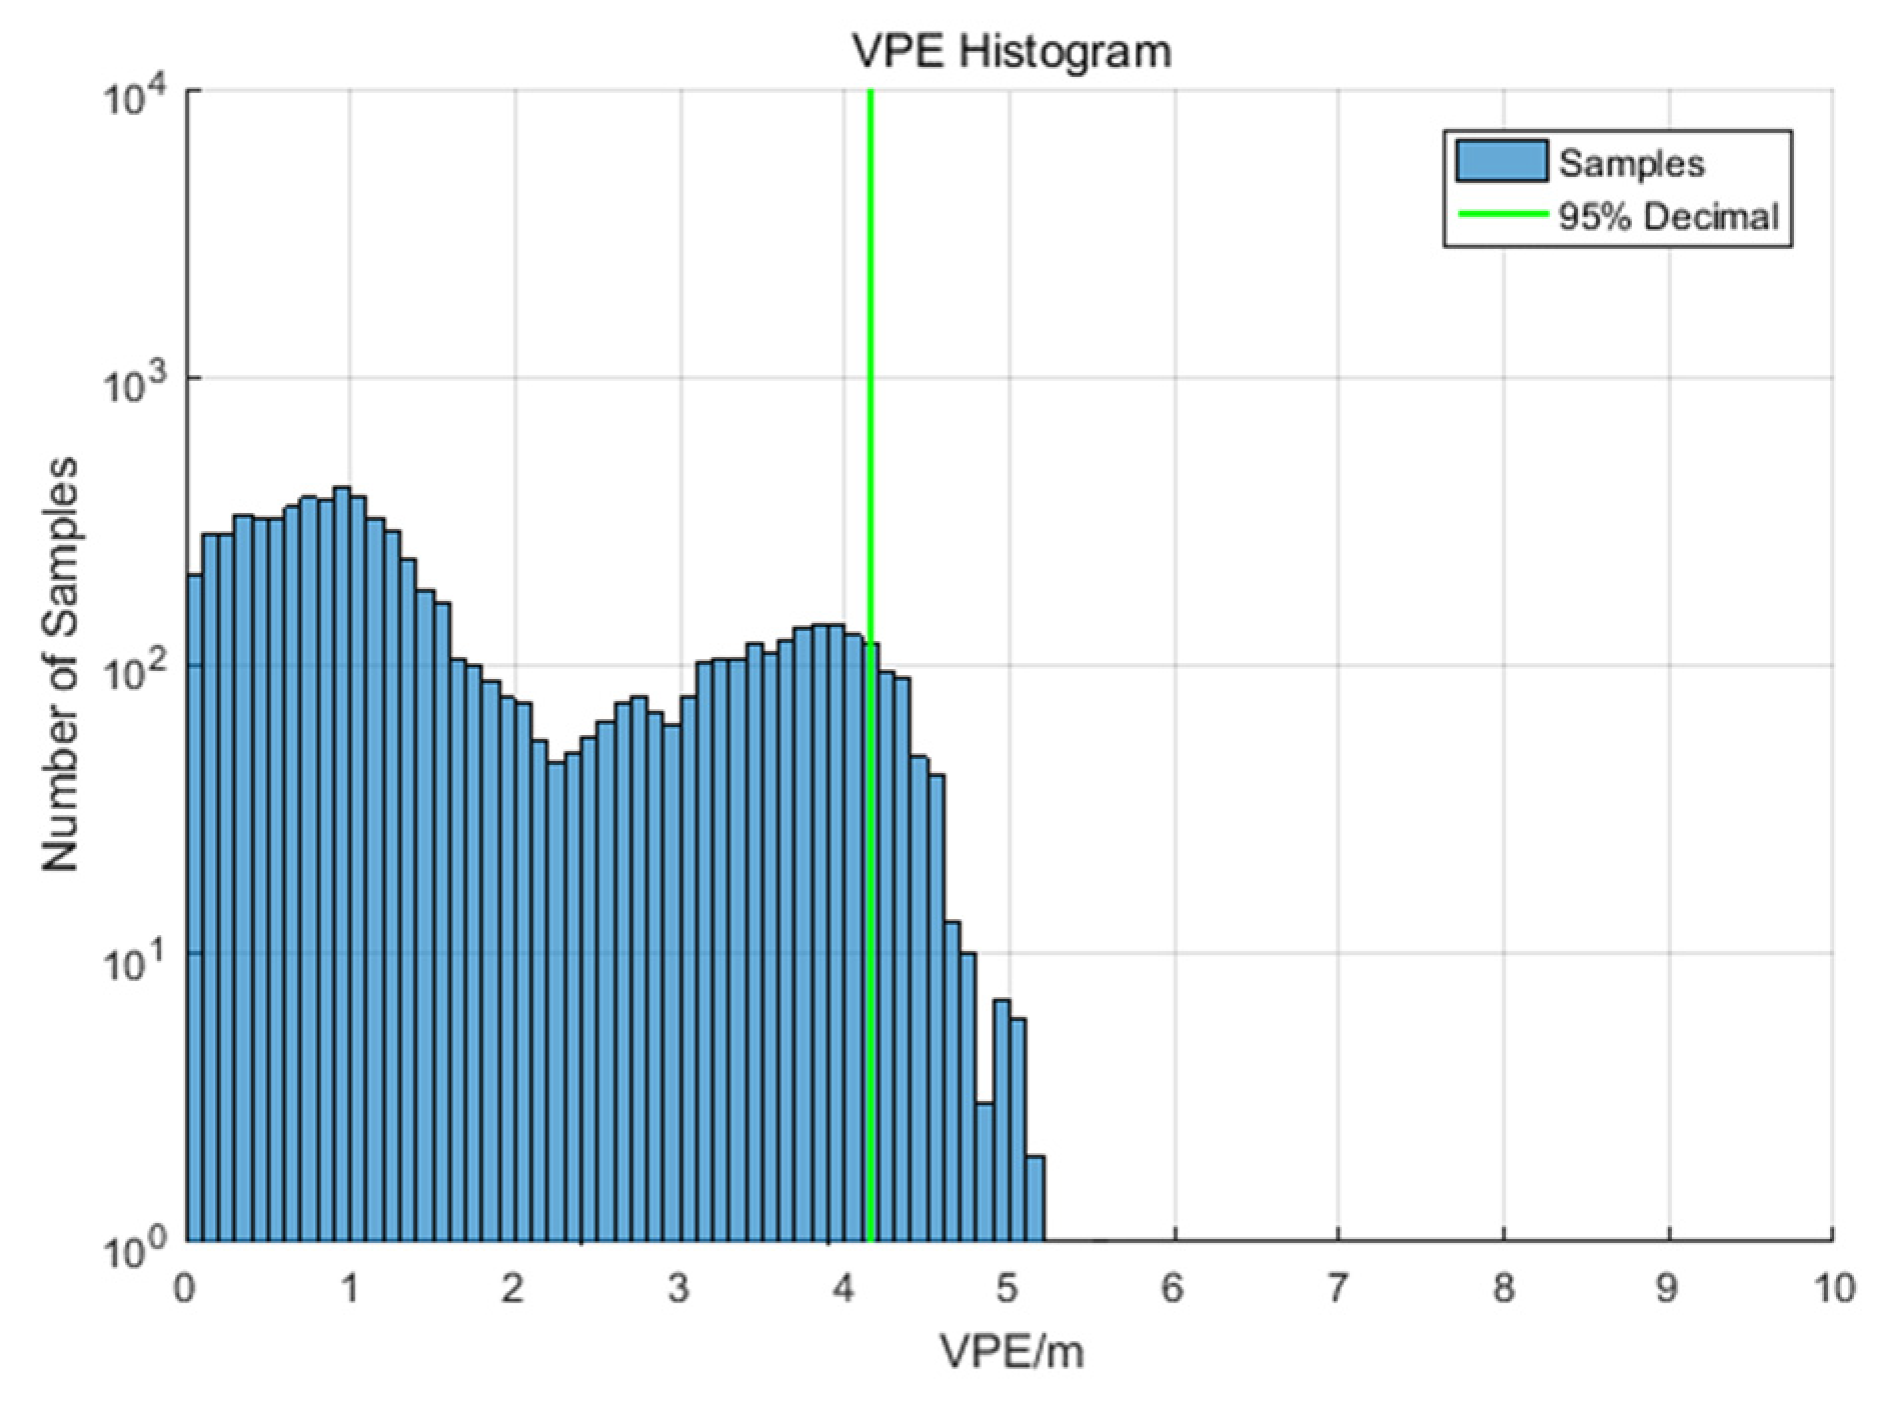
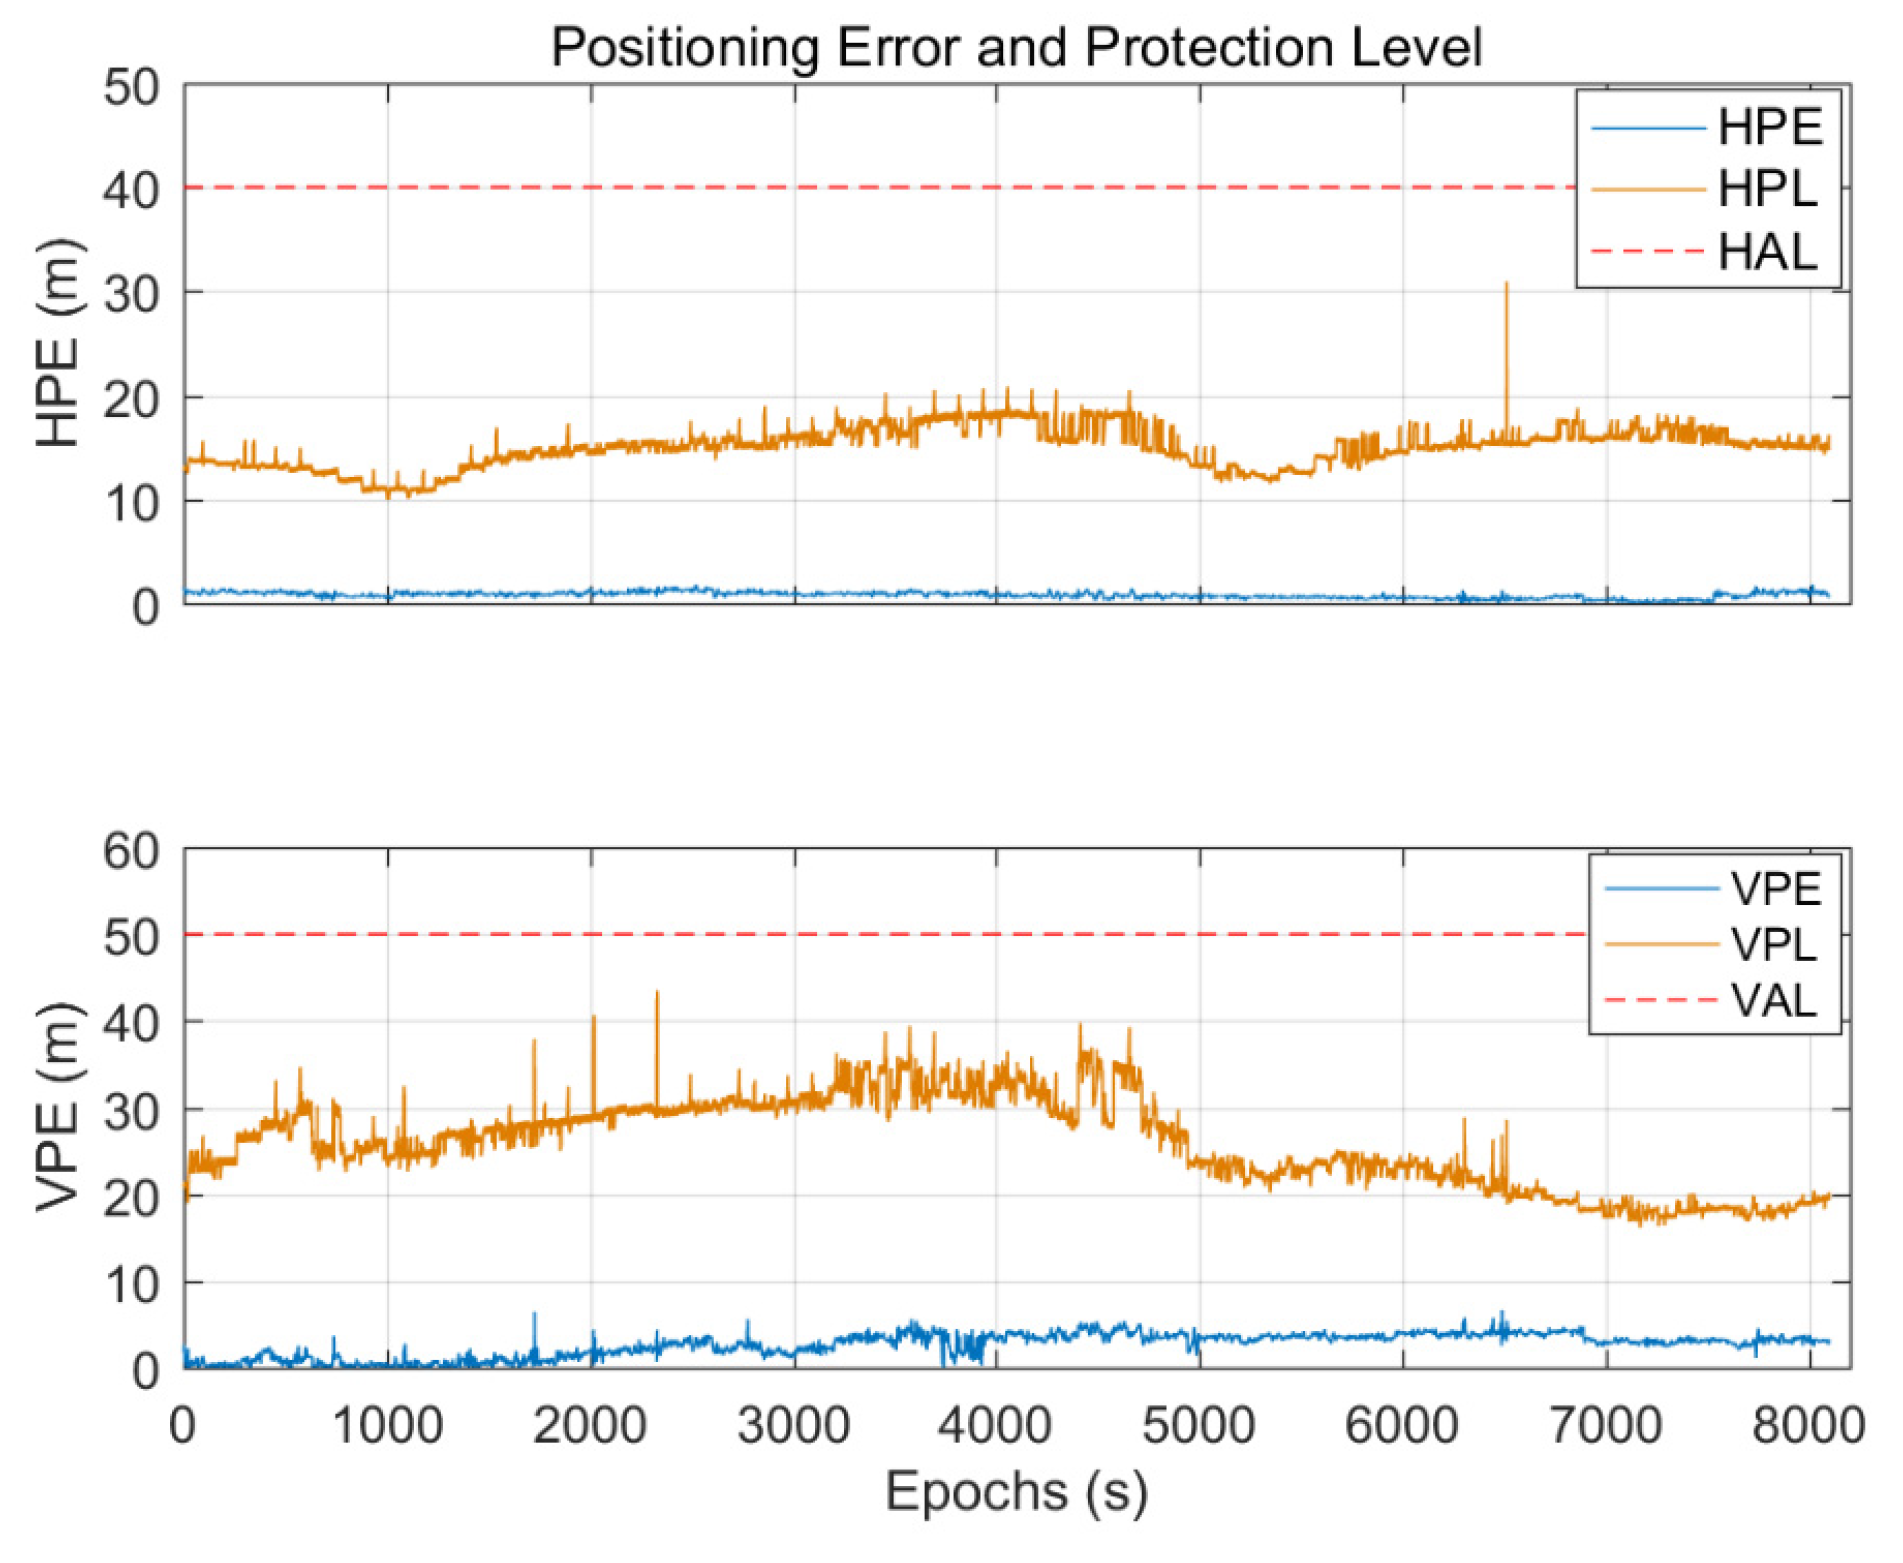
3.1. Positioning Accuracy
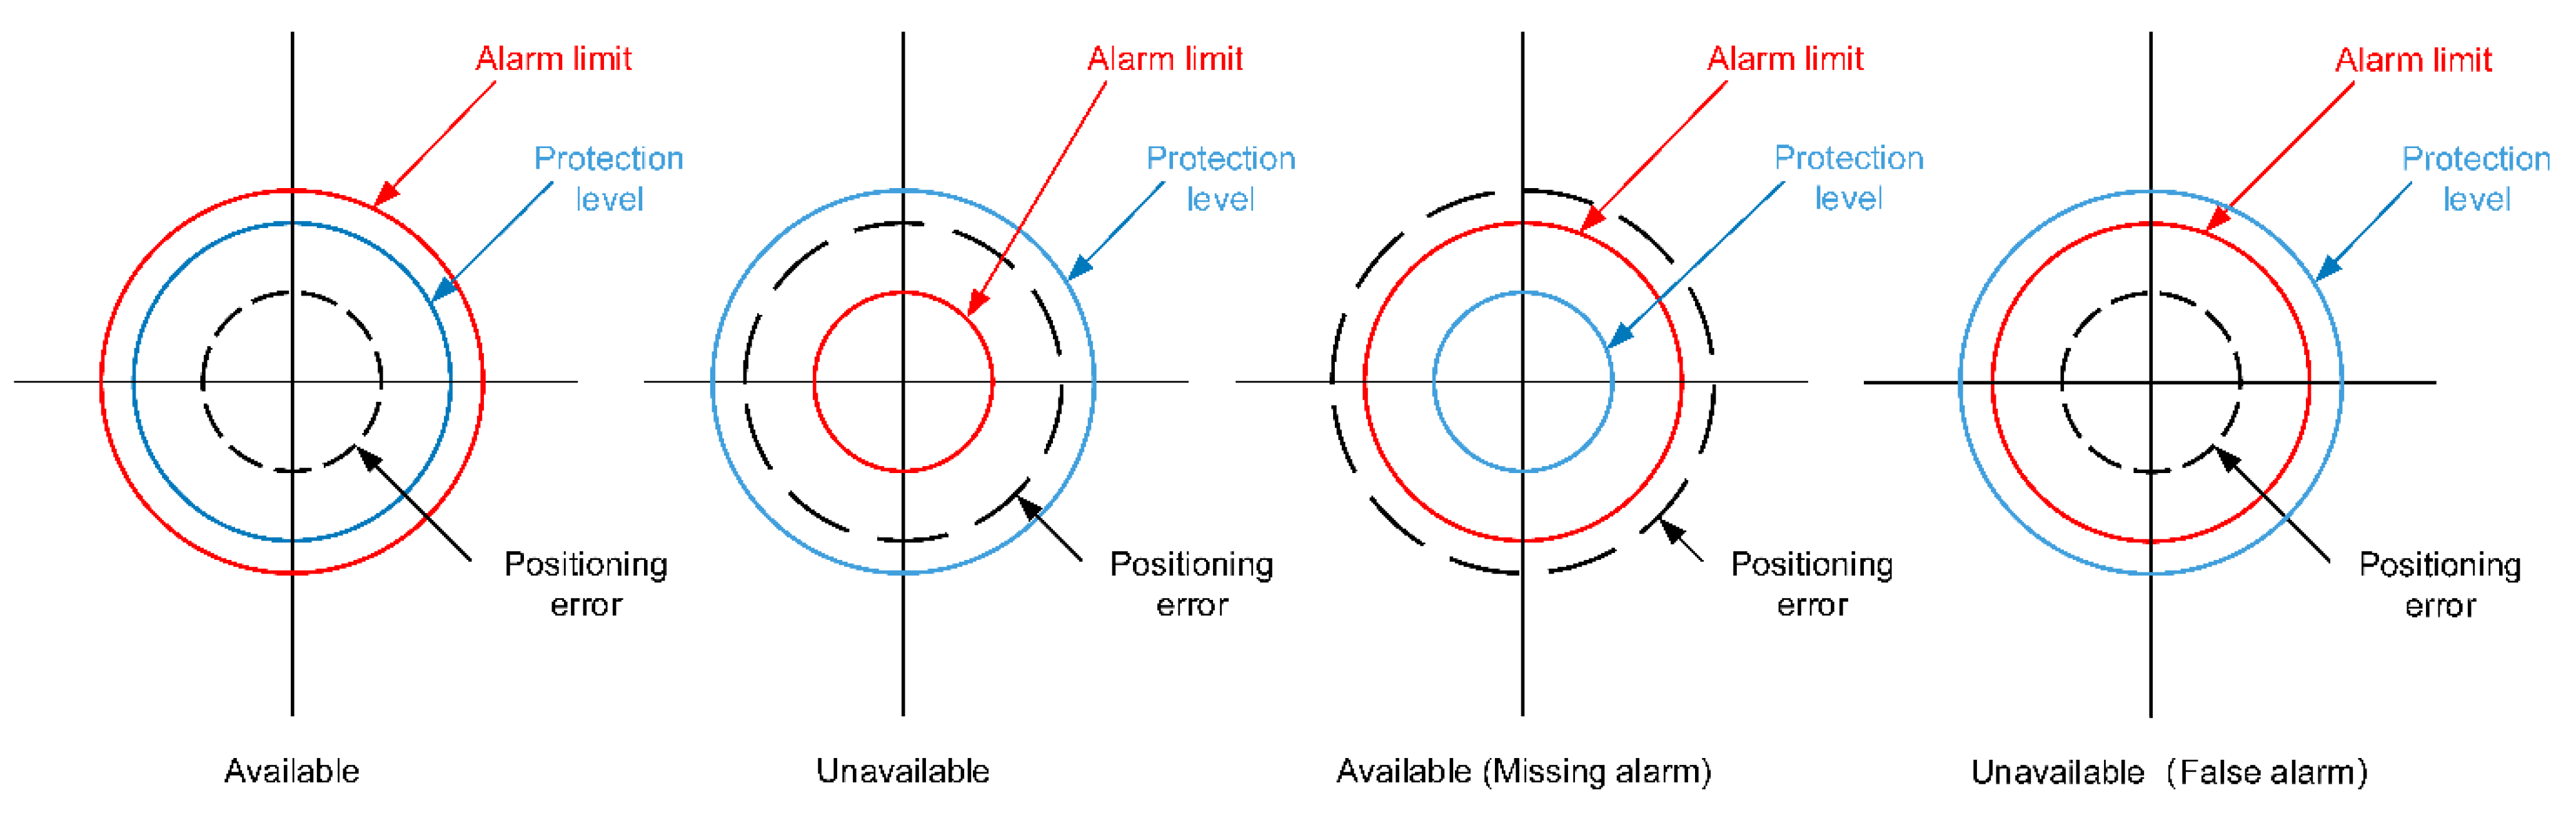
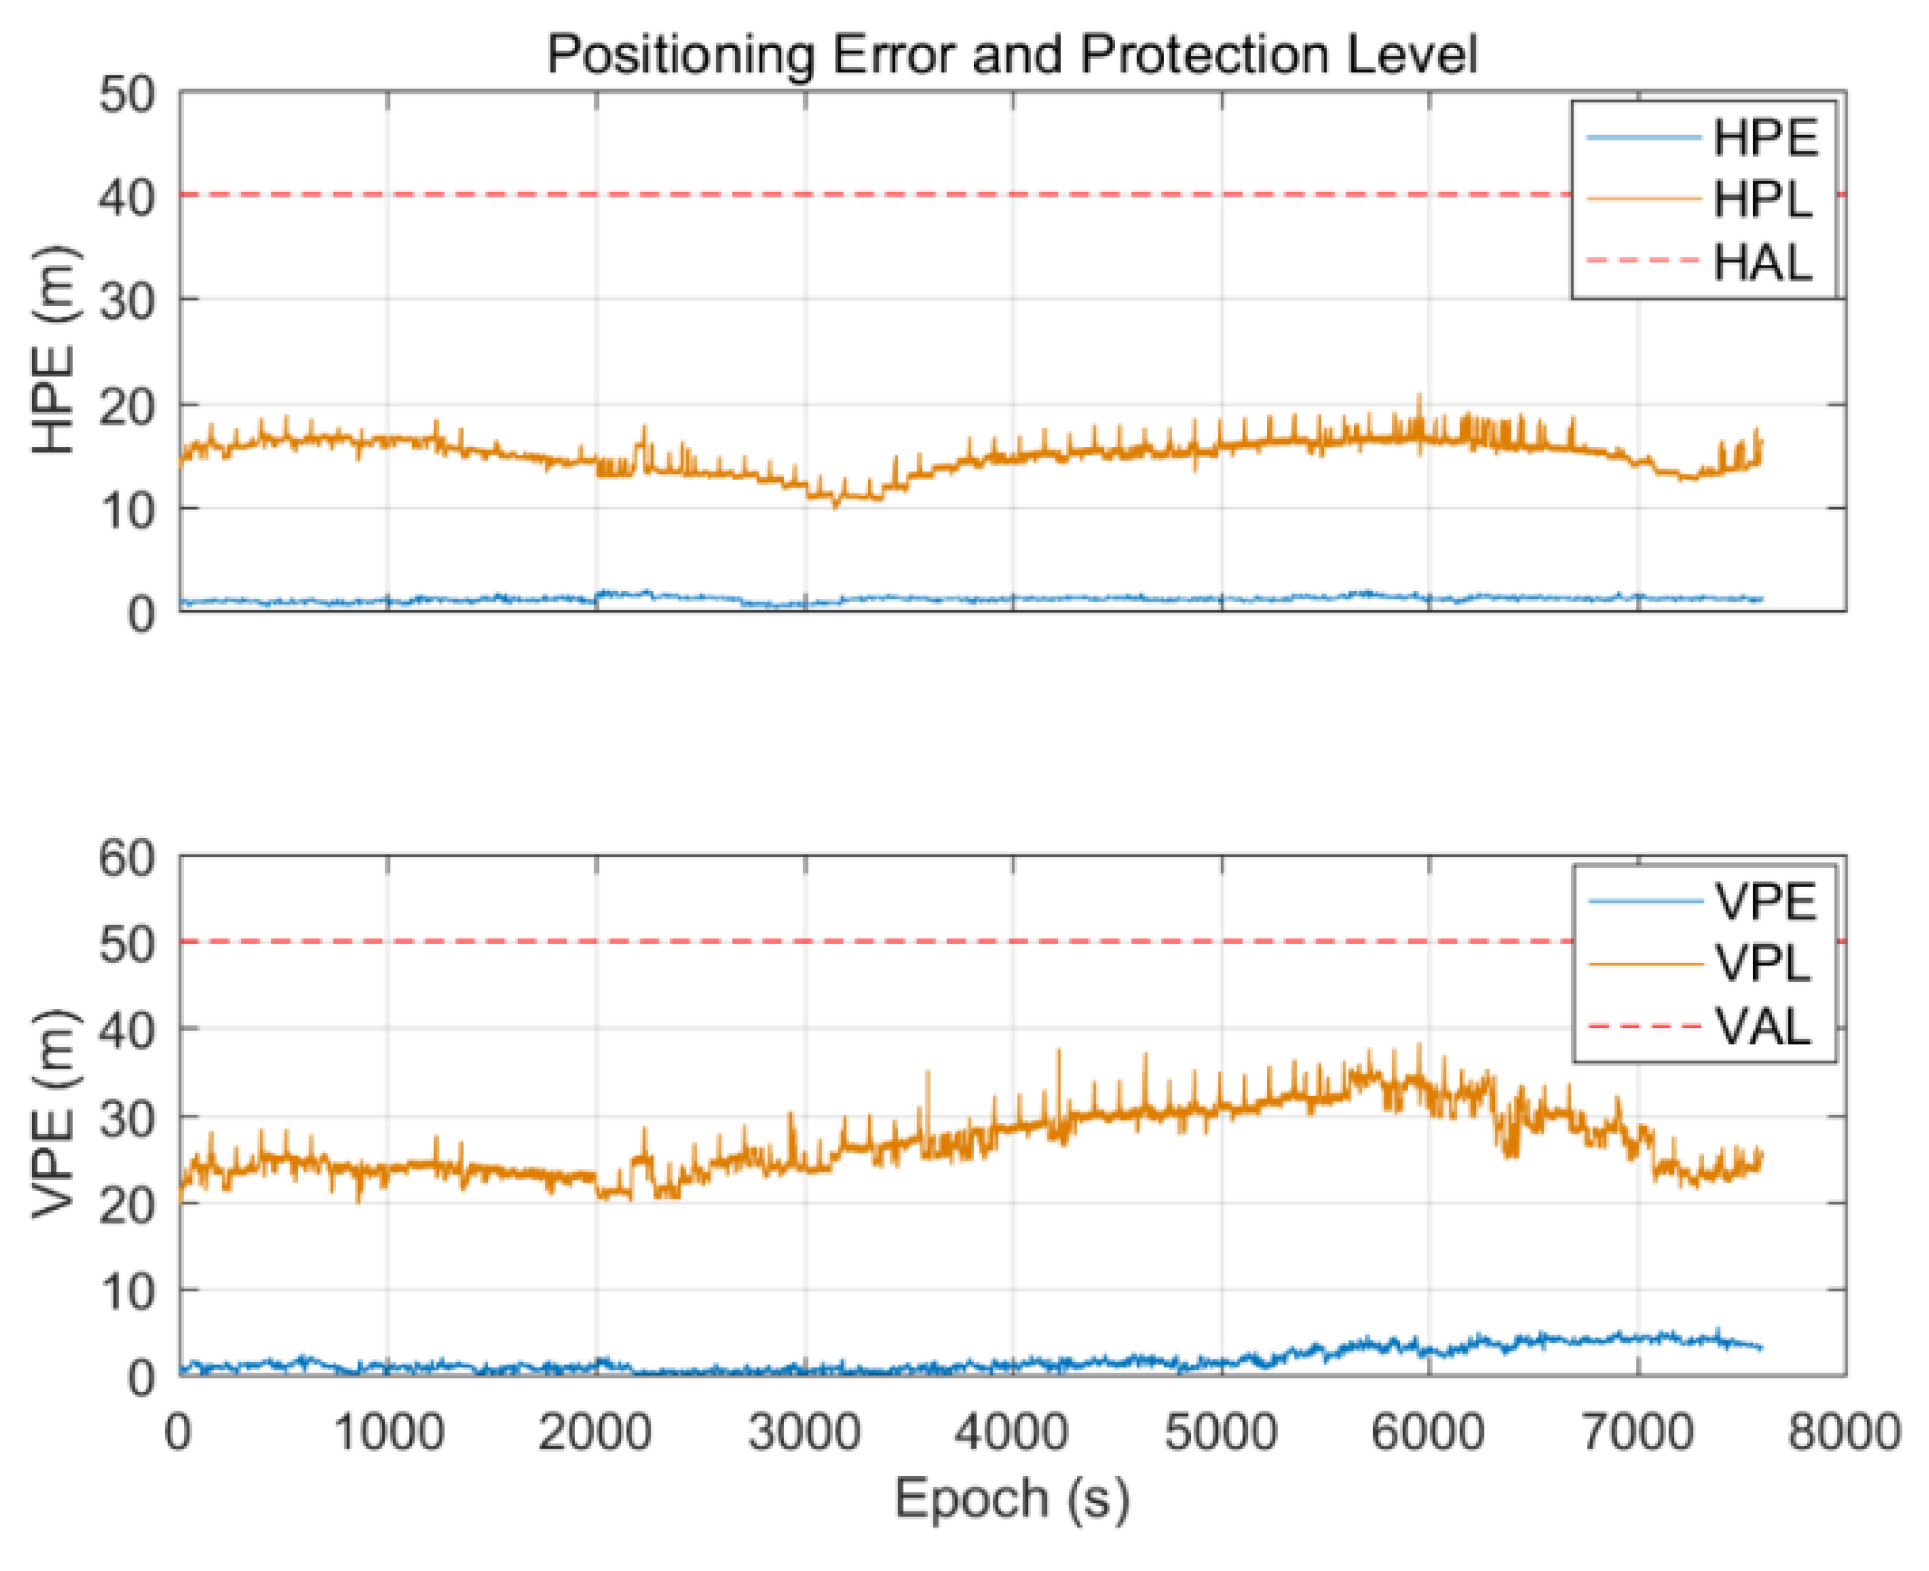
3.2. Availability
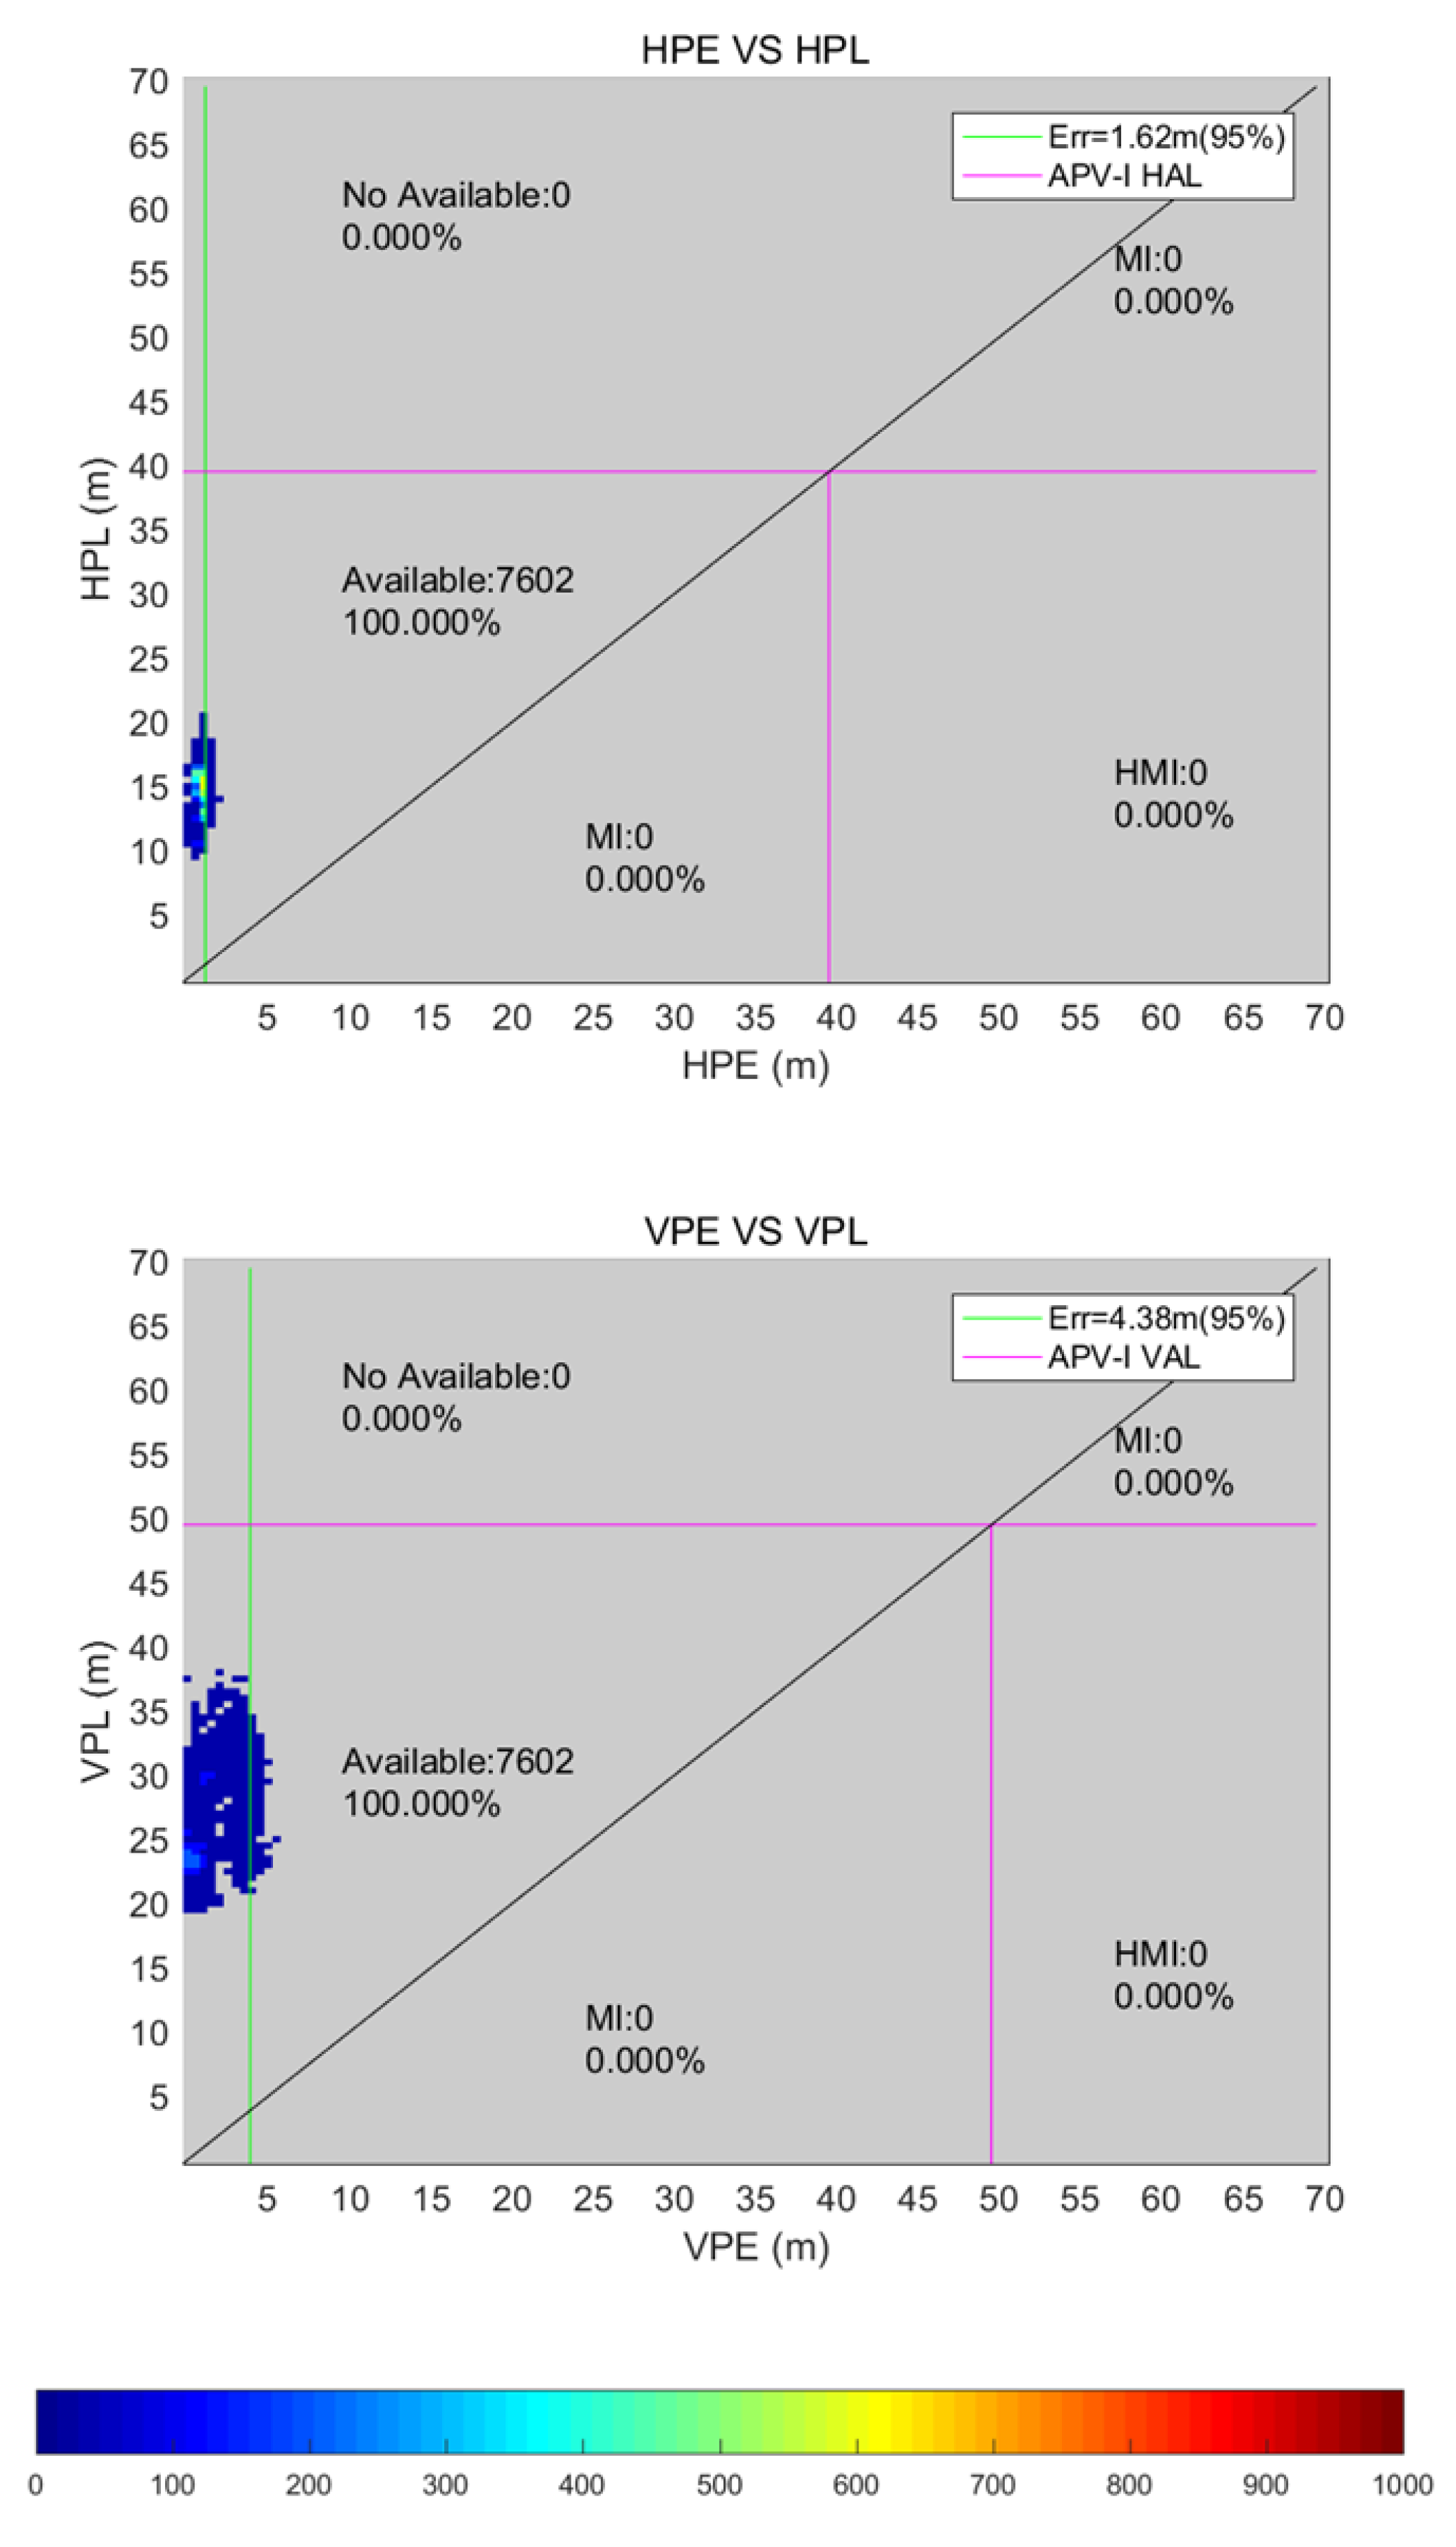
- The positioning error (PE) is less than the protection level, and the PL is less than the AL. Therefore the service is available;
- The PE is less than the AL, and the AL is less than the PL. The service is unavailable;
- The PL is less than the AL, and the AL is less than the PE. In this case, the service will be misjudged as available, causing system miss alarms and result in serious integrity risk events;
- The PE is less than the AL, and the AL is less than the PL. In this case, the service will be misjudged as unavailable, causing system false alarms and affecting the availability and continuity of the service.
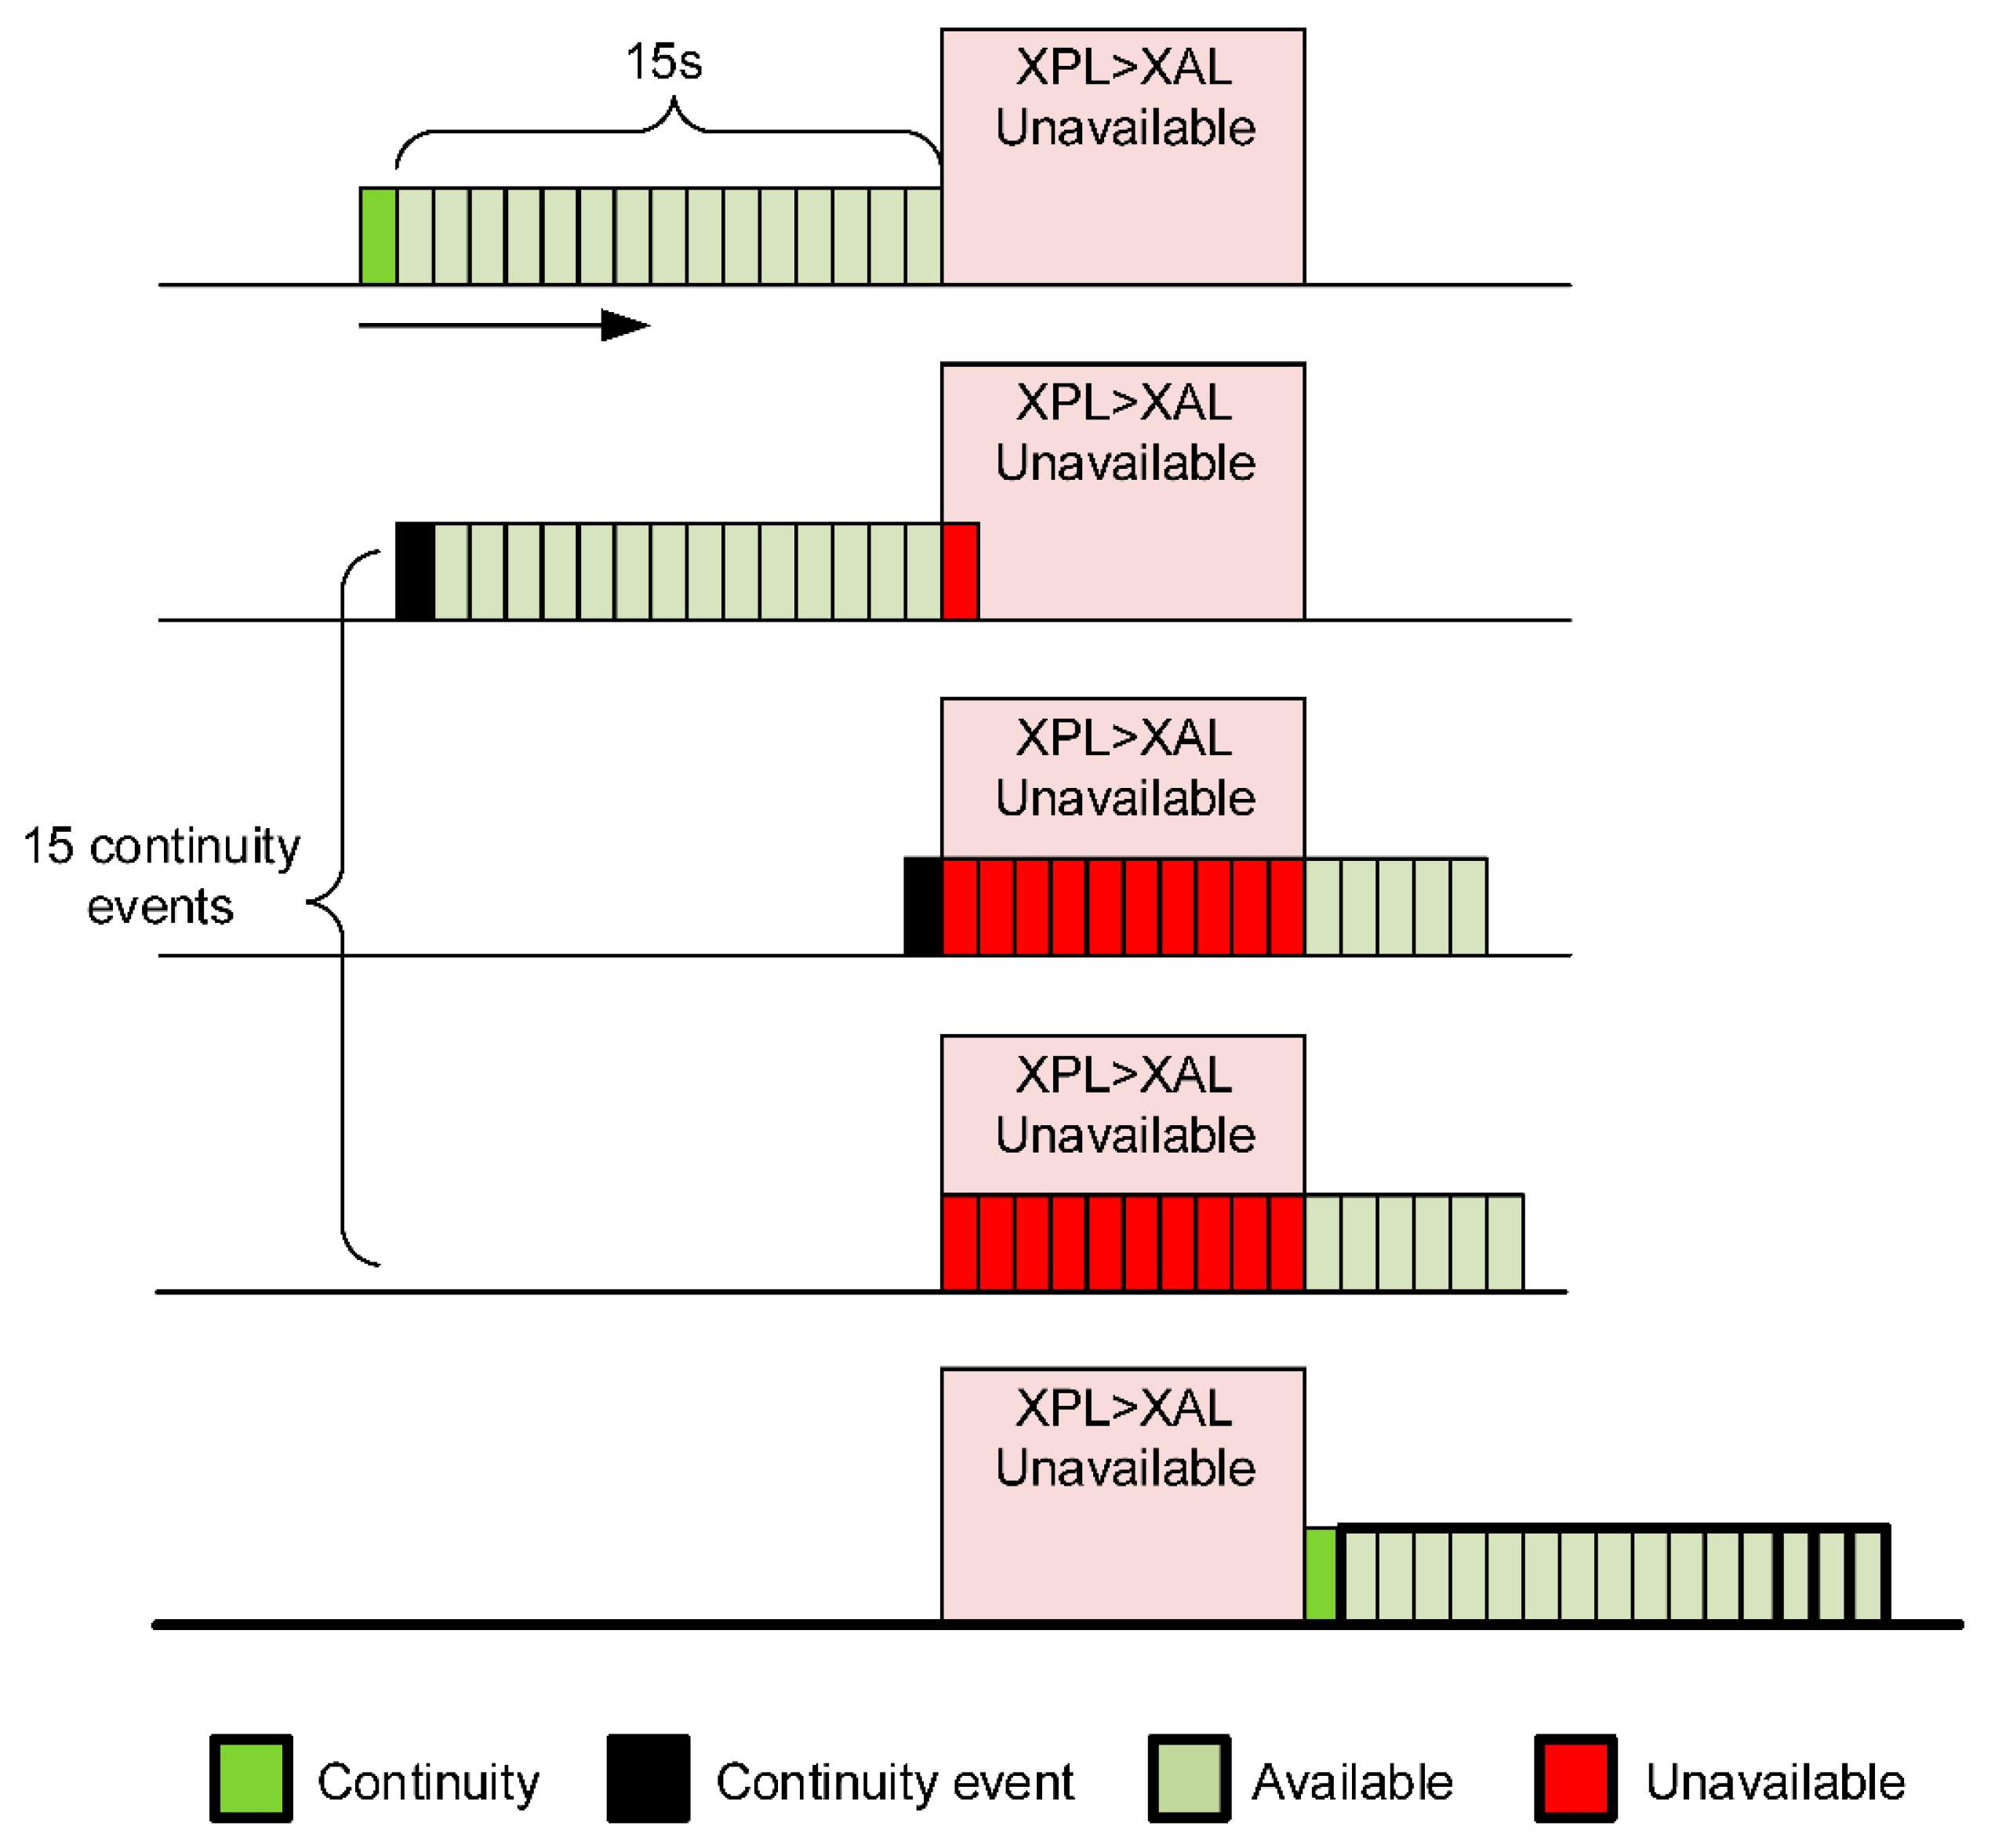
3.3. Continuity
3.4. Integrity
4. BDSBAS Aviation Flight Test
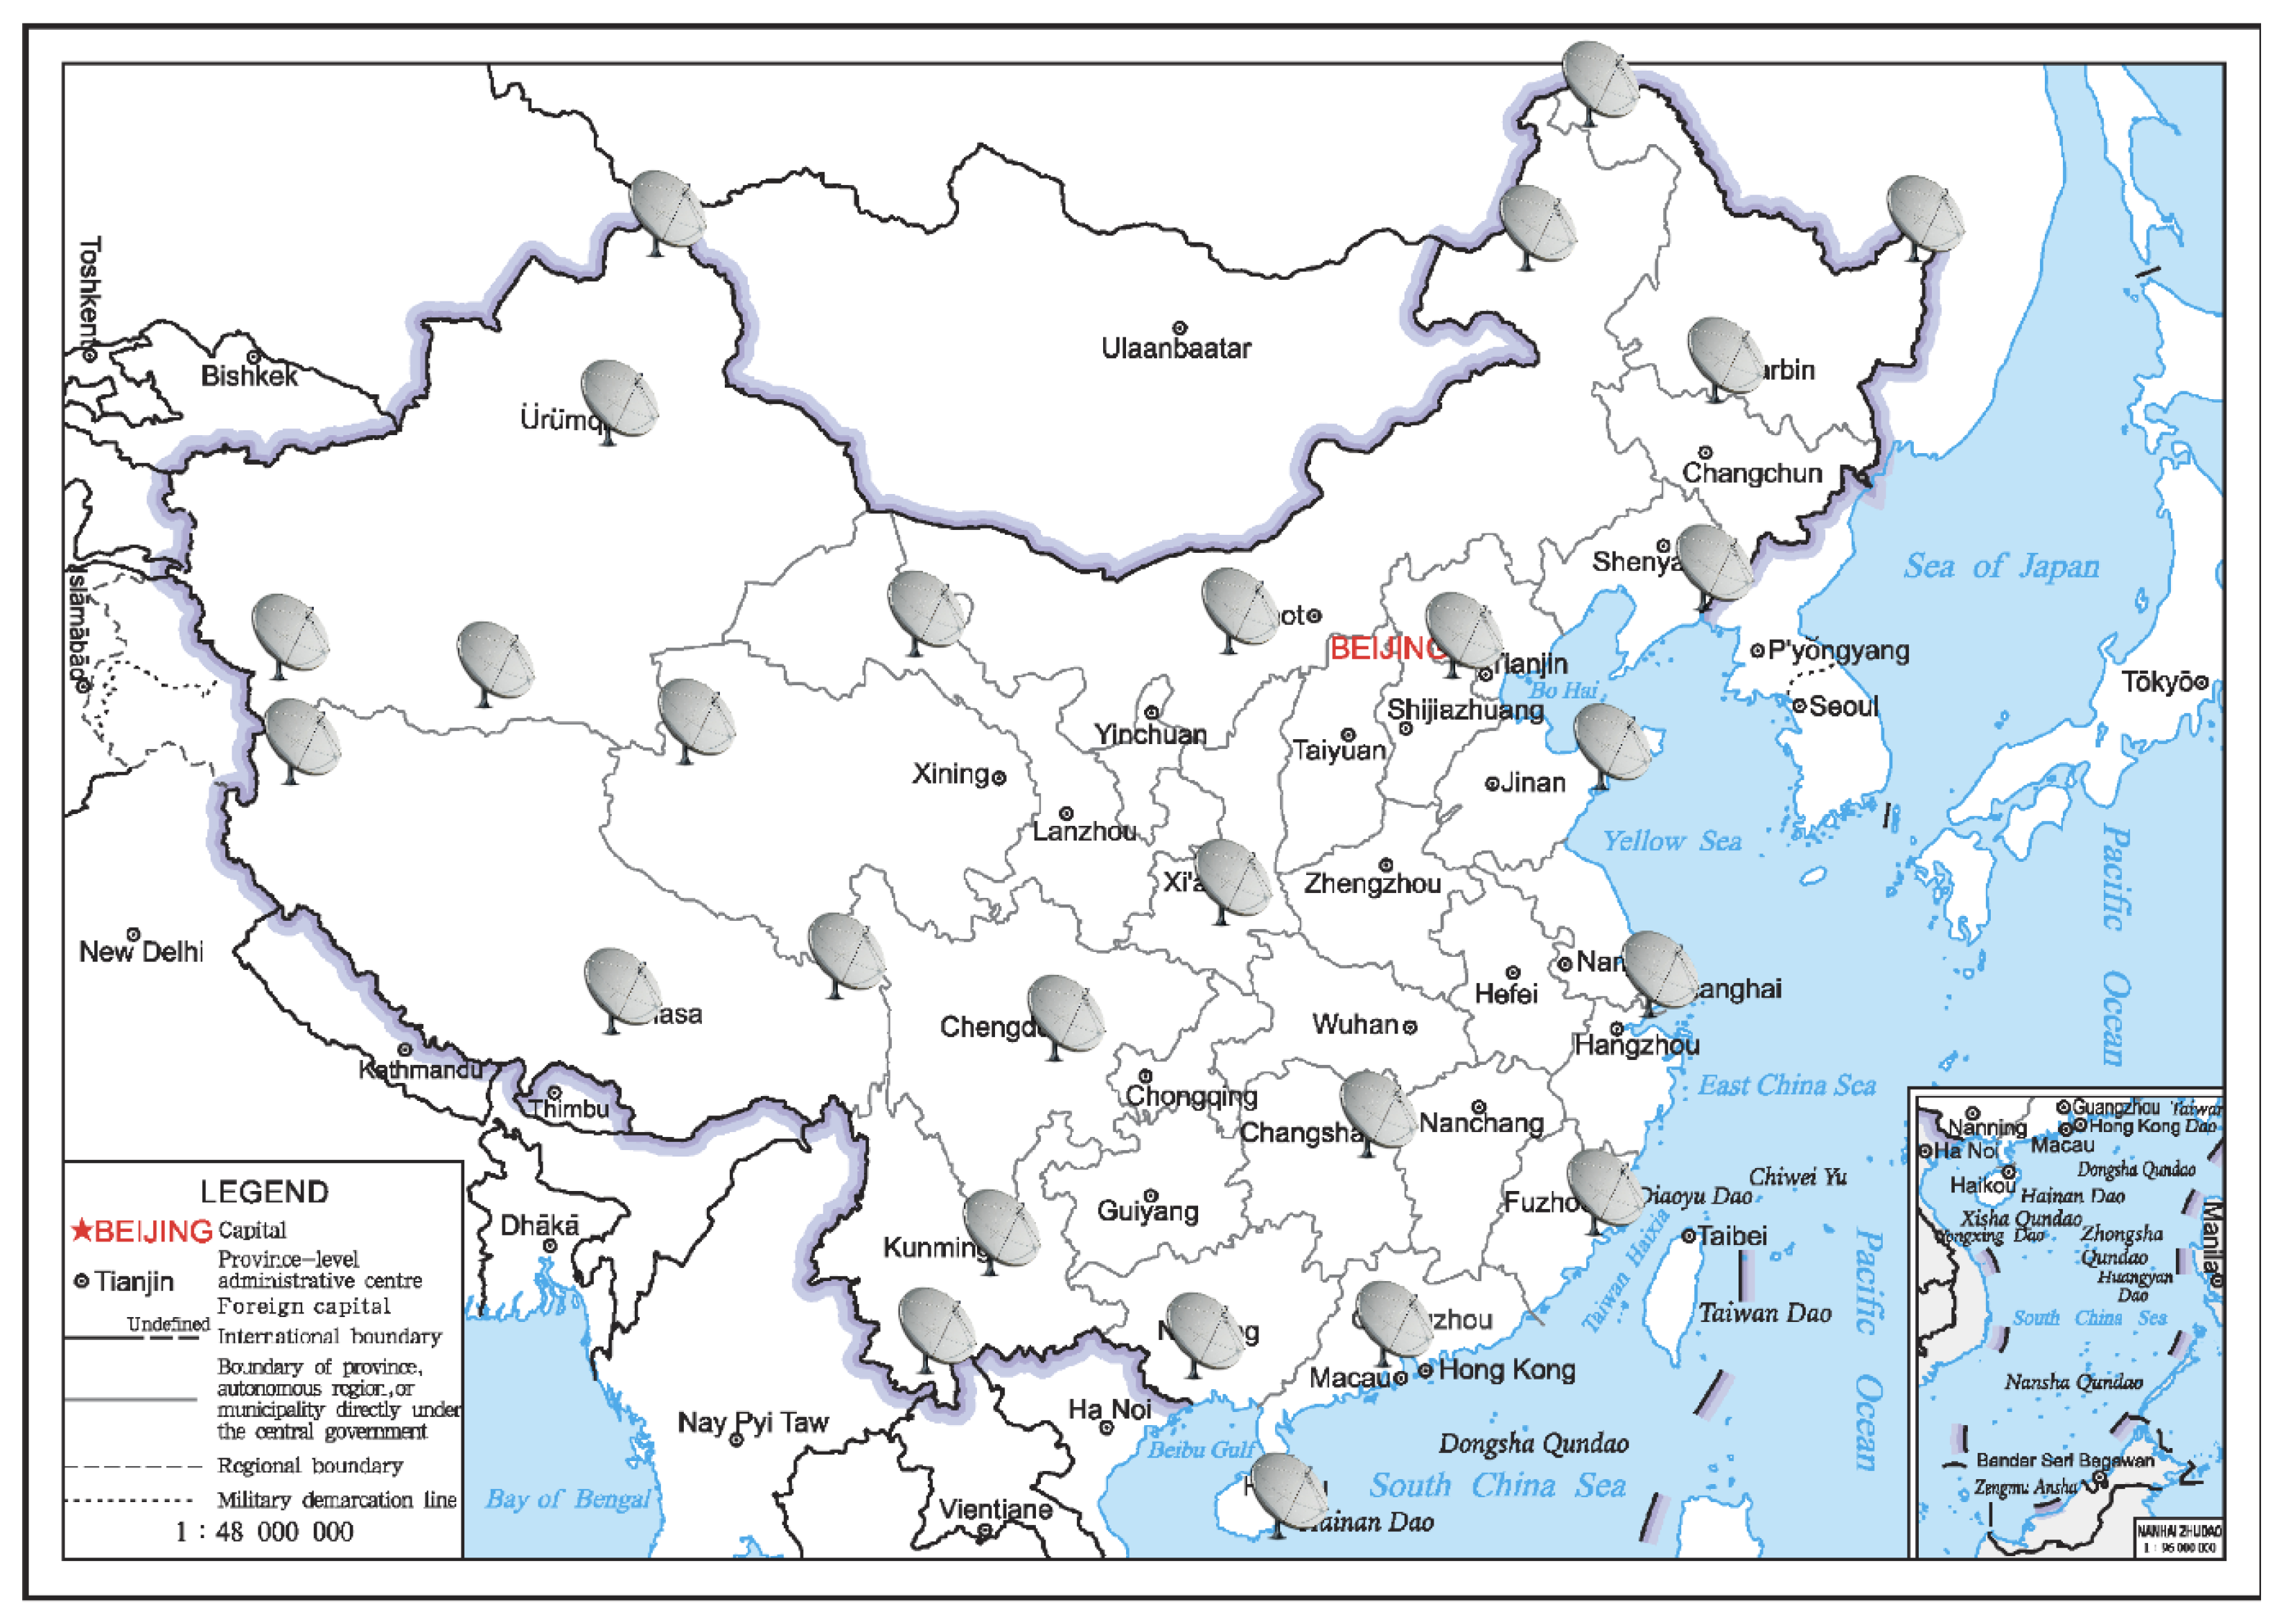
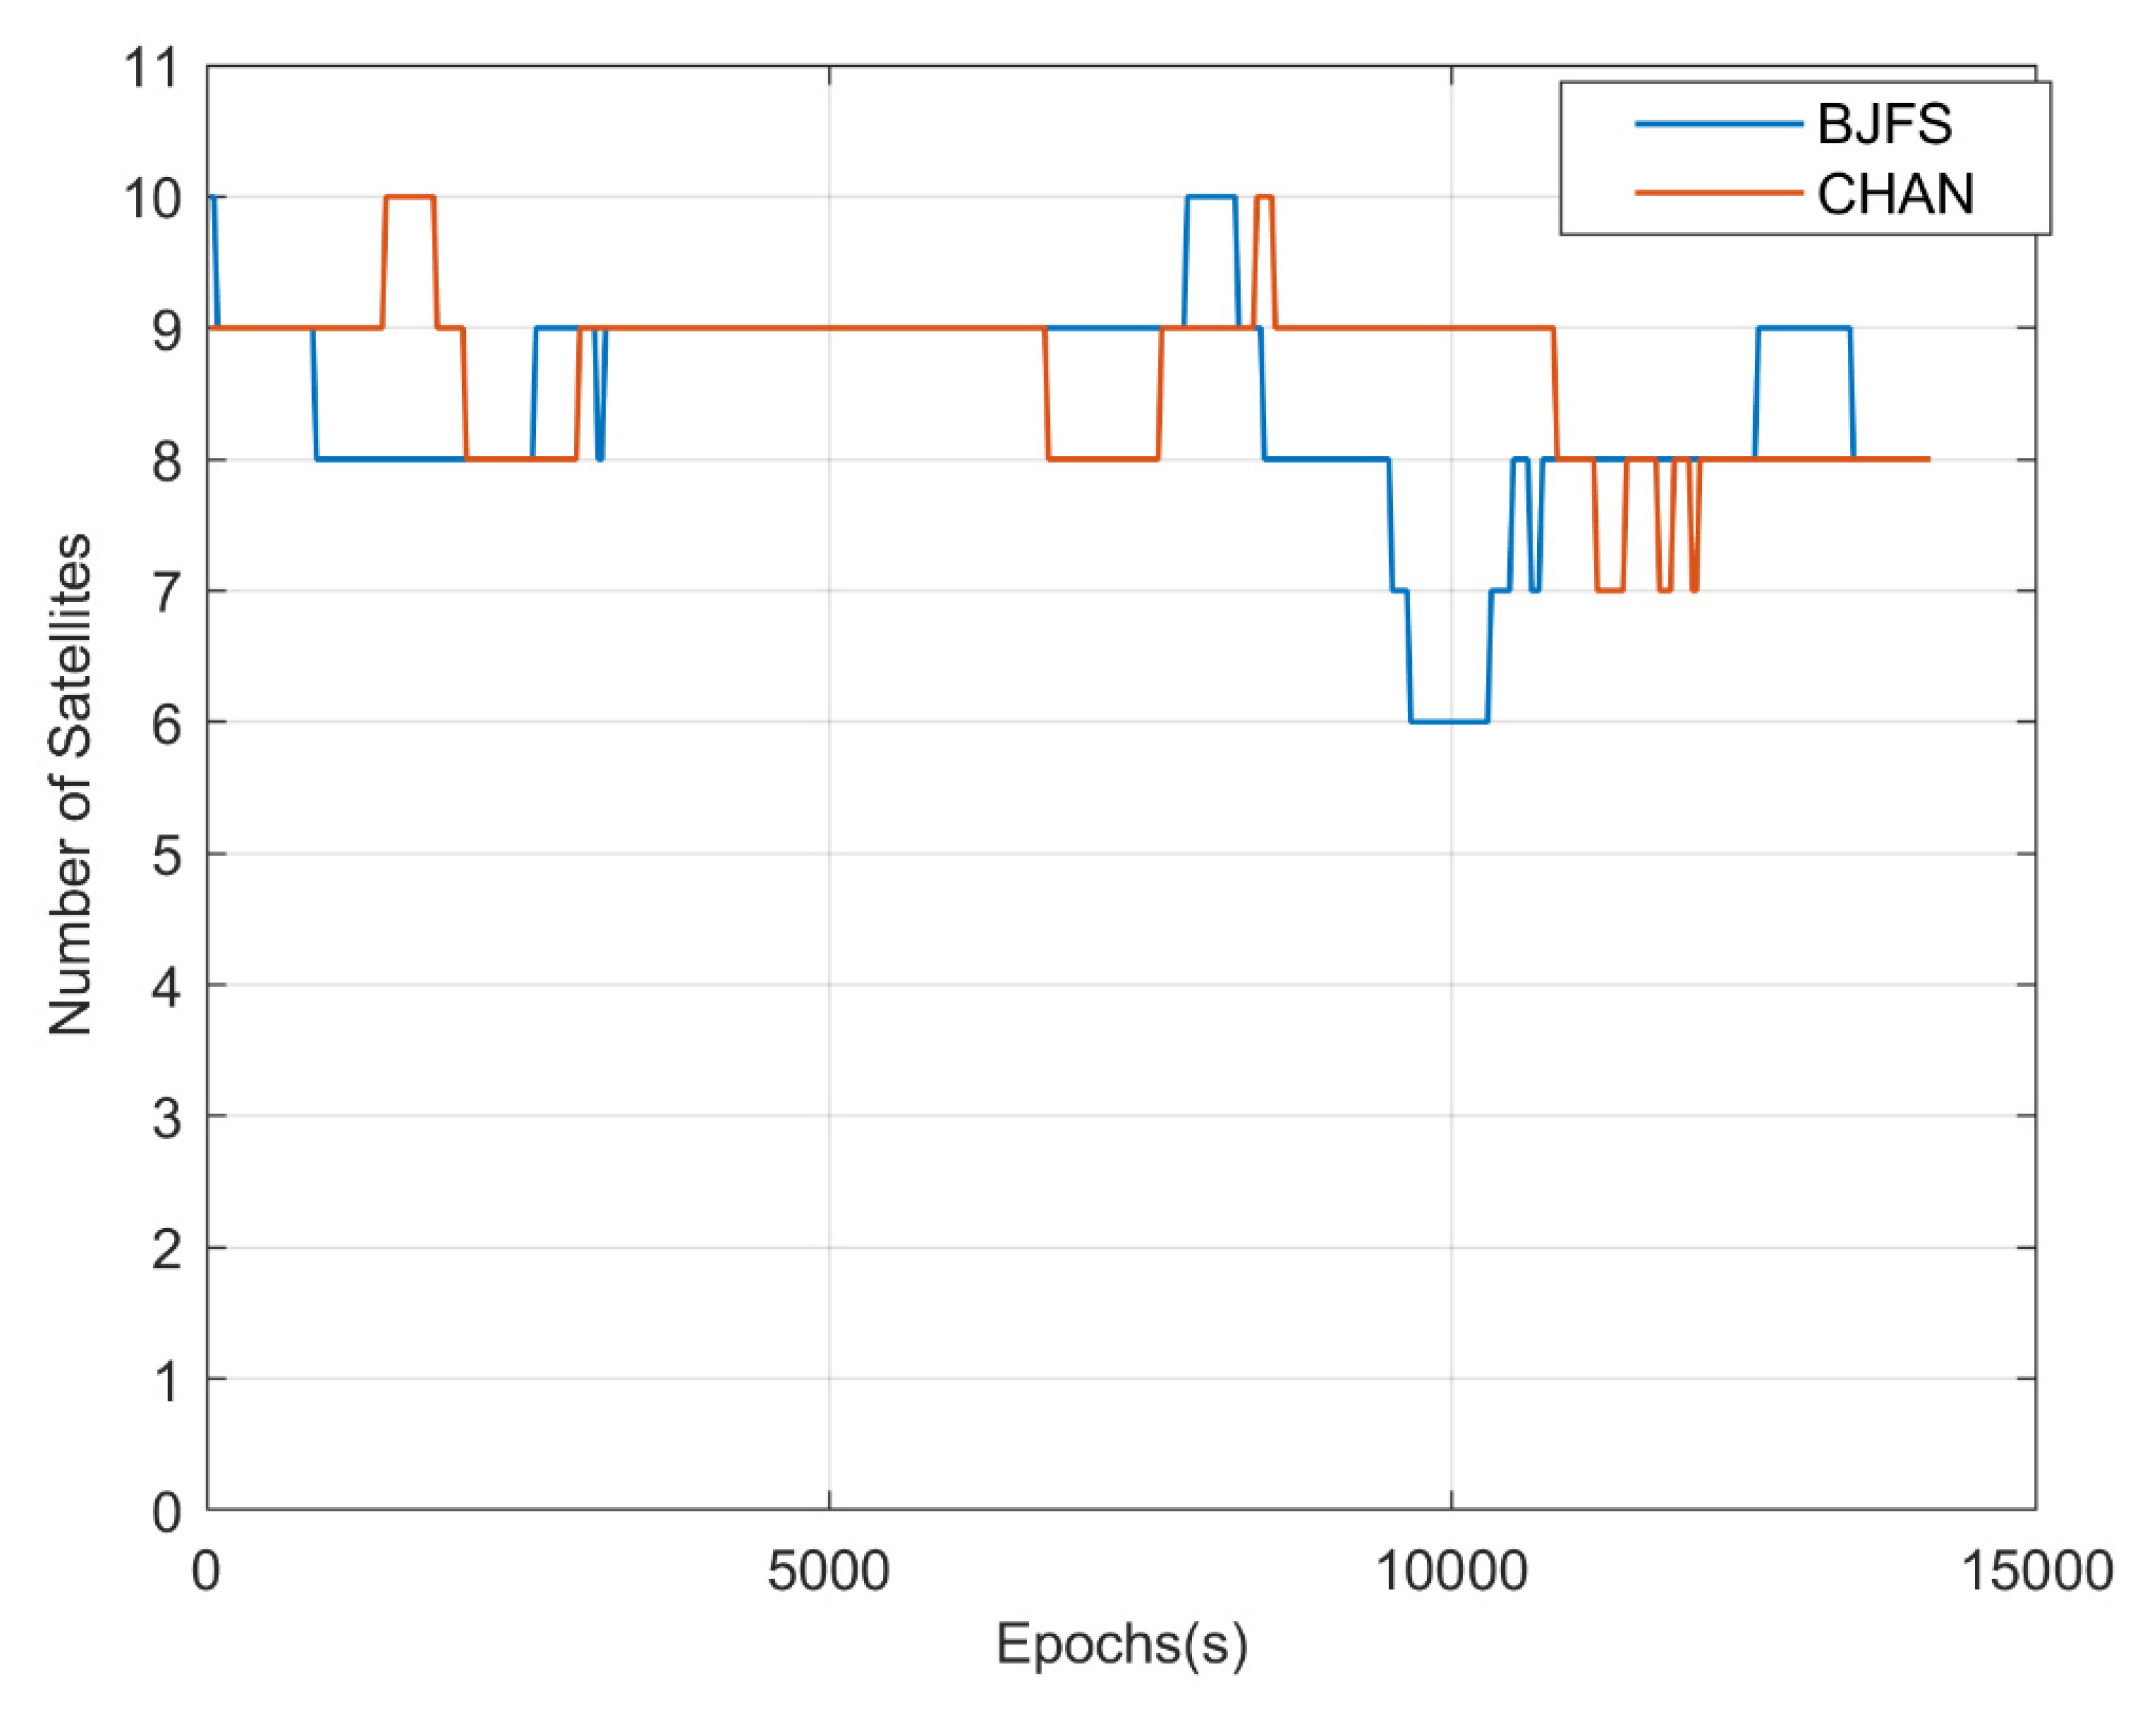
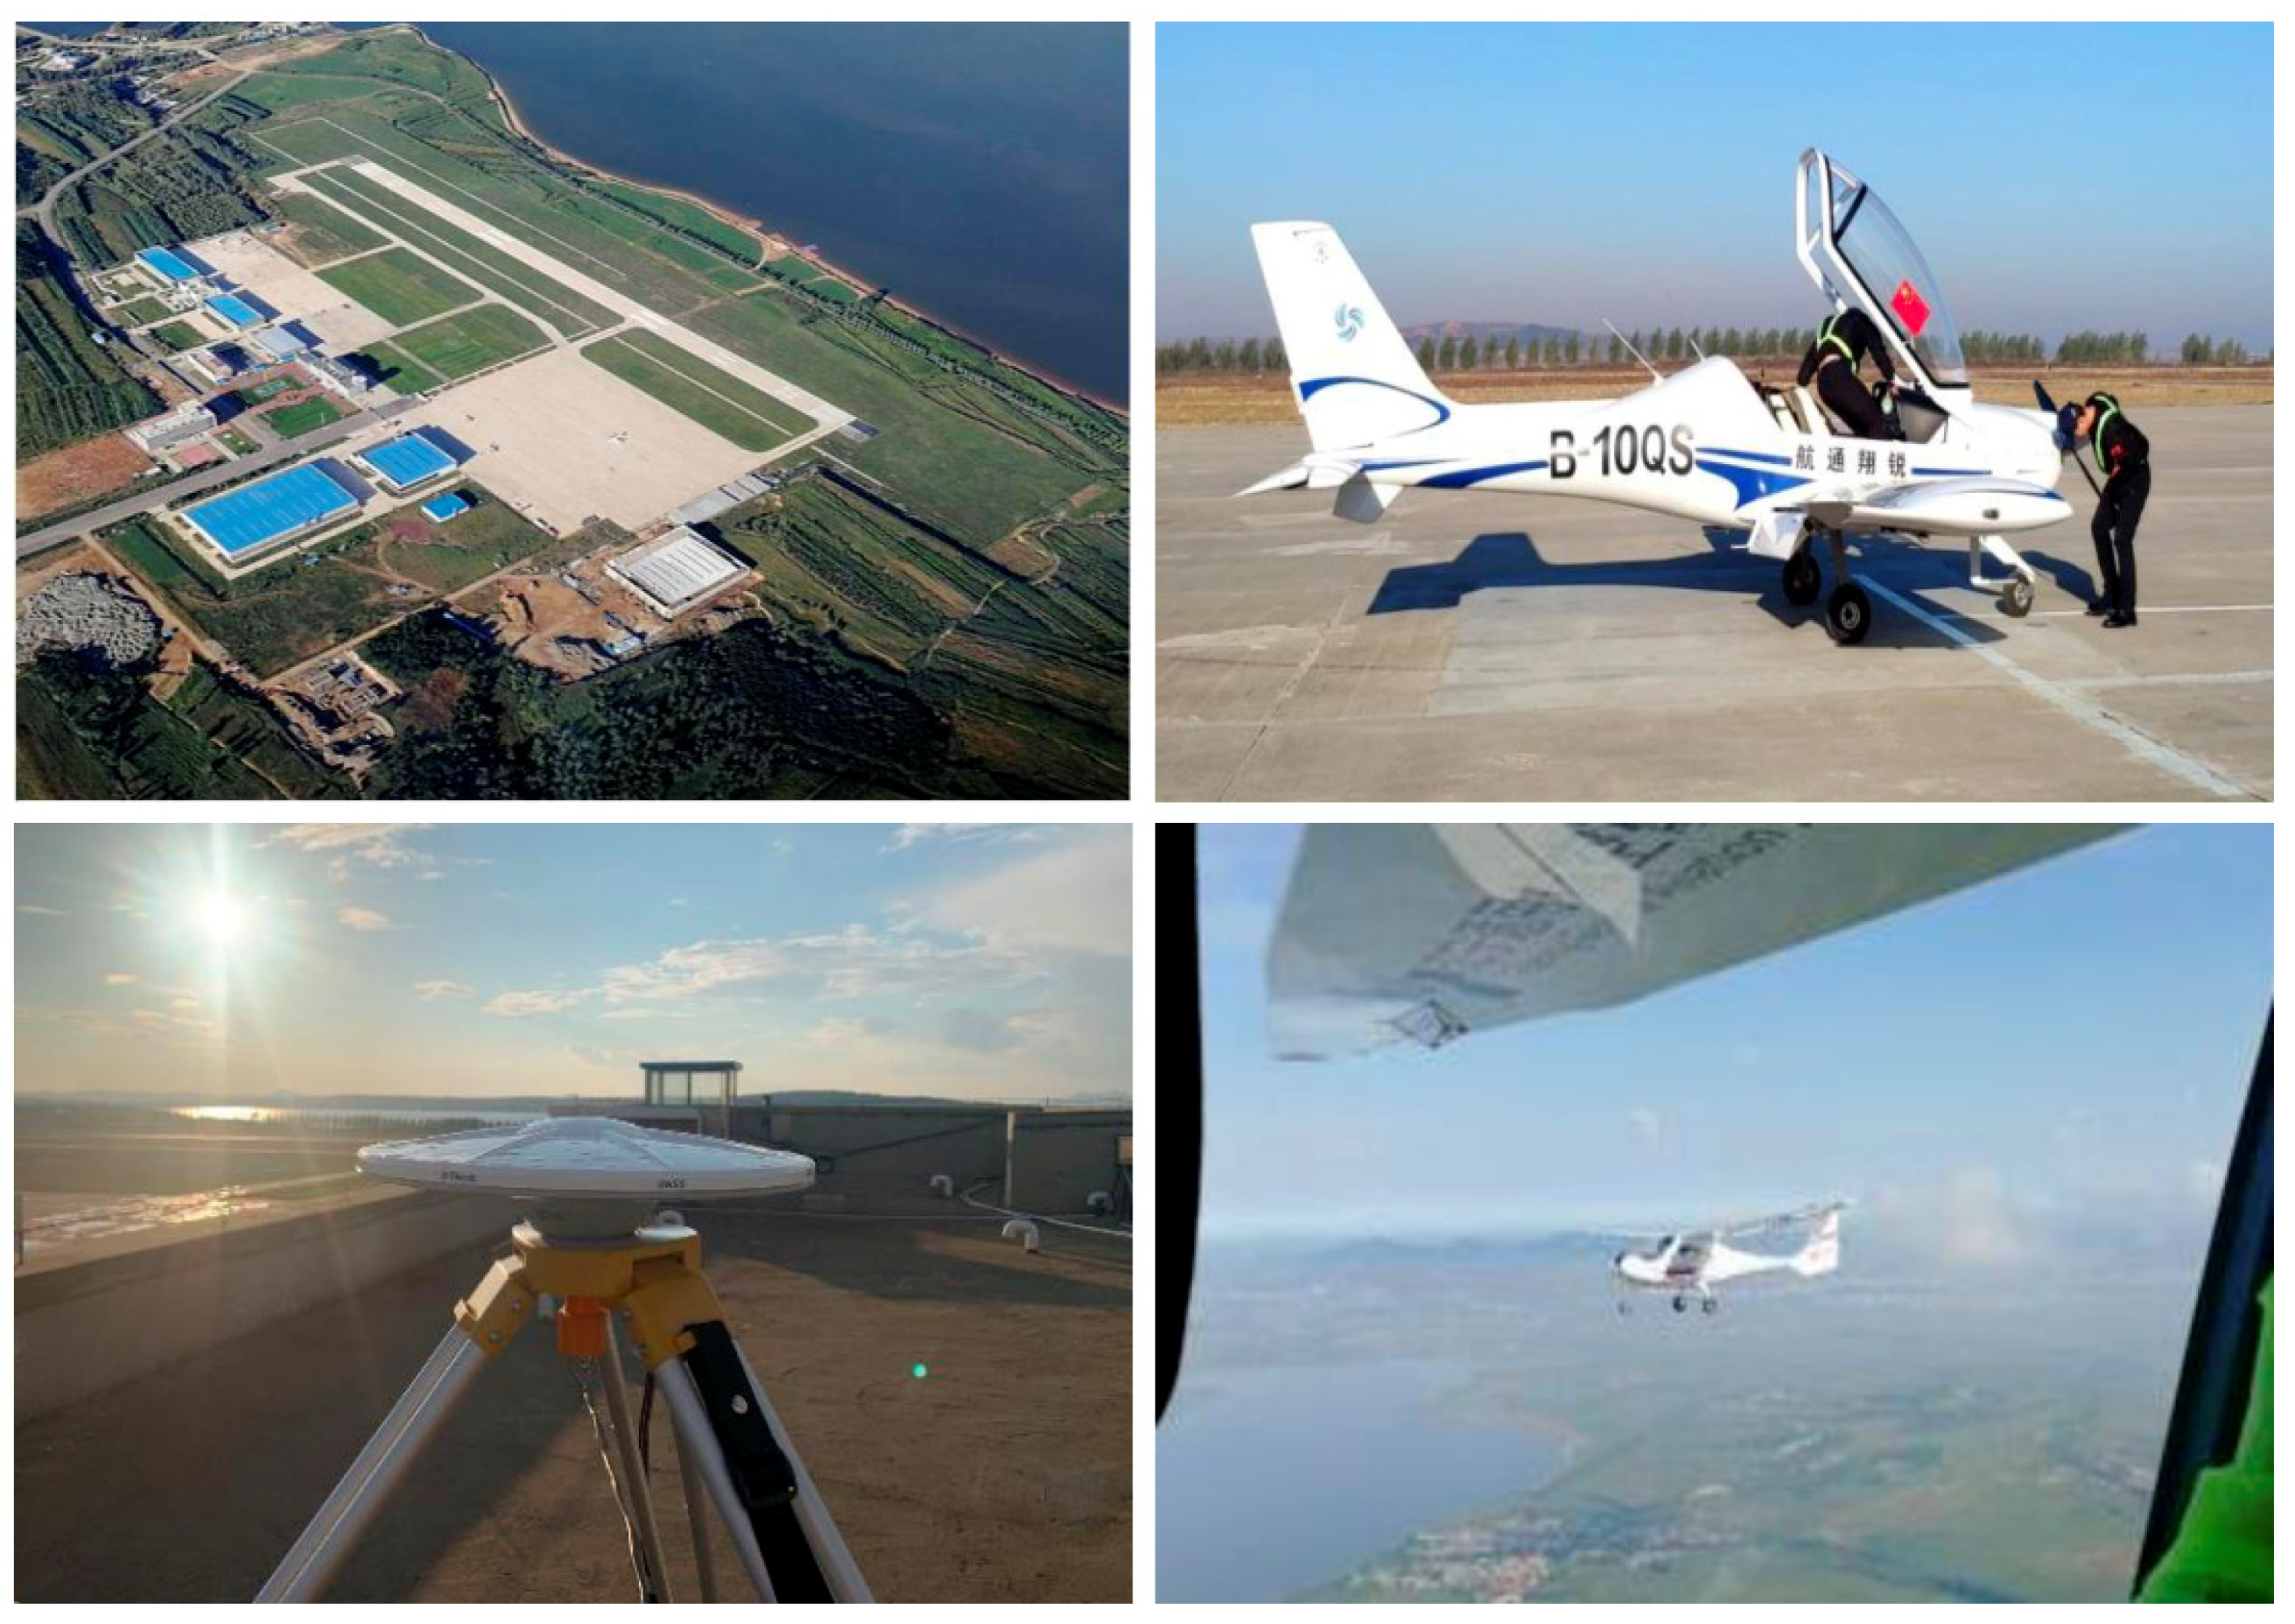
4.1. Flight Test Environment
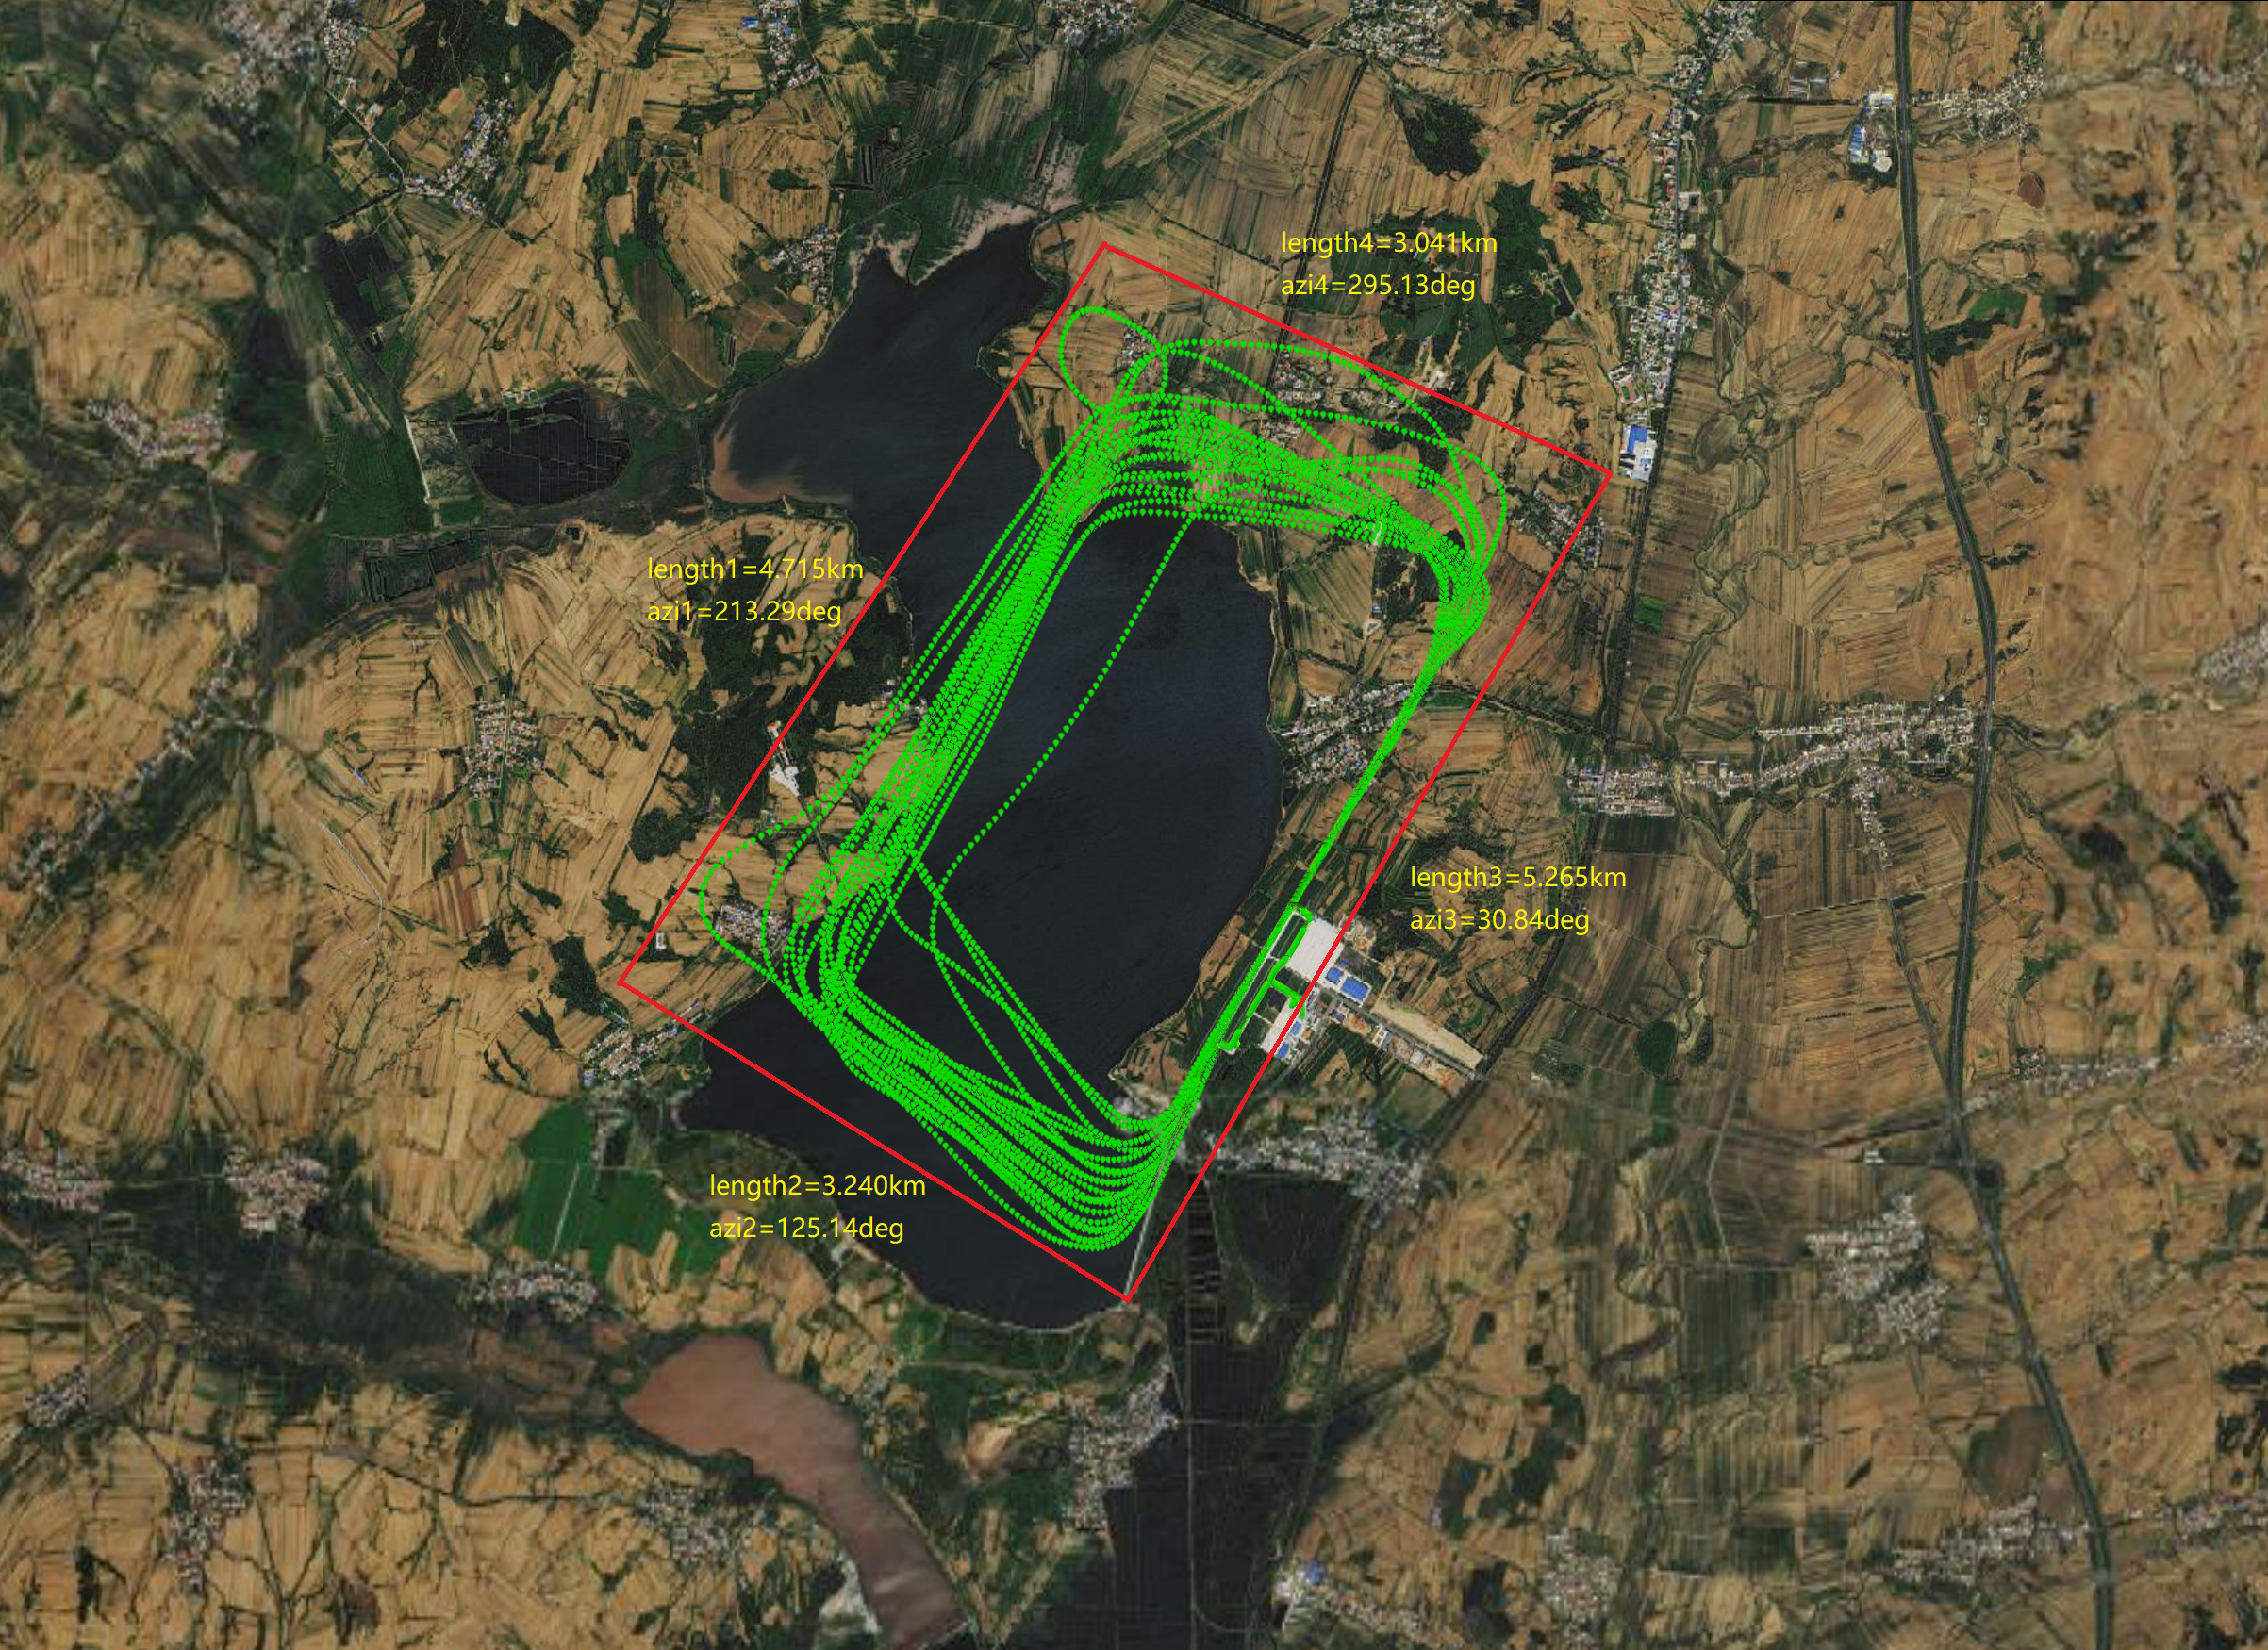
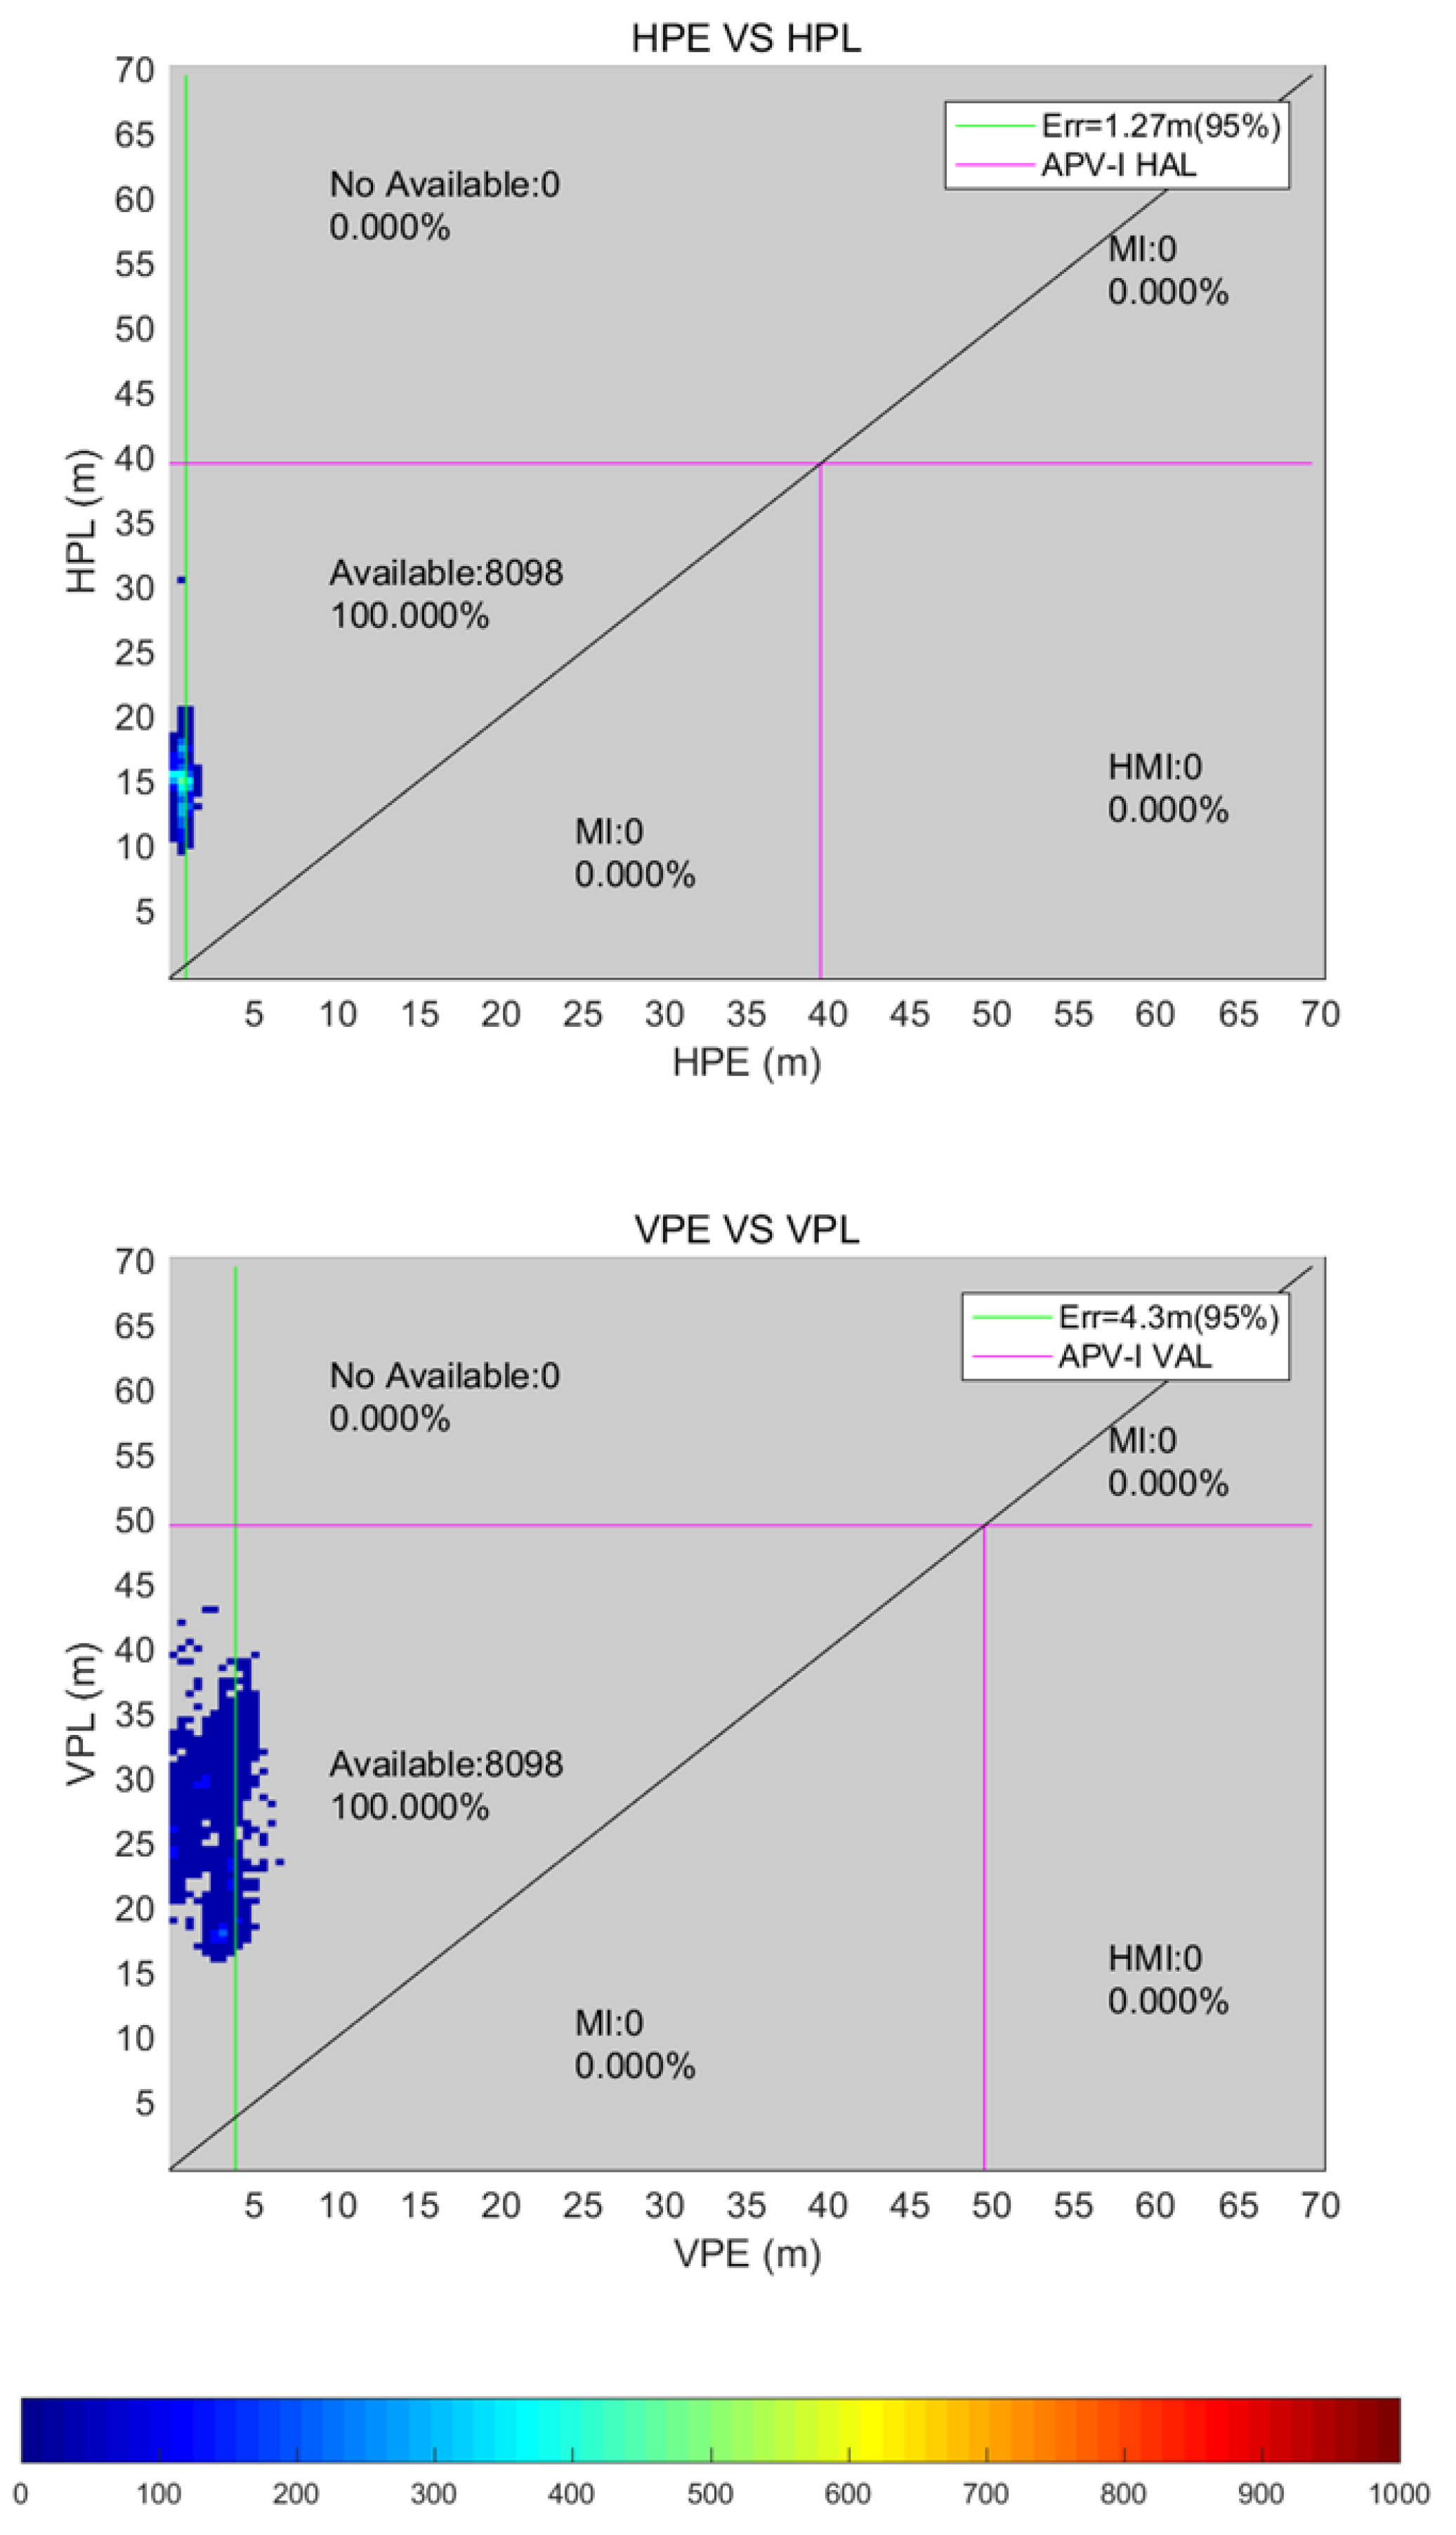
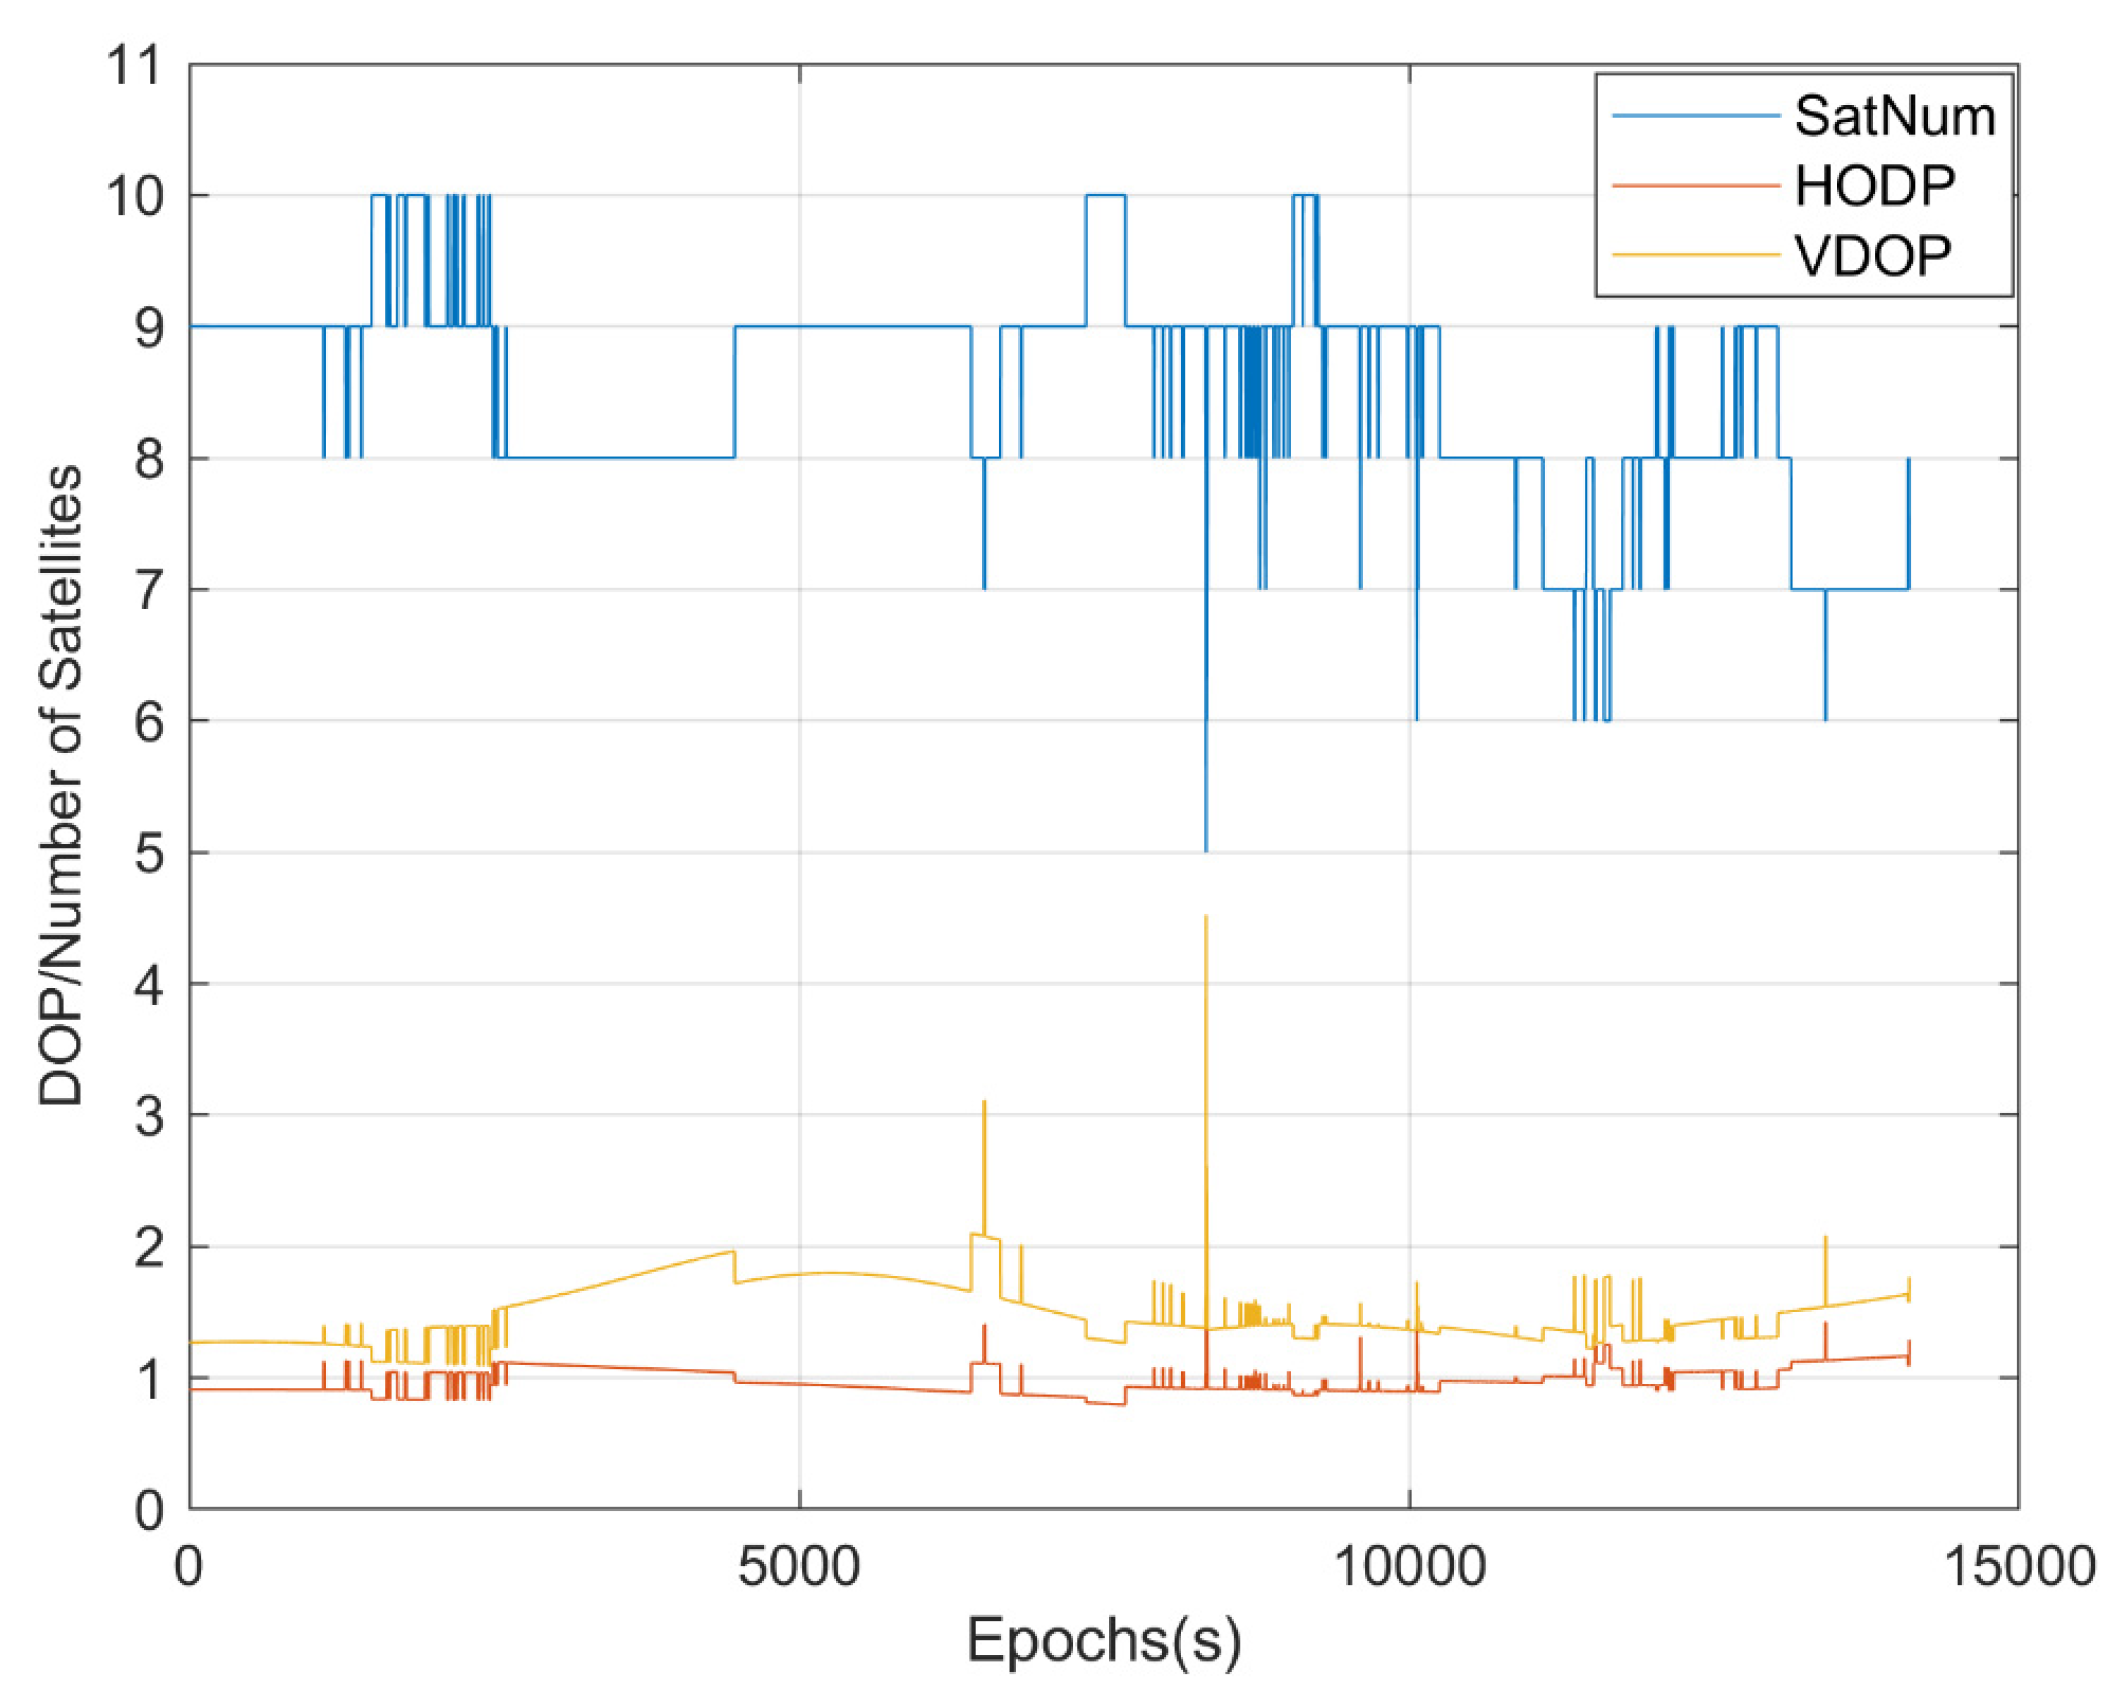
4.2. Flight Test-I
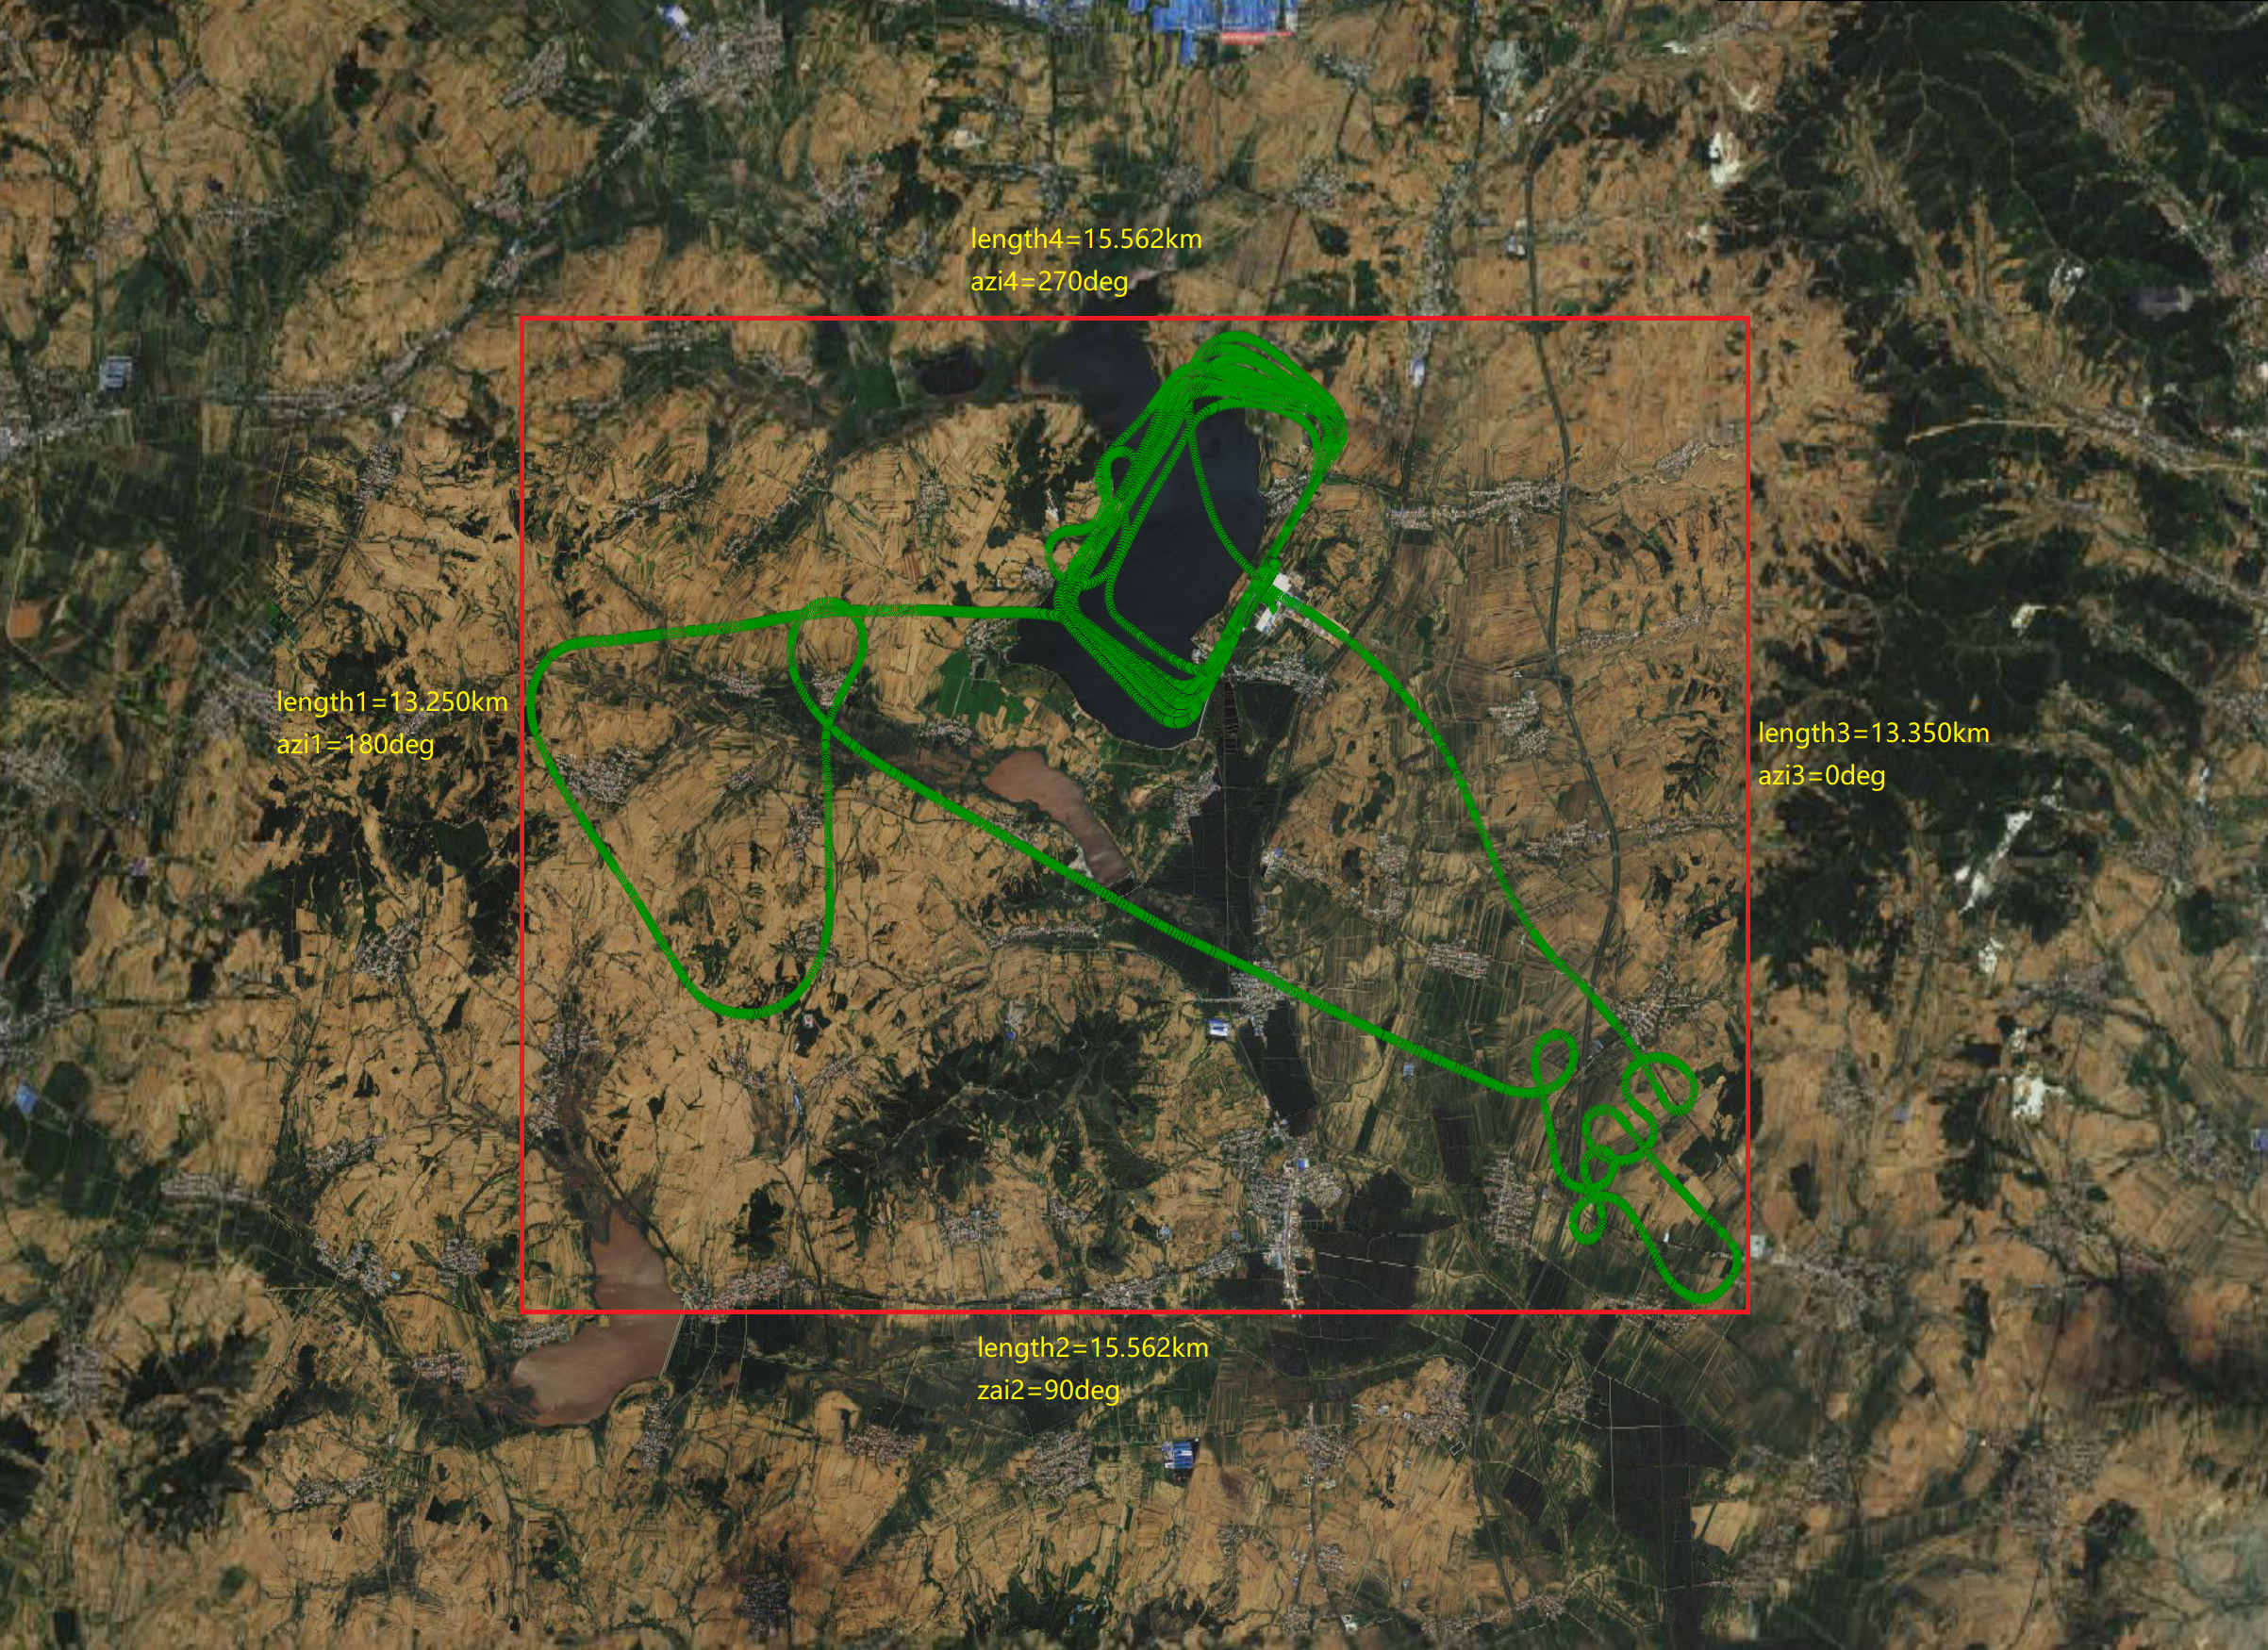
4.3. Flight Test-II
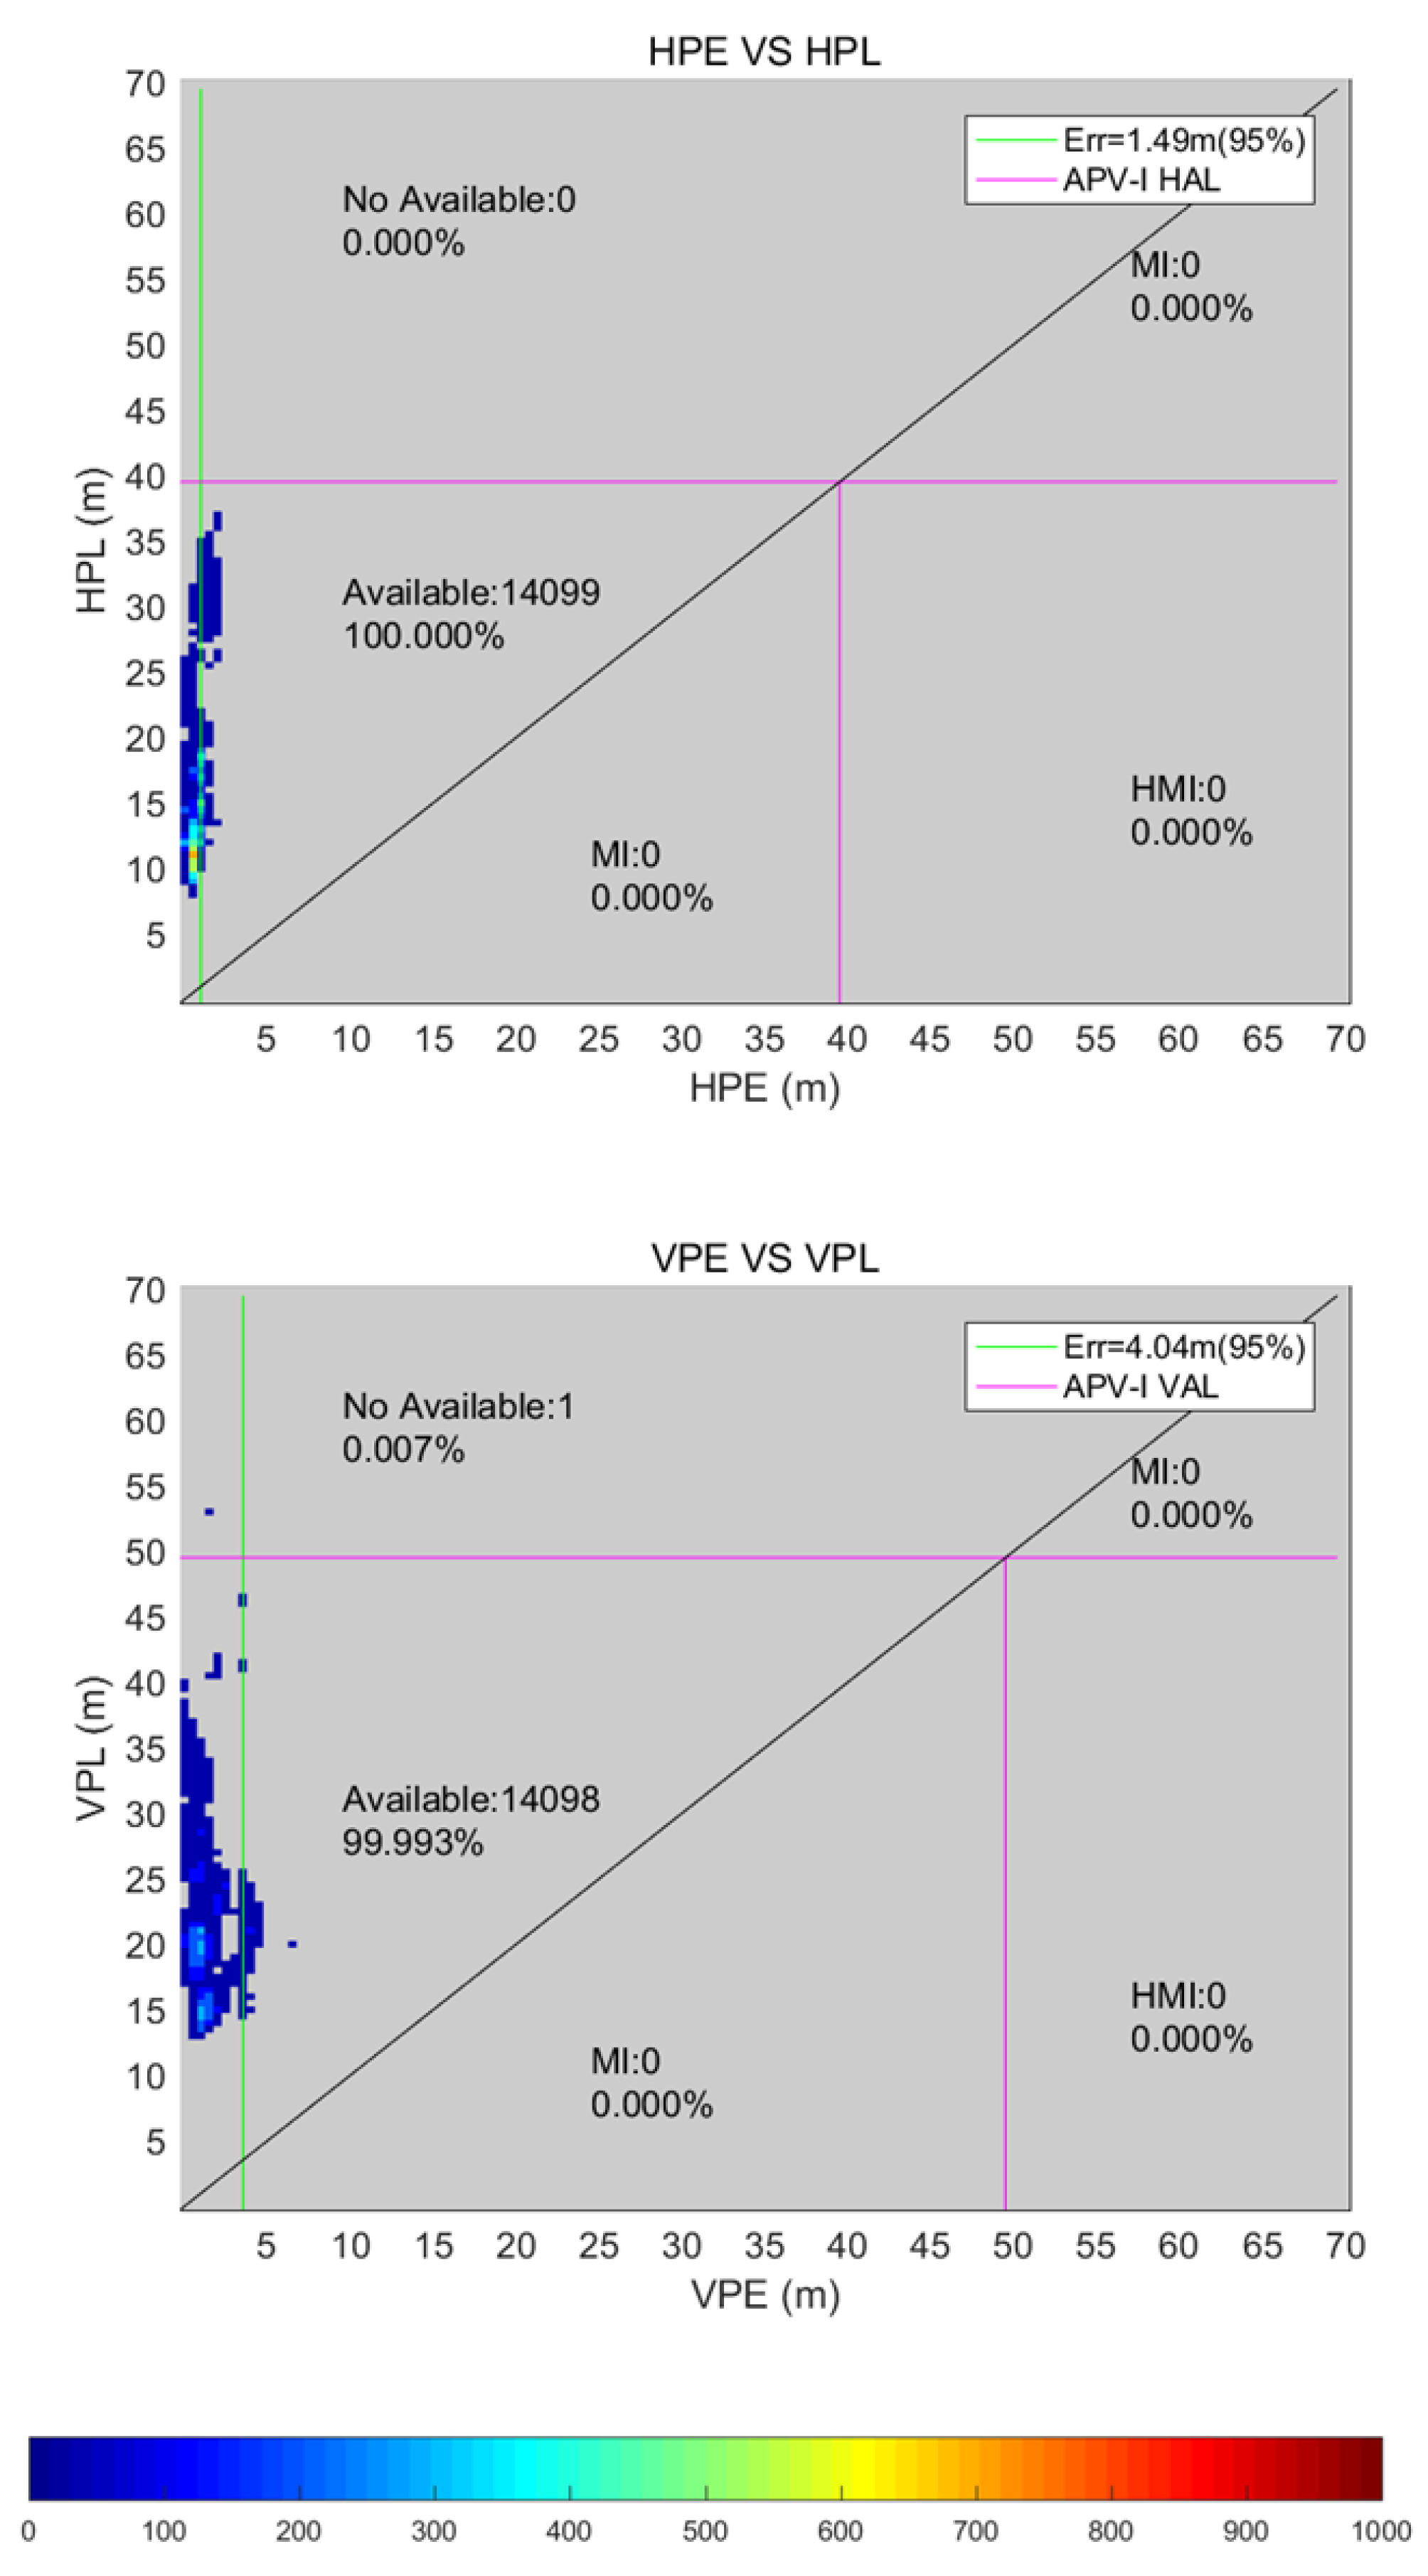
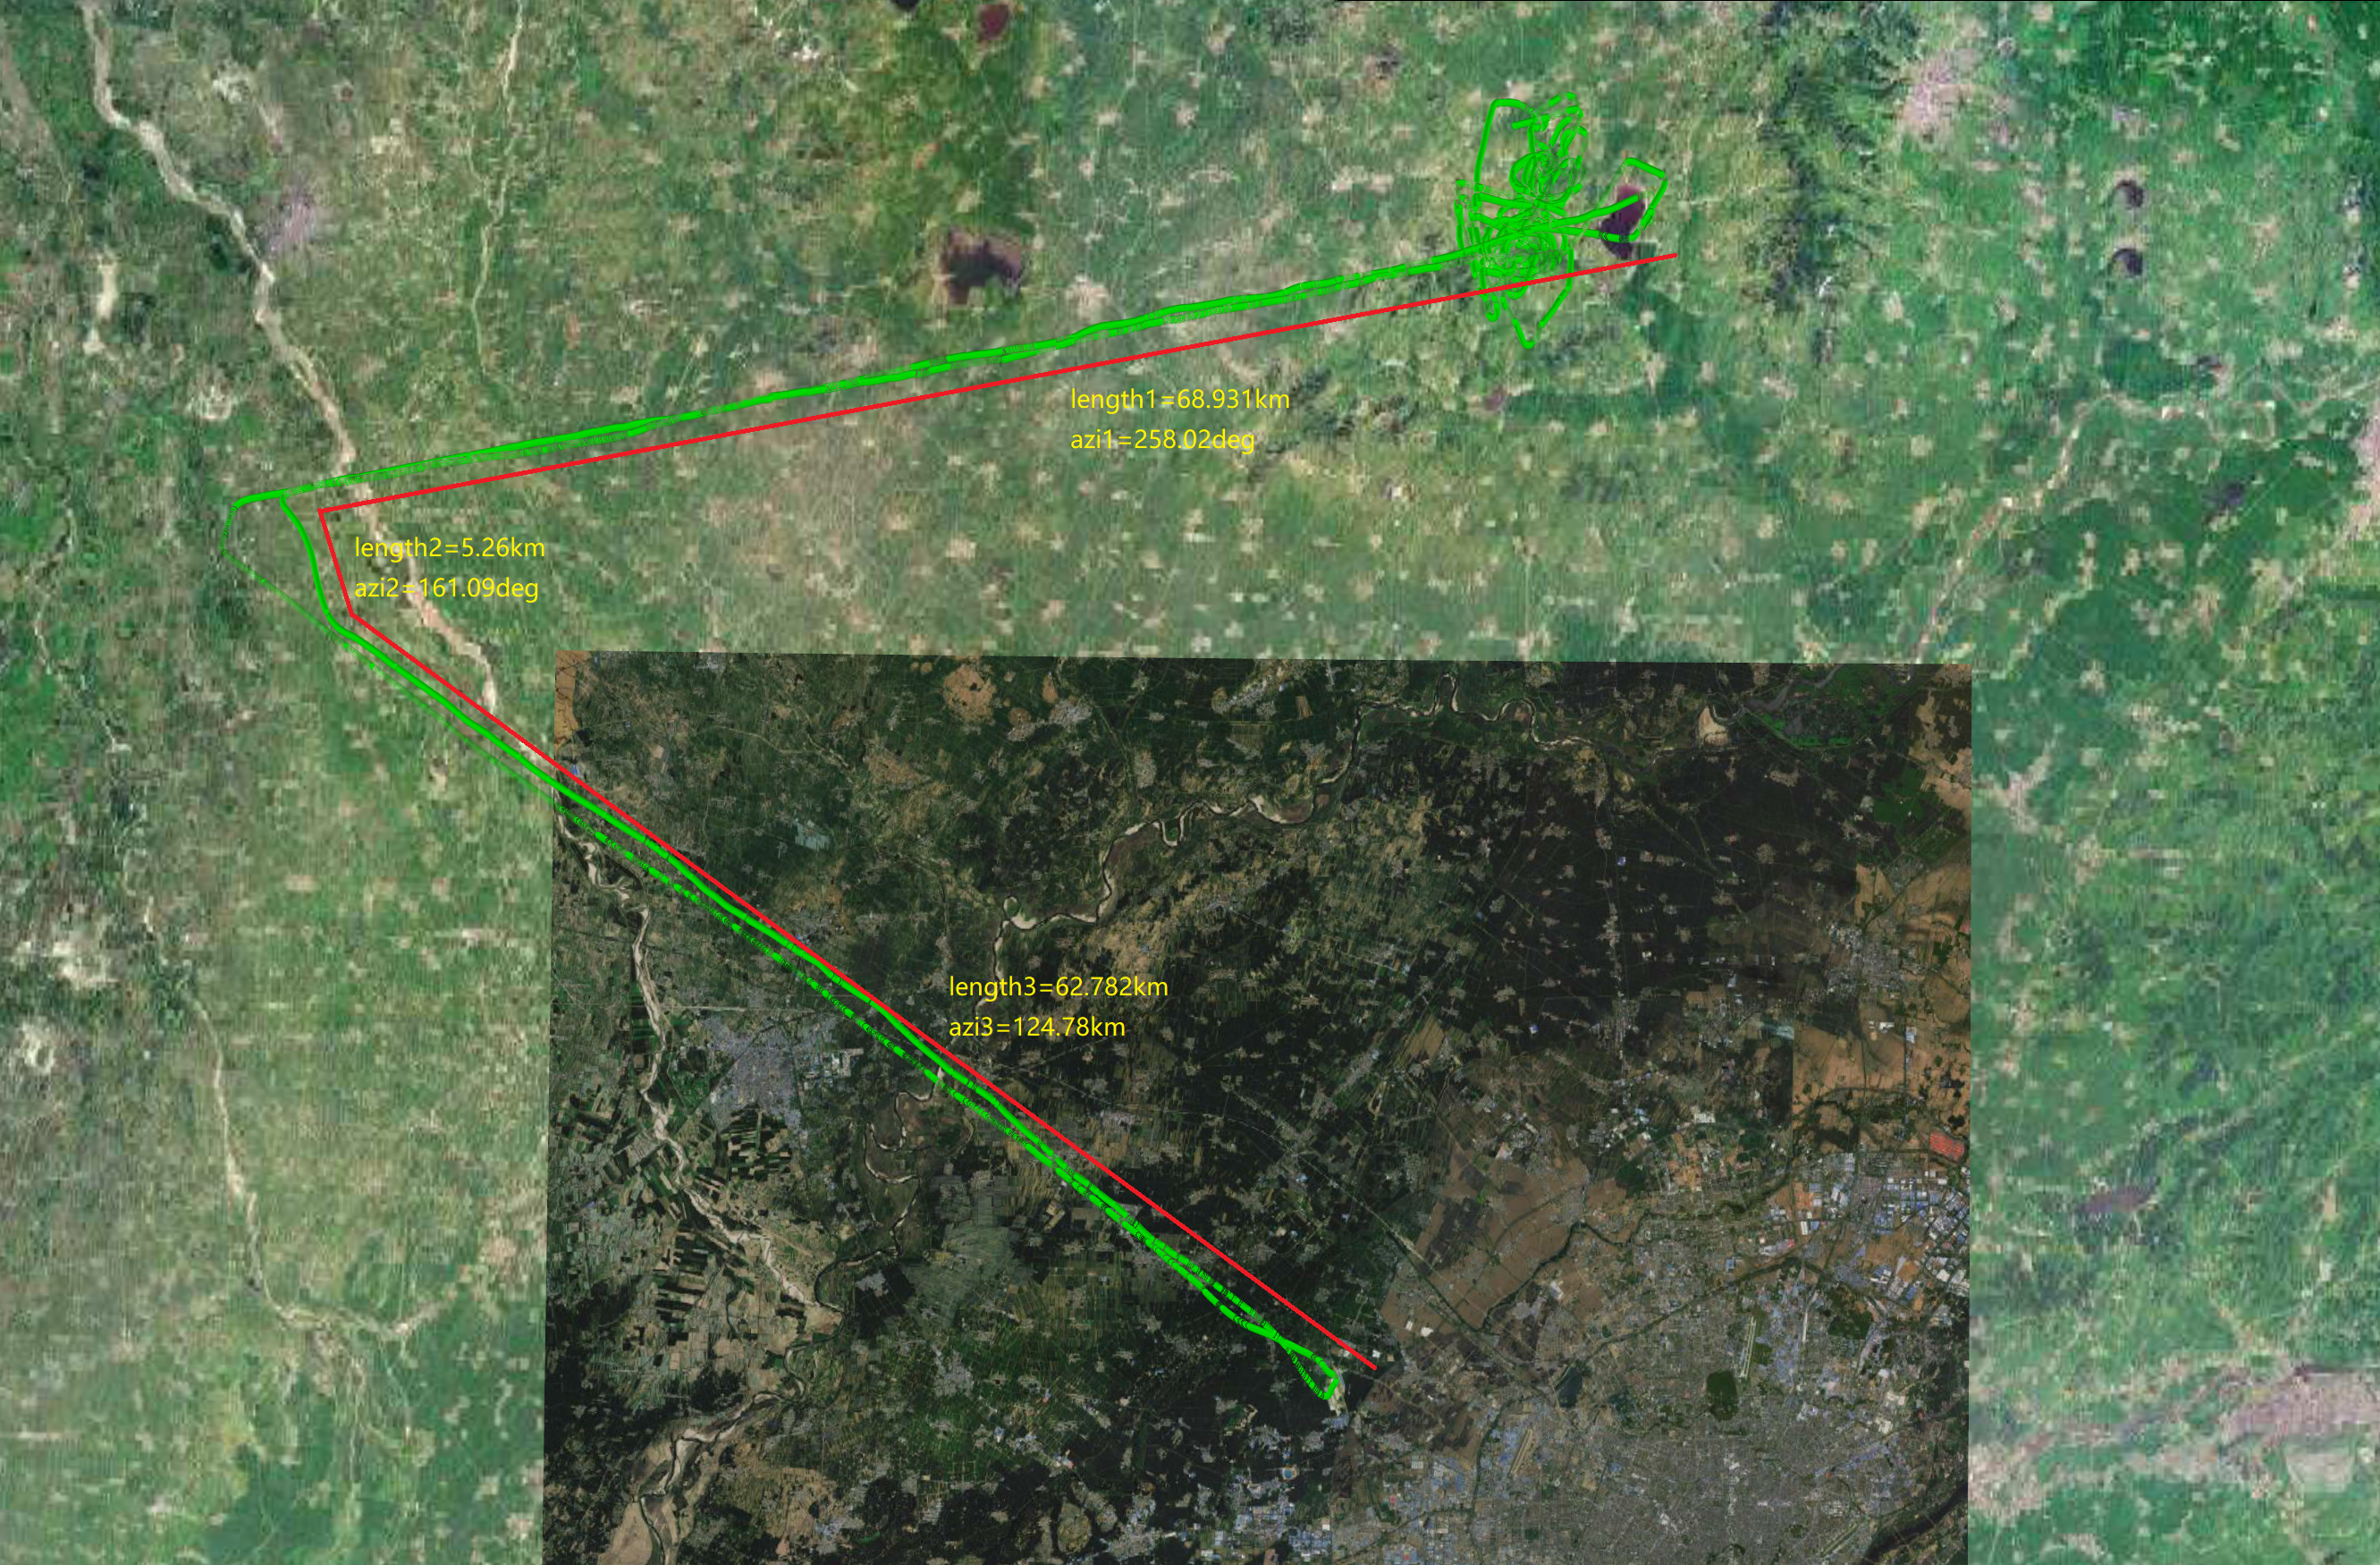
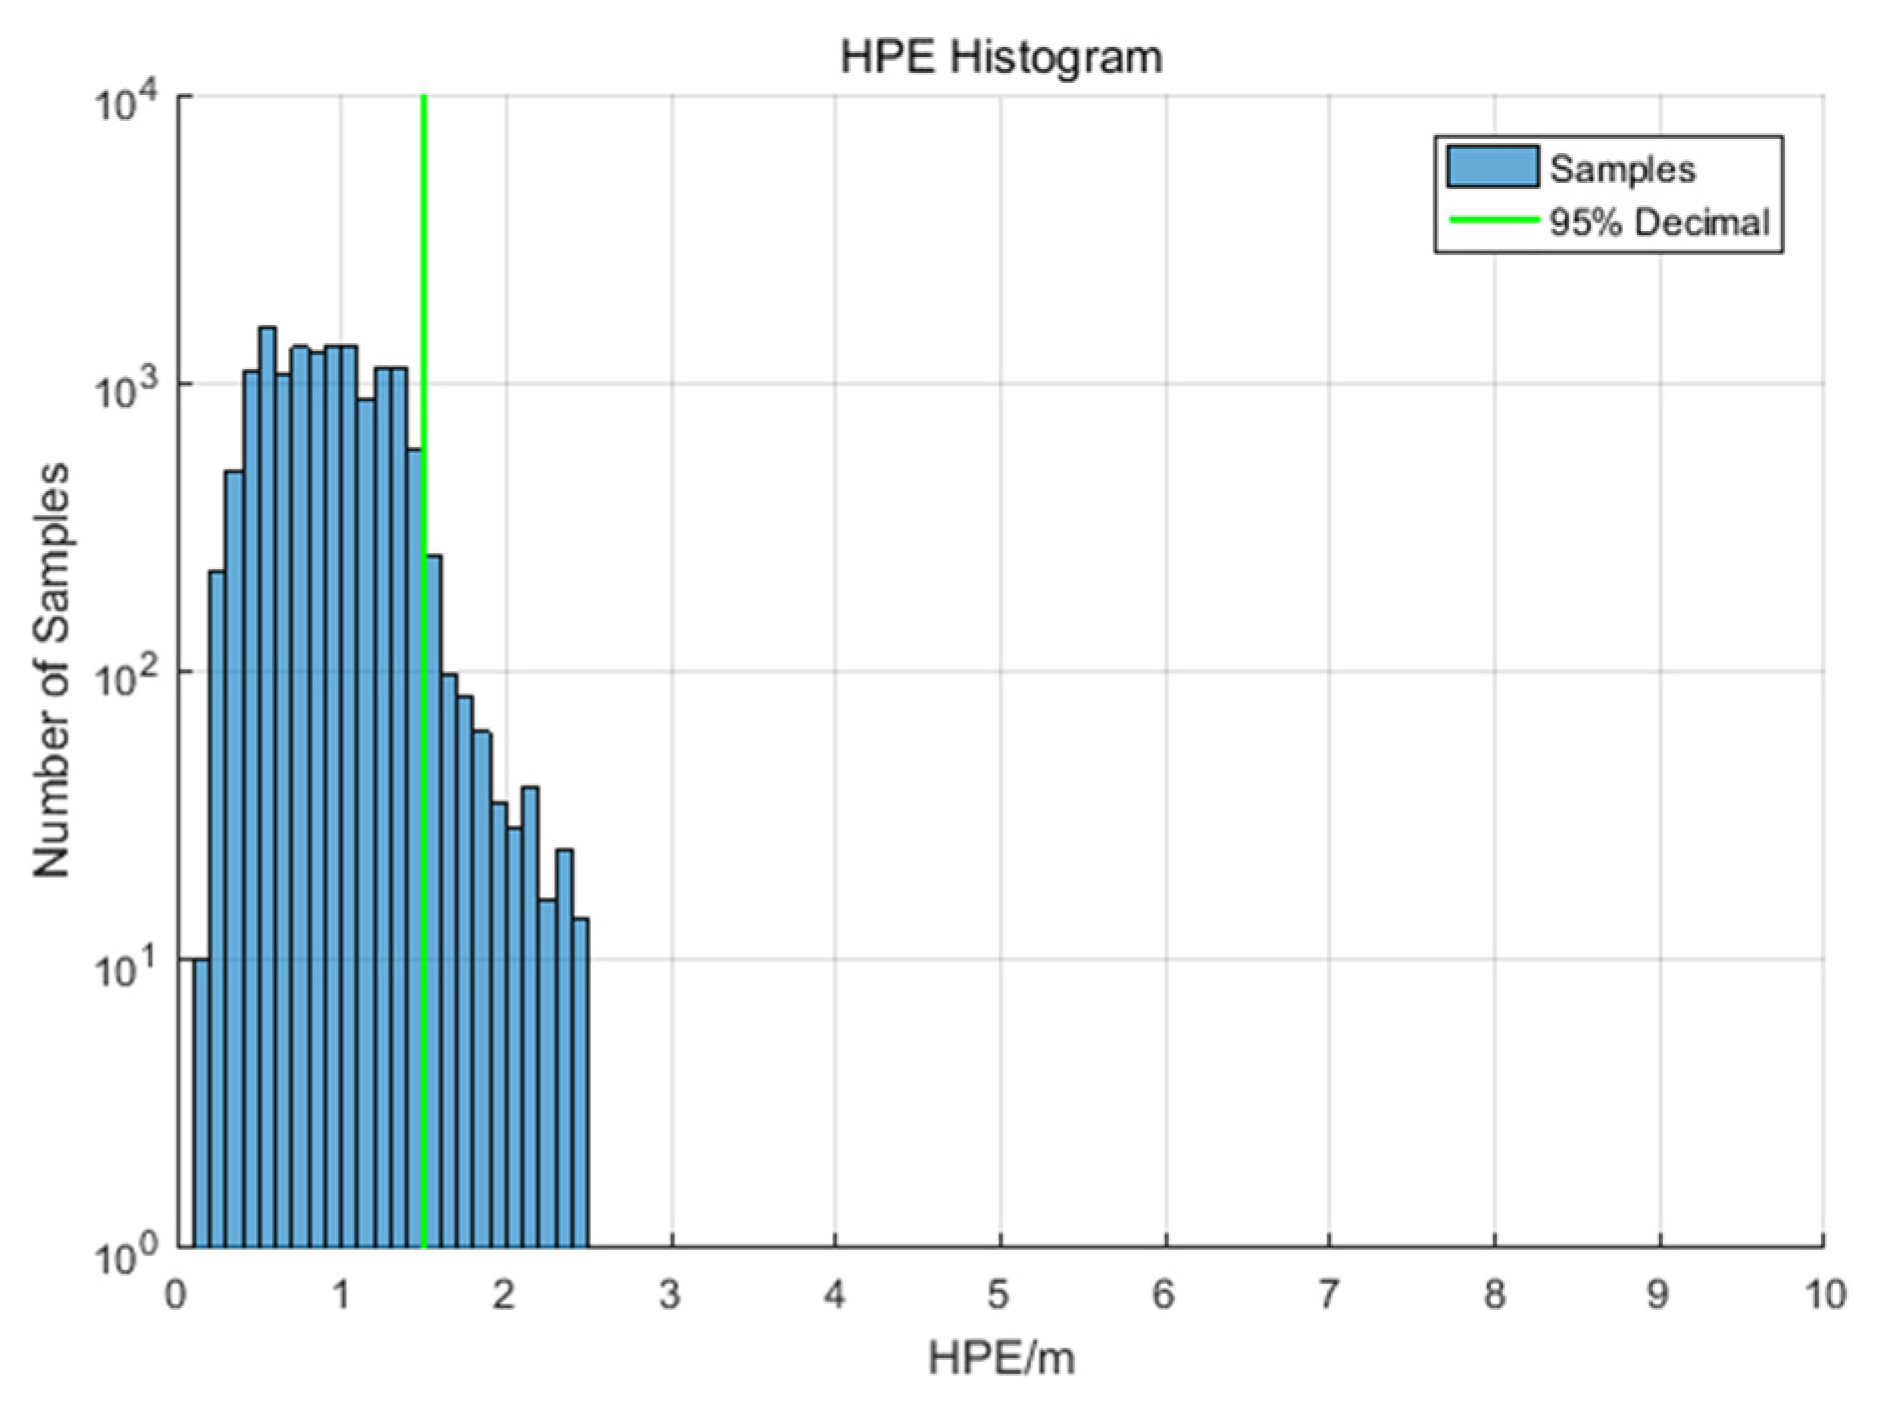
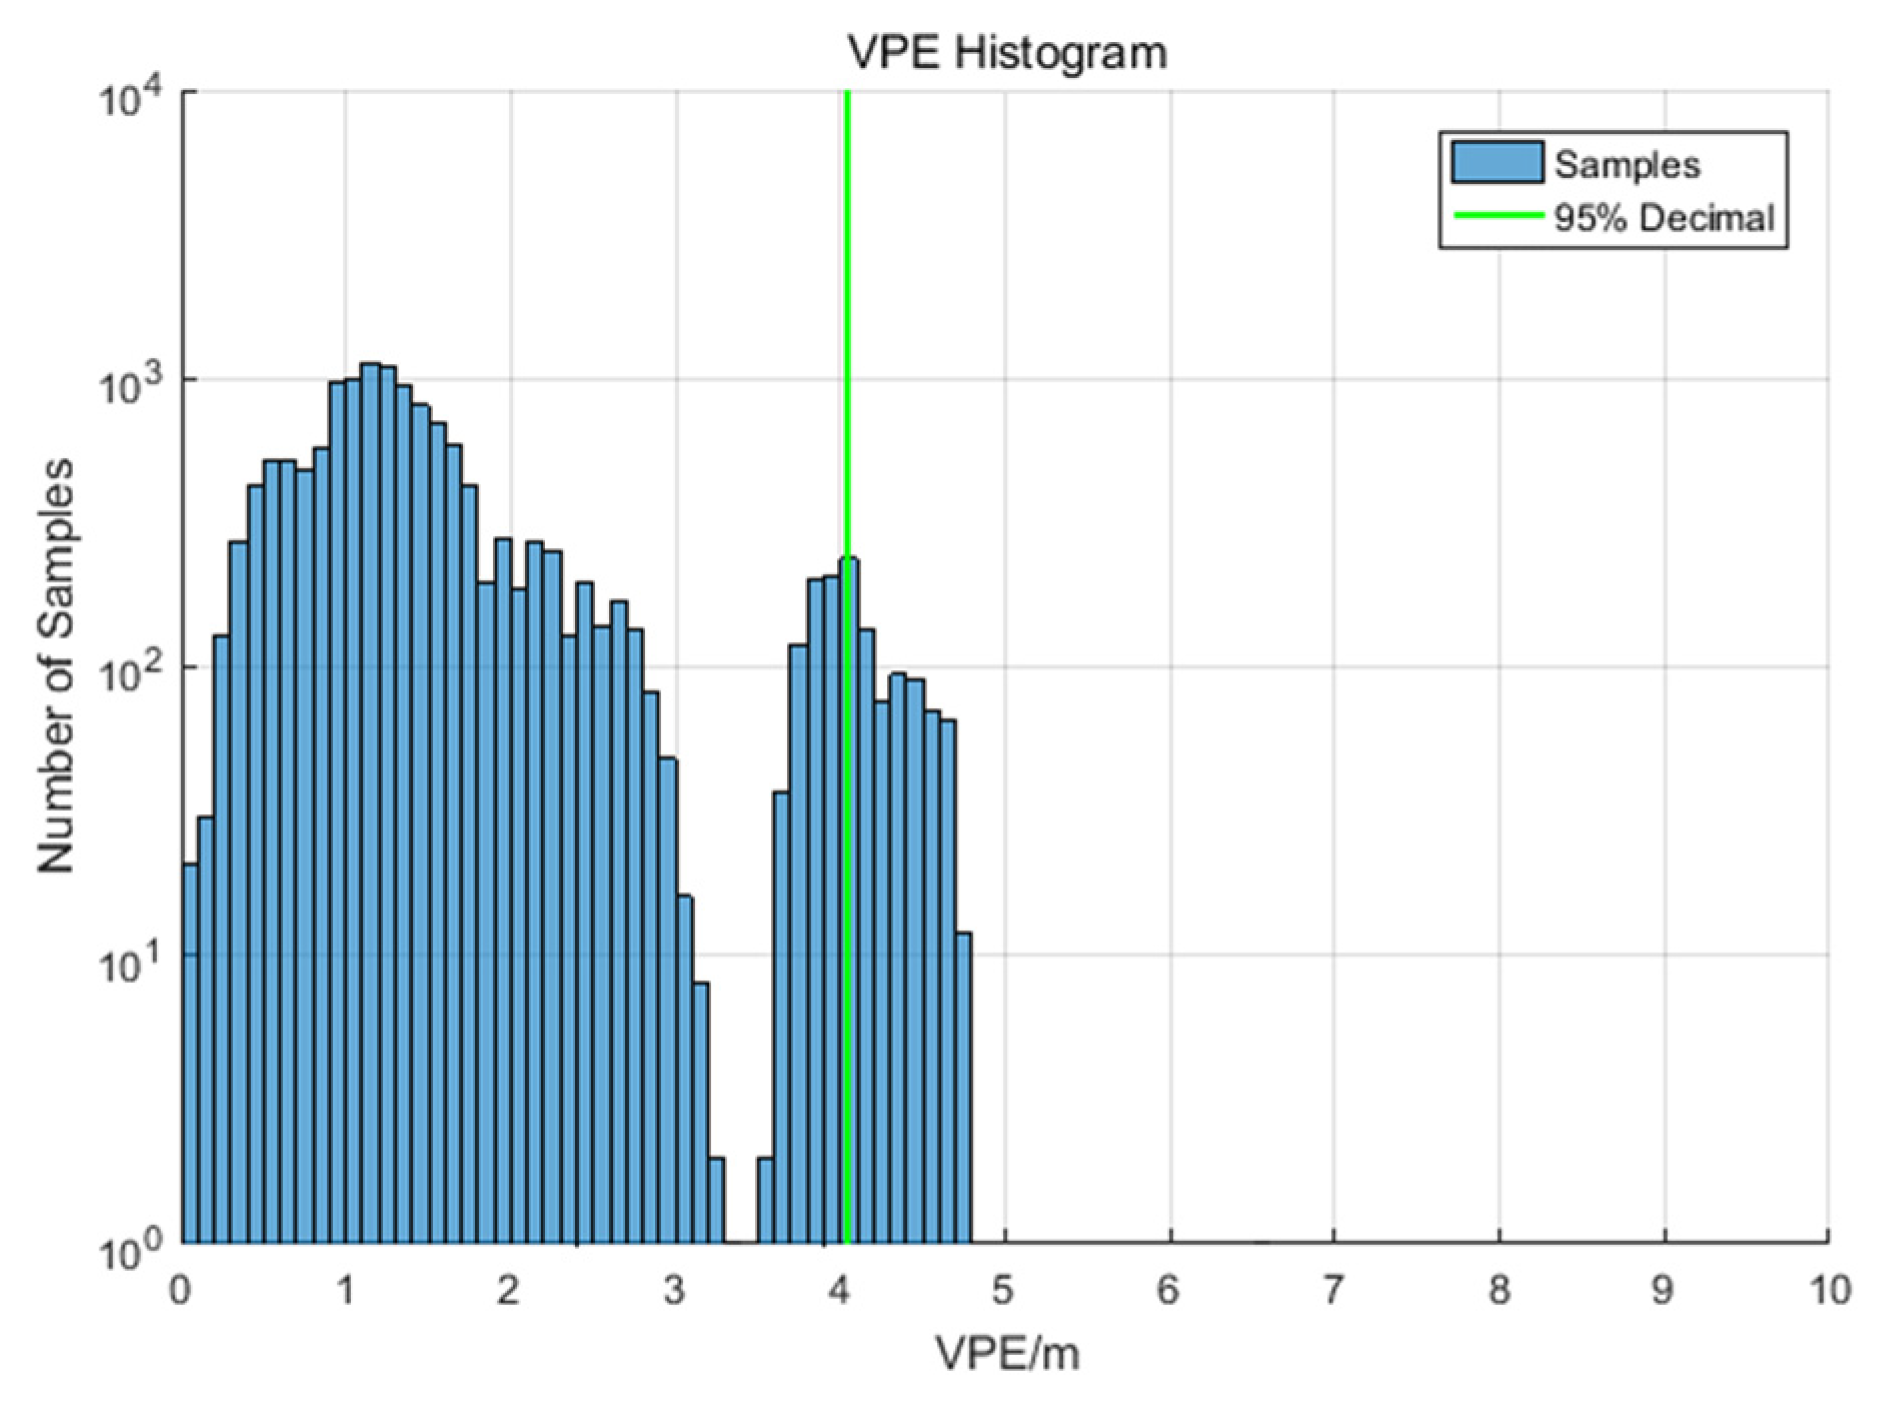
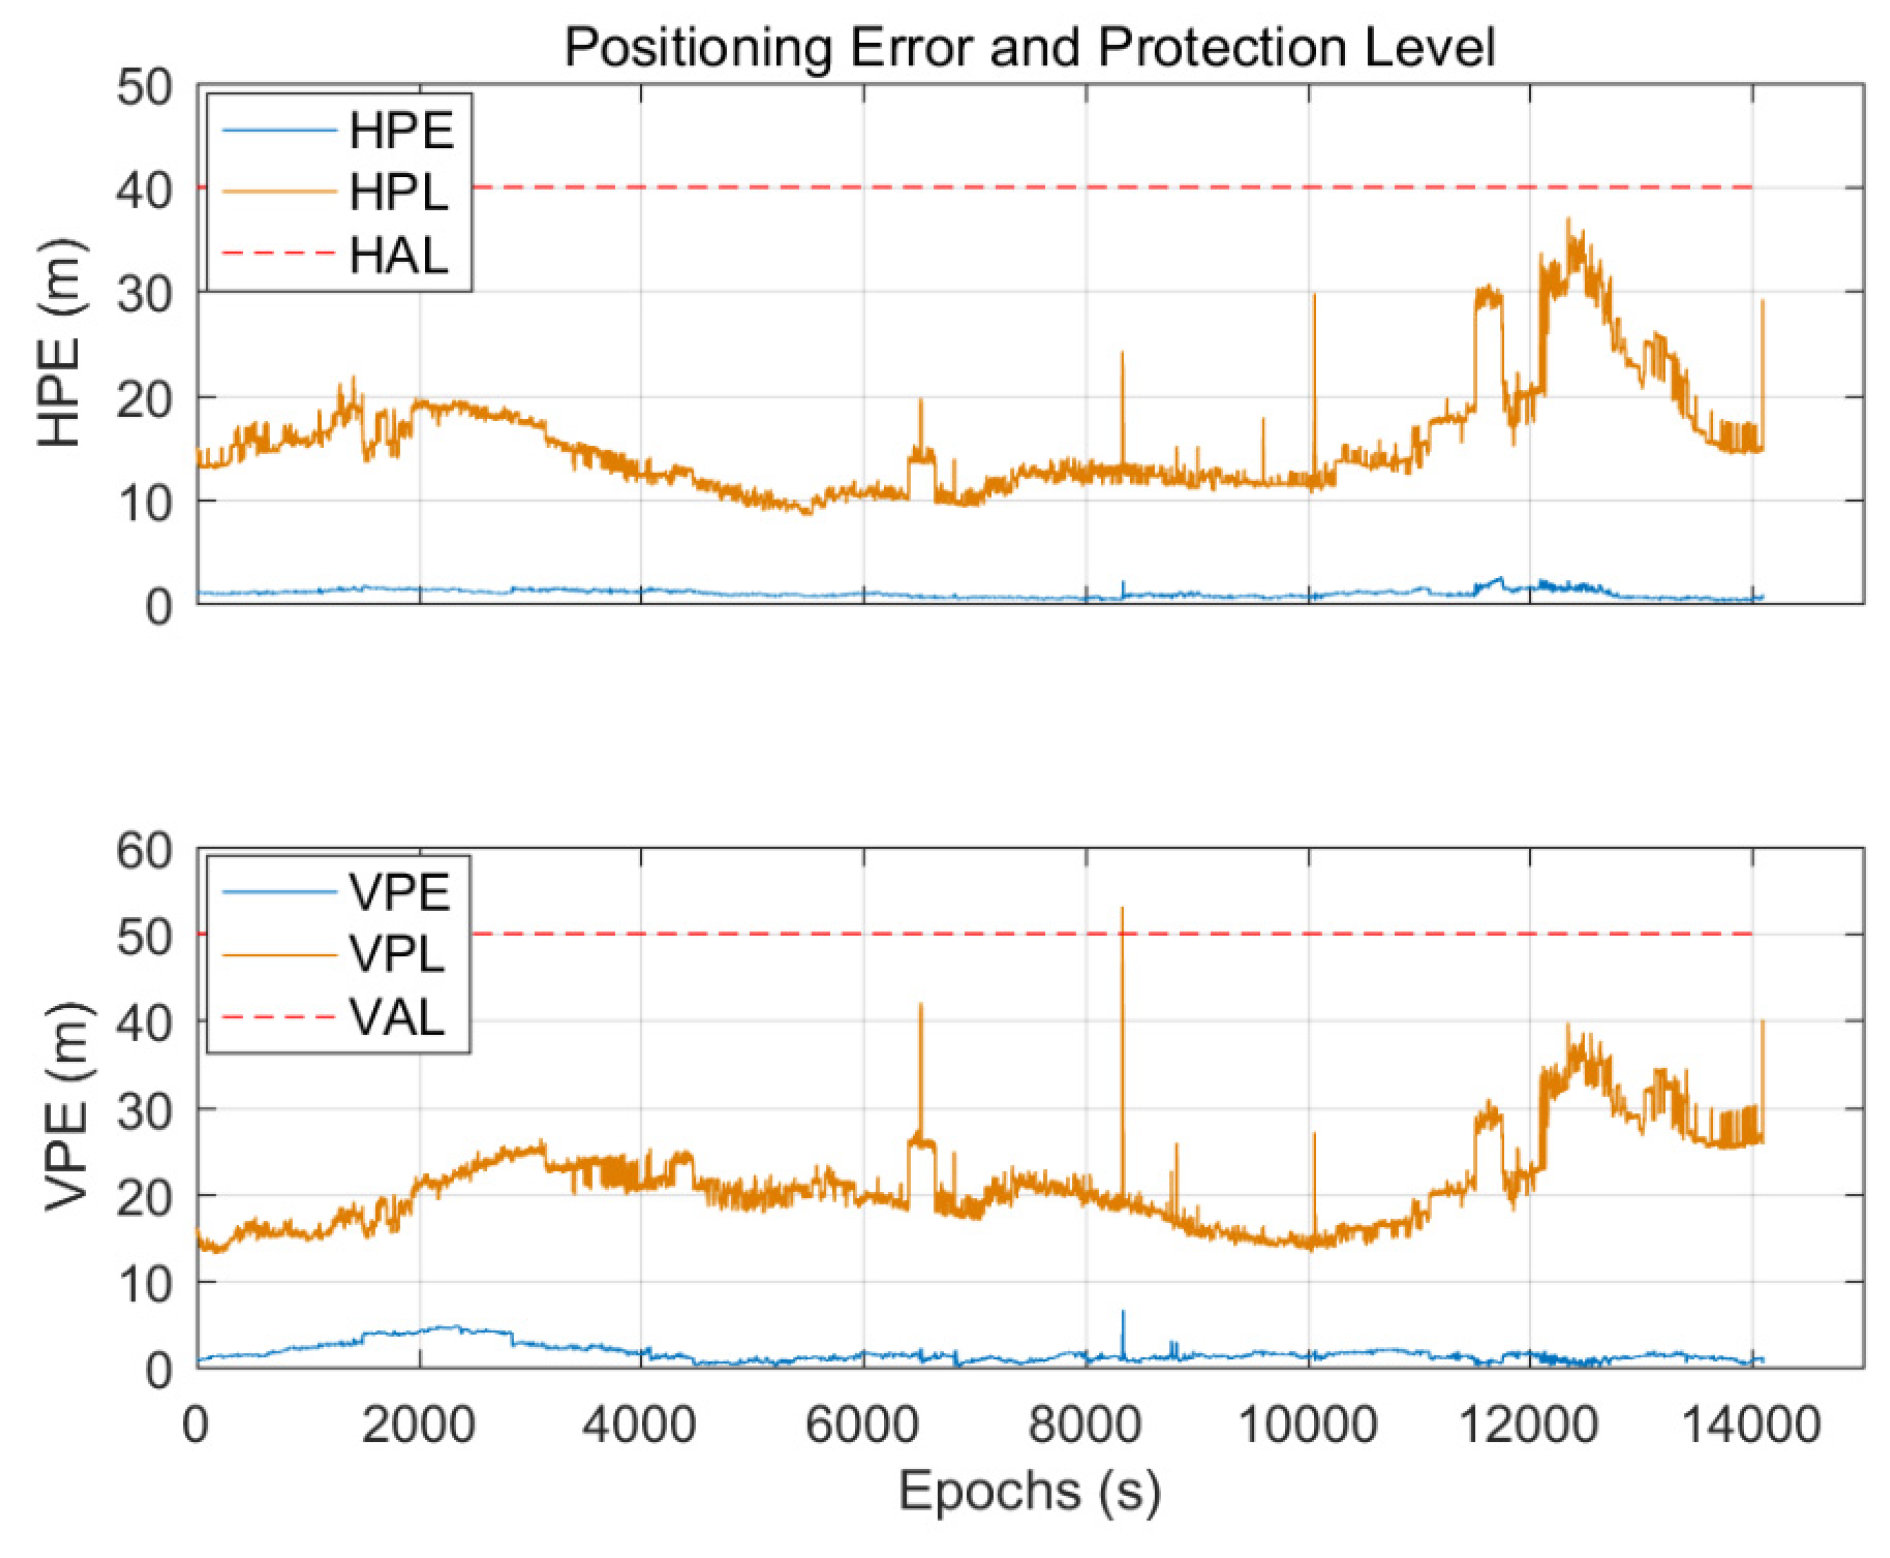
4.4. Flight Test-III
5. Conclusions
Author Contributions
Funding
Institutional Review Board Statement
Informed Consent Statement
Conflicts of Interest
References
- Bunce, D. Wide Area Augmentation System (WAAS) Status and History. Available online: https://www.gps.gov/multimedia/presentations/2014/09/ION/bunce.pdf (accessed on 19 January 2022).
- Todd, W.; Karl, S.; Eric, A.; William, W.; Chris, H.; Robert, S. WAAS at 15. Navig. J. Inst. Navig. 2018, 65, 581–600. [Google Scholar] [CrossRef]
- Schempp, T.; Stimmler, B. WAAS availability over the solar maximum. In Proceedings of the ION GNSS 2013, Nashville, TN, USA, 16–20 September 2013; pp. 902–911. [Google Scholar]
- Schempp, T. WAAS Development Changes Since Commissioning. Available online: https://www.icao.int/APAC/APAC-RSO/GBASSBAS%20Implementation%20Workshop/1-4_WAAS_Development_Changes_Since_Commissioning_final%20(T%20Schemmp).pdf (accessed on 19 January 2022).
- Jason, B. Wide Area Augmentation System (WAAS)—Program Status Update. Available online: https://www.faa.gov/about/office_org/headquarters_offices/ato/service_units/techops/navservices/gnss/library/briefings/media/WAAS_RTCA_brief_31213.pdf (accessed on 19 January 2022).
- Lawrence, D. FAA WAAS Update. Available online: https://www.gps.gov/multimedia/presentations/2015/03/munich/lawrence1.pdf (accessed on 19 January 2022).
- Lawrence, D. FAA Navigation Programs Update. Available online: https://www.gps.gov/cgsic/meetings/2019/lawrence.pdf (accessed on 19 January 2022).
- Walter Kee, C.; Walter, T.; Kee, C.; Chao, Y.C.; Tsai, Y.J.; Peled, U.; Ceva, J.; Barrows, A.K.; Abbott, E.; Powell, D.; et al. Flight Trials of the Wide-Area Augmentation System (WAAS). In Proceedings of the ION GPS 1994, Salt Lake City, UT, USA, 20–23 September 1994. [Google Scholar]
- European GNSS Agency (EGA). EGNOS Open Service (OS) Service Definition Document Issue 2.3. Available online: https://www.gsc-europa.eu/sites/default/files/sites/all/files/egnos_os_sdd_in_force.pdf (accessed on 19 January 2022).
- EGA. EGNOS Safety of Life (SOL) Service Definition Document Issue 3.4. Available online: https://www.gsc-europa.eu/sites/default/files/sites/all/files/egnos_sol_sdd_in_force.pdf (accessed on 19 January 2022).
- EGA. EGNOS Data Access Service (EDAS) Service Definition Document Issue 2.2. Available online: https://egnos-user-support.essp-sas.eu/new_egnos_ops/sites/default/files/documents/egnos_edas_sdd_in_force.pdf (accessed on 19 January 2022).
- Thales Alenia Space. EGNOS Status. Available online: https://www.icao.int/APAC/APAC-RSO/GBASSBAS%20Implementation%20Workshop/1-5_EGNOS%20Status_final%20(G%20COMELLI).pdf (accessed on 19 January 2022).
- Celestino, U. EGNOS Status and Plans. Available online: https://www.icao.int/MID/Documents/2016/ACAC-ICAO%20GNSS/EC%20Rabat%20EGNOS%20status%20and%20plans_final.pdf#search=EGNOS (accessed on 19 January 2022).
- Krasuski, K.; Wierzbicki, D. Monitoring Aircraft Position Using EGNOS Data for the SBAS APV Approach to the Landing Procedure. Sensors 2020, 20, 1945. [Google Scholar] [CrossRef] [PubMed] [Green Version]
- Saito, S. MSAS System Development. Available online: https://www.icao.int/APAC/APAC-RSO/GBASSBAS%20Implementation%20Workshop/1-6_MSAS%20System%20Development_Rev2%20(S%20Saito).pdf (accessed on 19 January 2022).
- Cabinet Office. Quasi-Zenith Satellite System Performance Standard (PS-QZSS-001). Available online: https://qzss.go.jp/en/technical/download/pdf/ps-is-qzss/ps-qzss-001.pdf (accessed on 19 January 2022).
- Sakai, T.; Tashiro, H. MSAS Status. In Proceedings of the Meeting of the Satellite Division of the Institute of Navigation, Savannah, GA, USA, 22–25 September 2013; pp. 2343–2360. [Google Scholar]
- Sakai, T. The status of dual-frequency multi-constellation SBAS trial by Japan. In Proceedings of the International Symposium on GNSS, Hong Kong, China, 8–10 December 2017. [Google Scholar]
- Schemmp, T. GAGAN Regional Service Availability. Available online: https://www.icao.int/APAC/APAC-RSO/GBASSBAS%20Implementation%20Workshop/3-7_GAGAN_Regional_Service_Availability%20(T%20Schemmp).pdf (accessed on 19 January 2022).
- Airports Authority of India (AAI). System Development—GAGAN. Available online: https://www.icao.int/APAC/APAC-RSO/GBASSBAS%20Implementation%20Workshop/1-7_System%20Development-GAGAN_final%20(M%20Rao).pdf#search=GAGAN (accessed on 19 January 2022).
- ICAO. Status Update of GNSS Activities in India. Available online: https://www.icao.int/APAC/Meetings/2016%20ISTF6/IP05_IND%20AI.3%20-%20Status%20update%20of%20GNSS%20activities.pdf#search=GAGAN (accessed on 19 January 2022).
- ICAO. GAGAN Status and Expansion. Available online: https://www.icao.int/APAC/Meetings/2017%20APANPIRG28/IP%2006,%20AI%203.4%20-%20GAGAN%20Ver%201.0.pdf#search=GAGAN (accessed on 19 January 2022).
- Revnivykh, I. GLONASS and SDCM Status and Development. Available online: http://www.unoosa.org/documents/pdf/icg/2019/icg14/03.pdf (accessed on 19 January 2022).
- ICAO. Status of Korean SBAS Program. Available online: https://www.icao.int/APAC/Meetings/2017%20PBNICG4/IP12_Status%20of%20Korean%20SBAS%20Program_updated.pdf#search=KASS (accessed on 19 January 2022).
- Lee, E. System Development—KASS. Available online: https://www.icao.int/APAC/APAC-RSO/GBASSBAS%20Implementation%20Workshop/1-8_KASS_Development_Status_final%20(E%20Lee).pdf#search=KASS (accessed on 19 January 2022).
- Choi, J. Regulation for KASS Certification. Available online: https://www.icao.int/APAC/APAC-RSO/GBASSBAS%20Implementation%20Workshop/2-6_[final]%20ICAO%20workshop%20presentation%20(Y%20Choi).pdf#search=KASS (accessed on 19 January 2022).
- China Satellite Navigation Office (CSNO). The Application Service Architecture of BeiDou Navigation Satellite System (Version 1.0). Available online: http://www.beidou.gov.cn/xt/gfxz/201912/P020191227333024390305.pdf (accessed on 19 January 2022).
- ICAO. The Development Plan of the BeiDou Satellite-Based Augmentation System (BDSBAS). Available online: https://www.icao.int/APAC/Meetings/2017%20CNSSG21/WP16_China%20AI.5%20-%20Rev%20-%20Beidou%20Augumentation%20System.pdf#search=BDSBAS (accessed on 19 January 2022).
- ICAO. DFMC SBAS SARPs: Part A Version 2.2. Available online: https://www.icao.int/airnavigation/Documents/NSP5_Report%20on%20Agenda%20Item%202.APPENDIX%20A1%20-%20DFMC%20SBAS%20SARPS%20Part%20A.pdf (accessed on 19 January 2022).
- CSNO. Development of the BeiDou Navigation Satellite System (Version 4.0). Available online: http://www.beidou.gov.cn/xt/gfxz/201912/P020191227430565455478.pdf (accessed on 19 January 2022).
- GPS PRN Coordination Office (PRNCO). L1 C/A PRN Code Assignments. Available online: https://www.gps.gov/technical/prn-codes/L1-CA-PRN-code-assignments-2020-Oct.pdf (accessed on 19 January 2022).
- Liu, C.; Gao, W.; Shao, B.; Lu, J.; Wang, W.; Chen, Y.; Su, C.; Xiong, S.; Ding, Q. Development of BeiDou satellite-based augmentation system. Navigation 2021, 68, 405–417. [Google Scholar] [CrossRef]
- Radio Technical Commission for Aeronautic (RTCA). Minimum Operational Performance Standards (MOPS) for Global Positioning System/Satellite-Based Augmentation System Airborne Equipment (Standard), Washington, DC, USA. 2016. Available online: https://my.rtca.org/NC__Product?id=a1B3600000211rIEAQ (accessed on 19 January 2022).
- Cao, Y.; Hu, X.; Wu, B. The Wide Area Difference System for the Regional Satellite Navigation System of Compass. Sci. China Phys. Mech. Astron. 2012, 55, 1307–1315. [Google Scholar] [CrossRef]
- ICAO. International Standards and Recommended Practices (SARPs) Annex 10—Aeronautical Telecommunications, 7th ed.; ICAO: Montreal, QC, Canada, 2018; Volume I. [Google Scholar]


| Satellite | PRN Code Number | Orbital Slot | Launch Date |
|---|---|---|---|
| GEO-1 | 130 | 140E | 1 November 2018 |
| GEO-2 | 144 | 80E | 9 March 2020 |
| GEO-3 | 143 | 110.5E | 23 June 2020 |
| Indicators | Statistical Results |
|---|---|
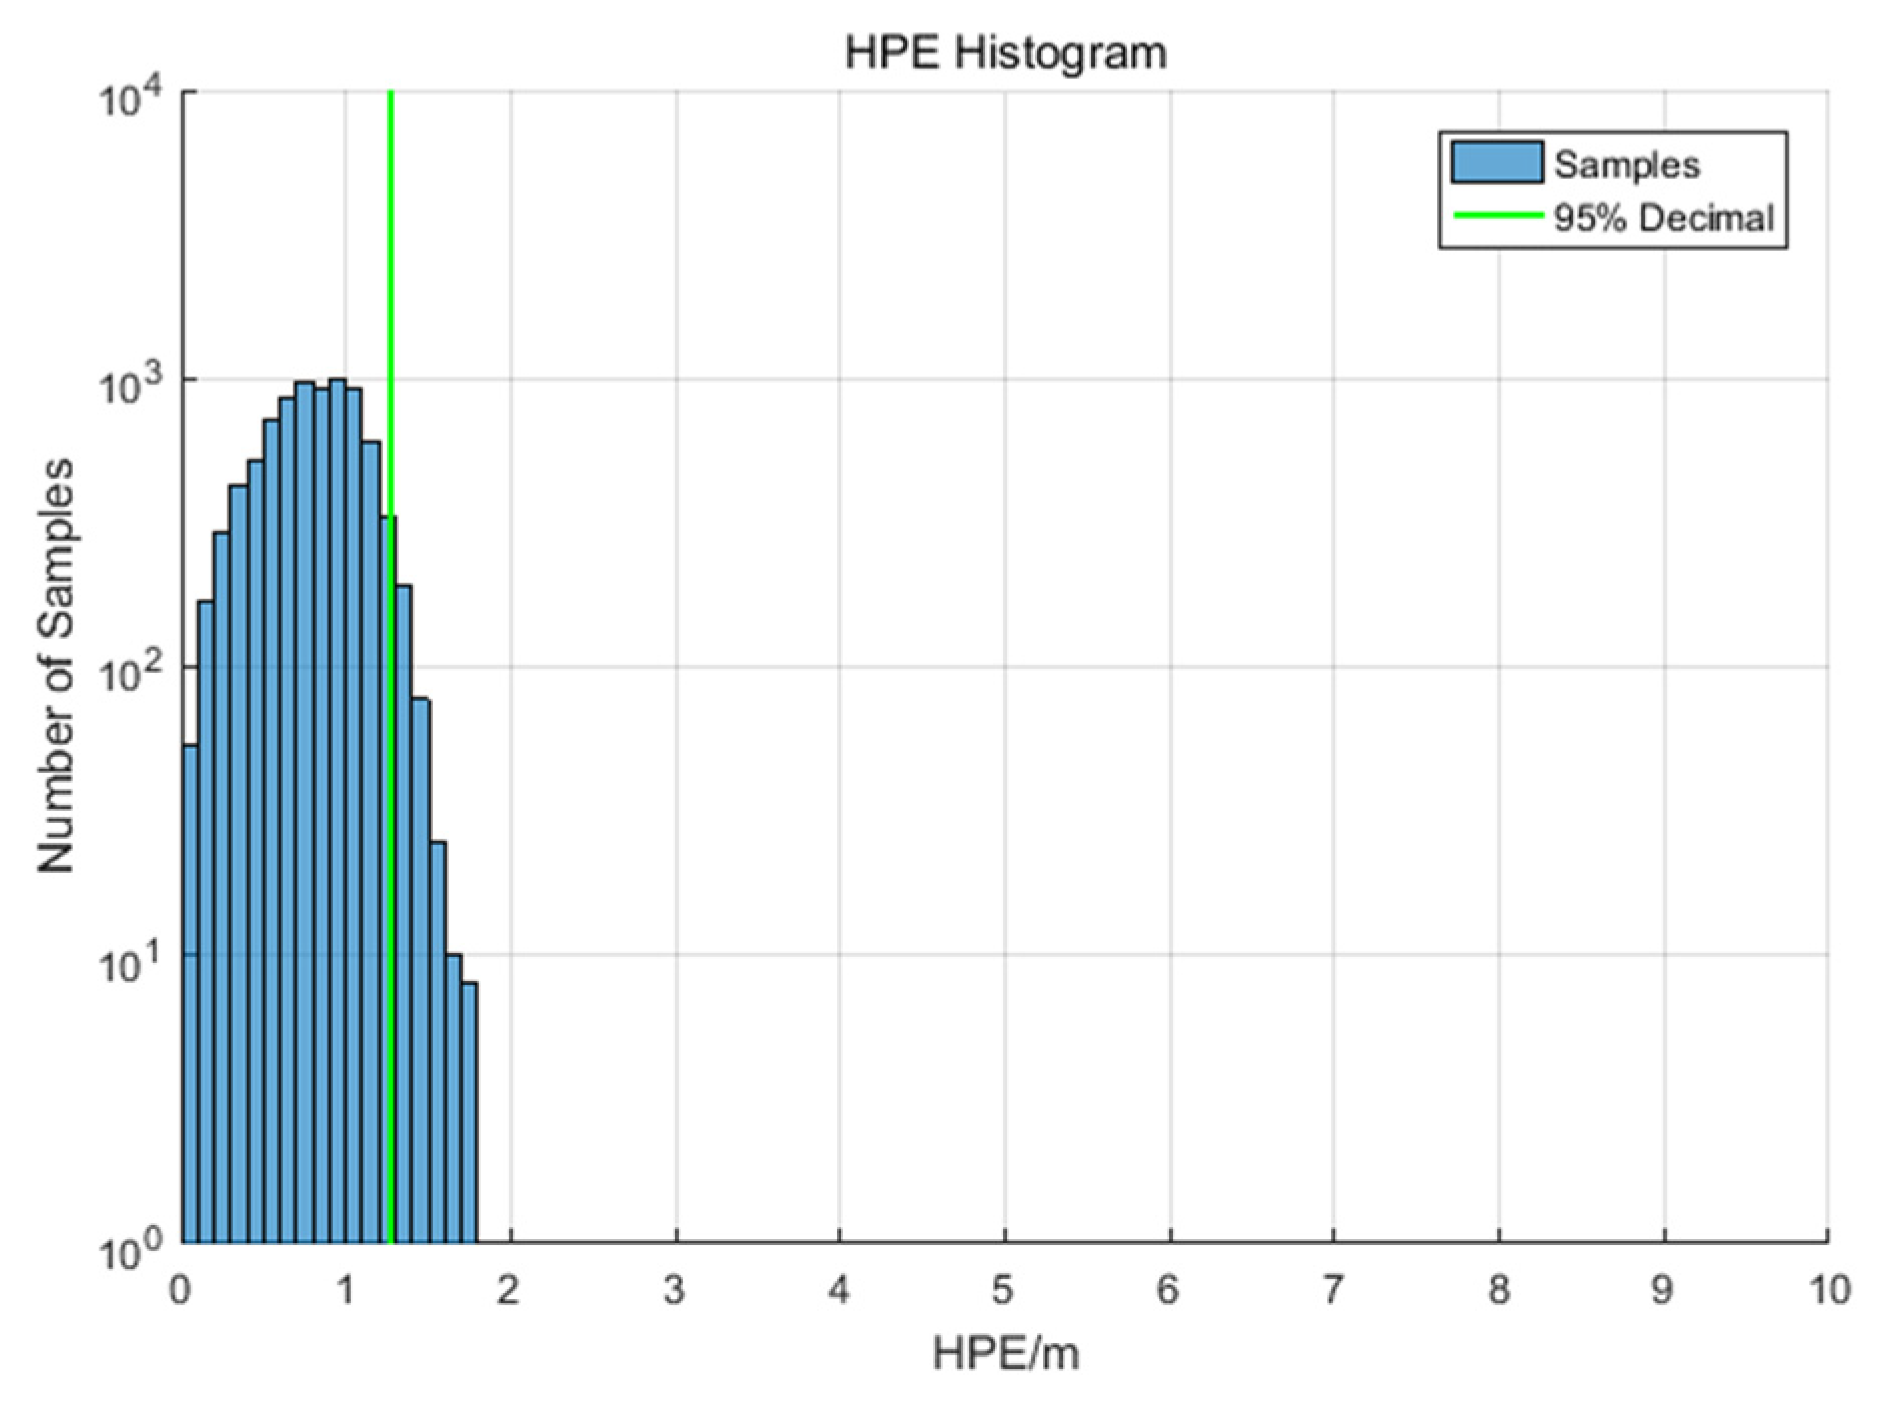
| Horizontal accuracy/m (95%) | 1.62 |
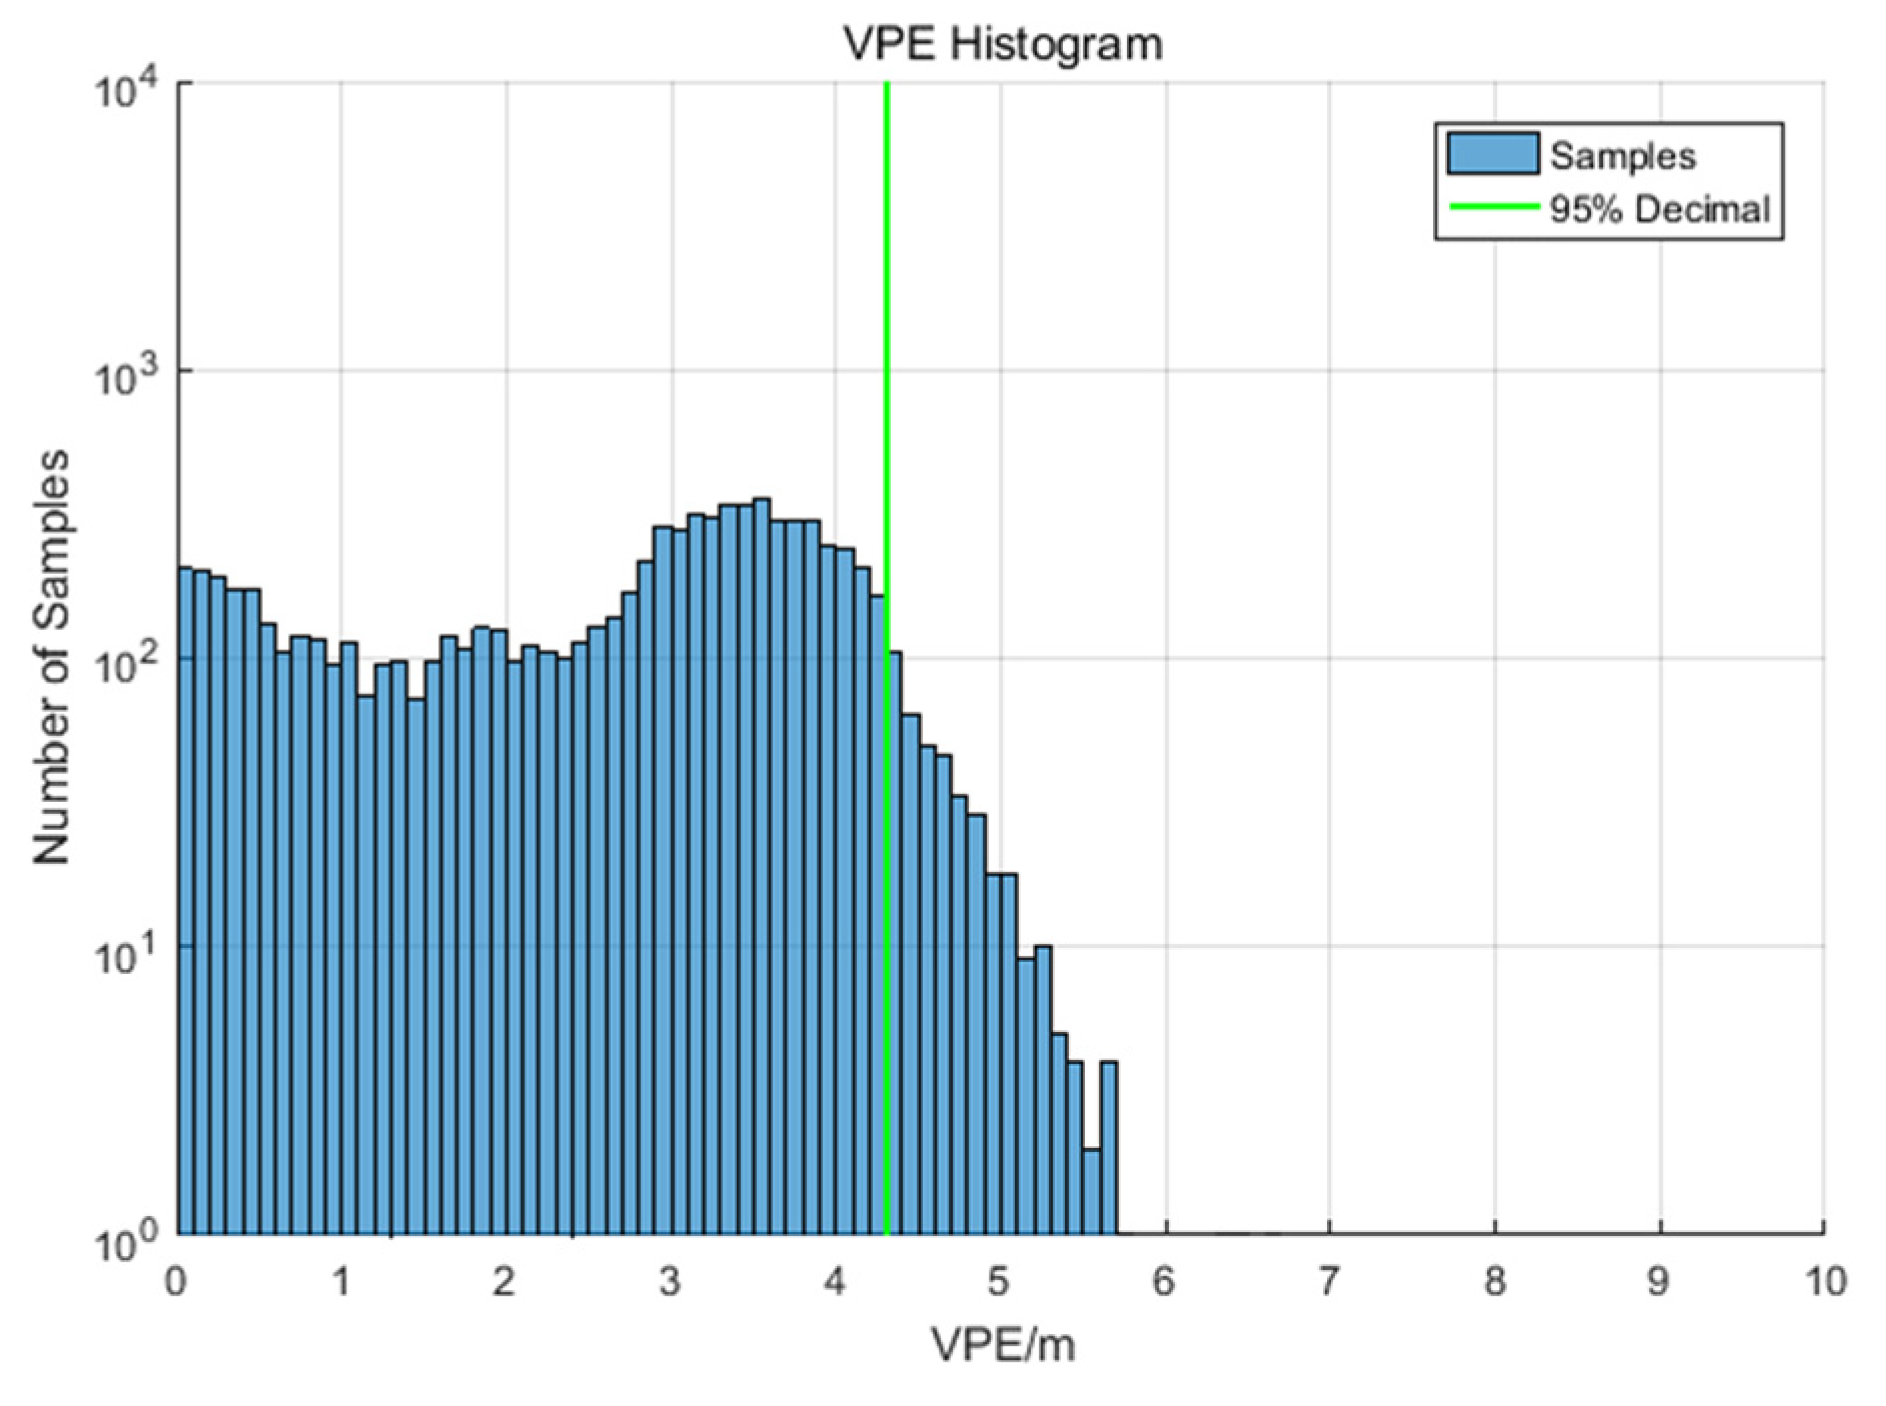
| Vertical accuracy/m (95%) | 4.38 |
| Minimum horizontal safety index | 7.160 |
| Minimum vertical safety index | 4.594 |
| NPA availability | 100.00% |
| NPA continuity | 100.00% |
| NPA HMI events | 0 |
| APV-I availability | 100.00% |
| APV-I continuity | 100.00% |
| APV-I HMI events | 0 |
| Indicators | Statistical Results |
|---|---|
| Horizontal accuracy/m (95%) | 1.27 |
| Vertical accuracy/m (95%) | 4.30 |
| Minimum horizontal safety index | 8.860 |
| Minimum vertical safety index | 2.582 |
| NPA availability | 100.00% |
| NPA continuity | 100.00% |
| NPA HMI events | 0 |
| APV-I availability | 100.00% |
| APV-I continuity | 100.00% |
| APV-I HMI events | 0 |
| Indicators | Statistical Results |
|---|---|
| Horizontal accuracy/m (95%) | 1.49 |
| Vertical accuracy/m (95%) | 4.04 |
| Minimum horizontal safety index | 11.506 |
| Minimum vertical safety index | 3.099 |
| NPA availability | 100.000% |
| NPA continuity | 100.000% |
| NPA HMI events | 0 |
| APV-I availability | 99.993% |
| APV-I continuity | 99.989% |
| APV-I HMI events | 0 |
Publisher’s Note: MDPI stays neutral with regard to jurisdictional claims in published maps and institutional affiliations. |
© 2022 by the authors. Licensee MDPI, Basel, Switzerland. This article is an open access article distributed under the terms and conditions of the Creative Commons Attribution (CC BY) license (https://creativecommons.org/licenses/by/4.0/).
Share and Cite
Gao, W.; Cao, Y.; Liu, C.; Lu, J.; Shao, B.; Xiong, S.; Su, C. Construction Progress and Aviation Flight Test of BDSBAS. Remote Sens. 2022, 14, 1218. https://doi.org/10.3390/rs14051218
Gao W, Cao Y, Liu C, Lu J, Shao B, Xiong S, Su C. Construction Progress and Aviation Flight Test of BDSBAS. Remote Sensing. 2022; 14(5):1218. https://doi.org/10.3390/rs14051218
Chicago/Turabian StyleGao, Weiguang, Yueling Cao, Cheng Liu, Jun Lu, Bo Shao, Shuai Xiong, and Chengeng Su. 2022. "Construction Progress and Aviation Flight Test of BDSBAS" Remote Sensing 14, no. 5: 1218. https://doi.org/10.3390/rs14051218
APA StyleGao, W., Cao, Y., Liu, C., Lu, J., Shao, B., Xiong, S., & Su, C. (2022). Construction Progress and Aviation Flight Test of BDSBAS. Remote Sensing, 14(5), 1218. https://doi.org/10.3390/rs14051218