Article

Assessing the Accuracy and Potential for Improvement of the National Land Cover Database’s Tree Canopy Cover Dataset in Urban Areas of the Conterminous United States

by
Mehdi Pourpeikari Heris
1,*,
Kenneth J. Bagstad
2,
Austin R. Troy
3 and
Jarlath P. M. O’Neil-Dunne
4
1
Department of Urban Policy and Planning, Hunter College, City University of New York, 695 Park Ave., New York, NY 10065, USA
2
US Geological Survey, Geosciences & Environmental Change Science Center, Lakewood, CO 80225, USA
3
College of Architecture and Planning, University of Colorado Denver, Denver, CO 80202, USA
4
Spatial Analysis Laboratory, University of Vermont, Burlington, VT 05405, USA
*
Author to whom correspondence should be addressed.
Remote Sens. 2022, 14(5), 1219; https://doi.org/10.3390/rs14051219
Submission received: 29 November 2021 / Revised: 23 February 2022 / Accepted: 25 February 2022 / Published: 2 March 2022
(This article belongs to the Special Issue Remote Sensing of Urban Vegetation and Its Applications)

Abstract

:
The National Land Cover Database (NLCD) provides time-series data characterizing the land surface for the United States, including land cover and tree canopy cover (NLCD-TC). NLCD-TC was first published for 2001, followed by versions for 2011 (released in 2016) and 2011 and 2016 (released in 2019). As the only nationwide tree canopy layer, there is value in assessing NLCD-TC accuracy, given the need for cross-city comparisons of urban forest characteristics. Accuracy assessments have only been conducted for the 2001 data and suggest substantial inaccuracies for that dataset in cities. For the most recent NLCD-TC version, we used various datasets that characterize the built environment, weather, and climate to assess their accuracy in different contexts within 27 cities. Overall, NLCD underestimates tree canopy in urban areas by 9.9% when compared to estimates derived from those high-resolution datasets. Underestimation is greater in higher-density urban areas (13.9%) than in suburban areas (11.0%) and undeveloped areas (6.4%). To evaluate how NLCD-TC error in cities could be reduced, we developed a decision tree model that uses various remotely sensed and built-environment datasets such as building footprints, urban morphology types, NDVI (Normalized Difference Vegetation Index), and surface temperature as explanatory variables. This predictive model removes bias and improves the accuracy of NLCD-TC by about 3%. Finally, we show the potential applications of improved urban tree cover data through the examples of ecosystem accounting in Seattle, WA, and Denver, CO. The outputs of rainfall interception and urban heat mitigation models were highly sensitive to the choice of tree cover input data. Corrected data brought results closer to those from high-resolution model runs in all cases, with some variation by city, model, and ecosystem type. This suggests paths forward for improving the quality of urban environmental models that require tree canopy data as a key model input.

1. Introduction

Urban trees are an important feature in evaluating urban landscapes and ecosystem services. The US does not have any nationwide tree canopy cover data product. The Multi-Resolution Land Characteristics (MRLC) Consortium produces the National Land Cover Database (NLCD) for the United States using Landsat satellite imagery and other supplementary resources such as high-resolution imagery and digital elevation models [1]. In this consortium, the US Geological Survey (USGS) leads the development of NLCD land cover and imperviousness datasets, National Oceanic and Atmospheric Administration (NOAA) the development of the Coastal Change Analysis Product (C-CAP) land cover product for coastal zones, and the US Department of Agriculture Forest Service (USFS) the development of the NLCD tree canopy cover (NLCD-TC) product [2]. NLCD-TC is an essential nationwide dataset that has been extensively used for a wide variety of applications. Some examples include modeling urban heat island effects [3], biodiversity [4], stormwater management [5], flood regulation [6], air quality [7], urban forest health [8], carbon sequestration [9], building energy analysis [10], and forest inventory estimation [11]. Three versions of the NLCD-TC data have been published, representing the years 2001, 2011, and 2016. The most recent version, released in 2019, includes data for the years 2011 and 2016, which allow direct comparison of NLCD-TC between years for the first time. The 2019 release, thus, allows researchers to carry out longitudinal studies related to the ecological and socio-economic roles of trees. Such longitudinal data can be valuable for time-series analysis of, for instance, tree canopy change [12], ecological processes dependent on these, or ecosystem accounting [13,14].
Although higher-resolution (i.e., 1 m) data for land cover, tree canopy cover, and impervious surfaces are available for many cities and regions in the US, the production of such data requires costly high-resolution observation platforms or the use of active sensors such as LiDAR [15]. At the extent of the conterminous US, NLCD products are still the most readily available source—having wall-to-wall coverage and consistent methods across space and time. Therefore, in the absence of a consistent and nationwide high-resolution dataset on urban forests, NLCD-TC data are often used by default to map urban trees where no alternative high-resolution data exist or in cases where large-area comparisons are needed. Although past studies have evaluated the NLCD-TC error [16,17], the extent to which NLCD-TC is truly usable for this purpose is still incompletely understood. The need for such research is augmented by MRLC intent to continue to produce these products for future years.
Since the NLCD-TC dataset fills an important data niche, its use comes with a risk of error propagation. For instance, Sander et al. [18] used NLCD-TC data in a hedonic model to measure the impact of urban trees on property values for two counties in Minnesota. They used this layer in incremental distances as a key input dataset in their models. Although they mention that NLCD-TC data had a mean absolute error of 14.1%, they assumed that this error can be ignored when a large number of cells is measured (i.e., 1000 pixels). This conjecture would be correct if the error were normally distributed around zero and across space. However, this assumption is an unsafe one because the error is not evenly distributed across different landscapes, and, thus, can introduce omitted variable bias into statistical models.
Many cities care about measuring their tree canopy so that they can track its changes over time and the impacts of those changes. For instance, Tampa Bay, Florida measures its urban forest every five years and quantifies the ecosystem service benefits it provides for use in urban forest management [19,20]. However, many cities, particularly smaller ones, lack the resources for periodic monitoring. In the absence of such data, local assessments are challenging. Changes over time tend to be small, meaning that for detecting such longitudinal assessments, a very accurate tree cover estimate is needed. Machine learning-based predictive models may, thus, help with estimating tree cover in longitudinal, regional, or local studies and using the data to quantify the socio-economic processes dependent on the urban tree canopy and their development could be useful for researchers outside the US using analogous datasets in other countries.
The original 2001 NLCD-TC dataset was modeled using a 30 m tree cover layer aggregated from 1 m resolution panchromatic digital orthophoto quarter-quadrangle images as the response variable; explanatory variables included 30 m resolution data extracted from 1992 NLCD land cover, Landsat 5 and 7 imagery, and a digital elevation model. The predictive model was based on regression trees and linear regression [21]. To generate the second NLCD-TC product, representing the 2011 tree canopy, five pilot areas across the United States were sampled using a dot grid approach. Coulston et al. [22] used manual photo-interpretation to define whether each point contained tree canopy or not. They used National Agriculture Imagery Program (NAIP) imagery (1 m resolution) as the response variable and Landsat 5 imagery and a digital elevation model as explanatory variables. Over 63,200 locations were interpreted to produce the response variable (Yang et al., 2018). Their predictive model was based on random forest regression, and the root mean square error (RMSE) of their model varied between 10 and 18%. Coulston et al. [22] used five NLCD mapping zones as sampling zones to train their model and reported that the error is greater in urban areas. However, their sampling zones do not represent different urban density profiles in urban areas; therefore, their method does not provide evidence on how the error varies across different density ranges.
As described above, basic definition, data, and algorithms for developing NLCD-TC 2001 and 2011 data were fundamentally different in terms of sampling and response variables. Critically, the approach to identifying tree canopies in the response imagery was also different. In the 2001 data, trees were classified if vegetation was measured to be 5 m or taller. In the 2011 data, trees were classified as a life form with no height threshold [23]. Due to these substantial differences, 2001 and 2011 datasets are not comparable and, therefore, not appropriate for longitudinal studies. Currently, the NLCD website does not include the 2001 data in its catalog.
In fall 2019, a third generation NLCD-TC database was published, including tree canopy data that were generated for the years 2011 and 2016 [24]. The 2019 NLCD-TC version uses similar methods as the previous version. To produce the 2016 products, the same “resources were not available to re-interpret tree canopy cover of all of the locations used in the [original] 2011 product. Rather 3% of the original locations were re-interpreted using newer NAIP imagery based on the occurrence of wildfires or large NDVI changes detected in Landsat-derived time series” [24] (p. 113). To build the explanatory variables for the production of the 2011 product, Landsat 5 Thematic Mapper imagery was used, whereas for the 2016 product, Landsat 8 Operational Land Imager imagery was used. The main predictive algorithm remains random forest regression.
Three studies have assessed the accuracy of the 2001 NLCD-TC dataset. First, Homer et al. [25] evaluated the accuracy of the NLCD-TC 2001 data in three NLCD mapping zones in Virginia, Minnesota, and Utah. They found mean absolute error in each zone of 9.9, 14.1, and 8.4%, respectively. A second study by Greenfield et al. [16] used aerial photos to identify trees in selected geographies and compared them with NLCD-TC values. To determine the assessment locations, they reclassified the 65 NLCD mapping zones into five larger regions (Southeast, Northeast, Midwest, Mountain West, and Arid West). Within four randomly selected NLCD mapping zones in each region, they selected seven incorporated areas or census-designated places of varying population densities. They randomly distributed 200 points across these locations. Greenfield et al. found that the NLCD-TC 2001 data underestimate tree cover by about 9.7% on average, with a consistent error rate across the conterminous United States and no statistical differences among different regions. A third accuracy assessment by Nowak and Greenfield [17] used manual photo-interpretation in a manner similar to Greenfield et al. [16] but distributed their samples in all 65 NLCD mapping zones. Nowak and Greenfield [17] found that the 2001 NLCD-TC data underestimate tree cover in 64 of the zones by 9.7% on average. These studies are based on dispersed sampling across different zones and climates. Notably, they did not identify the error distribution across the gradient of settlement density. The accuracy of NLCD-TC 2011 data also has not been independently studied—either for the first 2011 dataset released in 2016 or the more recently released 2019 product, which covers the years 2011 and 2016. Studies like these can shed light on the ways we use NLCD products.
Urban areas are typically more heterogeneous than rural areas. Any given urban NLCD 30 m grid cell often aggregates a wider variety of land cover classes into a single type than a more homogeneous non-urban environment. Further, “canopies” composed of a single tree, often smaller than a single pixel, are common in urban areas, and it is unclear if and when NLCD-TC data detect these isolated tree patches.
Given that no other national urban forest data sources exist, there is a need to better understand and quantify patterns and source error in the NLCD-TC datasets for urban areas so that the potential uses and limits of this dataset for this highly important context can be better understood. The objective of this paper is to do so by running comparisons of NLCD-TC against more accurate, high-resolution urban tree cover data by city and across multiple variables describing the built environment, climate, and ecoregion characteristics. Because high-resolution tree canopy data can be used to derive a percent tree cover for the same pixel area, albeit using finer scale building blocks, it is valid to compare the two for accuracy. However, it is worth noting that no matter how accurate NLCD-TC is in its pixel-level tree percentages, it can never characterize where the tree canopies are within that pixel when coverage is less than total, meaning that NLCD-TC will never be appropriate for analyses that require a high level of spatial precision.
We next evaluate methods of accuracy enhancement using additional nationally available explanatory variables derived from other sources, including NLCD land cover, regional climate data, Landsat 8 imagery, and building footprint data. This approach provides an exploratory application of how effectively remotely sensed products and more extensive training data (i.e., high-resolution tree canopy cover datasets) can address NLCD-TC spatial error in urban areas. Finally, we evaluate the implications of this error assessment for a modeling application where NLCD-TC is a key model input—in our case, city-scale ecosystem accounting/ecosystem service assessment [13,14]. This analysis shows how uncertainties in the NLCD-TC data affect research conclusions; though limited to a specific application, we expect our results to have relevance for the modeling of other urban phenomena dependent on tree canopy cover.

2. Methods

In this section, we first describe the data that we used in this work, then our data compilation and analysis procedures. The datasets that we used served two purposes: (1) accuracy assessment of the NLCD-TC data in different urban areas and (2) construction and testing of a predictive model to improve the quality of NLCD-TC and its applications to environmental modeling in urban areas.

2.1. Data

For the accuracy assessment, we used the most recent version of the 2011 NLCD-TC for the conterminous United States from the MRLC [1] as the target variable of interest.
We used high-resolution (1 m) land cover data (that includes tree canopy cover as a class) for 27 cities to build a 30 m layer (hereafter referred to as the “high-resolution derived TC” data) for accuracy assessment of the NLCD-TC data in urban areas as described in Section 2.2. For 10 cities, we used data from the US Environmental Protection Agency (EPA) EnviroAtlas portal. The reported fuzzy accuracy of these layers ranges from 83 to 95% at the 1 m scale [26]. For 17 cities, we received the data produced by the University of Vermont Spatial Analysis Laboratory (UVM SAL: 2011–2017; EPA data for Cleveland, OH, and Chicago, IL, USA, were also originally developed by the University of Vermont). Only a few cities provide a formal accuracy assessment for these layers. The tree cover layers for New York City and Philadelphia are 99 and 97% accurate [27]. Since the UVM SAL uses a similar procedure for all cities, including manual correction, it is expected that tree cover data for other cities will have similar accuracy levels. Nine of the datasets covered entire counties (e.g., Baltimore County, MD, USA); others covered small (e.g., Cambridge, MA, USA) to large (e.g., New York City, NY, USA) cities. City/county data represented the years 2007 through 2016, though nearly 60% of data are for 2010 and 2011. To evaluate how representative the data were across diverse climatic conditions, we classified each city/county dataset by EPA Level II Ecoregion [28] (Table 1).
We used six additional characteristics, listed below, as independent variables to construct a predictive model of tree canopy cover that aims to improve on the native NLCD-TC product in cities. Additionally, we used surface temperature, NDVI, building footprint, and urban density data to assess how NLCD-TC accuracy varies based on environmental and built environment characteristics (Section 2.2).
(a)
Surface temperature and NDVI. Tree cover has a negative correlation with surface temperature but a positive correlation with normalized difference vegetation index (NDVI) [29,30]. Therefore, we produced surface temperature and NDVI datasets from Landsat 8 images for each city or county (Table 1) as explanatory variables to evaluate NLCD-TC error. To produce these, we downloaded the four least cloud-covered summer images for the years 2013–2015. Considering the limited number of cloud-free images in humid parts of the US in the summertime, we judged four images per tile to provide sufficient variation and manageable computational demand. We calculated surface temperature using Landsat 8 band 10 and NDVI using bands 4 and 5 of the images based on USGS guidelines [31]. We extracted median values for surface temperature and NDVI for all four images in each scene.
(b)
Building footprints. In urban environments, trees and buildings create a heterogeneous environment, which makes tree detection using remotely sensed data challenging. To create a gradient of built density, we used the area of building footprints in each cell; this dataset is extracted from Microsoft building footprint data [32]. Microsoft reported that these data have 99.3% precision and 93.5% pixel recall accuracy. Heris et al. [33] evaluated the accuracy of this dataset and found it to detect 96, 93, and 94% of buildings over 100 m2 in Denver, CO, New York City, NY, and Los Angeles County, CA, respectively. We used three of the six summary datasets generated by Heris et al. [33]: (1) total building footprint coverage per cell (m2 per 900 m2 cell); (2) number of buildings that intersect each cell; and (3) area of the average building intersecting the cell (m2). These data have been converted into raster datasets that summarize building data for 30 m cells aligned with NLCD data, better meeting the needs of national-scale models. Because Microsoft used aerial photos from different years to generate this dataset, they did not provide a specific date for these data.
(c)
Urban density. We used an urban morphology classification produced by Heris [34], which is based on Census and impervious surface data for the years 2000 and 2010 (we used the 2010 product in this study). This classification is based on the neighborhood density of each 30 m cell for the conterminous US for five densities: high, medium, and low-density urban areas, urban fringe, and suburbs. This dataset helps to stratify the distribution of NLCD-TC error across different urban morphologies in built environments as well as natural (non-built) areas falling within cities or counties of interest. We also used this dataset to separate built and undeveloped areas. For undeveloped cells, we applied a query to exclude cells that have an impervious surface cover greater than 0%.
(d)
Climate data. To incorporate variation in climatic environments across cities, which helps explain differences in urban tree occurrence, in the NLCD-TC predictive model, we extracted the average annual high and low temperature and average annual precipitation for each city (1990–2018) from the US Climate Data website [35].
(e)
Year built of structures. We used the median year built of structures from the 2010 Census Block Group data [36] to incorporate the age of neighborhoods in our NLCD-TC predictive model assessment. This accounts for the fact that the maturity and size of urban tree canopies often correlate with the age of establishment of residential neighborhoods [37].
(f)
National Land Cover Database (NLCD) land cover. We used the most recent edition of the 2011 NLCD land cover [24] in the NLCD-TC predictive model.

2.2. Dependent and Independent Variables

To compare NLCD-TC values with the high-resolution derived TC data, we aggregated the amount of tree cover in 1 m cells to 30 m cells and calculated the percent cover for every 30 m cell. To evaluate the accuracy of the year 2011 NLCD-TC in US urban areas across different regions and landscapes, we initially calculated error (the difference between high-resolution derived TC and NLCD-TC at 30 m resolution). We report the mean error, RMSE, and Kolmogorov–Smirnov score. Our subsequent analysis has three parts. First, we evaluated the distribution of error in urban areas, across cities, and in different landscapes. Next, we developed a predictive model to improve the accuracy of the NLCD-TC dataset in urban areas. Finally, we showed how the predictive model can improve the accuracy of NLCD-TC in modeling applications for Denver, CO, and Seattle, WA.
To evaluate NLCD-TC error across 27 cities and counties, we generated scatterplots and histograms of the values of tree cover and their error (high-resolution derived TC minus NLCD-TC) in different landscapes. The categories we compared include EPA ecoregions, built versus undeveloped areas, cities, gradients for urban density, tree canopy cover, NDVI, total building footprint coverage, and surface temperature. Plotting these distributions helped us to understand error distribution patterns of the NLCD-TC 2011 data. For example, the total building footprint variable can help determine whether the error is larger in cells that have greater building cover.

2.3. Predictive Model

We developed a predictive model that aims to reduce tree canopy error rates in cities using a series of explanatory variables. Our decision tree model used high-resolution derived TC as the response variable and the following explanatory variables: NLCD-TC, NLCD land cover, building coverage, surface temperature, NDVI, urban density, median year built of housing units, average precipitation, average high temperature, and built/undeveloped. To compile the explanatory variables, we used the NLCD-TC grid structure to convert all layers to raster datasets with matching resolution, extent, and projection system. Ensuring that all raster layers have the same properties enabled the conversion of the raster layers to Python Numpy Arrays, which allows the use of a wide range of optimized libraries. We converted all explanatory layers, clipped from national layers to the 27 cities and counties, to Numpy arrays and then compiled them in a single Pandas dataframe in which every row is the cell data point, and every column is a variable. That primary data frame contains 34.8 million records after excluding cells with open water or no-data values.
We used the Scikit Learn package (version 0.24.2) for Python [38] to run the decision tree regressions. To avoid overfitting, we used a two-level incremental sampling method to evaluate the performance of the model. This sampling method also mitigates potential spatial autocorrelation. The incremental sampling method randomly sampled a fraction of the data. The fractions started from 0.1%, and in 17 steps, reach 100% of the data. For each fraction, we performed the second level of sampling through which we randomly sampled 80% of the data for training the regression model and used 20% of it for testing the results. This two-level sampling method created a 17-step incremental fraction that starts from 0.08 to 0.8% for training the model. The model performance was stable at 75–76% for sample sizes greater than five million (14% of the entire data; Figure 1).

2.4. Validation of the Predictive Model

To examine the predictive power of our model, we separated the data of two cities in widely differing climate zones (Denver, CO, and Seattle, WA, USA) from our training dataset and used the model to correct the bias of NLCD-TC in these cities. We report and present the improved NLCD-TC error distributions and fitted curves.

2.5. Use Case: Running Corrected Data vs. Native NLCD-TC for Two Ecosystem Accounting Models

We evaluated the impact of correcting NLCD-TC on two ecosystem service models that depend on TC as a key input, which we ran for Denver and Seattle. These two models quantify (1) the amount of rainfall intercepted by urban trees and (2) the quantity of cooling energy savings that trees provide through urban heat mitigation [14]. We used three different datasets to show the sensitivity of such models to input tree canopy datasets. The input tree cover data include (1) NLCD-TC 2011 (30 m resolution), (2) corrected NLCD-TC from our predictive model (30 m resolution), and (3) high-resolution tree cover datasets for the two cities (1 m resolution). The interception model uses tree cover and year 2011 precipitation data to quantify rainfall interception by trees during daily storm events throughout the year, accounting for leaf-on and -off seasons (with leaf area index values reduced during the leaf-off season). The heat mitigation impact model uses tree cover, buildings, surface temperature, and weather station data to estimate the cooling energy savings provided by trees [14]. We used the methods and terminology recommended by the United Nations for implementing ecosystem accounting—an internationally standardized approach to systematically quantify ecosystems and the services they provide to the economy. Along with tracking changes over time in ecosystems extent and condition, the System of Environmental-Economic Accounting Ecosystem Accounting (SEEA EA) quantifies, typically using models, the ecosystem services produced by specific ecosystems and used by economic units (businesses, households, and government), using a framework consistent with national economic accounting principles [39]. We used NLCD land cover data as a proxy for ecosystem types and stratified our outcomes using this layer to estimate the services that each ecosystem type provided. In this context, we generally assumed that the high-resolution tree cover data will typically provide more accurate estimates for modeled ecosystem services, though a true accuracy assessment of ecosystem service model results would require calibration data that are seldom available at city and national scale.

2.6. Code Availability

We used Python to program the analysis procedure and generate a variety of figures; we include several key figures representative of our analysis in the Results section below. We included the Jupyter Notebook that contains the code and all figures in a code repository [40].

3. Results

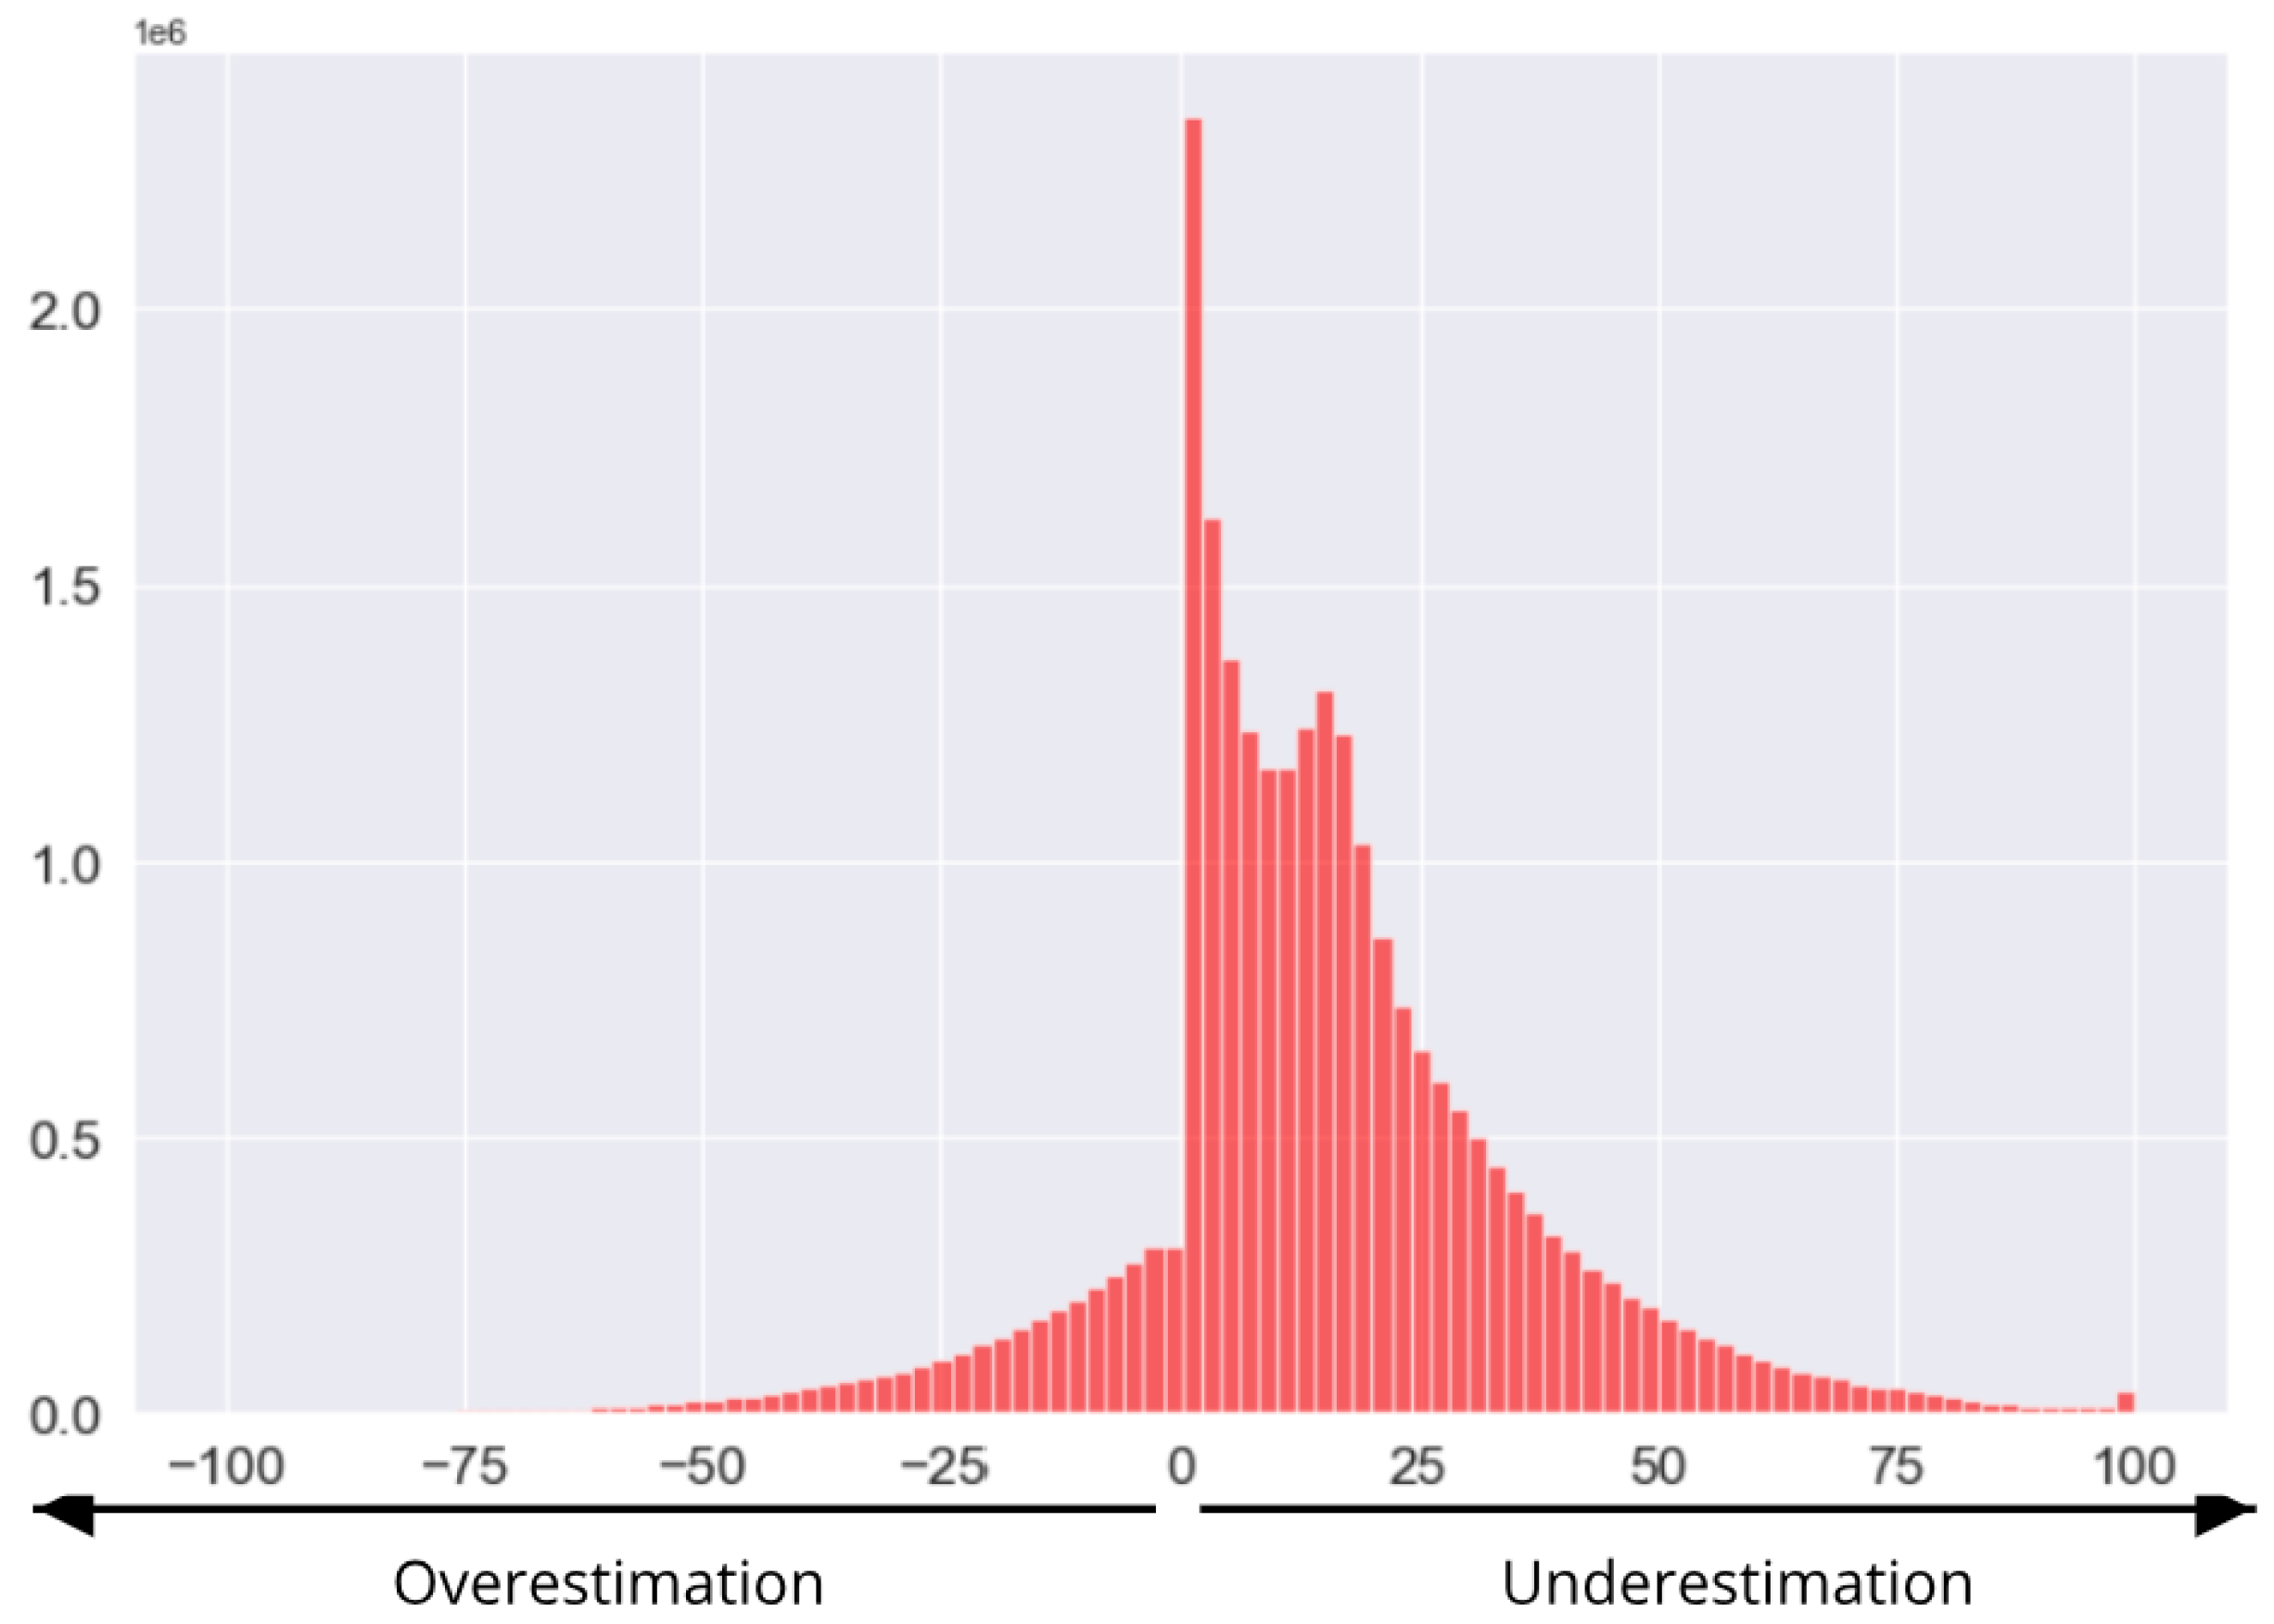
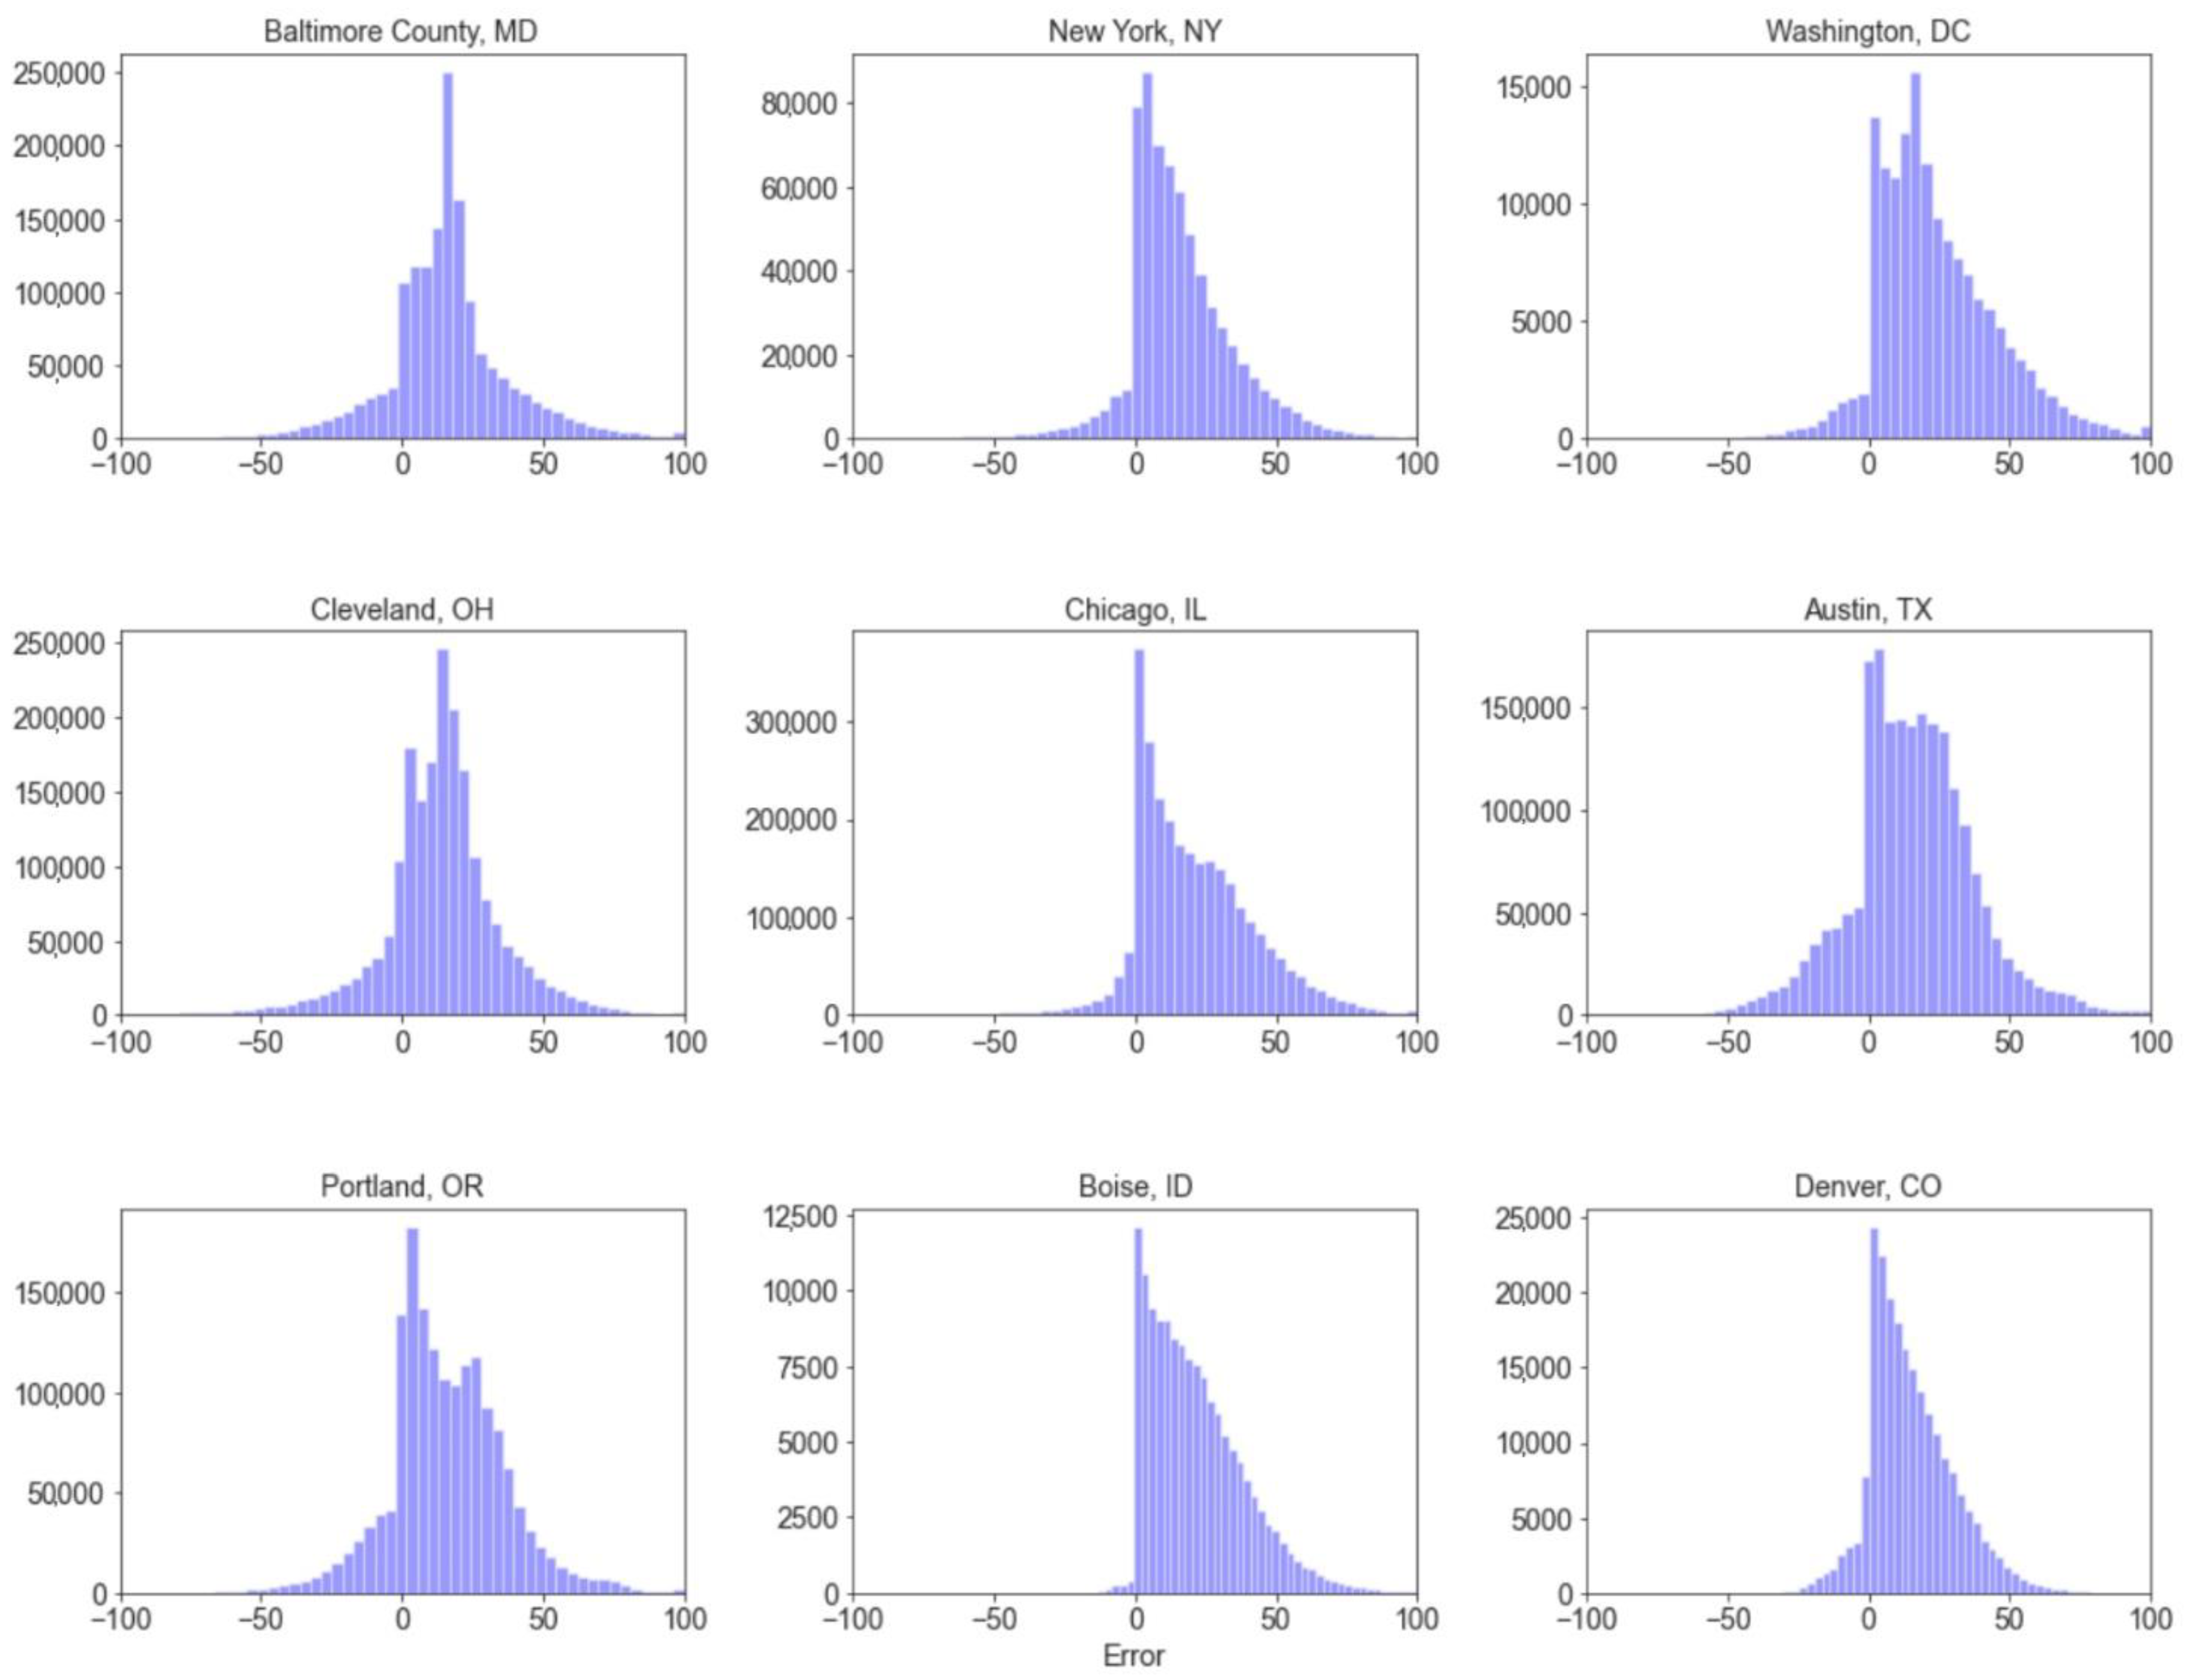
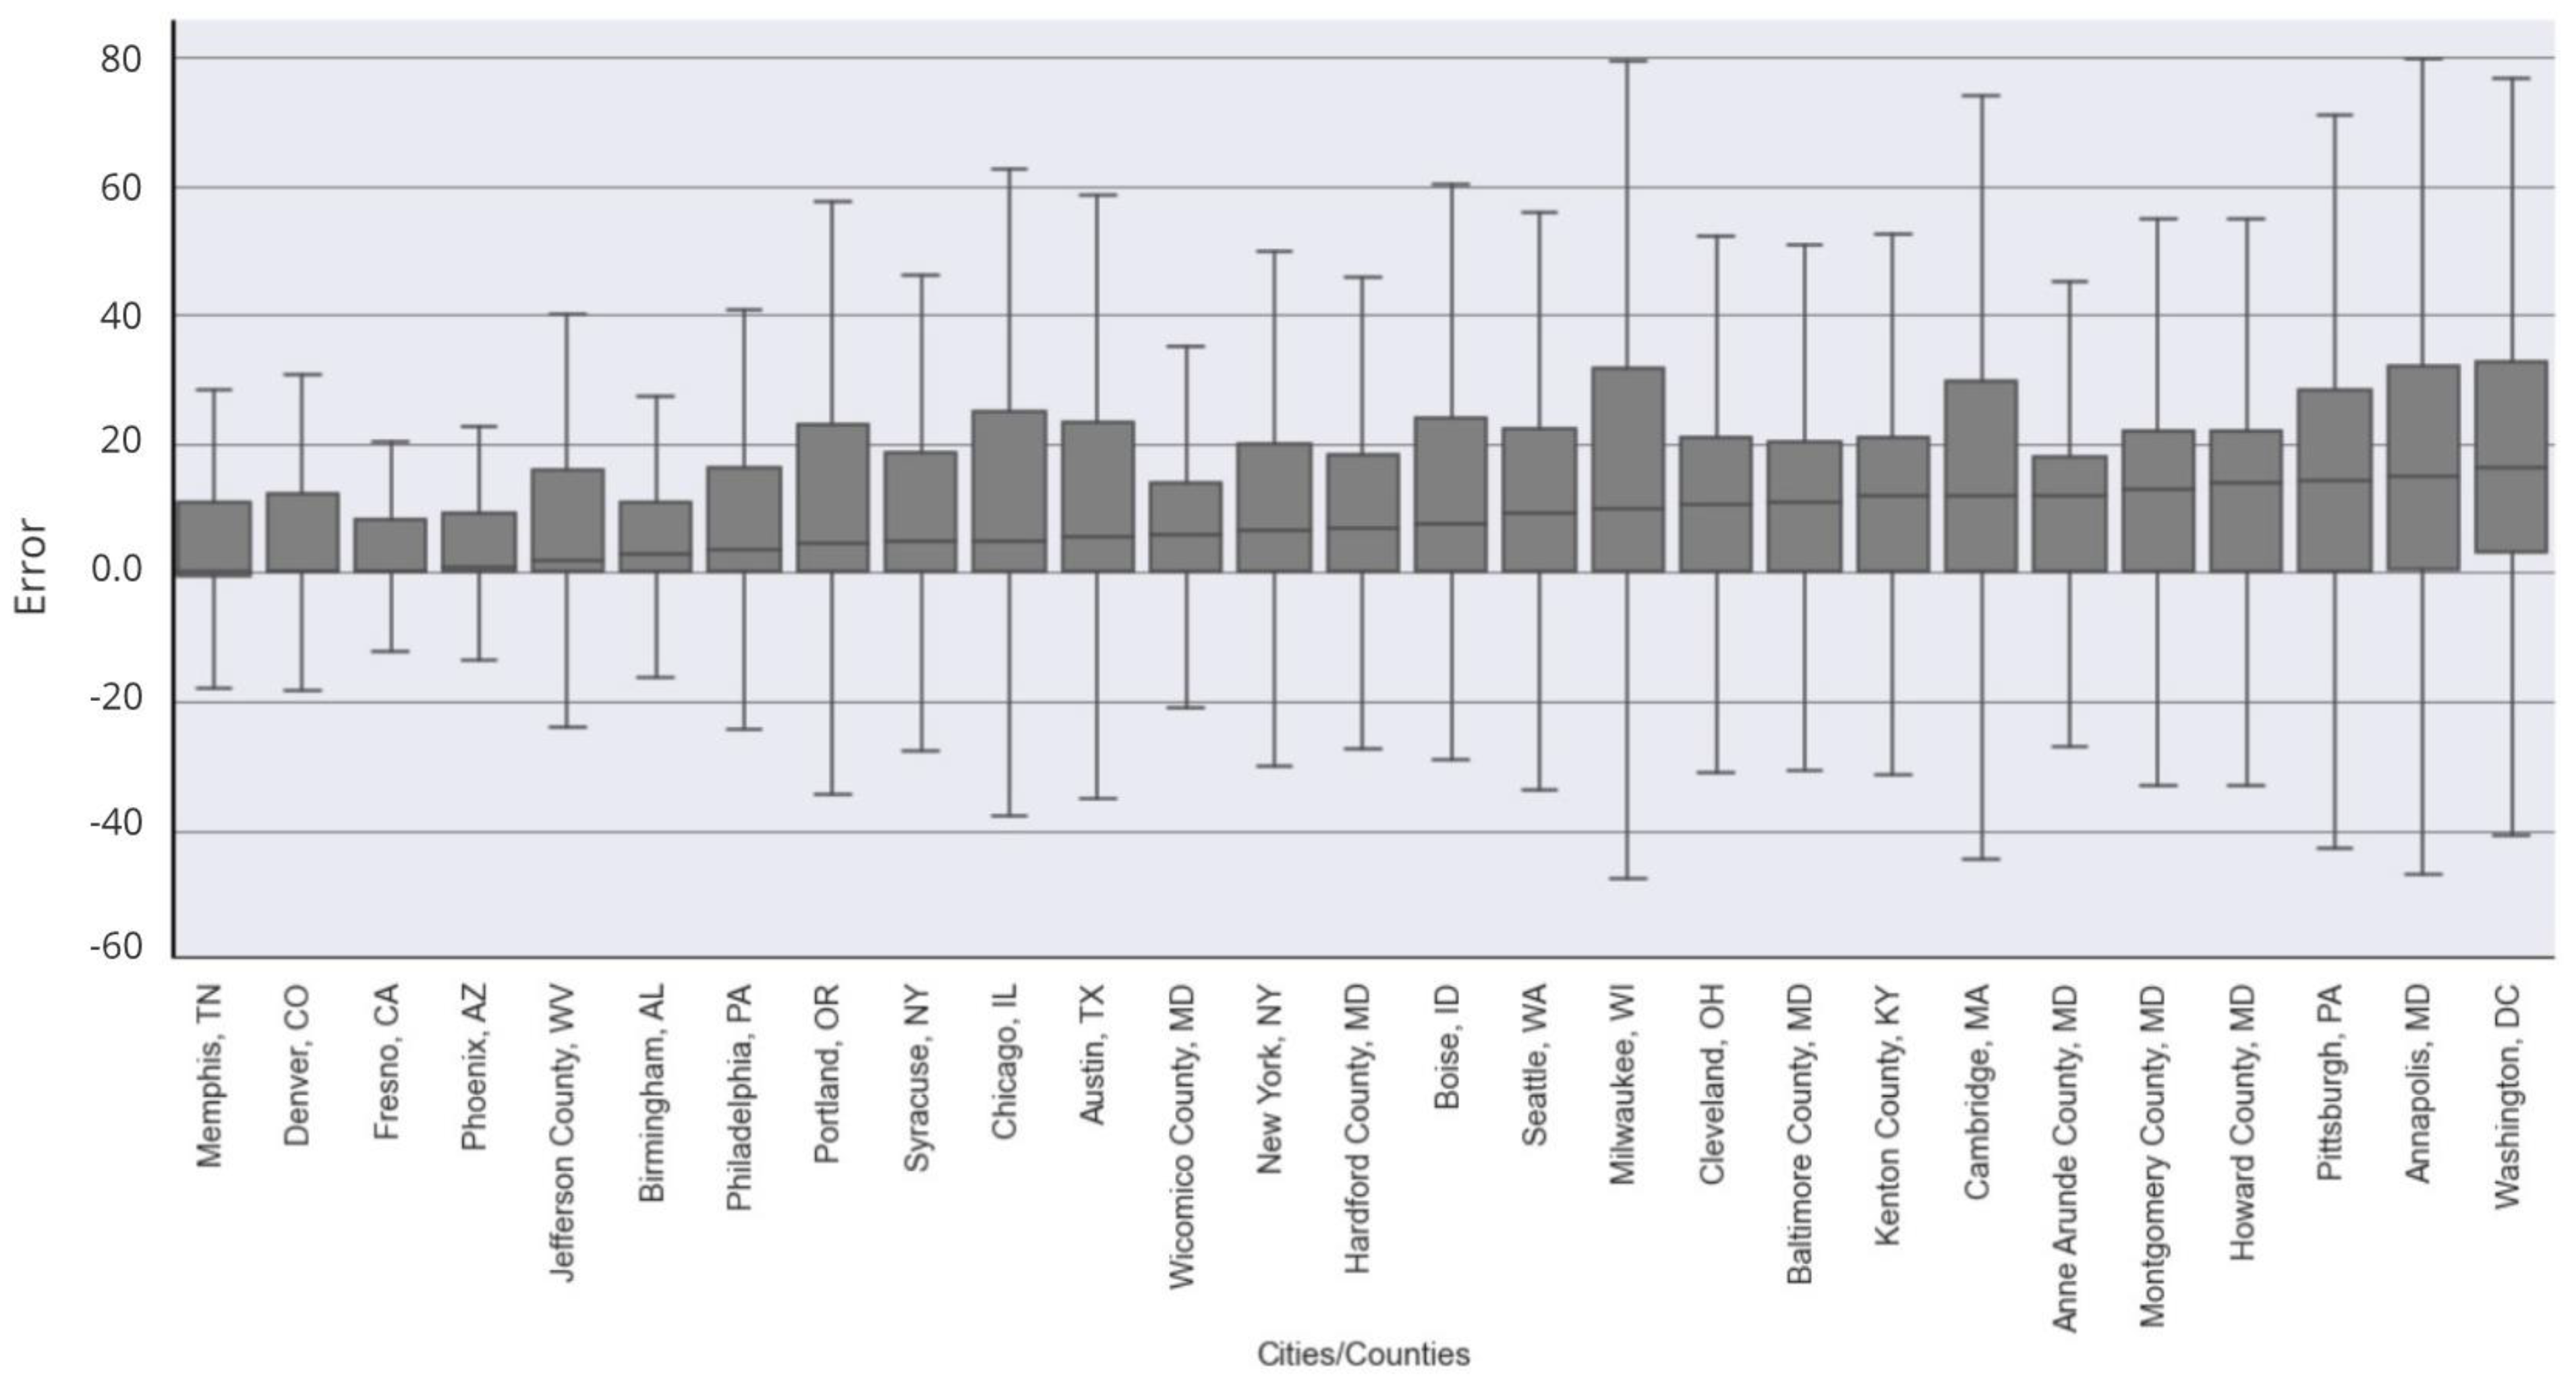
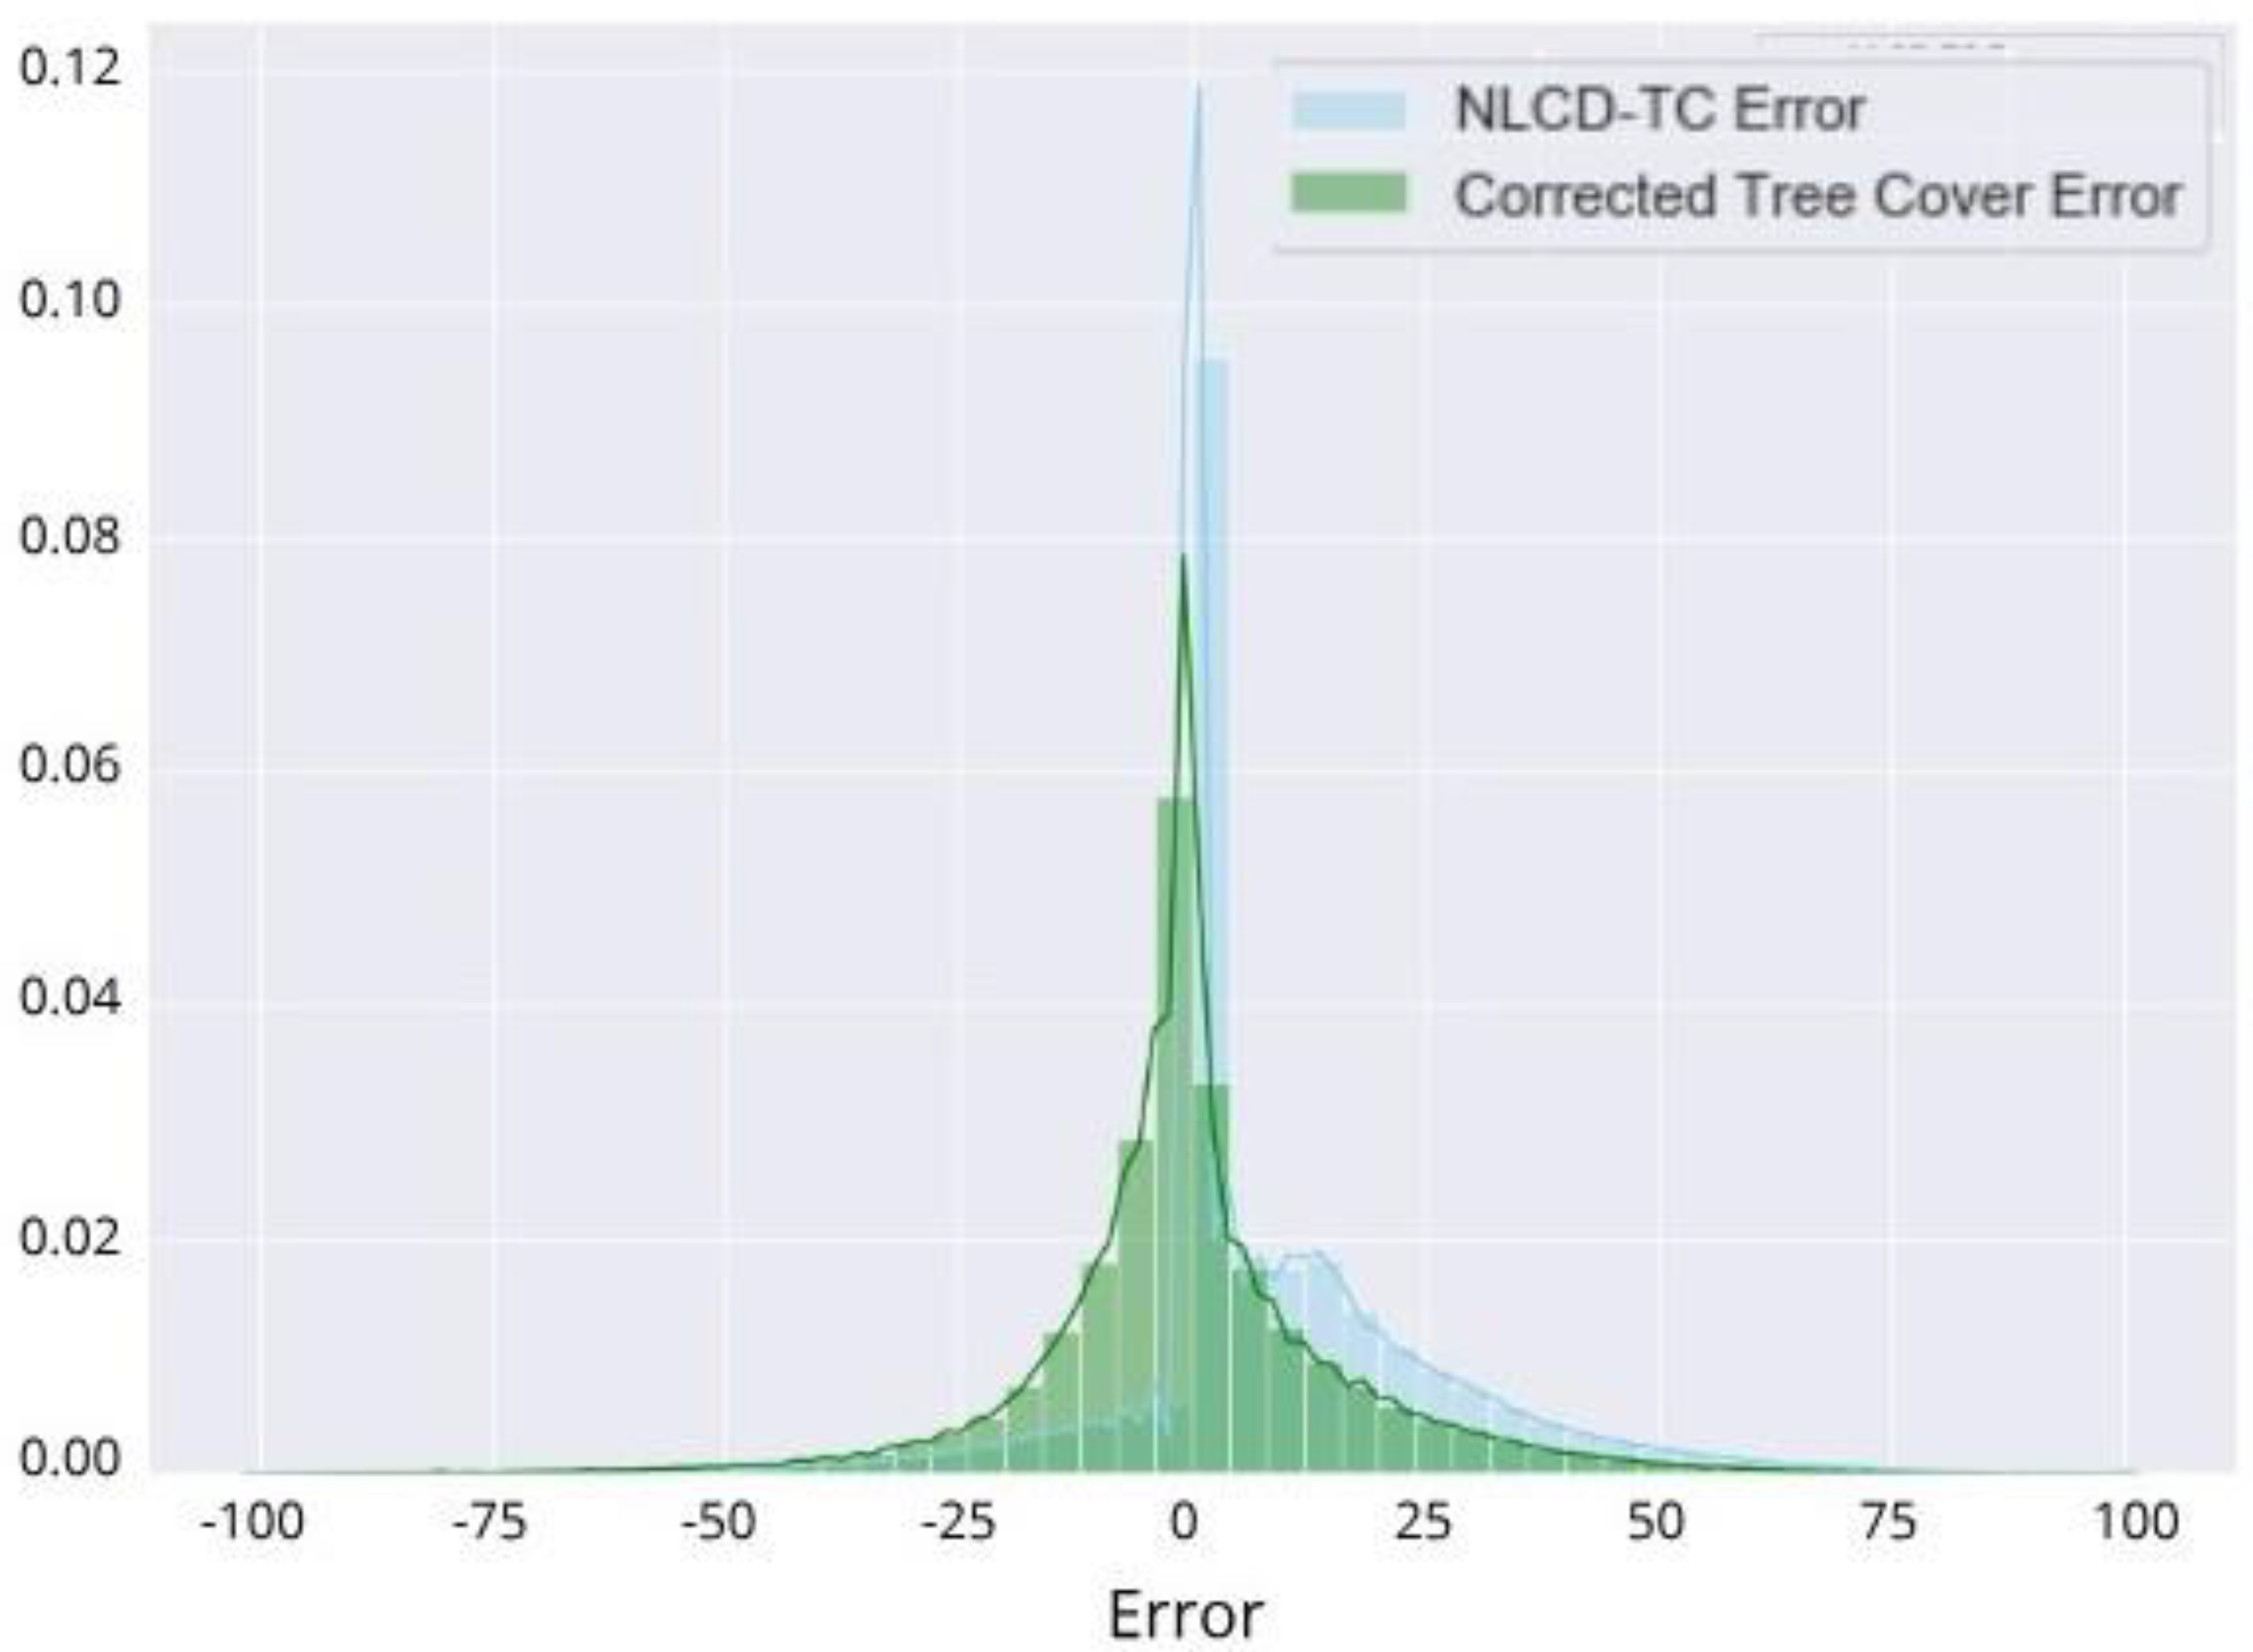
3.1. General Error Distribution

Our assessment for NLCD-TC 2011 compared to high-resolution derived TC data from 27 cities and counties shows a mean error of 9.9%, an absolute value of the error of 14.9%, and an RMSE of 23.3. The K–S test is 0.28, which reports the distance between the NLCD-TC distribution function and the high-resolution derived TC data distribution. The NLCD-TC 2011 tends to underestimate overall tree cover in cities (Figure 2). Across individual cities, overall error distribution patterns and differences in error vary (Figure 3 shows patterns for nine cities; additional cities are shown in the code repository). The common pattern in most cities is a greater underestimation than overestimation of tree cover on a grid cell basis (positive error values). This pattern is more extreme in cities such as Denver, Boise, and New York.

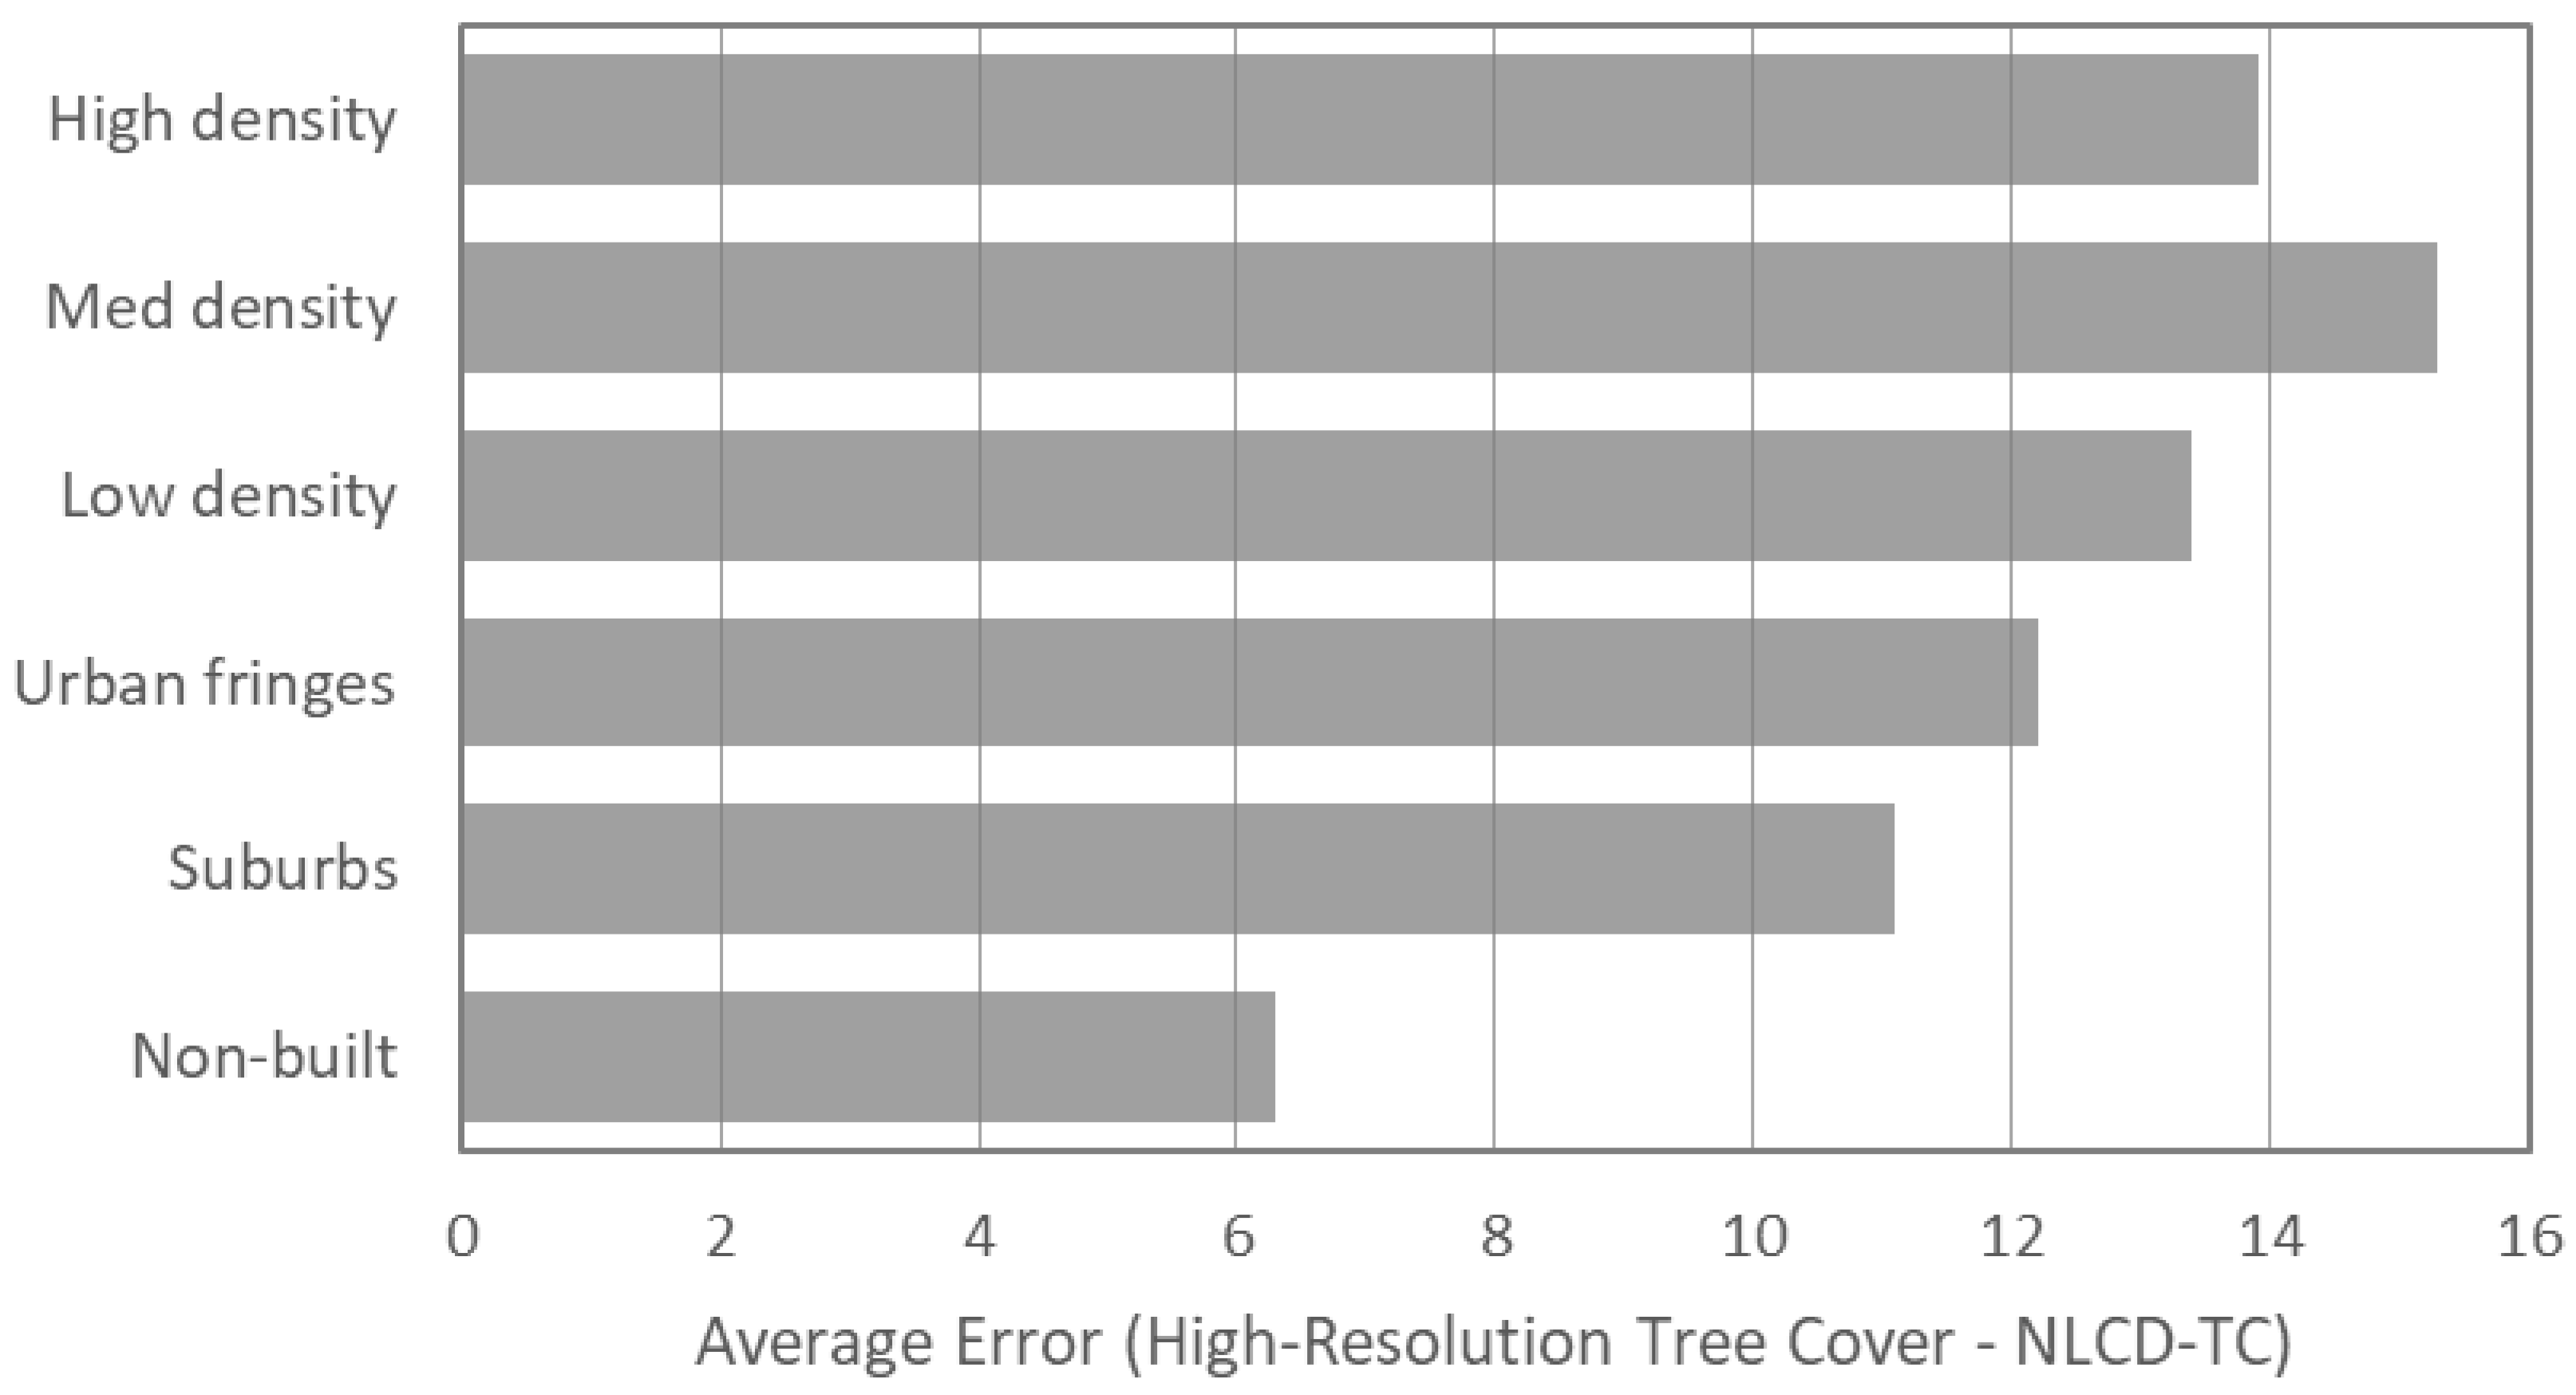
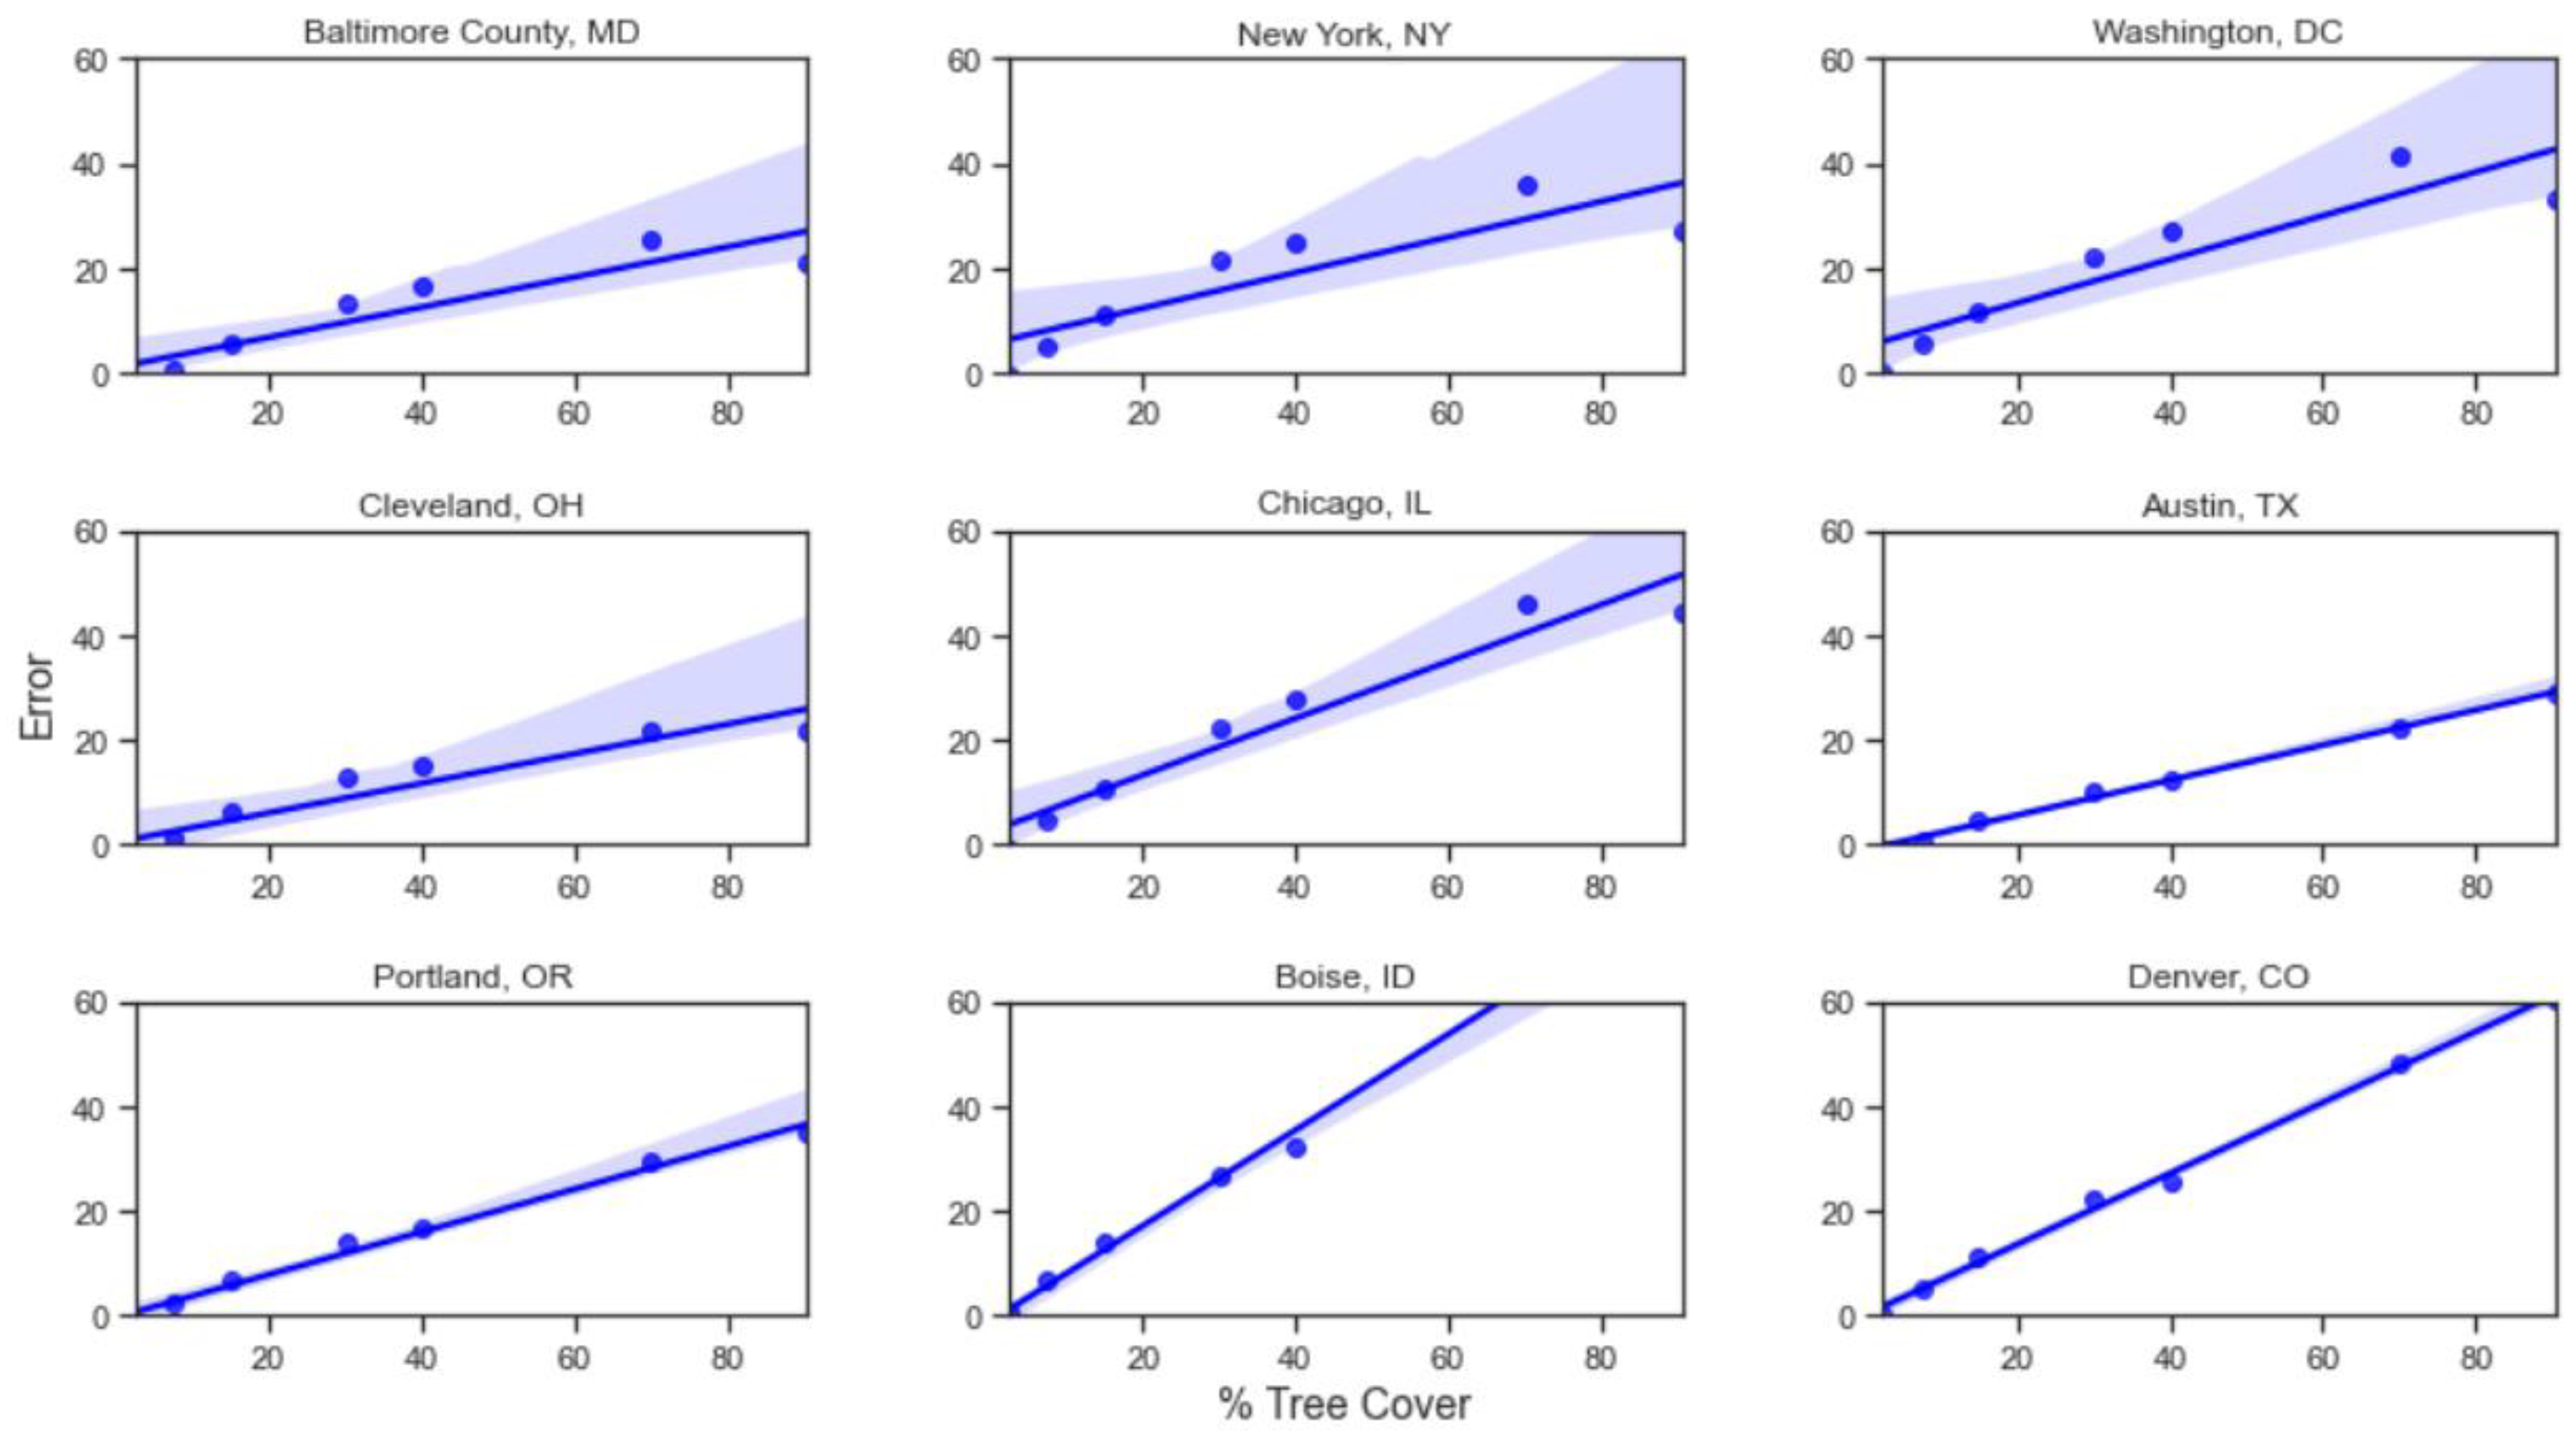
3.2. Error Distribution across Different Landscape Characteristics

Multidimensional error analysis provides insight into the uncertainty of the original data products and the choice of appropriate explanatory variables to build a predictive model to reduce the tree canopy error in cities. In this section, we assess how NLCD-TC 2011 accuracy varies across the following variables: (a) EPA ecoregions, (b) built versus undeveloped areas, (c) urban density, (d) tree cover gradients, (e) cities, (f) NDVI, (g) surface temperature, and (h) building footprint coverage.
(a) Error distribution across EPA ecoregions: Average error showed considerable differences across EPA ecoregions. Figure 4 shows the EPA Level II ecoregions of the US cities in warm deserts, Mediterranean, and Ozark/Ouachita-Appalachian forests regions (8-4, 10-2, and 11-1) have the lowest error while cold deserts and central plains (10-1, 8-1, and 8-2) have the largest error values.
(b) Error distribution across built versus undeveloped areas: Mean error is considerably higher in the built areas (11.8%) than undeveloped areas (6.4%). NLCD-TC 2011 underestimates tree cover consistently in built areas.
(c) Error distribution across urban density: Average NLCD-TC error also increases with urban density. The only exception to this pattern is that error in high-density areas is slightly less than in medium-density areas (Figure 5).
(d) Error distribution across tree cover gradients: In all cities, in cells with greater tree canopy cover, the average error is also larger (Figure 6). The slope of regression lines varies across cities. For instance, in Baltimore County, MD, and Austin, TX, the slopes are generally small, whereas, in Denver, CO, and Boise, ID, the slope is relatively large. These differences reflect the average tree canopy area in different cities and climates.
(e) Error distribution by cities/counties: NLCD-TC error varies considerably among cities/counties (Figure 7). In all cities but Memphis, TN, NLCD-TC underestimates tree cover. Washington, DC, has the largest average error (21%).
(f, g, h) Error distribution by NDVI, surface temperature, and building footprint gradients: For areas with higher surface temperatures, which typically have less tree canopy cover, NLCD-TC error is smaller (Figure 8a). Two clusters of error emerge relative to surface temperature—at lower temperatures (29–30 °C, with 15–18% error) and moderate (30–31 °C) temperatures centered around zero error. The second cluster likely indicates areas with understory vegetation and no tree cover. The NDVI scatterplot also shows an error cluster (approximately 15–20%) at higher NDVI levels (Figure 8b). This is most likely associated with the underestimation of tree cover. The building footprint coverage scatterplot shows a somewhat greater error in cells with less building coverage (Figure 8c). When building footprint area rises above 30%, the error is smaller. This indicates areas with more building coverage and less tree cover.

3.3. Predictive Model Performance

The R2 or performance score of the decision tree regression is 0.76 (Table 2). Besides NLCD-TC itself (by far the most important predictor), NLCD land cover, NDVI, and average precipitation are the strongest predictors. As expected, NLCD-TC itself is a very strong predictor; when we eliminated that, NDVI and NLCD land cover became strong predictors, yielding a model with an R2 of 0.68.
The predictive model improves the estimate of tree canopy cover relative to the native (uncorrected) NLCD-TC product (i.e., the red smoothed line, representing corrected NLCD-TC, is closer to the high-resolution green smoothed line than the native NLCD-TC blue smoothed line, Figure 9). The model predicts 0% canopy cover cells very effectively. It also improves the prediction of cells with 100% canopy cover compared to the native NLCD-TC. However, it still slightly underpredicts them relative to high-resolution derived TC tree canopy data, and it overestimates tree canopy cover at values of 1–20% and 90–99%. The corrected tree cover data have a better error distribution centered around zero (Figure 10). All metrics—mean error, mean absolute value of error, RMSE, and Kolmogorov–Smirnov test score—show that the predictive model has improved the accuracy of NLCD-TC in cities (Table 3).

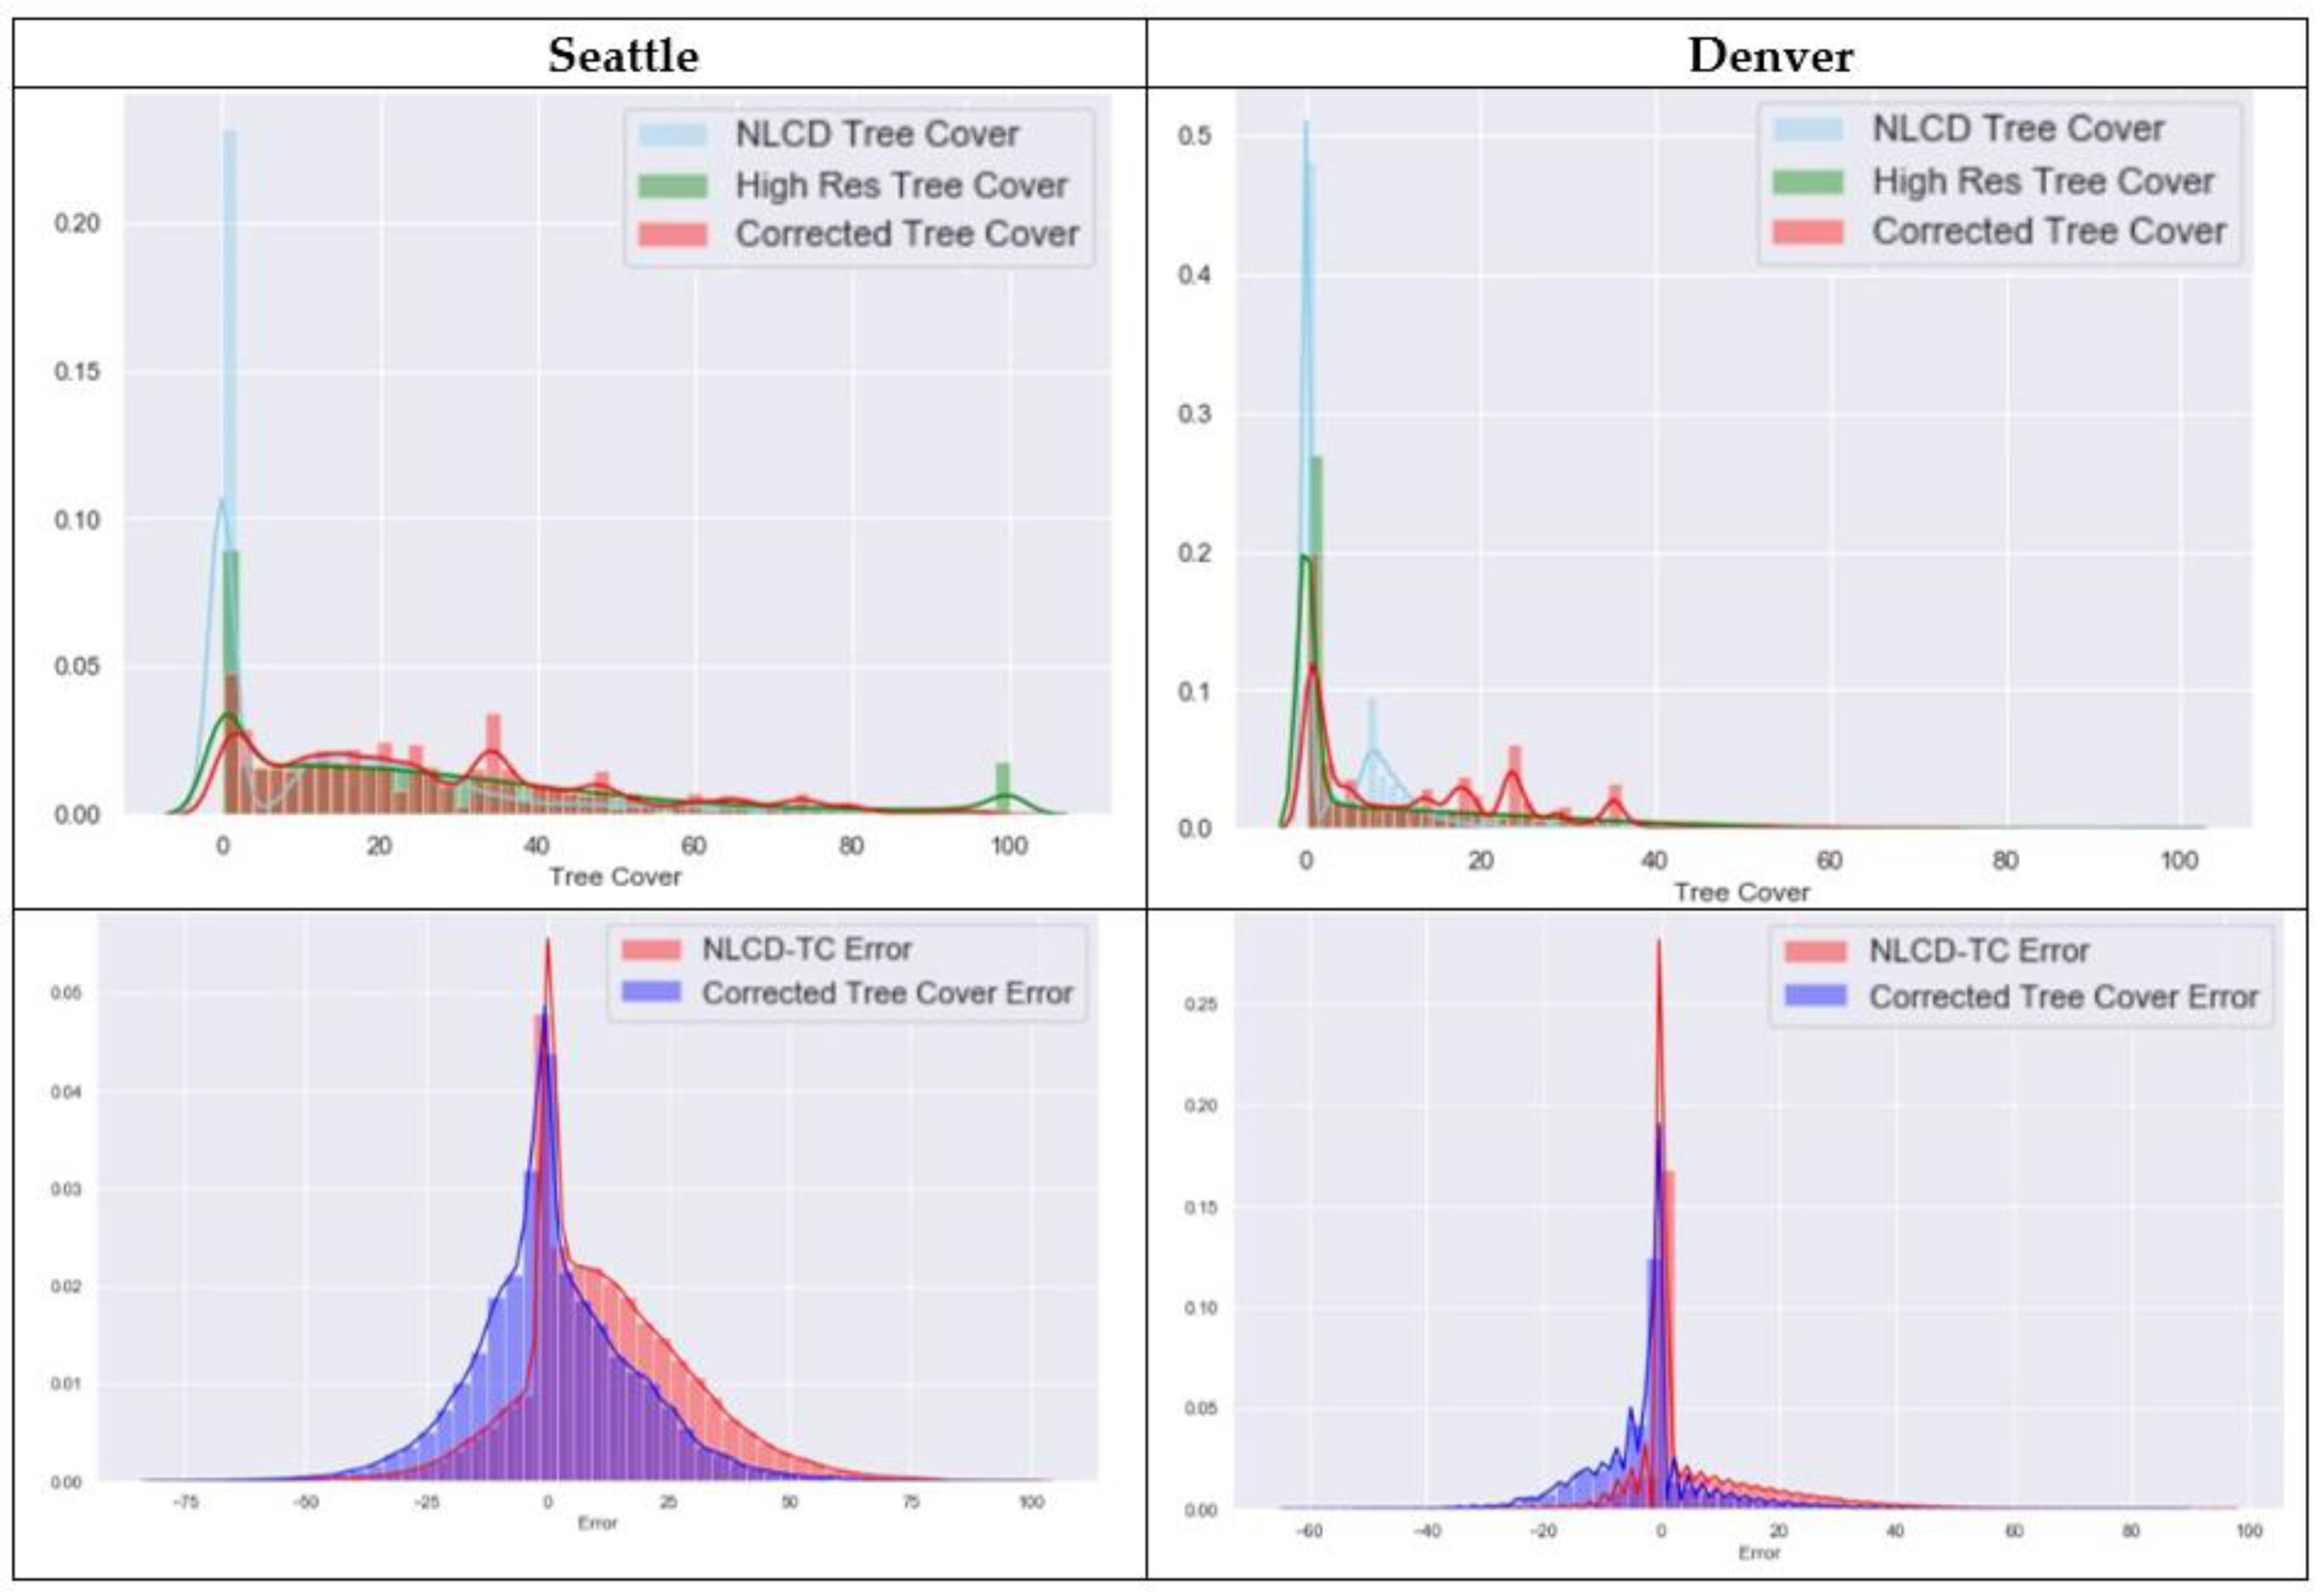
3.4. Validation of the Predictive Model in Denver, CO, and Seattle, WA, to Correct NLCD-TC Bias

To test the performance of a predictive NLCD-TC model in two cities in widely different EPA ecoregions (Denver in the South-Central Semiarid Prairies and Seattle in the Marine West Coast Forests), we used a model that excludes these two cities from its training dataset. The predictive model improves the accuracy of NLCD-TC in both cities substantially. It performs well in reducing the number of zero-cover grid cells where NLCD-TC underestimates tree cover considerably in both cities (Figure 11, top). The predictive model also produces an even distribution around zero (Figure 11, bottom). The average NLCD-TC error in Seattle is 11.9%, while that produced by the predictive model is 1.3%; these values for Denver are 5.3% and −1.5%, respectively. The predictive model, thus, improved the underestimation of NLCD-TC in both cities, though it still slightly overestimates tree cover in Denver and underestimates it in Seattle (both by <1.5%).

3.5. NLCD-TC Data Correction: Effects on Ecosystem Accounting Model Results

Denver and Seattle’s urban forests have different tree cover and patch configurations—with both figures being larger for Seattle. The average tree patch sizes for Denver and Seattle are 133 m2 and 193 m2, respectively. Mean citywide tree cover at 30 m resolution is 4.5% in Denver and 16.2% in Seattle. As reported above, our predictive model improves NLCD-TC in both cities. In Seattle, the predictive model increased citywide tree cover at 30 m cells from 16.2 to 27.2%. The predictive model also increased citywide tree cover estimates in Denver from 4.5 to 12.6% at the 30 m cell level.
Gains obtained from using corrected or high-resolution tree canopy cover inputs relative to native NLCD-TC are complex and depend on the model. In Denver, rainfall interception was estimated at 0.8 million, 2.1 million, and 17.2 million m3 of rainfall when native NLCD-TC, corrected NLCD-TC, and high-resolution tree canopy data were used, respectively (Table 4). By contrast, the heat mitigation model was less sensitive to tree canopy input data, with estimated energy savings at 47,937, 51,289, and 59,140 mWh using native, corrected, and high-resolution data, respectively. In both models for Denver, the corrected NLCD-TC produces estimates closer to the high-resolution ones. However, gains are relatively incremental and still substantially underestimate rainfall interception.
In contrast, using corrected NLCD-TC brings ecosystem service values for Seattle much closer to those generated using high-resolution data (Table 4). Rainfall interception for native NLCD-TC, corrected NLCD-TC, and high-resolution tree cover are 3.5, 5.4, and 6.0 million m3 water, respectively. In other words, in Seattle, the amount of rainfall interception increased from 58% of the total using native NLCD-TC to 89% using the corrected version (accuracy gains were smaller for Denver). Corresponding values for energy savings are 34,428, 40,280, and 51,335 mWh. When we stratified the results based on land cover type (as a proxy for ecosystem types), we can see for which cities, ecosystem services and ecosystem types, the correction has been most influential. Generally, the predictive model improved results over the native input tree cover data, though large gaps remained for a few ecosystem-ecosystem service types (e.g., energy savings in high-density developed areas of Seattle and overall results of the Denver rainfall interception model, Table 4). Overall, the corrected tree cover dataset is an important step forward in running more accurate ecosystem services and accounting models in urban areas, though more city-scale calibration data will be needed to assess model accuracy properly.

4. Discussion

As a nationwide dataset, NLCD-TC is the only available product for tracking urban tree cover throughout every city in the US. However, its relatively coarse resolution makes its accuracy and precision questionable in urban areas, especially where landscapes are heterogeneous and have a wide variety of cover types. This analysis sought to more systematically assess NLCD-TC error and possible error correction methods, in order to help establish the usability of NLCD-TC for urban forest analysis applications. While a series of papers evaluated errors associated with the first version of NLCD-TC (2001) dataset [16,17,25], we are unaware of similar analyses for the two more recent NLCD-TC datasets. Past studies (e.g., [16]) relied on a limited set of observations and called for more research into exploring the magnitude of uncertainty of NLCD-TC.
We leveraged the availability of newer validation datasets and analytical techniques to better understand tree canopy error in heterogeneous urban environments and evaluate approaches to its correction and use in urban modeling. Access to high-resolution data for multiple cities enabled us to train a decision tree algorithm on over 35 million sample points to more accurately estimate tree cover. We suggest that a machine learning algorithm can have two major benefits, by (1) improving the accuracy of the native dataset and (2) producing a better error distribution centered around zero across urban landscapes (i.e., with better geographic balance). Our study also shows the value of additional datasets (e.g., NDVI, climate, and building data) that can potentially be useful in generating more accurate future NLCD-TC layers.
We found that NLCD-TC 2011 error is not evenly distributed across different geographies, particularly in highly heterogeneous environments like cities where 30 m grid cells often encompass multiple land cover types. Stratifying the error across different characteristics, such as density gradients, built versus undeveloped land, and ecoregions showed that NLCD-TC tends to have a larger error (underestimation) in medium- and high-density urban areas. In other words, the error distribution is skewed to the right. The high frequency of zero error also is reasonable because NLCD-TC predicted so many cells correctly. This finding aligns with those of previous analyses [16,17,25] and also a recent study showing that NLCD impervious cover is typically overestimated in cities [41]. We suspect that this error could be due to (1) shadowing from buildings in urban areas that cause noise in the remotely sensed data; (2) more heterogeneous surfaces, which result in a larger error when remotely sensed data are used for detecting tree canopies; and (3) the fact that in cities, individual tree crowns are often isolated and small enough that they might not be detected in classification of 30 m resolution pixels. We also evaluated NLCD-TC data for 2016 and found the data to have similar error distribution and bias as the 2011 data, which we expected since they used the same production process.
Given current data availability, there is an opportunity to build more sophisticated models that incorporate urban heterogeneity to more accurately predict tree canopy cover in cities. High-resolution land cover data are a cost-effective way to produce an intensified sample at a spatial resolution capable of capturing the heterogeneity inherent in urban landscapes. By combining high-resolution land cover with diverse datasets in a decision tree model, we reduced the mean error from 8.1 to 0% and the mean absolute error from 13.5 to 10.6%, with an R2 value of 0.77. We found that climatic variables such as temperature and precipitation and built environment variables such as buildings and development density could improve the tree cover accuracy marginally but not considerably. Including such variables in future algorithms is recommended.
This accuracy assessment informs future studies about the usability of NLCD-TC data for ecosystem assessment models in urban contexts. NLCD-TC data might not be an appropriate input for a model that cannot tolerate a 10–15% underestimation of tree cover. In such cases, if high-resolution data are not available, our correction method may be helpful. In our application of native, corrected, and high-resolution tree canopy data to urban ecosystem accounting models, we found these models to be highly sensitive to the quality of urban tree canopy layers. Understanding the impact of tree canopy data quality on a given model can be complex since these models often use nonlinear relationships, and the relationship between the built environment and ecosystems is complex in cities [42]. For example, in our heat mitigation model, energy savings will be realized if trees are located close to buildings. If tree input data underestimate tree cover in cells with buildings, then the results would be substantially affected. In this case, the accuracy of values in cells without buildings would not matter. By contrast, the rainfall interception model quantifies interception by trees regardless of their location in a city; interception was underestimated more strongly in a city with a smaller and more dispersed canopy (Denver) than a larger and more connected one (Seattle). These points highlight the importance of understanding the spatial distribution of error.
Analyses relying on urban tree canopy data in cities should be aware of six points raised by our study. First, as we show in Section 3.2, error rates are higher in certain ecoregions, urban density, and cities than others. This makes efforts to correct tree canopy data more important in some places than others. Second, when evaluating tree cover in a region that includes developed and undeveloped land uses, error and uncertainty will be distributed unevenly across the landscape. Researchers should consider an average underestimation error of 5% in undeveloped areas and 11% in developed areas as a reasonable expectation when using the native (uncorrected) NLCD-TC products for urban and regional scale analysis. Third, since there is also a systematic error in NLCD impervious surface data [41], models that use both NLCD-TC and impervious data should be aware of the potentially interactive effects of the respective errors of these datasets. Fourth, while our predictive model removed bias in the data, the mean absolute error in urban areas improved modestly (from 13.5 to 10.6%), so high-resolution data will remain preferable when available. Fifth, if high-resolution data are available for a part but not all of a study area, it may be useful to use the high-resolution data to train an algorithm to correct NLCD-TC in the study area. Finally, urban models often benefit from being run at a higher resolution than 30 m [43,44], though this may not always be possible in large-scale comparative studies.
Machine learning algorithms offer the potential to improve the mapping of urban areas [45], including estimates of tree cover elsewhere in the world, particularly in heterogeneous environments like cities and in data-poor regions. Datasets derived from satellites like Landsat 8 and the Sentinel program can provide the basis for such studies. Adding other data for population or housing density or building footprints (now available for an increasing number of countries, including Australia, Austria, Canada, Germany, Tanzania, Uganda, and the U.K. [46,47,48]) could improve estimates of tree cover. Opportunities may, thus, exist to improve tree canopy cover estimates in cities for other parts of the world using methods similar to ours, improving on global [49] or continental-scale [50] tree canopy cover datasets. Now that more extensive climatic (e.g., temperature and precipitation), socio-economic (e.g., housing density), and built environment data are available, machine learning algorithms such as random forests can be used to combine such data to build localized models. Such corrected datasets may provide a more accurate view of urban processes that depend on tree canopy cover data as key model input, including urban climate, climate resiliency, and air and water quality. Our work shows how understanding the error distribution of tree canopy cover data and applying methods to improve its accuracy can improve urban ecosystem accounting models, with examples for multiple US cities and model types.
The most notable limitation of our study was that the city-level, high-resolution land cover datasets that we used for validation were not evenly distributed across the US, nor were they all available for the same year. A greater number of our samples were located in the East, particularly in the mid-Atlantic region. Our evaluation would be more complete if we had access to high-resolution data for more major cities in the Plains, Intermountain West, and Pacific Coast regions. We believe our model could be improved using cities more fully representative of diverse climatic regions, particularly with more examples from hotter and drier regions. High-resolution land cover data for some cities come from different years than 2011 (Table 1). Given the need to incorporate data from cities spanning as large a gradient as possible of climate/ecological zones as well as city size and age, and because time series of high-resolution data do not frequently exist for cities, we included data for a range of years. For 63% of our cities, that range is ±1 year from 2011, for 78% of cities the range is ±3 years from 2011, and for 96% of cities the range is ±4 years from 2011. Though this may produce some error, annual tree cover change in cities is often small, averaging 1% nationally over a five-year period though occasionally being as high as 0.9% [51] to 2% [52] per year. Future work could also evaluate uncertainty datasets that are produced alongside the NLCD-TC data.

5. Conclusions

In the absence of a nationwide dataset to characterize urban forests, the NLCD urban tree canopy layer is often used by default to map urban trees where no alternative high-resolution data exist or in cases where multi-city, regional, or national comparisons are needed. Our analysis sought to assess the accuracy of NLCD-TC in urban contexts and whether it can be improved through a multivariate modeling approach. Through validation using high-resolution land cover datasets, our study shows how the error of the US NLCD-TC 2011 is distributed in heterogeneous urban environments. This work and our subsequent predictive model can be useful in improving tree canopy cover estimates to track changes over time in urban tree canopies and associated ecosystem services in the absence of high-resolution data. This may be particularly useful in cities lacking the resources for periodic monitoring, whether small cities in developed nations like the US, or in the developing world, where approaches analogous to ours could be developed and applied.

Author Contributions

Conceptualization, M.P.H., K.J.B. and A.R.T.; methodology, M.P.H.; software, M.P.H.; validation, M.P.H. and K.J.B.; formal analysis, M.P.H.; investigation, M.P.H., K.J.B., A.R.T. and J.P.M.O.-D.; resources, A.R.T. and K.J.B.; data curation, J.P.M.O.-D.; writing—original draft preparation, M.P.H. and K.J.B.; writing—review and editing, K.J.B., A.R.T. and J.P.M.O.-D.; visualization, M.P.H.; supervision, K.J.B. and A.R.T.; project administration, A.R.T.; funding acquisition, A.R.T. and K.J.B. All authors have read and agreed to the published version of the manuscript.

Funding

We acknowledge the support of the NASA Biodiversity and Ecological Forecasting Program (grant no. 80NSSC18K0341) for Heris’ time. Support for Bagstad’s time was provided by the US Geological Survey Land Change Science Program. Any use of trade, firm, or product names is for descriptive purposes only and does not imply endorsement by the US Government.

Data Availability Statement

The code repository for regenerating the results is here: https://github.com/mehdiheris/NLCD_Assessment (accessed on 1 November 2021).

Acknowledgments

We acknowledge the support of the NASA Biodiversity and Ecological Forecasting Program and US Geological Survey Land Change Science Program.

Conflicts of Interest

The authors declare no conflict of interest.

References

  1. Multi-Resolution Land Characteristics (MRLC) Consortium|Multi-Resolution Land Characteristics (MRLC) Consortium. Available online: https://www.mrlc.gov/ (accessed on 15 January 2018).
  2. Wickham, J.D.; Stehman, S.V.; Gass, L.; Dewitz, J.; Fry, J.a.; Wade, T.G. Accuracy Assessment of NLCD 2006 Land Cover and Impervious Surface. Remote Sens. Environ. 2013, 130, 294–304. [Google Scholar] [CrossRef]
  3. Zhou, W.; Qian, Y.; Li, X.; Li, W.; Han, L. Relationships between Land Cover and the Surface Urban Heat Island: Seasonal Variability and Effects of Spatial and Thematic Resolution of Land Cover Data on Predicting Land Surface Temperatures. Landsc. Ecol. 2014, 29, 153–167. [Google Scholar] [CrossRef]
  4. Zhou, W.; Troy, A. Development of an Object-Based Framework for Classifying and Inventorying Human-Dominated Forest Ecosystems. Int. J. Remote Sens. 2009, 30, 6343–6360. [Google Scholar] [CrossRef]
  5. Wang, J.; Endreny, T.A.; Nowak, D.J. Mechanistic Simulation of Tree Effects in an Urban Water Balance Model 1. J. Am. Water Resour. Assoc. 2008, 44, 75–85. [Google Scholar] [CrossRef]
  6. Reistetter, J.A.; Russell, M. High-Resolution Land Cover Datasets, Composite Curve Numbers, and Storm Water Retention in the Tampa Bay, FL Region. Appl. Geogr. 2011, 31, 740–747. [Google Scholar] [CrossRef]
  7. Nowak, D.; Heisler, G.M. Air Quality Effects of Urban Trees and Parks. Natl. Recreat. Park Assoc. Res. Ser. 2010, 1–44. Available online: https://www.fs.usda.gov/treesearch/pubs/52881 (accessed on 29 November 2021).
  8. Kovacs, K.F.; Haight, R.G.; McCullough, D.G.; Mercader, R.J.; Siegert, N.W.; Liebhold, A.M. Cost of Potential Emerald Ash Borer Damage in U.S. Communities, 2009–2019. Ecol. Econ. 2010, 69, 569–578. [Google Scholar] [CrossRef]
  9. Zheng, D.; Ducey, M.J.; Heath, L.S. Assessing Net Carbon Sequestration on Urban and Community Forests of Northern New England, USA. Urban For. Urban Green. 2013, 12, 61–68. [Google Scholar] [CrossRef]
  10. Nowak, D.J.; Appleton, N.; Ellis, A.; Greenfield, E. Residential Building Energy Conservation and Avoided Power Plant Emissions by Urban and Community Trees in the United States. Urban For. Urban Green. 2017, 21, 158–165. [Google Scholar] [CrossRef] [Green Version]
  11. McRoberts, R.E.; Liknes, G.C.; Domke, G.M. Using a Remote Sensing-Based, Percent Tree Cover Map to Enhance Forest Inventory Estimation. For. Ecol. Manag. 2014, 331, 12–18. [Google Scholar] [CrossRef]
  12. Nowak, D.J.; Greenfield, E.J. Tree and Impervious Cover in the United States. Landsc. Urban Plan. 2012, 107, 21–30. [Google Scholar] [CrossRef] [Green Version]
  13. Boyd, J.W.; Bagstad, K.J.; Ingram, J.C.; Shapiro, C.D.; Adkins, J.E.; Casey, C.F.; Duke, C.S.; Glynn, P.D.; Goldman, E.; Grasso, M.; et al. The Natural Capital Accounting Opportunity: Let’s Really Do the Numbers. BioScience 2018, 68, 940–943. [Google Scholar] [CrossRef]
  14. Heris, M.; Bagstad, K.J.; Rhodes, C.; Troy, A.; Middel, A.; Hopkins, K.G.; Matuszak, J. Piloting Urban Ecosystem Accounting for the United States. Ecosyst. Serv. 2021, 48, 101226. [Google Scholar] [CrossRef]
  15. City of New York, Land Cover Raster Data (2017)–6in Resolution|NYC Open Data 2018; Accessed in May 2019. Available online: https://data.cityofnewyork.us/Environment/Land-Cover-Raster-Data-2017-6in-Resolution/he6d-2qns (accessed on 29 November 2021).
  16. Greenfield, E.J.; Nowak, D.J.; Walton, J.T. Assessment of 2001 NLCD Percent Tree and Impervious Cover Estimates. Photogramm. Eng. Remote Sens. 2009, 75, 1279–1286. [Google Scholar] [CrossRef]
  17. Nowak, D.J.; Greenfield, E.J. Evaluating The National Land Cover Database Tree Canopy and Impervious Cover Estimates Across the Conterminous United States: A Comparison with Photo-Interpreted Estimates. Environ. Manag. 2010, 46, 378–390. [Google Scholar] [CrossRef] [PubMed] [Green Version]
  18. Sander, H.; Polasky, S.; Haight, R.G. The Value of Urban Tree Cover: A Hedonic Property Price Model in Ramsey and Dakota Counties, Minnesota, USA. Ecol. Econ. 2010, 69, 1646–1656. [Google Scholar] [CrossRef]
  19. Landry, S.M.; Koeser, A.K.; Northrop, R.J.; McLean, D.; Donovan, G.; Andreu, M.G.; Hilbert, D. City of Tampa Tree Canopy and Urban Forest Analysis 2016. 2018. Available online: https://waterinstitute.usf.edu/upload/documents/TampaUEA2016_FinalReport-lowres.pdf (accessed on 29 November 2021).
  20. Warnell, K.J.D.; Russell, M.; Rhodes, C.; Bagstad, K.J.; Olander, L.P.; Nowak, D.J.; Poudel, R.; Glynn, P.D.; Hass, J.L.; Hirabayashi, S.; et al. Testing Ecosystem Accounting in the United States: A Case Study for the Southeast. Ecosyst. Serv. 2020, 43, 101099. [Google Scholar] [CrossRef]
  21. Huang, C.; Yang, L.; Wylie, B.; Homer, C. A Strategy for Estimating Tree Canopy Density Using Landsat 7 ETM and High Resolution Images Over Large Areas. In Proceedings of the Third International Conference on Geospatial Information in Agriculture and Forestry, Denver, Colorado, 5–7 November 2001. [Google Scholar]
  22. Coulston, J.W.; Moisen, G.G.; Wilson, B.T.; Finco, M.V.; Cohen, W.B.; Brewer, C.K. Modeling Percent Tree Canopy Cover: A Pilot Study. Photogramm. Eng. Remote Sens. 2012, 78, 715–727. [Google Scholar] [CrossRef] [Green Version]
  23. Homer, C.; Dewitz, J.; Yang, L.; Jin, S.; Danielson, P.; Coulston, J.; Herold, N.; Wickham, J.; Megown, K. Completion of the 2011 National Land Cover Database for the Conterminous United States–Representing a Decade of Land Cover Change Information. Photogramm. Eng. 2015, 81, 345–354. [Google Scholar]
  24. Yang, L.; Jin, S.; Danielson, P.; Homer, C.; Gass, L.; Bender, S.M.; Case, A.; Costello, C.; Dewitz, J.; Fry, J.; et al. A New Generation of the United States National Land Cover Database: Requirements, Research Priorities, Design, and Implementation Strategies. ISPRS J. Photogramm. Remote Sens. 2018, 146, 108–123. [Google Scholar] [CrossRef]
  25. Homer, C.; Huang, C.; Yang, L.; Wylie, B.; Coan, M. Development of a 2001 National Land-Cover Database for the United States. Photogramm. Eng. Remote Sens. 2004, 70, 829–840. [Google Scholar] [CrossRef] [Green Version]
  26. U.S. EPA EnviroAtlas. Available online: https://www.epa.gov/enviroatlas (accessed on 15 February 2019).
  27. O’Neil-Dunne, J.P.M.; MacFaden, S.W.; Royar, A.R.; Pelletier, K.C. An Object-Based System for LiDAR Data Fusion and Feature Extraction. Geocarto Int. 2013, 28, 227–242. [Google Scholar] [CrossRef]
  28. US EPA Ecoregions. Available online: https://www.epa.gov/eco-research/ecoregions (accessed on 6 May 2019).
  29. Buyantuyev, A.; Wu, J. Urban Heat Islands and Landscape Heterogeneity: Linking Spatiotemporal Variations in Surface Temperatures to Land-Cover and Socioeconomic Patterns. Landsc. Ecol. 2010, 25, 17–33. [Google Scholar] [CrossRef]
  30. Rosenfeld, A.H.; Akbari, H.; Bretz, S.; Fishman, B.L.; Kurn, D.M.; Sailor, D.; Taha, H. Mitigation of Urban Heat Islands: Materials, Utility Programs, Updates. Energy Build. 1995, 22, 255–265. [Google Scholar] [CrossRef]
  31. U.S. Geological Survey. Landsat 8 (L8) Data Users Handbook: Version 4 2019; US Geological Survey: Sioux Falls, SD, USA, 2019.
  32. Microsoft. US Building Footprints; Microsoft: Redmond, WA, USA, 2018. [Google Scholar]
  33. Heris, M.P.; Foks, N.; Bagstad, K.J.; Troy, A. A National Dataset of Rasterized Building Footprints for the U.S; US Geological Survey: Reston, VI, USA, 2020. [CrossRef]
  34. Heris, M.P. Evaluating Metropolitan Spatial Development: A Method for Identifying Settlement Types and Depicting Growth Patterns. Reg. Stud. Reg. Sci. 2017, 4, 7–25. [Google Scholar] [CrossRef] [Green Version]
  35. Your Weather Service U.S. Climate Data (1990–2018). Available online: https://www.usclimatedata.com (accessed on 11 February 2019).
  36. Manson, S.; Schroeder, J.; Van Riper, D.; Ruggles, S. National Historical Geographic Information System: Version 14.0; IPUMS: Minneapolis, MN, USA, 2019. [Google Scholar] [CrossRef]
  37. Troy, A.R.; Grove, J.M.; O’Neil-Dunne, J.P.; Pickett, S.T.; Cadenasso, M.L. Predicting Opportunities for Greening and Patterns of Vegetation on Private Urban Lands. Environ. Manag. 2007, 40, 394–412. [Google Scholar] [CrossRef]
  38. Pedregosa, F.; Varoquaux, G.; Gramfort, A.; Michel, V.; Thirion, B.; Grisel, O.; Blondel, M.; Prettenhofer, P.; Weiss, R.; Dubourg, V. Scikit-Learn: Machine Learning in Python. J. Mach. Learn. Res. 2011, 12, 2825–2830. [Google Scholar]
  39. United Nations Department of Economic and Social Affairs Statistics Division. System of Environmental-Economic Accounting-Ecosystem Accounting: Final Draft; United Nations: New York, NY, USA, 2021. [Google Scholar]
  40. Heris, M.P. Accuracy Assessment of National Land Cover Dataset Tree Cover Code. Available online: https://github.com/mehdiheris/NLCD_Assessment (accessed on 29 November 2021).
  41. Wickham, J.; Stehman, S.V.; Neale, A.C.; Mehaffey, M. Accuracy Assessment of NLCD 2011 Percent Impervious Cover for Selected USA Metropolitan Areas. Int. J. Appl. Earth Obs. Geoinf. 2020, 84, 101955. [Google Scholar] [CrossRef]
  42. Keeler, B.L.; Hamel, P.; McPhearson, T.; Hamann, M.H.; Donahue, M.L.; Meza Prado, K.A.; Arkema, K.K.; Bratman, G.N.; Brauman, K.A.; Finlay, J.C.; et al. Social-Ecological and Technological Factors Moderate the Value of Urban Nature. Nat. Sustain. 2019, 2, 29–38. [Google Scholar] [CrossRef]
  43. Grafius, D.R.; Corstanje, R.; Warren, P.H.; Evans, K.L.; Hancock, S.; Harris, J.A. The Impact of Land Use/Land Cover Scale on Modelling Urban Ecosystem Services. Landsc. Ecol. 2016, 31, 1509–1522. [Google Scholar] [CrossRef] [Green Version]
  44. Rioux, J.-F.; Cimon-Morin, J.; Pellerin, S.; Alard, D.; Poulin, M. How Land Cover Spatial Resolution Affects Mapping of Urban Ecosystem Service Flows. Front. Environ. Sci. 2019, 7, 93. [Google Scholar] [CrossRef]
  45. Kerins, P.; Guzder-Williams, B.; Mackres, E.; Rashid, T.; Pietraszkiewicz, E. Mapping Urban Land Use in India and Mexico Using Remote Sensing and Machine Learning; World Resources Institute: Washington, DC, USA, 2021. [Google Scholar]
  46. Haberl, H.; Wiedenhofer, D.; Schug, F.; Frantz, D.; Virág, D.; Plutzar, C.; Gruhler, K.; Lederer, J.; Schiller, G.; Fishman, T.; et al. High-Resolution Maps of Material Stocks in Buildings and Infrastructures in Austria and Germany. Environ. Sci. Technol. 2021, 55, 3368–3379. [Google Scholar] [CrossRef]
  47. Jochem, W.C.; Tatem, A.J. Tools for Mapping Multi-Scale Settlement Patterns of Building Footprints: An Introduction to the R Package Foot. PLoS ONE 2021, 16, e0247535. [Google Scholar] [CrossRef] [PubMed]
  48. Microsoft Building Footprints. Available online: https://github.com/microsoft?q=building+footprints&type=&language= (accessed on 7 March 2021).
  49. Hansen, M.C.; Potapov, P.V.; Moore, R.; Hancher, M.; Turubanova, S.A.; Tyukavina, A.; Thau, D.; Stehman, S.V.; Goetz, S.J.; Loveland, T.R.; et al. High-Resolution Global Maps of 21st-Century Forest Cover Change. Science 2013, 342, 850–853. [Google Scholar] [CrossRef] [PubMed] [Green Version]
  50. European Environment Agency. Copernicus Land Monitoring Service-High Resolution Layer Forest Product Specifications Document; Copernicus Team at EEA: Copenhagen, Denmark, 2017; p. 39.
  51. Nowak, D.J.; Greenfield, E.J. Declining Urban and Community Tree Cover in the United States. Urban For. Urban Green. 2018, 32, 32–55. [Google Scholar] [CrossRef]
  52. Treglia, M.L.; Acosta-Morel, M.; Crabtree, D.; Galbo, K.; Lin-Moges, T.; Van Slooten, A.; Maxwell, E.N. The State of the Urban Forest in New York City; Zenodo: New York City, NY, USA, 2021. [Google Scholar]
Figure 1. Model performance for incremental sample sizes (sample of cells drawn for running the predictive model).
Remotesensing 14 01219 g001
Figure 2. Error (deviation by % when compared to high-resolution derived data) distribution of National Land Cover Database-Tree Canopy 2011 data in all cities.
Remotesensing 14 01219 g002
Figure 3. Error (deviation by % when compared to high-resolution derived data) distribution of National Land Cover Database-Tree Canopy 2011 data in selected cities.
Remotesensing 14 01219 g003
Figure 4. Selected Environmental Protection Agency Level II ecoregions [28] and average National Land Cover Database-Tree Canopy error (deviation by % when compared to high-resolution derived data) by EPA Level II ecoregions.
Remotesensing 14 01219 g004
Figure 5. Average National Land Cover Database-Tree Canopy error (deviation by % when compared to high-resolution derived data) by urban density.
Remotesensing 14 01219 g005
Figure 6. Variations in error (deviation by % when compared to high-resolution derived data) by percent tree cover by city/county. Blue dots show the average of error in each range ([0,5], [5,10], [10,20], [20,40], [20,60], [60,80], [80,100]) and the blue line is the regression line; the shaded area shows the confidence intervals of slopes and intercepts.
Remotesensing 14 01219 g006
Figure 7. National Land Cover Database-Tree Canopy error (deviation by % when compared to high-resolution derived data) by cities/counties.
Remotesensing 14 01219 g007
Figure 8. Distribution of error (deviation by % when compared to high-resolution derived data) across all cities by (a) surface temperature, (b) Normalized Difference Vegetation Index, and (c) building footprint coverage gradients.
Remotesensing 14 01219 g008
Figure 9. Comparison of National Land Cover Database-Tree Cover, predicted tree cover, and high-resolution derived TC tree cover histograms; the smoothed lines show the normal density line; the Y axis shows the percentage of data counts.
Remotesensing 14 01219 g009
Figure 10. Comparison of National Land Cover Database-Tree Canopy (NLCD-TC) and corrected tree cover error (deviation by % when compared to high-resolution derived data) distribution; the smoothed lines are the normal density lines.
Remotesensing 14 01219 g010
Figure 11. Distribution of tree cover (top) and error (deviation by % when compared to high-resolution derived data) (bottom) for National Land Cover Database-Tree Canopy (NLCD-TC), high-resolution, and corrected tree cover data in Seattle, WA, and Denver, CO; the smoothed lines are the normal density lines.
Remotesensing 14 01219 g011
Table 1. Cities with high-resolution (1 m) land cover by US Environmental Protection Agency Level II Ecoregion [28]. City/county data are sourced from either the ● US Environmental Protection Agency EnviroAtlas [26] or * the University of Vermont [27].
Level II Ecoregion CodeLevel II EcoregionCity/CountyYear
7.1Marine West Coast Forest● Portland, OR2010
8.1Mixed Wood Plains* Cambridge, MA2016
* Cleveland, OH2011
* New York, NY2011
* Syracuse, NY2010
8.2Central USA Plains* Chicago, IL2010
● Milwaukee, WI2010
8.3Southeastern USA Plains* Annapolis, MD2007
* Anne Arundel County, MD2007
* Baltimore County, MD2007
* Harford County, MD2011
* Howard County, MD2007
* Kenton County, KY2012
● Memphis, TN2010
* Montgomery County, MD2014
* Prince George County, MD2014
* Philadelphia, PA2009
* Washington, DC2011
8.4Ozark/Ouachita-Appalachian Forests● Birmingham, AL2011
* Jefferson County, WV2011
* Pittsburgh, PA2015
8.5Mississippi Alluvial and Southeast USA Coastal Plains* Wicomico County, MD2011
9.4South Central Semiarid Prairies● Austin, TX2010
* Denver, CO2014
10.1Cold Deserts● Boise, ID2010
10.2Warm Deserts● Phoenix, AZ2010
11.1Mediterranean California● Fresno, CA2010
Table 2. Decision tree model outcomes (the importance/coefficient of explanatory variables).
Model ParametersRegression Results
Model with NLCD-TCModel without NLCD-TC
Model performance0.7650.681
Explanatory variable importance
National Land Cover Database-Tree Canopy 0.918Not included
NLCD land cover0.0230.366
Normalized Difference Vegetation Index0.0140.518
Average precipitation0.0130.031
Average high temperature0.0120.037
Building coverage0.0090.010
Urban density0.0040.011
Median year built0.0030.009
Surface temperature0.0020.013
Built/undeveloped0.0020.004
Table 3. Summary predictive model output.
MetricNLCD Tree CoverCorrected Tree Cover
Mean error8.1%−0.004%
Mean absolute error13.5%10.6%
Root mean squared error21.116.7
Kolmogorov–Smirnov score0.250.27
Table 4. The results of urban ecosystem accounting models for Denver and Seattle using National Land Cover Database-Tree Canopy (NLCD-TC) 2011, high-resolution tree cover data, and the corrected NLCD-TC.
Ecosystem Accounting Area (EAA)Ecosystem ServiceTree Cover Dataset (as the Input)Ecosystem Types (Land Cover)% of the High-Resolution Results
Open WaterDeveloped-OpenDeveloped-LowDeveloped-MediumDeveloped-HighBarrenDeciduous ForestEvergreen ForestMixed ForestScrub/ShrubGrassland/HerbaceousPasture/HayCultivated CropsWoody WetlandsEmergent Herbaceous WetlandsTotal
Denver COIntercepted water (1000 m3)Native NLCD-TC 2011017451614320010013052418875%
Corrected NLCD-TC0265145028762051025111791216913%
High-Resolution Tree Cover32315710,06431724322741437337222517,178100%
Energy Savings (mWh)Native NLCD-TC 20110697530,41789831446023053160166347,93781%
Corrected NLCD-TC0768831,97498071675024153210285351,28987%
High-Resolution Tree Cover0658638,12512,476188101402460341259,140100%
Seattle WAIntercepted water (1000 m3)Native NLCD-TC 201105271391713481831616318316510829347558%
Corrected NLCD-TC08072147109181194802423002582012816535489%
High-Resolution Tree Cover0908236312908422549293319271020141166035100%
Energy Savings (mWh)Native NLCD-TC 2011019,08212,767883172315132544900055657234,42867%
Corrected NLCD-TC020,69616,4271136222895903085800069967540,28078%
High-Resolution Tree Cover022,18925,0831504406210577354710001001183851,345100%
Publisher’s Note: MDPI stays neutral with regard to jurisdictional claims in published maps and institutional affiliations.

