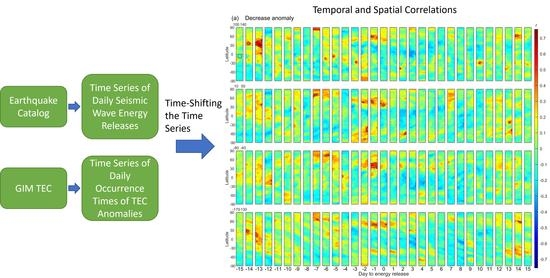
A Study of Possible Correlations between Seismo-Ionospheric Anomalies of GNSS Total Electron Content and Earthquake Energy
Abstract
1. Introduction
2. Materials and Methods
2.1. Earthquake Data
2.2. GIM TEC
2.3. TEC Anomalies
2.4. Removing Storm Effects and Other Experimental Designs
3. Results
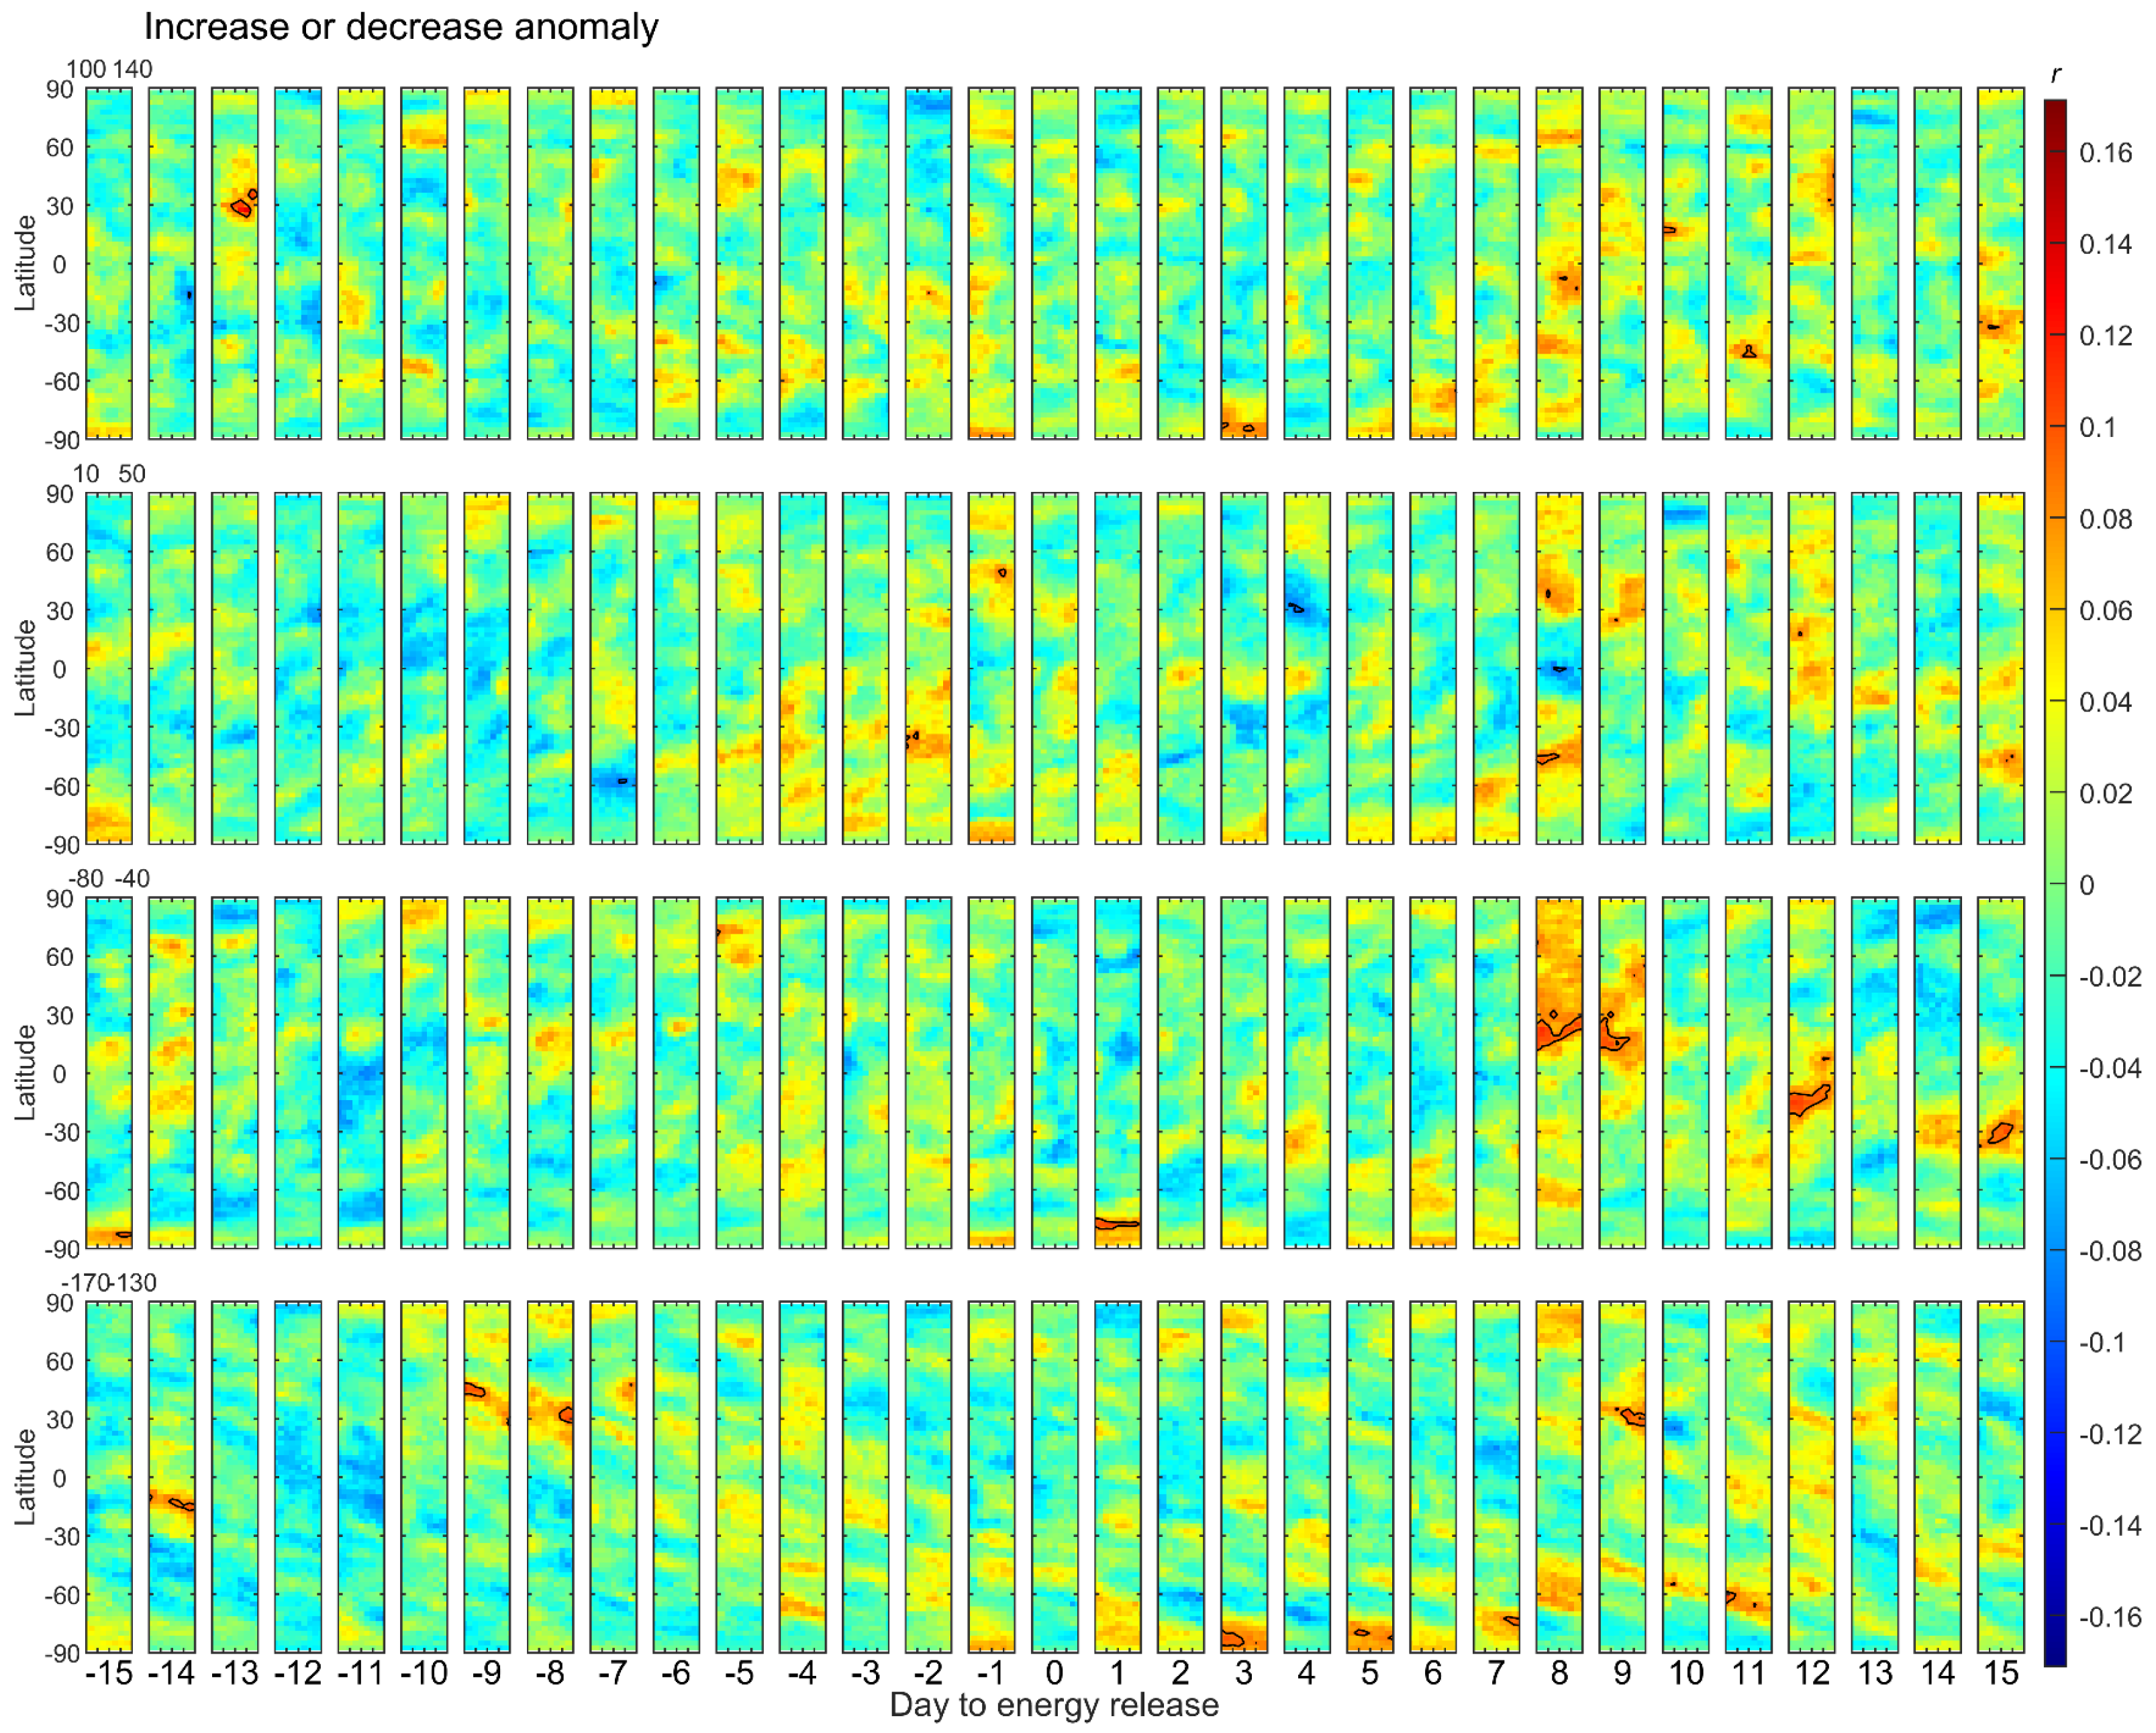
3.1. 110–130°E
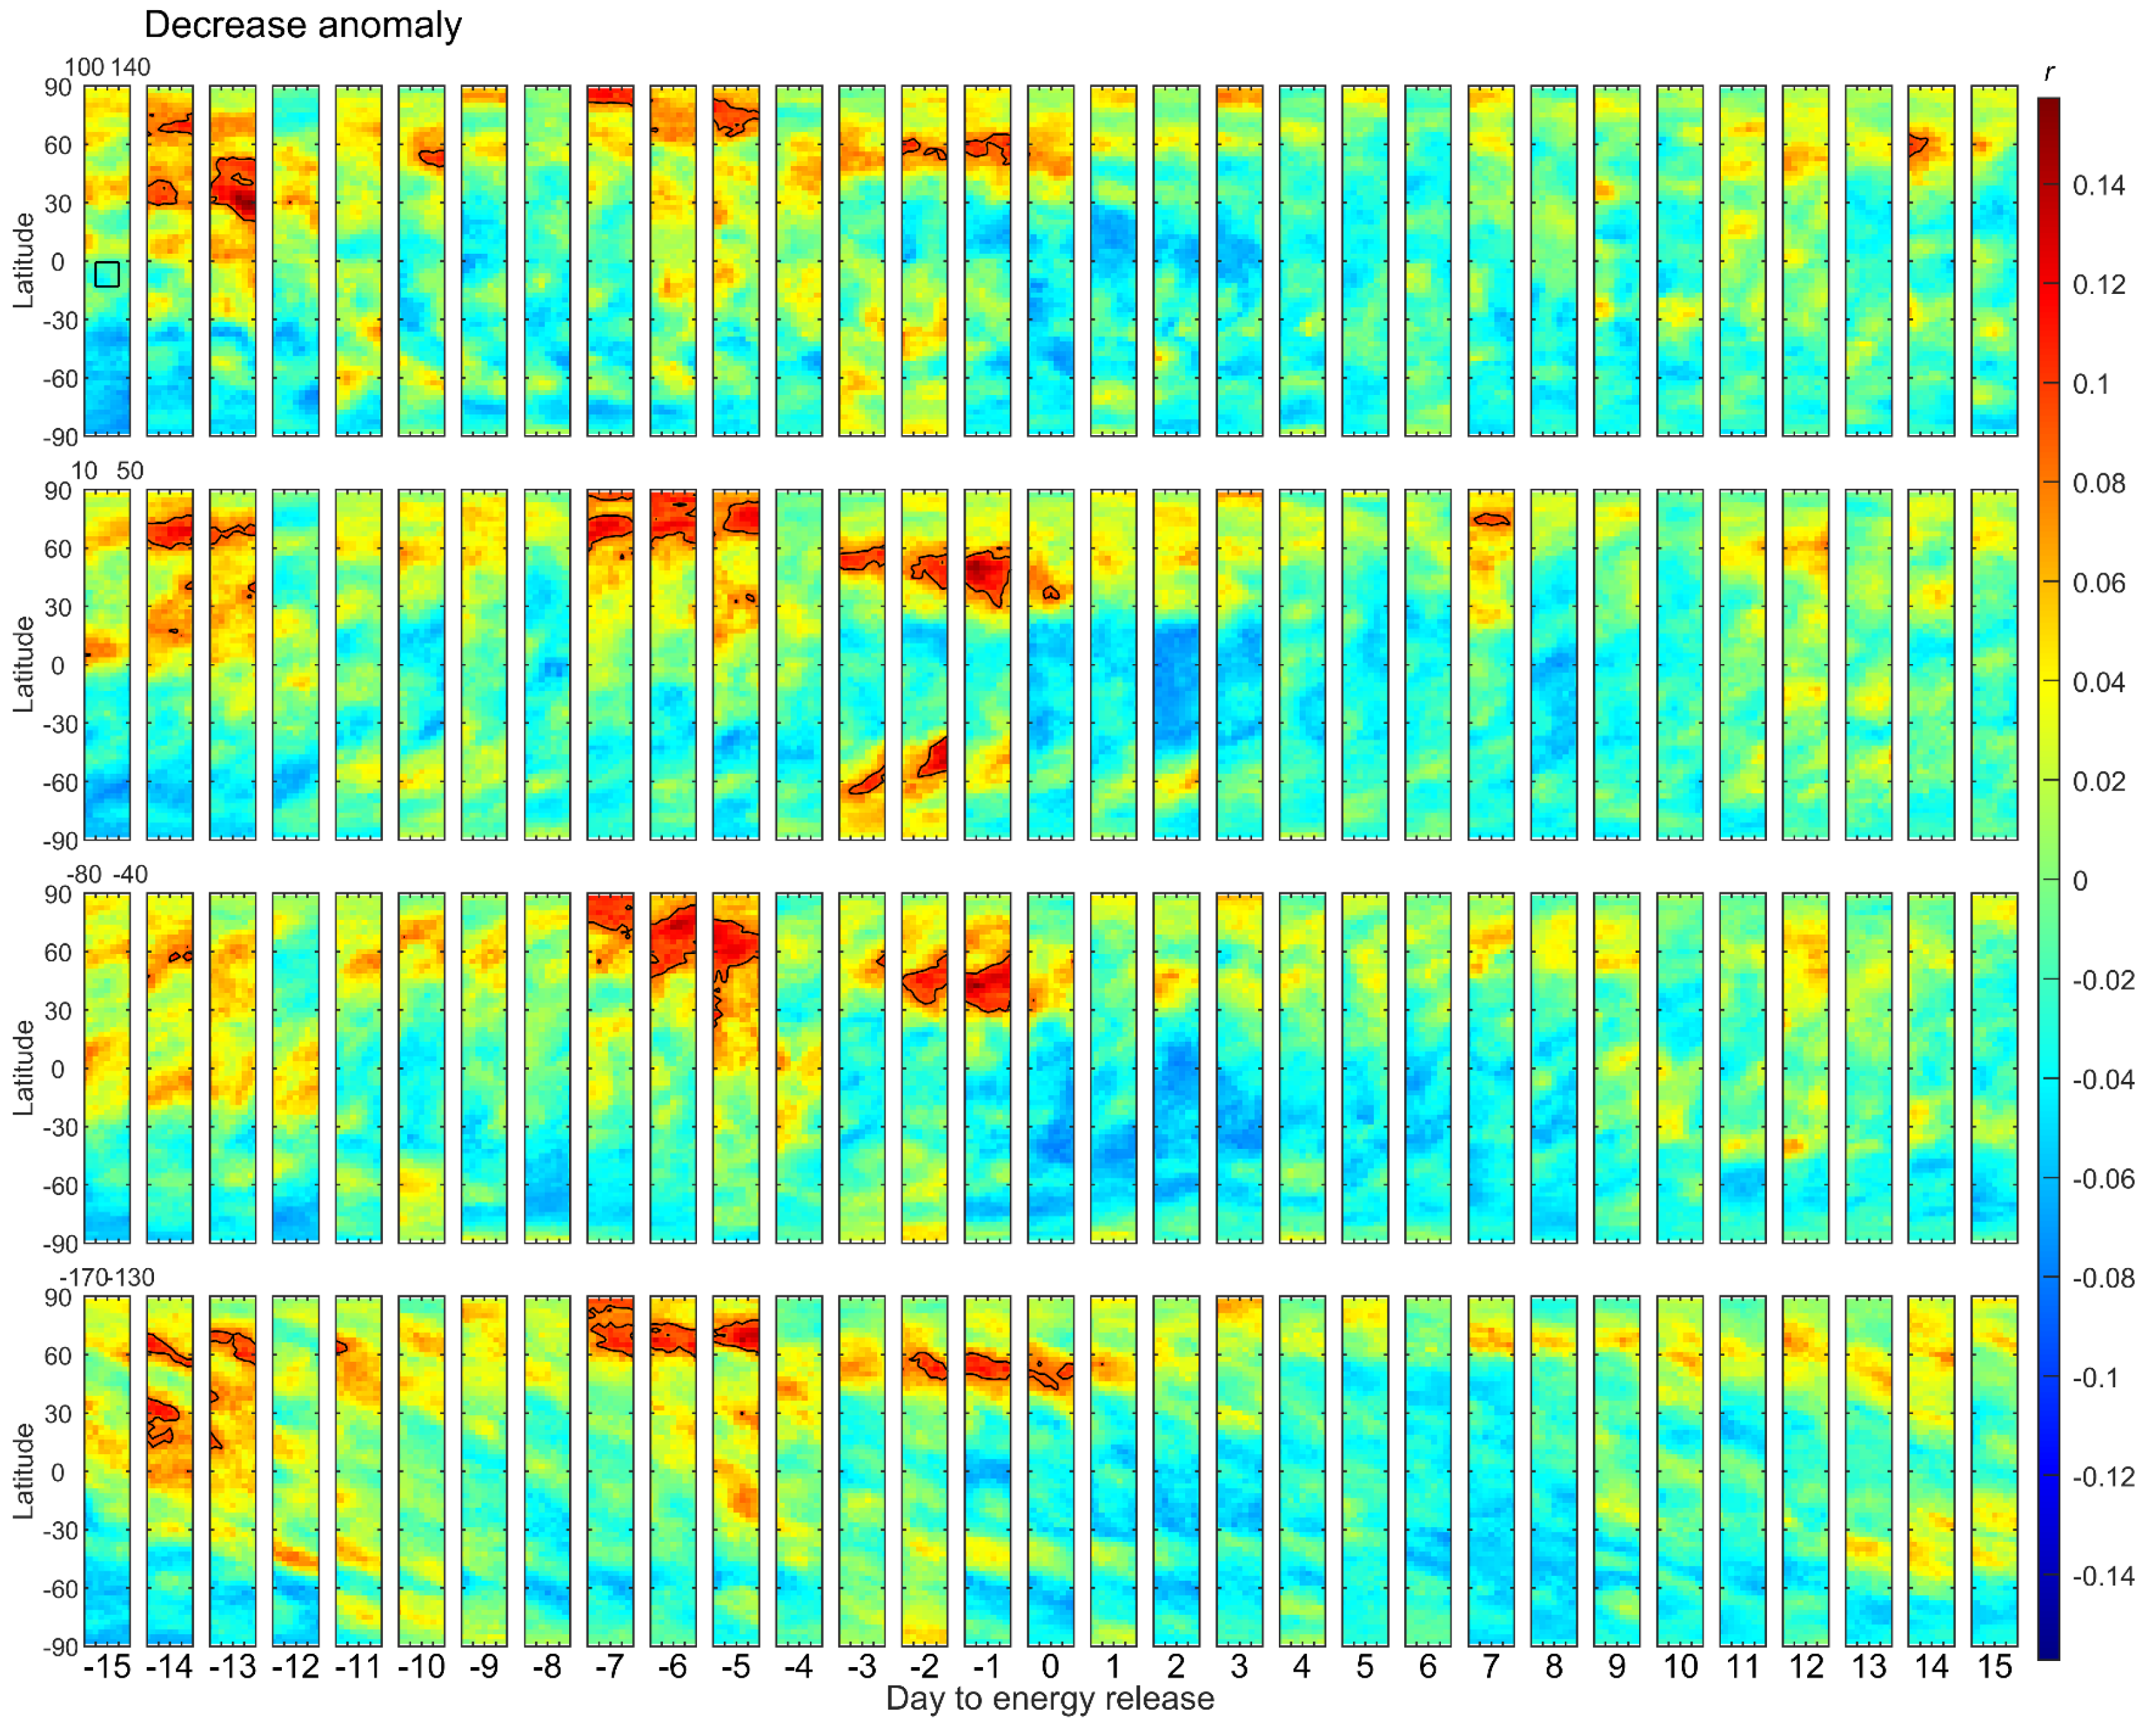
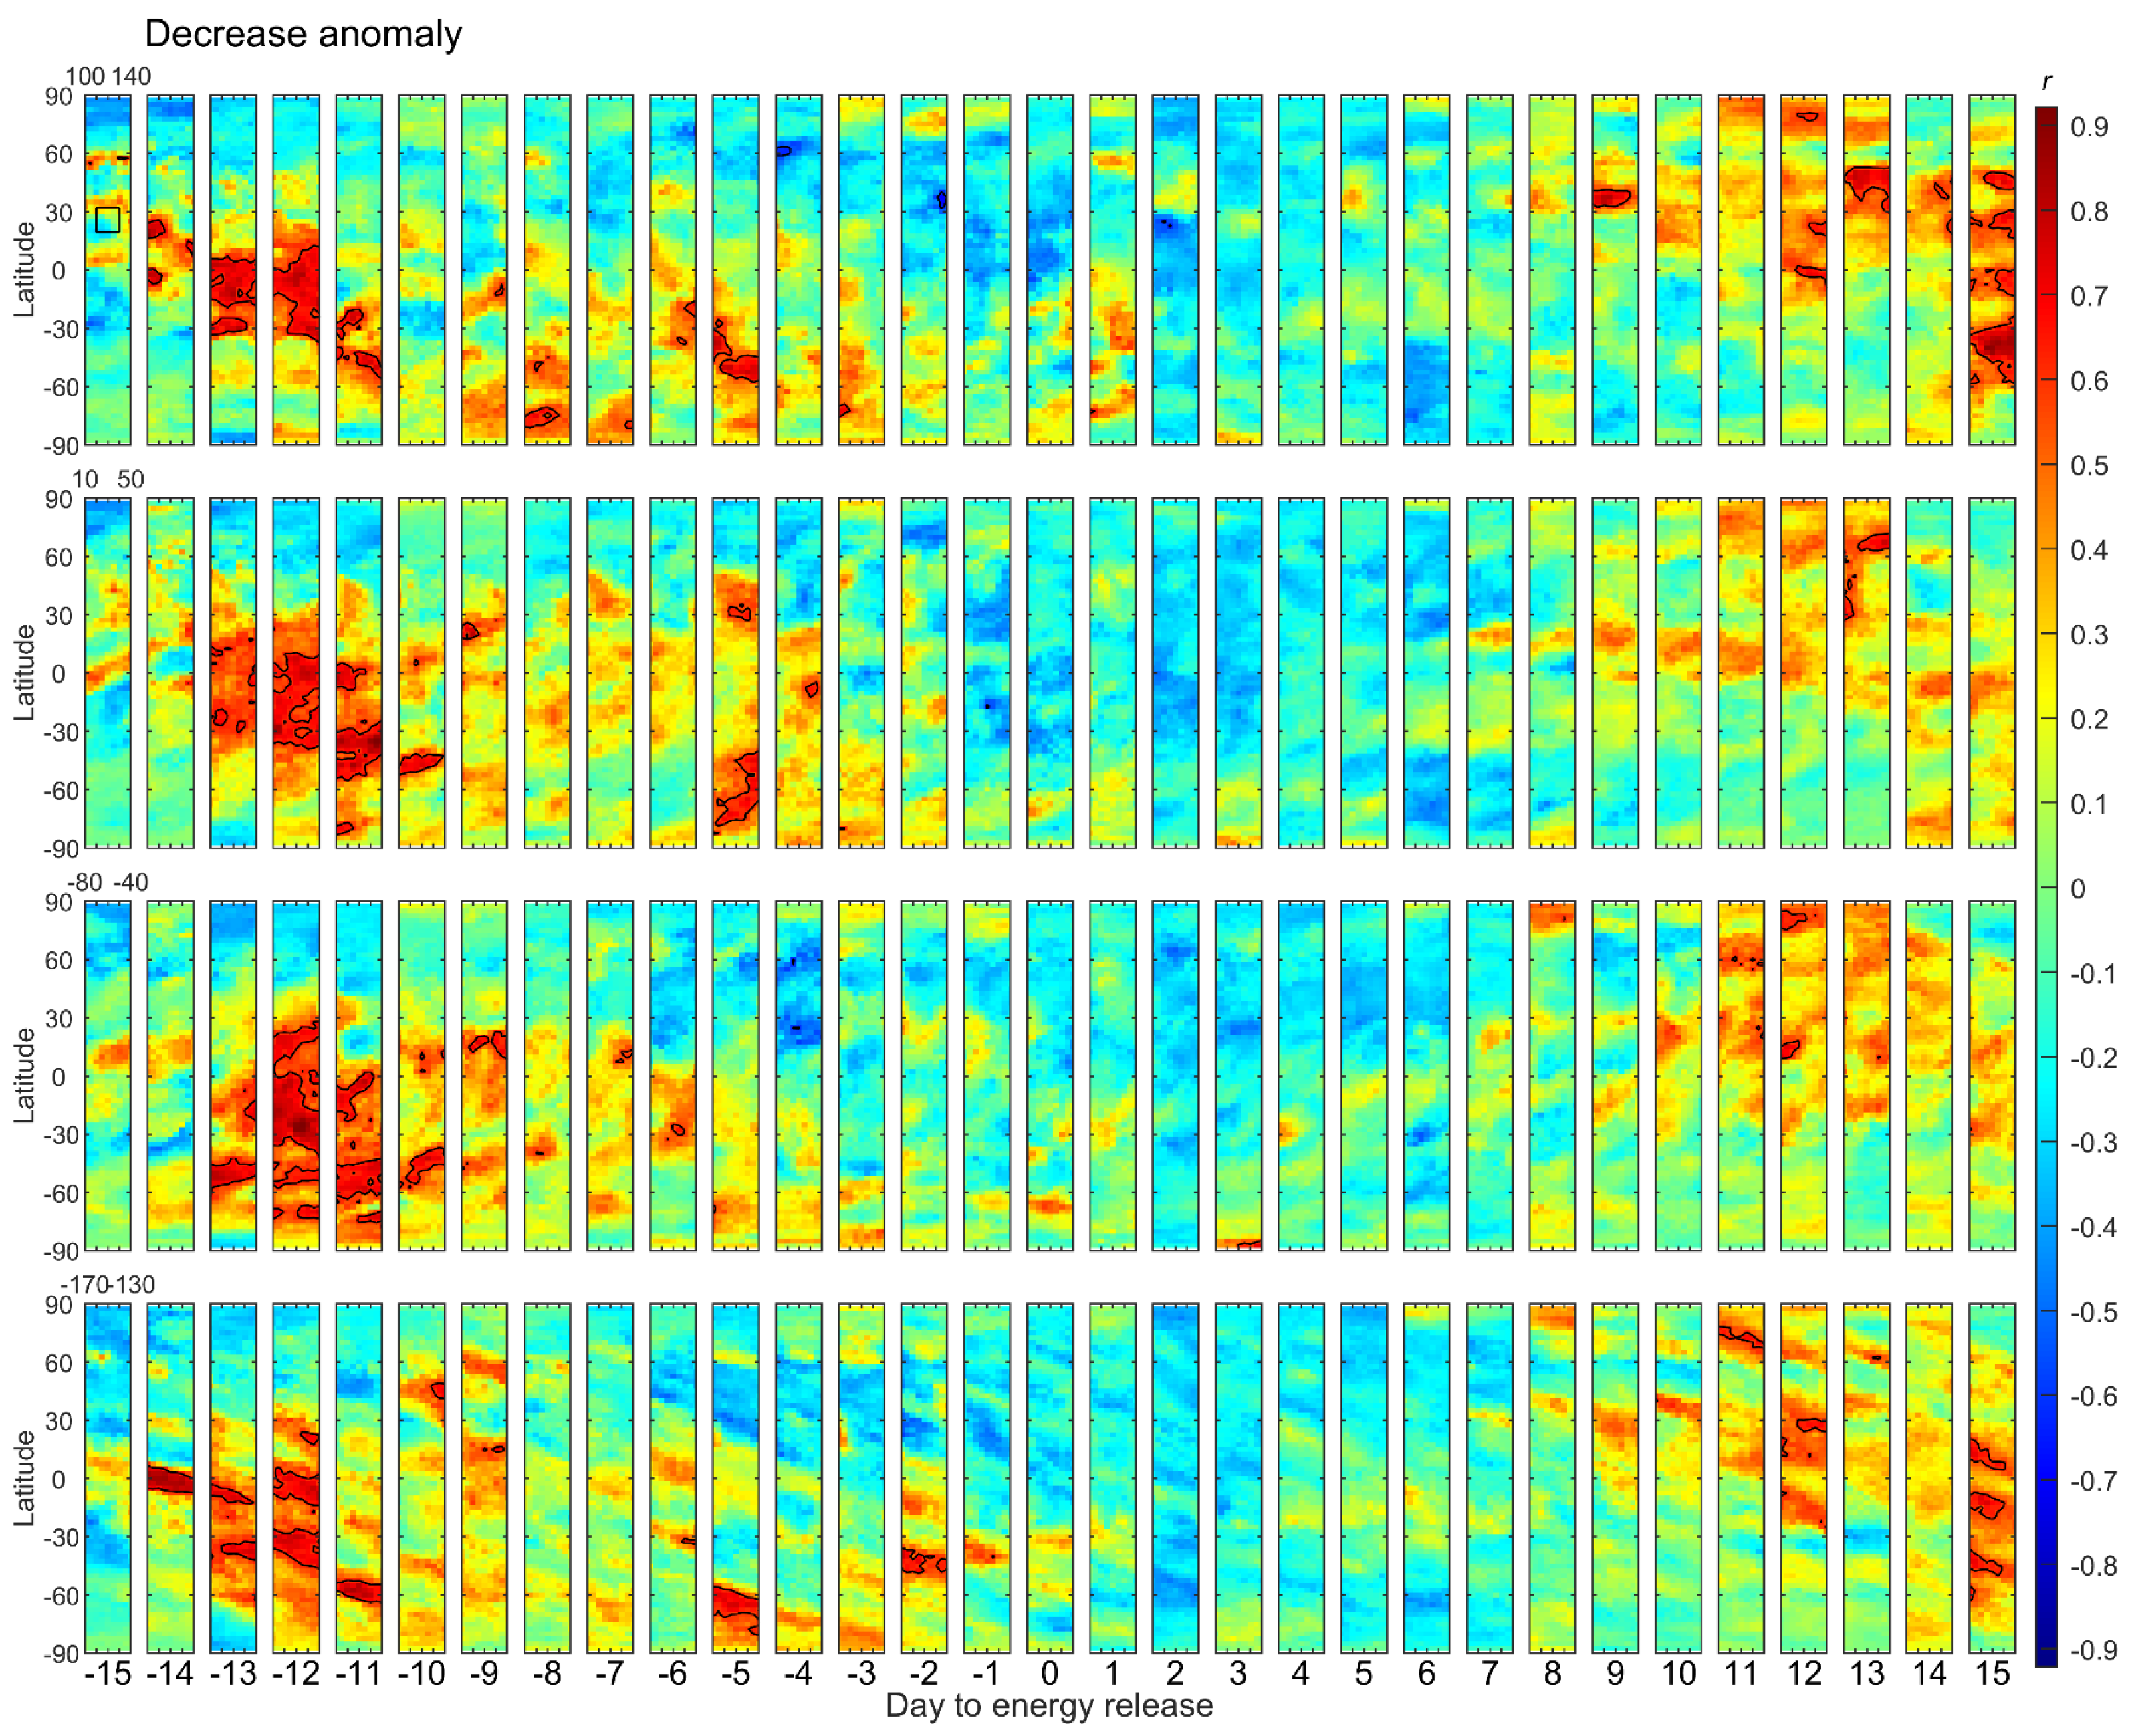
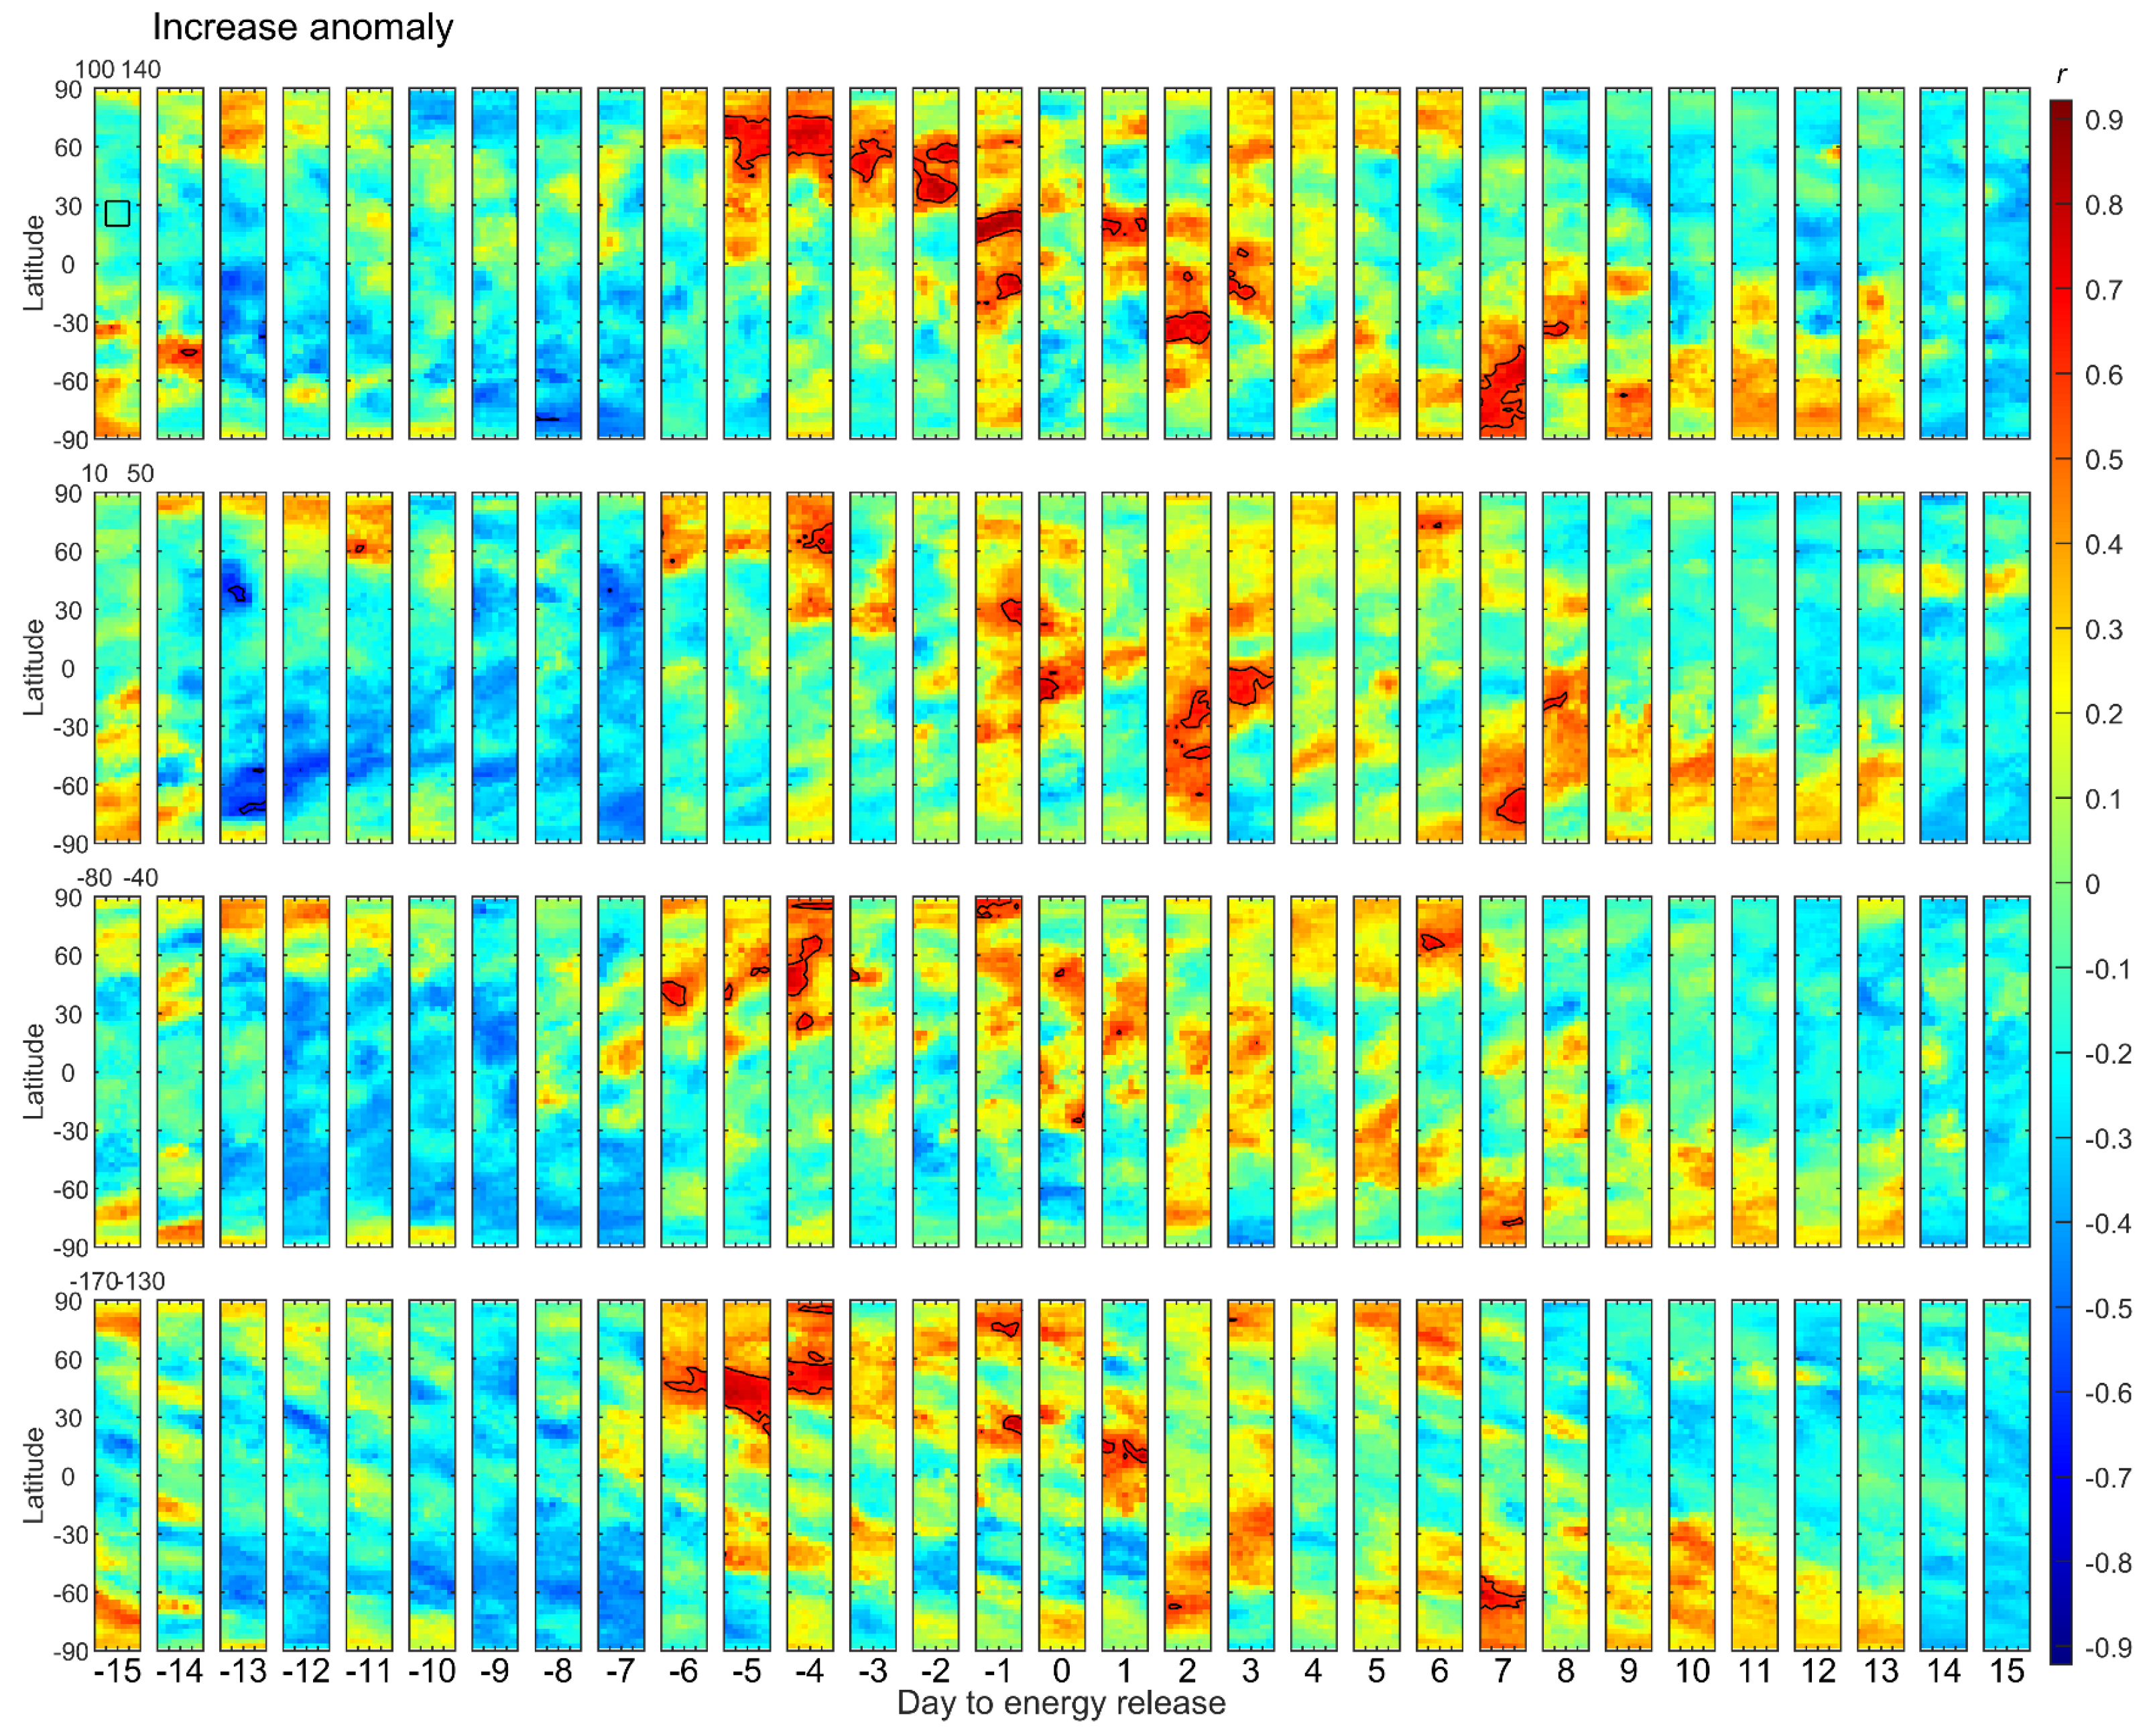
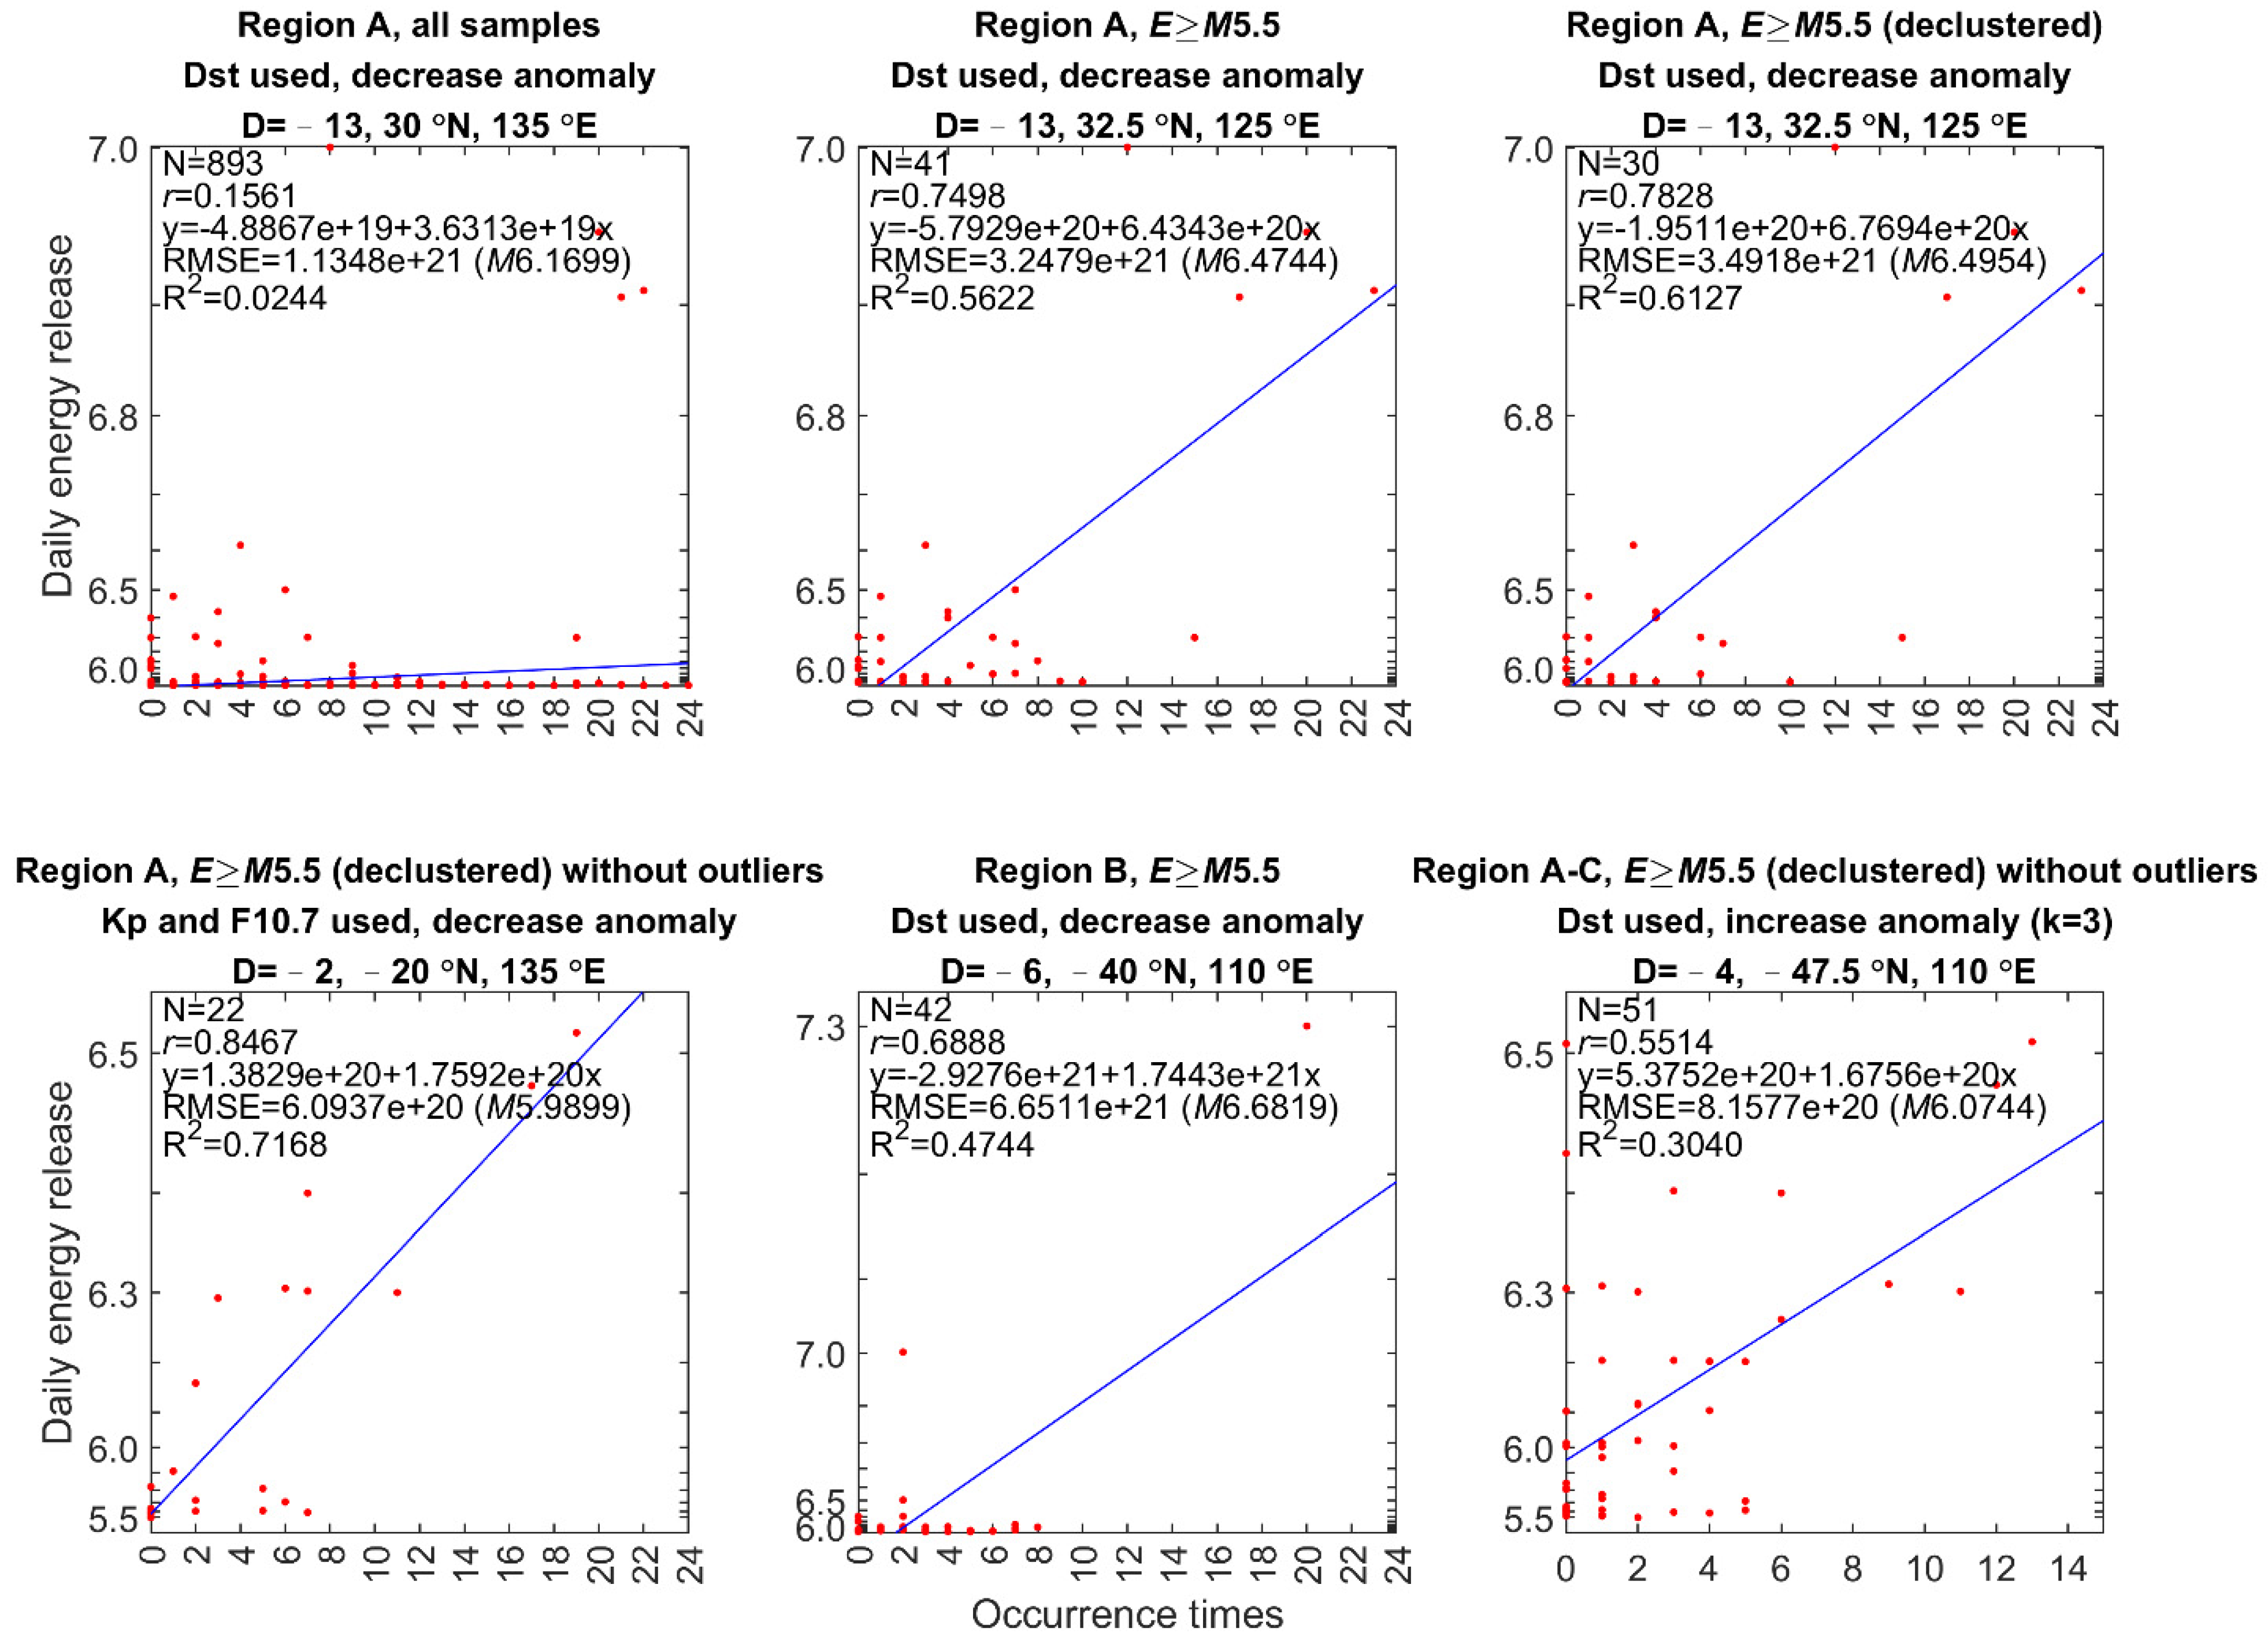
3.2. Region A
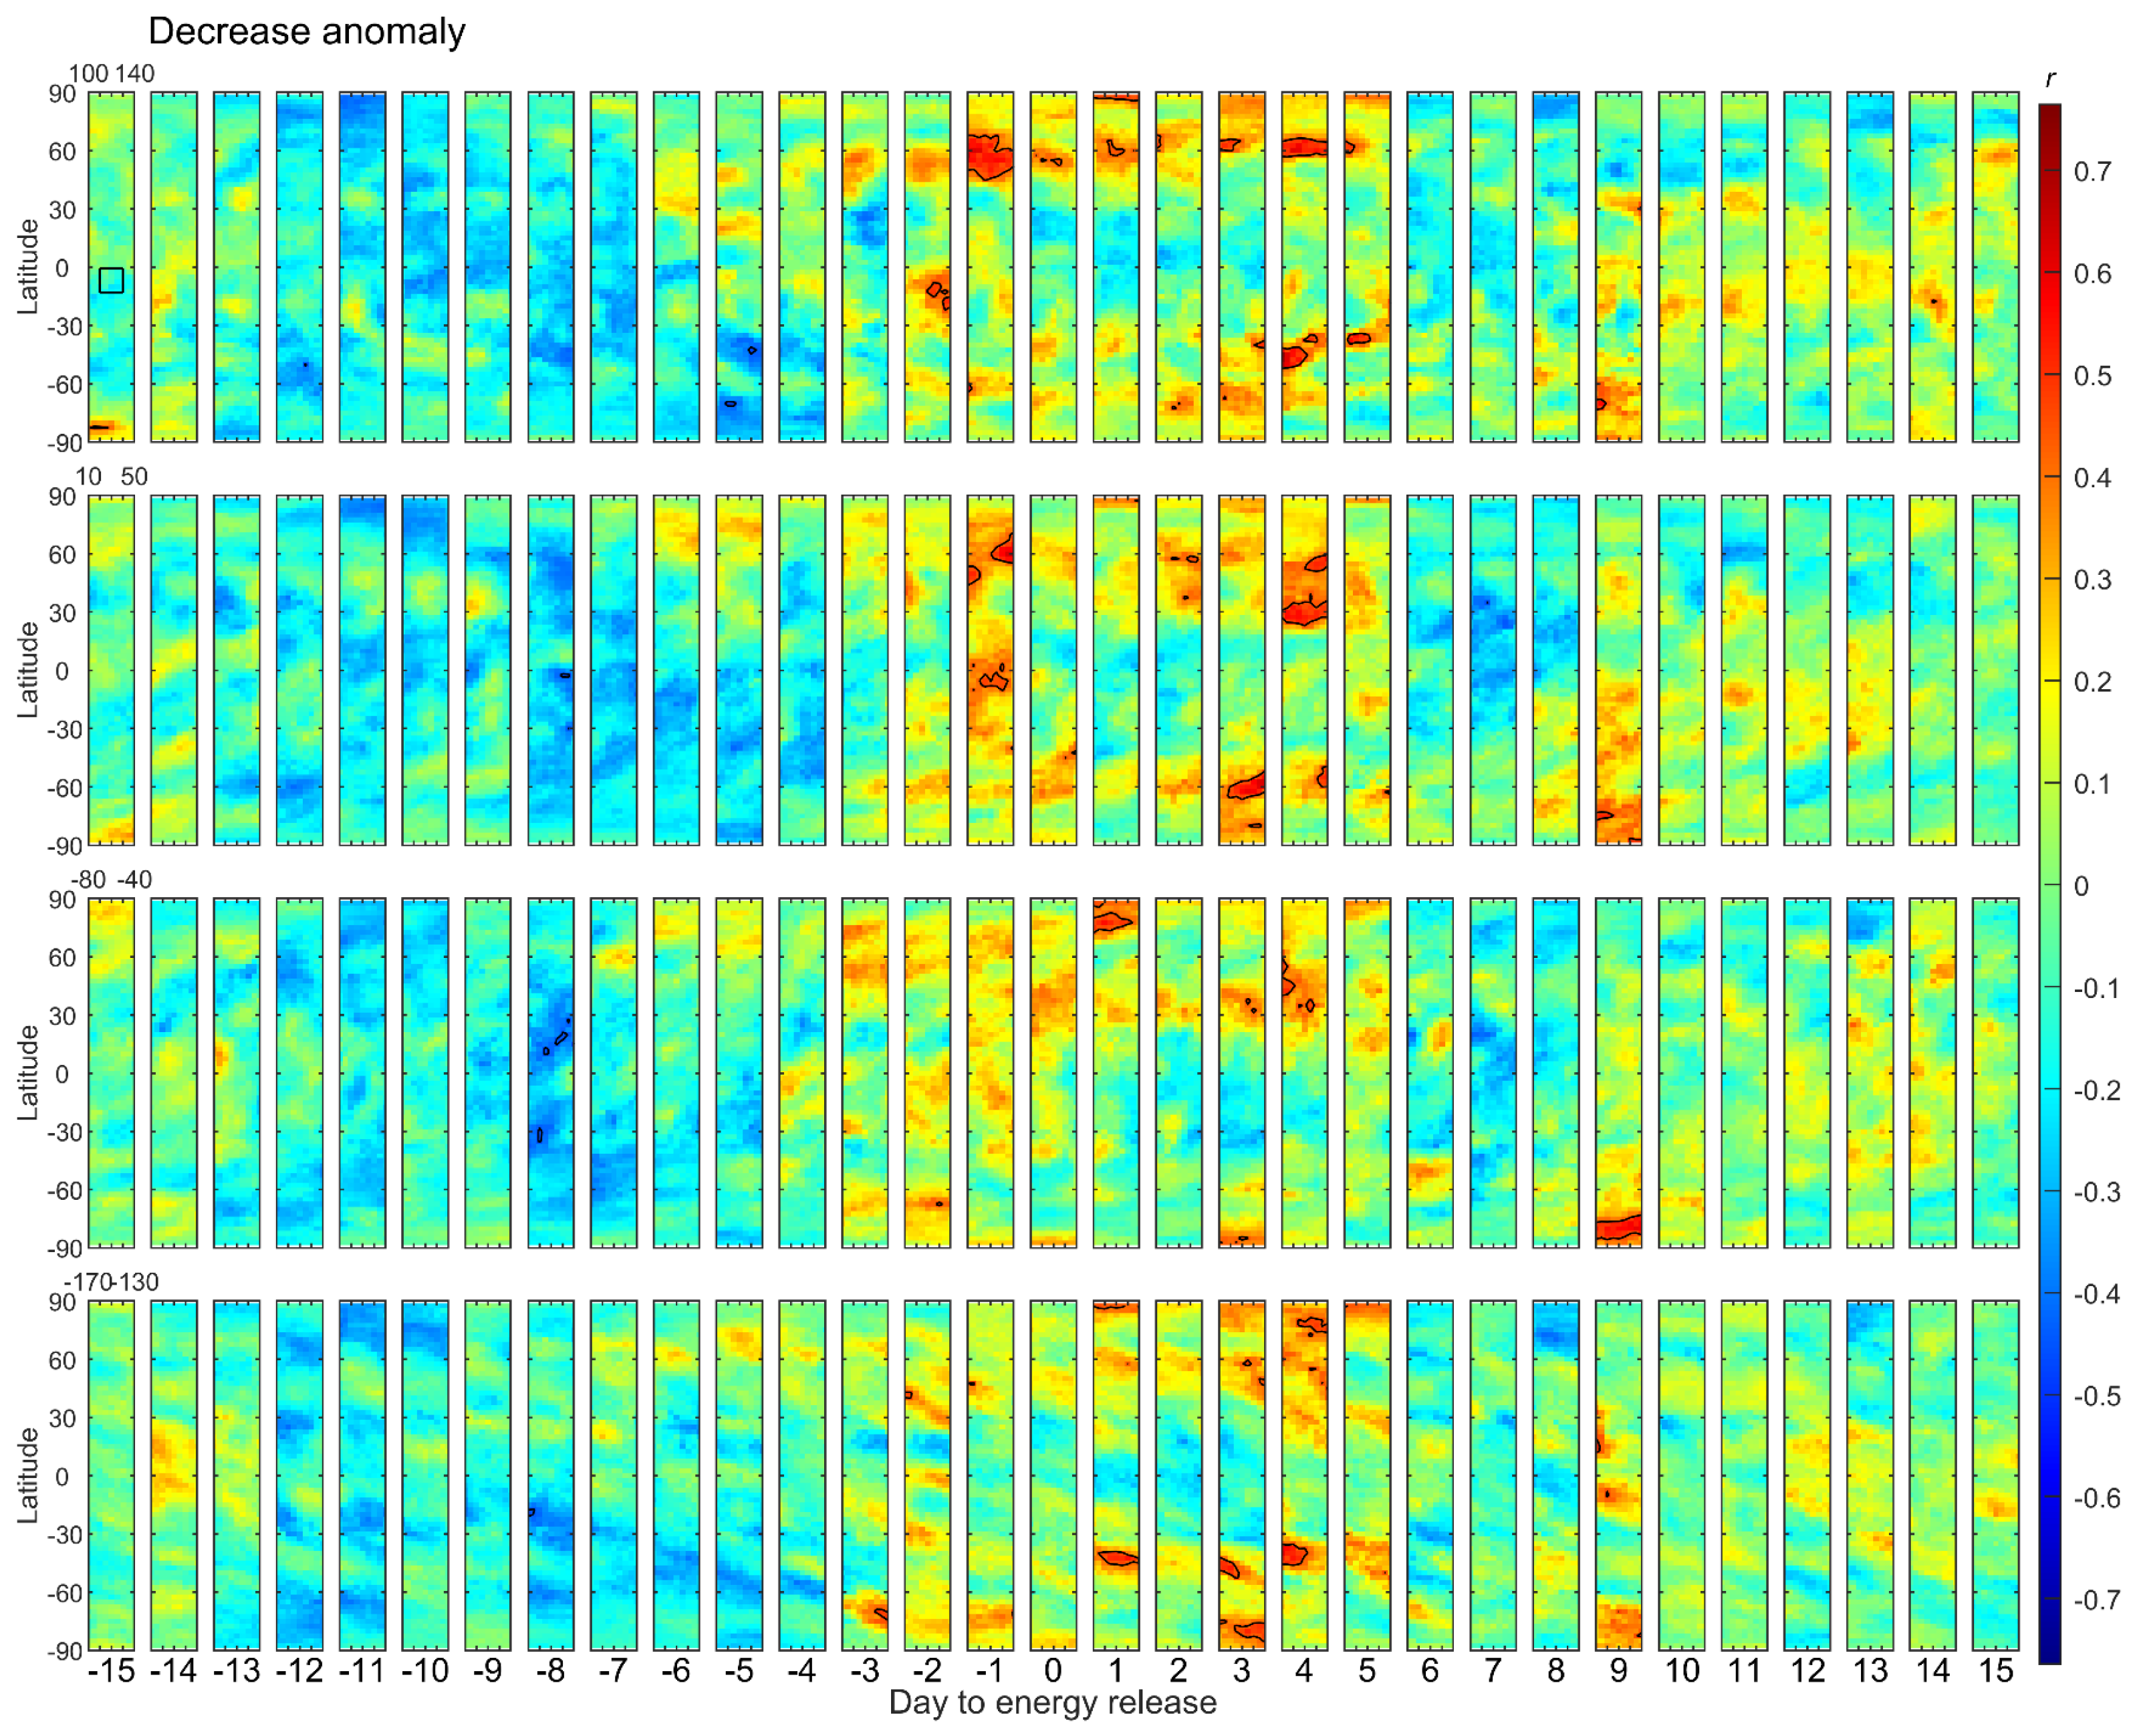
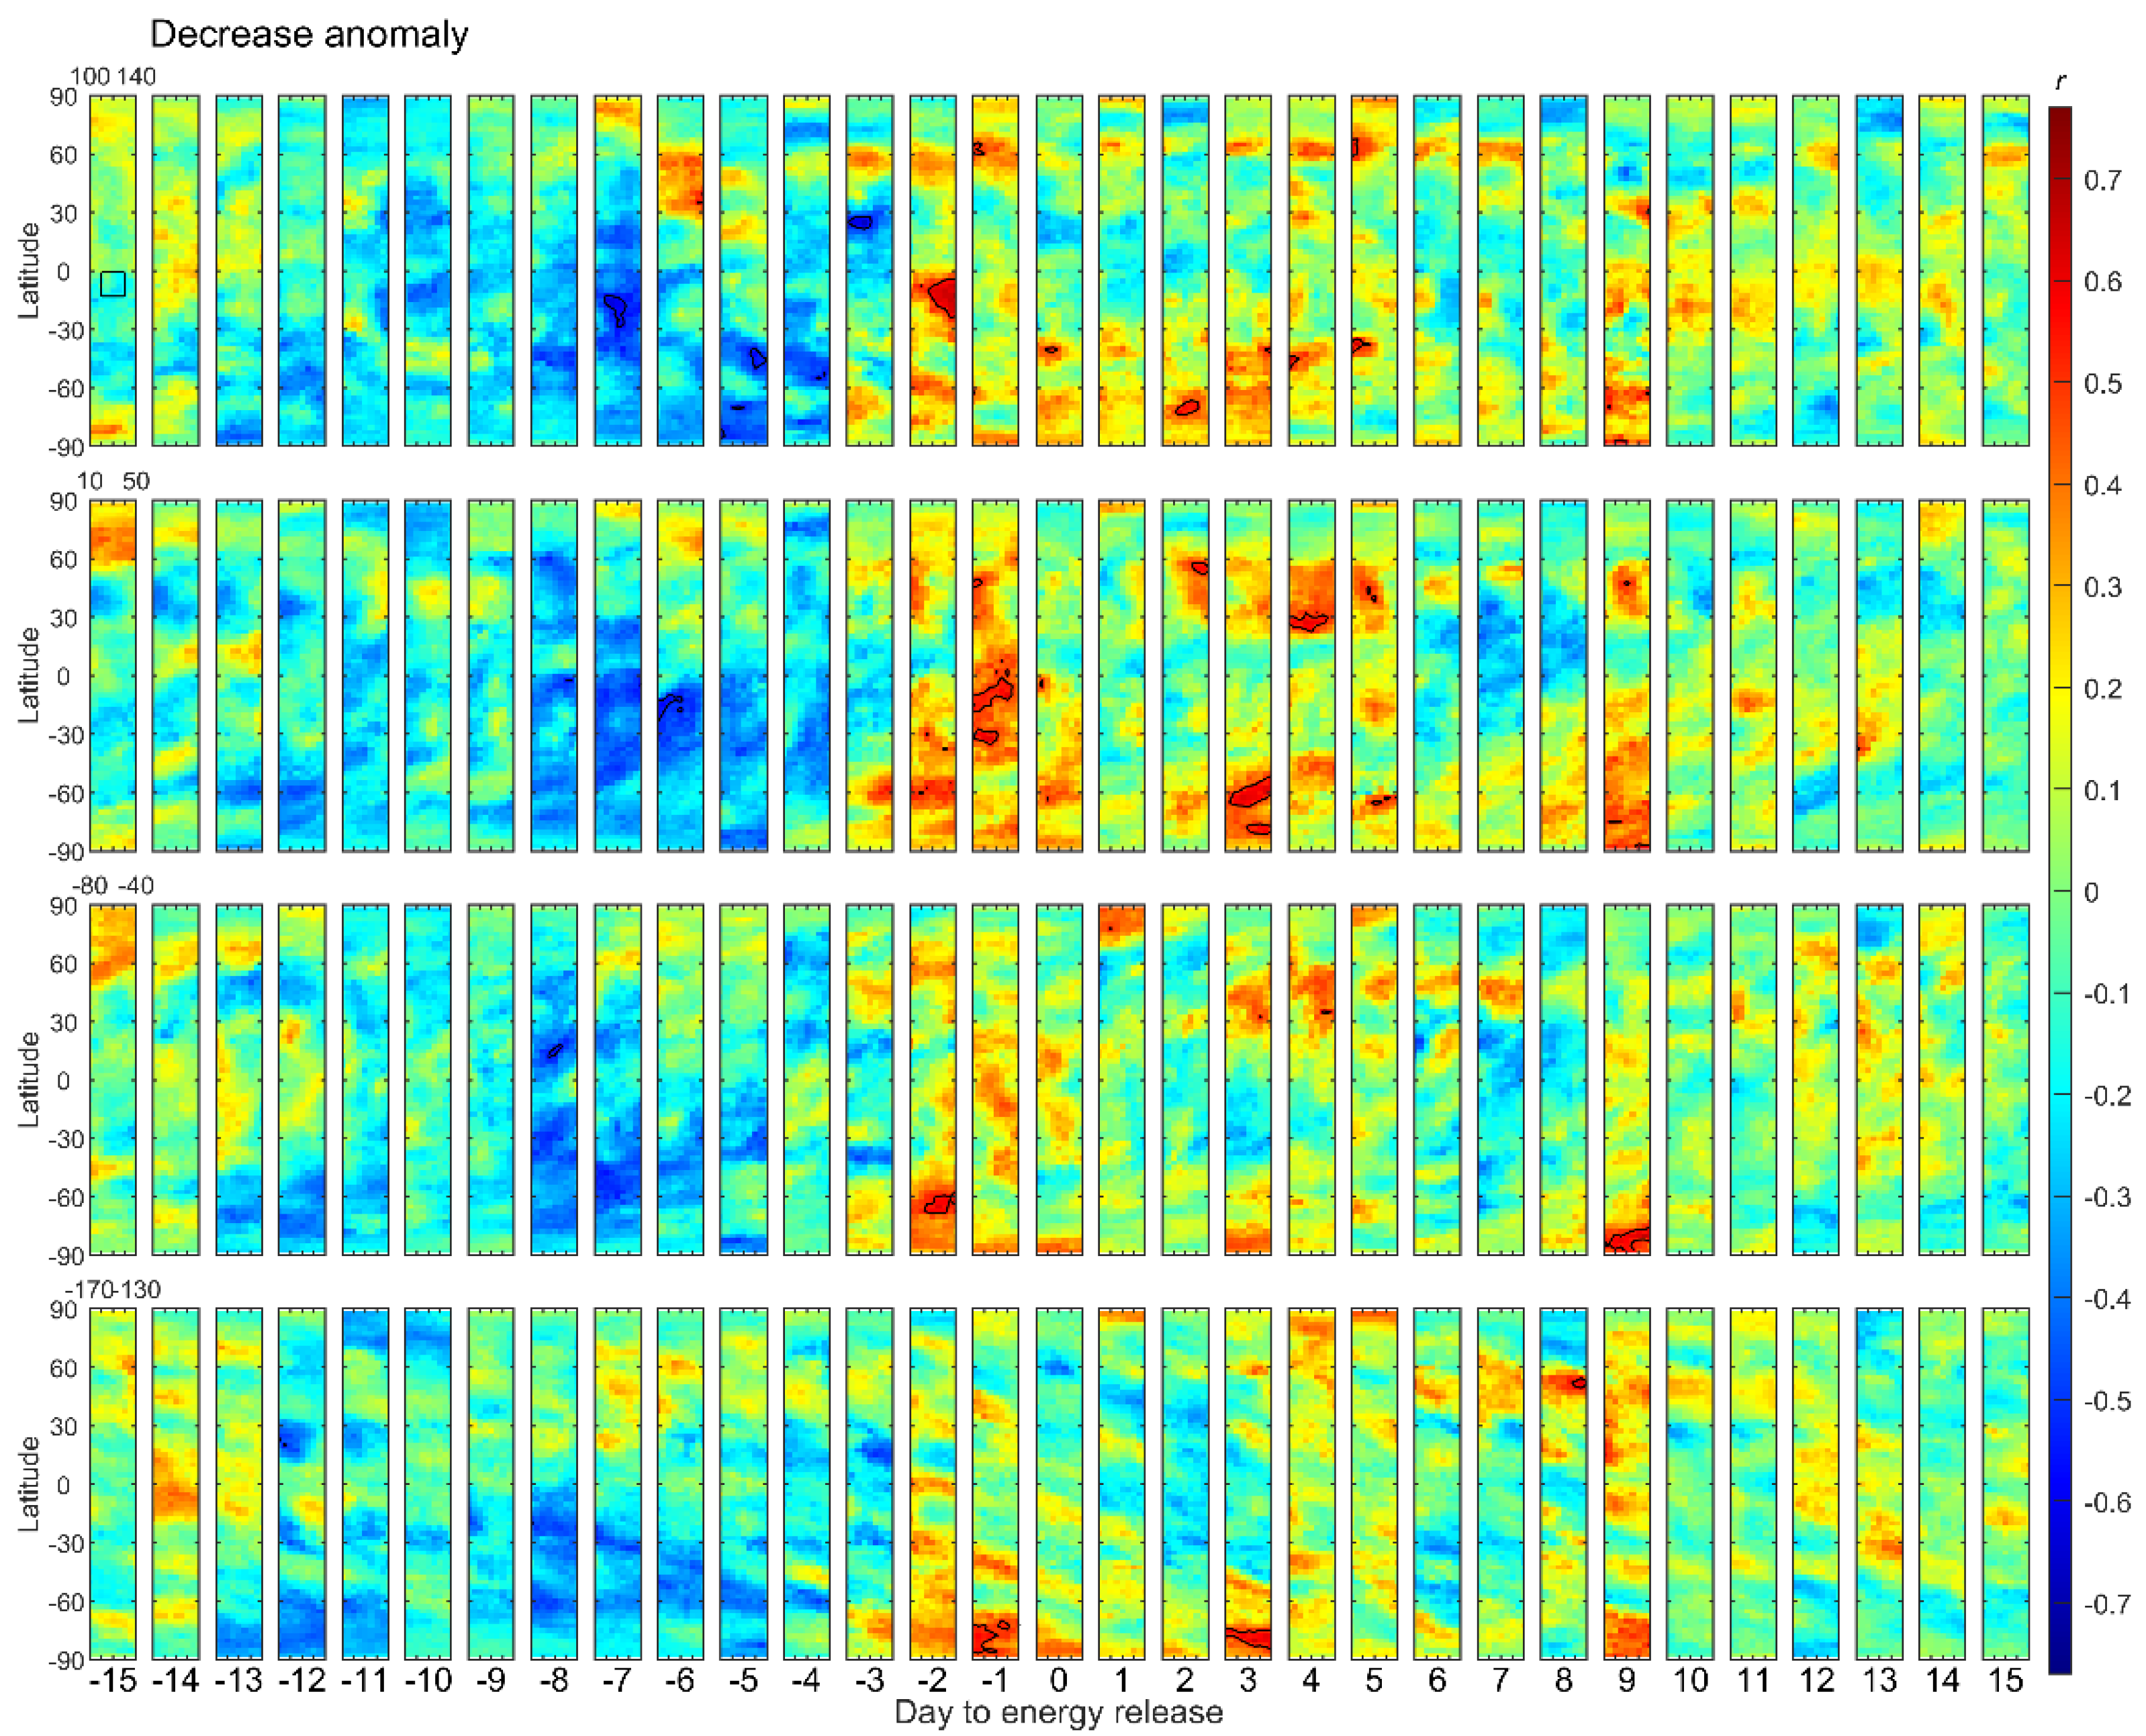
3.3. Region B
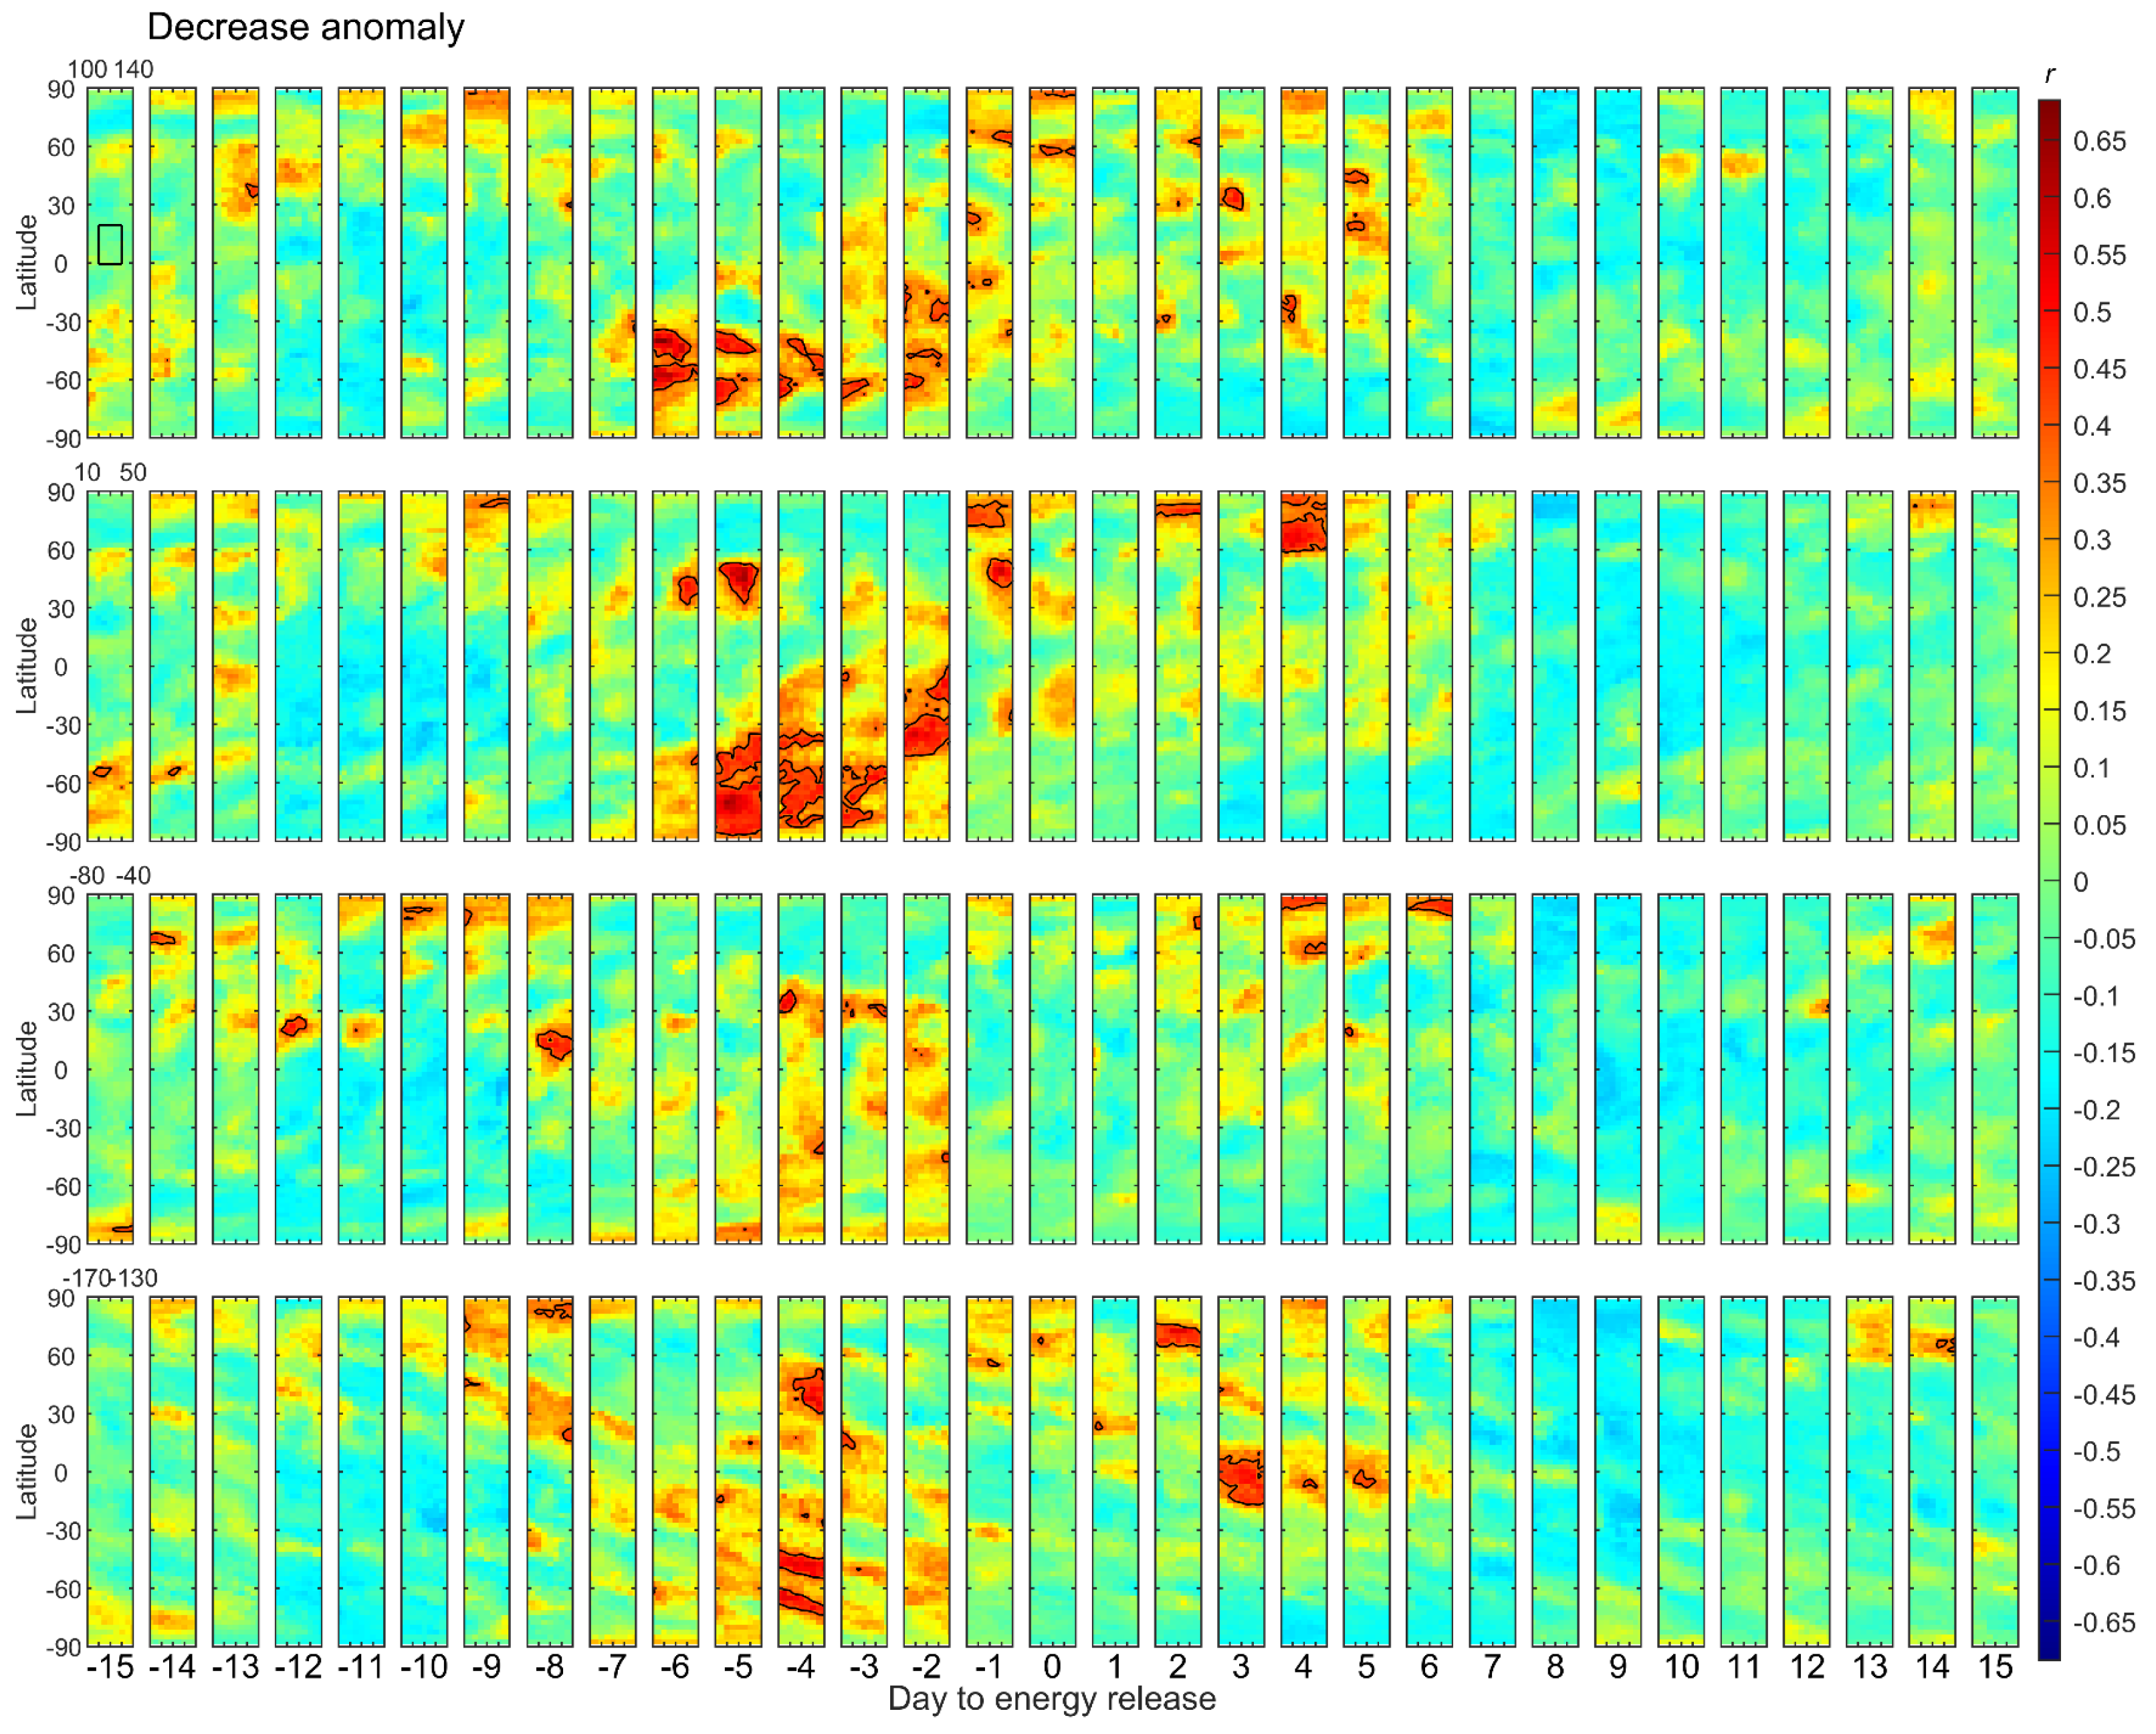
3.4. Region C
3.5. Geographical Dependence
4. Discussions
5. Conclusions
Supplementary Materials
Author Contributions
Funding
Institutional Review Board Statement
Informed Consent Statement
Data Availability Statement
Acknowledgments
Conflicts of Interest
References
- Yen, H.Y.; Chen, C.H.; Yeh, Y.H.; Liu, J.Y.; Lin, C.R.; Tsai, Y.B. Geomagnetic Fluctuations during the 1999 Chi-Chi Earthquake in Taiwan. Earth Planets Space 2004, 56, 39–45. [Google Scholar] [CrossRef]
- Chen, C.H.; Liu, J.Y.; Yen, H.Y.; Zeng, X.; Yeh, Y.H. Changes of Geomagnetic Total Field and Occurrences of Earthquakes in Taiwan. Terr. Atmos. Ocean. Sci. 2004, 15, 361–370. [Google Scholar] [CrossRef]
- Chen, C.H.; Liu, J.Y.; Lin, P.Y.; Yen, H.Y.; Hattori, K.; Liang, W.T.; Chen, Y.I.; Yeh, Y.H.; Zeng, X. Pre-Seismic Geomagnetic Anomaly and Earthquake Location. Tectonophysics 2010, 489, 240–247. [Google Scholar] [CrossRef]
- Chen, C.H.; Wang, C.H.; Wen, S.; Yeh, T.K.; Lin, C.H.; Liu, J.Y.; Yen, H.Y.; Lin, C.; Rau, R.J.; Lin, T.W. Anomalous Frequency Characteristics of Groundwater Level before Major Earthquakes in Taiwan. Hydrol. Earth Syst. Sci. 2013, 17, 1693–1703. [Google Scholar] [CrossRef]
- Chen, C.H.; Wen, S.; Yeh, T.K.; Wang, C.H.; Yen, H.Y.; Liu, J.Y.; Hobara, Y.; Han, P. Observation of Surface Displacements from GPS Analyses before and after the Jiashian Earthquake (M = 6.4) in Taiwan. J. Asian Earth Sci. 2013, 62, 662–671. [Google Scholar] [CrossRef]
- Liu, J.Y.; Chen, Y.I.; Pulinets, S.A.; Tsai, Y.B.; Chuo, Y.J. Seismo-Ionospheric Signatures Prior to M ≥ 6.0 Taiwan Earthquakes. Geophys. Res. Lett. 2000, 27, 3113–3116. [Google Scholar] [CrossRef]
- Liu, J.Y.; Chen, Y.I.; Chuo, Y.J.; Tsai, H.F. Variations of Ionospheric Total Electron Content during the Chi-Chi Earthquake. Geophys. Res. Lett. 2001, 28, 1383–1386. [Google Scholar] [CrossRef]
- Liu, J.Y.; Chen, Y.I.; Chen, C.H.; Liu, C.Y.; Nishihashi, M.; Li, J.Z.; Xia, Y.Q.; Oyama, K.I.; Hattori, K.; Lin, C.C.H. Seismoionospheric GPS Total Electron Content Anomalies Observed before the 12 May 2008 Mw 7.9 Wenchuan Earthquake. J. Geophys. Res. Space Phys. 2009, 114, A04320. [Google Scholar] [CrossRef]
- Liu, J.Y.; Chen, Y.I.; Chen, C.H.; Hattori, K. Temporal and Spatial Precursors in the Ionospheric Global Positioning System (GPS) Total Electron Content Observed before the 26 December 2004 M 9.3 Sumatra-Andaman Earthquake. J. Geophys. Res. Space Phys. 2010, 115, A09312. [Google Scholar] [CrossRef]
- Liu, J.Y.; Le, H.; Chen, Y.I.; Chen, C.H.; Liu, L.; Wan, W.; Su, Y.Z.; Sun, Y.Y.; Lin, C.H.; Chen, M.Q. Observations and Simulations of Seismoionospheric GPS Total Electron Content Anomalies before the 12 January 2010 M 7 Haiti Earthquake. J. Geophys. Res. Space Phys. 2011, 116, A04302. [Google Scholar] [CrossRef]
- Liu, J.Y.; Chen, Y.I.; Huang, C.C.; Parrot, M.; Shen, X.H.; Pulinets, S.A.; Yang, Q.S.; Ho, Y.Y. A Spatial Analysis on Seismo-Ionospheric Anomalies Observed by DEMETER during the 2008 M 8.0 Wenchuan Earthquake. J. Asian Earth Sci. 2015, 114, 414–419. [Google Scholar] [CrossRef]
- Yan, R.; Shen, X.; Huang, J.; Wang, Q.; Chu, W.; Liu, D.; Yang, Y.; Lu, H.; Xu, S. Examples of Unusual Ionospheric Observations by the CSES Prior to Earthquakes. Earth Planet. Phys. 2018, 2, 515–526. [Google Scholar] [CrossRef]
- Chen, Y.I.; Huang, C.S.; Liu, J.Y. Statistical Evidences of Seismo-Ionospheric Precursors Applying Receiver Operating Characteristic (ROC) Curve on the GPS Total Electron Content in China. J. Asian Earth Sci. 2015, 114, 393–402. [Google Scholar] [CrossRef]
- Liu, J.Y.; Chen, Y.I.; Chuo, Y.J.; Chen, C.S. A Statistical Investigation of Preearthquake Ionospheric Anomaly. J. Geophys. Res. 2006, 111, A05304. [Google Scholar] [CrossRef]
- Liu, J.Y.; Chen, C.H.; Chen, Y.I.; Yang, W.H.; Oyama, K.I.; Kuo, K.W. A Statistical Study of Ionospheric Earthquake Precursors Monitored by Using Equatorial Ionization Anomaly of GPS TEC in Taiwan during 2001–2007. J. Asian Earth Sci. 2010, 39, 76–80. [Google Scholar] [CrossRef]
- Pulinets, S.; Davidenko, D. Ionospheric Precursors of Earthquakes and Global Electric Circuit. Adv. Space Res. 2014, 53, 709–723. [Google Scholar] [CrossRef]
- Oyama, K.I.; Chen, C.H.; Bankov, L.; Minakshi, D.; Ryu, K.; Liu, J.Y.; Liu, H. Precursor Effect of 11 March 2011 off the Coast of Tohoku Earthquake on High and Low Latitude Ionospheres and Its Possible Disturbing Mechanism. Adv. Space Res. 2019, 63, 2623–2637. [Google Scholar] [CrossRef]
- Kelley, M.C.; Swartz, W.E.; Heki, K. Apparent Ionospheric Total Electron Content Variations Prior to Major Earthquakes Due to Electric Fields Created by Tectonic Stresses. J. Geophys. Res. Space Phys. 2017, 122, 6689–6695. [Google Scholar] [CrossRef]
- Kim, V.P.; Hegai, V.V.; Liu, J.Y.; Ryu, K.; Chung, J.K. Time-Varying Seismogenic Coulomb Electric Fields as a Probable Source for Pre-Earthquake Variation in the Ionospheric F2-Layer. J. Astron. Space Sci. 2017, 34, 251–256. [Google Scholar] [CrossRef]
- Masci, F.; Thomas, J.N.; Secan, J.A. On a Reported Effect in Ionospheric TEC around the Time of the 6 April 2009 L’Aquila Earthquake. Nat. Hazards Earth Syst. Sci. 2017, 17, 1461–1468. [Google Scholar] [CrossRef]
- Nenovski, P.I.; Pezzopane, M.; Ciraolo, L.; Vellante, M.; Villante, U.; de Lauretis, M. Local Changes in the Total Electron Content Immediately before the 2009 Abruzzo Earthquake. Adv. Space Res. 2015, 55, 243–258. [Google Scholar] [CrossRef][Green Version]
- Dautermann, T.; Calais, E.; Haase, J.; Garrison, J. Investigation of Ionospheric Electron Content Variations before Earthquakes in Southern California, 2003–2004. J. Geophys. Res. 2007, 112, B02106. [Google Scholar] [CrossRef]
- Thomas, J.N.; Huard, J.; Masci, F. A Statistical Study of Global Ionospheric Map Total Electron Content Changes Prior to Occurrences of M ≥ 6.0 Earthquakes during 2000–2014. J. Geophys. Res. Space Phys. 2017, 122, 2151–2161. [Google Scholar] [CrossRef]
- Gutenberg, B.; Richter, C.F. Earthquake Magnitude, Intensity, Energy, and Acceleration. Bull. Seismol. Soc. Am. 1956, 46, 105–145. [Google Scholar] [CrossRef]
- CODE Final Product Series for the IGS; Astronomical Institute, University of Bern: Bern, Switzerland, 2020. [CrossRef]
- Liu, J.Y.; Yang, W.H.; Lin, C.H.; Chen, Y.I.; Lee, I.T. A Statistical Study on the Characteristics of Ionospheric Storms in the Equatorial Ionization Anomaly Region: GPS-TEC Observed over Taiwan. J. Geophys. Res. Space Phys. 2013, 118, 3856–3865. [Google Scholar] [CrossRef]
- Zhu, F.; Su, F.; Lin, J. Statistical Analysis of TEC Anomalies Prior to M 6.0 + Earthquakes During 2003–2014. Pure Appl. Geophys. 2018, 175, 3441–3450. [Google Scholar] [CrossRef]
- Illowsky, B.; Dean, S. Testing the Significance of the Correlation Coefficient. In Introductory Statistics; OpenStax: Houston, TX, USA, 2013; Available online: https://opentextbc.ca/introstatopenstax/chapter/testing-the-significance-of-the-correlation-coefficient/ (accessed on 30 November 2021).
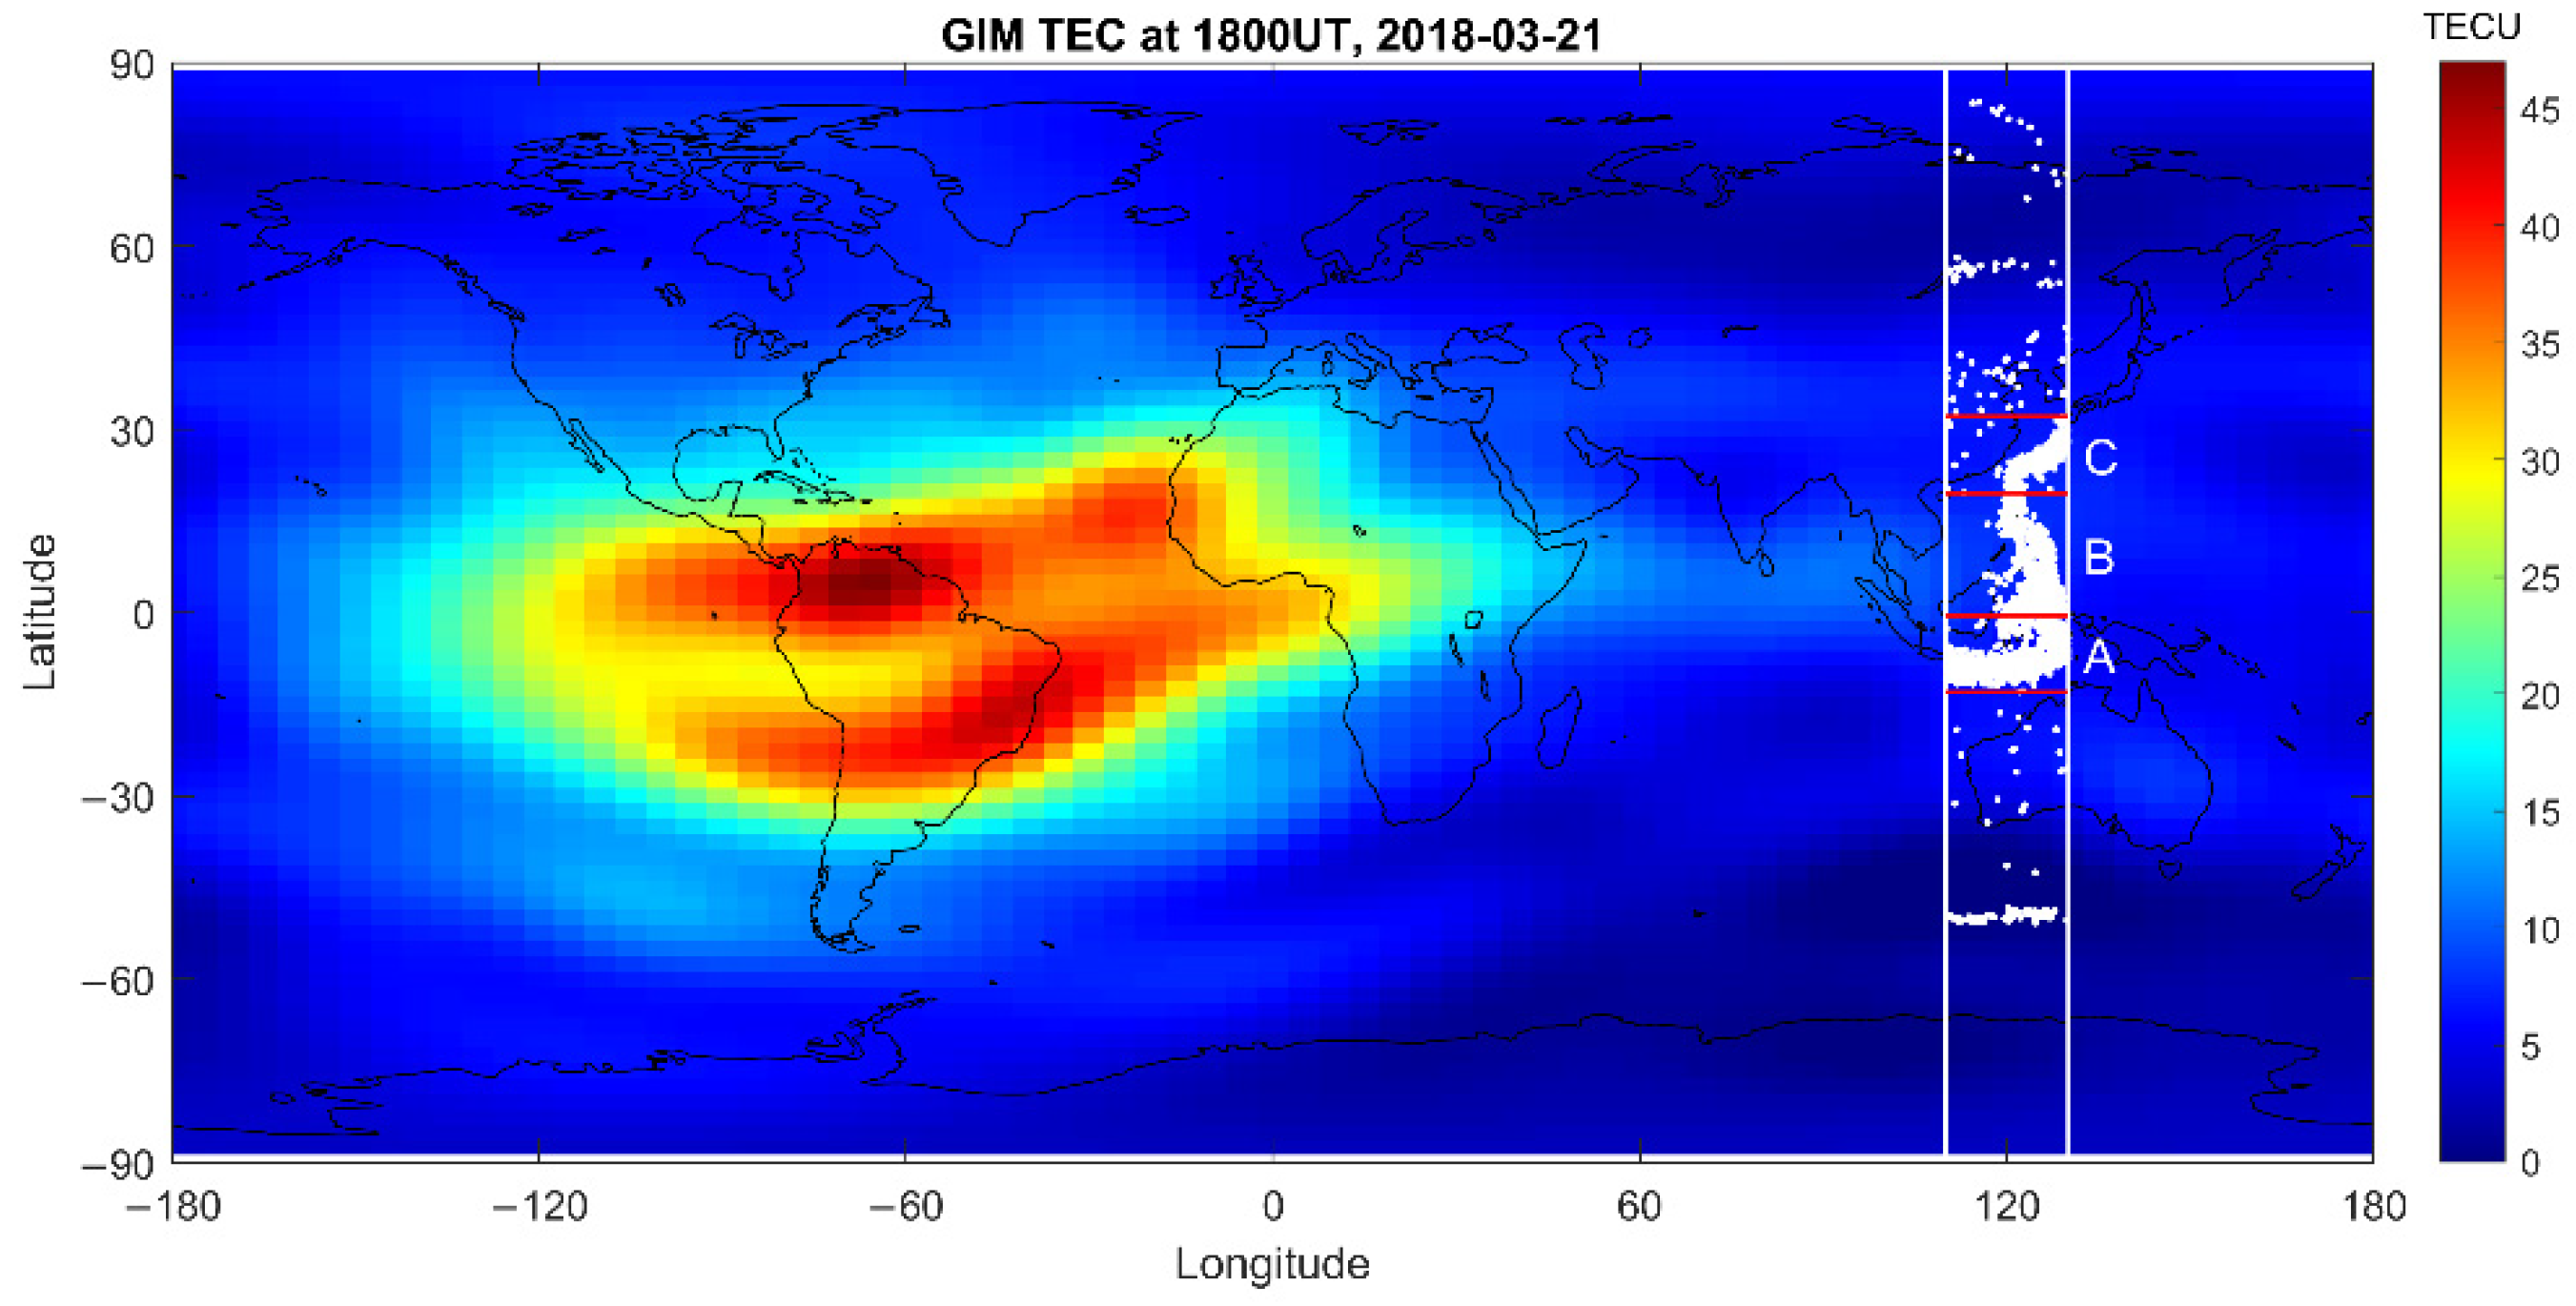


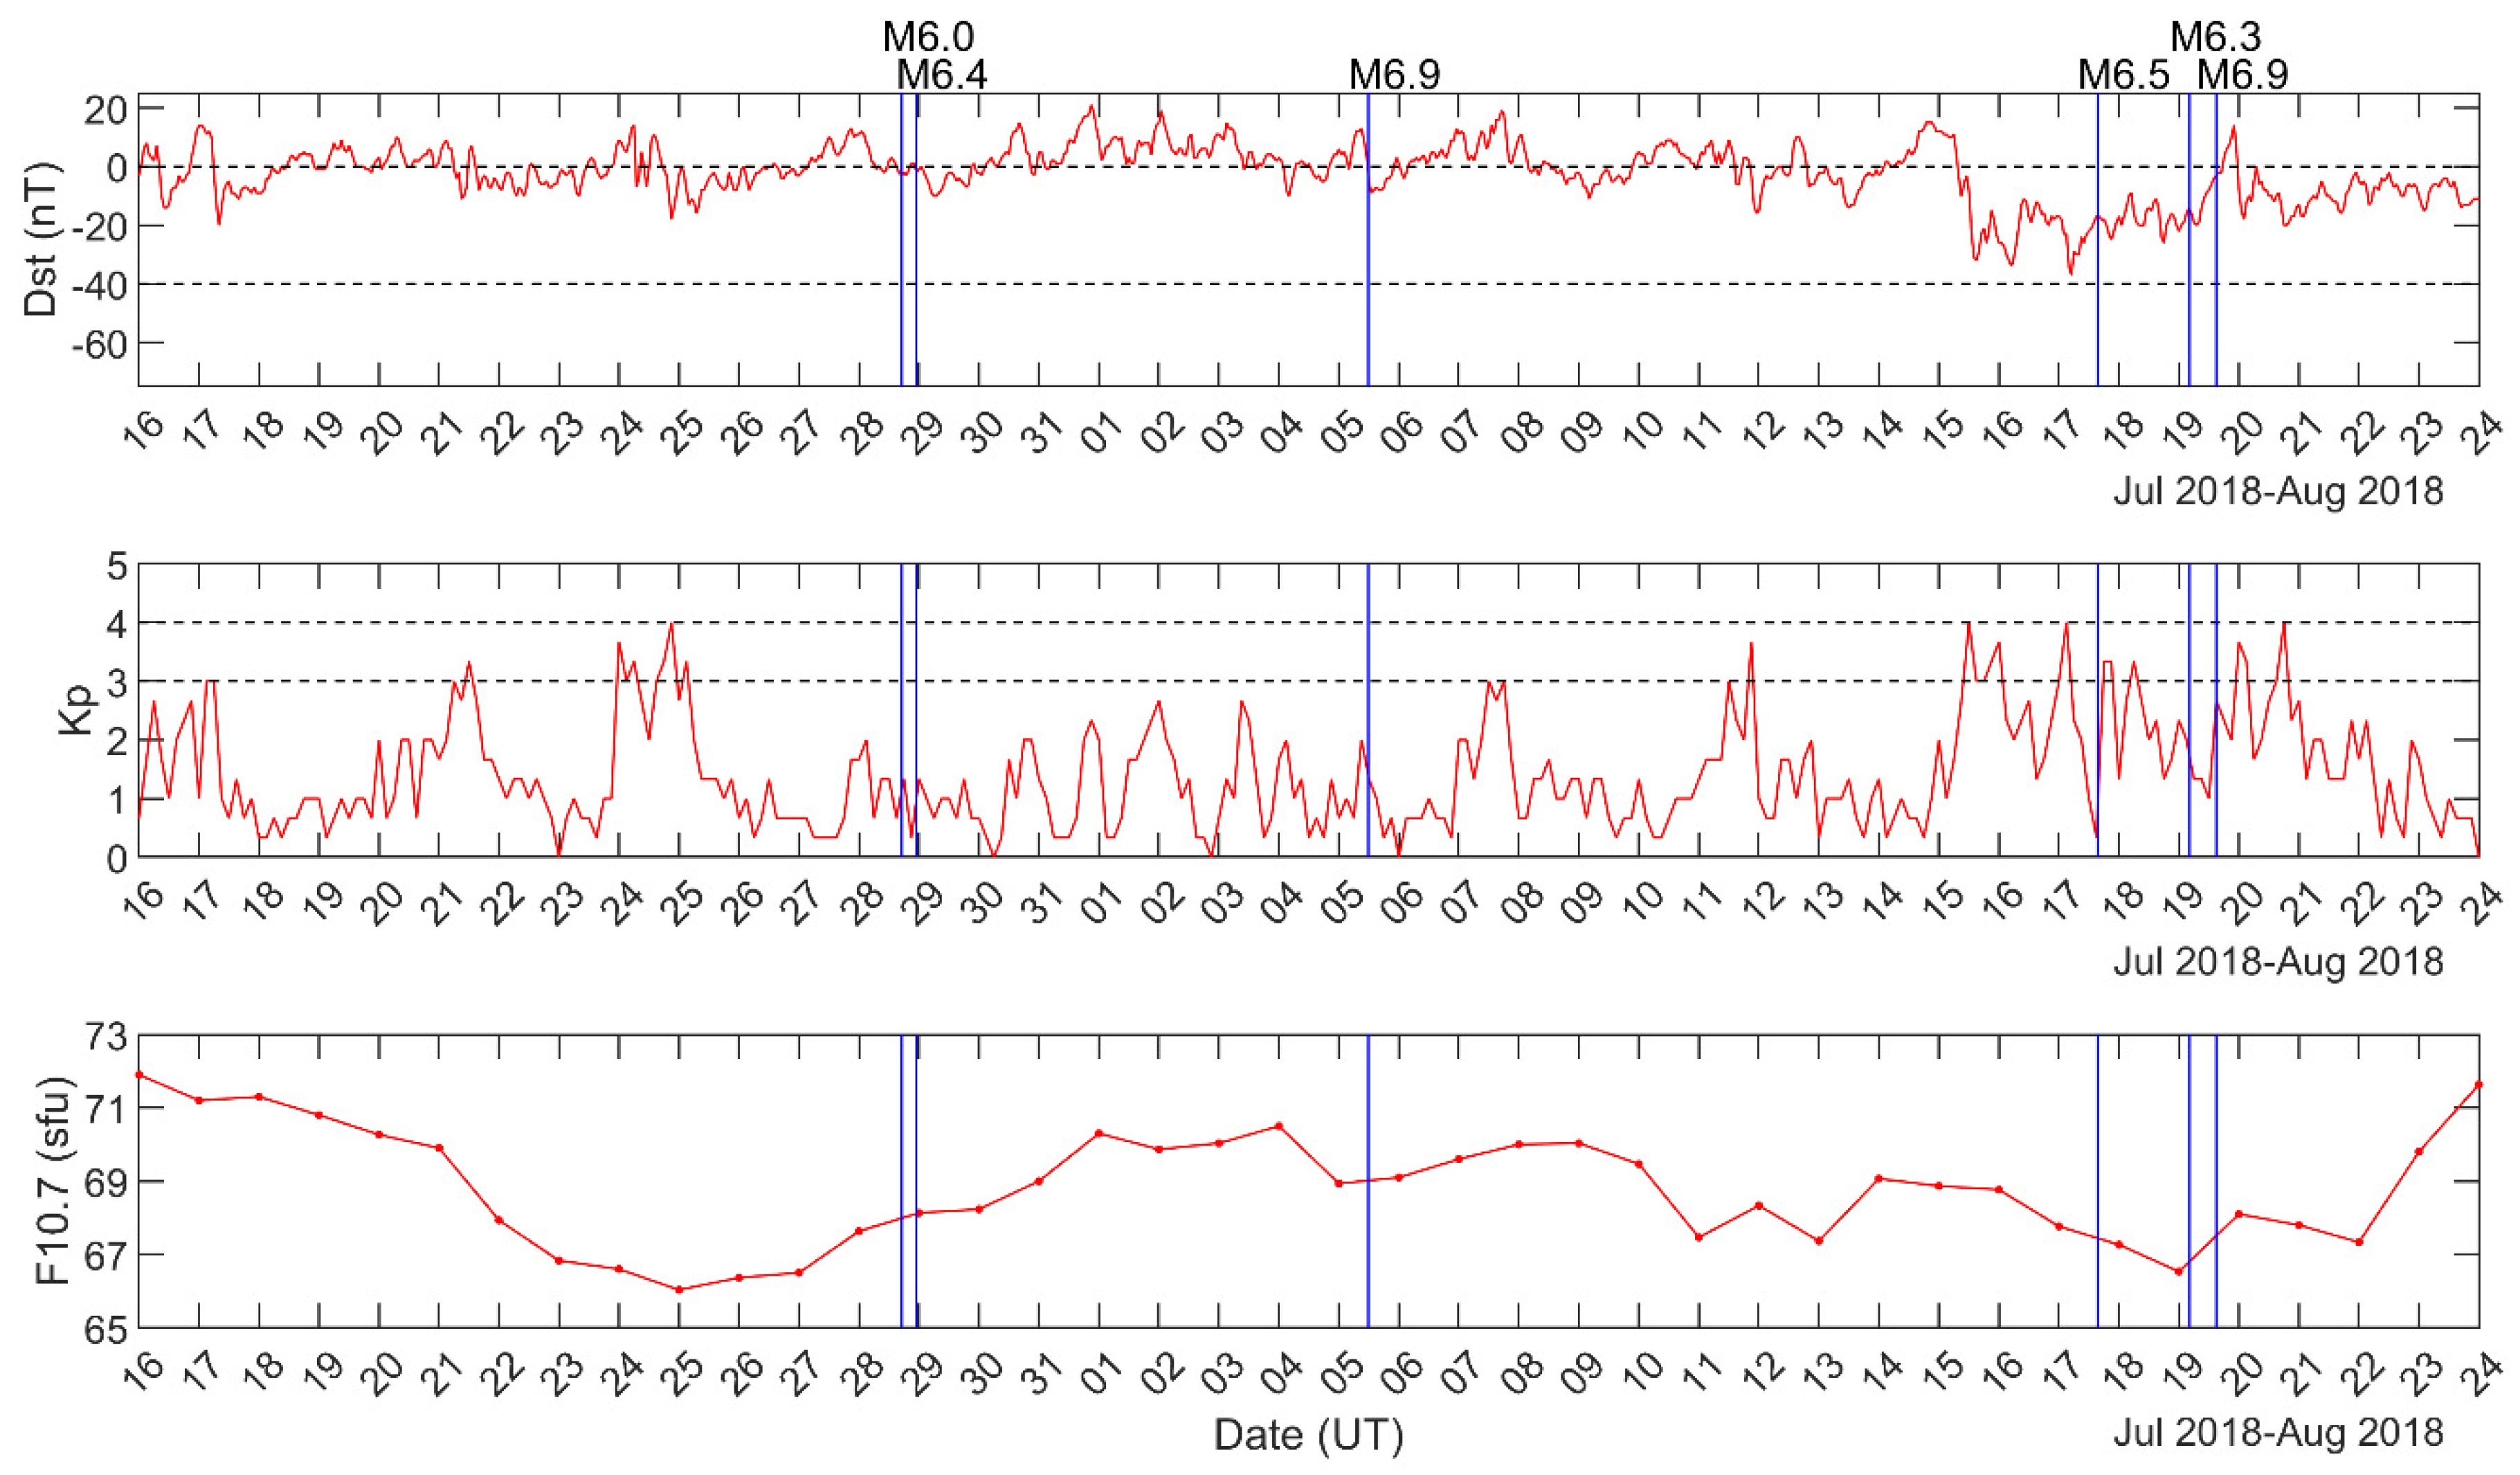
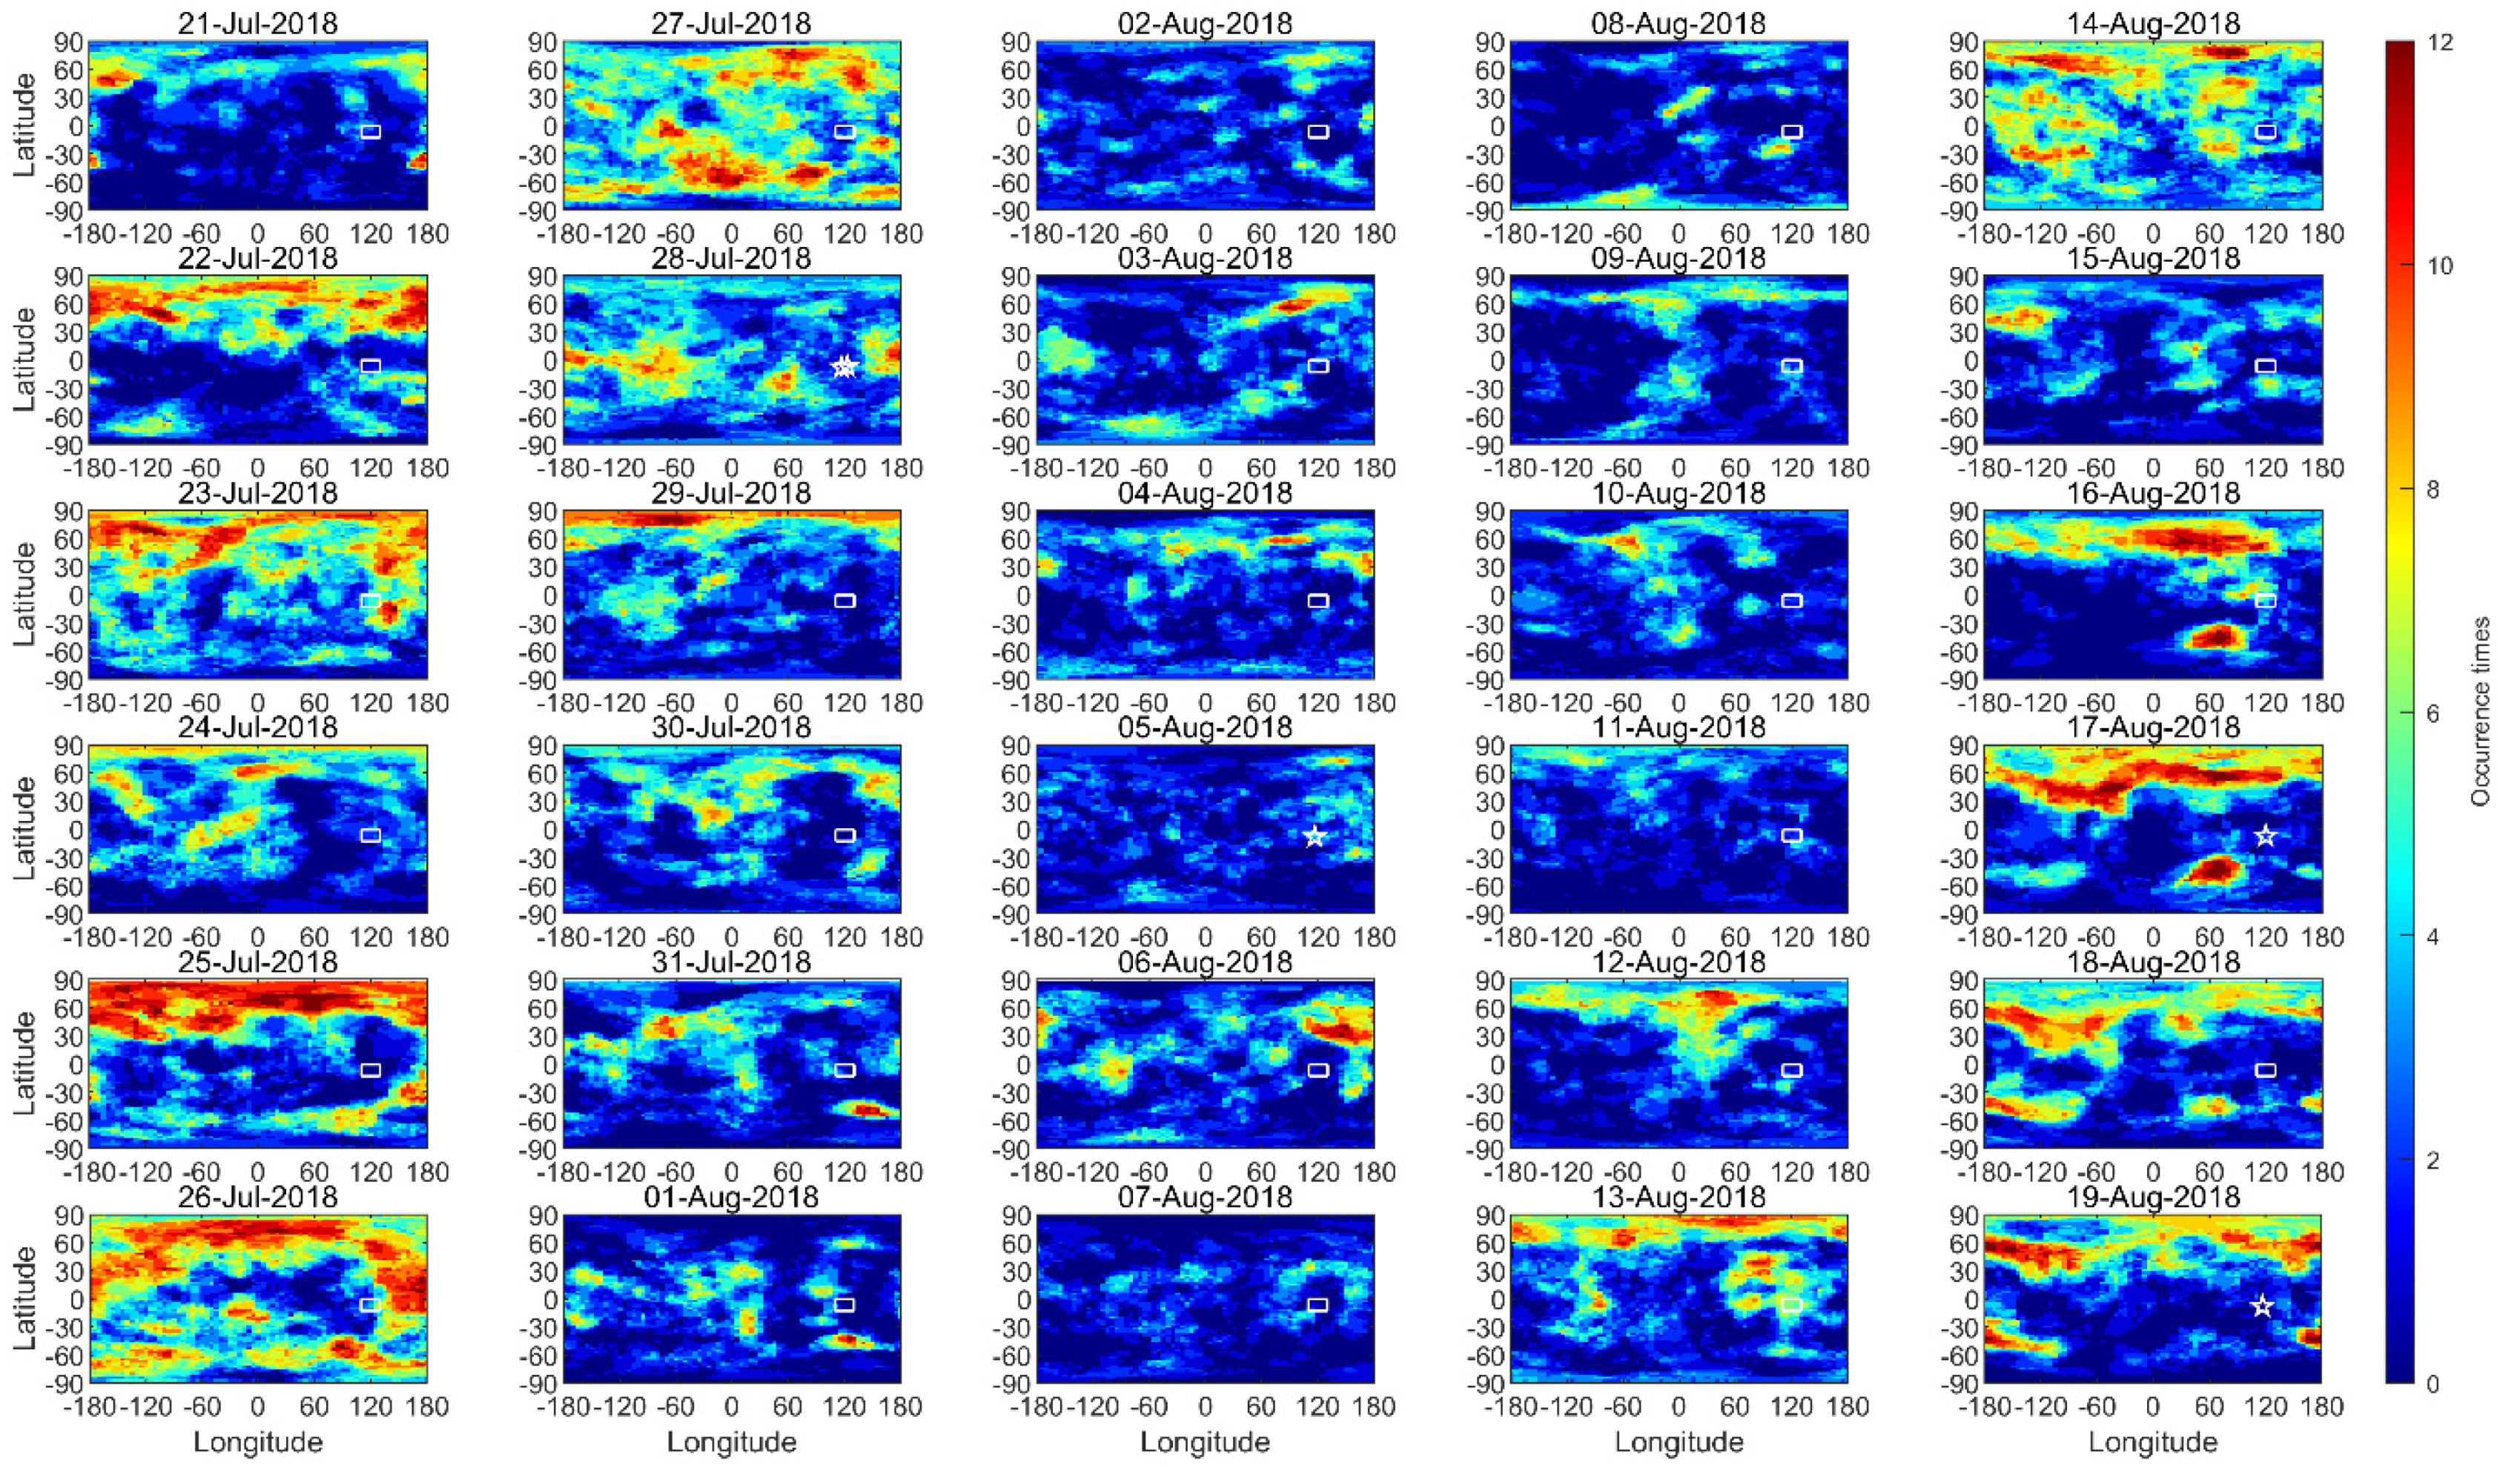
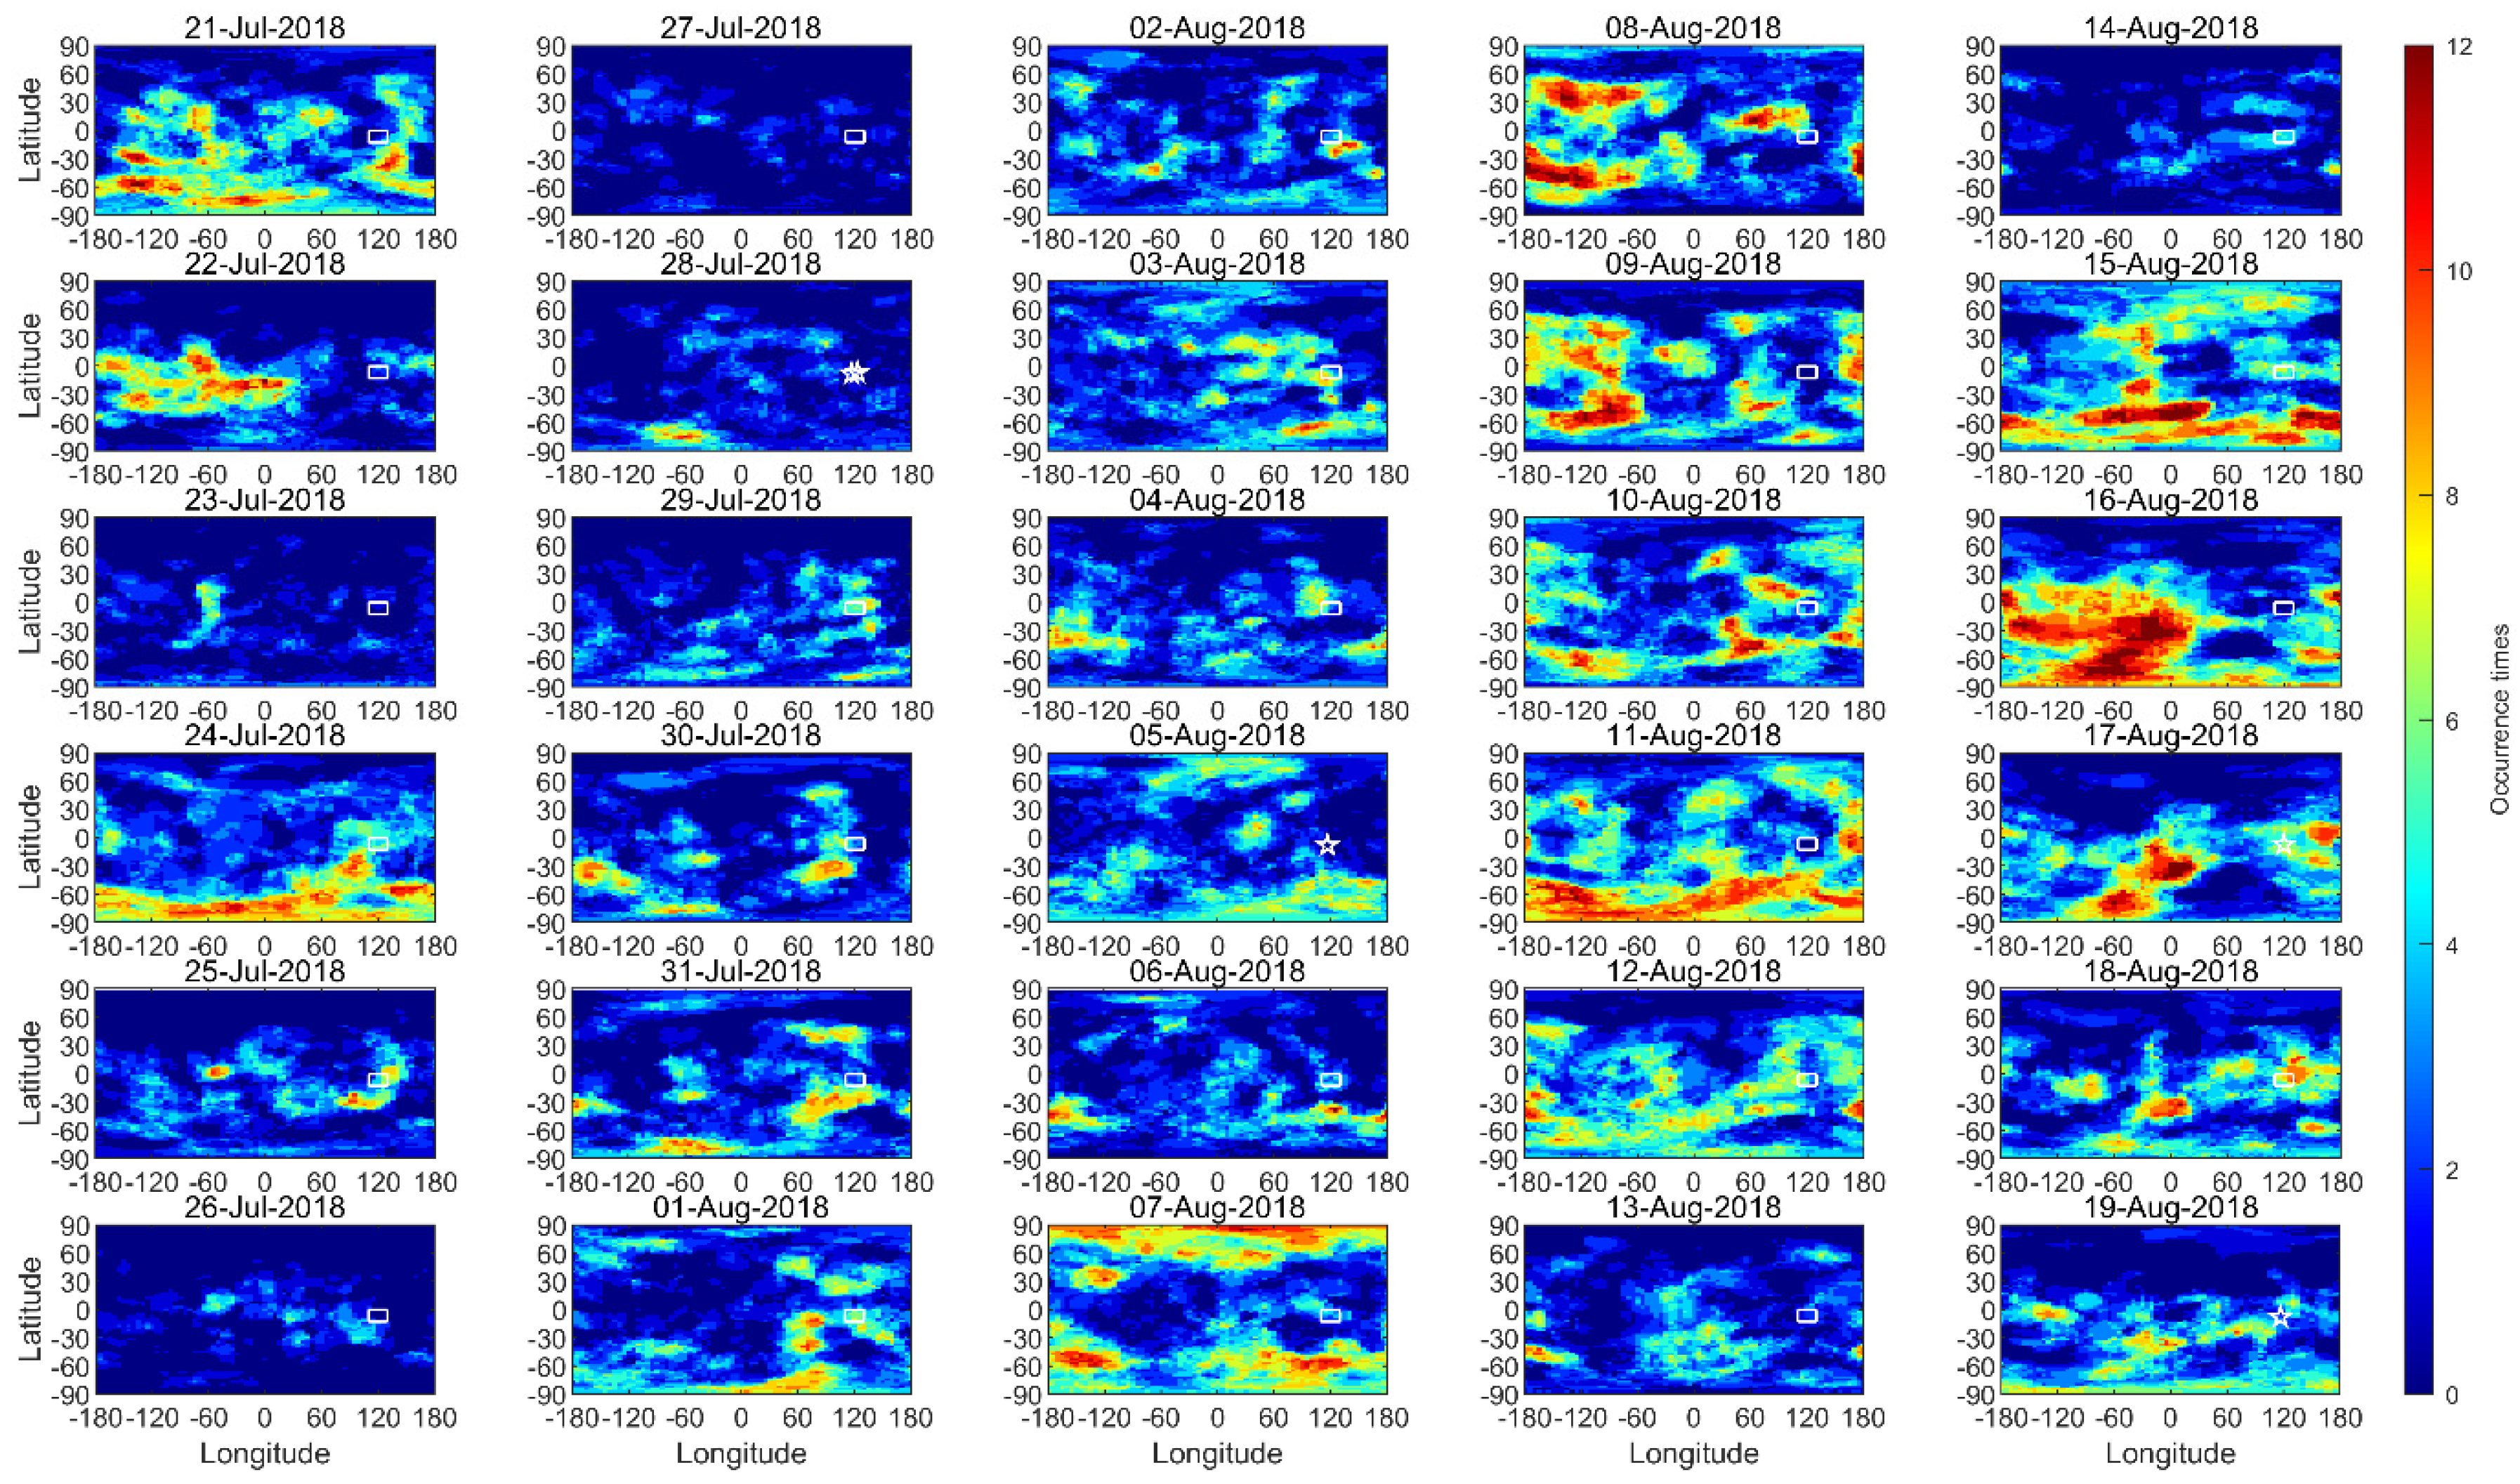
| EQK Number | Total EQK Number | Total Energy Release (erg) | % of Global EQK Number | % of Global Energy Release | ||||
|---|---|---|---|---|---|---|---|---|
| M < 5 | 5 ≤ M < 6 | 6 ≤ M < 7 | 7 ≤ M < 8 | |||||
| All | 7307 | 711 | 58 | 4 | 8080 | 4.40 × 10²³ | 6.54% | 3.43% |
| A | 2652 | 244 | 26 | 1 | 2923 | 1.37 × 10²³ | 2.37% | 1.07% |
| B | 3392 | 343 | 21 | 3 | 3759 | 2.66 × 10²³ | 3.04% | 2.07% |
| C | 1000 | 93 | 10 | 0 | 1103 | 3.26 × 10 22 | 0.89% | 0.25% |
| Region | With Outliers | Without Outliers | ||||
|---|---|---|---|---|---|---|
| Sample Size | rα=0.01 | Max. Daily Energy Release in M | Sample Size | rα=0.01 | Max. Daily Energy Release in M | |
| A | 34–44 | 0.384–0.436 | 6.906–7.000 | 29–37 | 0.418–0.471 | 6.480–6.512 |
| B | 41–52 | 0.354–0.398 | 7.300–7.505 | 35–45 | 0.380–0.430 | 6.201–6.201 |
| C | 14–20 | 0.561–0.661 | 6.429–6.701 | 10–16 | 0.623–0.765 | 6.154–6.200 |
| Min. p | D | Lat. | Long. | r | |||
|---|---|---|---|---|---|---|---|
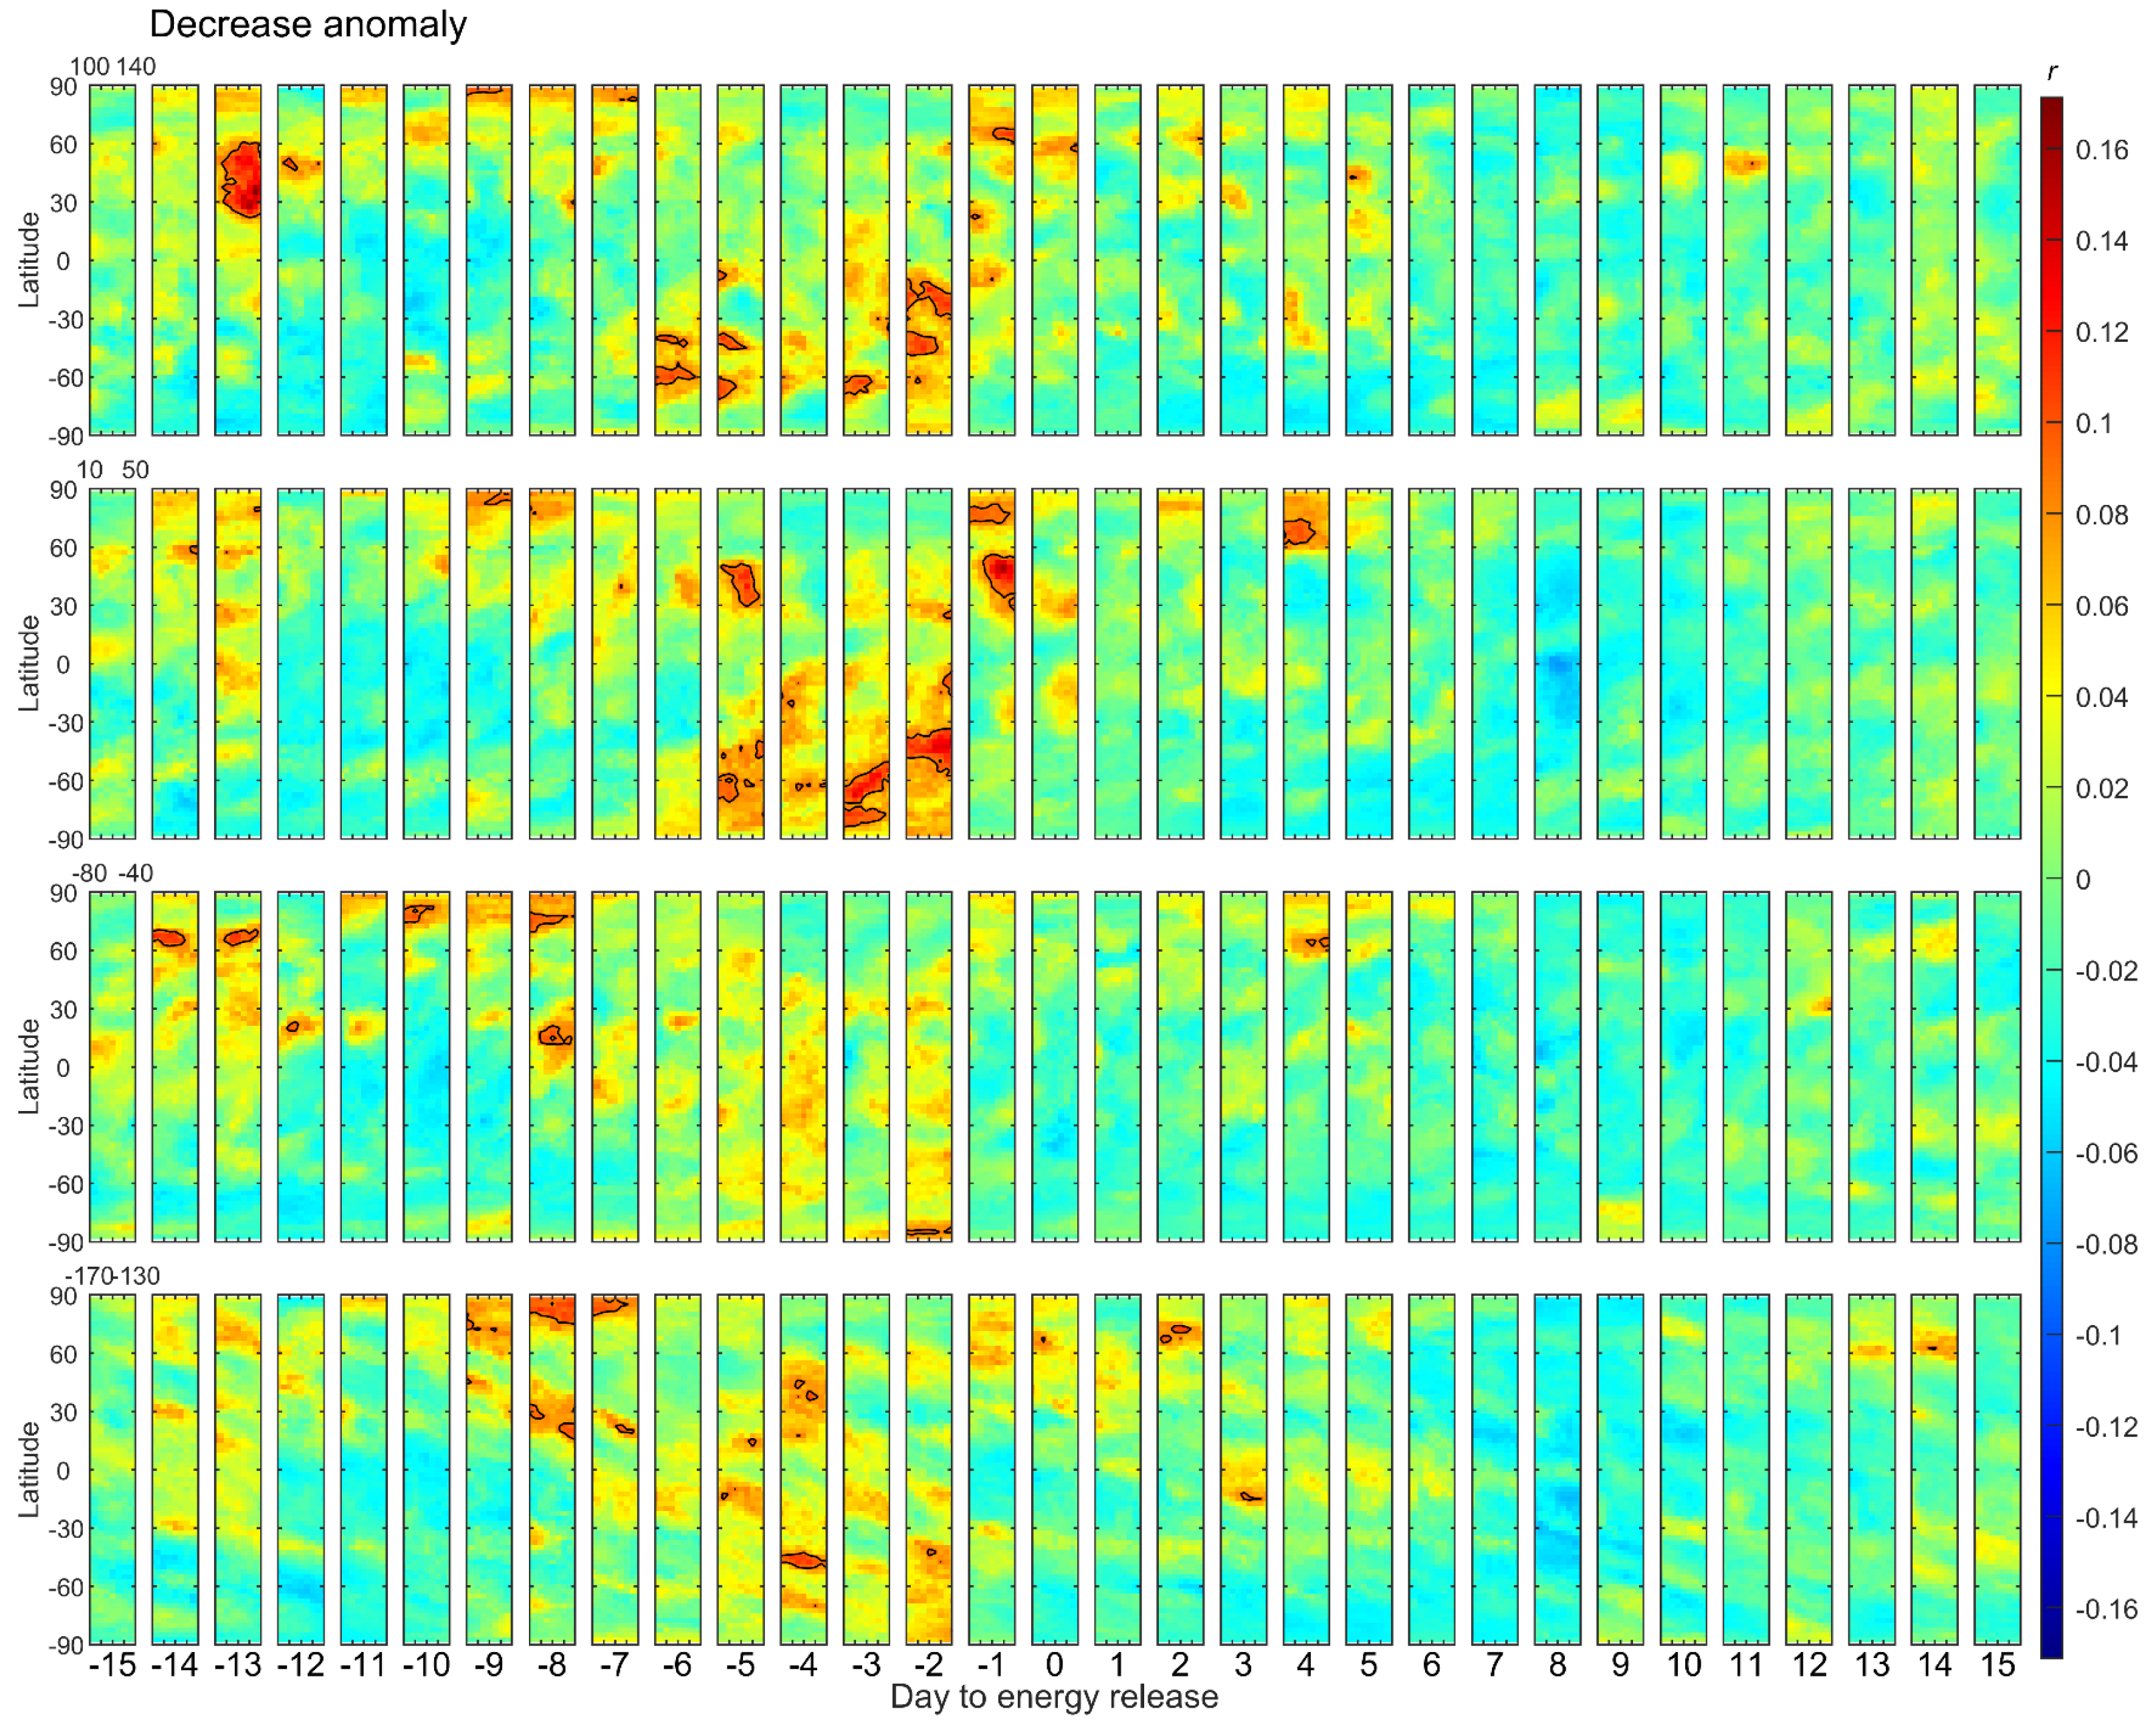
| 110–130 °E (all samples) | Decrease anomaly | 2.025 × 10⁻⁷ | −13 | 35 | 135 | 0.169 * | |
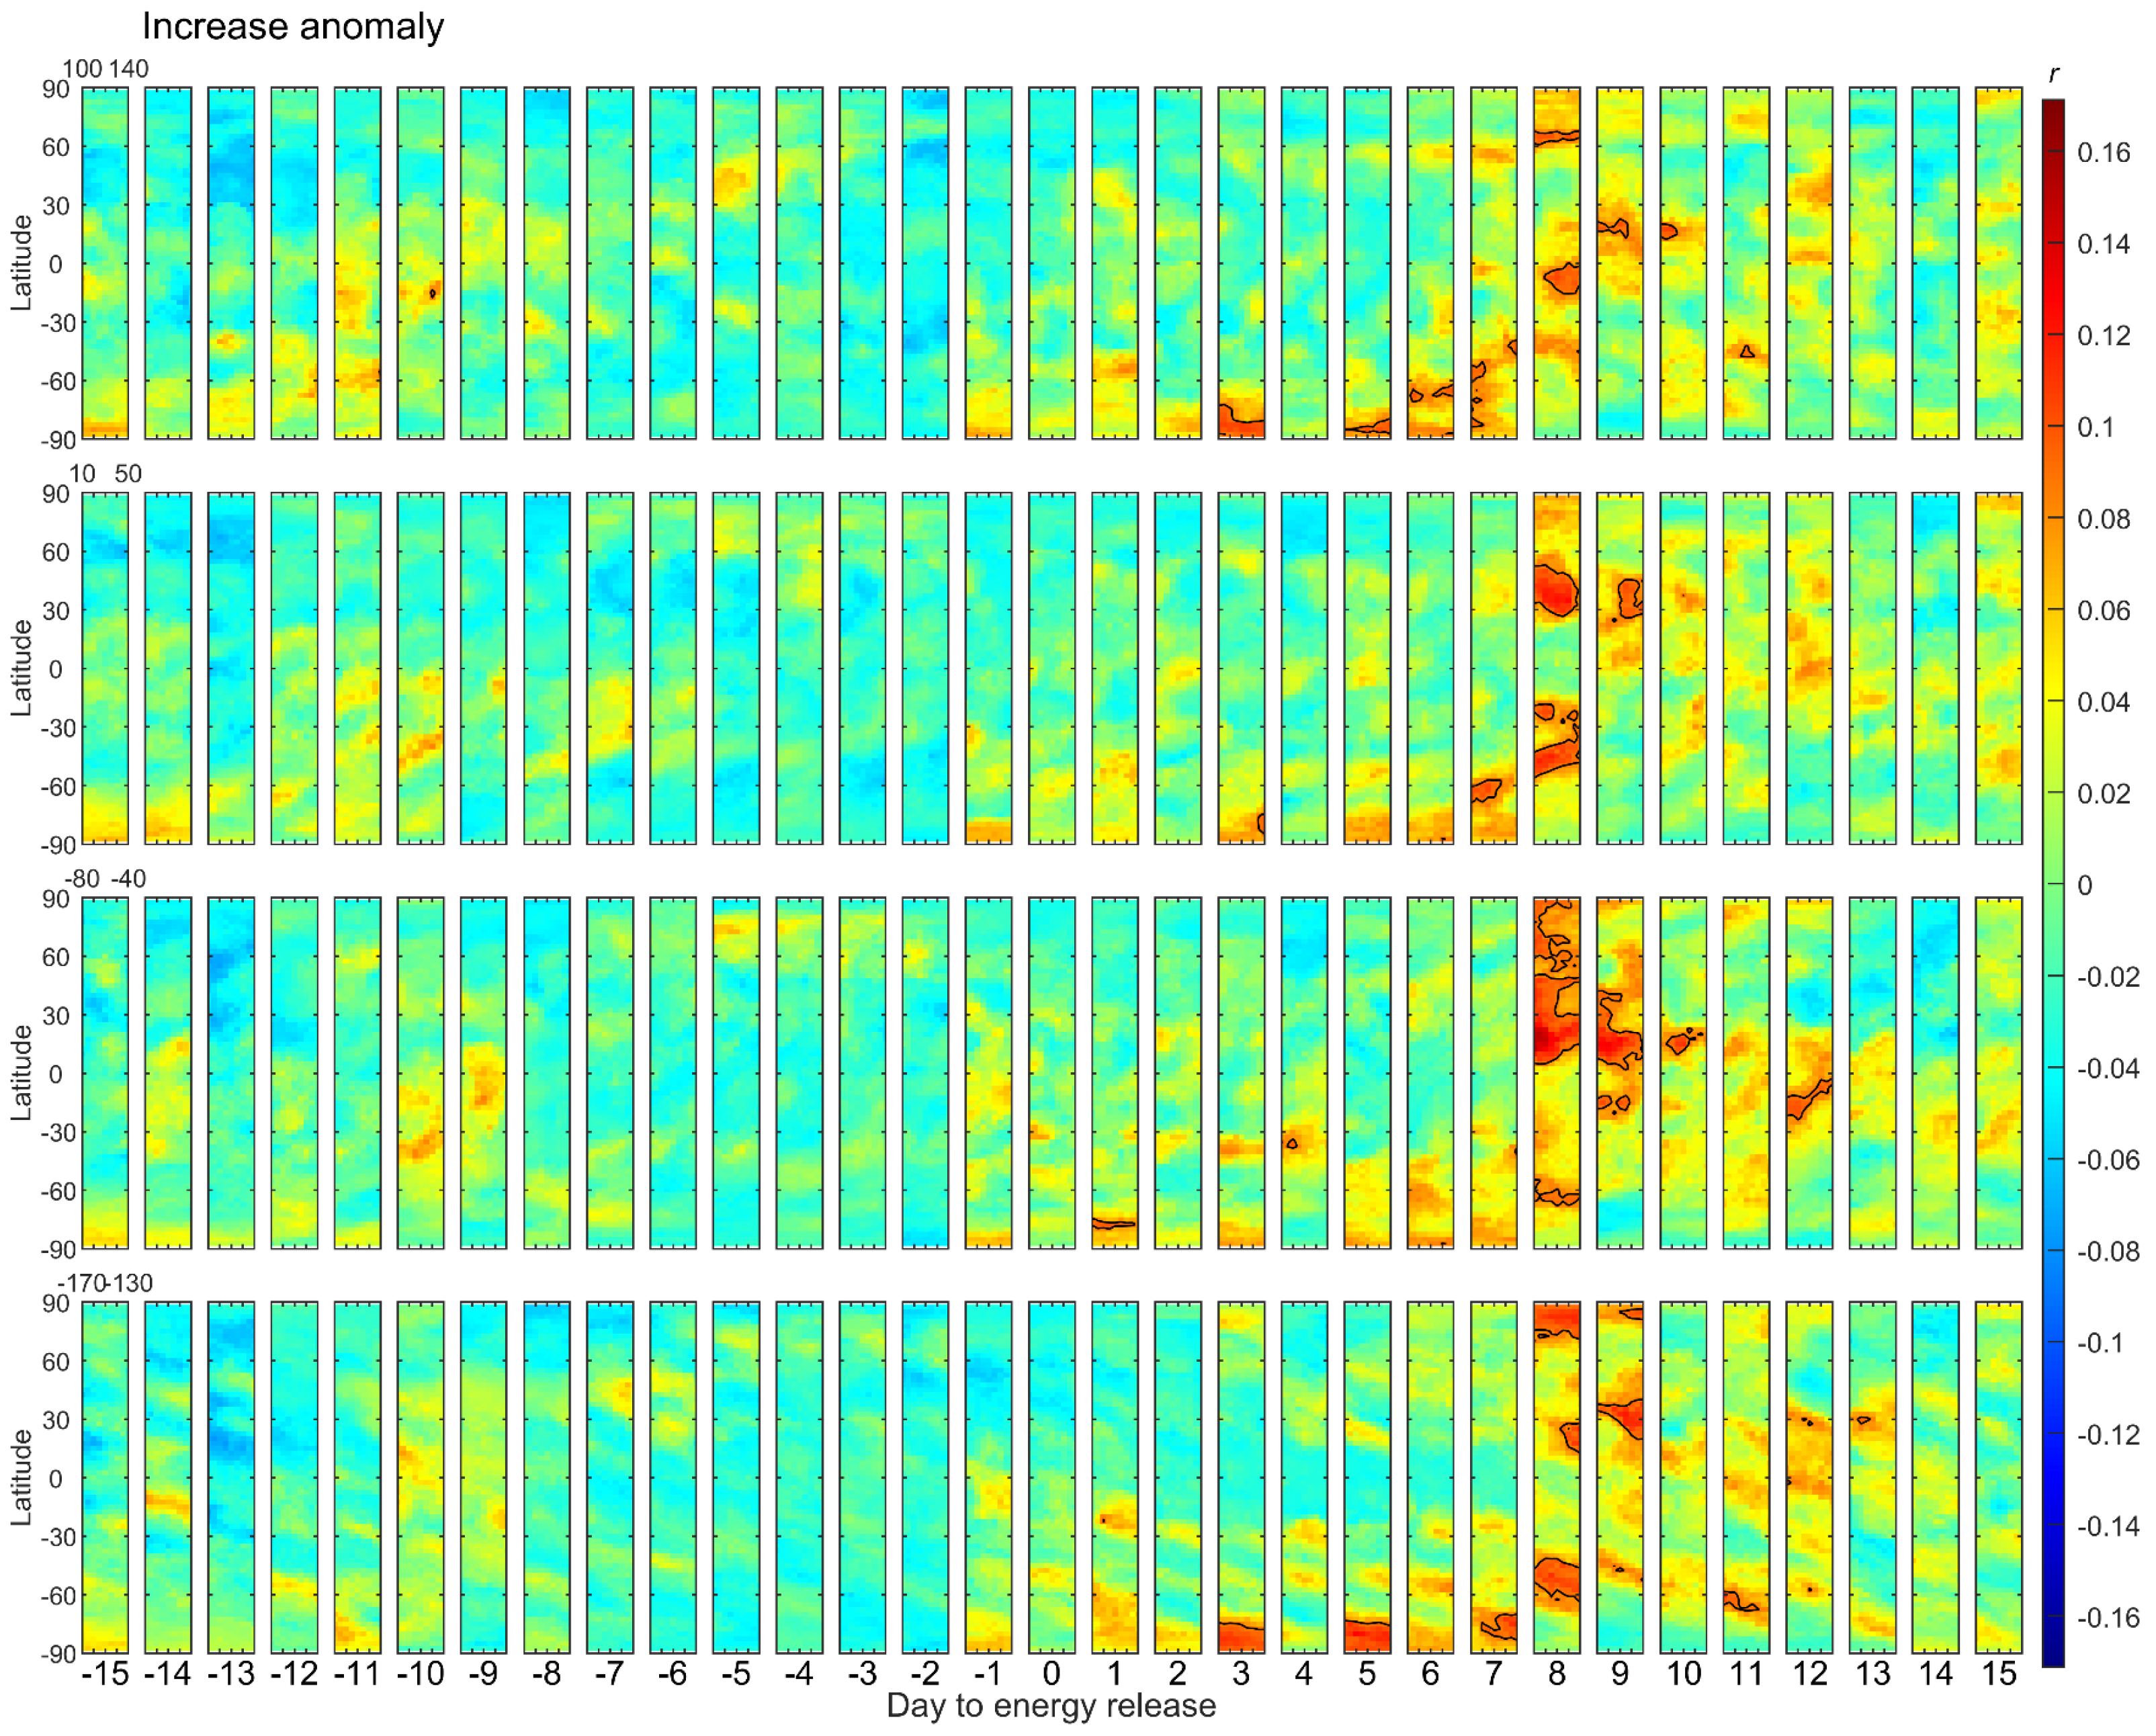
| Increase anomaly | 8.448 × 10⁻⁷ | 8 | 15 | −90 | 0.158 * | ||
| Region A | All samples | Decrease anomaly | 1.382 × 10⁻⁶ | −13 | 30 | 135 | 0.156 * |
| Increase anomaly | 7.497 × 10⁻⁶ | −15 | −87.5 | 30 | 0.144 * | ||
| E ≥ M5.5 | Decrease anomaly | 8.411 × 10⁻⁹ | −13 | 32.5 | 125 | 0.750 * | |
| Increase anomaly | 8.951 × 10⁻⁶ | 9 | −12.5 | 70 | 0.650 * | ||
| E ≥ M5.5 and outliers removed | Decrease anomaly | 4.617 × 10⁻⁸ | 3 | −45 | 165 | 0.764 * | |
| Increase anomaly | 1.741 × 10⁻⁵ | −12 | 55 | 40 | 0.633 * | ||
| Region B | All samples | Decrease anomaly | 1.753 × 10⁻⁵ | −5 | −70 | 95 | 0.138 * |
| Increase anomaly | 1.136 × 10⁻⁶ | 9 | 15 | −70 | 0.156 * | ||
| E ≥ M5.5 | Decrease anomaly | 2.295 × 10⁻⁷ | −6 | −40 | 110 | 0.689 * | |
| Increase anomaly | 9.674 × 10⁻⁷ | 8 | 62.5 | −100 | 0.637 * | ||
| E ≥ M5.5 and outliers removed | Decrease anomaly | 1.641 × 10⁻⁶ | 1 | −77.5 | 50 | 0.669 * | |
| Increase anomaly | 4.097 × 10⁻⁵ | 10 | 7.5 | −160 | 0.553 | ||
| Region C | All samples | Decrease anomaly | 6.410 × 10⁻⁹ | 15 | −35 | 140 | 0.187 * |
| Increase anomaly | 1.171 × 10⁻⁶ | 2 | −5 | 90 | 0.156 * | ||
| E ≥ M5.5 | Decrease anomaly | 1.454 × 10⁻⁸ | −11 | −35 | 65 | 0.947 * | |
| Increase anomaly | 1.624 × 10⁻⁷ | −3 | 50 | −80 | 0.902 * | ||
| E ≥ M5.5 and outliers removed | Decrease anomaly | 3.089 × 10⁻⁷ | −9 | −50 | −165 | 0.940 | |
| Increase anomaly | 2.102 × 10⁻⁸ | −4 | 85 | −65 | 0.944 | ||
| Min. p | D | Lat. | Long. | r | |||
|---|---|---|---|---|---|---|---|
| Region A | Using Dst index | Decrease anomaly | 2.929 × 10⁻⁵ | 4 | −47.5 | 95 | 0.726 |
| Increase anomaly | 7.909 × 10⁻⁶ | −12 | 55 | 40 | 0.750 | ||
| Using Kp and F107 | Decrease anomaly | 3.391 × 10⁻⁷ | −2 | −20 | 135 | 0.847 * | |
| Increase anomaly | 7.988 × 10⁻⁷ | −11 | 40 | −45 | 0.879 * | ||
| Region B | Using Dst index | Decrease anomaly | 2.716 × 10⁻⁵ | 8 | 52.5 | −15 | 0.677 |
| Increase anomaly | 1.607 × 10⁻⁶ | 10 | 27.5 | 55 | 0.698 * | ||
| Using Kp and F107 | Decrease anomaly | 1.589 × 10⁻⁵ | 2 | −47.5 | −20 | 0.692 | |
| Increase anomaly | 3.129 × 10⁻⁸ | 13 | 5 | 25 | 0.763 * | ||
| Region C | Using Dst index | Decrease anomaly | 1.088 × 10⁻⁷ | −11 | −35 | 10 | 0.959 |
| Increase anomaly | 1.525 × 10⁻⁶ | −4 | 47.5 | −75 | 0.934 | ||
| Using Kp and F107 | Decrease anomaly | 4.741 × 10⁻⁸ | −12 | −50 | −170 | 0.965 | |
| Increase anomaly | 1.236 × 10⁻⁷ | −1 | 17.5 | 105 | 0.968 | ||
| Min. p | D | Lat. | Long. | r | |||
|---|---|---|---|---|---|---|---|
| Region A | Using Dst index | Decrease anomaly | 1.598 × 10⁻⁷ | −13 | 32.5 | 125 | 0.783 |
| Increase anomaly | 6.166 × 10⁻⁵ | −7 | −32.5 | 95 | 0.704 * | ||
| Using Kp and F107 | Decrease anomaly | 4.036 × 10⁻⁶ | −8 | −17.5 | 65 | 0.756 * | |
| Increase anomaly | 7.127 × 10⁻⁷ | 7 | 0 | 95 | 0.823 * | ||
| Region B | Using Dst index | Decrease anomaly | 1.792 × 10⁻⁷ | −4 | −50 | −130 | 0.756 * |
| Increase anomaly | 2.243 × 10⁻⁷ | 8 | −10 | 155 | 0.744 * | ||
| Using Kp and F107 | Decrease anomaly | 1.842 × 10⁻⁷ | −4 | 60 | 35 | 0.706 | |
| Increase anomaly | 7.943 × 10⁻¹⁴ | 13 | 7.5 | −135 | 0.875 * | ||
| Region C | Using Dst index | Decrease anomaly | 4.196 × 10⁻¹⁰ | 15 | −35 | 125 | 0.980 * |
| Increase anomaly | 1.525 × 10⁻⁶ | −4 | 47.5 | −75 | 0.934 | ||
| Using Kp and F107 | Decrease anomaly | 3.849 × 10⁻⁹ | −11 | −30 | 60 | 0.984 | |
| Increase anomaly | 7.780 × 10⁻⁹ | 0 | 7.5 | −145 | 0.988 * | ||
Publisher’s Note: MDPI stays neutral with regard to jurisdictional claims in published maps and institutional affiliations. |
© 2022 by the authors. Licensee MDPI, Basel, Switzerland. This article is an open access article distributed under the terms and conditions of the Creative Commons Attribution (CC BY) license (https://creativecommons.org/licenses/by/4.0/).
Share and Cite
Su, Y.-C.; Sha, J. A Study of Possible Correlations between Seismo-Ionospheric Anomalies of GNSS Total Electron Content and Earthquake Energy. Remote Sens. 2022, 14, 1155. https://doi.org/10.3390/rs14051155
Su Y-C, Sha J. A Study of Possible Correlations between Seismo-Ionospheric Anomalies of GNSS Total Electron Content and Earthquake Energy. Remote Sensing. 2022; 14(5):1155. https://doi.org/10.3390/rs14051155
Chicago/Turabian StyleSu, Yung-Chih, and Jinming Sha. 2022. "A Study of Possible Correlations between Seismo-Ionospheric Anomalies of GNSS Total Electron Content and Earthquake Energy" Remote Sensing 14, no. 5: 1155. https://doi.org/10.3390/rs14051155
APA StyleSu, Y.-C., & Sha, J. (2022). A Study of Possible Correlations between Seismo-Ionospheric Anomalies of GNSS Total Electron Content and Earthquake Energy. Remote Sensing, 14(5), 1155. https://doi.org/10.3390/rs14051155


