
Predicting Canopy Chlorophyll Content in Sugarcane Crops Using Machine Learning Algorithms and Spectral Vegetation Indices Derived from UAV Multispectral Imagery

 ,
,  , , ,
, , ,
Abstract
:
1. Introduction
1.1. Application of Remote Sensing on Sugarcane Crops
1.2. Machine Learning for Crop Health and Chlorophyll Content
2. Methodology
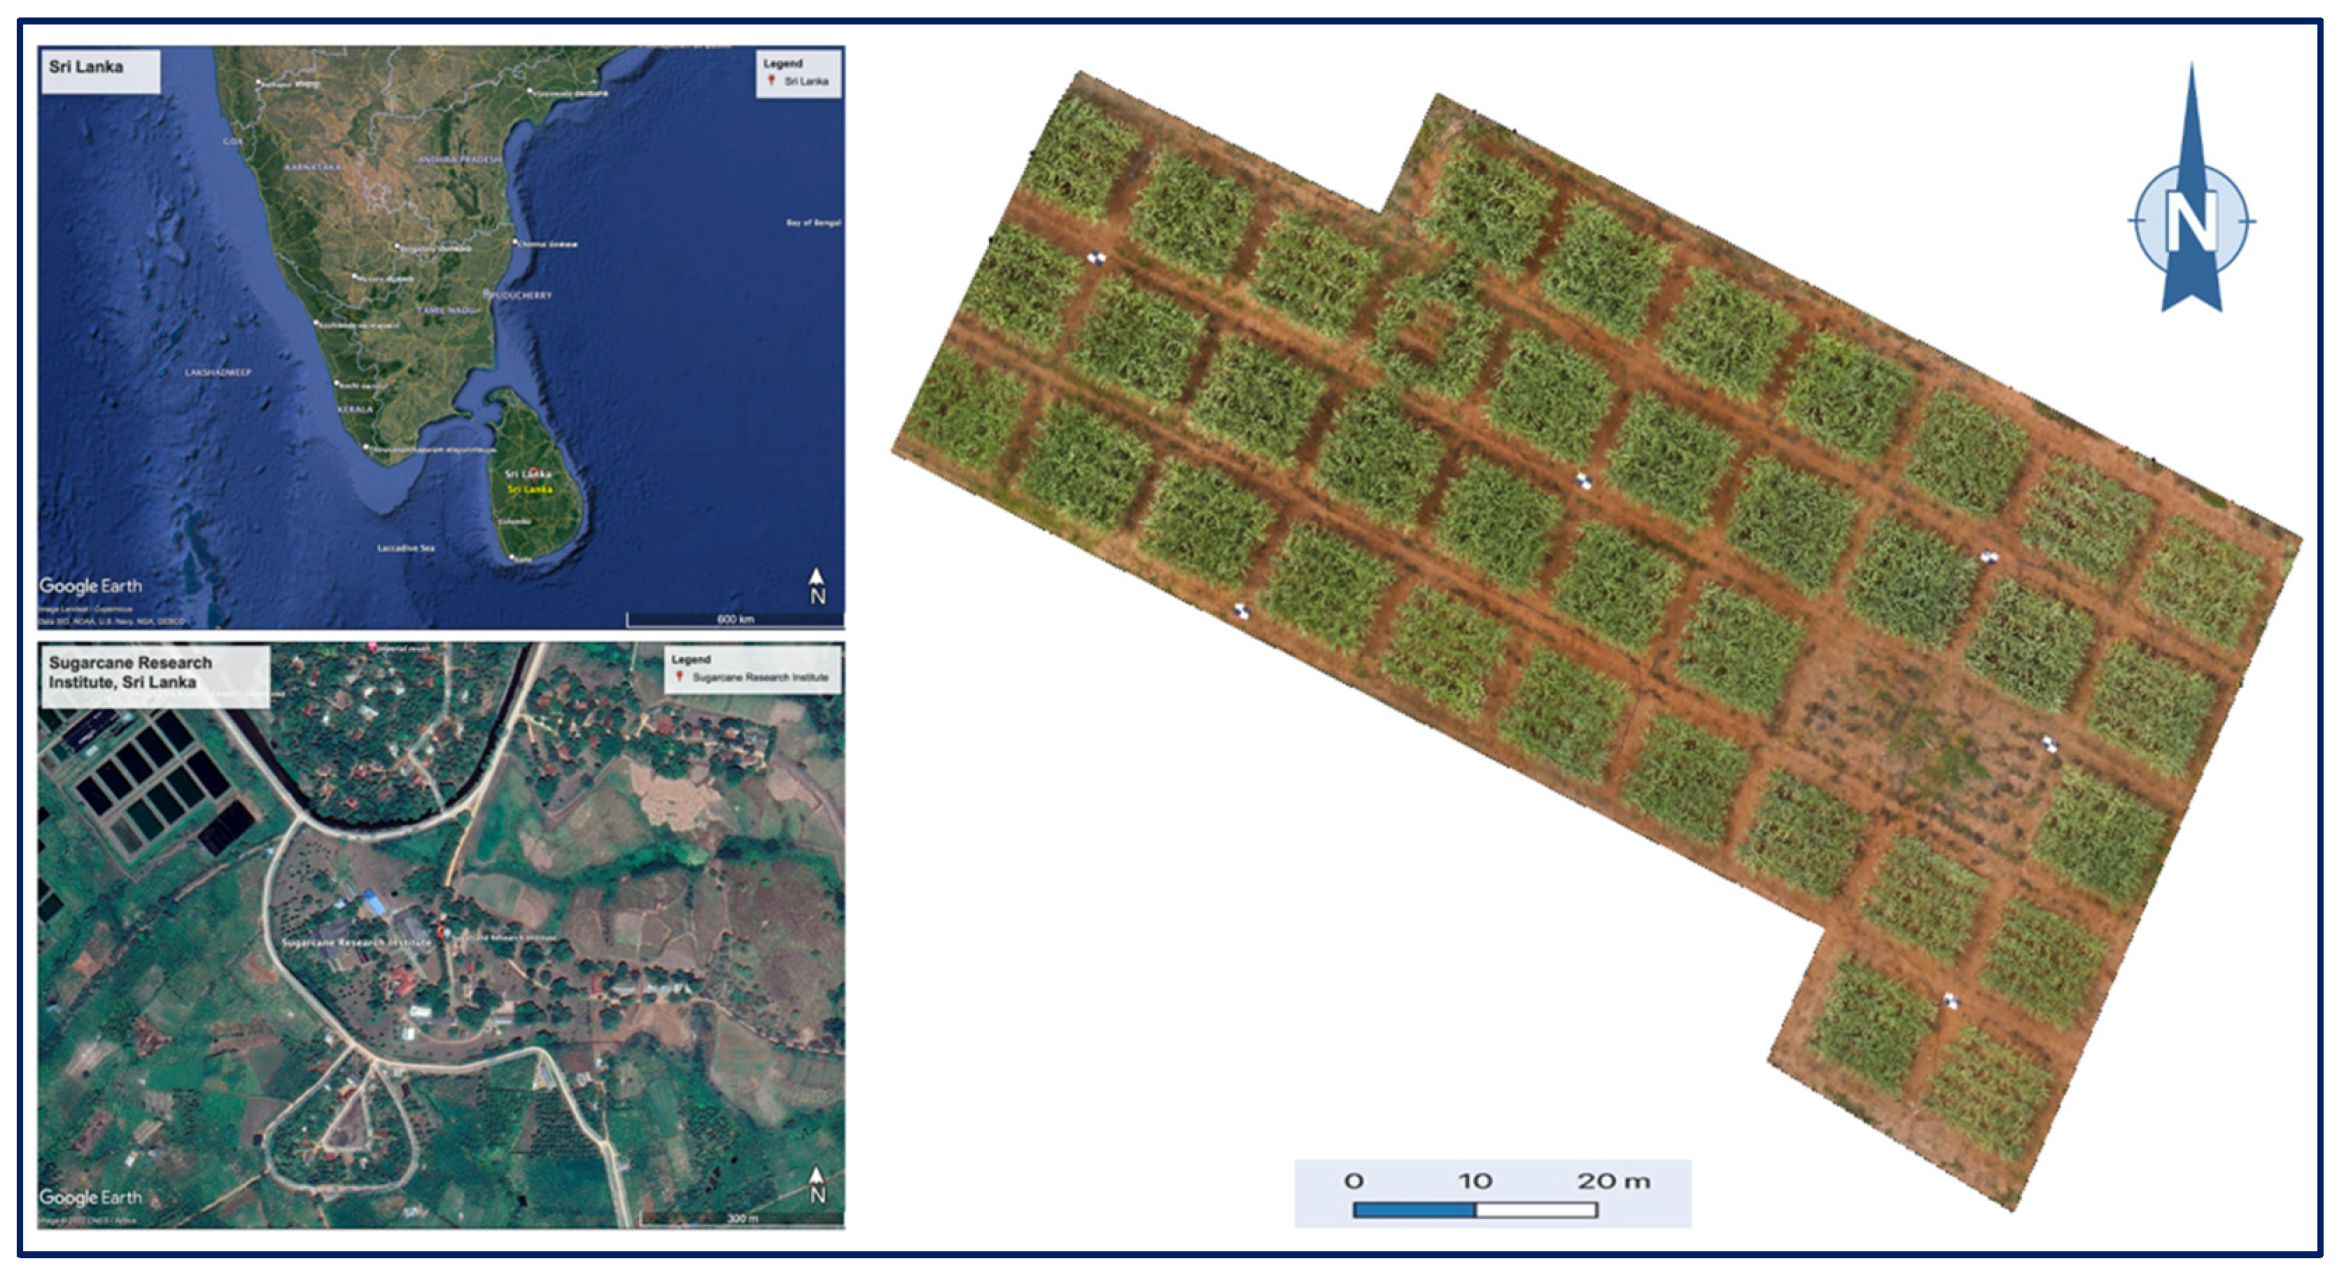
2.1. Study Site
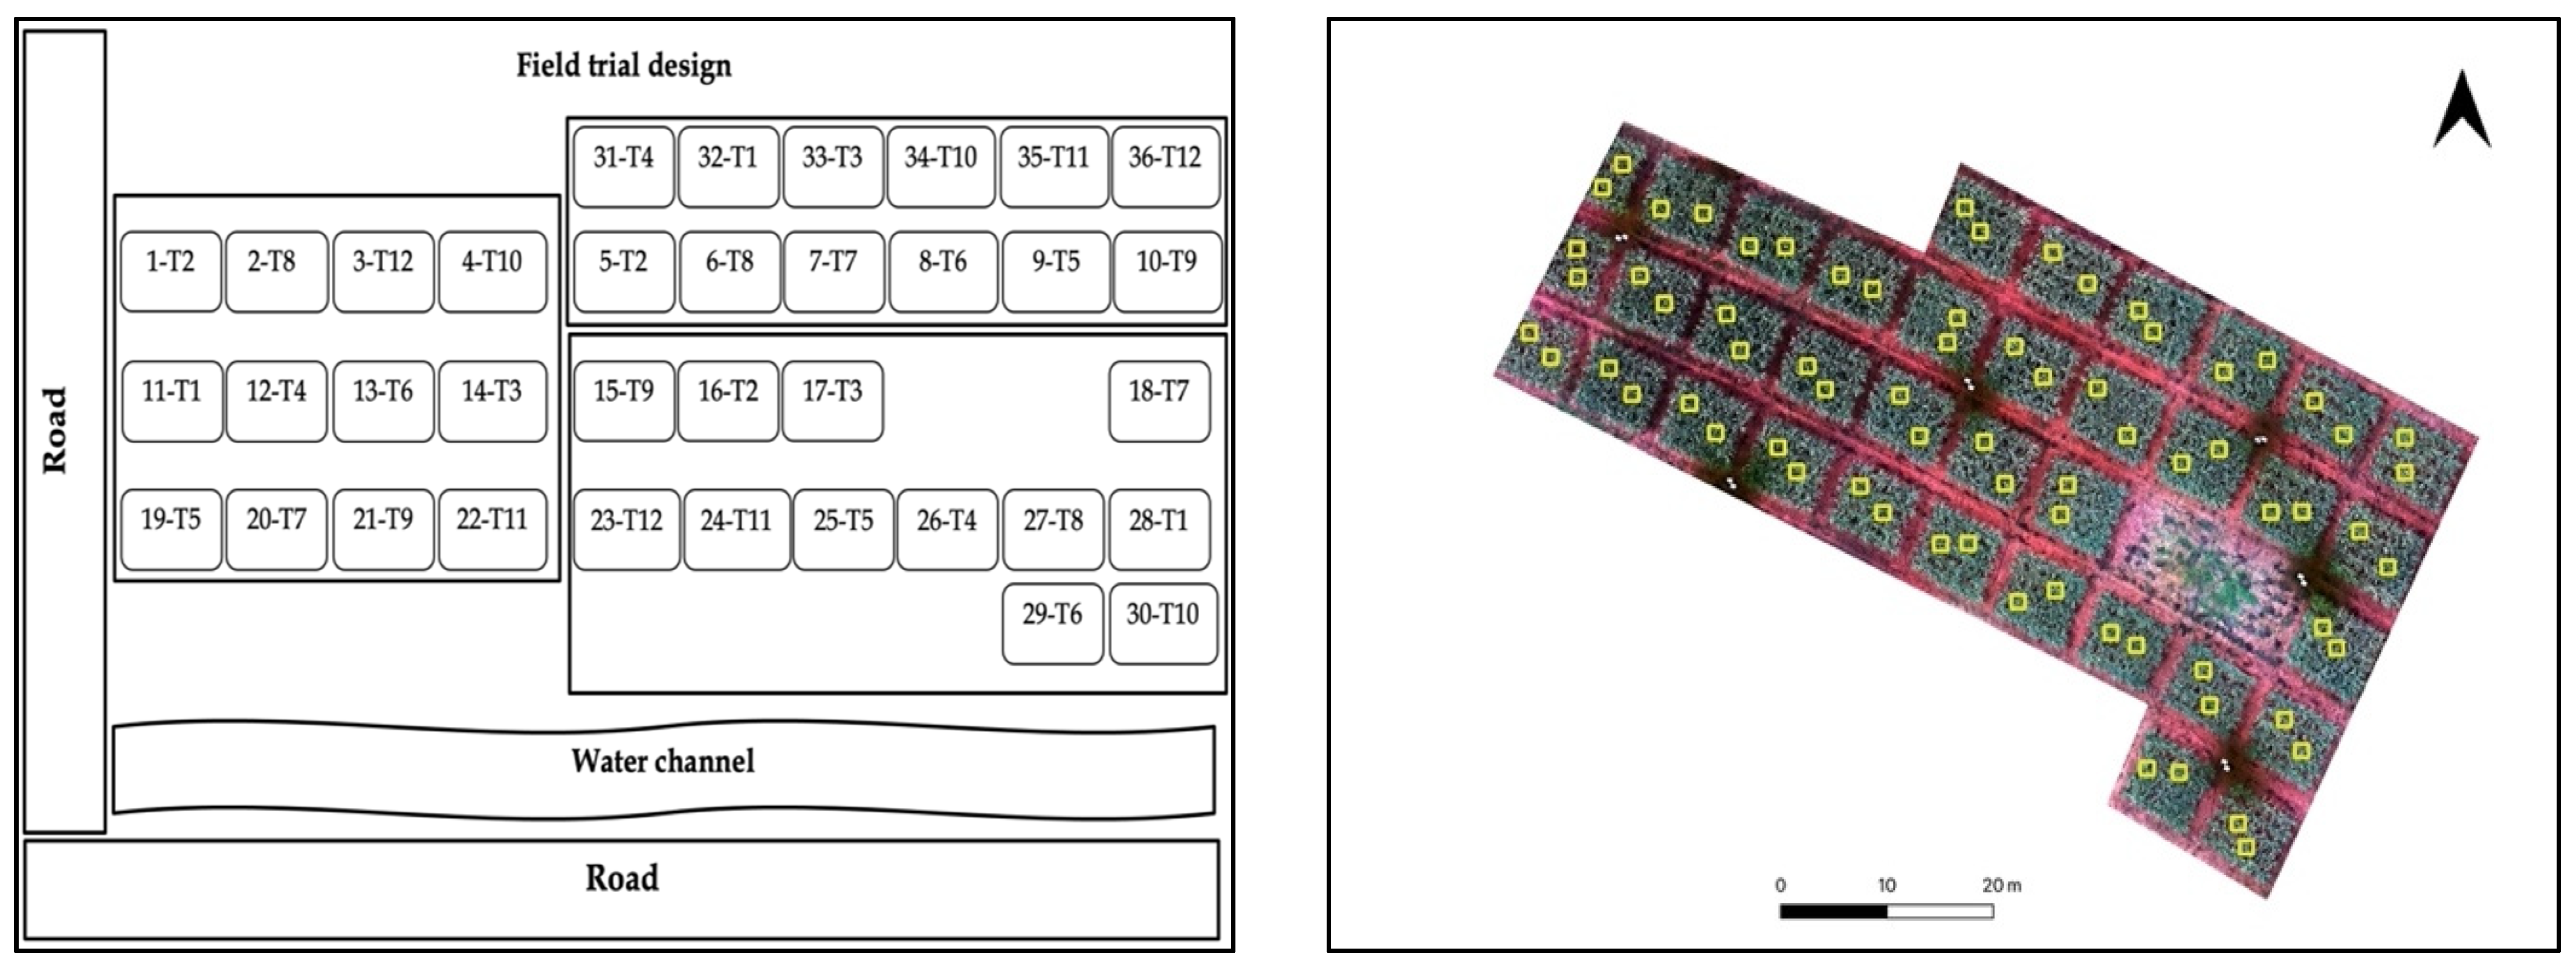
2.2. Experimental Design
2.3. Ground Truth Data Collection
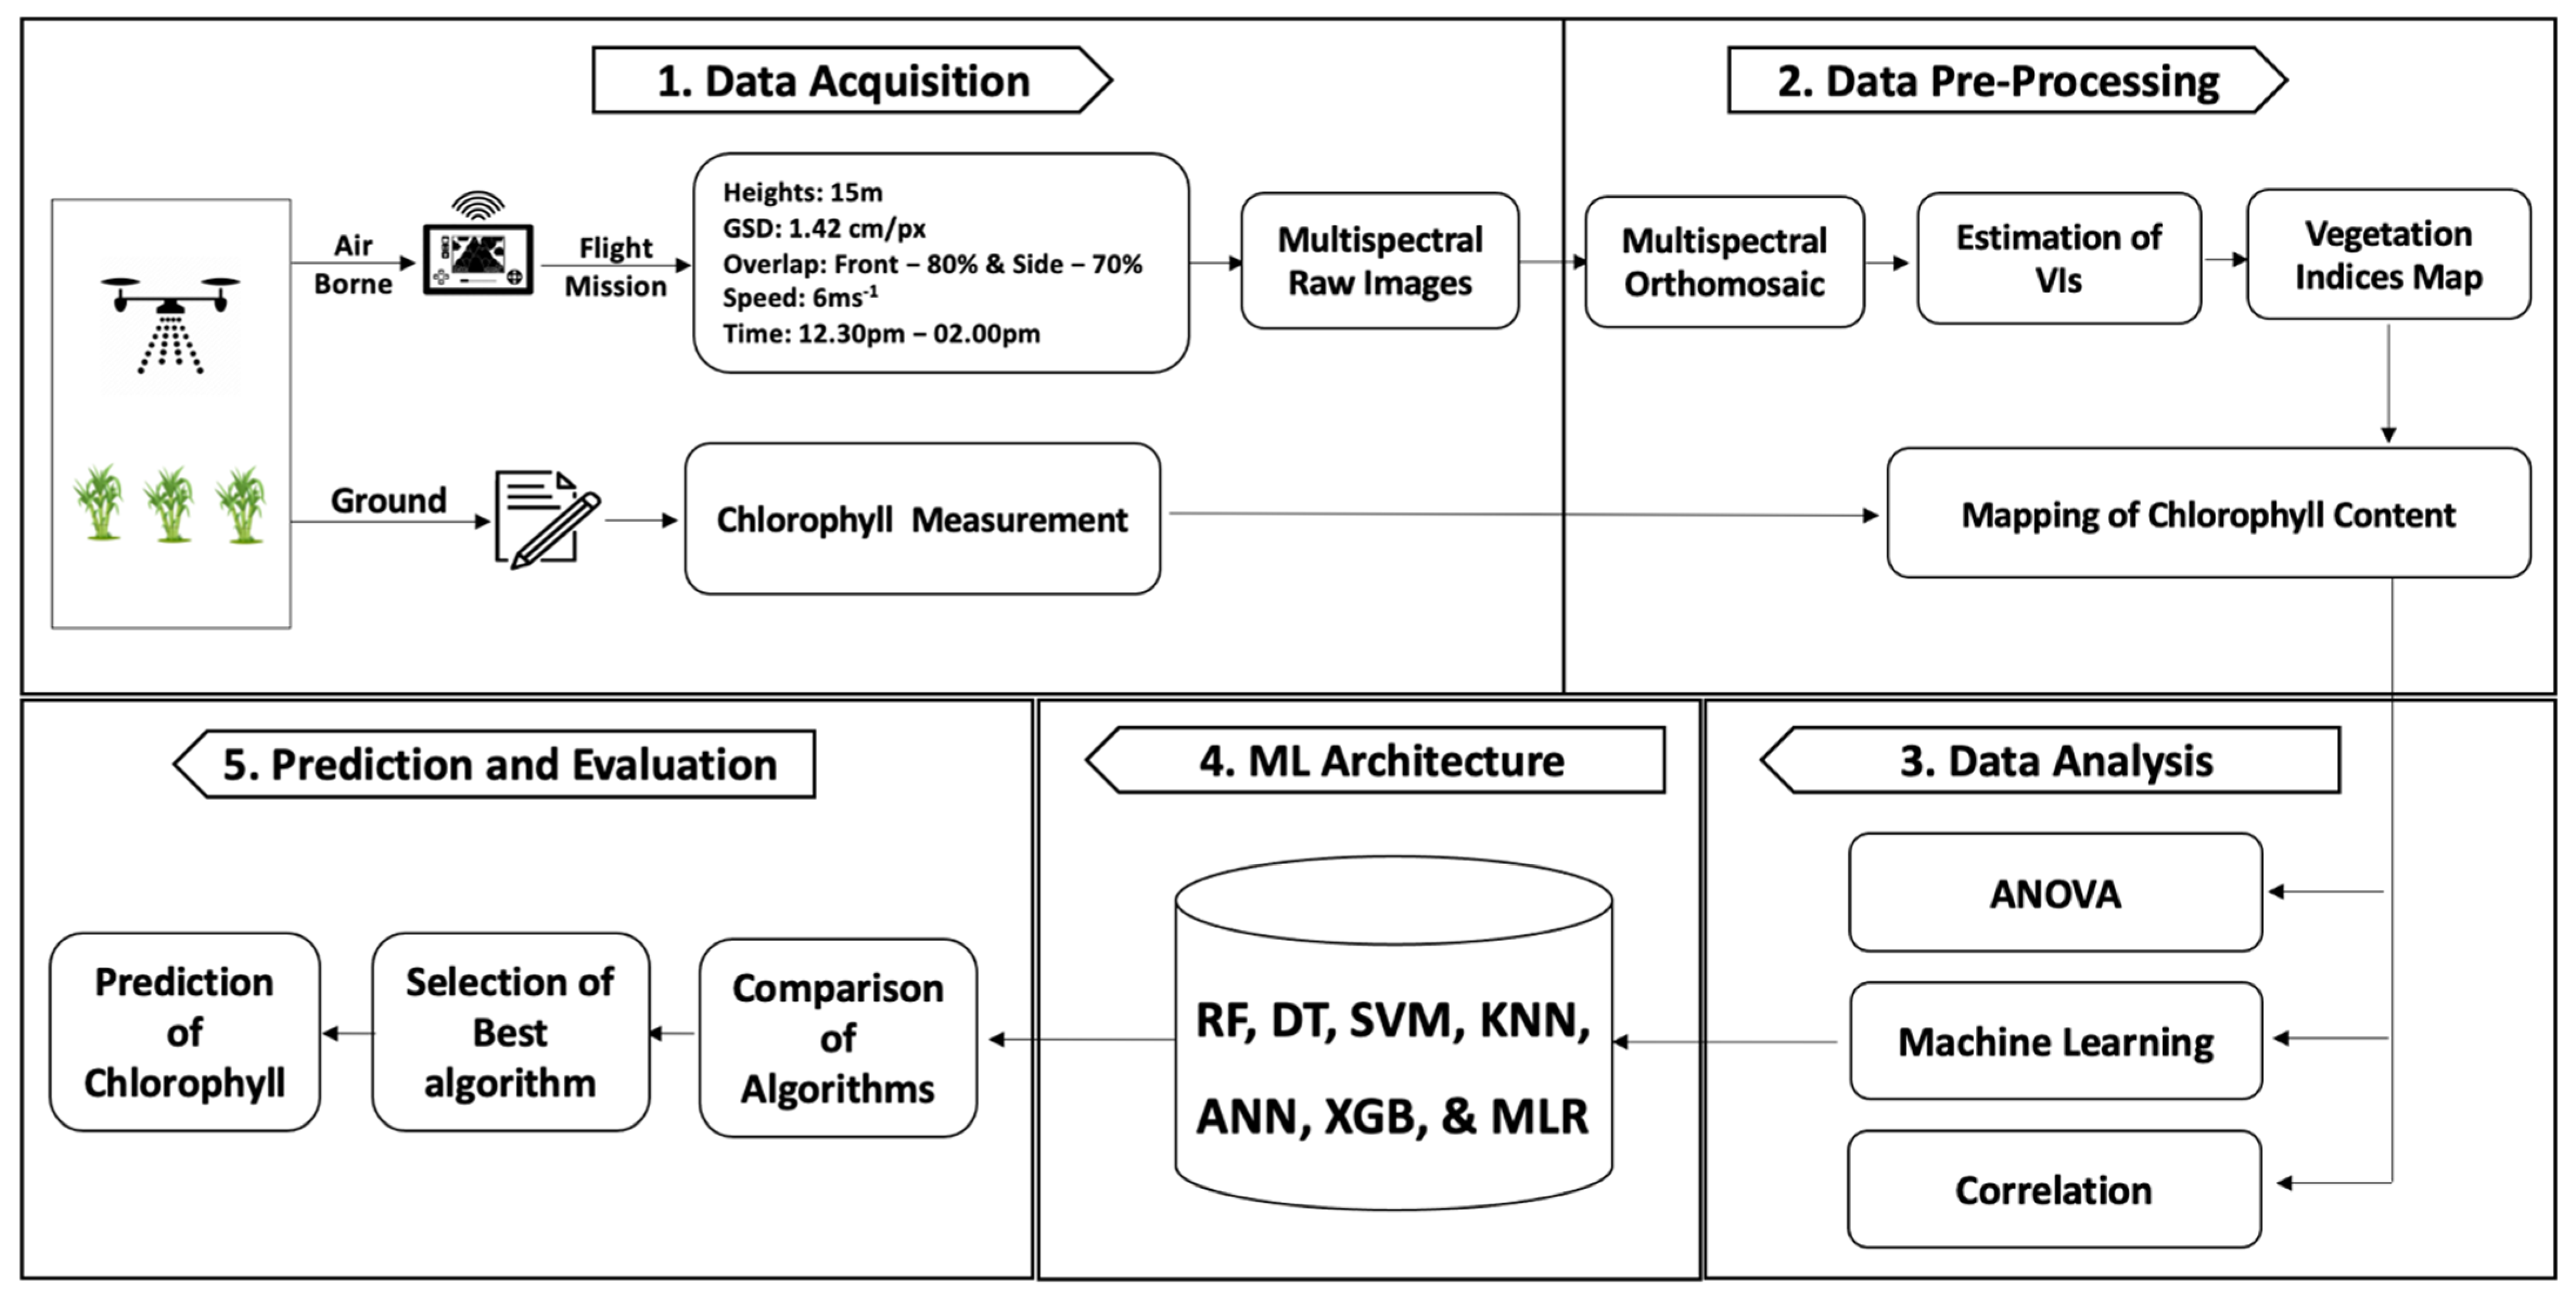
2.4. Acquisition and Preprocessing of UAV Multispectral Images
2.5. Estimation of Vegetation Indices
2.6. Machine Learning Modelling and Statistical Analysis
3. Results
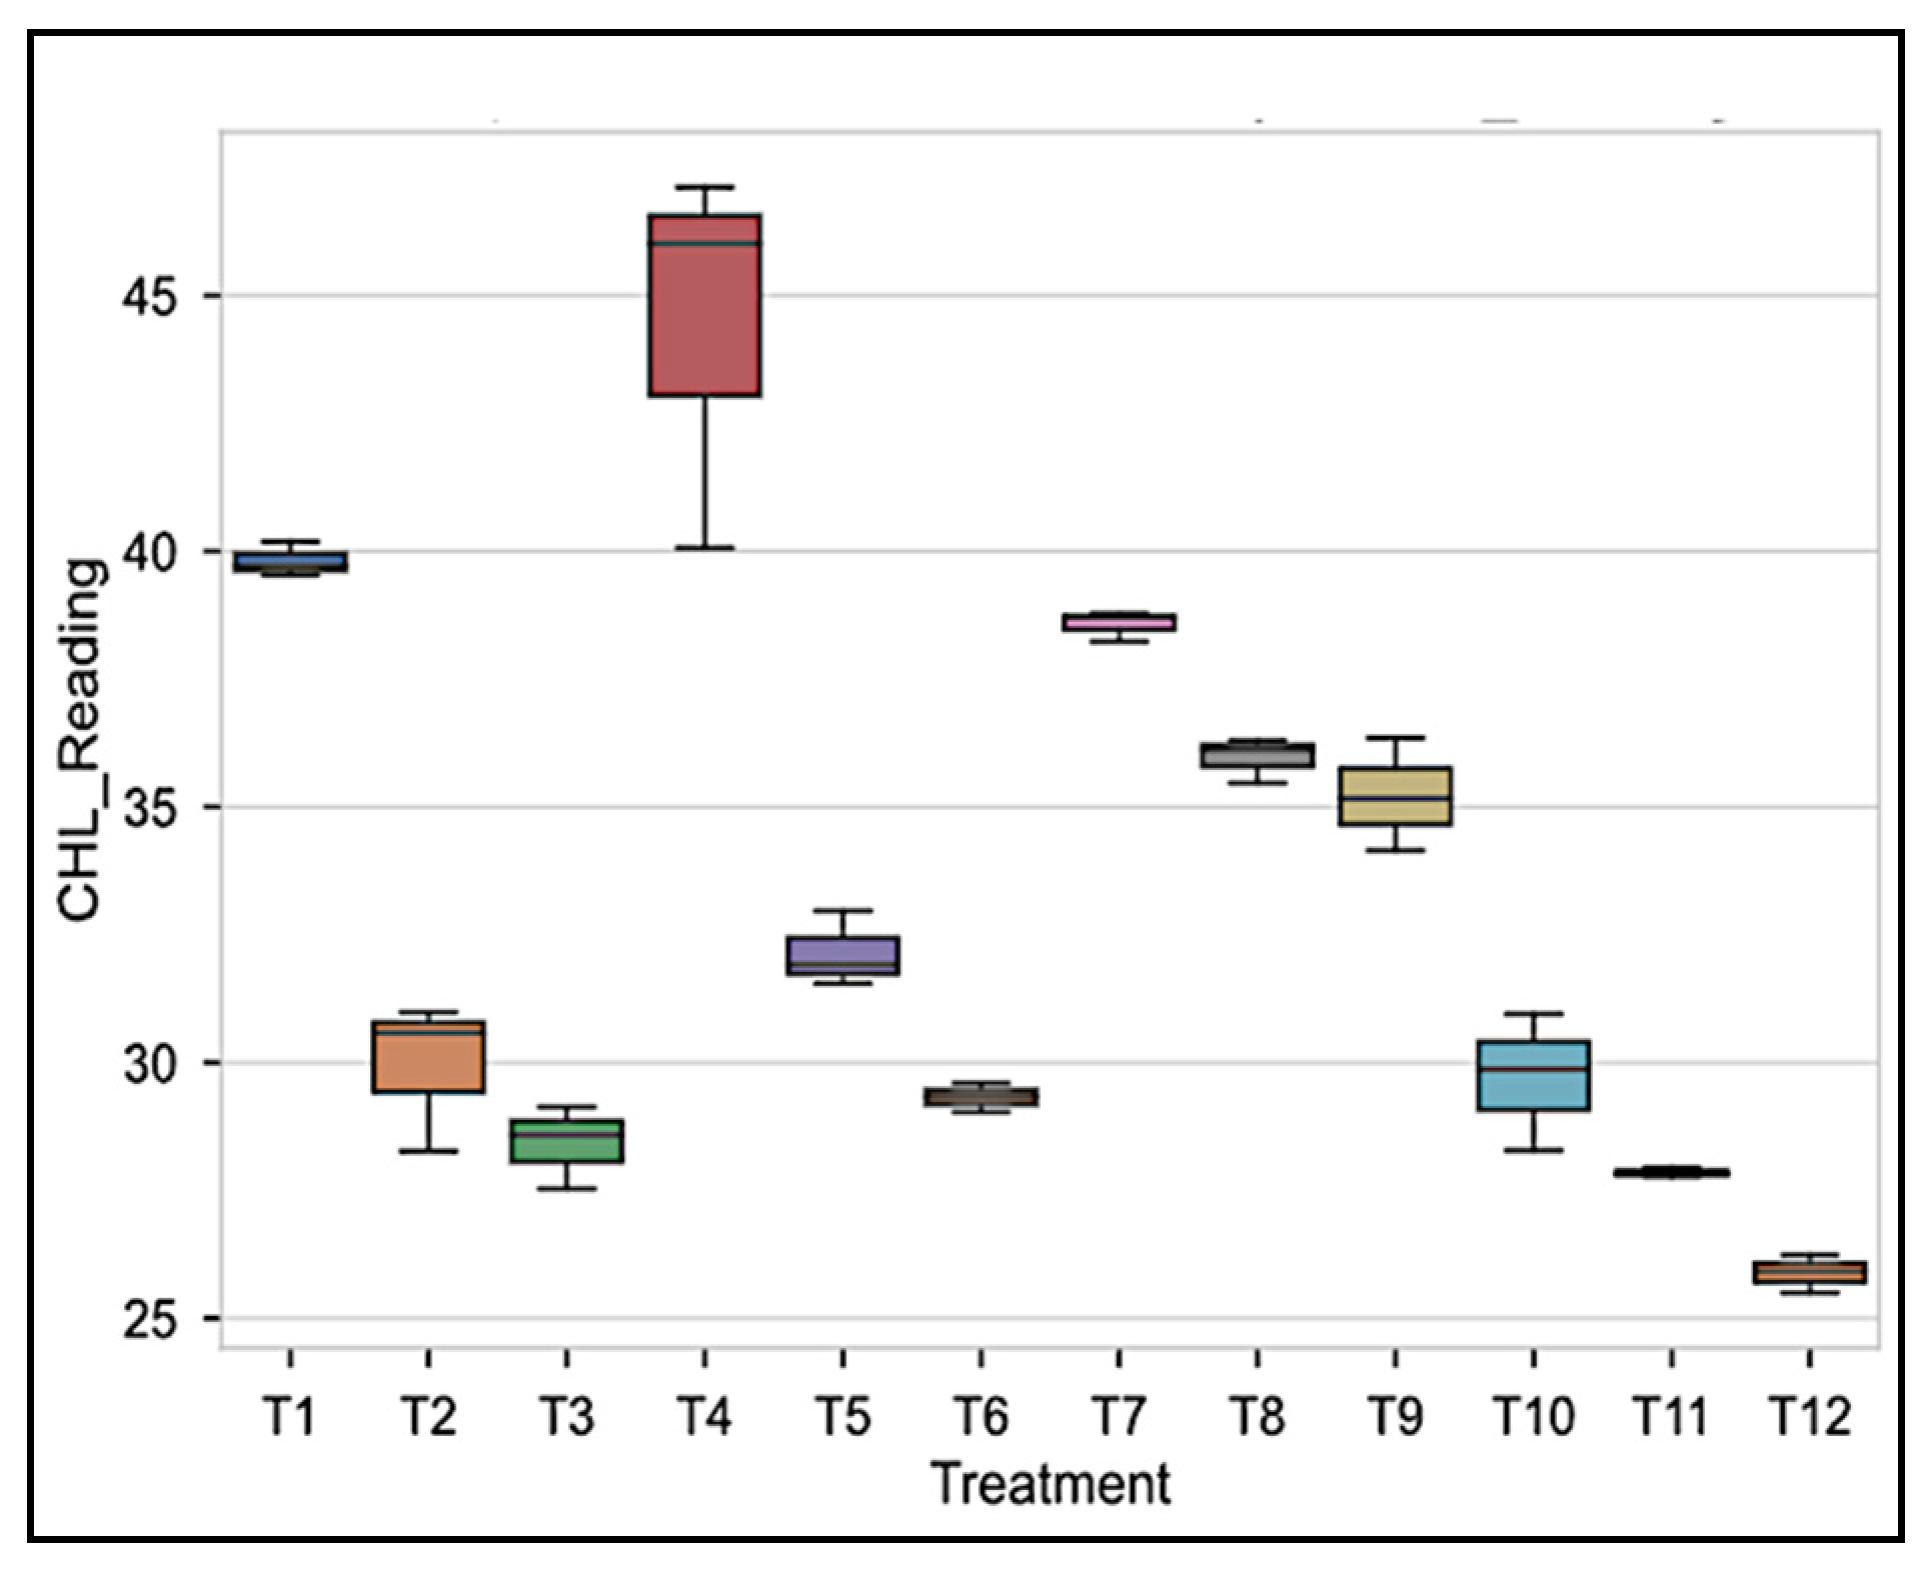
3.1. One Way ANOVA Statistical Analysis for Different Treatments and Chlorophyll Content
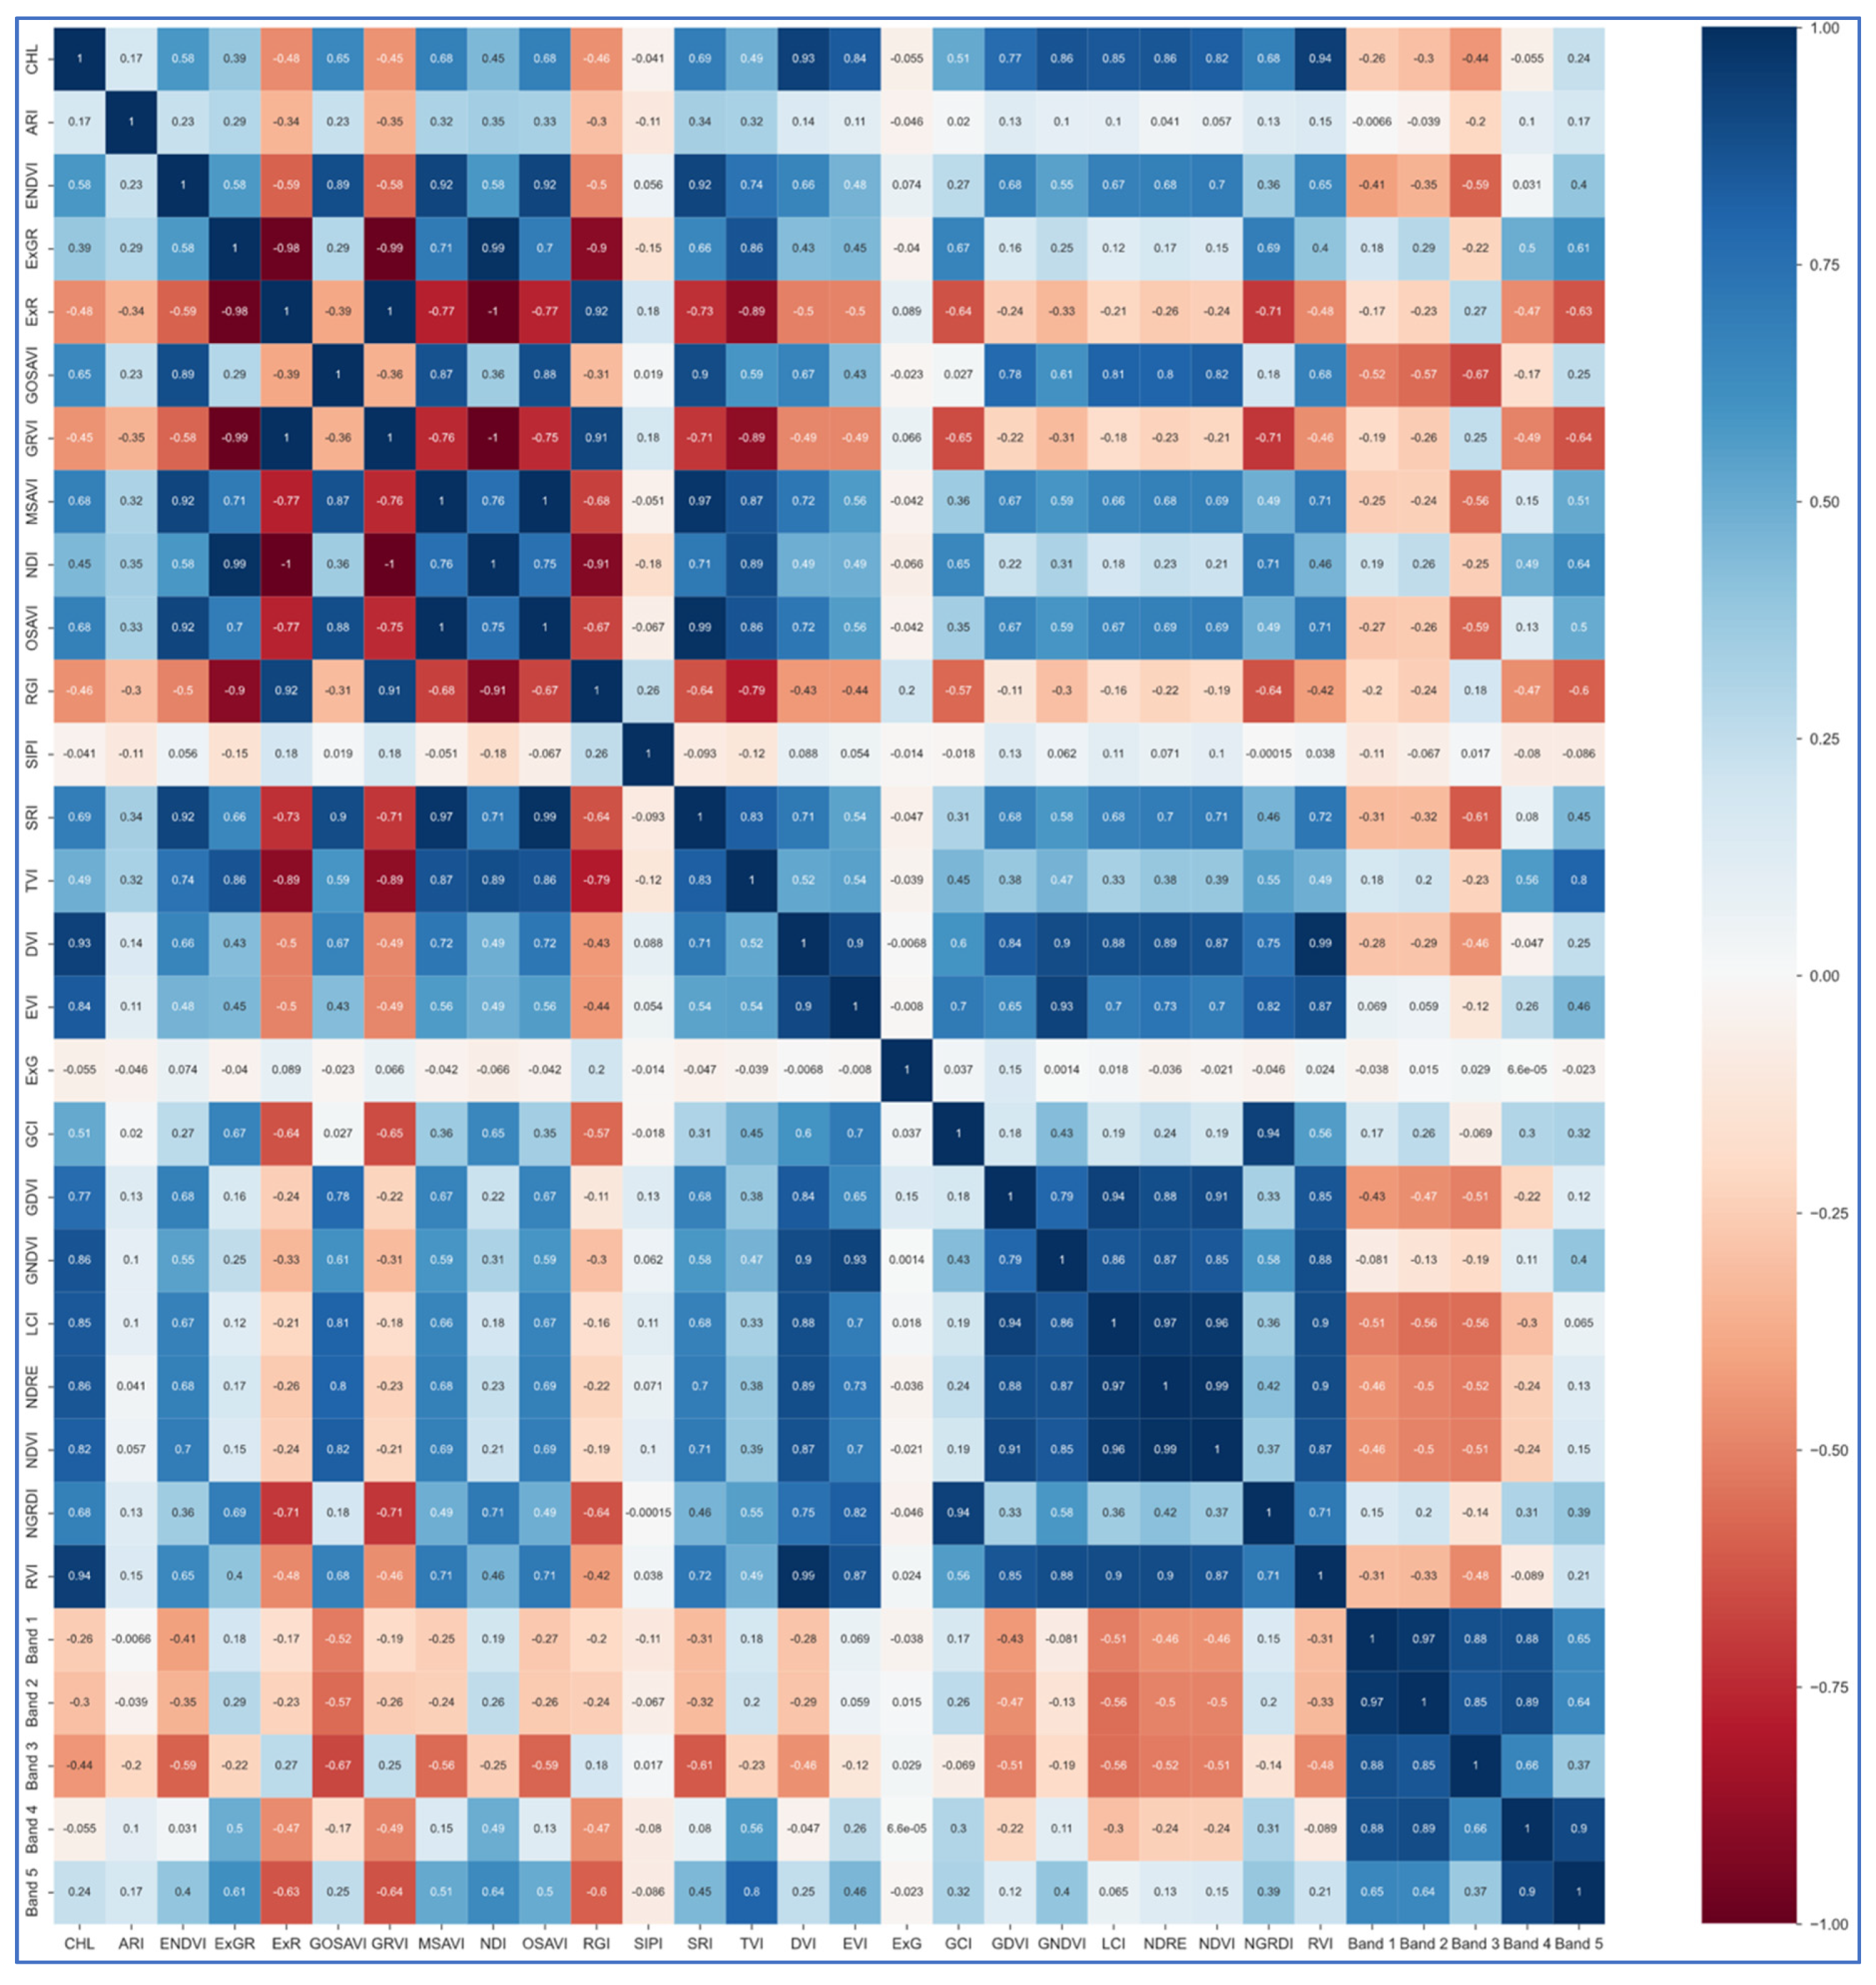
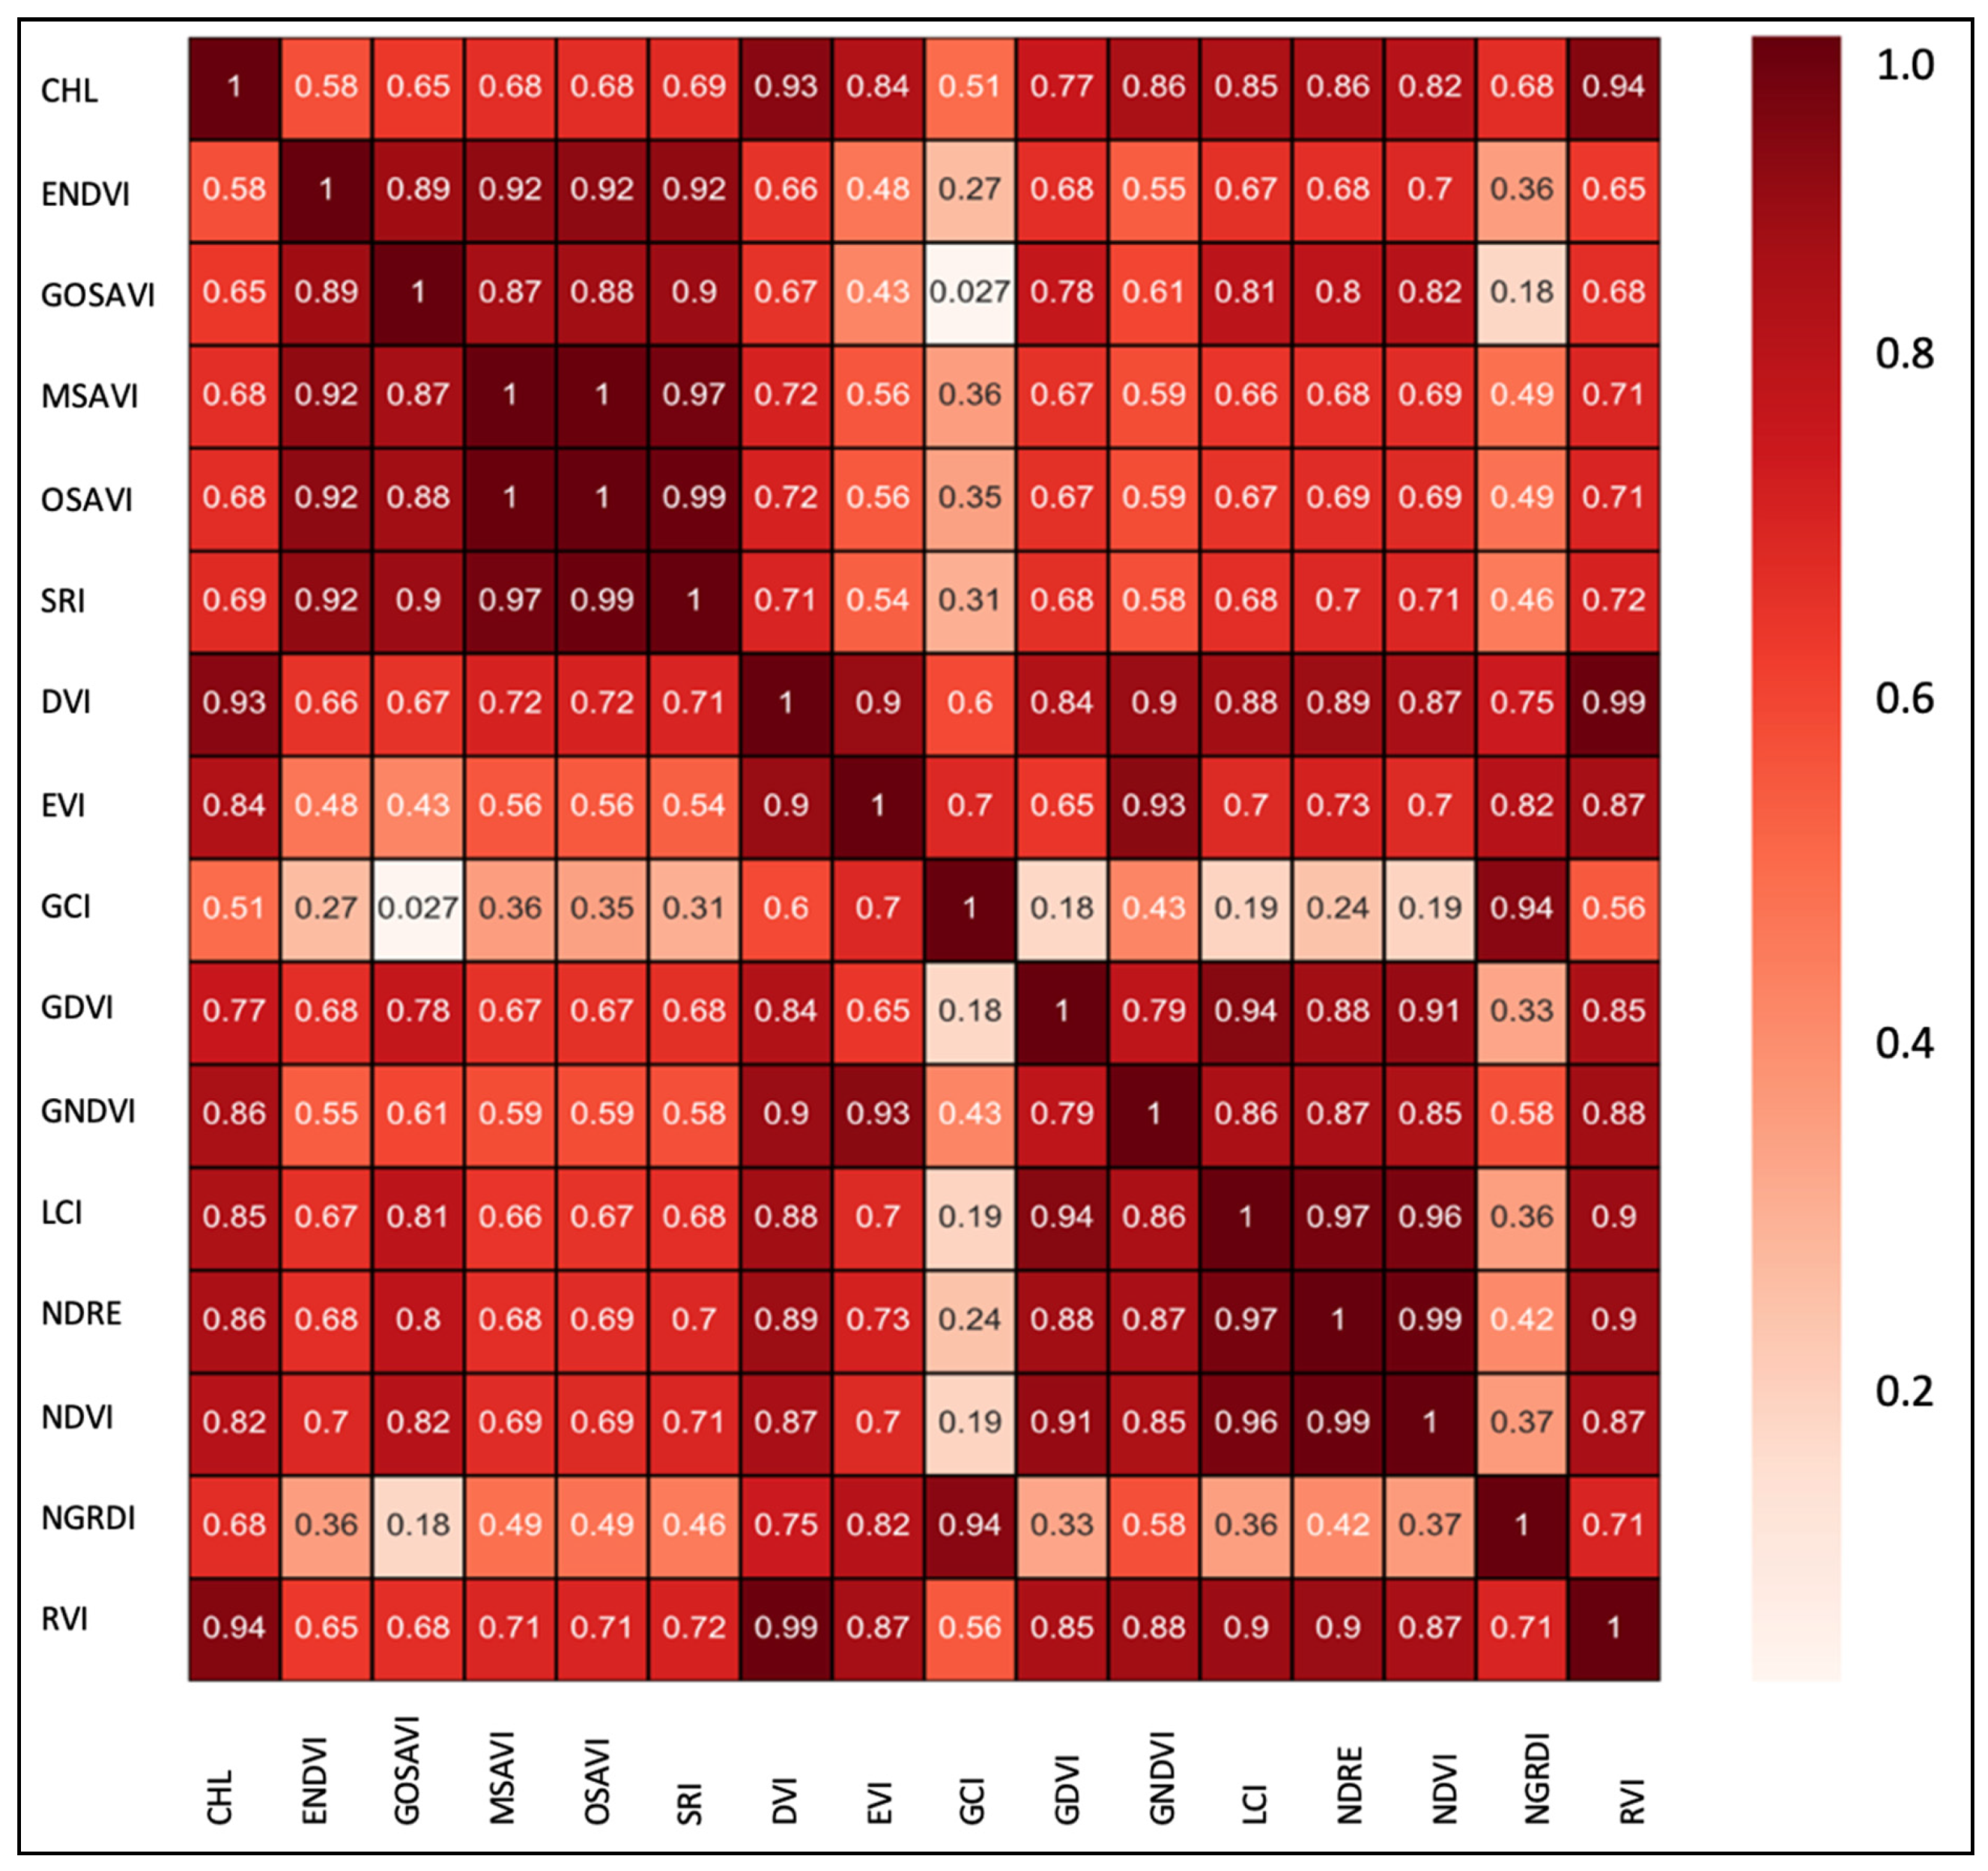
3.2. Correlation between Vegetation Indices and Sugarcane Chlorophyll Content
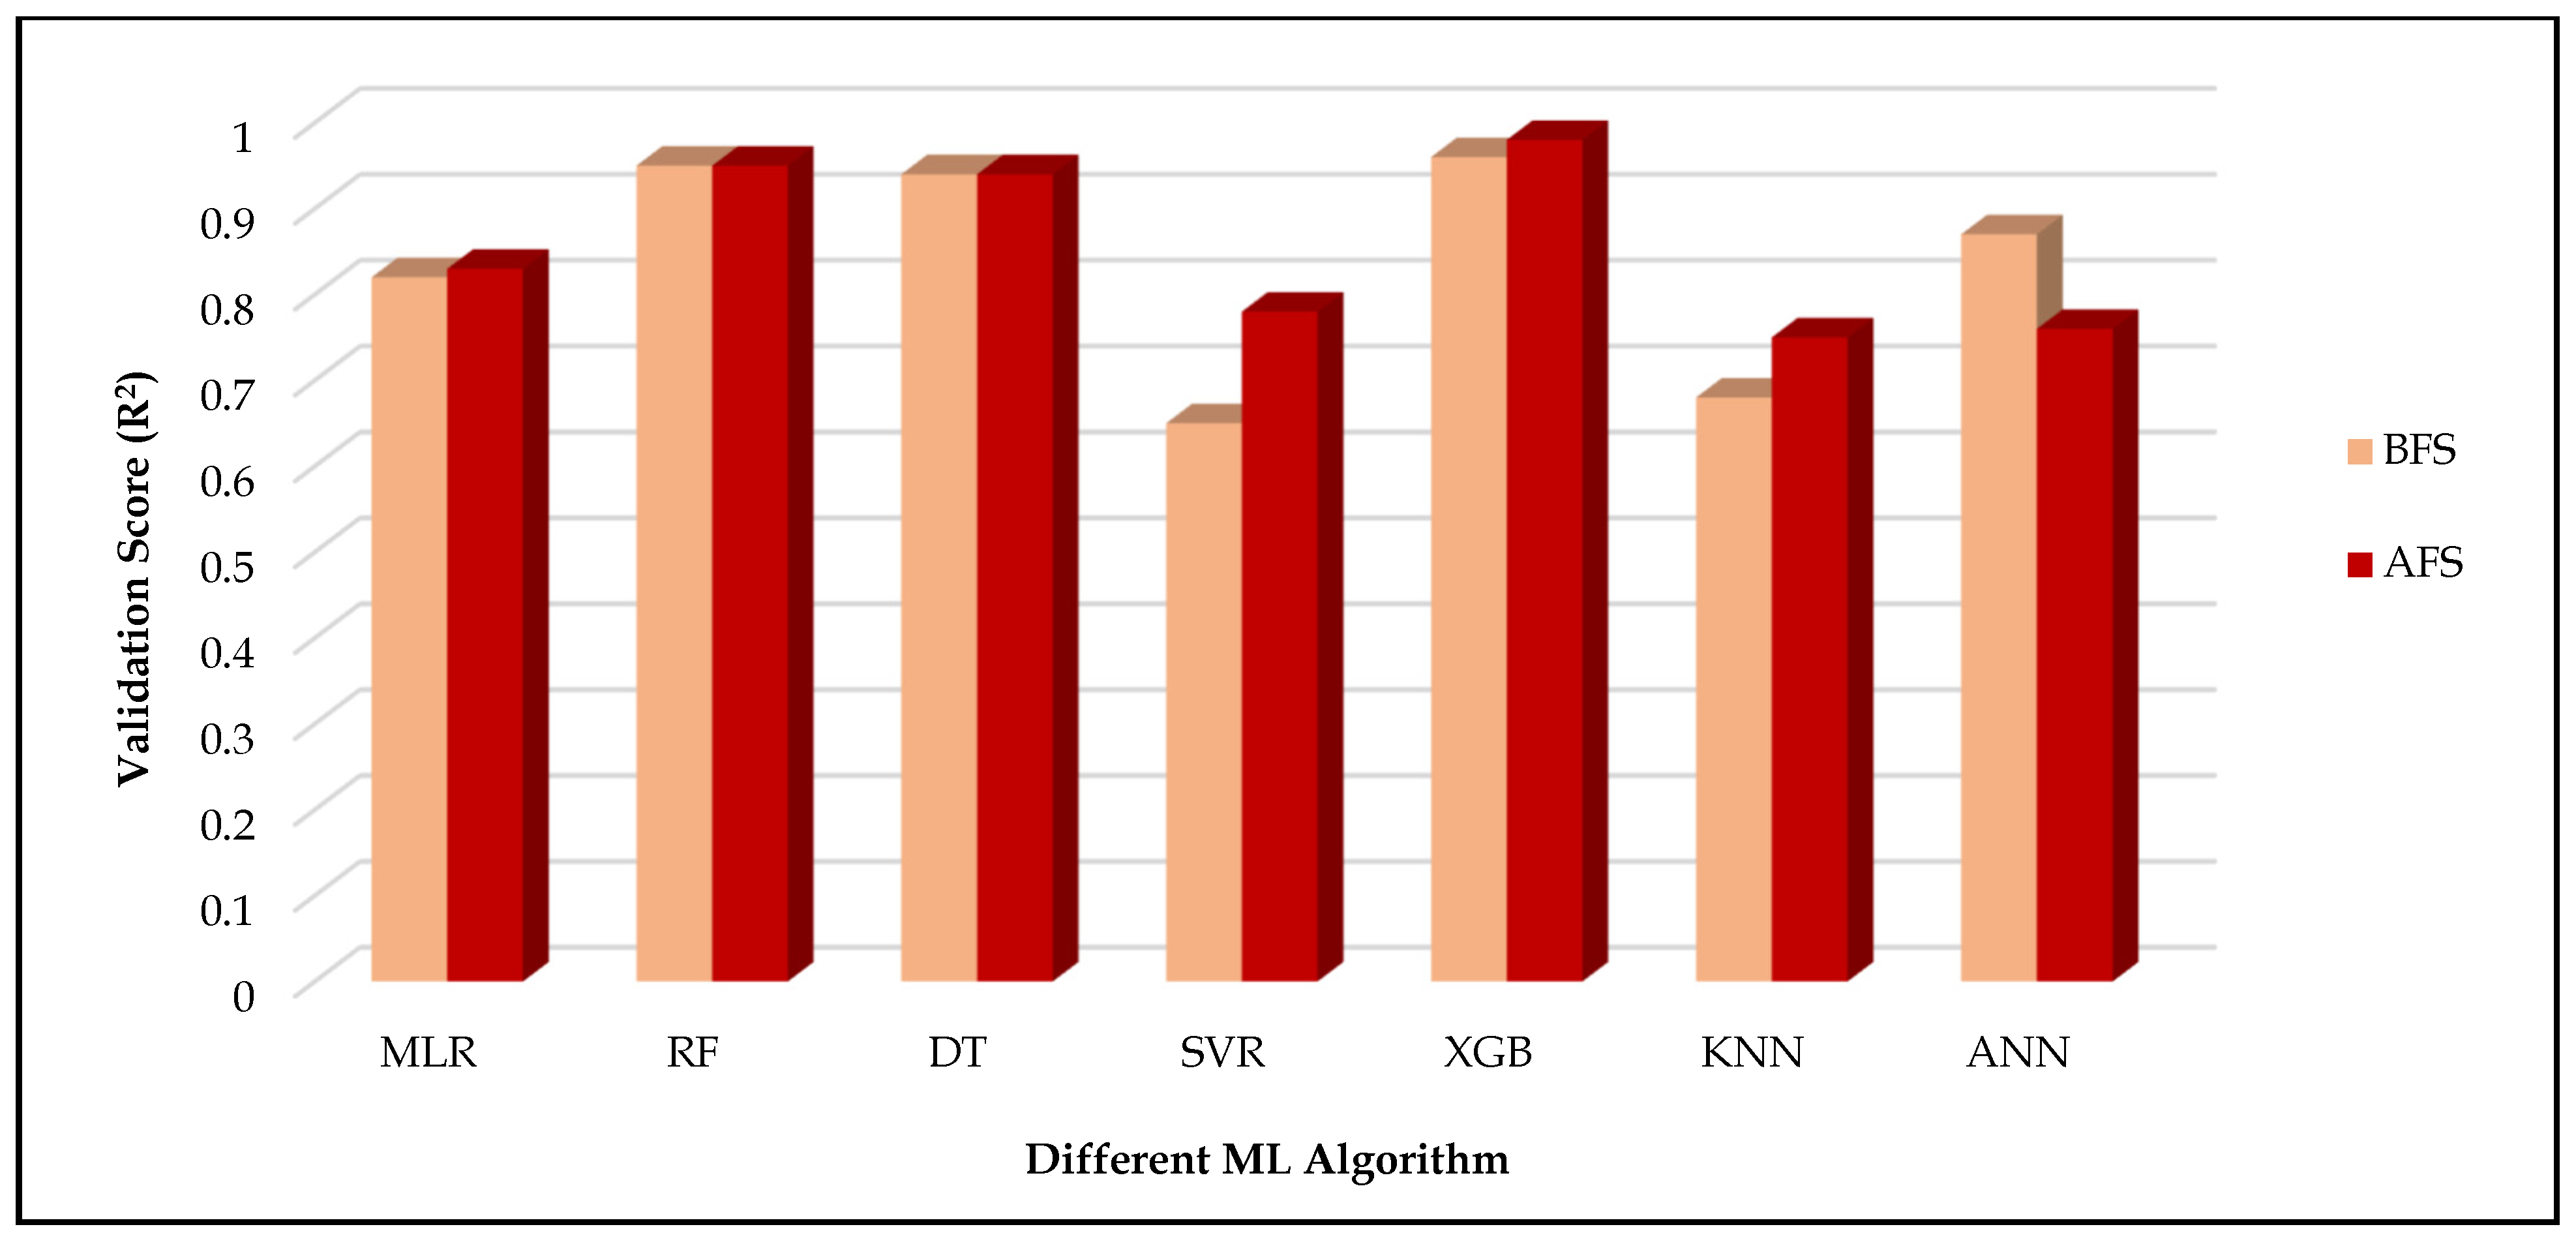
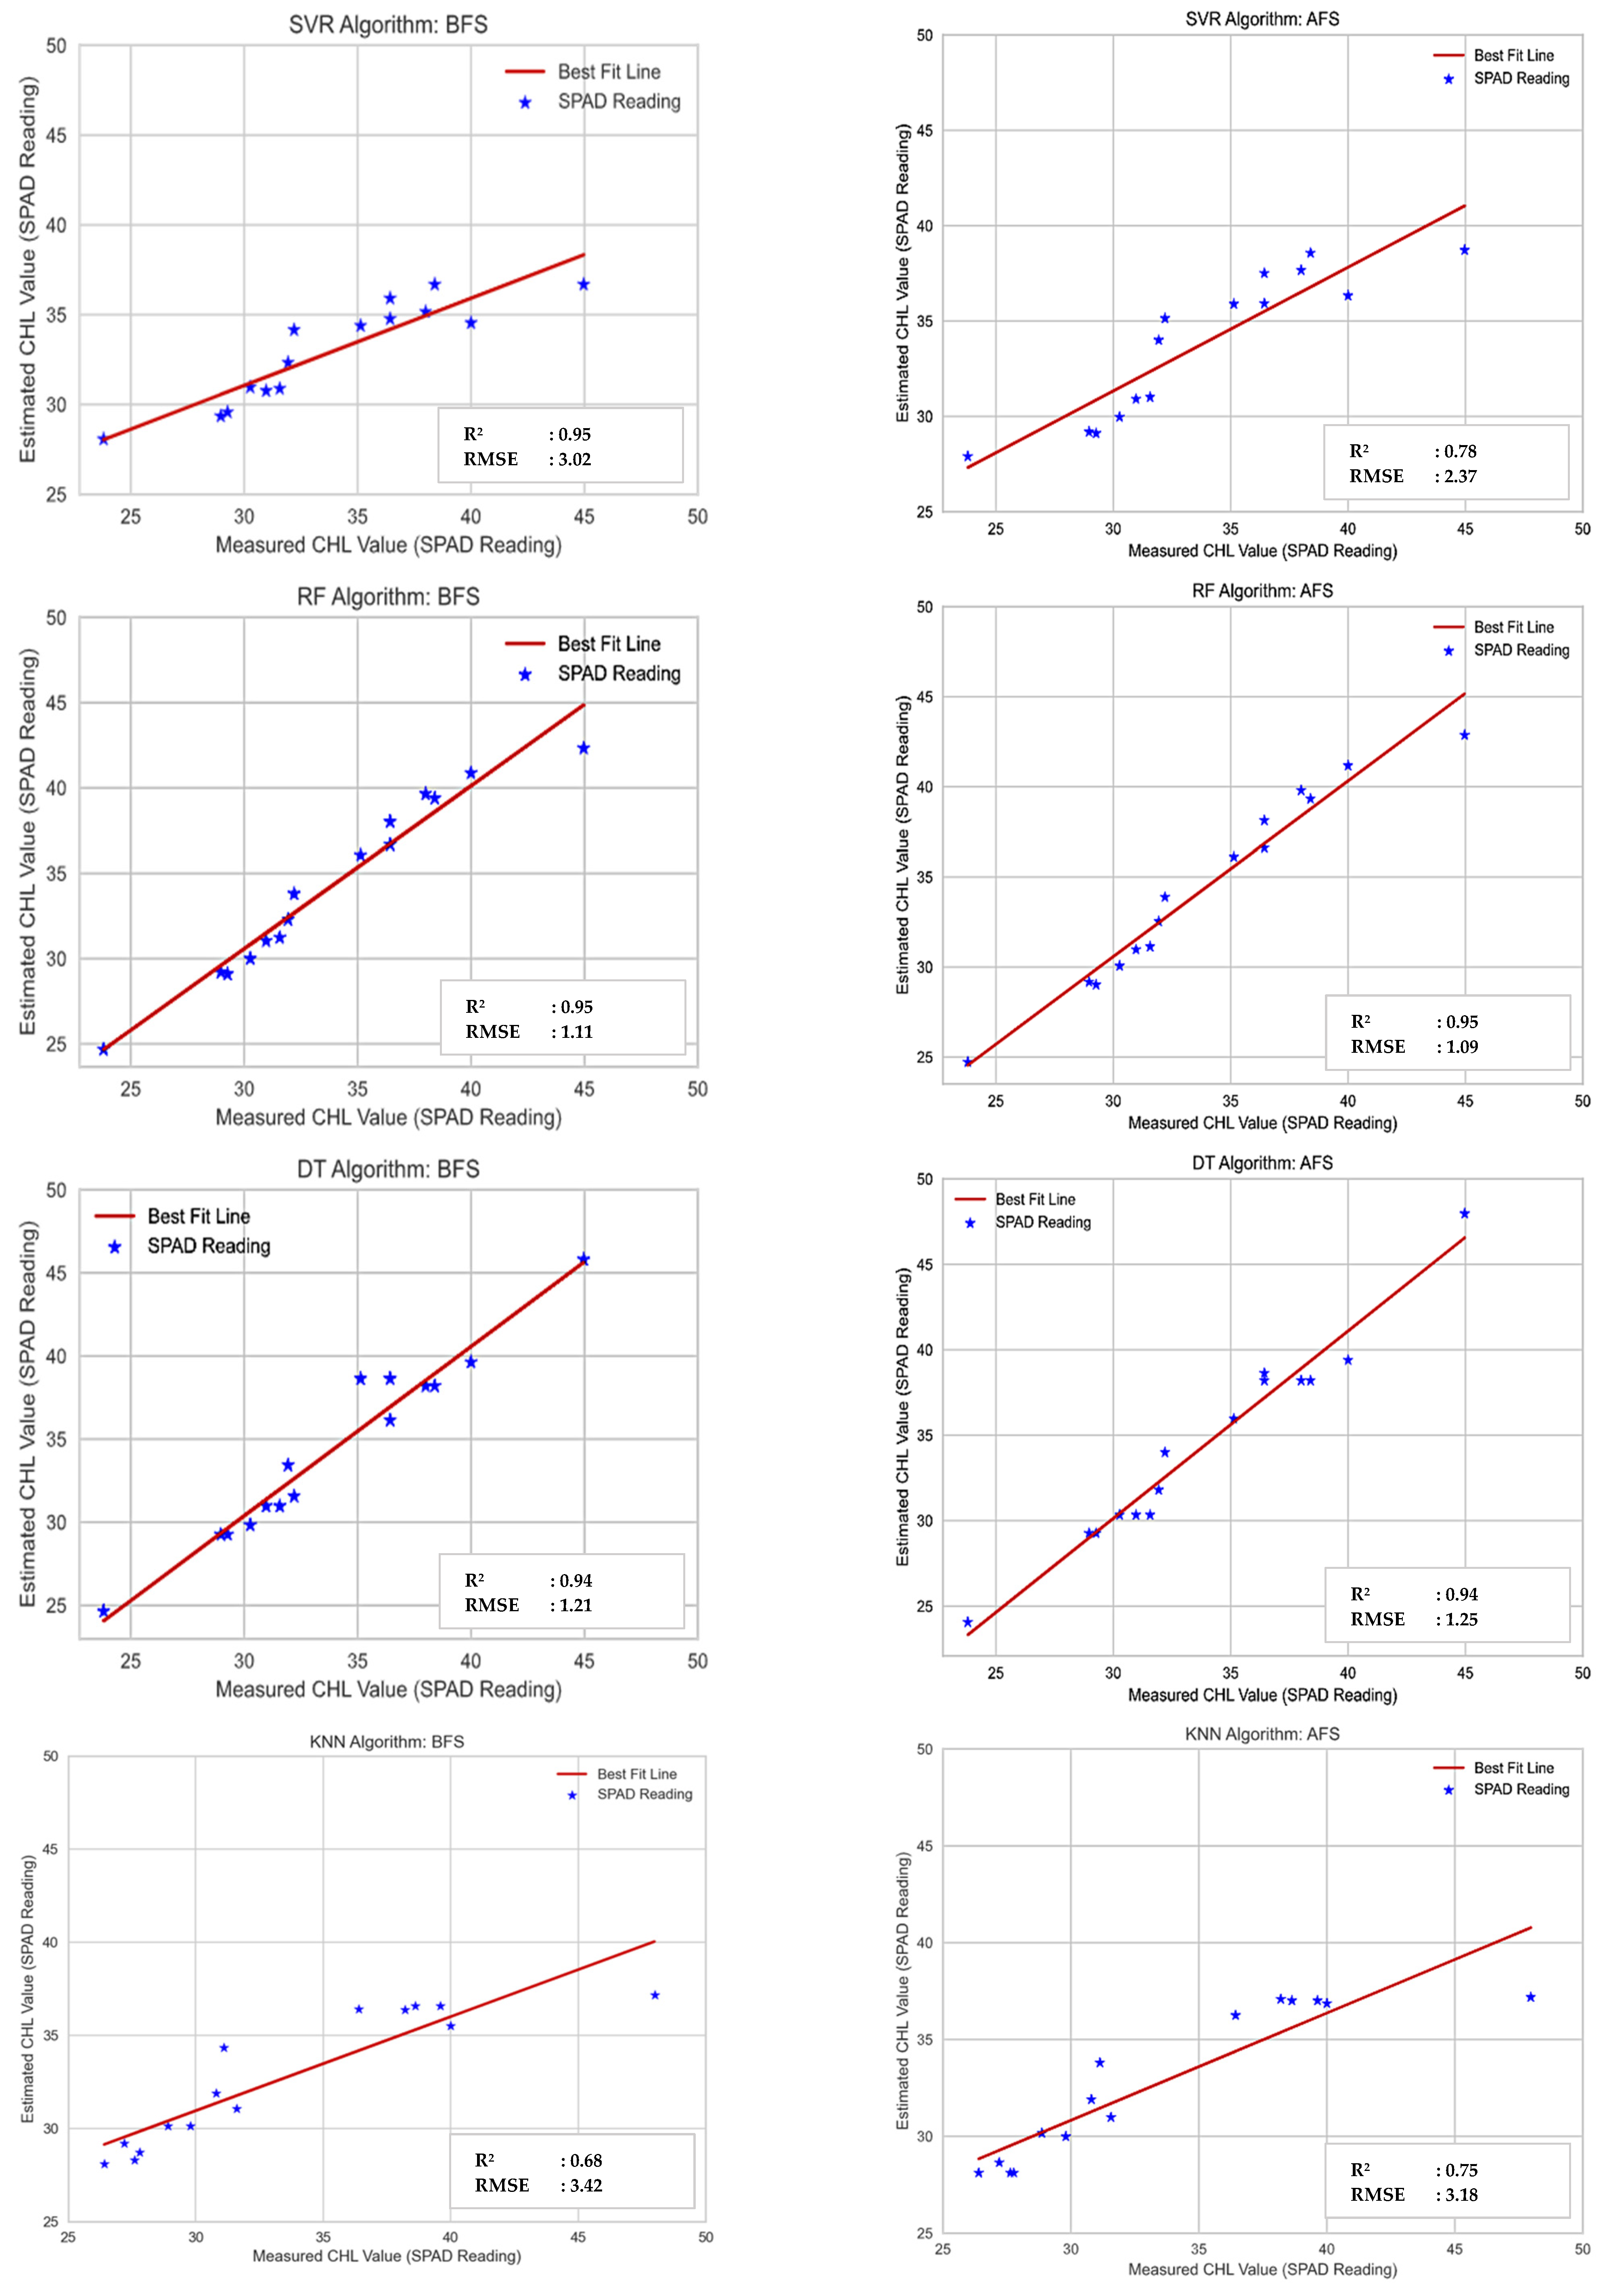
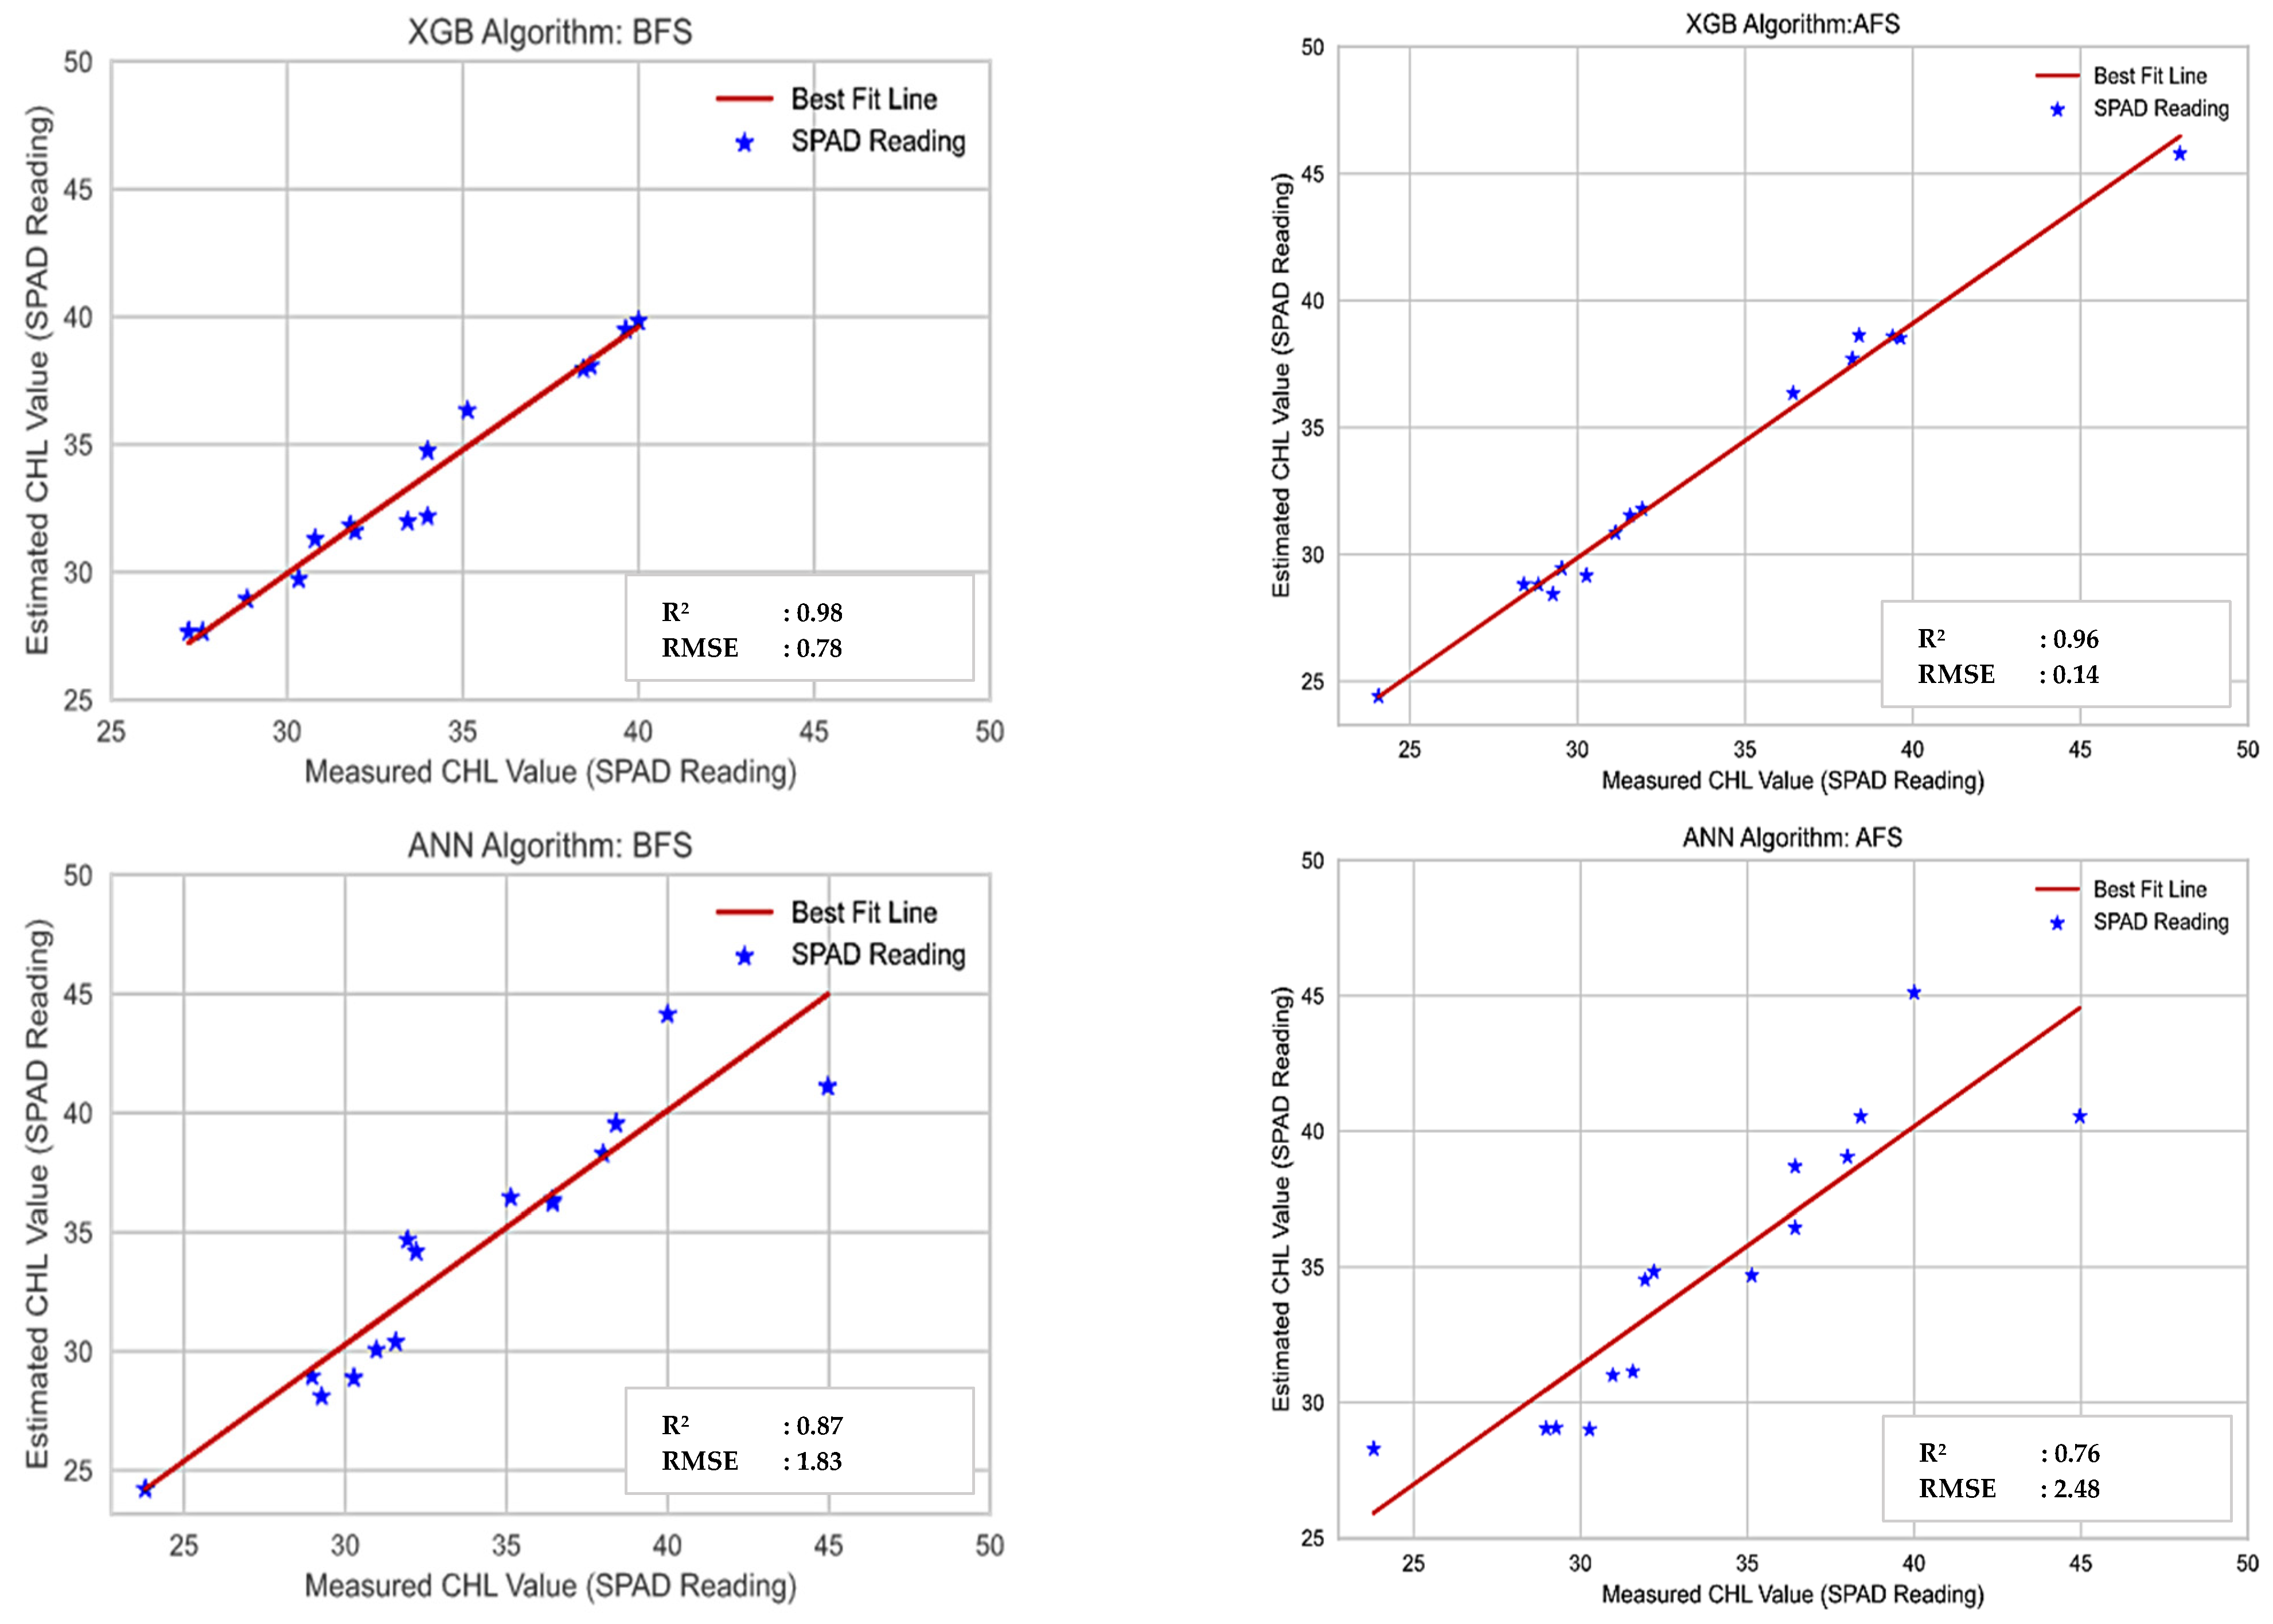
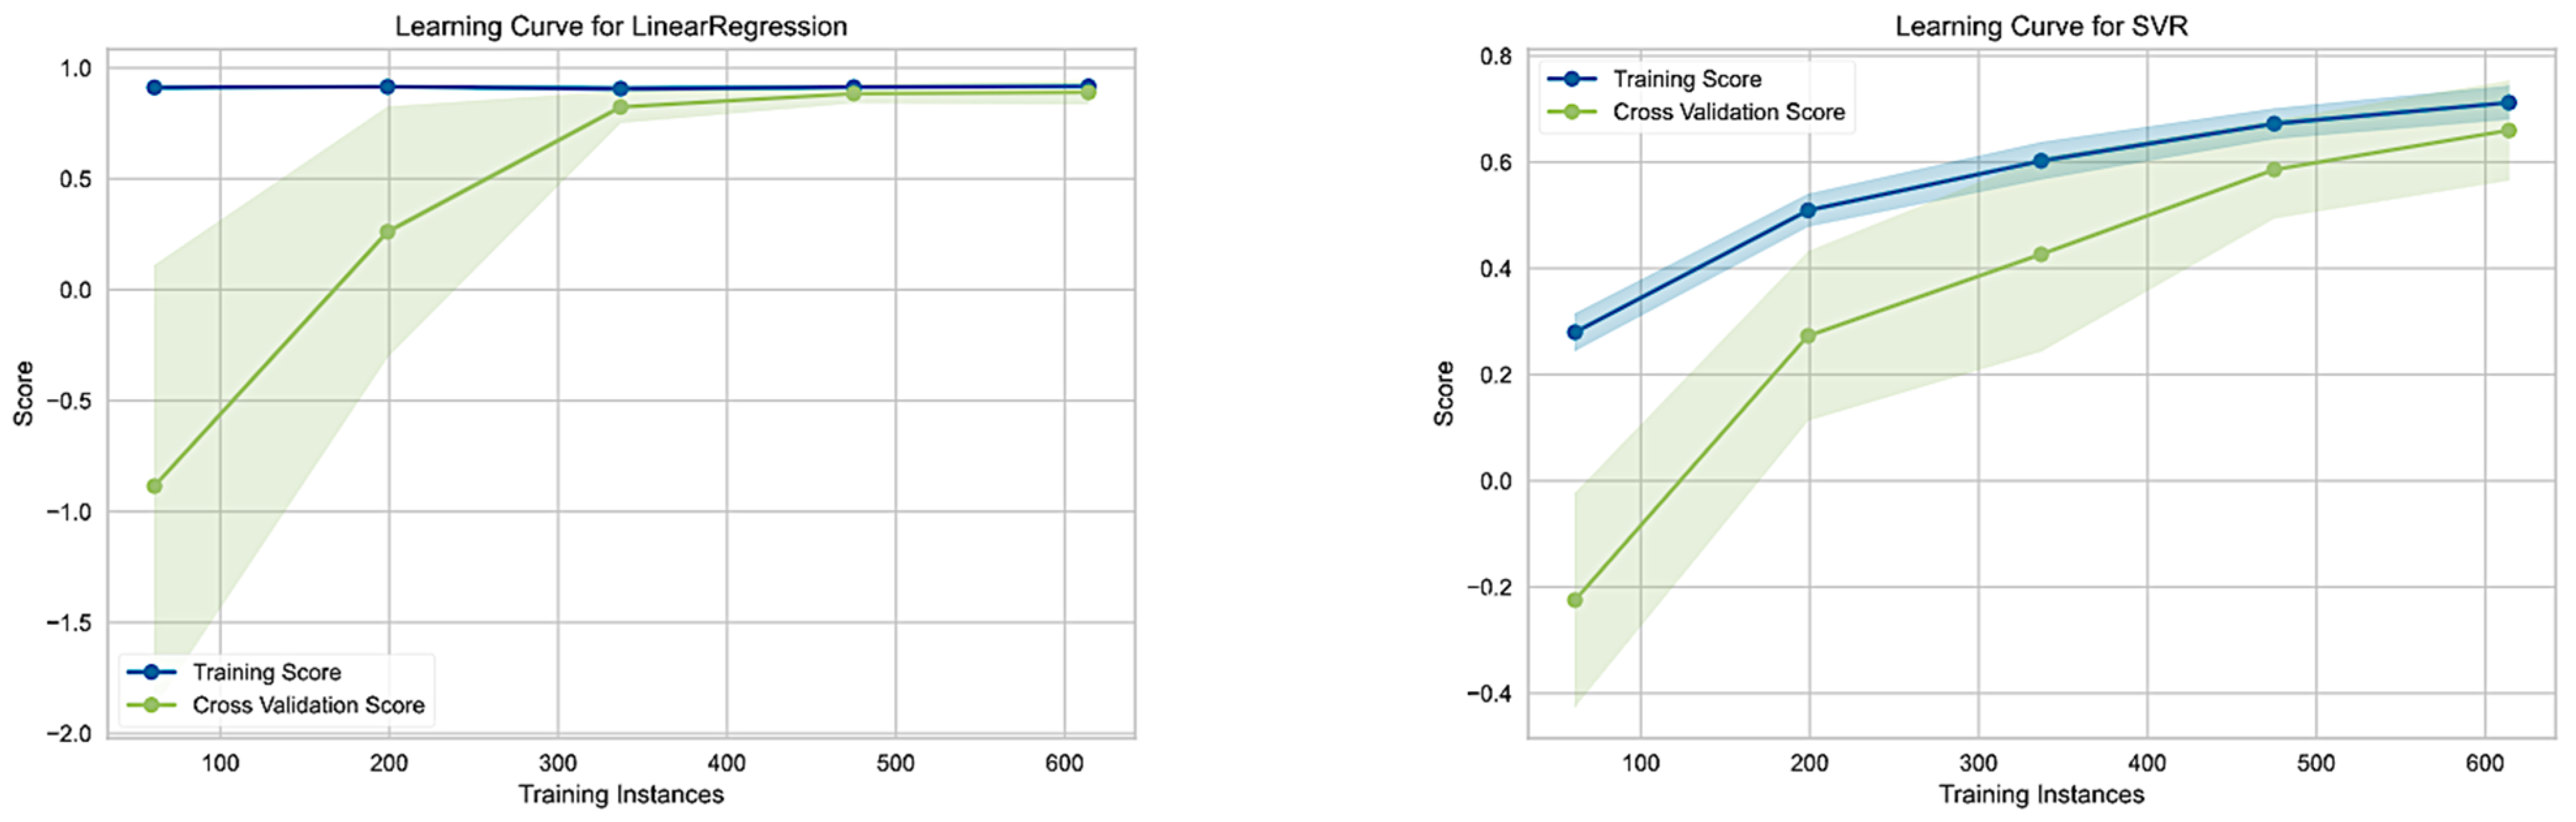
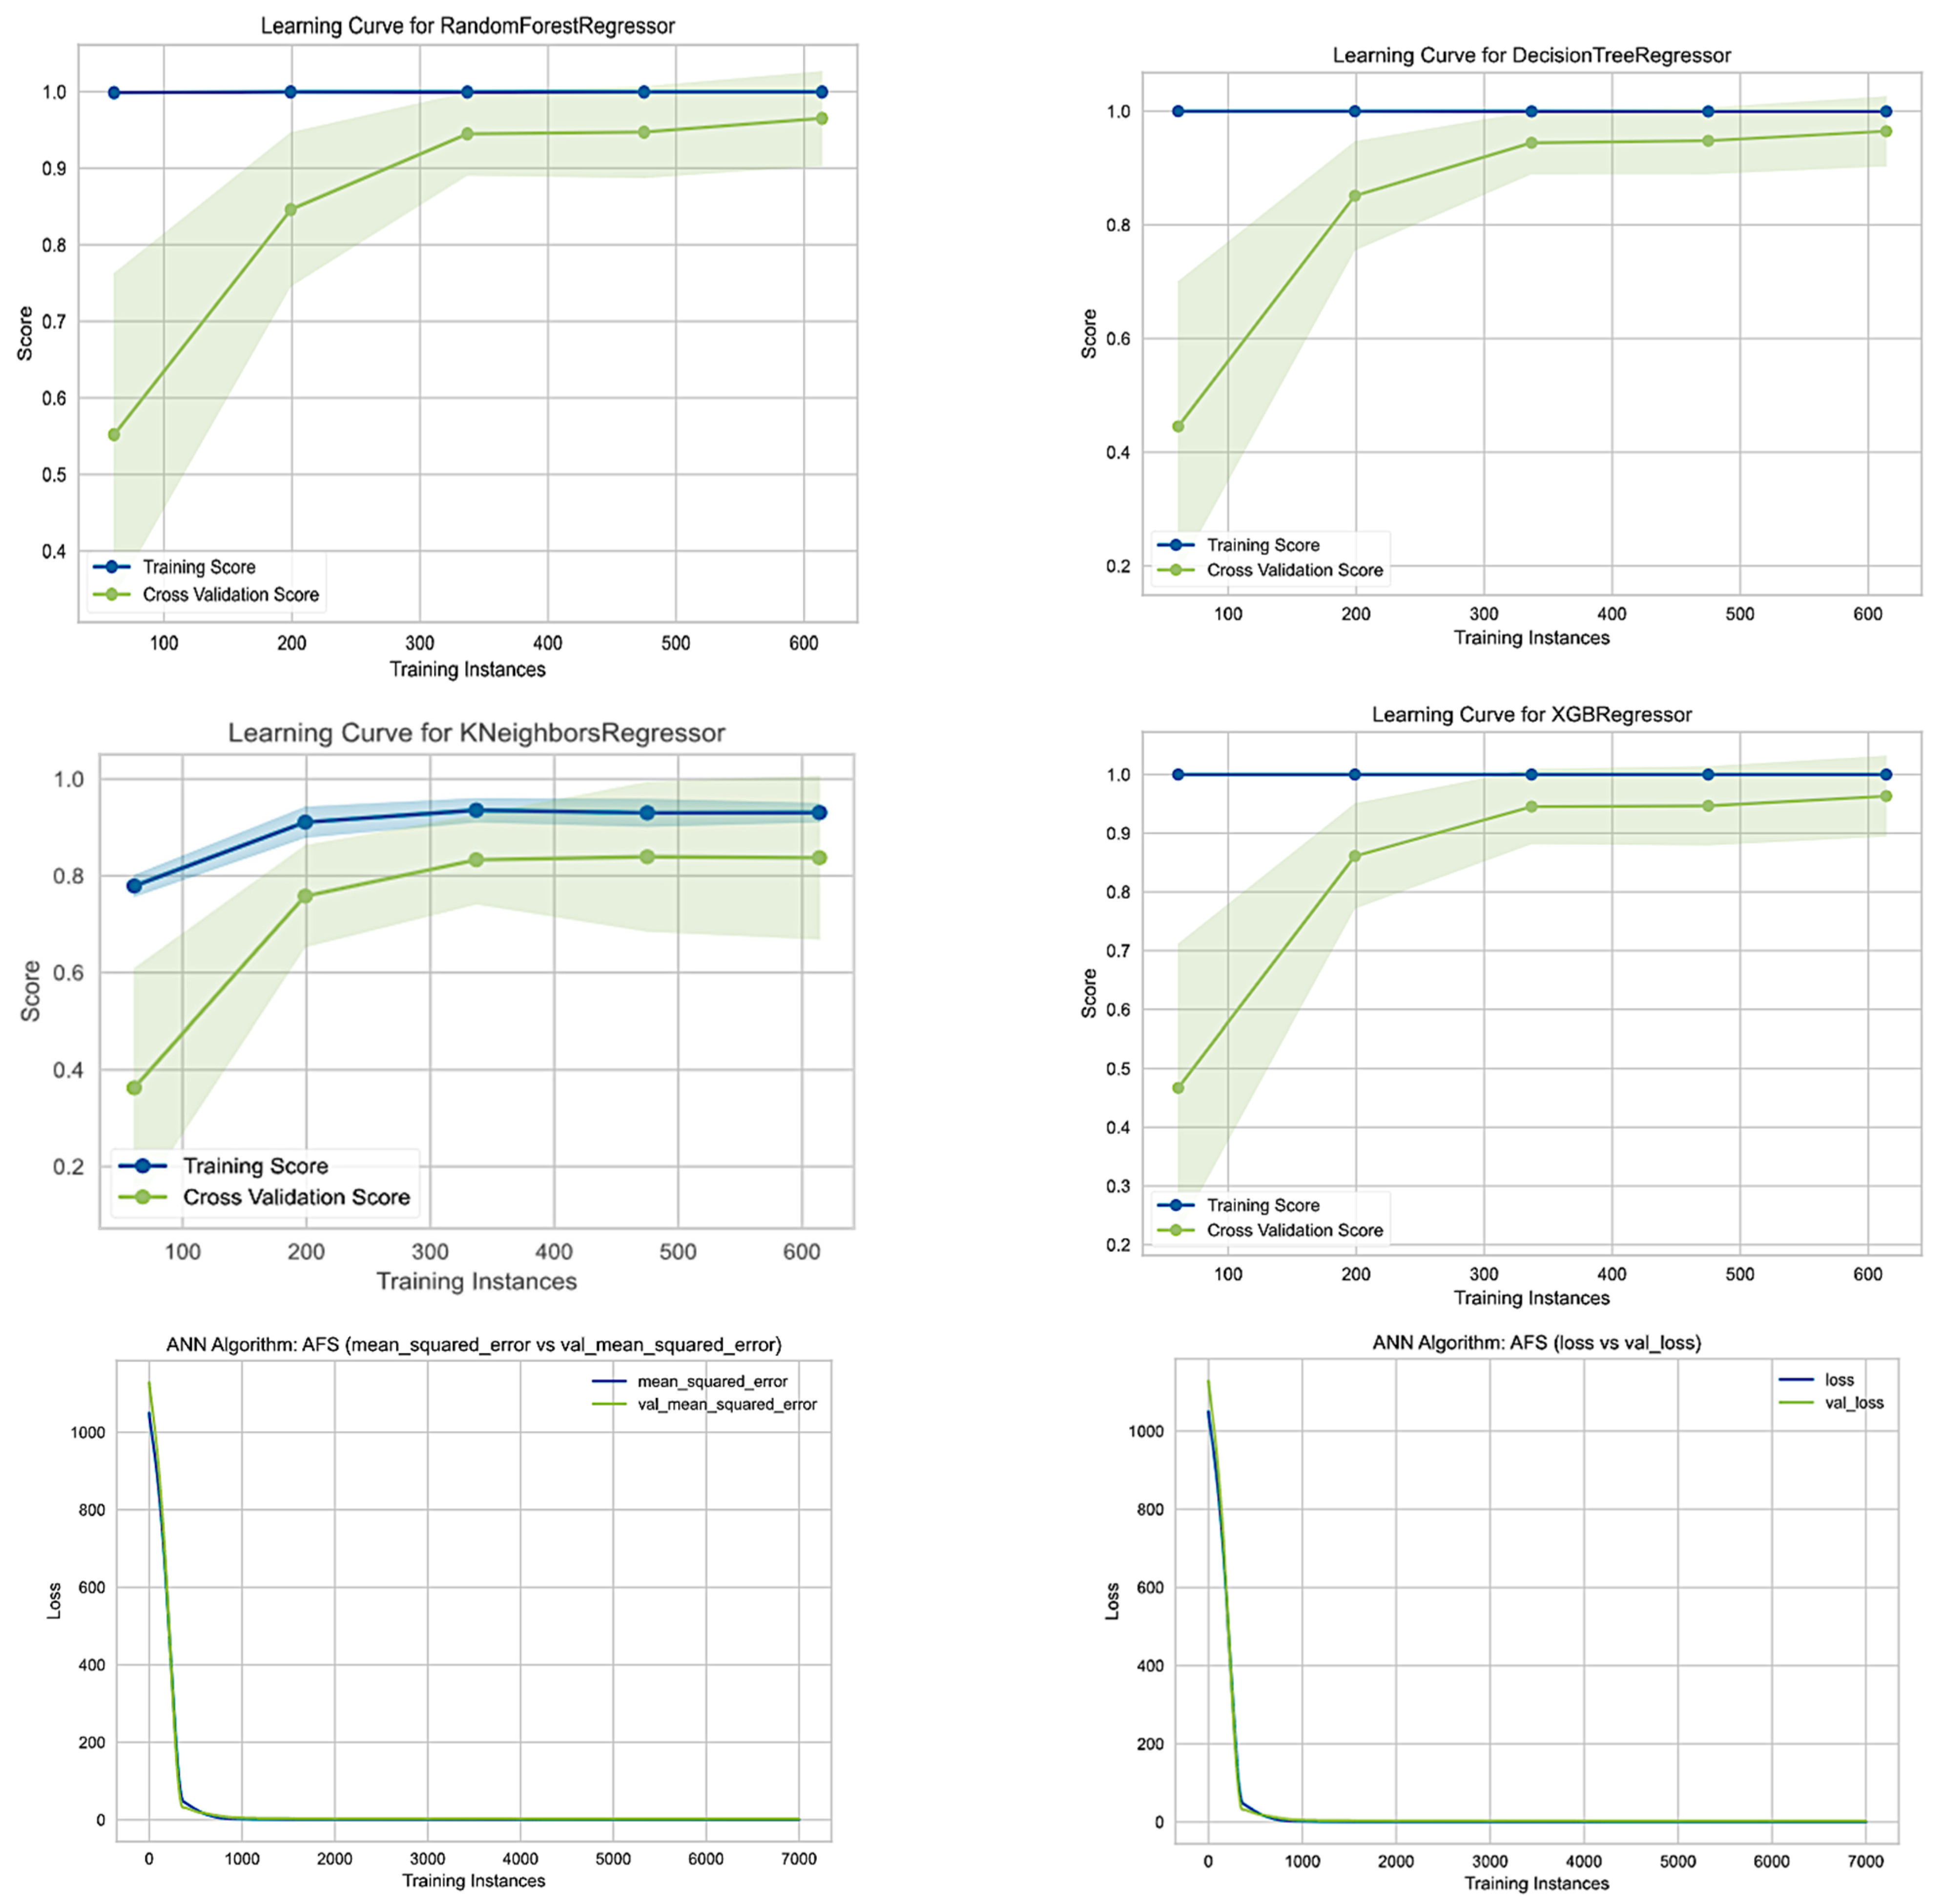
3.3. Prediction of Sugarcane Chlorophyll Content by Using Machine Learning Algorithms
4. Discussion
4.1. Basic Statistical Analysis
4.2. Machine Learning Approach Using Multispectral Bands and VLs
4.3. Limitations of the Experimental and Modelling Approach
5. Conclusions
Author Contributions
Funding
Informed Consent Statement
Data Availability Statement
Acknowledgments
Conflicts of Interest
Appendix A
References
- Vanegas, F.; Bratanov, D.; Powell, K.; Weiss, J.; Gonzalez, F. A Novel Methodology for Improving Plant Pest Surveillance in Vineyards and Crops Using UAV-Based Hyperspectral and Spatial Data. Sensors 2018, 18, 260. [Google Scholar] [CrossRef] [PubMed] [Green Version]
- Thomas, J.E.; Wood, T.A.; Gullino, M.L.; Ortu, G.; Thomas, J.E.; Wood, T.A. Diagnostic Tools for Plant Biosecurity. In Practical Tools for Plant and Food Biosecurity; Springer: Cham, Switzerland, 2017; pp. 209–226. [Google Scholar] [CrossRef]
- Mcfadyen, A.; Gonzalez, L.F.; Campbell, D.A.; Eagling, D. Evaluating Unmanned Aircraft Systems for Deployment in Plant Biosecurity; Queensland University of Technology: Brisbane City, QLD, Australia, 2014. [Google Scholar] [CrossRef]
- Puig Garcia, E.; Gonzalez, F.; Hamilton, G.; Grundy, P. Assessment of crop insect damage using unmanned aerial systems: A machine learning approach. In Proceedings of the MODSIM 2015, 21st International Congress on Modelling and Simulation, Gold Coast, Australia, 29 November–4 December 2015; Available online: http://www.mssanz.org.au/modsim2015/F12/puig.pdf (accessed on 14 January 2022).
- Hu, Y.; Wilson, S.; Schwessinger, B.; Rathjen, J.P. Blurred lines: Integrating emerging technologies to advance plant biosecurity. Curr. Opin. Plant Biol. 2020, 56, 127–134. [Google Scholar] [CrossRef] [PubMed]
- Sandino, J.; Pegg, G.; Gonzalez, F.; Smith, G. Aerial Mapping of Forests Affected by Pathogens Using UAVs, Hyperspectral Sensors, and Artificial Intelligence. Sensors 2018, 18, 944. [Google Scholar] [CrossRef] [Green Version]
- Zhang, T.; Su, J.; Liu, C.; Chen, W.-H. State and parameter estimation of the AquaCrop model for winter wheat using sensitivity informed particle filter. Comput. Electron. Agric. 2020, 180, 105909. [Google Scholar] [CrossRef]
- Seyyedhasani, H.; Digman, M.; Luck, B.D. Utility of a commercial unmanned aerial vehicle for in-field localization of biomass bales. Comput. Electron. Agric. 2020, 180, 105898. [Google Scholar] [CrossRef]
- Nebiker, S.; Annen, A.; Scherrer, M.; Oesch, D. A light-weight multispectral sensor for micro UAV—Opportunities for very high resolution airborne remote sensing. Int. Arch. Photogramm. Remote Sens. Spat.-Form. Sci. 2008, 37, 1193–1200. [Google Scholar]
- Yue, J.; Lei, T.; Li, C.; Zhu, J. The Application of Unmanned Aerial Vehicle Remote Sensing in Quickly Monitoring Crop Pests. Intell. Autom. Soft Comput. 2012, 18, 1043–1052. [Google Scholar] [CrossRef]
- Aasen, H.; Honkavaara, E.; Lucieer, A.; Zarco-Tejada, P.J. Quantitative Remote Sensing at Ultra-High Resolution with UAV Spectroscopy: A Review of Sensor Technology, Measurement Procedures, and Data Correction Workflows. Remote Sens. 2018, 10, 1091. [Google Scholar] [CrossRef] [Green Version]
- Casagli, N.; Frodella, W.; Morelli, S.; Tofani, V.; Ciampalini, A.; Intrieri, E.; Raspini, F.; Rossi, G.; Tanteri, L.; Lu, P. Spaceborne, UAV and ground-based remote sensing techniques for landslide mapping, monitoring and early warning. Geoenviron. Disasters 2017, 4, 9. [Google Scholar] [CrossRef]
- Xiang, H.; Tian, L. Development of a low-cost agricultural remote sensing system based on an autonomous unmanned aerial vehicle (UAV). Biosyst. Eng. 2011, 108, 174–190. [Google Scholar] [CrossRef]
- Hansen, P.M.; Schjoerring, J.K. Reflectance measurement of canopy biomass and nitrogen status in wheat crops using normalized difference vegetation indices and partial least squares regression. Remote Sens. Environ. 2003, 86, 542–553. [Google Scholar] [CrossRef]
- Haboudane, D.; Miller, J.R.; Tremblay, N.; Zarco-Tejada, P.J.; Dextraze, L. Integrated narrow-band vegetation indices for prediction of crop chlorophyll content for application to precision agriculture. Remote Sens. Environ. 2002, 81, 416–426. [Google Scholar] [CrossRef]
- Hoeppner, J.M.; Skidmore, A.K.; Darvishzadeh, R.; Heurich, M.; Chang, H.-C.; Gara, T.W. Mapping Canopy Chlorophyll Content in a Temperate Forest Using Airborne Hyperspectral Data. Remote Sens. 2020, 12, 3573. [Google Scholar] [CrossRef]
- Shah, S.H.; Angel, Y.; Houborg, R.; Ali, S.; McCabe, M.F. A Random Forest Machine Learning Approach for the Retrieval of Leaf Chlorophyll Content in Wheat. Remote Sens. 2019, 11, 920. [Google Scholar] [CrossRef] [Green Version]
- Zhang, L.; Han, W.; Niu, Y.; Chávez, J.L.; Shao, G.; Zhang, H. Evaluating the sensitivity of water stressed maize chlorophyll and structure based on UAV derived vegetation indices. Comput. Electron. Agric. 2021, 185, 106174. [Google Scholar] [CrossRef]
- Tahir, M.N.; Naqvi, S.Z.A.; Lan, Y.; Zhang, Y.; Wang, Y.; Afzal, M.; Cheema, M.J.M.; Amir, S. Real time estimation of chlorophyll content based on vegetation indices derived from multispectral UAV in the kinnow orchard. Int. J. Precis. Agric. Aviat. 2018, 1, 24–31. [Google Scholar] [CrossRef] [Green Version]
- Paneque-Gálvez, J.; McCall, M.K.; Napoletano, B.M.; Wich, S.A.; Koh, L.P. Small Drones for Community-Based Forest Monitoring: An Assessment of Their Feasibility and Potential in Tropical Areas. Forests 2014, 5, 1481–1507. [Google Scholar] [CrossRef] [Green Version]
- Jang, G.; Kim, J.; Yu, J.-K.; Kim, H.-J.; Kim, Y.; Kim, D.-W.; Kim, K.-H.; Lee, C.W.; Chung, Y.S. Review: Cost-Effective Unmanned Aerial Vehicle (UAV) Platform for Field Plant Breeding Application. Remote Sens. 2020, 12, 998. [Google Scholar] [CrossRef] [Green Version]
- Themistocleous, K. The use of UAV platforms for remote sensing applications: Case studies in Cyprus. In Proceedings of the Second International Conference on Remote Sensing and Geoinformation of Environment, Pafos, Cyprus, 7–10 April 2014; Volume 92290S. [Google Scholar] [CrossRef]
- Yang, G.; Liu, J.; Zhao, C.; Li, Z.; Huang, Y.; Yu, H.; Xu, B.; Yang, X.; Zhu, D.; Zhang, X.; et al. Unmanned Aerial Vehicle Remote Sensing for Field-Based Crop Phenotyping: Current Status and Perspectives. Front. Plant Sci. 2017, 8, 1111. [Google Scholar] [CrossRef]
- Vergouw, B.; Nagel, H.; Bondt, G.; Custers, B. Drone Technology: Types, Payloads, Applications, Frequency Spectrum Issues and Future Developments. In The Future of Drone Use; Custers, B., Ed.; TMC Asser Press: The Hague, The Netherlands, 2016; pp. 3–20. [Google Scholar] [CrossRef]
- Delavarpour, N.; Koparan, C.; Nowatzki, J.; Bajwa, S.; Sun, X. A Technical Study on UAV Characteristics for Precision Agriculture Applications and Associated Practical Challenges. Remote Sens. 2021, 13, 1204. [Google Scholar] [CrossRef]
- Miphokasap, P.; Wannasiri, W. Estimations of Nitrogen Concentration in Sugarcane Using Hyperspectral Imagery. Sustainability 2018, 10, 1266. [Google Scholar] [CrossRef] [Green Version]
- Wu, C.; Niu, Z.; Tang, Q.; Huang, W.; Rivard, B.; Feng, J. Remote estimation of gross primary production in wheat using chlorophyll-related vegetation indices. Agric. For. Meteorol. 2009, 149, 1015–1021. [Google Scholar] [CrossRef]
- Lu, S.; Lu, X.; Zhao, W.; Liu, Y.; Wang, Z.; Omasa, K. Comparing vegetation indices for remote chlorophyll measurement of white poplar and Chinese elm leaves with different adaxial and abaxial surfaces. J. Exp. Bot. 2015, 66, 5625–5637. [Google Scholar] [CrossRef] [Green Version]
- Fawcett, D.; Panigada, C.; Tagliabue, G.; Boschetti, M.; Celesti, M.; Evdokimov, A.; Biriukova, K.; Colombo, R.; Miglietta, F.; Rascher, U.; et al. Multi-Scale Evaluation of Drone-Based Multispectral Surface Reflectance and Vegetation Indices in Operational Conditions. Remote Sens. 2020, 12, 514. [Google Scholar] [CrossRef] [Green Version]
- Osco, L.P.; Ramos, A.P.M.; Pereira, D.R.; Moriya, A.S.; Imai, N.N.; Matsubara, E.T.; Estrabis, N.; De Souza, M.; Junior, J.M.; Gonçalves, W.N.; et al. Predicting Canopy Nitrogen Content in Citrus-Trees Using Random Forest Algorithm Associated to Spectral Vegetation Indices from UAV-Imagery. Remote Sens. 2019, 11, 2925. [Google Scholar] [CrossRef] [Green Version]
- Cui, B.; Zhao, Q.; Huang, W.; Song, X.; Ye, H.; Zhou, X. A New Integrated Vegetation Index for the Estimation of Winter Wheat Leaf Chlorophyll Content. Remote. Sens. 2019, 11, 974. [Google Scholar] [CrossRef] [Green Version]
- Gitelson, A.A.; Viña, A.; Ciganda, V.; Rundquist, D.C.; Arkebauer, T.J. Remote estimation of canopy chlorophyll content in crops. Geophys. Res. Lett. 2005, 32, L08403. [Google Scholar] [CrossRef] [Green Version]
- Ballester, C.; Brinkhoff, J.; Quayle, W.C.; Hornbuckle, J. Monitoring the Effects of Water Stress in Cotton using the Green Red Vegetation Index and Red Edge Ratio. Remote Sens. 2019, 11, 873. [Google Scholar] [CrossRef] [Green Version]
- Chen, P.; Haboudane, D.; Tremblay, N.; Wang, J.; Vigneault, P.; Li, B. New spectral indicator assessing the efficiency of crop nitrogen treatment in corn and wheat. Remote Sens. Environ. 2010, 114, 1987–1997. [Google Scholar] [CrossRef]
- De Rosa, D.; Basso, B.; Fasiolo, M.; Friedl, J.; Fulkerson, B.; Grace, P.R.; Rowlings, D.W. Predicting pasture biomass using a statistical model and machine learning algorithm implemented with remotely sensed imagery. Comput. Electron. Agric. 2020, 180, 105880. [Google Scholar] [CrossRef]
- Feng, L.; Zhang, Z.; Ma, Y.; Du, Q.; Williams, P.; Drewry, J.; Luck, B. Alfalfa Yield Prediction Using UAV-Based Hyperspectral Imagery and Ensemble Learning. Remote Sens. 2020, 12, 2028. [Google Scholar] [CrossRef]
- Zhou, X.; Yang, L.; Wang, W.; Chen, B. UAV Data as an Alternative to Field Sampling to Monitor Vineyards Using Machine Learning Based on UAV/Sentinel-2 Data Fusion. Remote Sens. 2021, 13, 457. [Google Scholar] [CrossRef]
- Lamichhane, S.; Kumar, L.; Wilson, B. Digital soil mapping algorithms and covariates for soil organic carbon mapping and their implications: A review. Geoderma 2019, 352, 395–413. [Google Scholar] [CrossRef]
- Fu, Y.; Yang, G.; Song, X.; Li, Z.; Xu, X.; Feng, H.; Zhao, C. Improved Estimation of Winter Wheat Aboveground Biomass Using Multiscale Textures Extracted from UAV-Based Digital Images and Hyperspectral Feature Analysis. Remote Sens. 2021, 13, 581. [Google Scholar] [CrossRef]
- Han, L.; Yang, G.; Dai, H.; Xu, B.; Yang, H.; Feng, H.; Li, Z.; Yang, X. Modeling maize above-ground biomass based on machine learning approaches using UAV remote-sensing data. Plant Methods 2019, 15, 10. [Google Scholar] [CrossRef] [Green Version]
- Moran, J.A.; Mitchell, A.K.; Goodmanson, G.; Stockburger, K. Differentiation among effects of nitrogen fertilization treatments onconifer seedlings by foliar reflectance: A comparison of method. Tree Physiol. 2000, 20, 1113–1120. [Google Scholar] [CrossRef] [PubMed] [Green Version]
- Xu, J.-X.; Ma, J.; Tang, Y.-N.; Wu, W.-X.; Shao, J.-H.; Wu, W.-B.; Wei, S.-Y.; Liu, Y.-F.; Wang, Y.-C.; Guo, H.-Q. Estimation of Sugarcane Yield Using a Machine Learning Approach Based on UAV-LiDAR Data. Remote Sens. 2020, 12, 2823. [Google Scholar] [CrossRef]
- Canata, T.; Wei, M.; Maldaner, L.; Molin, J. Sugarcane Yield Mapping Using High-Resolution Imagery Data and Machine Learning Technique. Remote Sens. 2021, 13, 232. [Google Scholar] [CrossRef]
- Lee, H.; Wang, J.; Leblon, B. Using Linear Regression, Random Forests, and Support Vector Machine with Unmanned Aerial Vehicle Multispectral Images to Predict Canopy Nitrogen Weight in Corn. Remote Sens. 2020, 12, 2071. [Google Scholar] [CrossRef]
- QGIS.org. QGIS Geographic Information System. QGIS Association. 2021. Available online: http://www.qgis.org (accessed on 21 January 2022).
- Imran, A.B.; Khan, K.; Ali, N.; Ahmad, N.; Ali, A.; Shah, K. Narrow band based and broadband derived vegetation indices using Sentinel-2 Imagery to estimate vegetation biomass. Glob. J. Environ. Sci. Manag. 2020, 6, 97–108. [Google Scholar] [CrossRef]
- Marcial-Pablo, M.D.J.; Gonzalez-Sanchez, A.; Jimenez-Jimenez, S.I.; Ontiveros-Capurata, R.E.; Ojeda-Bustamante, W. Estimation of vegetation fraction using RGB and multispectral images from UAV. Int. J. Remote Sens. 2018, 40, 420–438. [Google Scholar] [CrossRef]
- Avola, G.; Di Gennaro, S.F.; Cantini, C.; Riggi, E.; Muratore, F.; Tornambè, C.; Matese, A. Remotely Sensed Vegetation Indices to Discriminate Field-Grown Olive Cultivars. Remote Sens. 2019, 11, 1242. [Google Scholar] [CrossRef] [Green Version]
- Boiarskii, B. Comparison of NDVI and NDRE Indices to Detect Differences in Vegetation and Chlorophyll Content. J. Mech. Contin. Math. Sci. 2019, 4, 20–29. [Google Scholar] [CrossRef]
- Eitel, J.U.H.; Vierling, L.A.; Litvak, M.E.; Long, D.S.; Schulthess, U.; Ager, A.A.; Krofcheck, D.J.; Stoscheck, L. Broadband, red-edge information from satellites improves early stress detection in a New Mexico conifer woodland. Remote Sens. Environ. 2011, 115, 3640–3646. [Google Scholar] [CrossRef]
- Zhang, J.; Wang, C.; Yang, C.; Xie, T.; Jiang, Z.; Hu, T.; Luo, Z.; Zhou, G.; Xie, J. Assessing the Effect of Real Spatial Resolution of In Situ UAV Multispectral Images on Seedling Rapeseed Growth Monitoring. Remote Sens. 2020, 12, 1207. [Google Scholar] [CrossRef] [Green Version]
- Yu, R.; Luo, Y.; Zhou, Q.; Zhang, X.; Wu, D.; Ren, L. Early detection of pine wilt disease using deep learning algorithms and UAV-based multispectral imagery. For. Ecol. Manag. 2021, 497, 119493. [Google Scholar] [CrossRef]
- Haboudane, D.; Miller, J.R.; Pattey, E.; Zarco-Tejada, P.J.; Strachan, I.B. Hyperspectral vegetation indices and novel algorithms for predicting green LAI of crop canopies: Modeling and validation in the context of precision agriculture. Remote Sens. Environ. 2004, 90, 337–352. [Google Scholar] [CrossRef]
- Kumar, V.; Sharma, A.; Bhardwaj, R.; Thukral, A.K. Comparison of different reflectance indices for vegetation analysis using Landsat-TM data. Remote Sens. Appl. Soc. Environ. 2018, 12, 70–77. [Google Scholar] [CrossRef]
- Gitelson, A.A.; Viña, A.; Arkebauer, T.J.; Rundquist, D.C.; Keydan, G.; Leavitt, B. Remote estimation of leaf area index and green leaf biomass in maize canopies. Geophys. Res. Lett. 2003, 30, 1248. [Google Scholar] [CrossRef] [Green Version]
- Wu, W. The Generalized Difference Vegetation Index (GDVI) for Dryland Characterization. Remote Sens. 2014, 6, 1211–1233. [Google Scholar] [CrossRef] [Green Version]
- Scher, C.L.; Karimi, N.; Glasenhardt, M.; Tuffin, A.; Cannon, C.H.; Scharenbroch, B.C.; Hipp, A.L. Application of remote sensing technology to estimate productivity and assess phylogenetic heritability. Appl. Plant Sci. 2020, 8, e11401. [Google Scholar] [CrossRef]
- Jannoura, R.; Brinkmann, K.; Uteau, D.; Bruns, C.; Joergensen, R.G. Monitoring of crop biomass using true colour aerial photographs taken from a remote controlled hexacopter. Biosyst. Eng. 2015, 129, 341–351. [Google Scholar] [CrossRef]
- Xue, J.; Su, B. Significant Remote Sensing Vegetation Indices: A Review of Developments and Applications. J. Sens. 2017, 2017, 1353691. [Google Scholar] [CrossRef] [Green Version]
- Susantoro, T.M.; Wikantika, K.; Saepuloh, A.; Harsolumakso, A.H. Selection of vegetation indices for mapping the sugarcane condition around the oil and gas field of North West Java Basin, Indonesia. IOP Conf. Ser. Earth Environ. Sci. 2018, 149, 012001. [Google Scholar] [CrossRef] [Green Version]
- Capolupo, A.; Monterisi, C.; Tarantino, E. Landsat Images Classification Algorithm (LICA) to Automatically Extract Land Cover Information in Google Earth Engine Environment. Remote Sens. 2020, 12, 1201. [Google Scholar] [CrossRef] [Green Version]
- Kerkech, M.; Hafiane, A.; Canals, R. Deep leaning approach with colorimetric spaces and vegetation indices for vine diseases detection in UAV images. Comput. Electron. Agric. 2018, 155, 237–243. [Google Scholar] [CrossRef]
- Tesfaye, A.A.; Awoke, B.G. Evaluation of the saturation property of vegetation indices derived from sentinel-2 in mixed crop-forest ecosystem. Spat. Inf. Res. 2021, 29, 109–121. [Google Scholar] [CrossRef]
- Melillos, G.; Hadjimitsis, D.G. Using simple ratio (SR) vegetation index to detect deep man-made infrastructures in Cyprus. In Proceedings of the Detection and Sensing of Mines, Explosive Objects, and Obscured Targets XXV, Online, 27 April–8 May 2020; Volume 114180E. [Google Scholar] [CrossRef]
- Salisu, A.; Abubakar, H.; Abubakar, H. One Way Anova: Concepts and Application in Agricultural System. In Proceedings of the CEUR Workshop Proceedings, Kaunas, Lithuania, 27 April 2018. [Google Scholar]
- Blachnik, M. Comparison of Various Feature Selection Methods in Application to Prototype Best Rules. Adv. Intell. Soft Comput. 2009, 57, 257–264. [Google Scholar] [CrossRef]
- Ramos, A.P.M.; Osco, L.P.; Furuya, D.E.G.; Gonçalves, W.N.; Santana, D.C.; Teodoro, L.P.R.; Junior, C.A.D.S.; Capristo-Silva, G.F.; Li, J.; Baio, F.H.R.; et al. A random forest ranking approach to predict yield in maize with uav-based vegetation spectral indices. Comput. Electron. Agric. 2020, 178, 105791. [Google Scholar] [CrossRef]
- Catalina, T.; Iordache, V.; Caracaleanu, B. Multiple regression model for fast prediction of the heating energy demand. Energy Build. 2013, 57, 302–312. [Google Scholar] [CrossRef]
- Perlich, C.; Provost, F.; Simonoff, J.S. Tree Induction vs. Logistic Regression: A Learning-Curve Analysis. J. Mach. Learn. Res. 2003, 4. [Google Scholar]
- Meek, C.; Thiesson, B.; Heckerman, D. The Learning-Curve Sampling Method Applied to Model-Based Clustering. J. Mach. Learn. Res. 2002, 2, 397–418. [Google Scholar]
- Jozdani, S.E.; Johnson, B.A.; Chen, D. Comparing Deep Neural Networks, Ensemble Classifiers, and Support Vector Machine Algorithms for Object-Based Urban Land Use/Land Cover Classification. Remote Sens. 2019, 11, 1713. [Google Scholar] [CrossRef] [Green Version]
- Wei, L.; Wang, Z.; Huang, C.; Zhang, Y.; Wang, Z.; Xia, H.; Cao, L. Transparency Estimation of Narrow Rivers by UAV-Borne Hyperspectral Remote Sensing Imagery. IEEE Access 2020, 8, 168137–168153. [Google Scholar] [CrossRef]
- Yang, X.; Yang, R.; Ye, Y.; Yuan, Z.; Wang, D.; Hua, K. Winter wheat SPAD estimation from UAV hyperspectral data using cluster-regression methods. Int. J. Appl. Earth Obs. Geoinf. 2021, 105, 102618. [Google Scholar] [CrossRef]
- Yoosefzadeh-Najafabadi, M.; Earl, H.J.; Tulpan, D.; Sulik, J.; Eskandari, M. Application of Machine Learning Algo-rithms in Plant Breeding: Predicting Yield from Hyperspectral Reflectance in Soybean. Front. Plant Sci. 2021, 11, 2169. [Google Scholar] [CrossRef]
- Dong, T.; Shang, J.; Chen, J.M.; Liu, J.; Qian, B.; Ma, B.; Morrison, M.J.; Zhang, C.; Liu, Y.; Shi, Y.; et al. Assessment of Portable Chlorophyll Meters for Measuring Crop Leaf Chlorophyll Concentration. Remote Sens. 2019, 11, 2706. [Google Scholar] [CrossRef] [Green Version]
- Liu, Y.; Liu, S.; Li, J.; Guo, X.; Wang, S.; Lu, J. Estimating biomass of winter oilseed rape using vegetation indices and texture metrics derived from UAV multispectral images. Comput. Electron. Agric. 2019, 166, 105026. [Google Scholar] [CrossRef]


| No | Models | Equation | Hyper Parameter and Optimum Values |
|---|---|---|---|
| 1 | MLR | where; R2: R-squared SSres: residual sum of squares SStot: total sum of squares. where; RMSE: root mean square error are predict values y1, y2…, yn are observed values n is the number of observations | normalize = True |
| 2 | RF | Bootstrap = True max_depth = 10 n_estimators =150 random_state = 11 | |
| 3 | DT | criterion = mse random_state = 0 max_depth = 9 | |
| 4 | SVR | kernel = rbf | |
| 5 | XGB | learning_rate = 0.001 max_depth = 20 n_estimators = 200 use_label_encoder = False | |
| 6 | KNN | n_neighbors = 23 weights = uniform algorithm = auto leaf_size = 30 | |
| 7 | ANN | learning_rate = 0.0001 epochs = 7000 batch_size = 100 validation |
| Parameter | Reading |
|---|---|
| Average air temperature | 27.98 °C |
| Maximum air temperature | 23.5 °C |
| Minimum air temperature | 34.0 °C |
| Minimum relative humidity | 50% |
| Maximum relative humidity | 71% |
| Average wind speed | 4.2 km/h |
| Treatment No | Treatment |
|---|---|
| T1 | Fertilizer mixture (FM) 1 (Provide 80% from SRI recommended nutrient level) |
| T2 | FM 1 (Provide 65% from SRI recommended nutrient level) |
| T3 | FM 1 (Provide 50% from SRI recommended nutrient level) |
| T4 | FM 2 (Provide 80% from SRI recommended nutrient level) |
| T5 | FM 2 (Provide 65% from SRI recommended nutrient level |
| T6 | FM 2 (Provide 50% from SRI recommended nutrient level |
| T7 | 100% from SRI recommendation |
| T8 | 80% from SRI recommendation |
| T9 | 75% from SRI recommendation + 25% Compound fertiliser |
| T10 | 65% from SRI recommendation |
| T11 | 50% from SRI recommendation |
| T12 | Zero Fertilizer |
| Height | 15m |
|---|---|
| Ground Sampling Distance (GSD) | 1.42 cm/px |
| Speed | 6 ms−1 |
| Overlap | Front-80% & Side-70% |
| Time | 12.30–02.00 p.m. |
| No | Vegetation Indices | Formula | Purpose | References |
|---|---|---|---|---|
| 01 | Normalized Difference Vegetation Index (NDVI) | Estimation of vegetation biomass, | [43] | |
| 02 | Green Normalized Difference Vegetation Index (GNDVI) | Estimation of vegetation fraction, Estimation of productivity and assess phylogenetic heritability, Discrimination of field-grown olive cultivars | [44,46] | |
| 03 | Normalized Difference Red Edge Index (NDRE) | Detect Differences in Vegetation and Chlorophyll Content., Early stress detection, Growth monitoring | [47,48,49] | |
| 04 | Leaf Chlorophyll Index (LCI) | Early detection of pine wilt disease | [50] | |
| 05 | Difference Vegetation Index (DVI) | Prediction of green LAI of crop canopies, Comparison of different reflectance indices for vegetation analysis, discriminate field-grown olive cultivars | [46,51,52] | |
| 06 | Ratio Vegetation Index (RVI) | Early detection of pine wilt disease | [50] | |
| 07 | Enhanced Vegetation Index (EVI) | Early detection of pine wilt disease | [50] | |
| 08 | Triangular Vegetation Index (TVI) | TVI = 60(NIR − G) − 100(R − G) | Early detection of pine wilt disease | [50] |
| 09 | Green Chlorophyll Index (GCI) | Estimation of leaf area index and green leaf biomass | [52,53] | |
| 10 | Green Difference Vegetation Index (GDVI) | Generalized Difference Vegetation Index (GDVI) estimate productivity and assess phylogenetic heritability | [45,46,54] | |
| 11 | Normalized Green Red Difference Index (NGRDI) | Monitoring of crop biomass | [46,55] | |
| 12 | Modified Soil-Adjusted Vegetation Index (MSAVI) | Significant remote sensing vegetation indices | [56] | |
| 13 | Atmospherically Resistant Vegetation Index (ARVI) | Significant remote sensing vegetation indices | [56] | |
| 14 | Structure Insensitive Pigment Index (SIPI) | Mapping the sugarcane | [57] | |
| 15 | Optimized Soil-Adjusted Vegetation Index (OSAVI) | Extraction of land cover information | [58] | |
| 16 | Green Optimized Soil Adjusted Vegetation Index (GOSAVI) | Extraction of land cover information | [58] | |
| 17 | Excess Green (ExG) | Vine diseases detection | [59] | |
| 18 | Excess Red (ExR) | Vine diseases detection | [59] | |
| 19 | Excess Green Red (ExGR) | Vine diseases detection | [59] | |
| 20 | Green Red Vegetation Index (GRVI) | Vine diseases detection | [59] | |
| 21 | Normalized Difference Index (NDI) | Vine diseases detection | [59] | |
| 22 | Red Green Index (RGI) | Vine diseases detection | [59] | |
| 23 | Enhanced Normalized Difference Vegetation Index (ENDVI) | Mapping the sugarcane | [57] | |
| 24 | Simple Ratio Index (SRI) | SRI = NIR/R | Evaluation of the saturation property of vegetation indices | [60,61] |
| ML Model | R2 (Training) | R2 (Validation) | RMSE | |||
|---|---|---|---|---|---|---|
| BFS | AFS | BFS | AFS | BFS | AFS | |
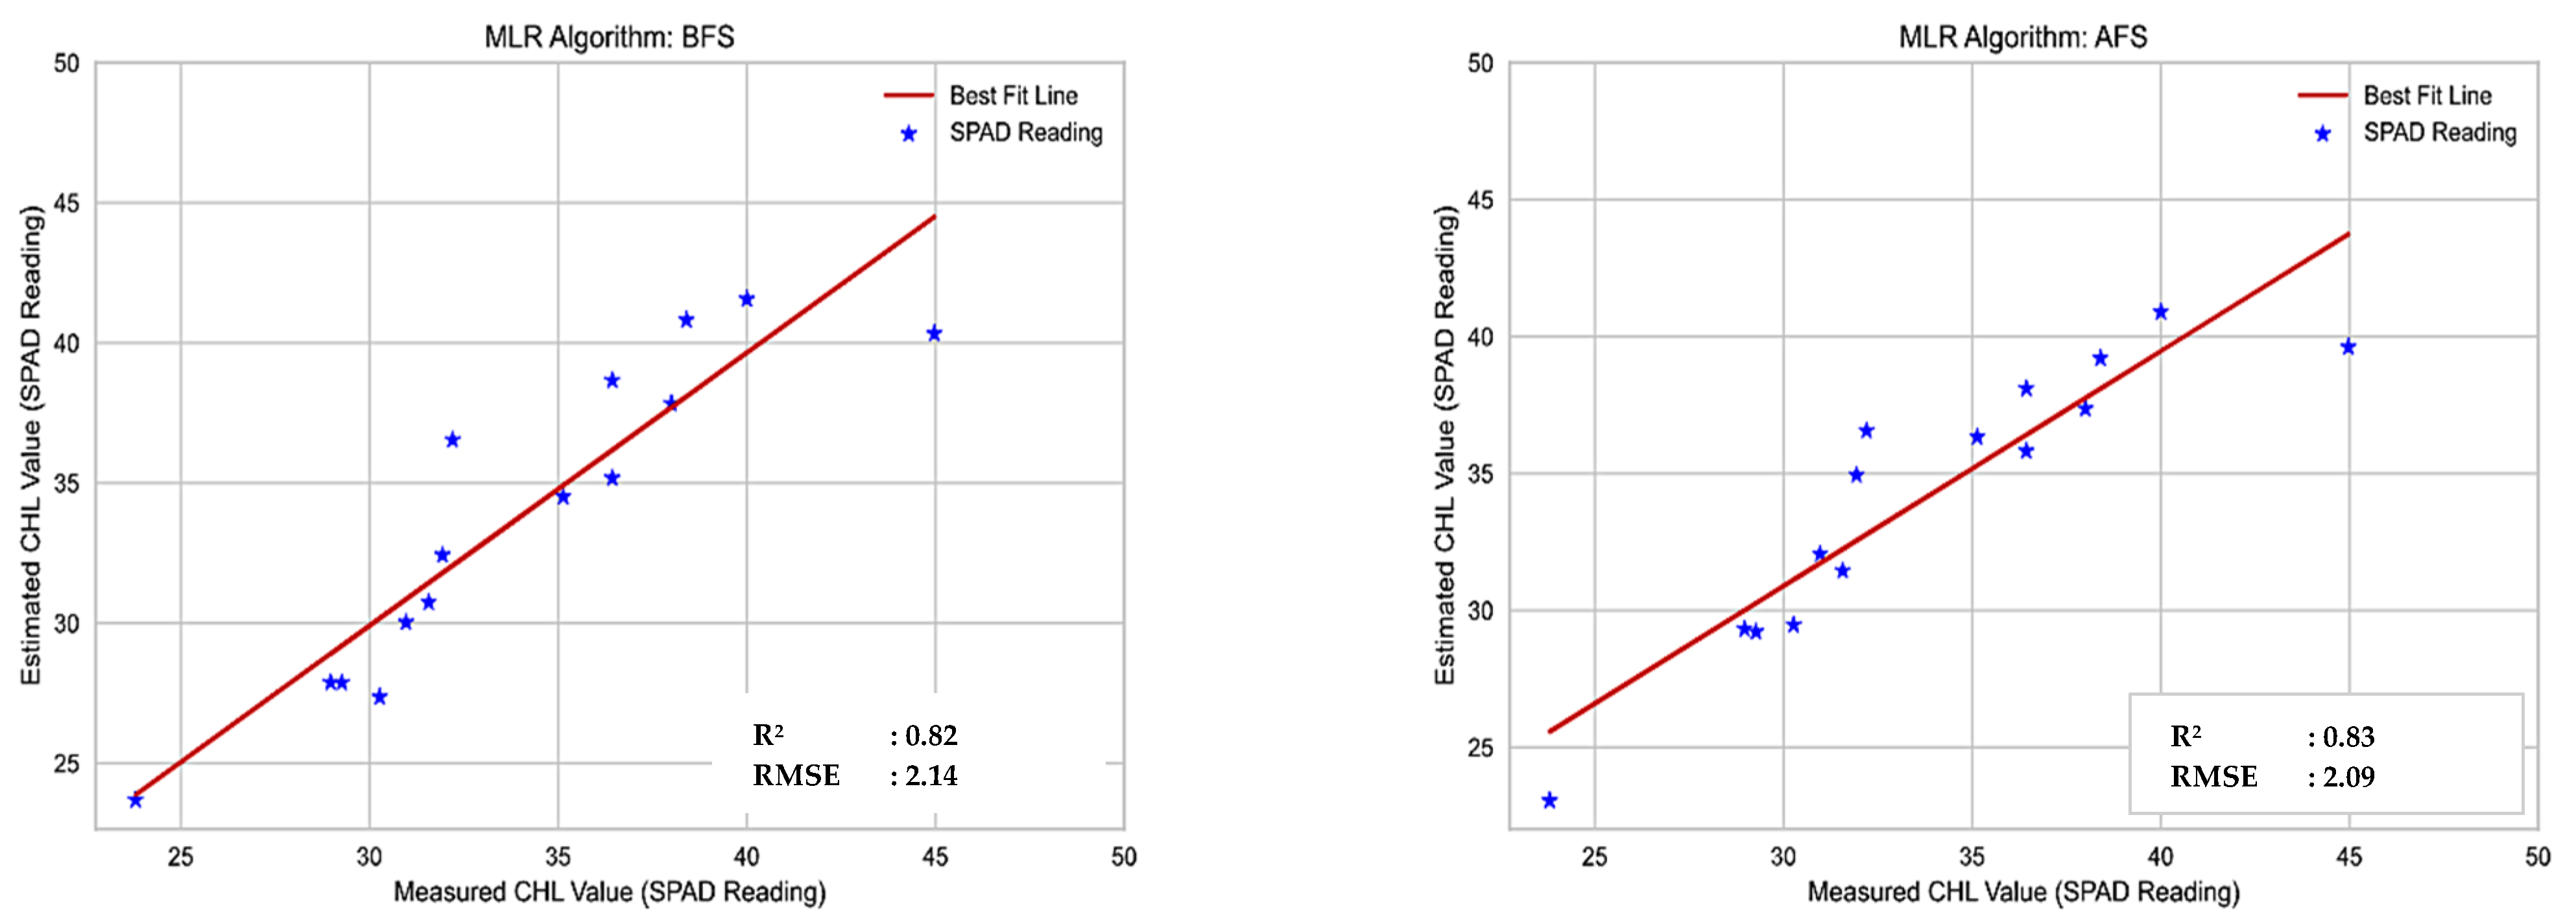
| MLR | 0.95 | 0.93 | 0.82 | 0.83 | 2.14 | 2.09 |
| RF | 0.99 | 0.99 | 0.95 | 0.95 | 1.11 | 1.09 |
| DT | 1.00 | 1.00 | 0.94 | 0.94 | 1.21 | 1.25 |
| SVR | 0.74 | 0.85 | 0.65 | 0.78 | 3.02 | 2.37 |
| XGB | 0.99 | 0.99 | 0.96 | 0.98 | 0.14 | 0.78 |
| KNN | 0.69 | 0.73 | 0.68 | 0.75 | 3.42 | 3.18 |
| ANN | 0.98 | 0.98 | 0.87 | 0.76 | 1.83 | 2.48 |
Publisher’s Note: MDPI stays neutral with regard to jurisdictional claims in published maps and institutional affiliations. |
© 2022 by the authors. Licensee MDPI, Basel, Switzerland. This article is an open access article distributed under the terms and conditions of the Creative Commons Attribution (CC BY) license (https://creativecommons.org/licenses/by/4.0/).
Share and Cite
Narmilan, A.; Gonzalez, F.; Salgadoe, A.S.A.; Kumarasiri, U.W.L.M.; Weerasinghe, H.A.S.; Kulasekara, B.R. Predicting Canopy Chlorophyll Content in Sugarcane Crops Using Machine Learning Algorithms and Spectral Vegetation Indices Derived from UAV Multispectral Imagery. Remote Sens. 2022, 14, 1140. https://doi.org/10.3390/rs14051140
Narmilan A, Gonzalez F, Salgadoe ASA, Kumarasiri UWLM, Weerasinghe HAS, Kulasekara BR. Predicting Canopy Chlorophyll Content in Sugarcane Crops Using Machine Learning Algorithms and Spectral Vegetation Indices Derived from UAV Multispectral Imagery. Remote Sensing. 2022; 14(5):1140. https://doi.org/10.3390/rs14051140
Chicago/Turabian StyleNarmilan, Amarasingam, Felipe Gonzalez, Arachchige Surantha Ashan Salgadoe, Unupen Widanelage Lahiru Madhushanka Kumarasiri, Hettiarachchige Asiri Sampageeth Weerasinghe, and Buddhika Rasanjana Kulasekara. 2022. "Predicting Canopy Chlorophyll Content in Sugarcane Crops Using Machine Learning Algorithms and Spectral Vegetation Indices Derived from UAV Multispectral Imagery" Remote Sensing 14, no. 5: 1140. https://doi.org/10.3390/rs14051140
APA StyleNarmilan, A., Gonzalez, F., Salgadoe, A. S. A., Kumarasiri, U. W. L. M., Weerasinghe, H. A. S., & Kulasekara, B. R. (2022). Predicting Canopy Chlorophyll Content in Sugarcane Crops Using Machine Learning Algorithms and Spectral Vegetation Indices Derived from UAV Multispectral Imagery. Remote Sensing, 14(5), 1140. https://doi.org/10.3390/rs14051140