Technical Note

First Form, Then Function: 3D Reconstruction of Cucumber Plants (Cucumis sativus L.) Allows Early Detection of Stress Effects through Leaf Dimensions

Institute of Horticultural Production Systems, Leibniz Universität Hannover, D-30419 Hannover, Germany
*
Author to whom correspondence should be addressed.
Remote Sens. 2022, 14(5), 1094; https://doi.org/10.3390/rs14051094
Submission received: 17 January 2022 / Revised: 18 February 2022 / Accepted: 18 February 2022 / Published: 23 February 2022

Abstract

:
Detection of morphological stress symptoms through 3D examination of plants might be a cost-efficient way to avoid yield losses and ensure product quality in agricultural and horticultural production. Although the 3D reconstruction of plants was intensively performed, the relationships between morphological and physiological plant responses to salinity stress need to be established. Therefore, cucumber plants were grown in a greenhouse in nutrient solutions under three salinity treatments: 0, 25, and 50 mM NaCl. To detect stress-induced changes in leaf transversal and longitudinal angles and dimensions, photographs were taken from plants for 3D reconstruction through photogrammetry. For assessment of physiological stress responses, invasive leaf measurements, including the determination of leaf osmotic potential, leaf relative water content, and the leaf dry to fresh weight ratio, were performed. The transversal and longitudinal leaf dimensions revealed statistically significant differences between stressed and control plants after 60 °Cd (day 3) for the leaves which appeared before stress imposition. Strong correlations were found between the transversal width and some investigated physiological traits. Morphological changes were shown as indicators of physiological responses of leaves under salinity stress.

1. Introduction

Plants are constantly subjected to changes in environmental variables, which might act as stressors when a certain threshold is reached. Under stress conditions, plants respond at both morphological and physiological levels [1]. Under NaCl salinity stress, the plant absorbs sodium and chloride present in the root zone. If the plant cell cannot distribute sodium efficiently, the plant is forced to exclude sodium from the leaf, which is energy costly. If this adaptation mechanism collapses, the plant suffers from sodium toxicity [2,3]. As part of the stress avoidance strategy, a change of leaf angle might help to prevent water loss through transpiration, alongside the reduction in the stomatal conductance, leaf rolling, and the reduction in leaf area growth [3]. Significant yield loss and reduction in photosynthetic traits were observed in plants under salinity stress [3,4,5]. Therefore, early stress detection might help to prevent yield reduction.
Salinity stress firstly causes a reduction in the osmotic potential in the nutrient solution, which leads to a reduction in leaf expansion and stomatal conductance [3,5]. Then, the biochemical capacity of leaves is affected, and the stomatal regulation is disturbed due to the accumulation of sodium and chloride ions in the leaves leading to an ionic effect [3,5]. The accumulation is faster in matured leaves [2], leading to an appearance of chlorotic and partially necrotic spots [6]. For plant species with high water use efficiency WUEs, such as tomatoes, the toxicity of sodium might be delayed [7,8].
Plant 3D architecture can provide morphological information, which might help to quantify the abiotic stress status. Different methods such as light detection and ranging (LiDAR), laser scans, time of flight (ToF) cameras, and stereoscopic viewing were investigated as non-invasive methods to assess plant 3D architecture. LiDAR was used to investigate some canopy traits such as volumes [9], leaf area, width, height [10]. Other methods such as ToF and stereoscopy were successfully used to measure structural traits such as leaf angles and optical parameters such as reflectance of plant populations [11,12,13]. However, the application of these methods is much easier in isolated plants than in dense canopies, as they mostly require space for the interaction of robots with the plants. A 3D reconstruction of images using photogrammetry allows the reconstruction of objects with clear lines or regular shapes. Although plants have a complex geometry difficult to reconstruct through photogrammetry, traits such as leaf area, leaf angle, and plant topology were successfully determined using 3D models [14], and good correlations with physiological traits were reported [14].
Physiological parameters obtained from destructively sampled plant material such as ion content, water potential, or osmotic potential were reported as good indicators of plant abiotic stress [3]. On the other hand, non-invasive methods using hyperspectral images were performed in different plant species to detect early stress, senescence, or disease symptoms [15,16,17,18,19,20,21]. For instance, stress symptoms were found ten days earlier from hyperspectral images than using the dimensionless normalized difference vegetation index, which describes the difference between visible and near-infrared reflectance of vegetation cover. Using architectural characteristics included in a 3D model and hyperspectral images of sugar beet, high accuracy in the detection of leaf spot disease symptoms was observed [16]. A hyperspectral camera was used to observe the drought recovery after the re-watering through leaves reflectance of maize plants [17]. Especially narrow waveband reflectance within a range of 690–700 nm was suggested to be helpful for early plant stress detection [18,19,20,21]. Stomatal conductance showed a high correlation with a band combination of hyperspectral data under drought stress [22]. A laser scanner showed the low night temperature stress affected the plant height of sweep pepper only six hours post-stress imposition [23]. Although the hyperspectral camera and the laser scanner were found efficient for early stress detection of individual plants, the sensors are still not affordable for low budgets, and therefore, there is a need for cheaper tools and affordable methods. As an alternative to a multispectral camera, the Microsoft Kinect RGB camera of the Xbox360 gaming console can relatively easily reproduce small objects in 3D and in real-time. This method is easy to use since a successful measurement of plant height was reported [24] but showed a limitation under direct sunlight, which leads to missing tree branches in cherry trees [25].
The aim of this work was to investigate architectural and physiological plant traits for early stress recognition using 3D reconstruction by photogrammetry of RGB images. We would like to investigate (1) whether non-invasive or invasive measurement methods allow an earlier stress detection and (2) whether there are relationships between invasive and non-invasive measurement methods.

2. Materials and Methods

2.1. Plant Material

Two experiments were conducted in a greenhouse of the Institute of Horticultural Production Systems, Leibniz Universität Hannover, Germany (52.5°N, 9.7°E) in March and June 2017. Cucumber seeds (Cucumis sativus, cv. Aramon, Rijk Zwaan, De Lier, Netherlands) were sown in rock-wool cubes (36 mm × 36 mm × 40 mm) for each experiment. Seven days after sowing, seedlings were transplanted into larger rock-wool cubes (10 cm × 10 cm × 6.5 cm) and grown there for another seven days until the appearance of the third leaf. Then, seedlings were transplanted upon Styrofoam floating in a container filled with 30 L of nutrient solution in the greenhouse. There was one plant per container, and each container was placed on a scale to record the weight of the container and a rod, which was attached to the container to support the cucumber plant. Each litre of the nutrient solution contained 0.53 g Ca(NO3)2 and 0.65 g Ferty Basisdünger 1 (Planta GmbH, Regenstauf, Germany). The electrical conductivity was adjusted to 1.2–1.3 mS cm−1, and the pH was kept between 5.6–6.2 by adding 1% sulfuric acid to the nutrient solution and changing the solution weekly. A total of eighteen experimental plants were distributed randomly to three blocks to achieve a plant density of 0.4 plants m−2. The blocks were organized to reduce the light gradient effect within the glasshouse. The three plants in the south of the greenhouse were considered as border plants and received no salinity treatment. When the fifth leaf reached roughly 5 cm in length, containers received salinity treatments of 0, 25, and 50 mM NaCl in the nutrient solution with two repetitions per block. A weekly refreshment of all treatment solutions was performed. The day/night temperature for heating was set to 22 °C day/20 °C night. Greenhouse ventilation was opened at 24 °C during daytime. All side shoots under leaf six and fruits were removed during the early vegetative growth of the plant.

2.2. Measurements

Destructive and non-destructive measurements were performed on different dates for leaves 3, 7, and 11. The first measurement was performed at the five-leaf stage when salinity stress was imposed. The number of repetitions varied with measurements and days post-stress imposition. At the stress imposition, there were 6 repetitions for each stress treatment. At stress imposition (day 0, 16 °Cd), four repetitions per treatment were measured, and photos were taken. On days 1 (33 Cd), 2 (39 °Cd), 3 (60 °Cd), 7 (110 °Cd) and 8 (133 °Cd), a total of 2 repetitions were measured for each treatment. On days 14 (220 °Cd) and 21 (325 °Cd), 4 replications were measured for each treatment.

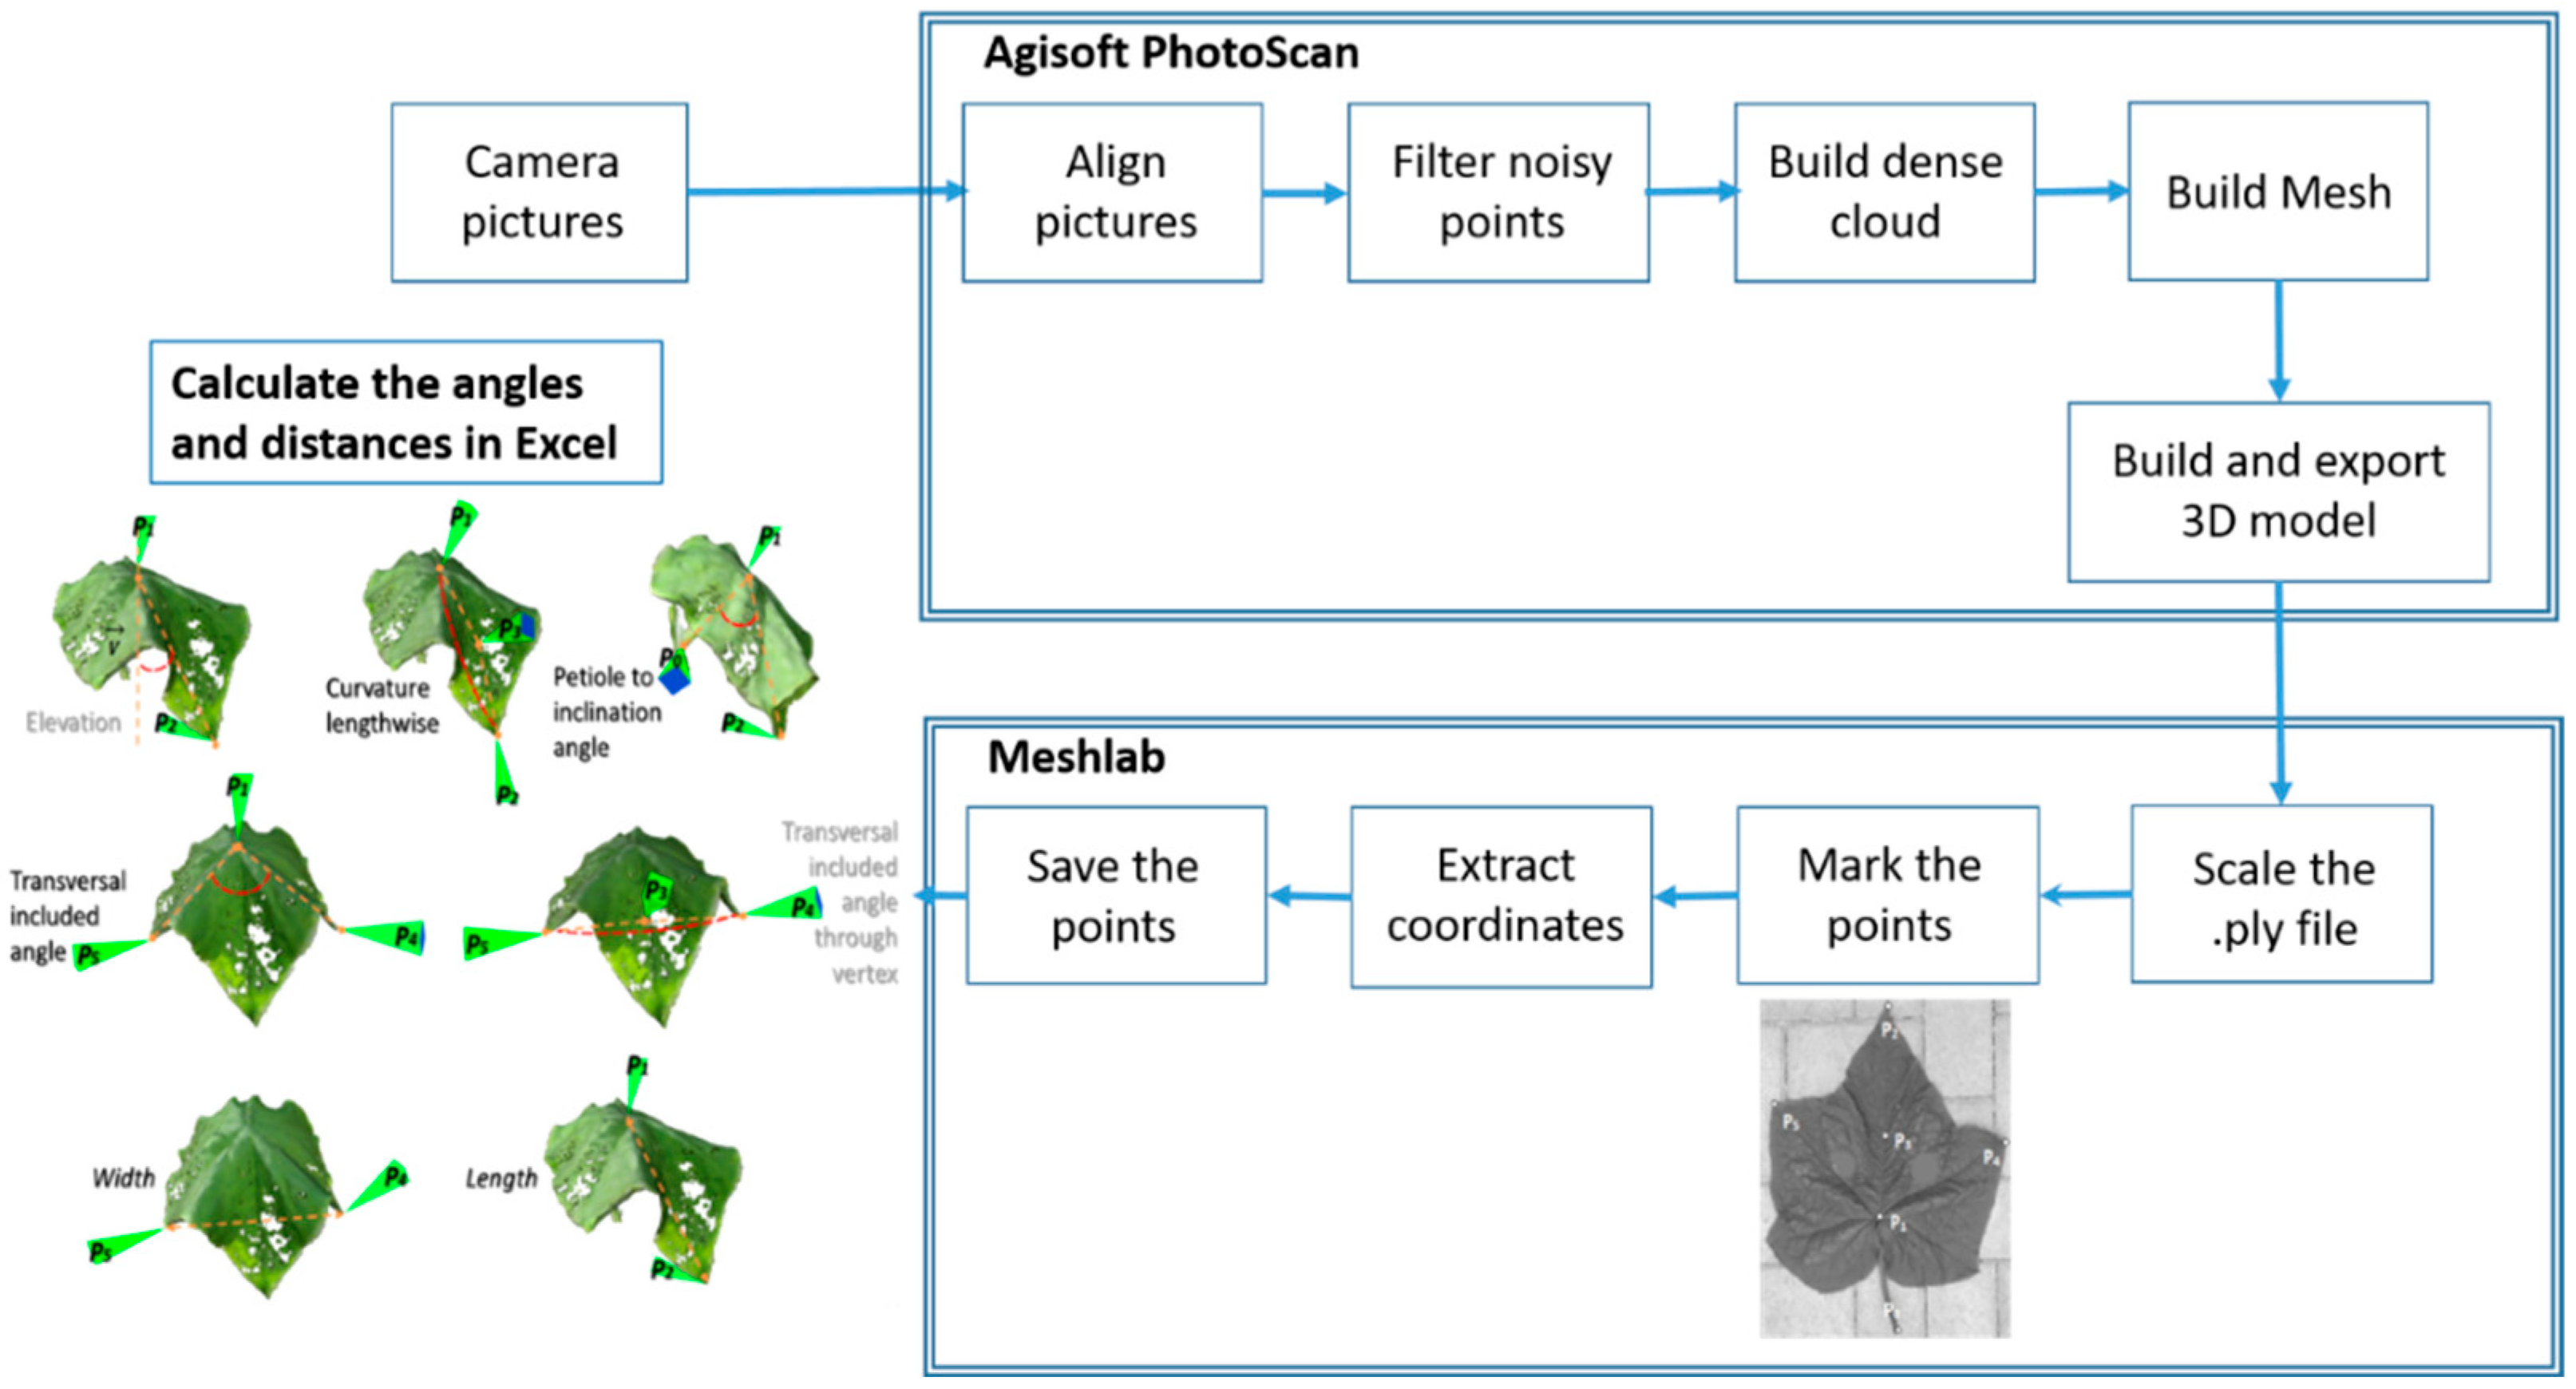
2.2.1. Non-Invasive Measurements

Pictures of each experimental plant were taken in JPEG format from different angles with the digital single-lens reflex camera (Canon EOS 750 D, Canon Germany GmbH, Krefeld, Germany) with an overlapping region of about 50–70%. Depending on the size of the plant, the number of obtained photos ranges between 60 and 160. After importing the pictures of individual plants in Agisoft PhotoScan (Agisoft version 1.3.2, Agisoft LLC, St. Petersburg, Russia), a 3D reconstruction of the plants was performed, and the result was exported to a .ply file (Figure 1). In the program MeshLab (version 2016.12, [26], 2008), the 3D model was first scaled using the grids with known size place at the base of the plant. Then, measurement points for obtaining the angles and distances on leaves 3, 7, and 11 were selected on the 3D plant and saved as pp-file to be imported in Excel. The points P0, P1, P2, P3, P4, and P5 were chosen, as can be observed in Figure 1, to capture the variation of different leaf architectural traits.
The curvature lengthwise is the included angle along the leaf’s main vein defined by the vectors P 3 P 1   and P 3 P 2   , in reference to the angle between the points P2, P1, and P3. The larger the angle, the less curved the leaf is in the longitudinal direction. The basic formula for all curvature angles is:
P 1 P 3 P 2 ^ = c o s 1 ( P 3 P 1   × P 3 P 2 | P 3 P 1   | · | P 3 P 2 | ) .
The curvature along the petiole is defined as the included angle along the leaf’s main vein and along the petiole that lies between P0, P1, and P2. The distance between the internode and the leaf tip is proportional to the angle   P 0 P 1 P 2 ^ :
P 0 P 1 P 2 ^ = c o s 1 ( P 1 P 0   × P 1 P 2 | P 1 P 0   | · | P 1 P 2 | ) .
The transversal curvature, i.e., the curvature of the leaf width, can be defined by the angle P 4 P 1 P 5 ^ formed by the vectors P 1 P 4   , and P 1 P 5 . P 4 P 1 P 5 ^ is the included angle broadside of the leaf’s opposite margins of second-order veins. The angle can be derived in a similar way to Equations (1) and (2).
Leaf transversal P4P5 and longitudinal distances P1P2 are denoted here as “width” and “length”. However, the reader has to keep in mind that these are 3D distances and do not denote the width or length of the flat-leaf. These leaf distances are caused by leaf curvature and are sensitive to stress treatment.

2.2.2. Invasive Measurements

Destructive measurements such as osmotic potential (Ψs), relative water content (cW), leaf dry weight (WLd), the fresh weight (WLf), and the dry weight to fresh weight ratio (rd). For the measurement of Ψs, circular leaf disks of 0.5 cm diameter were cut from the leaves, dipped in liquid nitrogen, and then stored in the freezer at −15 °C until the end of sampling. The samples were individually transferred to sample chambers connected to a psychrometer (Psypro C-52, Wescor Inc., Logan, UT, USA) and left there for two hours at room temperature to equilibrate. Each measurement included three log-intervals of five minutes each. Only the third reading was kept. A 2 cm diameter circular section was punched out of the leaves, and the fresh weight (FW), the weight at full turgor (DW100), and the dry weight (DW) were determined. The relative water content was calculated as RWC   ( % ) = F W D W D W 100 D W × 100 . From DW and FW, the dry weight to fresh weight ratio was calculated in % by   D W F W × 100 . Furthermore, ion analyses (sodium, chloride, and potassium) of leaves and fruits were conducted, and the DW_FW_ratios of the fruits were calculated.

2.3. Statistical Analysis

Data were analyzed with a linear mixed model (R-version 3.5.1, R Foundation) using the package lmer4 with blocks and experiments as random factors. To evaluate linear correlations between non-invasive and invasive measurements within leaves 3 and 7, linear regressions were used. To evaluate the salinity stress effect on both destructive and non-destructive traits, a linear mixed model was used. Thereafter, pairwise comparisons were carried out using the Tukey test to evaluate the significance of each salinity treatment with control. The packages lmerTest and emmeans were applied.
The significances indicated by asterisks (*) denote significant differences to the control at p < 0.05 based on the Tukey test. Significant difference between all treatments determined using the Tukey test is indicated by different letters. The figures show mean values as well as standard deviations over the thermal time ( T m a x + T m i n   2 T b a s e ) and diverse repetition numbers. The hourly averaged temperature values Tmax and Tmin or Tbase represent the maximum, minimum, or base temperature (10 °C) in the greenhouse.

3. Results

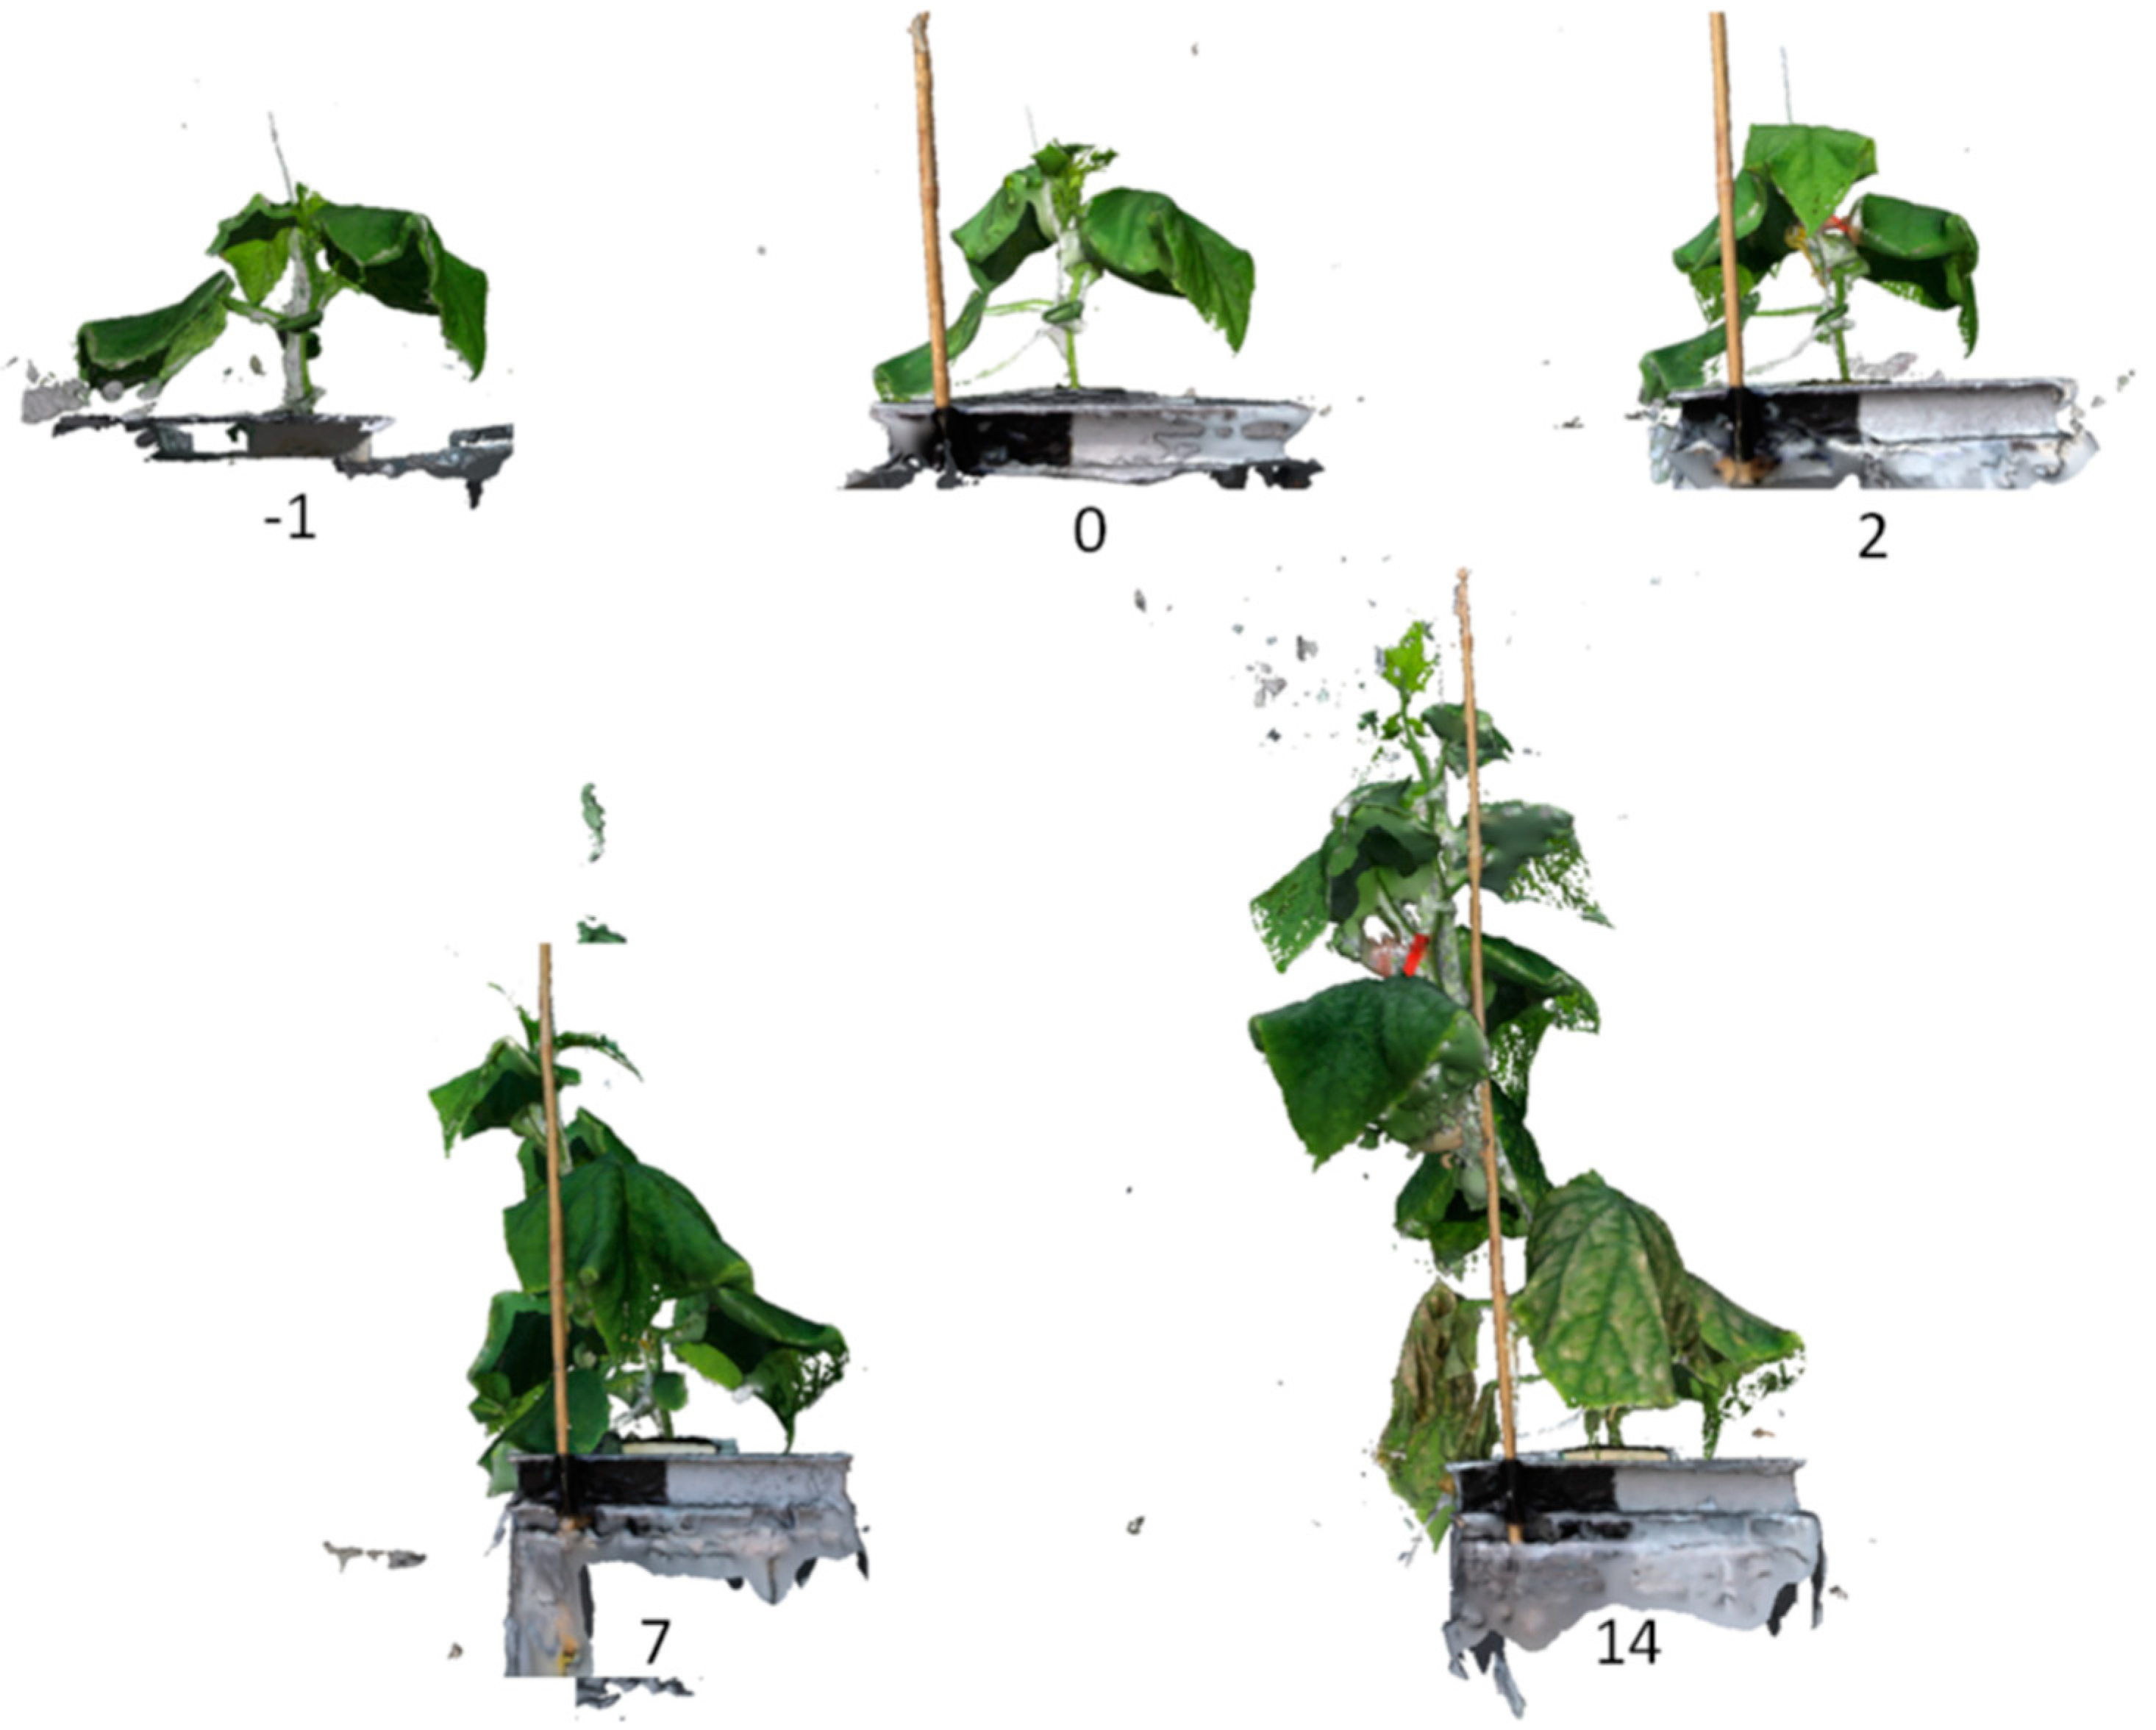
3.1. 3D Reconstruction of Plants

3D reconstruction of the plants from photographs was successful (Figure 2). This allowed quantifying the morphological development of each plant. Plants with 50 mM NaCl concentration showed leaf symptoms such as chloroses and necrosis from day 14. The oldest leaves were most affected by the stress.

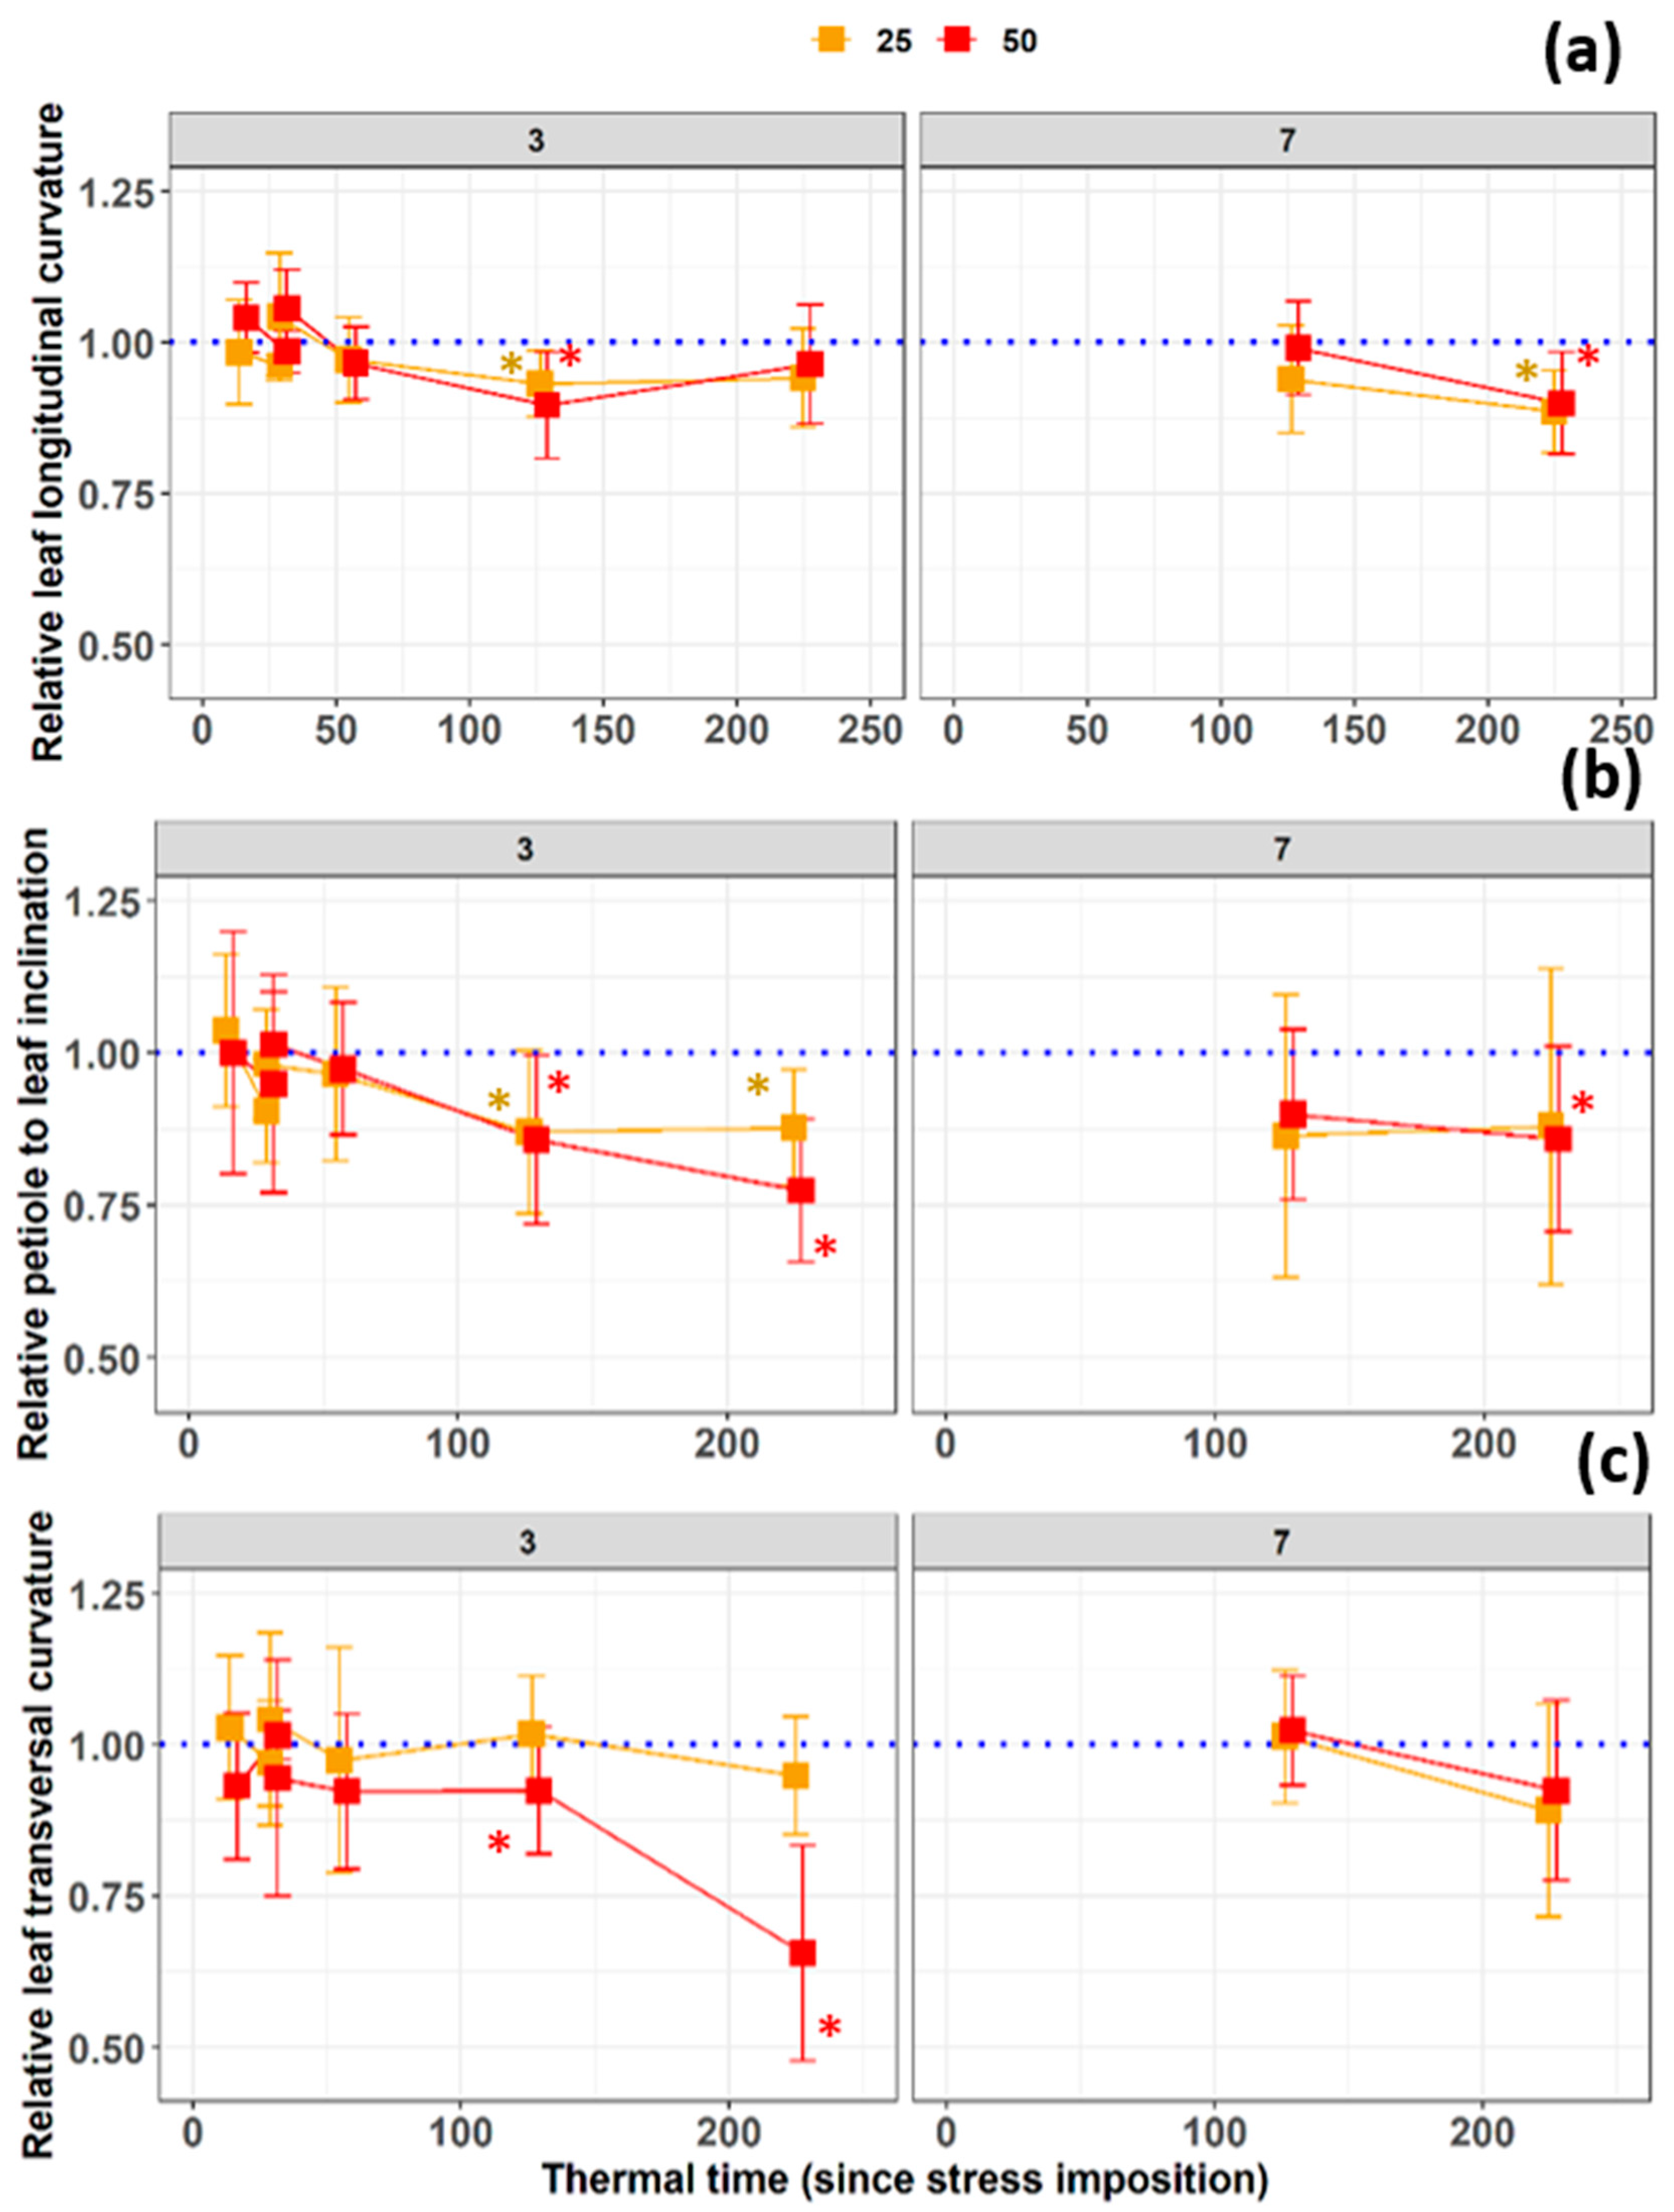
3.2. Early Detection of Salinity Stress from Leaf Longitudinal and Transversal Dimensions after 60 °Cd

Transversal widths of the third leaves were found very sensitive to salt stress when grown under 50 mM NaCl and less sensitive in the 25 mM NaCl treatment (Figure 3a). Transversal widths of the leaves, which appeared at stress imposition (leaves 7), reacted equally sensitive to stress as lengths. At 60 °Cd after the imposition of salinity stress, leaves three exposed to 50 mM NaCl already had a significantly shorter longitudinal length than the control (Figure 3b). For leaves seven, the differences between the leaf lengths at 50 mM NaCl to the control treatment were significant from the first time at 110 °Cd. The leaves under 25 mM NaCl treatment also had a shorter longitudinal length than the control leaves at 133 °Cd and 220 °Cd. Leaves 11 significant effects under showed from the beginning 25 and 50 mM NaCl.

3.3. Stress Response of the Transversal Leaf Included Angle

After 110 °Cd there were significant differences in longitudinal included angle of leaves three for both stress treatments in comparison to the controls. However, the difference was no longer significant at 220 °Cd (Figure 4a). From the beginning of the salinity treatment until the last measurement date 220 °Cd later, the transversal included angle of leaves three decreased in both salt treatment, and was significant from 133 °Cd on (Figure 4c). A statistically significant difference between stress and control treatments was obtained from time 133 °Cd on for leaves three (Figure 4c).

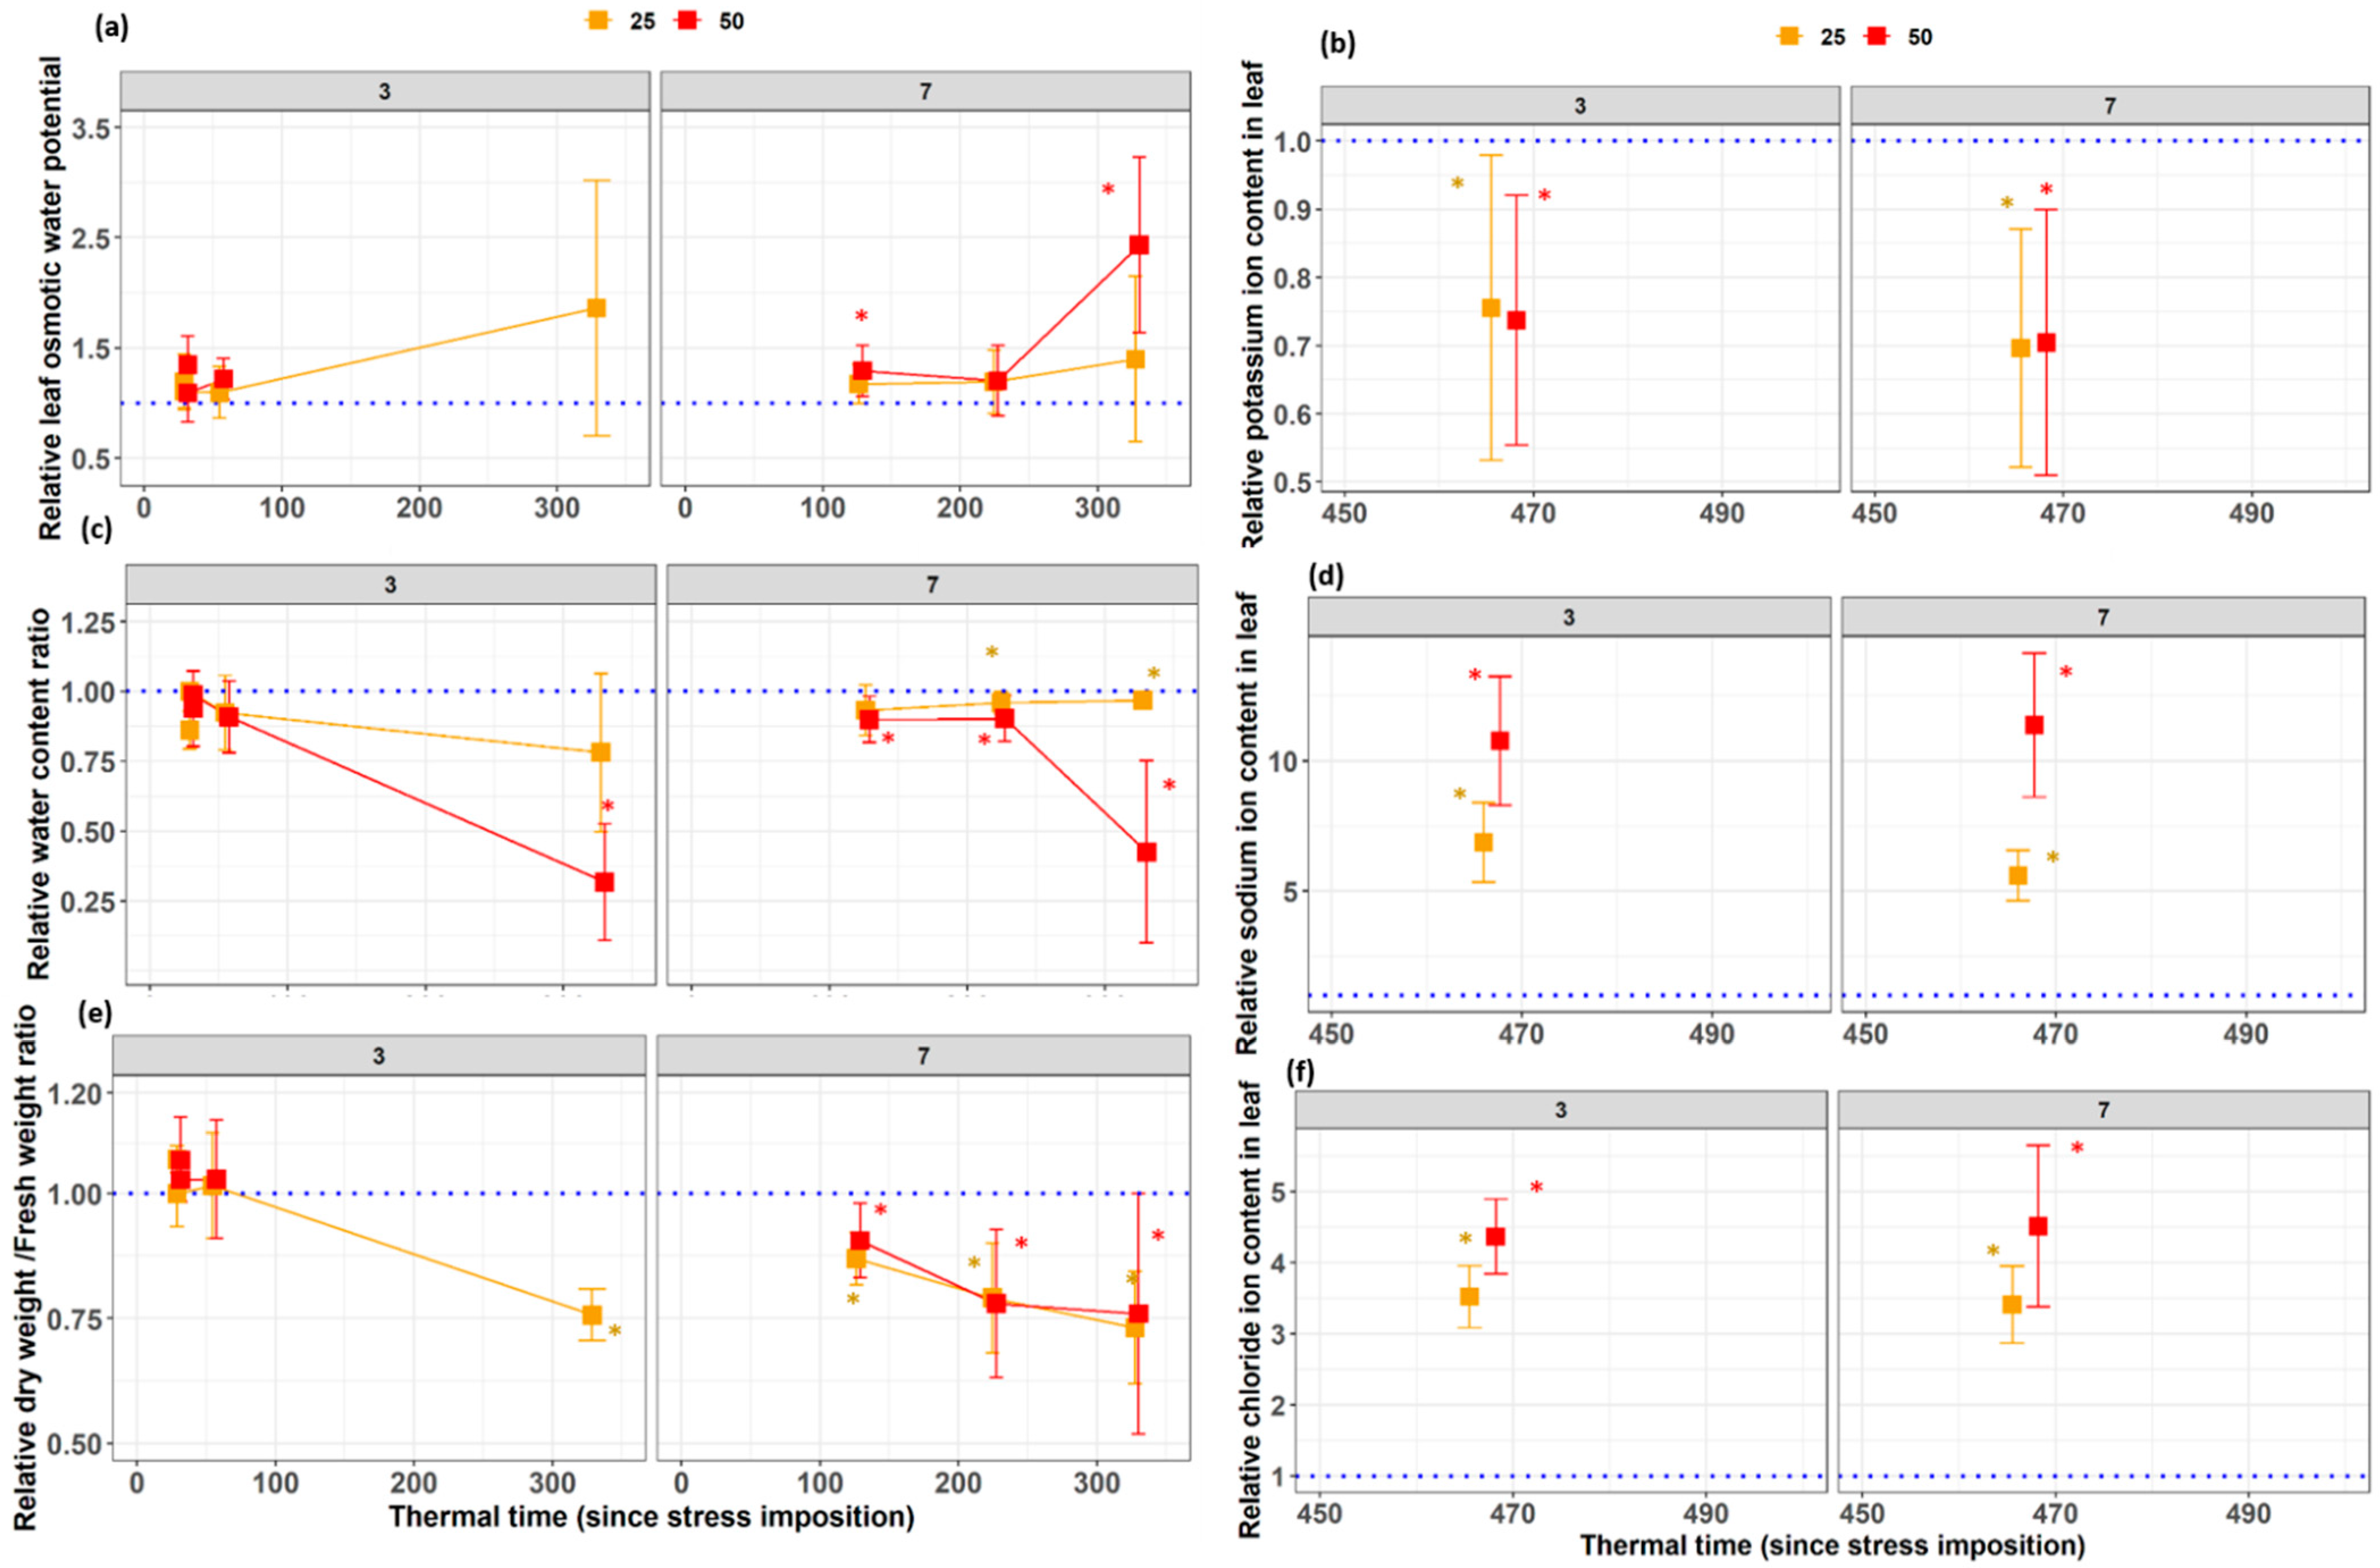
3.4. Physiological Traits

At the beginning of the measurements of leaf 7 (110 °Cd), the relative leaf water potential, the relative water content, and the relative dry weight/ fresh weight ratio of the 50 mM treatment were significantly different from the control (Figure 5a,c,e). These trends were kept during the leaf development at each measurement time point. A similar trend was observed for the 25 Mm salinity treatment but was less pronounced. For leaves three, which was already growing at stress imposition, almost no significant salinity stress effect was observed on the physiological parameters investigated. However, there were significant differences in sodium, potassium, and chloride concentration in leaves three at the final harvest (Figure 5b,d,f).

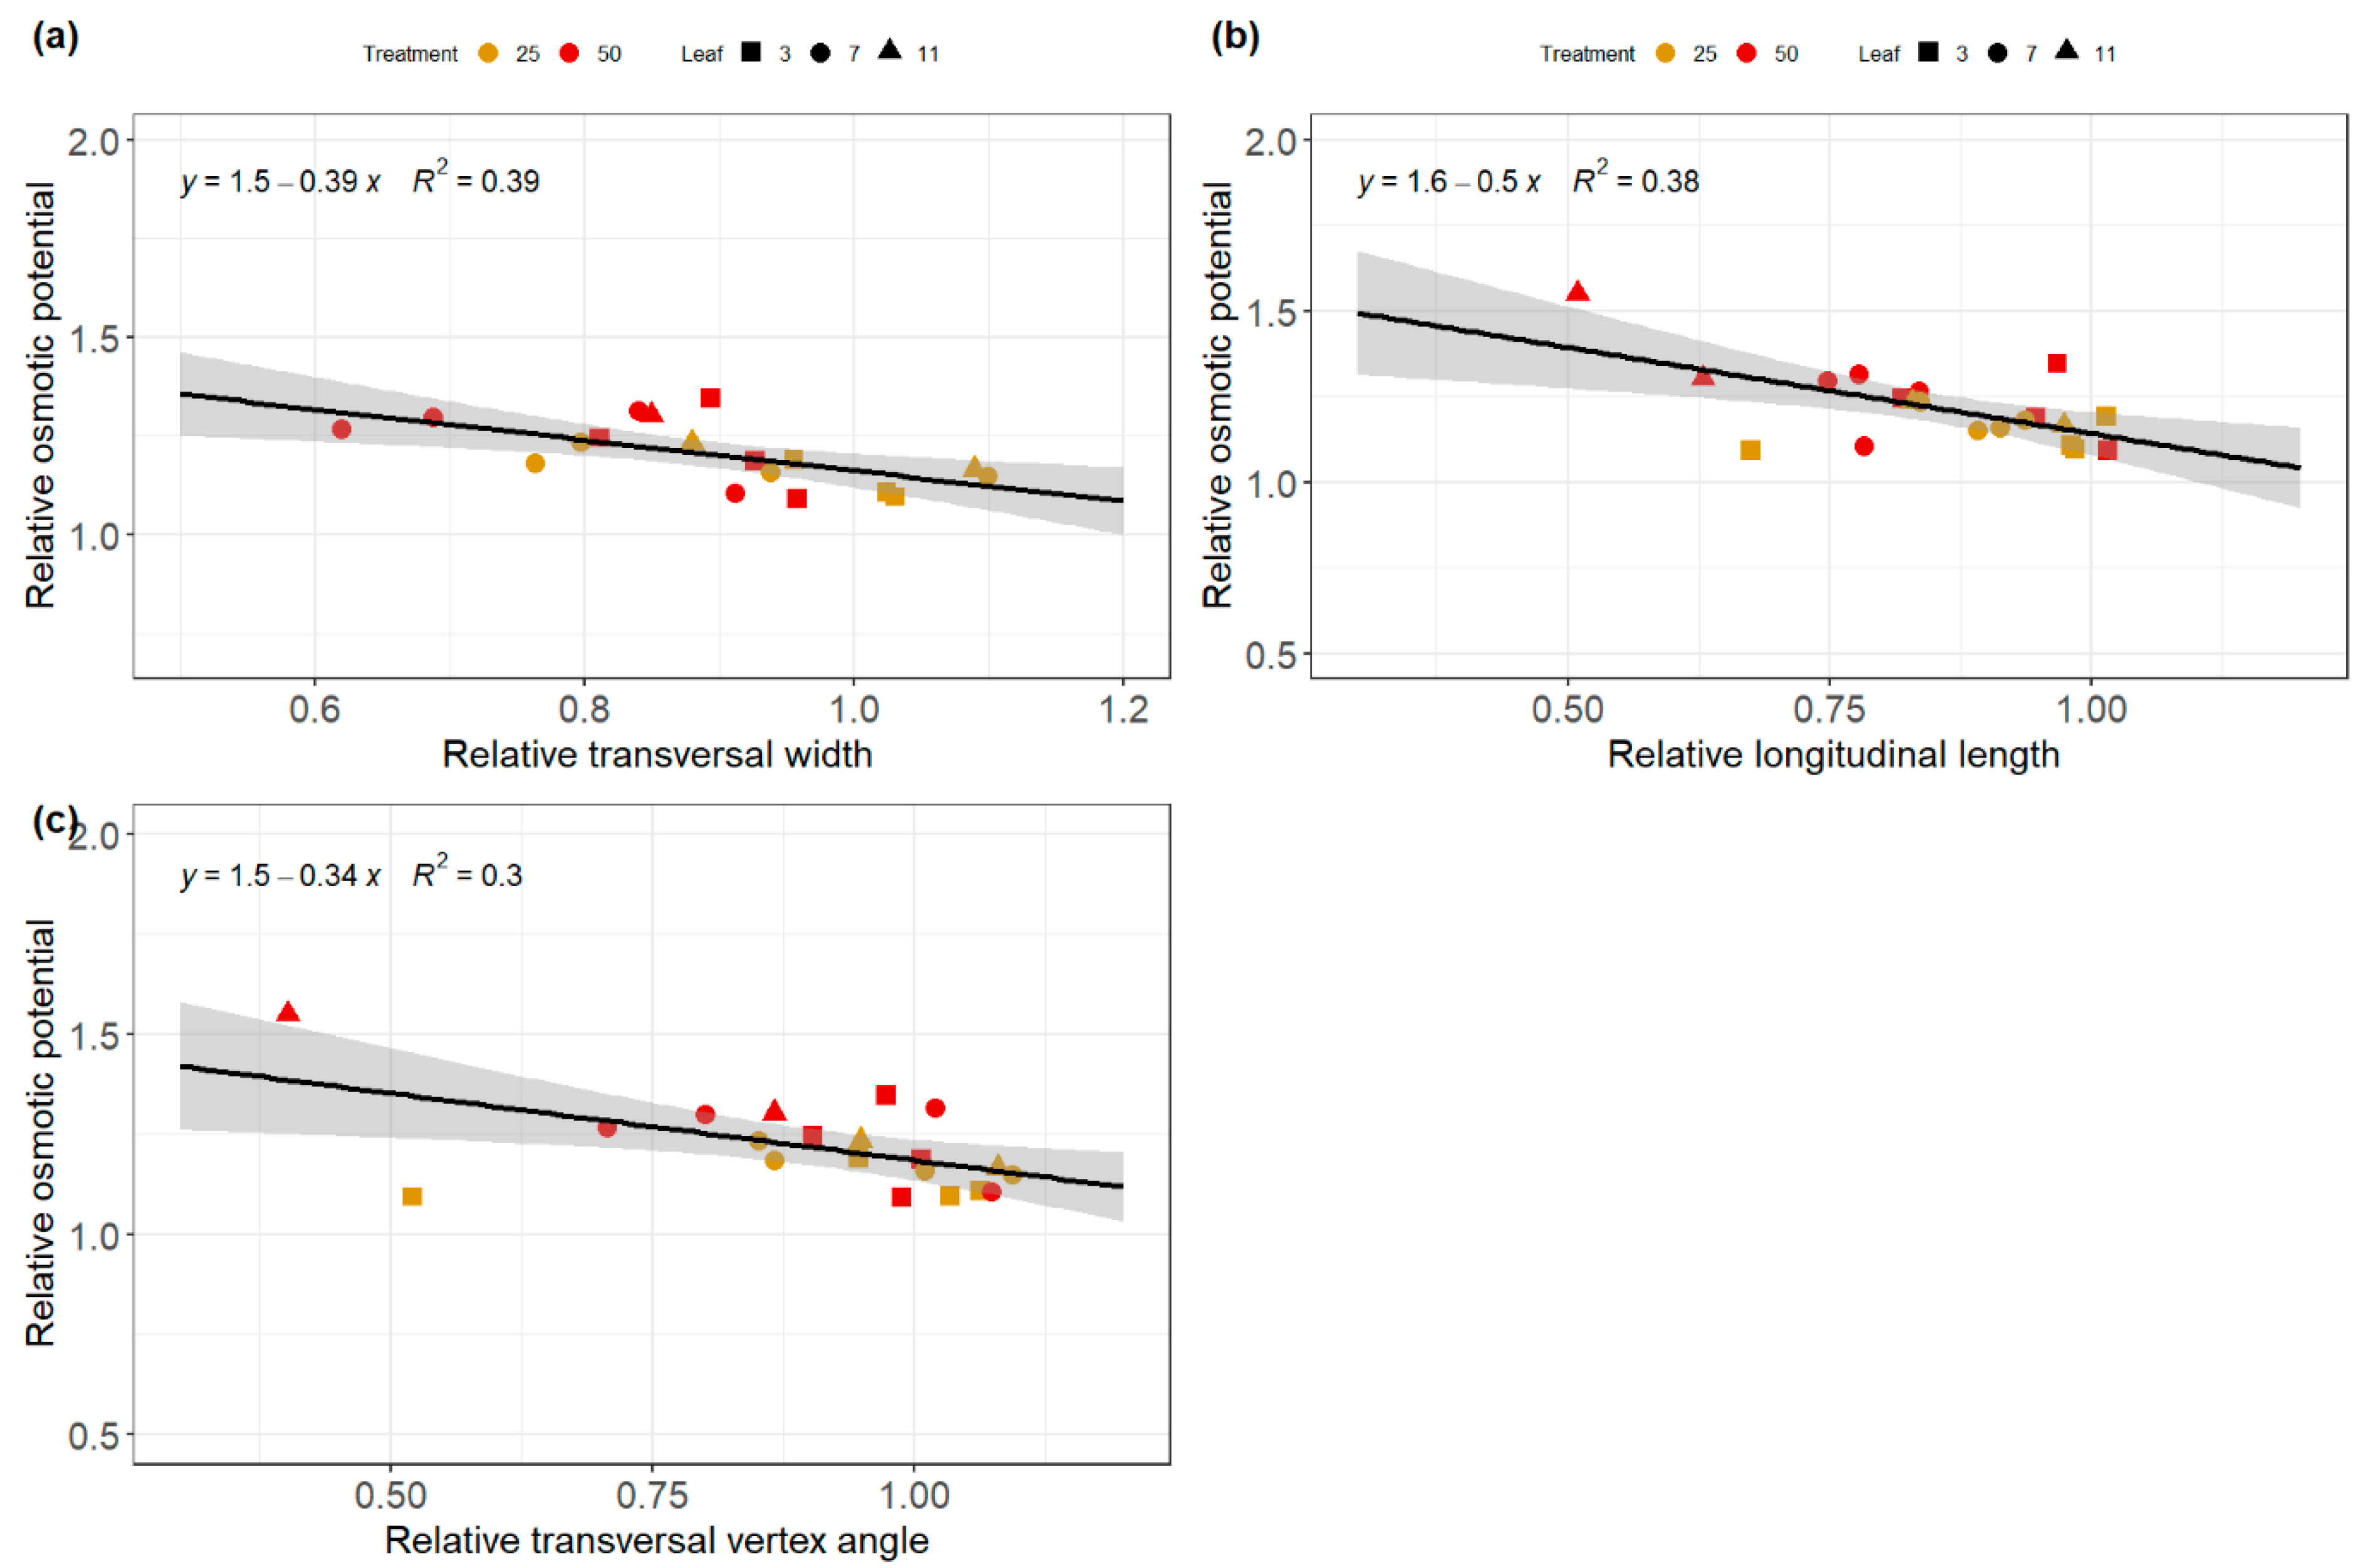
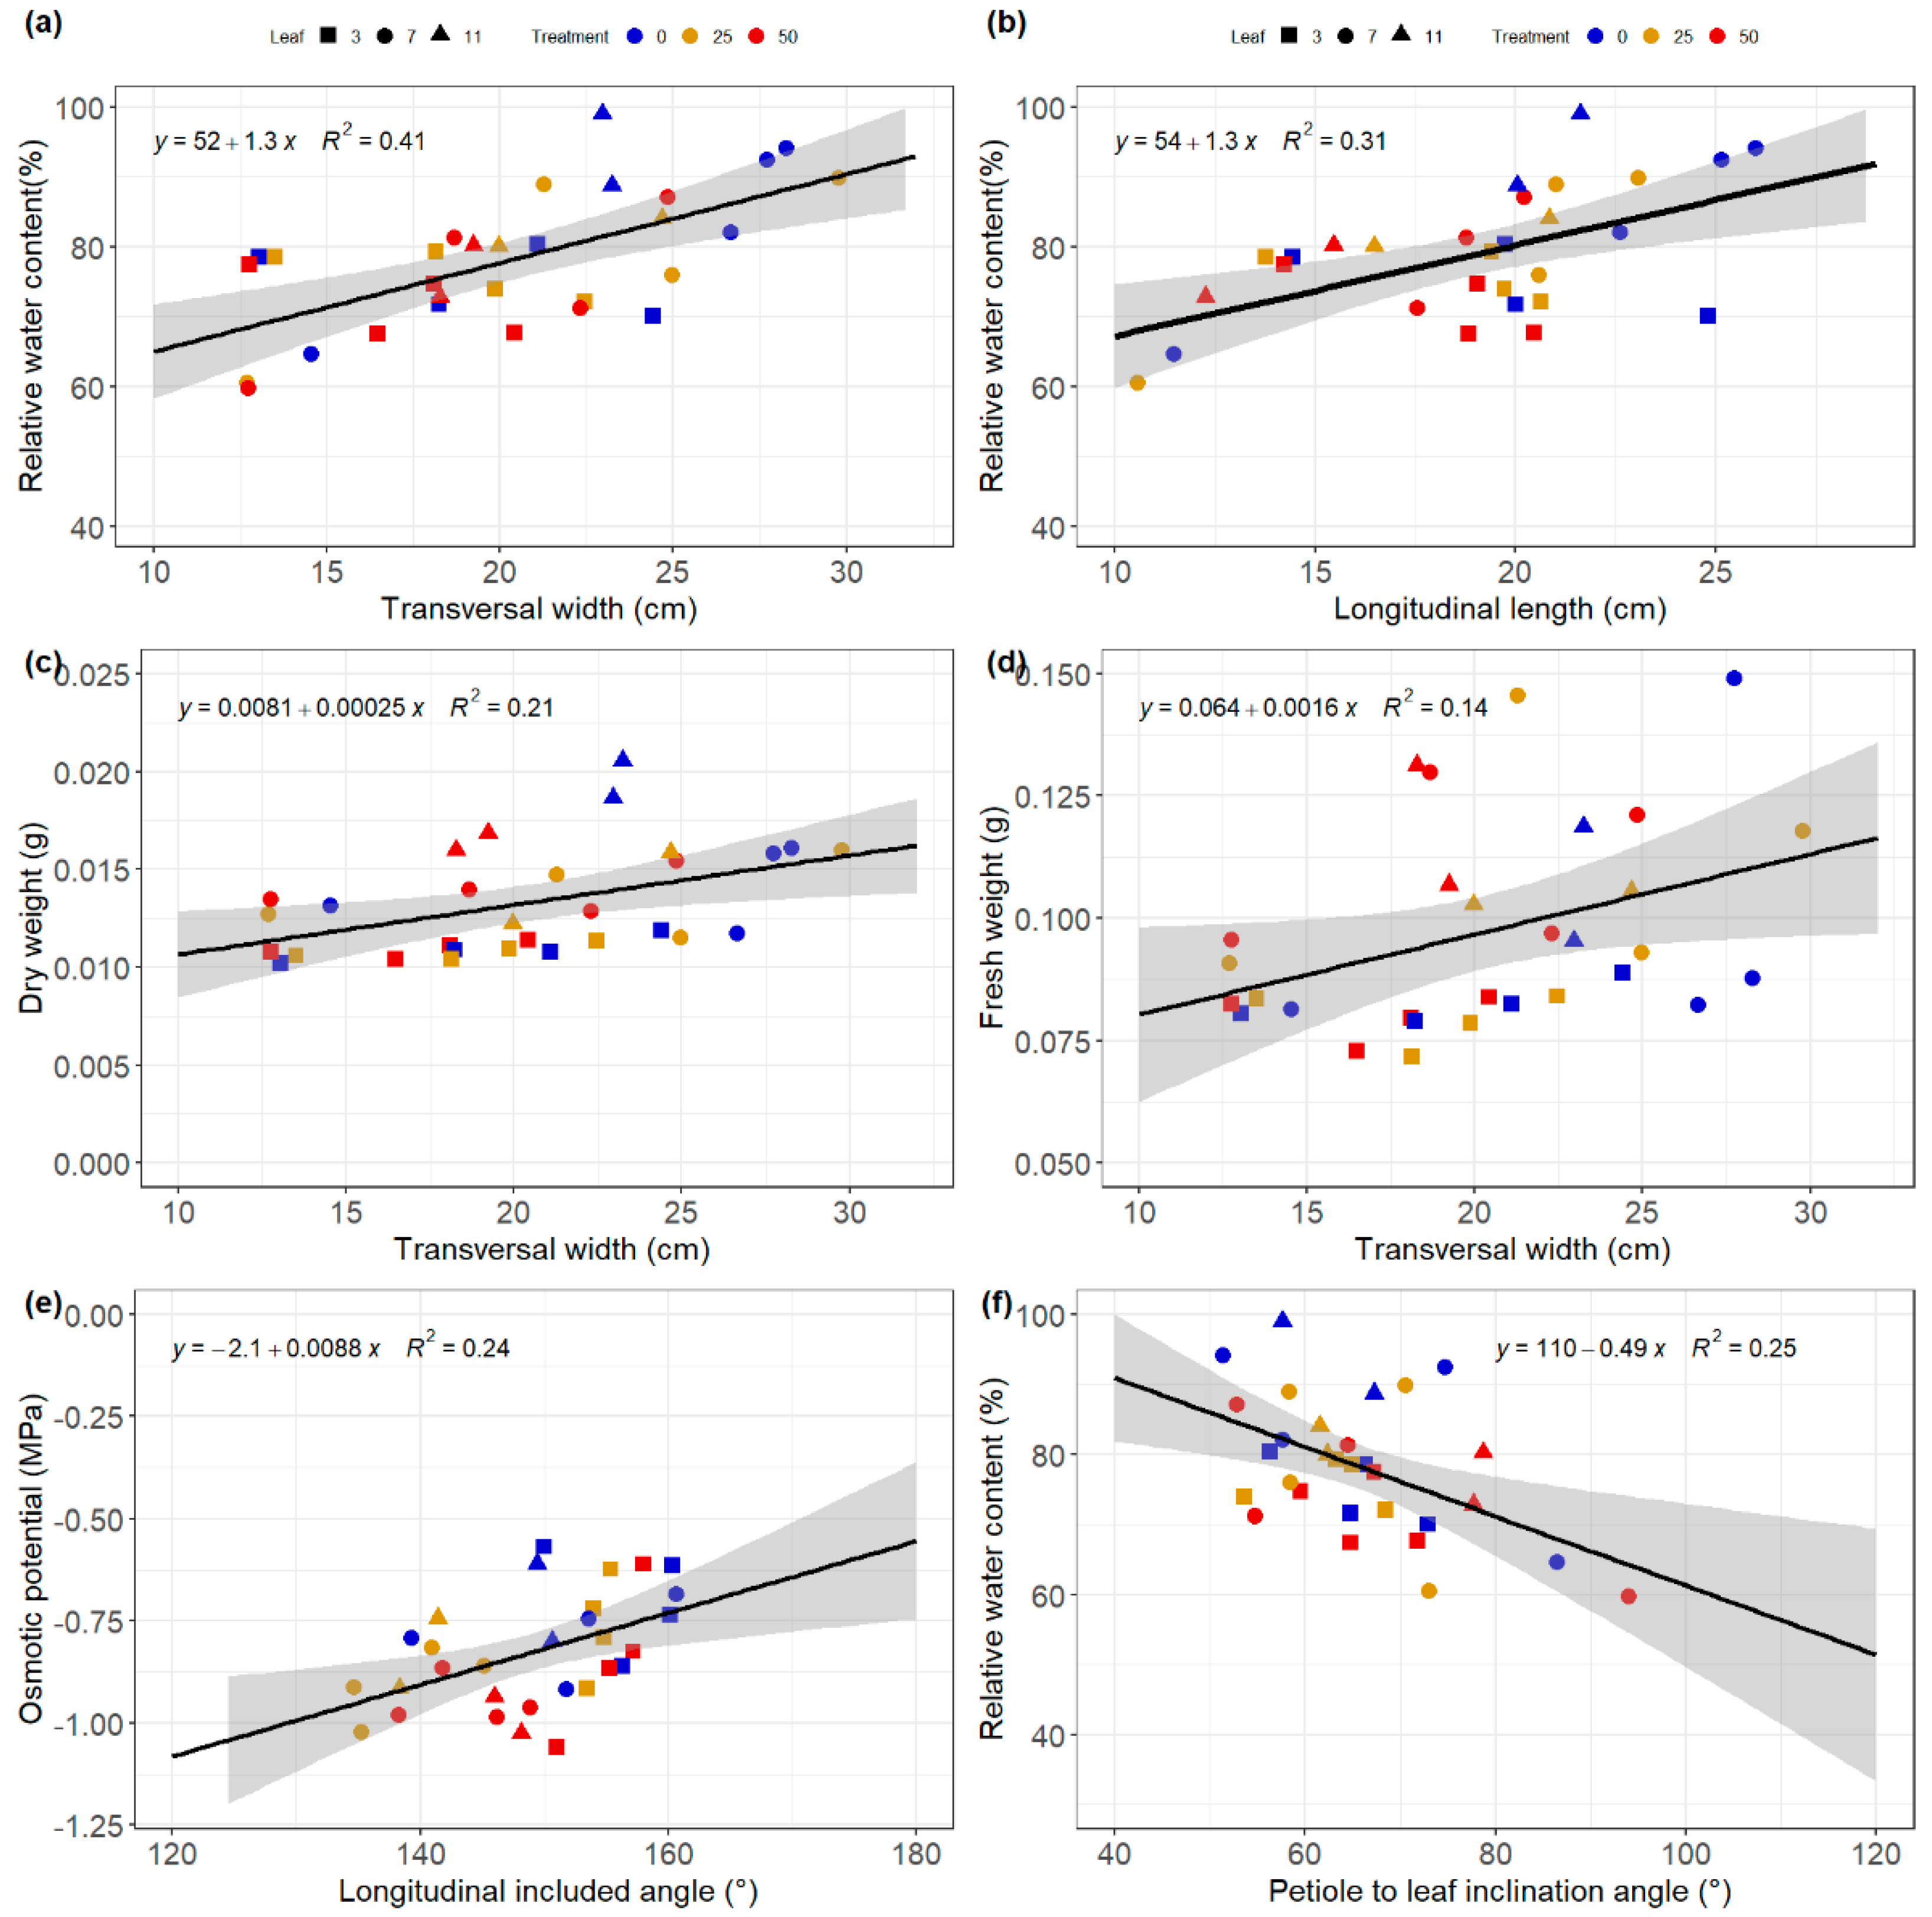
3.5. Relationships between Architectural and Physiological Traits

The relationship between the architectural and physiological traits was investigated using correlation diagrams. The significant correlations between different architectural and physiological traits obtained are summarized in Figure 6 and Figure 7 for both relative and absolute values. Negative correlations were found between the relative longitudinal and transversal dimensions of the leaves and the relative osmotic potential (Figure 7). Therefore, leaves that declined the less their transversal and longitudinal dimensions under salinity stress were leaves with the lower osmotic potential. A good correlation was also found between transversal width and the dry weight, suggesting that the ratio of the transversal width of the stress plants became smaller with respect to the control when the osmotic potential of the stressed plant became more negative.
Architectural traits such as longitudinal length and transversal width had a high correlation with RWC. This suggests that the longitudinal and transversal dimensions of the leaf are good indicators of RWC (Figure 6a,b). Therefore, leaves with higher transversal and longitudinal dimensions tend to have higher relative water content. Moreover, good correlations were found between the transversal widths and traits, such as the dry and fresh weight of the leaf disk harvested destructively during the experiments (Figure 6c,d). The longitudinal included angle and the petiole inclination angle also showed a good correlation with the osmotic potential and RWC, respectively (Figure 6e,f). These results support the idea that observing architectural changes of leaf traits might provide insights about physiological traits such as RWC, dry and fresh weight and the osmotic potential of the leaves.

4. Discussion

An affordable early stress detection method for greenhouse crops might prevent high yield losses. The aim of this work was to identify architectural responses of cucumbers under salinity stress that might be helpful for the early detection of salinity stress using photogrammetry. Some morphological traits such as the transversal and longitudinal length of the leaf appeared to be better indicators of salinity stress than the physiological traits investigated since significant differences were detected after 60 °Cd and 110 °Cd, while the difference was obtained for destructive measurements from 220 °Cd on.

4.1. Later Significant Differences between Stress and Control for Invasive Measurements

Salinity stress effects on leaves were reported to be completely dependent on the growth phase. Under salinity, the osmotic potential was reported to reduce at a first phase, leading to osmotic stress [3,5]. This effect, when occurring typically for developing leaves, led to the reduction in the growth rate of the leaf [5]. For a fully expanded leaf, it was assumed that the toxic effect of salt is faster than in a younger leaf [3,5]. An early reduction in the leaf elongation rate might contribute to the reduced leaf area and, therefore, the leaf longitudinal and transversal distances under salinity stress for the leaves that were already initiated at stress imposition. In our results, the earliest difference between the control and the salt treatment 50 mM NaCl was observed for osmotic potential, RWC, and DW/FW-ratio after 220 °Cd in leaf 11 and not in leaf 7. The younger the leaf was, the faster or earlier the effect was measured as the leaves grew. However, the measurement interval for leaves three and seven was probably too large to get an even earlier response. Data points between 220 °Cd to 325 °Cd could help to address the issue.
At the last measurement date, most third leaf of the plants under 50 mM NaCl treatment was dried. The salinity effect was more severe for these plants. In healthy leaves, the potassium concentration is usually higher than that of sodium, as reported in the literature [3]. Potassium is one of the most important ions in plants and is usually found in stomata guard cells, where it controls opening [3]. Potassium deficiency disadvantaged the plant’s photosynthetic processes, which depend on CO2 input. An abundance of sodium and potassium ions in the leaf was recently reported to trigger growth reduction in the Arabidopsis plants under NaCl treatment due, among others, to their effects on stomatal regulation [27]. However, through active transport of sodium in the root, the sodium ions can be accumulated into the vacuoles and, therefore, protect the rest of the plant. Chlorosis and necrosis symptoms were already evident in the 3D model of the treatment with 50 mM NaCl after 14 days suggesting a toxic salinity effect. Although the cucumber plant was still producing dry matter and fruits, the processes slowed down or even stagnated. Chemical analysis of the leaves showed a higher sodium concentration than that of potassium. Wolf et al. [28] suggested remobilization of sodium from new leaves to the oldest through the phloem. In our study, we observed a similar relative ion concentration in both old and young leaves, which is not completely in agreement with [2]. An imbalance of the sodium, chloride, and potassium ions occurred at the end of the experiment (Figure 5), with up to 12 times more Na+ and 5 times more Cl- in stress plants than in control plants, while 40% less K+ was measured as reported for cotton [29].

4.2. Earlier Response of Non-Invasive Morphological Traits

The 3D reconstruction using photogrammetry allowed to non-invasively estimate morphological responses of cucumber leaves under salinity stress. 97.78% of possible 3D models were reconstructed successfully using pictures taken during the experiment. The leaf angles and dimensions were successfully calculated and used for stress detection. By statistical analysis, significant phases of salinity described by the osmotic and ionic effects were detected [5]. With large curvature angles, the curvature of the leaf is less pronounced and more pronounced at a smaller angle. After 110 °Cd for leaves three and 220 °Cd of leaves seven, differences between stress and control plants were significant for some longitudinal length and the transversal width of the plants.
The curvature lengthwise angle represented the earliest possibility of stress detection under the leaf angles for a leaf, which appeared already before stress imposition, followed by the transversal leaf included and petiole to leaf inclination angles. Some effects characterized by changes in angles or other measured parameters independently of the treatments suggested that changing in angle was not only due to salt treatment but also to climatic conditions or the development stage of the leaves. At 60 °Cd the width and length of leaves thhree of the treatment with 50 mM NaCl showed the earliest stress response in comparison to the control. The width and length of leaves three and seven seemed to increase in all treatments, which was explained by climatic or development effect.
However, from 60 °Cd and 133 °Cd, the increase was associated with the significance between at least the control and the salt treatment with 50 mM NaCl so that the stress was recognizable and maintained despite the plant growth.

4.3. Relationship between Non-Invasive and Invasive Data

Significant correlations between the leaf osmotic potential, the relative water content and the dry weight fresh weight ratio, and some 3D-base morphological traits were found for cucumber leaves under greenhouse conditions (Figure 6 and Figure 7). These suggested that the measured morphological changes can be related to physiological responses. Factors such as the relative osmotic potential can be derived from the relative transversal width, relative longitudinal length, and longitudinal curvature. Our results were obtained with cucumber leaves, which are relatively large and react to salinity stress through leaf rolling, leading to limited exposed surfaces to irradiance. For smaller leaves, it might be difficult to observe a similar behavior since the leaf width would not vary in a similar magnitude. However, as the growth rate of the leaves is also salinity sensitive [2,3], this might lead to a significant salinity effect on the width and the length. Using leaves of different sizes, the variation in the transversal and longitudinal included angles could be different since not all plants would vary these angles. It would therefore be important to investigate other leaf parameters such as petiole elevation angle and leaf inclination angle.

5. Conclusions

Using 3D reconstruction of plant architecture through photogrammetry, it was possible to find a significant salinity effect on the transversal and longitudinal leaf lengths just 60 °Cd post-stress impositions for leaves that appeared before stress imposition. Invasive measurements such as the leaf osmotic potential, the relative water content in the leaf as well as the dry weight-fresh weight ratio of leaves showed statistically significant differences much later for leaves that appeared before stress imposition. Moreover, we found that these morphological traits correlate well with physiological traits such as leaf osmotic adjustment, relative water content, dry weight, and fresh weight.

Author Contributions

Conceptualization, D.M.-N. and M.B.; methodology, D.M.-N. and M.B.; software, D.M.-N. and M.B.; validation, D.M.-N., M.B. and H.S.; formal analysis, M.B.; resources, D.M.-N. and H.S.; data curation, D.M.-N. and M.B.; writing—original draft preparation, M.B.; writing—review and editing D.M.-N. and H.S. All authors have read and agreed to the published version of the manuscript.

Funding

This research received no external funding.

Institutional Review Board Statement

Not applicable.

Informed Consent Statement

Not applicable.

Data Availability Statement

Not applicable.

Acknowledgments

We would like to thank Ilona Napp for her technical assistance during the experiment. The publication of this article was funded by the Open Access Publishing Fund of Leibniz Universität Hannover.

Conflicts of Interest

The authors declare no conflict of interest.

References

  1. de Micco, V.; Aronne, G. morpho-anatomical traits for plant adaptation to drought. In Plant Responses to Drought Stress: From Morphological to Molecular Features; Aroca, R., Ed.; Springer: Berlin/Heidelberg, Germany, 2012; pp. 37–61. ISBN 978-3-642-32653-0. [Google Scholar]
  2. Munns, R.; Tester, M. Mechanisms of salinity tolerance. Annu. Rev. Plant Biol. 2008, 59, 651–681. [Google Scholar] [CrossRef] [Green Version]
  3. Isayenkov, S.V.; Maathuis, F.J.M. Plant salinity stress: Many unanswered questions remain. Front. Plant Sci. 2019, 10, 80. [Google Scholar] [CrossRef] [PubMed] [Green Version]
  4. Drew, M.C.; Hold, P.S.; Picchioni, G.A. Inhibition by NaCl of Net CO2 Fixation and Yield of Cucumber. J. Am. Soc. Hortic. Sci. 1990, 115, 472–477. [Google Scholar] [CrossRef] [Green Version]
  5. Chen, T.-W.; Kahlen, K.; Stützel, H. Disentangling the contributions of osmotic and ionic effects of salinity on stomatal, mesophyll, biochemical and light limitations to photosynthesis. Plant Cell Environ. 2015, 38, 1528–1542. [Google Scholar] [CrossRef] [PubMed]
  6. Stępień, P.; Kłbus, G. Water relations and photosynthesis in Cucumis sativus L. leaves under salt stress. Biol. Plant 2006, 50, 610–616. [Google Scholar] [CrossRef]
  7. Al-Karaki, G.N. Growth, water use efficiency, and sodium and potassium acquisition by tomato cultivars grown under salt stress. J. Plant Nutr. 2000, 23, 1–8. [Google Scholar] [CrossRef]
  8. Kahlen, K.; Stützel, H. Modelling photo-modulated internode elongation in growing glasshouse cucumber canopies. New Phytol. 2011, 190, 697–708. [Google Scholar] [CrossRef]
  9. Dassot, M.; Colin, A.; Santenoise, P.; Fournier, M.; Constant, T. Terrestrial laser scanning for measuring the solid wood volume, including branches, of adult standing trees in the forest environment. Comput. Electron. Agric. 2012, 89, 86–93. [Google Scholar] [CrossRef]
  10. Llop, J.; Gil, E.; Llorens, J.; Miranda-Fuentes, A.; Gallart, M. Testing the Suitability of a Terrestrial 2D LiDAR Scanner for Canopy Characterization of Greenhouse Tomato Crops. Sensors 2016, 16, 1435. [Google Scholar] [CrossRef] [Green Version]
  11. Biskup, B.; Scharr, H.; Schurr, U.; Rascher, U. A stereo imaging system for measuring structural parameters of plant canopies. Plant Cell Environ. 2007, 30, 1299–1308. [Google Scholar] [CrossRef]
  12. Alenyà, G.; Dellen, B.; Torras, C. 3D modelling of leaves from color and ToF data for robotized plant measuring. In Proceedings of the IEEE International Conference on Robotics and Automation, Shanghai, China, 9–13 May 2011; pp. 3408–3414, ISBN 9781612843865. [Google Scholar]
  13. Chéné, Y.; Rousseau, D.; Lucidarme, P.; Bertheloot, J.; Caffier, V.; Morel, P.; Belin, É.; Chapeau-Blondeau, F. On the use of depth camera for 3D phenotyping of entire plants. Comput. Electron. Agric. 2012, 82, 122–127. [Google Scholar] [CrossRef]
  14. Santos, T.T.; Koenigkan, L.V.; Barbedo, J.G.; Rodrigues, G.C. 3d plant modeling: Localization, mapping and segmentation for plant phenotyping using a single hand-held camera. In Lecture Notes in Computer Science (Including Subseries Lecture Notes in Artificial Intelligence and Lecture Notes in Bioinformatics); Springer: Berlin/Heidelberg, Germany, 2015; pp. 247–263. ISBN 9783319162195. [Google Scholar]
  15. Behmann, J.; Steinrücken, J.; Plümer, L. Detection of early plant stress responses in hyperspectral images. ISPRS J. Photogramm. Remote Sens. 2014, 93, 98–111. [Google Scholar] [CrossRef]
  16. Roscher, R.; Behmann, J.; Mahlein, A.K.; Dupuis, J.; Kuhlmann, H.; Plümer, L. Detection of disease symptoms on hyperspectral 3D plant models. ISPRS Ann. Photogramm. Remote Sens. Spat. Inf. Sci. 2016, 3, 89–96. [Google Scholar] [CrossRef] [Green Version]
  17. Mohd Asaari, M.S.; Mishra, P.; Mertens, S.; Dhondt, S.; Inzé, D.; Wuyts, N.; Scheunders, P. Close-range hyperspectral image analysis for the early detection of stress responses in individual plants in a high-throughput phenotyping platform. ISPRS J. Photogramm. Remote Sens. 2018, 138, 121–138. [Google Scholar] [CrossRef]
  18. Carter, G.A. Responses of Leaf Spectral Reflectance to Plant Stress. Am. J. Bot. 1993, 80, 239. [Google Scholar] [CrossRef]
  19. Hoque, E.; Hutzler, P.J.S. Spectral blue-shift of red edge monitors damage class of beech trees. Remote Sens. Environ. 1992, 39, 81–84. [Google Scholar] [CrossRef]
  20. Rock, B.N.; Hoshizaki, T.; Miller, J.R. Comparison of in situ and airborne spectral measurements of the blue shift associated with forest decline. Remote Sens. Environ. 1988, 24, 109–127. [Google Scholar] [CrossRef]
  21. Horler, D.N.H. The Red Edge of Plant Leaf Reflectance; Taylor and Francis: London, UK, 1983. [Google Scholar]
  22. Maimaitiyiming, M.; Ghulam, A.; Bozzolo, A.; Wilkins, J.L.; Kwasniewski, M.T. Early Detection of Plant Physiological Responses to Different Levels of Water Stress Using Reflectance Spectroscopy. Remote Sens. 2017, 9, 745. [Google Scholar] [CrossRef] [Green Version]
  23. Sánchez, E.; Heuvelink, E.; Gelder, A.d.; Stanghellini, C. New Non-invasive Tools for Early Plant Stress Detection. Procedia Environ. Sci. 2015, 29, 249–250. [Google Scholar] [CrossRef] [Green Version]
  24. Azzari, G.; Goulden, M.L.; Rusu, R.B. Rapid characterization of vegetation structure with a Microsoft Kinect sensor. Sensors 2013, 13, 2384–2398. [Google Scholar] [CrossRef] [Green Version]
  25. Wang, Q.; Zhang, Q. Three-Dimensional Reconstruction of a Dormant Tree Using RGB-D Cameras. In Proceedings of the American Society of Agricultural and Biological Engineers, Kansas City, MO, USA, 21–24 July 2013. [Google Scholar]
  26. Cignoni, P.; Callieri, M.; Corsini, M.; Dellepiane, M.; Ganovelli, F.; Ranzuglia, G. MeshLab: An Open-Source Mesh Processing Tool. In Proceedings of the Sixth Eurographics Italian Chapter Conference, Salerno, Italy, 2–4 July 2008; Scarano, V., Ed.; Eurographics Assoc: Aire-la-Ville, Switzerland, 2008; pp. 129–136, ISBN 9783905673685. [Google Scholar]
  27. Álvarez-Aragón, R.; Haro, R.; Benito, B.; Rodríguez-Navarro, A. Salt intolerance in Arabidopsis: Shoot and root sodium toxicity, and inhibition by sodium-plus-potassium overaccumulation. Planta 2016, 243, 97–114. [Google Scholar] [CrossRef] [PubMed]
  28. Wolf, O.; Munns, R.; Tonnet, M.L.; Jeschke, W.D. The role of the stem in the partitioning of Na+ and K+ in salt-treated barley. J. Exp. Bot. 1991, 42, 697–704. [Google Scholar] [CrossRef]
  29. Zhang, L.; Ma, H.; Chen, T.; Pen, J.; Yu, S.; Zhao, X. Morphological and physiological responses of cotton (Gossypium hirsutum L.) plants to salinity. PLoS ONE 2014, 9, e112807. [Google Scholar] [CrossRef] [PubMed] [Green Version]
Figure 1. Workflow for image processing and data extraction to determine leaf angles and distance dimensions.
Remotesensing 14 01094 g001
Figure 2. 3D reconstruction of a plant one day before (−1) and 0, 2, 7 and 14 days after stress imposition under 50 mM NaCl treatment.
Remotesensing 14 01094 g002
Figure 3. Dynamics of the relative leaf (a) longitudinal and (b) transversal dimensions of leaves three and seven during the NaCl stress treatment of 0, 25, or 50 mM in the nutrient solution. The x-axis represents the thermal time from stress imposition, while the relative values are the ratio of the stress treatments to the control (blue line). The squares represent the averages, and the whiskers represent ± standard deviations of 5 to 10 repetitions. The asterisks represent significant differences from the control through pairwise comparison.
Remotesensing 14 01094 g003
Figure 4. Temporal development of the (a) curvature lengthwise angle, (b) petiole to leaf inclination angle, and (c) transversal leaf included angle of leaves three and seven during the salinity stress treatment with 0, 25, or 50 mM NaCl in the nutrient solution. The x-axes represent the thermal time since stress imposition, while the y-axes present the relative values for each leaf with respect to the control value. Asterisks indicate significant differences compared to the control treatment.
Remotesensing 14 01094 g004
Figure 5. Dynamics of the relative values of (a) osmotic leaf water potential, (b) potassium ion concentration, (c) relative leaf water content, (d) sodium ion concentration, (e) dry weight to fresh weight ratio, and (f) chloride ion concentration of leaves three and seven during the salinity stress treatment 0, 25, or 50 mM NaCl in the nutrient solution. The x-axis represents the thermal time since stress imposition, while the y-axis presents the relative values for each leaf with respect to the control value. Asterisks indicate significant differences with the control treatment.
Remotesensing 14 01094 g005
Figure 6. Relationships between architectural traits such as the relative transversal width (a), the relative longitudinal length (b), and the transversal vertex angle with the relative osmotic potential (c) of cucumber leaves under salinity stress treatment of 0, 25, and 50 mM NaCl. The grey region represents the 95% confidence interval.
Remotesensing 14 01094 g006
Figure 7. Relationships between architectural such as the transversal width (a,c,d), the longitudinal length (b), the longitudinal included angle (e) and the petiole to leaf inclination angle (f), and physiological traits such as the relative water content, the dry and fresh weights and the osmotic potential of cucumber leaves under salinity stress treatment of 0, 25, and 50 mM NaCl. The grey regions represent the 95% confidence interval.
Remotesensing 14 01094 g007
Publisher’s Note: MDPI stays neutral with regard to jurisdictional claims in published maps and institutional affiliations.

