Article

Mapping the Location and Extent of 2019 Prevent Planting Acres in South Dakota Using Remote Sensing Techniques

1
NASA-Harvest, Department of Geographical Sciences, University of Maryland, College Park, MD 20742, USA
2
Office of the Chief Economist, United States Department of Agriculture, Washington, DC 20250, USA
*
Author to whom correspondence should be addressed.
Remote Sens. 2021, 13(13), 2430; https://doi.org/10.3390/rs13132430
Submission received: 6 April 2021 / Revised: 27 May 2021 / Accepted: 13 June 2021 / Published: 22 June 2021

Abstract

:
The inability of a farmer to plant an insured crop by the policy’s final planting date can pose financial challenges for the grower and cause reduced production for a widely impacted region. Prevented planting is primarily caused by excess moisture or rainfall such as the catastrophic flooding and widespread conditions that prevented active field work in the midwestern region of United States in 2019. While the Farm Service Agency reports the number of such “prevent plant” acres each year at the county scale, field-scale maps of prevent plant fields—which would enable analyses related to assessing and mitigating the impact of climate on agriculture—are not currently available. The aim of this study is to demonstrate a method for mapping likely prevent plant fields based on flood mapping and historical cropland maps. We focused on a study region in eastern South Dakota and created flood maps using Landsat 8 and Sentinel 1 images from 2018 and 2019. We used automatic threshold-based change detection using NDVI and NDWI to accentuate changes likely caused by flooding. The NDVI change detection map showed vegetation loss in the eastern parts of the study area while NDWI values showed increased water content, both indicating possible flooding events. The VH polarization of Sentinel 1 was also particularly useful in identifying potential flooded areas as the VH values for 2019 were substantially lower than those of 2018, especially in the northern part of the study area, likely indicating standing water or reduced biomass. We combined the flood maps from Landsat 8 and Sentinel 1 to form a complete flood likelihood map over the entire study area. We intersected this flood map with a map of fallow pixels extracted from the Cropland Data Layer to produce a map of predicted prevent plant acres across several counties in South Dakota. The predicted figures were within 10% error of Farm Service Agency reports, with low errors in the most affected counties in the state such as Beadle, Hanson, and Hand.

Graphical Abstract

1. Introduction

1.1. Problem Statement

Prevented planting is defined as the inability of a farmer to plant an insured crop by the final planting date outlined in the insurance policy [1]. This is typically due to extreme weather conditions such as excessive rainfall, hurricanes, or drought. Reports from agricultural producers state that more than 19 million acres went unplanted in 2019, marking the most prevent planting acres reported by the U.S. Department of Agriculture Farm Service Agency (USDA-FSA) since 2007 [2]. The prevent planting acres in the midwestern states were primarily due to a combination of extreme levels of rainfall coupled with an explosive cyclogenesis (popularly termed “bomb cyclone”) that caused large volumes of rain and snow to fall, leading to more than 4 billion USD in crop insurance claims [3]. South Dakota had the most severe impact, with almost 4 million unplanted acres, followed by five other midwestern states—Illinois, Ohio, Missouri, Arkansas, and Minnesota—each of which had more than one million unplanted acres [4]. Lower crop yields for corn and soybeans were predicted as far back as May 2019 when only “23% of the acres were planted in the 18 largest corn-producing states, compared to a 46% average for the last five years” [5].
While the Farm Service Agency reports the total number of prevent plant acres at the county scale each year [6], maps that provide information on how prevent plant acres are spatially distributed at the field scale are not currently available. Maps of estimated prevent plant acres could unlock studies that aim to measure and address the impact of extreme weather events and climate on agriculture by identifying fields that were most severely impacted by extreme events as well as enable the impact on subsequent seasons to be tracked. Remote sensing map products for predicting prevent plant acres could also be used to facilitate processing of timely insurance claims for affected farmers. In addition, such maps could help to quantify the damage from flooding on crops and to improve the accuracy of crop type maps by filtering out unplanted fields that might be incorrectly classified. In this study, we present a method for detecting fields that were prevented from planting due to flooding or standing water based on satellite observations. We evaluated our remote sensing-based estimates of prevent plant acreage by comparing to official estimates from the Farm Service Agency. We provide the Google Earth Engine code to enable this analysis to be reproduced and used by researchers and decision-makers for other regions of interest and future growing seasons.

1.2. Related Work

Since flooding and excess moisture are the dominant causes of prevented planting, particularly in the Midwestern US in 2019, we used flood mapping techniques to identify fields that might have gone unplanted due to water inundation. Floods are a common form of natural disaster that occurs when water covers naturally dry land due to the overtopping of riverbanks or lakes [7,8]. They are widespread natural disasters that affect lives, infrastructure, and economies of impacted areas [9]. The 2019 flooding in the Midwestern US began in March caused by a combination of heavy rains, bomb cyclone and frozen winter snow affecting about 11 states and 400 counties [10]. Remote sensing plays a crucial role in providing useful information about the extent, depth, dynamics, and impact of flooding events due to its large area of coverage and high temporal resolution. Generally, synthetic aperture radar (SAR) satellites are more widely used for flood mapping than optical satellites due to the ability of SAR to capture clear images irrespective of weather conditions or time of day [9]. Furthermore, the unique spectral signature of water under both optical and radar imagery makes flood mapping a feasible venture. Water bodies generally appear black or very dark in radar imagery as a result of specular scattering where the impinging radar signal is reflected away from the sensor, making it distinguishable from dry land [7,8,9,11]. Orthorectified Terrain Observation Progressive Scans (TOPSAR) images have been stacked together before subjective thresholding methods are used to categorize flooded and non-flooded regions [7,11]. In the case of optical images, the normalized differential water index (NDWI) is used to detect flooded areas after converting from DN to radiance [6]. However, modified normalized differential water index (MNDWI) was found to be better at identifying flooded areas because open water absorbs more intense mid infrared light than near infrared [7,11,12].
Urban flood mapping using SAR images has usually been more challenging than in rural areas due to complicated backscattering mechanisms caused by varying building types and heights as well as different road topologies. Li et al. [9] presented an unsupervised approach using a combination of backscatter intensity and interferometric coherence time series to differentiate different types of flooded areas under the Bayesian network fusion framework. This synergistic approach provides more reliable information especially in urban areas with changing landscape than either method alone [9]. Furthermore, a plethora of normalized differential spectral indices (NDSIs) have been proposed to aid agronomic flood detection in different scenarios using a combination of short-wave (SWIR), near infrared (NIR) and visible light (VIS) from MODIS. The normalized differential index of SWIR and NIR has been proven useful to detect water presence but unfortunately it cannot distinguish between flooded soil and plant water content [13]. It was however concluded that the VIS/SWIR index is best for water detection in low-resolution images where the mixed pixels problem can strongly affect results [13]. In addition, NDSIs that use band 7 (SWIR 2) of Landsat 8 are more sensitive to water presence compared to those that use band 6 (SWIR 1). The choice of band used will depend on the aim of water mapping. For example, if underestimating the water presence is preferable to overestimation, band 6 will be a better option [13].
Normalized differential indices are also used for radar images. One proposed index is the normalized differential flood index (NDFI) [8,14]. This index is based on multi-temporal statistical analysis of two SAR images before and after an event. The NDFI is the normalized difference of the mean of the reference (before) image and the minimum of the stacked reference and crisis (after) image. A constant threshold of 0.7 can then be applied to distinguish flooded areas from non-flooded areas [8]. Another SAR index is the modified Sentinel 1A Water Index (MSWI). This index was generated by the regression analysis of NDWI as the response/dependent variable and various SAR band math operations (VH, VH − VV, VV × VH, etc.) as the independent variables, where VV and VH represent the backscattering coefficients in their respective polarization [15]. The Otsu thresholding method was then used to distinguish between the water and non-water areas [15].
Image fusion techniques using the enhanced Spatial and Temporal Adaptive Reflectance Fusion Model (ESTARFM) have been employed on Landsat and MODIS data to produce synthetic flood images [12]. This fusion method has shown the ability to capture phenological variations and detect sudden changes in areas of flooding events. The images were then classified using an SVM classifier with a radial basis kernel function for best results. The predicted/fused image pair of Landsat/MODIS has shown to be in strong agreement with actual Landsat images, especially in stable areas, but less so in inundated regions [12].

1.3. Study Objectives

The objectives of this study are to:
I. Derive a flood extent map of the study area showing the inundated regions by applying change detection techniques on Landsat 8 and Sentinel 1 images.
II. Use the flood extent and fallow cropland maps to create a map of predicted prevent plant acres and compare derived county-level estimates with reported figures.

2. Materials and Methods

2.1. Study Area

The study area for this project was the eastern region of South Dakota as shown in Figure 1. This state was selected for this research because it had the highest number of prevent plant acres with approximately four million prevent plant acres in 2019 [4]. The study area includes several counties such as Spink, Kingsbury, McCook, Beadle, Hutchinson, and others that had over 100,000 prevent plant acres each in 2019 [6].

2.2. Data Processing

Table 1 summarizes the data products used in this study. Most of the preprocessing for the images was already carried out by Google Earth Engine (GEE) developers, hence they were ready for analysis. However, the Sentinel 1 images needed a further processing step to reduce speckle noise. This processing step is called speckle filtering and helps to reduce the salt-and-pepper noise usually associated with radar imagery [16]. This noise appears as random small white spots in the image that reduce quality. For this project, we applied a simple mean filter with a fixed window to the Sentinel 1 images. For the Landsat 8 images, we created a cloud mask using the “pixel qa” band to remove the cloud-covered pixels from the images. The other datasets described above did not require further preprocessing. We filtered these datasets to only use images intersecting the study area.

2.3. Potential Issues

One of the biggest issues was the amount of cloud cover in the Landsat 8 images, likely due to the weather conditions causing the flood. Removing the cloud cover—which was necessary for the analysis—caused holes and gaps in the images which in turn reduced the area covered and made continuity/trends of features difficult to follow. As a result, approximately 14% of the study area was removed. This was one of the reasons behind selecting a larger area of study rather than a few counties. Another potential pitfall was the type of speckle filtering applied to the Sentinel 1 images; several types of speckle filters exist in specialized imagery applications, but none are available on GEE. Although attempts have been made by developers in GEE community to translate some of these filters to the GEE platform, their efficacy cannot be guaranteed. This is particularly true since speckle filtering is typically done before terrain correction, but in GEE terrain correction has already been done without speckle filtering. Hence, any speckle filtering done afterwards may not necessarily result in similar image accuracy.

2.4. Workflow

As discussed earlier in the data section, we used GEE for data retrieval and analysis. One of the key reasons for using this platform—besides providing a compact, browser-based code development environment for data access and analysis—is to leverage its preprocessed archives of images thereby significantly reducing the number of steps needed to achieve results. We used ArcMap (ESRI Redlands, CA, USA) for map reporting and publishing as GEE is limited in this regard. Steps for processing Landsat 8 images included cloud removal, vegetation indices generation, Otsu thresholding and multi-date image compositing. For Sentinel 1 we performed speckle filtering, Otsu thresholding, band math and multi-date image stacking (Figure 2). We discuss these steps in detail in the following sections.

2.5. Landsat-8 Processing

A critical aspect of selecting Landsat 8 images is choosing the images that have the least cloud cover yet overlap as much of the study area as possible. This issue can be exacerbated when the event being captured or monitored is time-sensitive, further limiting available options. Since the 2019 flood events lasted from mid-March to September [4], we limited our search to Landsat 8 images during that time frame. We sorted the available images based on cloud cover and only retained images with less than 30% cloud cover. We then selected images in such a way that as much of the study area as possible was covered, and the time difference between the reference (2018) and flood (2019) image was at most 15 months apart (see Table 2). We used the “pixel_qa” band of Landsat 8 to identify and remove cloud pixels and other artifacts from the image, then mosaicked to join adjacent images. The mosaicked image consisted of 3 images for each year. The source code for this cloud mask is provided by GEE [17].
After mosaicking and cloud cover removal, we created a series of normalized differential indices for 2018 and 2019 Landsat 8 images. The indices that we used are defined below:
NDVI = NIR Red NIR + Red
NDWI = Green NIR Green + NIR
NIR represents the near infrared (Band 5) while Green and Red represents Bands 3 and 4, respectively. We used these indices for multi-date composite image analysis in which we assigned the reference (2018) image to the red and blue bands while we assigned the flood image (2019) to the green band. We also created difference images for change detection by subtracting the 2019 NDVI and NDWI images from the corresponding 2018 images. This highlighted possible flooded areas by identifying areas of substantial NDVI and NDWI change between the two periods.

2.6. Sentinel-1 Processing

Unlike Landsat, cloud cover has no adverse effect on Sentinel 1 image quality due to its use of radar rather than optical wavelengths, so the major criteria used for image selection was coverage of the study area within the same time window as the Landsat 8 images. Although there was no complete overlap between the Sentinel 1 and Landsat 8 images, the Sentinel 1 images selected covered as much of the Landsat 8 image as possible within the study area. Two counties in South Dakota—Beadle and Hutchinson—were of particular interest due to the high number of prevent plant acres and were covered by all selected images.
Other criteria used to select images were to ensure the orbit pass was “ascending” and the instrument mode was Interferometric Wide Swath (IW). An ascending orbit pass indicates the satellite is moving from South to North along its orbit. A descending pass could also be used as long as the same orbit pass is maintained across all the images used. The instrument mode determines how images are acquired along the track of the satellite. Interferometric Wide Swath (IW) is the most common acquisition mode over land. Sentinel 1 images in the GEE catalog come in four possible combinations of Vertically Propagated/Vertically Received radar waves (VV), Horizontally Propagated/Horizontally Received (HH), Vertically Propagated/Horizontally Received (VH) and Horizontally Propagated/Vertically Received (HV). We used only the VH polarization since it is more sensitive to open water and thus more pertinent to flood mapping in this study [18,19]. We did not use local incidence angles because these values are usually the same for a fixed location and data acquisition properties. Also, the incidence angle usually varies with distance of the target features from the sensor rather than any inherent property of the target itself. After filtering the available images with these criteria, we mosaicked the selected images.
Radiometric and terrain correction have already been applied to the Sentinel 1 images in the GEE catalog but needed further processing to remove salt-and-pepper noise from the image in a process called speckle filtering. There are no specialized image filters in GEE, so we applied a simple mean filter using the ee.Image.focal_mean() function with a fixed radius of 50 m and a circle kernel type. Similar to the Landsat 8 multi-date composite image analysis, we created a multi-date composite of the Sentinel 1 images by assigning the 2018 image to the red and blue bands and the 2019 flood image to the green band. We also created a VH difference image for change detection by dividing the 2019 image by the corresponding 2018 image. We used the division operation for the Sentinel 1 image instead of subtraction like the Landsat 8 images due to the logarithmic nature of the image values.

2.7. Thresholding

We used Otsu thresholding to distinguish flooded pixels from non-flooded pixels. Otsu thresholding provides an automatic and data-driven way of separating the two pixel groups by minimizing the differences within each group while maximizing the difference across the groups, similar to clustering techniques [20]. Otsu thresholding provides a way to automatically separate target and background values in a group of pixels and eliminate subjective thresholding which can be prone to error. We applied Otsu thresholding to both the Landsat 8 and Sentinel 1 difference images.

2.8. Fallow Cropland Masking and Prevent Plant Area Estimation

We exported the flood extent maps generated from the Landsat 8 and Sentinel 1 images to ArcGIS and combined them with a union operation. We used the Cropland Data Layer for 2019 [21] to extract only the pixels categorized as “fallow/idle cropland” from the flood map. This an essential step aimed at filtering out fields that may have been flooded but were eventually planted. We further restricted the map to only include pixels that were fallow in CDL 2019 but not CDL 2018 in an effort to filter out fields that have been fallow for other reasons such as previous prevented planting or abandonment. Since the CDL is made available by the USDA after the growing season (usually February the following year), this step could not be used for within-season assessments. Finally, we estimated the total prevent plant area for each county by summing the pixels using the Zonal Statistics as a Table tool in ArcGIS. We then multiplied by cell area (30 m cell size) and converted to acres before comparing to the reported figures from the Farm Service Agency to assess accuracy.

3. Results

3.1. Landsat 8

Figure 3 shows the NDVI values for the two years under consideration: 2018, which represents the before or reference image, and 2019, which represents the crisis/flood image. The lower values of NDVI observed in the eastern and central parts of the 2019 image indicate possible flooded areas. As a result of excess cloud cover, using images from the same observation month was not feasible. It is important to note that due to the difference in observation months, some differences in NDVI values could also be attributed to differences in crop growth caused by late planting in 2019 which would also coincide with flooded areas. According to reports, planting in South Dakota was delayed by several weeks because of the flooding and excess moisture [22,23]. Some pixels with cloud cover, which were removed in the processing stage, appear as white pixels in all images.
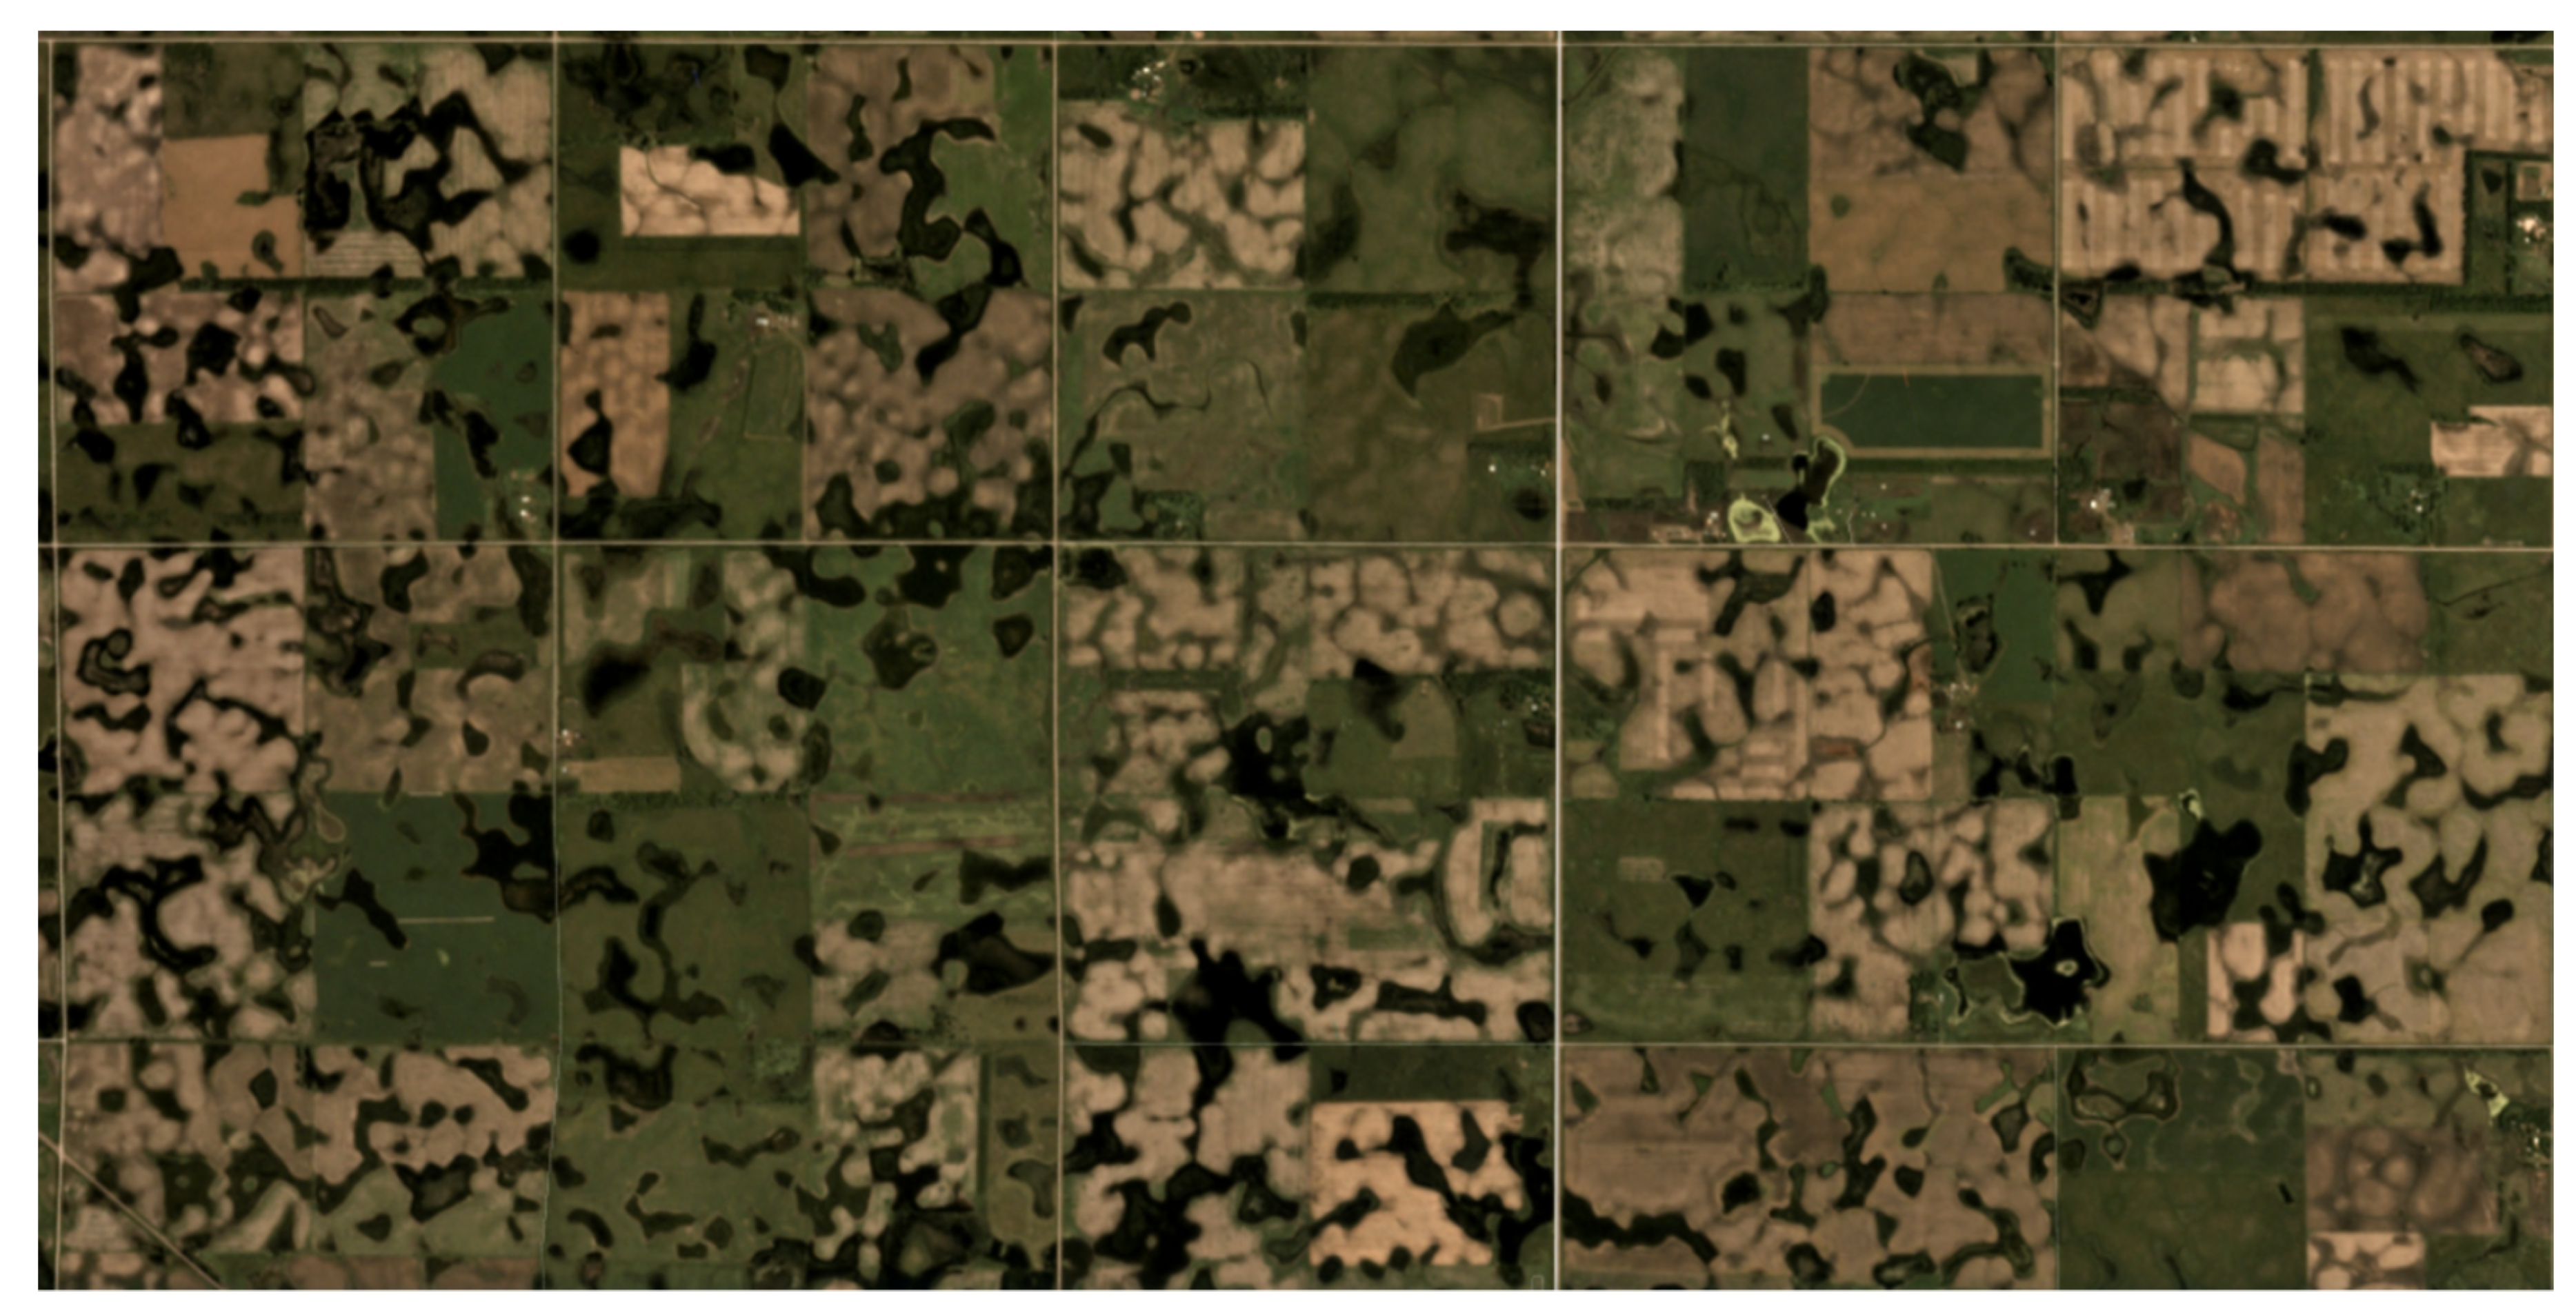
Figure 4 shows the NDWI images from each year with substantial changes observed between 2018 and 2019. The 2019 image in Figure 4 shows an increase in NDWI for most of the area compared to the 2018 image, which may be due to the effects of flooding. Figure 5 shows a RapidEye image of a section of the study area showing flooded fields as an example of the patterns likely responsible for the increase in NDWI shown in Figure 4 and the decrease in NDVI shown in Figure 3. Overall, the areas of increase in NDWI values overlap with the areas of reduced NDVI, lending further support to the hypothesis that these pixels were flooded or not farmable due to waterlogged soil.
Figure 6 shows the NDVI and NDWI difference images. The red color in Figure 6 (left) indicates areas where the NDVI value from 2018 was greater than that of 2019 (interpreted as vegetation loss) while the green color indicates areas where 2019 NDVI values were greater compared to 2018 (vegetation gain). This vegetation loss is likely due to the direct effects of flooding indicating the presence of water, soggy soil, or indirect effects of flooding leading to late crop planting or fallow fields. Conversely, the NDWI difference map (Figure 6, right) shows areas where the NDWI values were higher in 2018 than in 2019 indicated in red whereas parts where NDWI values were higher in 2019 are indicated in blue. Higher NDWI values are expected in 2019 compared to 2018 in flooded areas, hence negative values can be interpreted as possible flooded areas on this map.
We used Otsu thresholding to separate flooded and non-flooded pixels in the NDVI difference map. We used NDVI instead of NDWI or both indices because of the substantial overlap between the two difference images. The histogram of NDVI values shows a bimodal distribution (Figure 7) which we interpret as the boundary between two different groups of pixels (flooded and not flooded, which we interpret as candidates for unplanted and planted pixels). The Otsu method provides an automatic, data-driven way of separating the pixels by finding an ideal threshold value, hence limiting the need for subjective thresholding techniques. This method is particularly useful in cases where there are two distinct groups of pixels as in this bimodal distribution. The optimal NDVI change/difference threshold value derived by this technique was −0.243: we assumed values greater than this threshold to be flooded pixels and values below it to be non-flooded (Figure 8).

3.2. Sentinel 1

Figure 9 shows the Sentinel 1 difference and multi-date composite images. As discussed in the related work section, areas with open water exhibit lower VH/VV intensities due to specular reflection typical of smooth surfaces, causing impinging waves to be reflected away from the sensor. This leads to a low backscatter coefficient or dark pixel on the radar image. This contrasts with areas of vegetation where double-bouncing or volume scattering is prevalent with some signal reflected to the sensor, causing a bright pixel or higher backscatter coefficient. As a result, lower backscatter values or VH intensities are expected in the 2019 images compared to the 2018 image due to the presence of flooding. The before-after-before (BAB) composite image (Figure 9, left) clearly shows areas in purple where 2018 VH intensity was higher than in 2019, suggesting possible areas of flooding. The VH difference map (Figure 9, right) also illustrates this point with higher differences shown in red in the same locations.
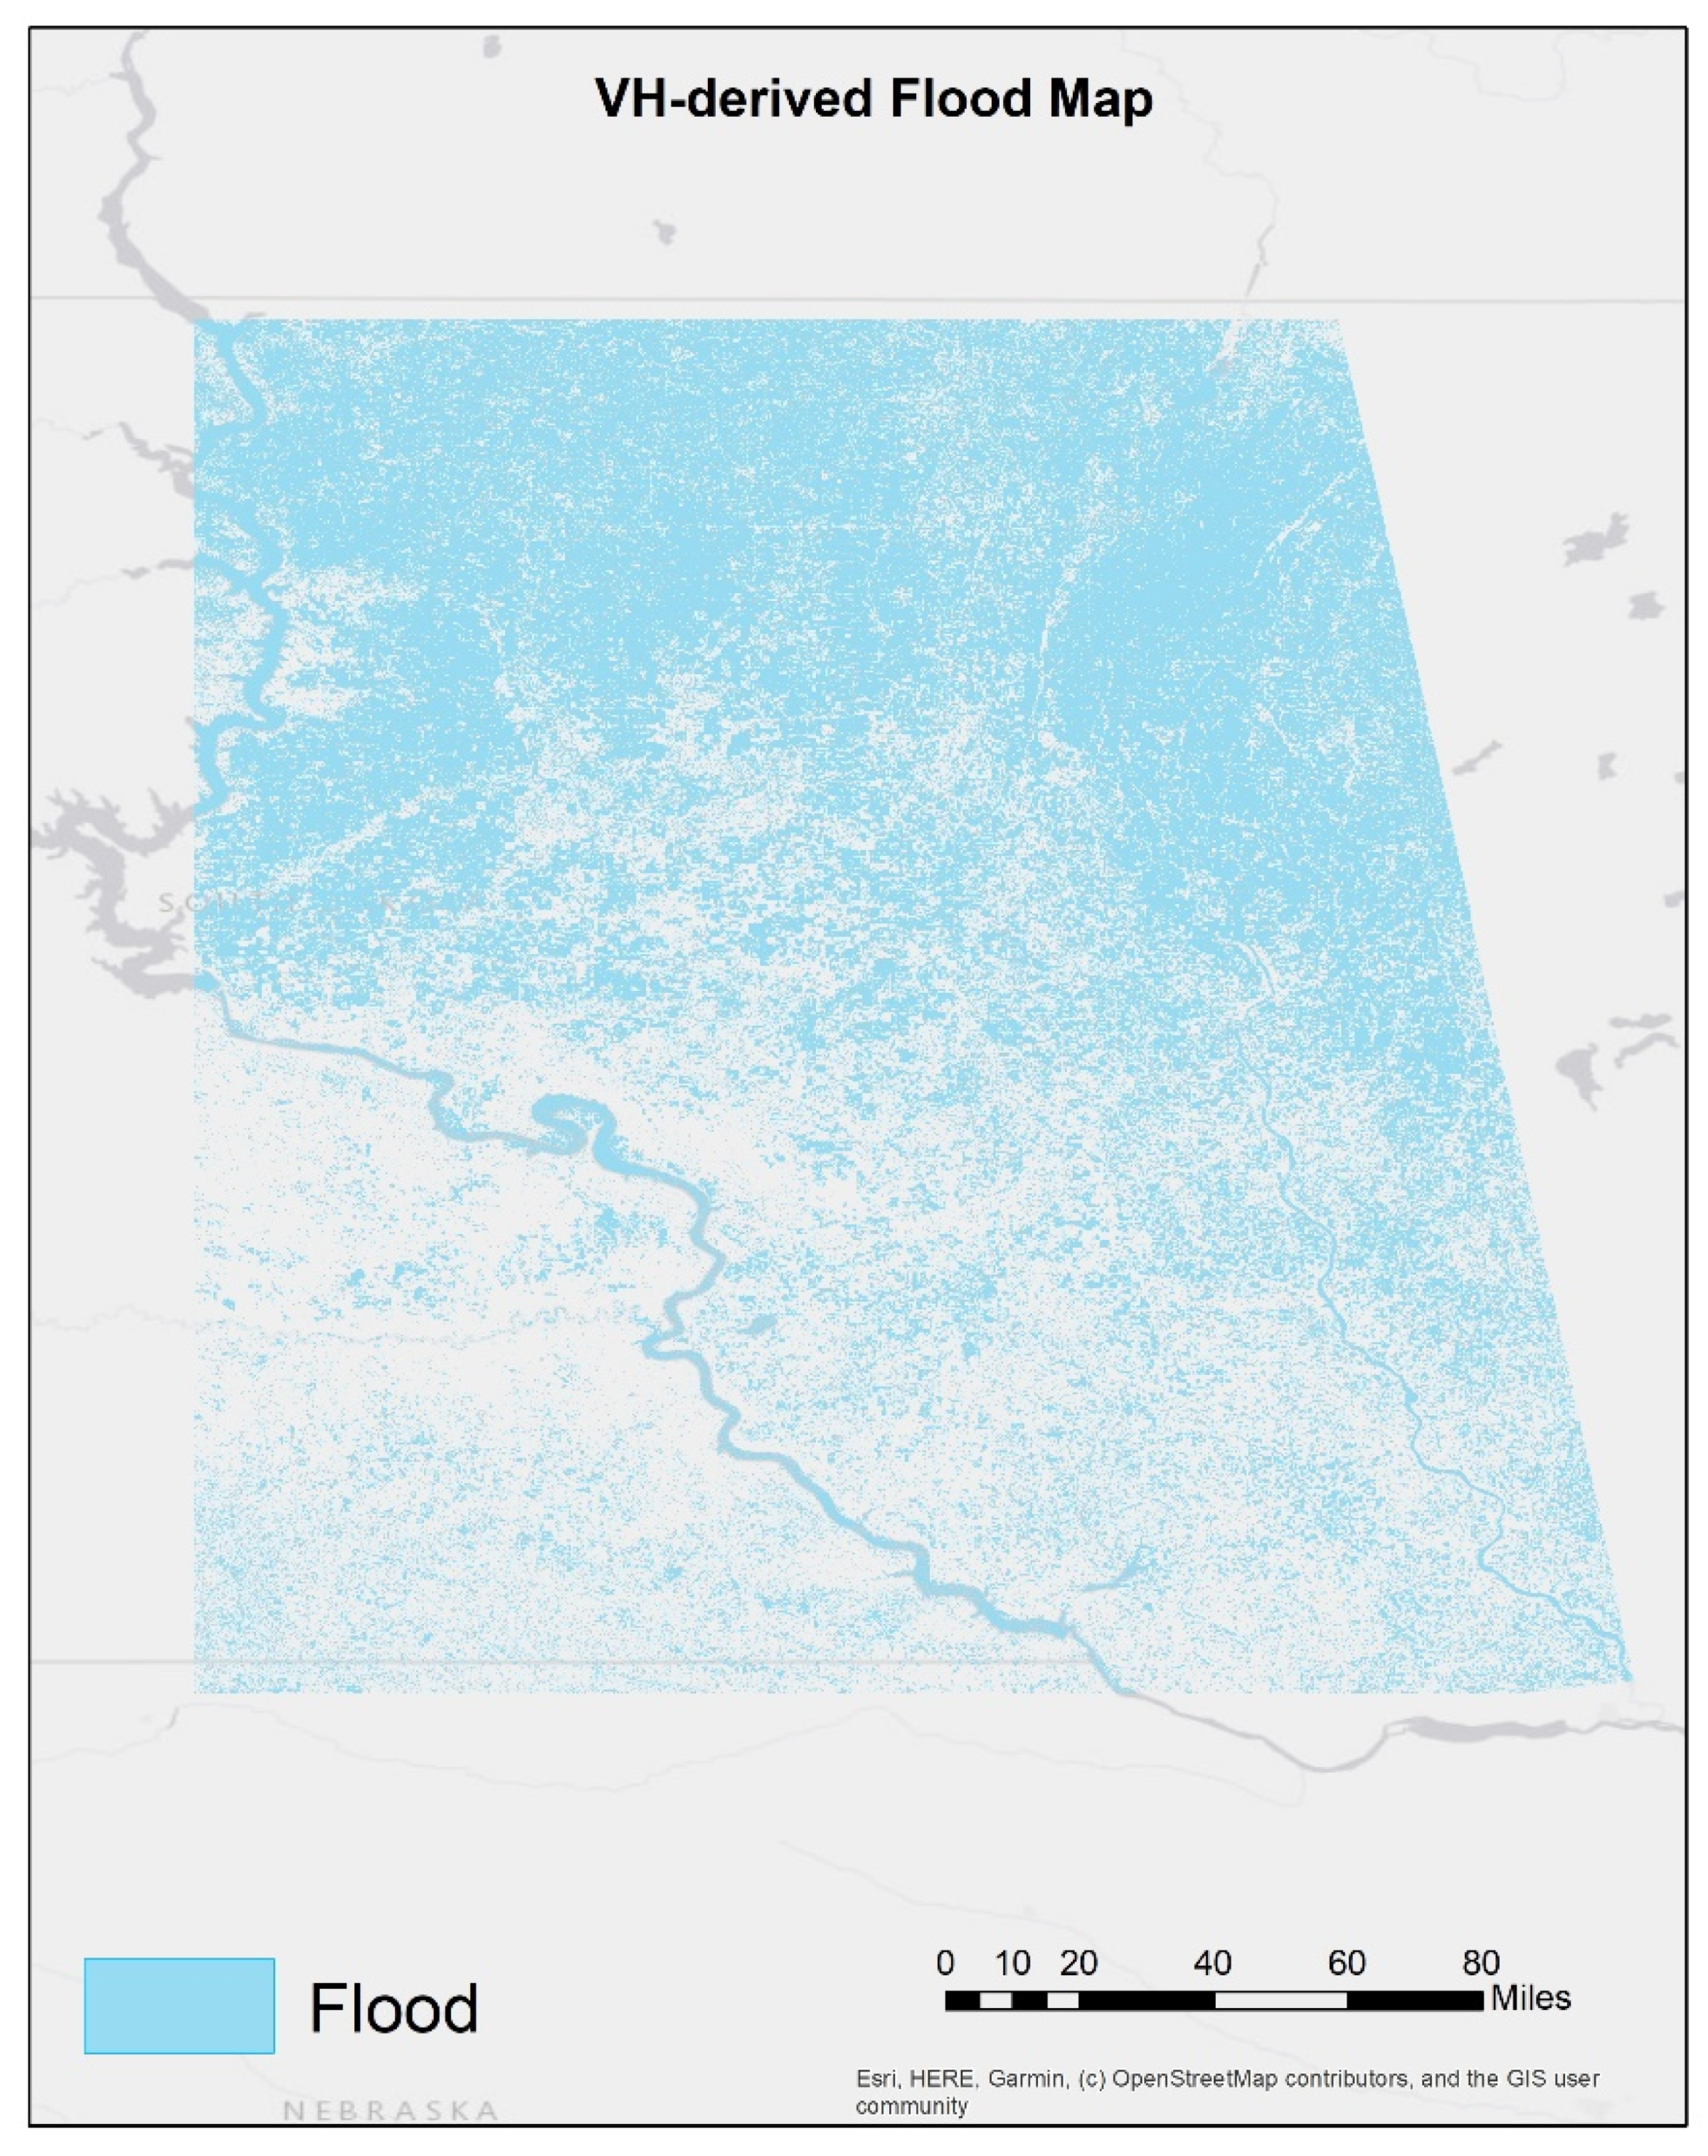
Figure 10 shows the histogram of values in the VH difference image. Unlike that of the NDVI difference image, this histogram shows only one major peak rather than a bimodal distribution. Although the optimal choice of threshold in this case is less clear, we used Otsu thresholding to automatically select a threshold separating possible flooded and non-flooded pixels. This resulted in a threshold value of 1.037, with pixels above this threshold assumed to have been flooded and those below it non-flooded (Figure 11).

3.3. Prevent Plant Estimates

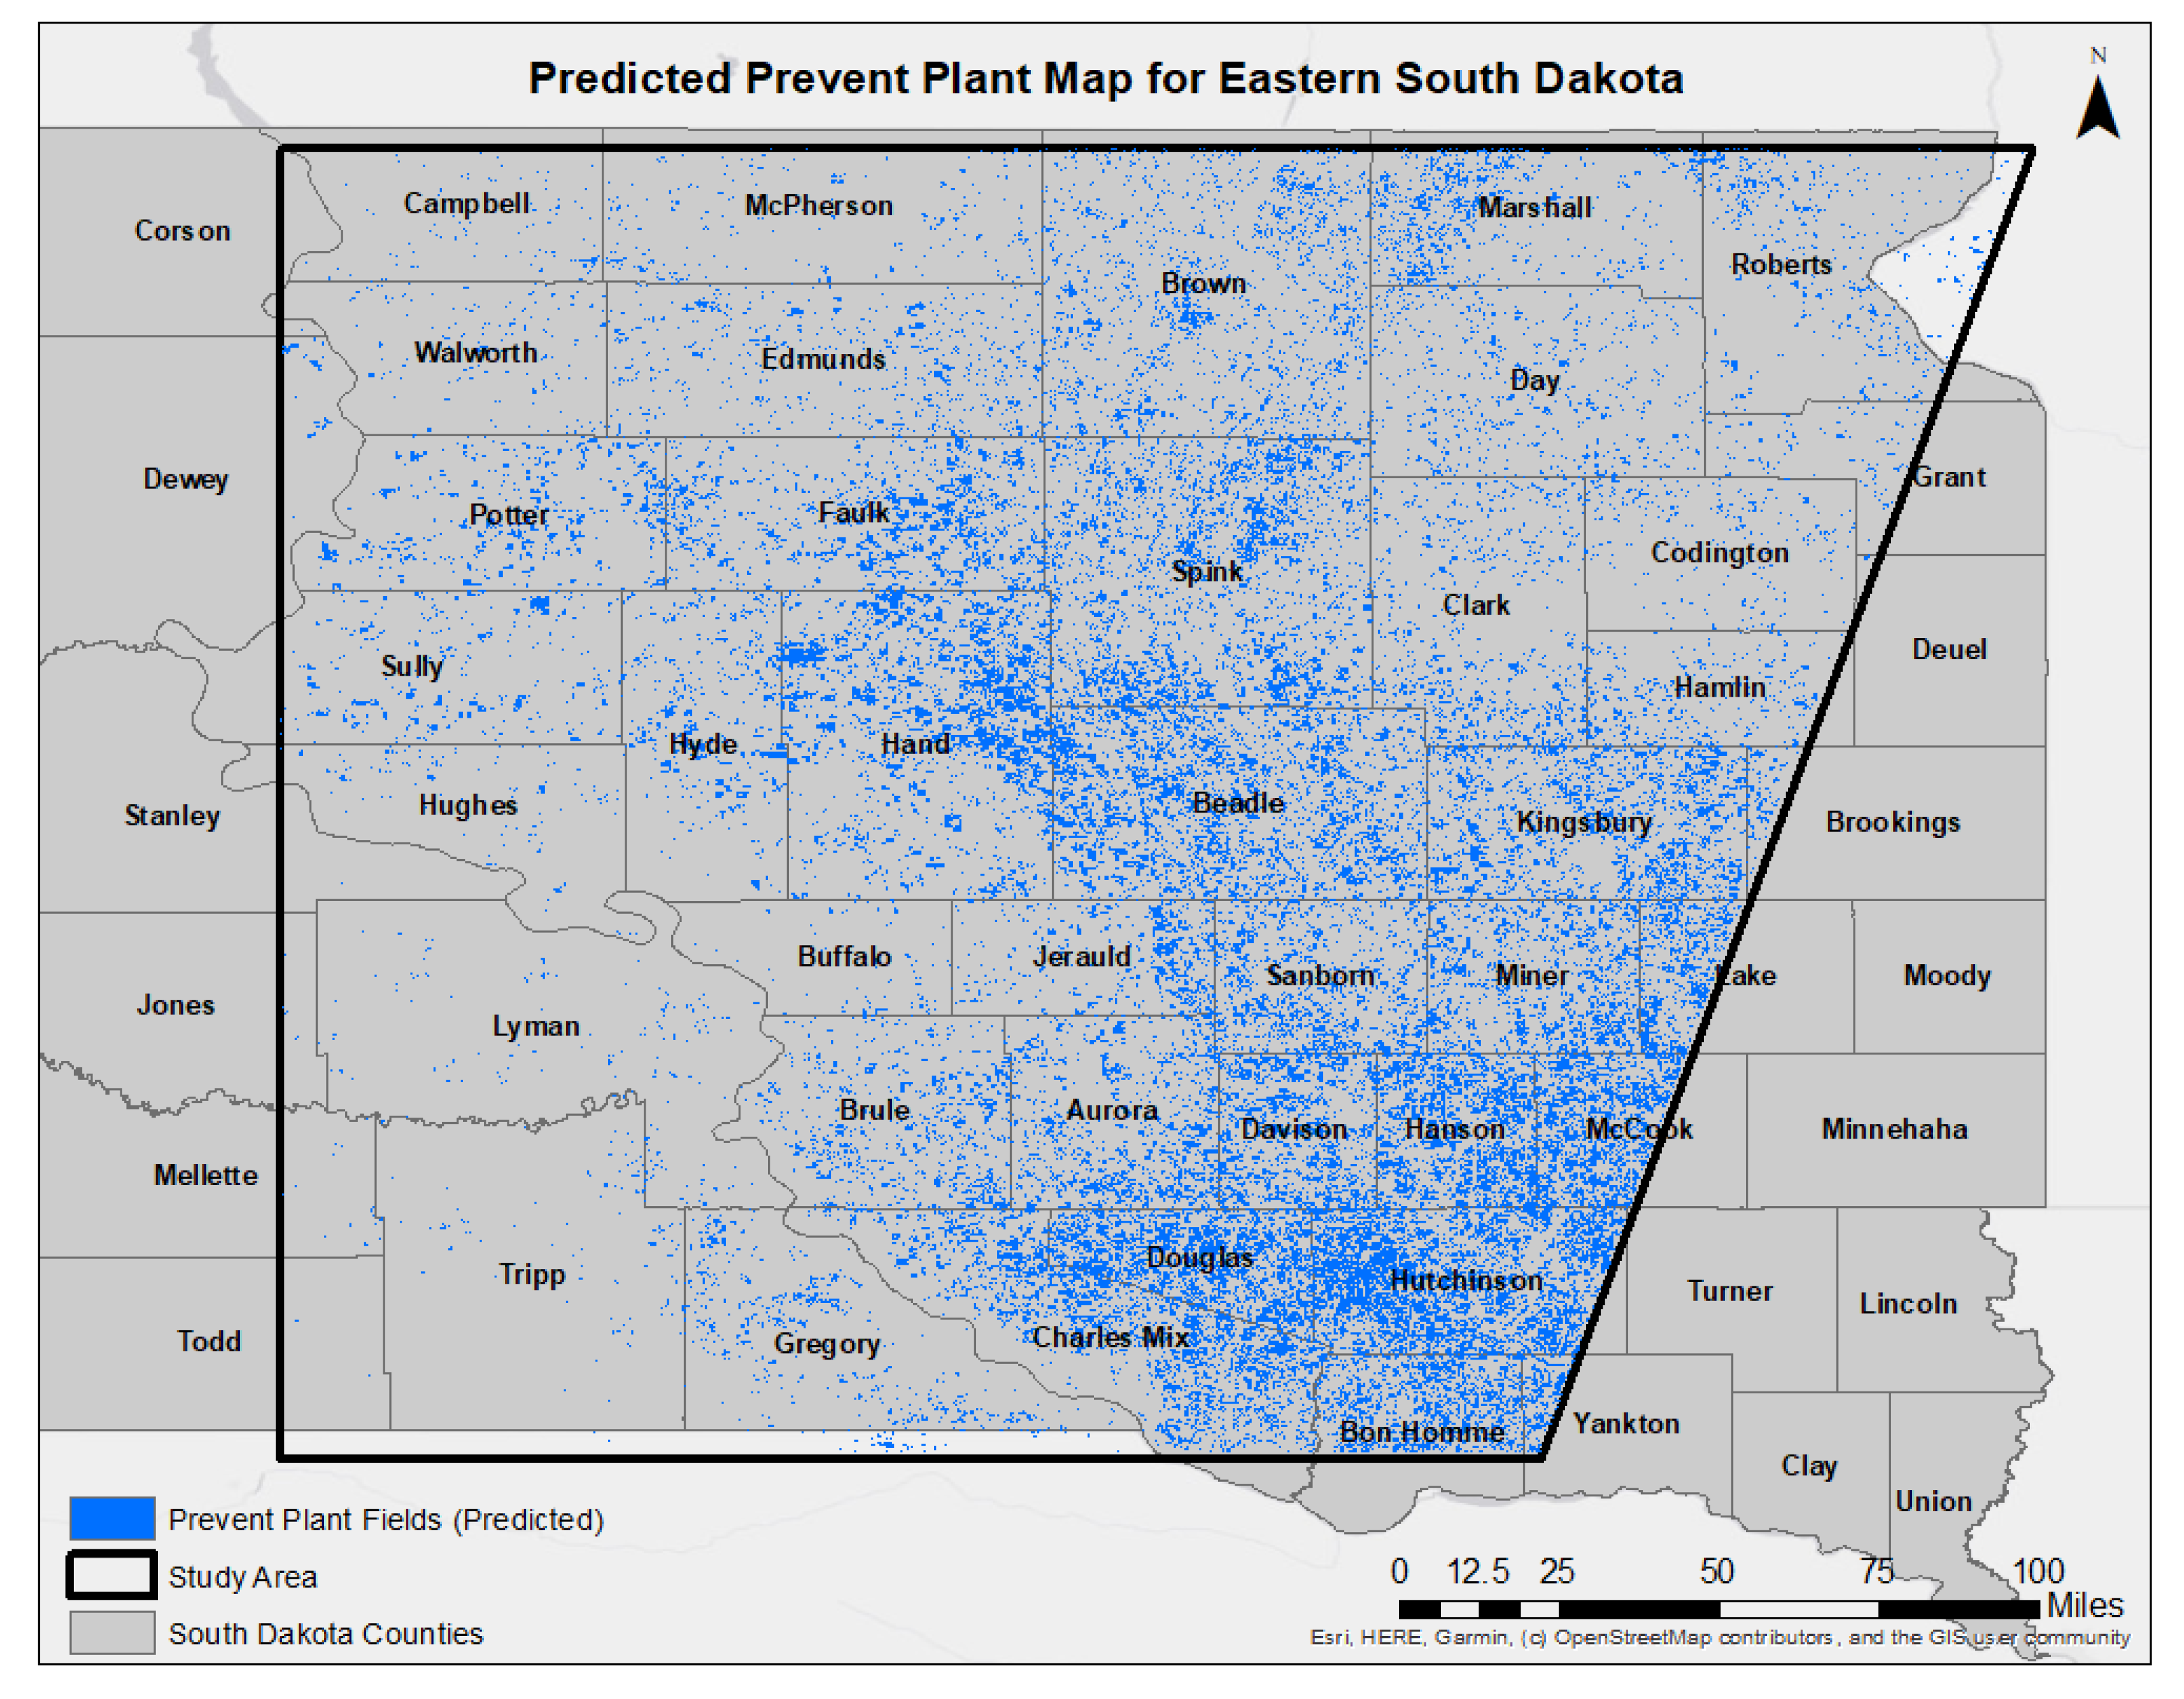
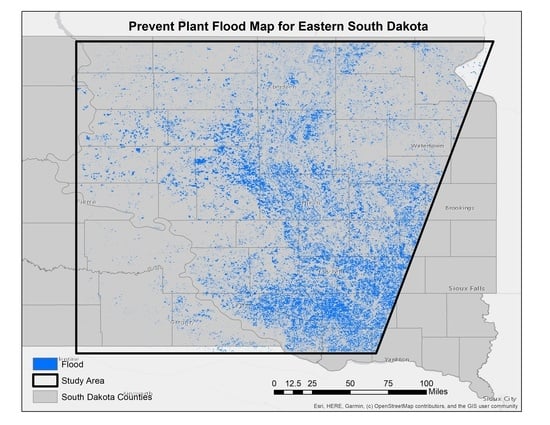
We combined the flood maps derived from Sentinel 1 and Landsat 8 with a union operation, resulting in the map shown in Figure 12, indicating cropland locations where growers were likely to have been prevented from planting due to flooding in 2019. Since field-scale ground-truth data on flooding was not available for 2019, our evaluation of the flood maps was qualitative. While the flood map is an intermediate product in our workflow, the objective of this study is to create maps of prevent plant fields, which we were able to evaluate quantitatively by comparing to the Farm Service Agency’s reports of county-level prevent plant acres. After aggregating our map-based estimates to the county scale and converting to acres, we compared the resulting estimates to the prevent plant acres reported by the Farm Service Agency for each county to assess the accuracy of the prevent plant map predicted acres (Table 3).
The highest agreement between our map and the FSA prevent plant estimates was in Hanson, Jerauld, and Spink counties with error values 1%. Other counties such as Miner, Douglas Faulk, Beadle and Hutchinson have error values less than 10%.
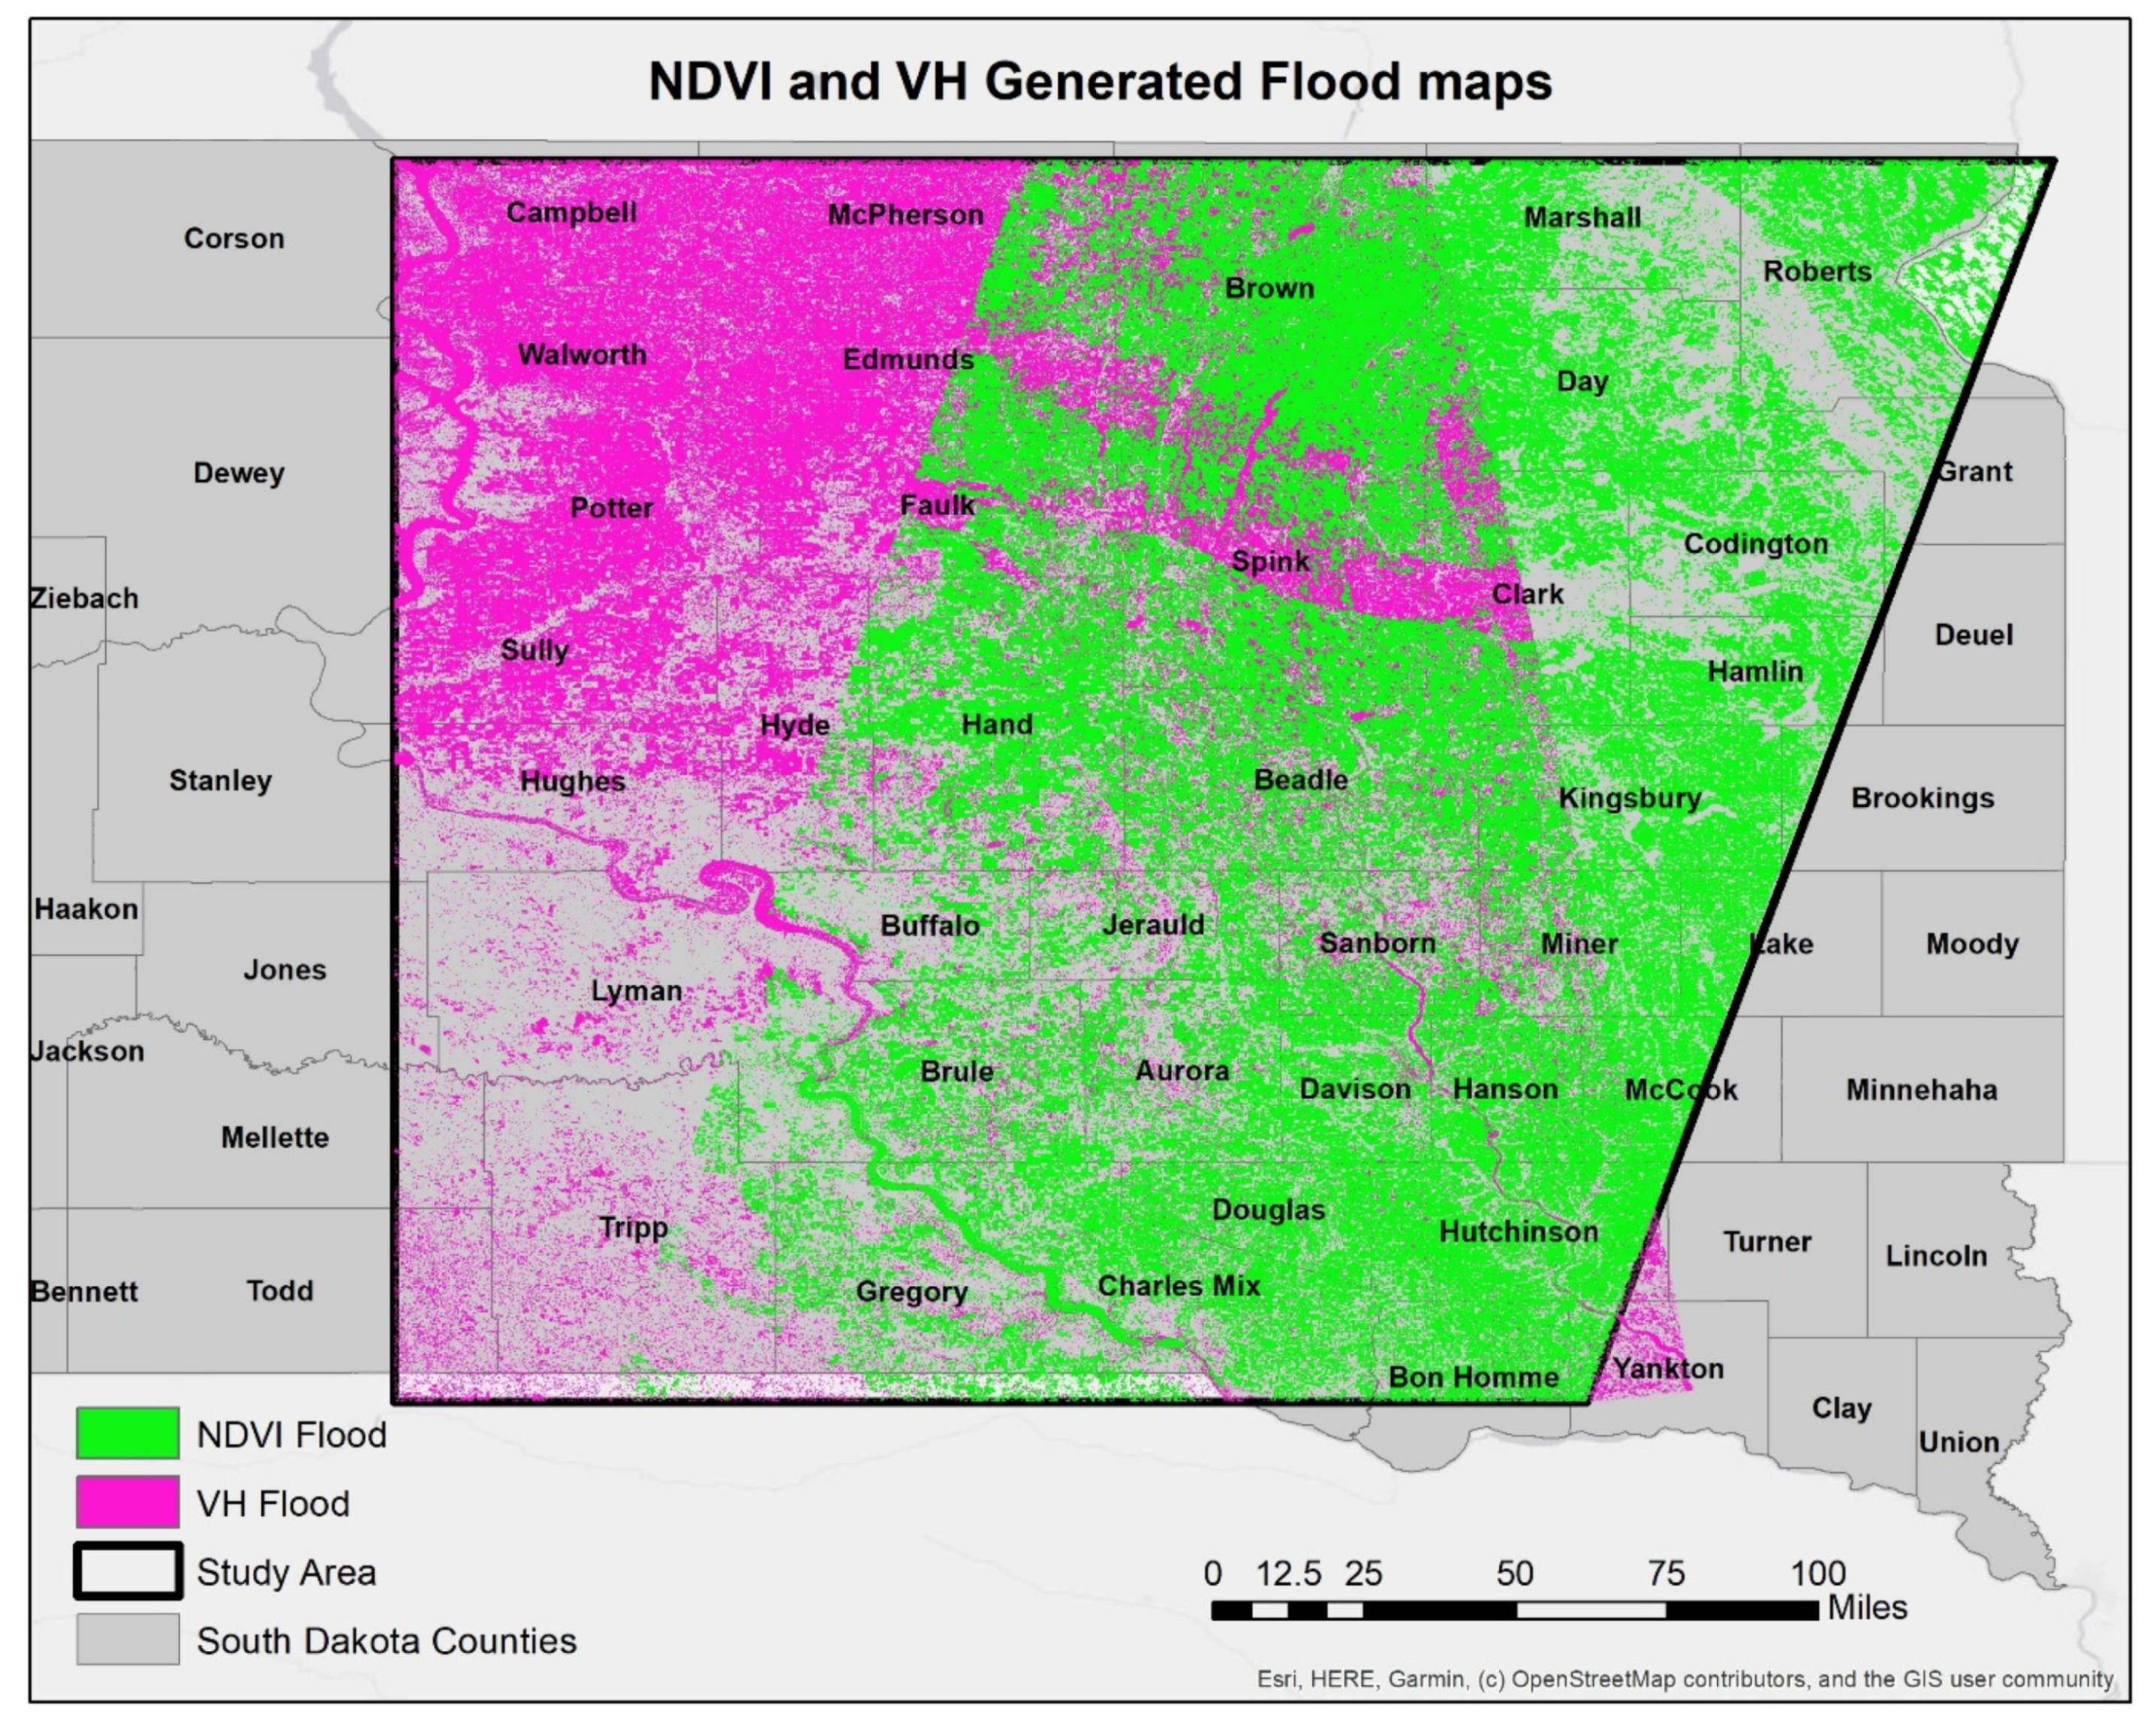
Counties such as Tripp, Lyman, Hughes, McCook, and others with very high percent error values are partially outside of the study area, leading to an incomplete flood map for the county, or are covered by only one of the Sentinel 1 or Landsat 8 images. Regions covered by either the VH- or NDVI-based flood map but not both could lead to an underestimation of flooding (Figure 13). To improve the estimates for these counties, we recommend a wider study area with Landsat 8 and Sentinel 1 images that fully cover these counties or a local and more focused county-level analysis in future work. While flooding was the dominant reason for prevented planting in 2019, soggy or waterlogged soil due to excess rainfall could also have prevented planting and may not have been captured by this analysis.

4. Discussion and Conclusions

The results from this study demonstrate the use of remote sensing techniques to aid in the estimation of prevent plant acres. Due to the unavailability of ground truth information about which individual fields were prevented from planting due to flooding, we relied on the Cropland Data Layer (CDL) for 2019 to spatially confine our flood pixels to only those that fall within pixels classified as “fallow/idle cropland” by CDL. This meant that we removed the pixels that were classified as flooded by our map and as “cultivated” by the CDL. These could be pixels where the flood map overestimated (false positives) or where the cultivated land was actually flooded at the time of satellite image capture but was eventually planted later in the season. It is important to note that our aim was not to create a comprehensive and detailed flood map of the study area but rather to highlight agricultural fields that were likely to have been prevented from planting due to severe flooding using the flood map as an intermediary product. For this reason, as well as a lack of ground-truth data on flooding, we did not quantitatively evaluate the accuracy of the flood maps. Flood pixels that appeared over urban centers, forests, and other land use types not relevant to agriculture were removed from the combined Landsat 8 and Sentinel 1 flood map (Figure 13). This was particularly helpful for SAR-based flood maps as urban and forests provide more complex scattering mechanisms leading to the increased appearance of false positives [25]. In addition to reducing the number of possible false positives, this step also constrained our analysis to only the flood pixels directly relevant to agriculture.
To evaluate the accuracy of our prevent plant map, we compared the county-scale aggregated area that was classified as prevent plant to the 2019 crop acreage data from Farm Service Agency (FSA). In future work, the accuracy of both the flood mapping and prevent plant prediction could be improved by incorporating ground-truth data about flooding and/or prevent plant fields, e.g., to inform thresholds for classifying flooded areas or to evaluate the field-scale performance of our classification.
One potential source of error is the use of the Cropland Data Layer (CDL) to identify pixels that were classified as both flooded by our map and as fallow/idle by the CDL. While the CDL overall has high accuracy for midwestern states [26], land use and crop type information generated from CDL has been shown to be problematic at times, especially when multiyear analysis of land use is necessary [27]. Since the CDL is not available until after the growing season and similar products are not available for most countries, our approach could be improved in future work to support in-season mapping and use in other countries by using in-season crop type mapping methods (e.g., [28]) instead of the CDL or by directly detecting whether a field was fallow or planted. This would also ensure real-time analysis when disasters occur during the growing season and help reduce potential errors associated with late-planted fields.
While there is substantial prior work using satellite observations for crop type mapping or crop yield estimation (e.g., [29,30,31,32,33,34]), to our knowledge this is the first study that aims to use remote sensing techniques for detecting fields prevented from planting due to flooding or excess moisture. We hope to stimulate further studies that use remote sensing techniques to characterize the effects of natural disasters and extreme weather on agricultural production. As climatic conditions continue to be more unpredictable, understanding the role and impact of flooding and other disasters on agriculture will be crucial for devising adaptive measures to ensure sustainability.

Author Contributions

Conceptualization, H.K.; methodology, A.L., H.K.; software, A.L.; validation, A.L., H.K.; formal analysis, A.L.; investigation, A.L.; resources, A.L., H.K.; data curation, A.L.; writing—original draft preparation, A.L.; writing—review and editing, H.K., I.B.-R., S.M.; visualization, A.L.; supervision, H.K.; project administration, A.L., H.K. All authors have read and agreed to the published version of the manuscript.

Funding

This research received no external funding.

Acknowledgments

A.L. would like to thank the Department of Geographical Sciences at University of Maryland for their support not just during this research, but his entire master’s program. Special thanks to Jonathan Resop and Rejanne Le Bivic for their contributions to this project.

Conflicts of Interest

The authors declare no conflict of interest.

Appendix A

Table A1. A comparison of observed and predicted prevent plant acres sorted by percent error.
CountyPredicted Prevent Plant Acres (Fallow)FSA Prevent Plant AcresAbsolute ErrorPercent Error
Hanson103,478103,6751960.19
Jerauld36,29035,9803100.86
Spink177,457175,59718601.06
Hand163,839157,55062903.99
Miner74,51270,66138515.45
Douglas111,633120,82891957.61
Kingsbury116,205107,69185147.91
Brule51,46647,59638708.13
Faulk90,85898,93580778.16
Sanborn67,40673,99565888.90
Beadle192,731212,20219,4709.18
Aurora74,07667,70163749.42
Hutchinson204,524226,36221,8389.65
Day37,77942,795501711.72
Charles Mix139,409161,77122,36213.82
Davison76,97891,79114,81416.14
Gregory29,83735,989615317.10
Marshall47,99061,76013,77022.30
Clark47,64862,09614,44823.27
Potter44,21759,60515,38725.82
Codington17,57124,815724529.19
Hyde37,48553,26415,77929.62
McPherson16,28923,190690129.76
Buffalo57154245147034.63
Bon Homme71,305112,38141,07636.55
Brown101,530160,33558,80536.68
Roberts29,02948,30019,27039.90
McCook86,103145,72759,62440.91
Walworth995317,073711941.70
Hamlin23,69841,87218,17443.40
Edmunds40,27573,54733,27245.24
Sully27,43450,27522,84045.43
Campbell578415,398961462.43
Hughes670226,63919,93774.84
Lyman884035,90627,06675.38
Tripp613844,04137,90286.06

References

  1. Prevented Planting. Available online: https://www.rma.usda.gov/en/Topics/Prevented-Planting (accessed on 4 October 2020).
  2. Report: Farmers Prevented from Planting Crops on More Than 19 Million Acres. Available online: https://www.fsa.usda.gov/news-room/news-releases/2019/report-farmers-prevented-from-planting-crops-on-more-than-19-million-acres (accessed on 4 October 2020).
  3. Prevented or Delayed Planting. Available online: https://www.farmers.gov/manage/prevented-planting (accessed on 4 October 2020).
  4. 2019 Catastrophic River Flooding. Available online: https://disasterphilanthropy.org/disaster/2019-u-s-spring-floods/ (accessed on 6 October 2020).
  5. Schnitkey, G.; Zulauf, C. Late Planting Decisions in 2019. Farmdoc Dly. 2019, 9, 83. [Google Scholar]
  6. 2019 Crop Acreage Data Dated. 1 November 2019. Available online: https://www.fsa.usda.gov/news-room/efoia/electronic-reading-room/frequently-requested-information/crop-acreage-data/index (accessed on 3 October 2020).
  7. Kyriou, A.; Nikolakopoulos, K. A combined study of flood propagation mapping, using sentinel-1 and landsat-8 data. A case study from river evros, greece. Bull. Geol. Soc. Greece 2017, 50, 1711–1720. [Google Scholar] [CrossRef]
  8. Cian, F.; Marconcini, M.; Ceccato, P.; Giupponi, C. Flood Depth Estimation by Means of High-Resolution SAR Images and LiDAR Data. ResearchGate. Available online: https://www.researchgate.net/publication/326067701_Flood_depth_estimation_by_means_of_high-resolution_SAR_images_and_LiDAR_data (accessed on 16 September 2020).
  9. Li, Y.; Martinis, S.; Wieland, M.; Schlaffer, S.; Natsuaki, R. Urban Flood Mapping Using SAR Intensity and Interferometric Coherence via Bayesian Network Fusion. Remote Sens. 2019, 11, 2231. [Google Scholar] [CrossRef] [Green Version]
  10. The Great Flood of 2019: A Complete Picture of a Slow-Motion Disaster. Available online: https://www.nytimes.com/interactive/2019/09/11/us/midwest-flooding.html (accessed on 6 October 2020).
  11. Kyriou, A.; Nikolakopoulos, K. Flood mapping from Sentinel-1 and Landsat-8 data: A case study from river Evros, Greece. In Proceedings of the Earth Resources and Environmental Remote Sensing/GIS Applications VI, Toulouse, France, 22–24 September 2015; Volume 9644, p. 64405. [Google Scholar] [CrossRef]
  12. Dao, P.; Liou, Y.-A.; Chou, C.-W. Detection of Flood Inundation Regions with Landsat/MODIS Synthetic Data. ResearchGate. Available online: https://www.researchgate.net/publication/275026654_Detection_of_Flood_Inundation_Regions_with_LandsatMODIS_Synthetic_Data (accessed on 15 September 2020).
  13. Boschetti, M.; Nutini, F.; Manfron, G.; Brivio, P.A.; Nelson, A. Comparative Analysis of Normalised Difference Spectral Indices Derived from MODIS for Detecting Surface Water in Flooded Rice Cropping Systems. PLoS ONE 2014, 9, e88741. [Google Scholar] [CrossRef] [PubMed]
  14. Cian, F.; Marconcini, M.; Ceccato, P. Normalized Difference Flood Index for rapid flood mapping: Taking advantage of EO big data. Remote Sens. Environ. 2018, 209, 712–730. [Google Scholar] [CrossRef]
  15. Wang, J.; Ding, J.; Li, G.; Liang, J.; Yu, D.; Aishan, T.; Zhang, F.; Yang, J.; Abulimiti, A.; Liu, J. Dynamic detection of water surface area of Ebinur Lake using multi-source satellite data (Landsat and Sentinel-1A) and its responses to changing environment. Catena 2019, 177, 189–201. [Google Scholar] [CrossRef]
  16. Kupidura, P. Comparison of filters dedicated to speckle suppression in sar images. ISPRS Int. Arch. Photogramm. Remote Sens. Spat. Inf. Sci. 2016, XLI-B7, 269–276. [Google Scholar] [CrossRef] [Green Version]
  17. Earth Engine Data Catalog. Available online: https://developers.google.com/earthengine/datasets/catalog/LANDSAT_LC08_C01_T1_SR (accessed on 30 September 2020).
  18. Manjusree, P.; Kumar, L.; Bhatt, C.M.; Rao, G.S.; Bhanumurthy, V. Optimization of threshold ranges for rapid flood inundation mapping by evaluating backscatter profiles of high incidence angle SAR images. Int. J. Disaster Risk Sci. 2012, 3, 113–122. [Google Scholar] [CrossRef] [Green Version]
  19. Solbø, S.; Solheim, I. Towards Operational Flood Mapping with Satellite SAR; Special Publication ESA SP; European Space Agency: Paris, France, 2005. [Google Scholar]
  20. Otsu’s Method for Image Segmentation. Available online: https://medium.com/google-earth/otsus-method-for-image-segmentation-f5c48f405e (accessed on 15 October 2020).
  21. USDA Cropland Data Archive. Available online: https://www.nass.usda.gov/Research_and_Science/Cropland/Release/index.php (accessed on 15 September 2020).
  22. USDA Crop Progress Report. Available online: https://www.nass.usda.gov/Publications/Todays_Reports/reports/prog2719.pdf (accessed on 10 February 2021).
  23. USDA Crop Progress and Condition Report, South Dakota. 2019. Available online: https://www.nass.usda.gov/Charts_and_Maps/Crop_Progress_&_Condition/2019/SD_2019.pdf (accessed on 10 February 2021).
  24. Planet Team. Planet Team. Planet Application Program Interface. In Space for Life on Earth; Planet Team: San Francisco, CA, USA, 2017; Available online: https://api.planet.com (accessed on 12 February 2021).
  25. Dasgupta, A.; Grimaldi, S.; Ramsankaran, R.; Pauwels, V.R.N.; Walker, J.P.; Chini, M.; Hostache, R.; Matgen, P. Flood Mapping Using Synthetic Aperture Radar Sensors from Local to Global Scales. In Geophysical Monograph Series; Schumann, G.J.-P., Bates, P.D., Apel, H., Aronica, G.T., Eds.; John Wiley & Sons, Inc.: Hoboken, NJ, USA, 2018; pp. 55–77. [Google Scholar] [CrossRef]
  26. Boryan, C.G.; Yang, Z. Deriving crop specific covariate data sets from multi-year NASS geospatial cropland data layers. In Proceedings of the 2013 IEEE International Geoscience and Remote Sensing Symposium—IGARSS, Melbourne, Australia, 21–26 July 2013; pp. 4225–4228. [Google Scholar] [CrossRef] [Green Version]
  27. Lark, T.J.; Mueller, R.M.; Johnson, D.M.; Gibbs, H.K. Measuring land-use and land-cover change using the U.S. department of agriculture’s cropland data layer: Cautions and recommendations. Int. J. Appl. Earth Obs. Geoinf. 2017, 62, 224–235. [Google Scholar] [CrossRef]
  28. Kerner, H.; Sahajpal, R.; Skakun, S.; Becker-Reshef, I.; Barker, B.; Hosseini, M.; Puricelli, E.; Gray, P. Resilient In-Season Crop Type Classification in Multispectral Satellite Observations using Growth Stage Normalization. arXiv 2020, arXiv:2009.10189. [Google Scholar]
  29. Bellow, M.E.; Graham, M.L. Improved Crop Area Estimation in the Mississippi Delta Region Using Landsat Tm Data. Presented at the ASPRS/ACSM/RT 92 Convention, Washington, DC, USA, 3–7 August 1992; Available online: https://www.nass.usda.gov/Education_and_Outreach/Reports,_Presentations_and_Conferences/GIS_Reports/ (accessed on 28 March 2021).
  30. Wu, B.; Li, Q. Crop area estimation using remote sensing on two-stage stratified sampling. Int. Soc. Photogrametry Remote Sens. 2004, 20, 12–23. [Google Scholar]
  31. Husak, G.J.; Marshall, M.T.; Michaelsen, J.; Pedreros, D.; Funk, C.; Galu, G. Crop area estimation using high and medium resolution satellite imagery in areas with complex topography. J. Geophys. Res. Atmos. 2008, 113, D14. [Google Scholar] [CrossRef] [Green Version]
  32. Viskovic, L.; Kosovic, I.N.; Mastelic, T. Crop Classification using Multi-spectral and Multitemporal Satellite Imagery with Machine Learning. In Proceedings of the 2019 International Conference on Software, Telecommunications and Computer Networks (SoftCOM), Split, Croatia, 19–21 September 2019; p. 8903738. [Google Scholar]
  33. Wagstaff, K.; Mazzoni, D. Recent HARVIST Results: Classifying Crops from Remote Sensing Data. 2006. Available online: https://www.researchgate.net/publication/228940421_Recent_HARVIST_results_classifying_crops_from_remote_sensing_data (accessed on 28 March 2021).
  34. Kobayashi, N.; Tani, H.; Wang, X.; Sonobe, R. Crop classification using spectral indices derived from Sentinel-2A imagery. J. Inf. Telecommun. 2020, 4, 67–90. [Google Scholar] [CrossRef]
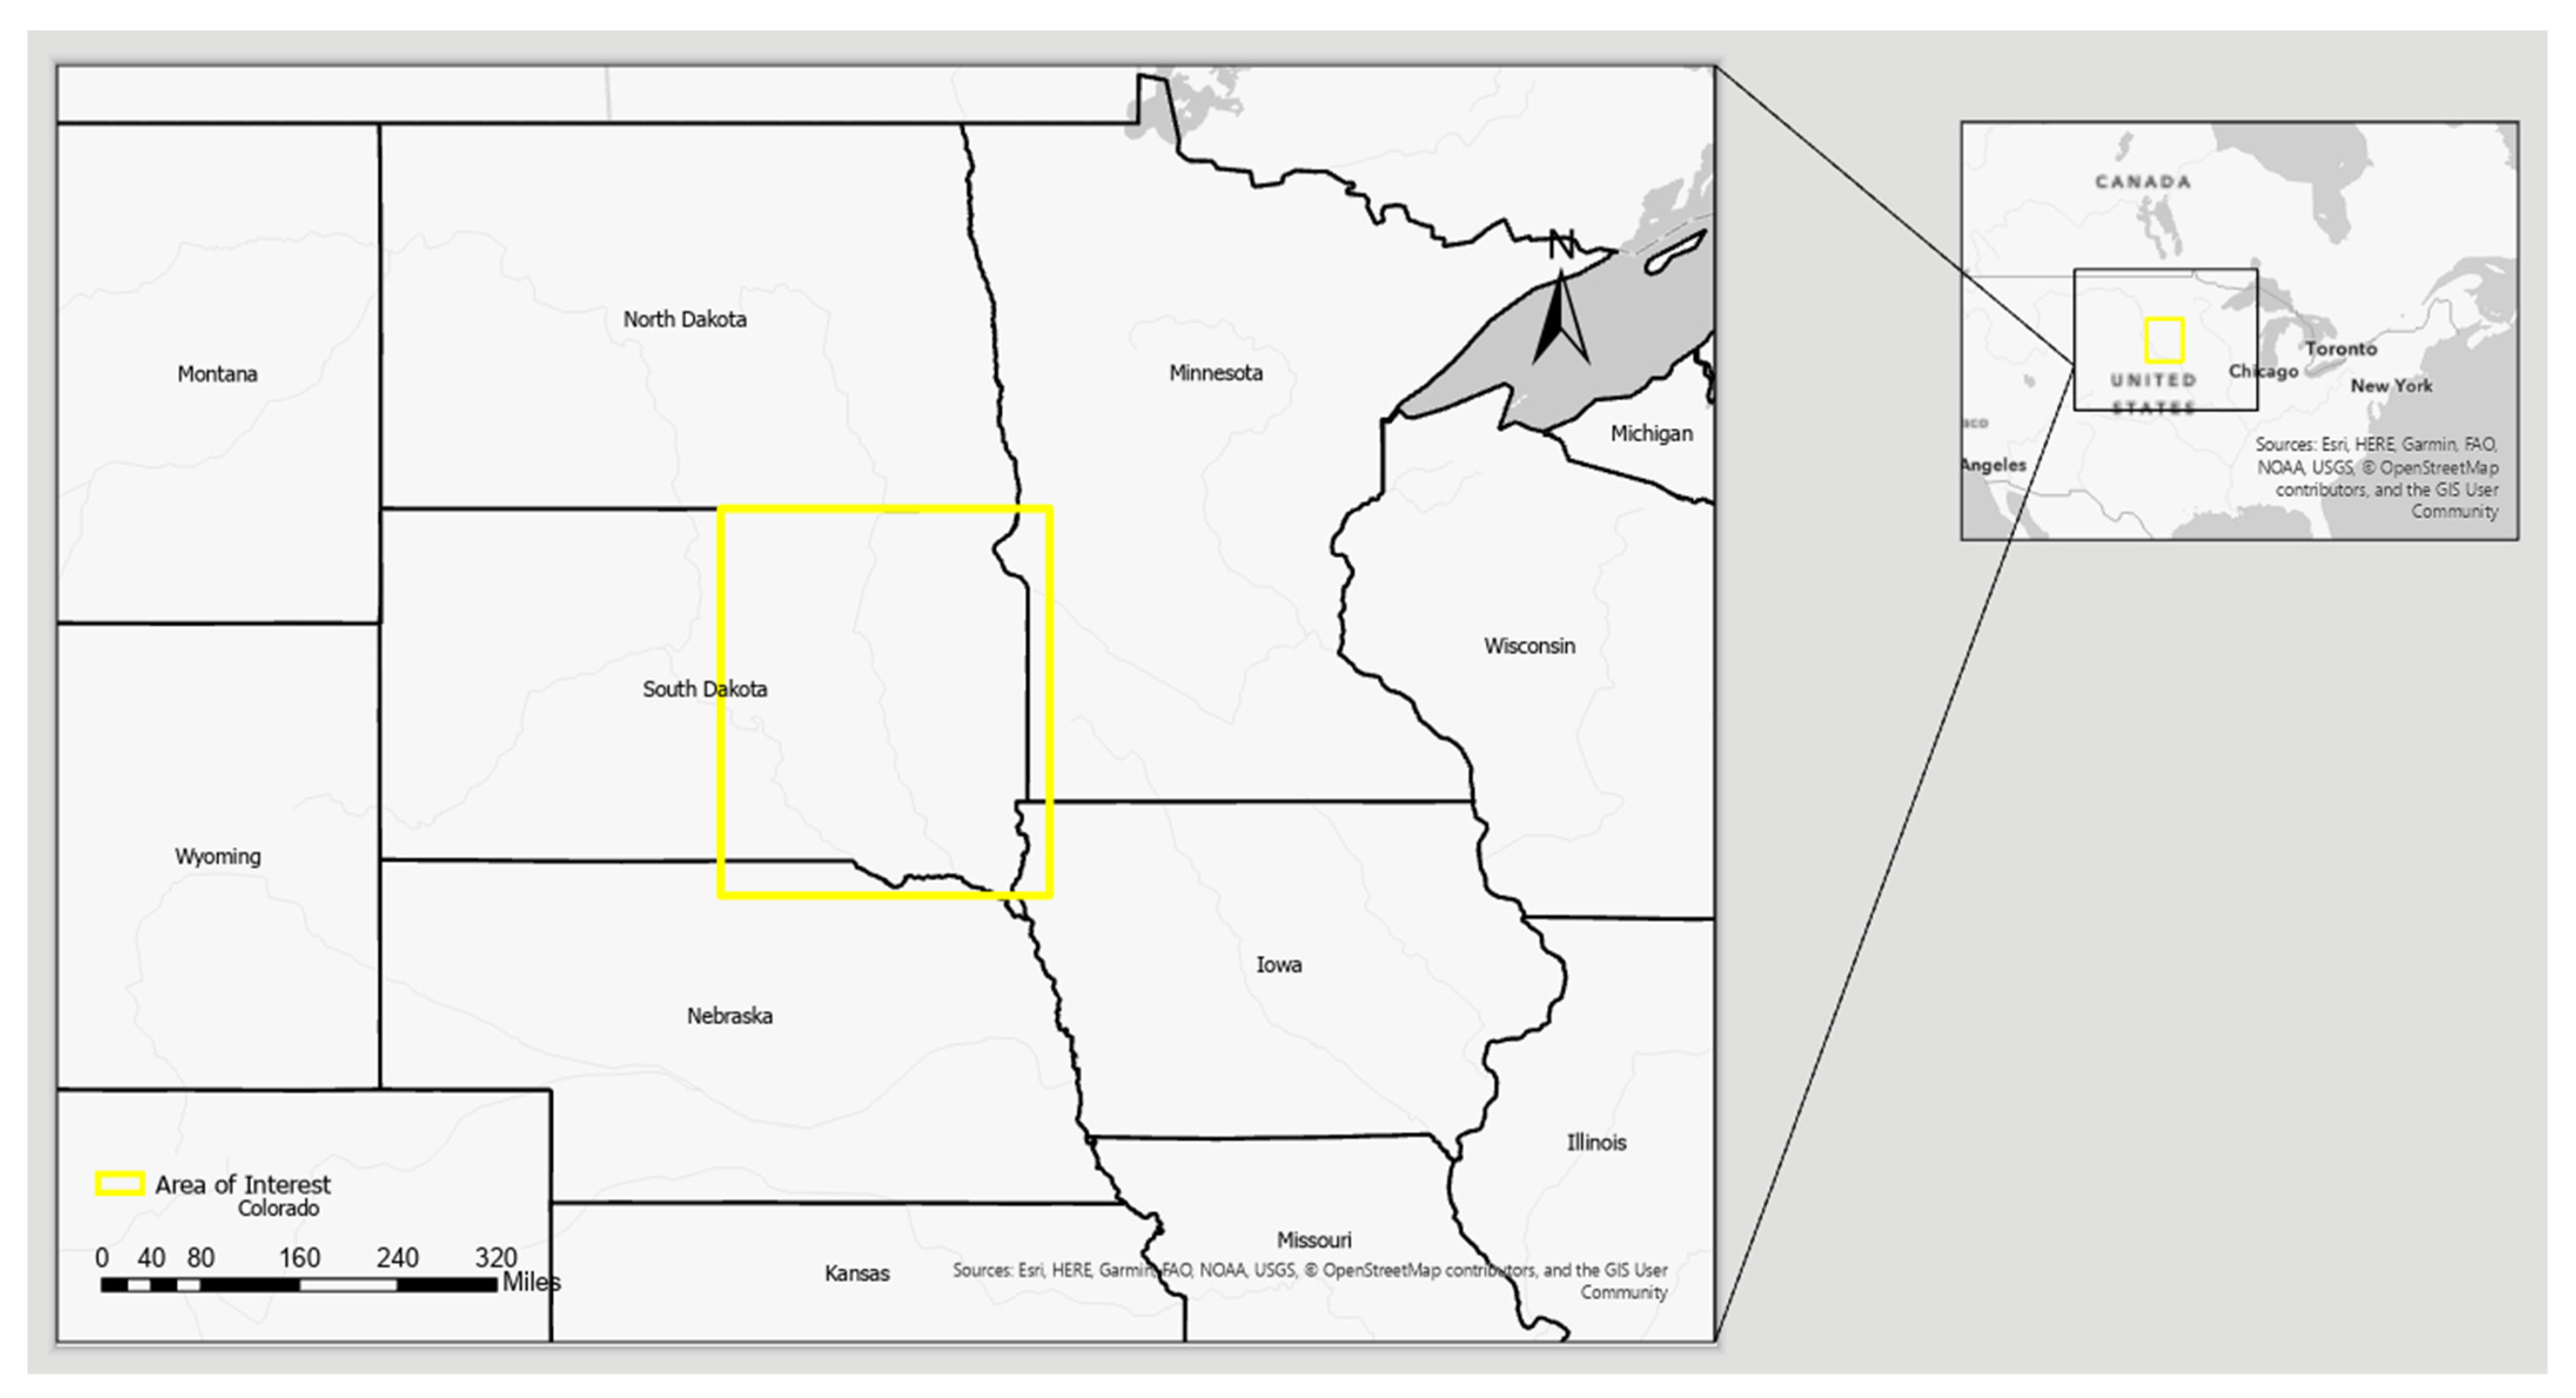
Figure 1. The yellow rectangle indicates the study area which covers the eastern half of South Dakota.
Remotesensing 13 02430 g001
Figure 2. Processing and analysis workflow for prevent plant acres estimation.
Remotesensing 13 02430 g002
Figure 3. The 2019 image shows lower NDVI values compared to the previous year which could be an indication of flooding. Gaps (white pixels) in the images are due to masked clouds.
Remotesensing 13 02430 g003
Figure 4. NDWI map of study area for April 2018 (left) and June 2019 (right) showing general increase in NDWI values across most of the study area.
Remotesensing 13 02430 g004
Figure 5. A June 2019 RapidEye image showing flooded fields in Letcher town of Sanborn County, South Dakota [24].
Remotesensing 13 02430 g005
Figure 6. NDVI change detection map (left) and NDWI change detection map (right).
Remotesensing 13 02430 g006
Figure 7. Bimodal distribution of NDVI change image showing two distinct pixel groups: flooded and non-flooded pixels.
Remotesensing 13 02430 g007
Figure 8. Flood map at 30 m scale generated from NDVI change detection map using threshold value of −0.243.
Remotesensing 13 02430 g008
Figure 9. Before-After-Before Image (left) and VH difference map (right) highlighting similar changes across the two time intervals.
Remotesensing 13 02430 g009
Figure 10. Histogram of VH difference showing just one major peak.
Remotesensing 13 02430 g010
Figure 11. Flood map at 30 m scale derived using pixels greater than the optimum threshold value.
Remotesensing 13 02430 g011
Figure 12. Predicted prevent plant map showing counties most severely affected by flooding in eastern South Dakota in 2019.
Remotesensing 13 02430 g012
Figure 13. Overlay of NDVI and VH generated flood maps showings areas of overlap and fringes without overlap.
Remotesensing 13 02430 g013
Table 1. Summary of the data used.
Data SourceData TypeData QualityData Usage
European Space Agency (ESA) Sentinel 1 via Google Earth EngineGeoTIFFHigh data quality as all the necessary preprocessing has already been done. This includes applying orbit files, radiometric and terrain correction. The images were acquired in 2018 and 2019.
Resolution: 10 m/pixel
This dataset was used for change detection analysis and to generate flood extent map over the study area.
United State Geological Survey (USGS) Landsat 8 OLI via Google Earth EngineGeoTIFFHigh data quality as all the necessary preprocessing has already been done. This includes radiometric and terrain correction, atmospheric correction as well as DN to reflectance values. The images were acquired in 2018 and 2019.
Resolution: 30 m/pixel
These images were also used for change detection and for computing relevant indices to aid flood identification and impact.
Cropland data for 2019 from United States Department of Agriculture GeoTIFFGeo-referenced crop type maps derived from a variety of satellite platforms. Crop classification of the raster is 85–95% accurate for the most common crop types such as corn and soybeans.
This data was released February 2020.
Resolution: 30 m/pixel
This raster image was used to estimate the total area of affected fields.
Crop Acreage data for 2019 [2]ExcelThe information/figures presented in this table can be deemed of average quality. According to the source, some producers may report the same acres twice depending on the use: either grazing or grain.
This data was compiled in November 2019.
This table was used for comparison with estimated figures from the flood extent map.
Administrative boundaries of counties in South Dakota from the Esri Living AtlasShapefileThis data is of high quality and authoritative based on the author/source. This feature layer aided county level estimation of prevent plant fields.
Table 2. Landsat Surface Reflectance and Ground Range Detected Sentinel Images used for this analysis.
Image IDPlatformEventDate
LANDSAT/LC08/C01/T1_SR/LC08_030028_20180428Landsat 8Before Flood04/28/2018
LANDSAT/LC08/C01/T1_SR/LC08_030029_20180428
LANDSAT/LC08/C01/T1_SR/LC08_030030_20180428
LANDSAT/LC08/C01/T1_SR/LC08_030028_20190602After Flood06/02/2019
LANDSAT/LC08/C01/T1_SR/LC08_030029_20190602
LANDSAT/LC08/C01/T1_SR/LC08_030030_20190602
COPERNICUS/S1_GRD/S1B_IW_GRDH_1SDV_20180408T002936
_20180408T003005_010385_012E91_D6C5
Sentinel 1Before Flood04/08/2018
COPERNICUS/S1_GRD/S1B_IW_GRDH_1SDV_20180408T003005
_20180408T003030_010385_012E91_D76D
COPERNICUS/S1_GRD/S1B_IW_GRDH_1SDV_20180408T003030
_20180408T003055_010385_012E91_030F
COPERNICUS/S1_GRD/S1B_IW_GRDH_1SDV_20190602T002945
_20190602T003014_016510_01F13C_4D1E
After Flood06/02/2019
COPERNICUS/S1_GRD/S1B_IW_GRDH_1SDV_20190602T003014
_20190602T003039_016510_01F13C_B19C
COPERNICUS/S1_GRD/S1B_IW_GRDH_1SDV_20190602T003039
_20190602T003104_016510_01F13C_5AA0
Table 3. A comparison of FSA-reported and our predicted prevent plant acres, sorted by percent error. Only the top and bottom 5 counties are shown. See Table A1 in Appendix A for all counties.
CountyPredicted Prevent Plant Acres (Fallow)FSA Prevent Plant AcresAbsolute Error (Acres)Percent Error (%)
Top 5 Counties
Hanson103,478103,6751960.19
Jerauld36,29035,9803100.86
Spink177,457175,59718601.06
Hand163,839157,55062893.99
Miner74,51270,66138505.45
Bottom 5 Counties
Sully27,43450,27522,84045.43
Campbell578415,398961362.44
Hughes670226,63919,93674.84
Lyman884035,90627,06675.38
Tripp613844,04137,90286.06
Publisher’s Note: MDPI stays neutral with regard to jurisdictional claims in published maps and institutional affiliations.