
Water Vapor Density Retrieval Studies Using Commercial Millimeter-Wave Links at 38 GHz and E-Band


Abstract
:1. Introduction
2. Materials and Methods
2.1. Method for Water Vapor Density Retrieval
2.2. Statistical Performance Test
2.3. Outdoor Measurement
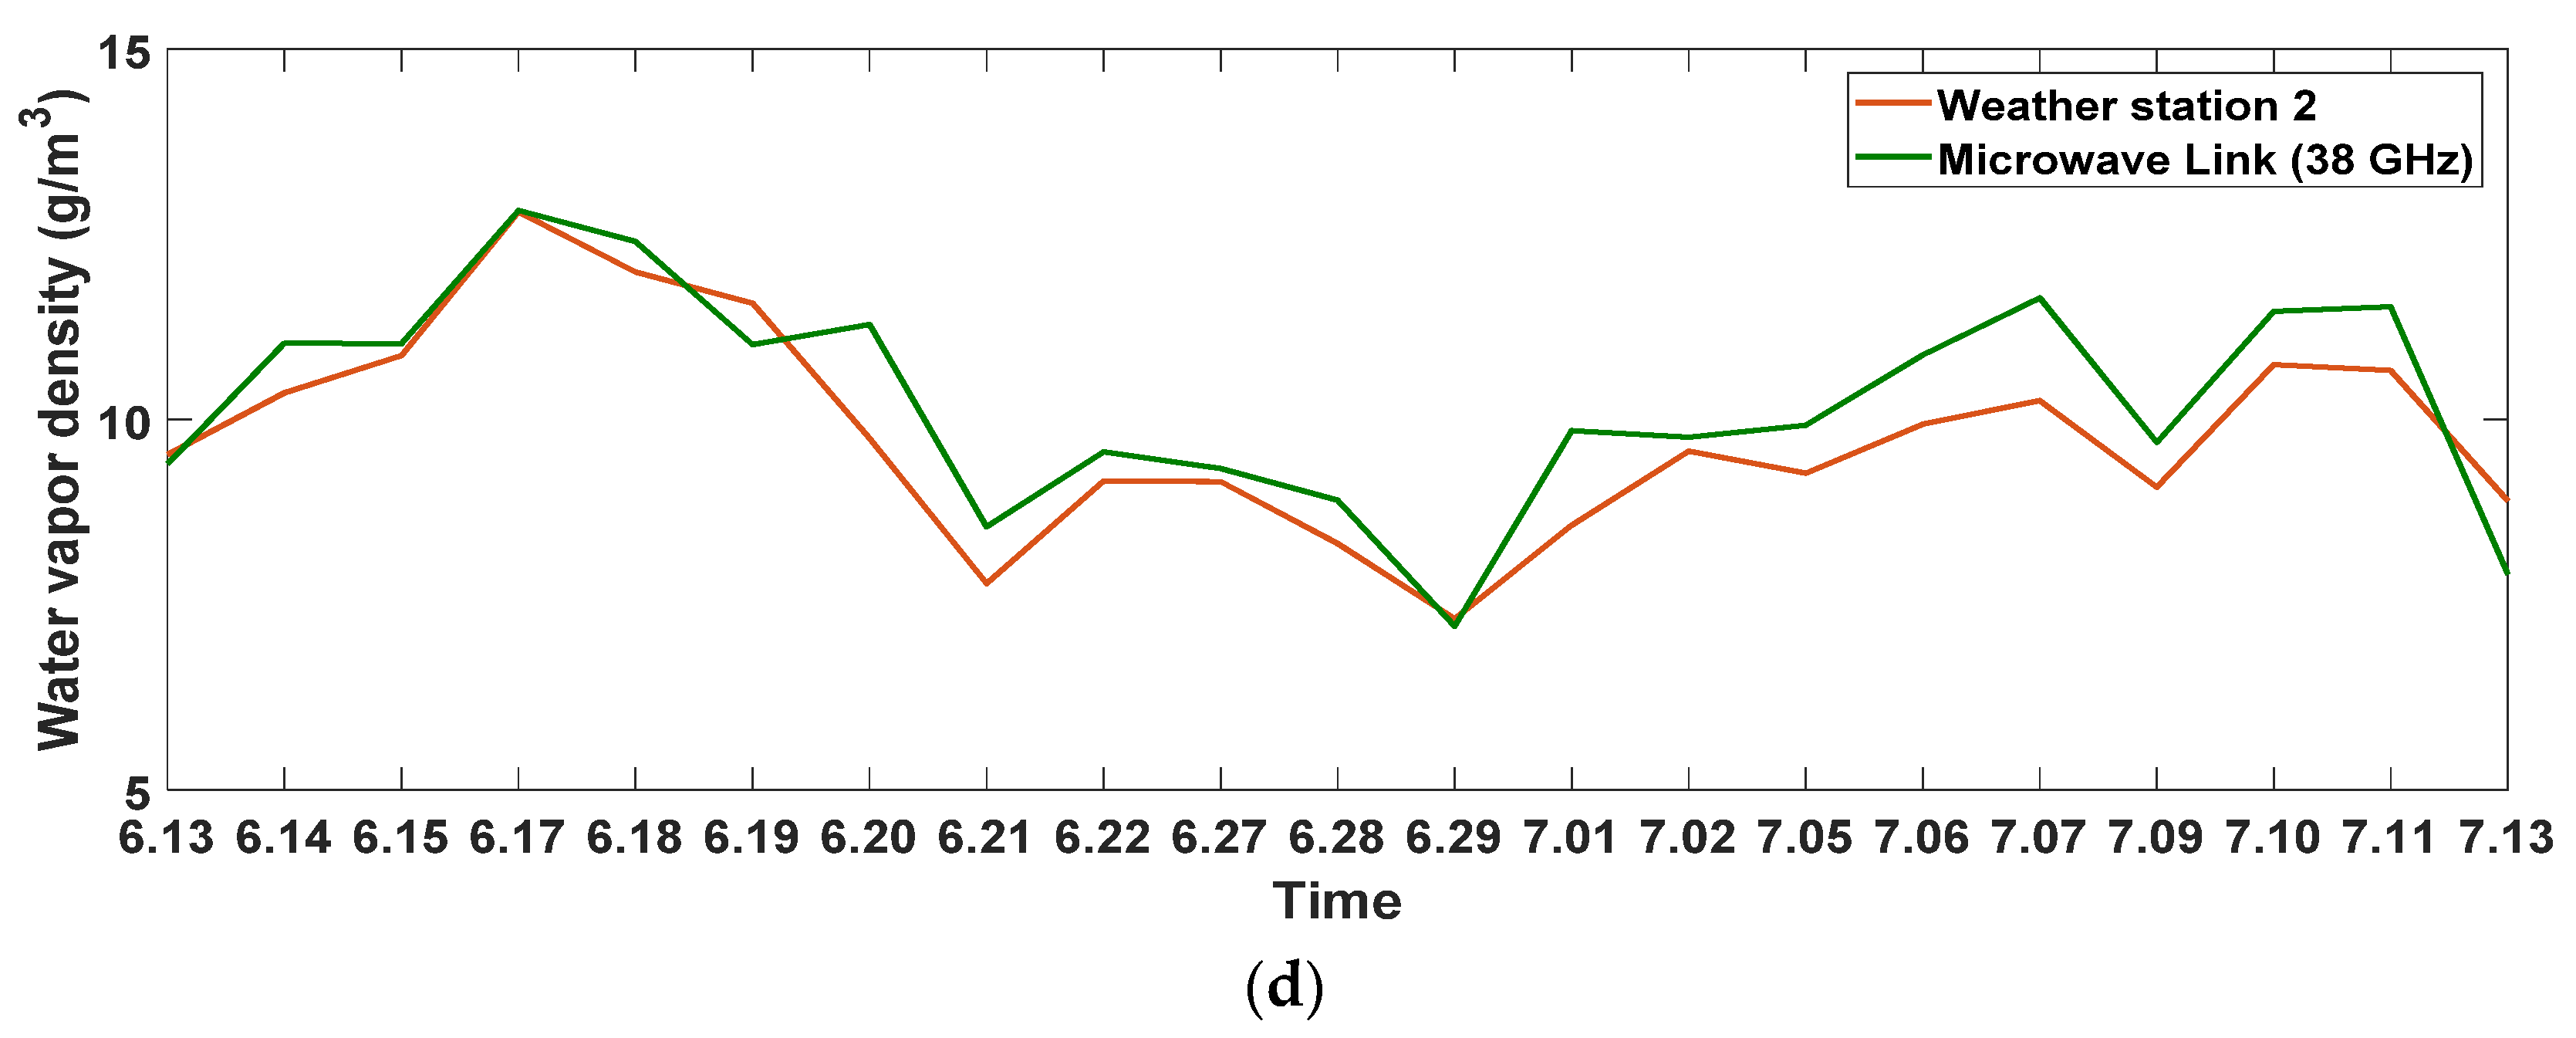
3. Results
4. Discussion
5. Conclusions
Author Contributions
Funding
Institutional Review Board Statement
Informed Consent Statement
Data Availability Statement
Acknowledgments
Conflicts of Interest
References
- Allan, R.P.; Shine, K.P.; Slingo, A.; Pamment, J.A. The dependence of clear-sky outgoing long-wave radiation on surface temperature and relative humidity. Q. J. R. Meteorol. Soc. 1999, 125, 2103–2126. [Google Scholar] [CrossRef]
- Benton, G.S.; Blackburn, R.T.; Snead, V.O. The role of the atmosphere in the hydrologic Cycle. Eos Trans. Am. Geophys. Union 1950, 31, 61–93. [Google Scholar] [CrossRef]
- Lennart, B. The global atmospheric water cycle. Environ. Res. Lett. 2010, 5, 1–8. [Google Scholar]
- Emanuel, K.; Raymond, D.; Betts, A.; Bosart, L.; Thorpe, A. Report of the first prospectus development team of the U.S. Weather Research Program to NOAA and the NSF. Bull. Am. Meteorol. Soc. 1995, 76, 1194–1208. [Google Scholar]
- Ducrocq, V.; Ricard, D.; Lafore, J.P.; Orain, F. Storm-scale numerical rainfall prediction for five precipitating events over France: On the importance of the initial humidity field. Weather. Forecast. 2002, 17, 1236–1256. [Google Scholar] [CrossRef]
- Soden, B.J.; Turner, D.D.; Lesht, B.M.; Miloshevich, L.M. An analysis of satellite, radiosonde, and lidar observations of upper tropospheric water vapour from the atmospheric radiation measurement program. J. Geophys. Res. Atmos. 2004, 109, 1–19. [Google Scholar] [CrossRef] [Green Version]
- Cady-Pereira, K.E.; Shephard, M.W.; Turner, D.D.; Mlawer, E.J.; Clough, S.A.; Wagner, T.J. Improved daytime column-integrated precipitable water vapor from Vaisala radiosonde humidity sensors. J. Atmos. Ocean. Technol. 2008, 25, 873–883. [Google Scholar] [CrossRef]
- Jedlovec, G.J. Precipitable water estimation from high-resolution split window radiance measurements. J. Appl. Meteorol. 1990, 29, 863–877. [Google Scholar] [CrossRef] [Green Version]
- Liljegren, J.C.; Clothiaux, E.E.; Mace, G.G.; Kato, S.; Dong, X. A new retrieval for cloud liquid water path using a ground-based microwave radiometer and measurements of cloud temperature. J. Geophys. Res. Atmos. 2001, 106, 14485–14500. [Google Scholar] [CrossRef]
- Chen, B.; Liu, Z. Global water vapor variability and trend from the latest 36 year (1979 to 2014) data of ECMWF and NCEP reanalysis, radiosonde, GPS, and microwave satellite. JGR Atmos. 2015, 121, 11442–11462. [Google Scholar]
- Messer, H.; Zinevich, A.; Alpert, P. Environmental monitoring by wireless communication networks. Science 2006, 312, 713. [Google Scholar] [CrossRef] [PubMed] [Green Version]
- Alpert, P.; Messer, H.; David, N. Mobile networks aid weather monitoring. Nature 2016, 537, 617. [Google Scholar] [CrossRef] [PubMed] [Green Version]
- Uijlenhoet, R.; Overeem, A.; Leijnse, H. Opportunistic remote sensing of rainfall using microwave links from cellular communication networks. Wiley Interdiscip. Rev. Water 2018, 5, e1289. [Google Scholar] [CrossRef] [Green Version]
- Han, C.; Duan, S. Impact of atmospheric parameters on the propagated signal power of millimeter-wave bands based on real measurement data. IEEE Access 2019, 7, 113626–113641. [Google Scholar] [CrossRef]
- David, N.; Alpert, P.; Messer, H. Novel method for water vapour monitoring using wireless communication networks measurements. Atmos. Chem. Phys. 2009, 9, 2413–2418. [Google Scholar] [CrossRef] [Green Version]
- Alpert, P.; Rubin, P. First daily mapping of surface moisture from cellular network data and comparison with both observations/ECMWF product. Geophys. Res. Lett. 2018, 45, 8619–8628. [Google Scholar] [CrossRef]
- Rubin, Y. A Novel Approach for High Resolution Humidity Mapping based on Cellular Network Data. Master’s Thesis, Tel Aviv University, Tel Aviv, Israel, 2018. [Google Scholar]
- Ericsson Mobility Report. 2018. Available online: https://www.ericsson.com/assets/local/microwave-outlook/documents/ericsson-microwave-outlook-report-2018.pdf (accessed on 4 August 2021).
- Taori, R.; Sridharan, A. Point-to-multipoint in-band mmwave backhaul for 5G networks. IEEE Commun. Mag. 2015, 53, 195–201. [Google Scholar] [CrossRef]
- Han, C.; Huo, J.; Gao, Q.; Su, G.; Wang, H. Rainfall monitoring based on next-generation millimeter-wave backhaul technologies in a dense urban environment. Remote Sens. 2020, 12, 1045. [Google Scholar] [CrossRef] [Green Version]
- Fencl, M.; Dohnal, M.; Valtr, P.; Grabner, M.; Bareš, V. Atmospheric observations with E-band microwave links—Challenges and opportunities. Atmos. Meas. Tech. 2020, 13, 6559–6578. [Google Scholar] [CrossRef]
- Rappaport, T.S.; Heath, R.W., Jr.; Daniels, R.C.; Murdock, J.N. Millimeter Wave Wireless Communications; Pearson/Prentice Hall: Hoboken, NJ, USA, 2015; pp. 99–110. [Google Scholar]
- Rappaport, T.S.; MacCartney, G.R., Jr.; Samimi, M.K.; Sun, S. Wideband millimeter-wave propagation measurements and channel models for future wireless communication system design. IEEE Trans. Commun. 2015, 63, 3029–3056. [Google Scholar] [CrossRef]
- International Telecommunication Union Radio Communication Bureau. ITU-R P. 676–12 (International Telecommunication Union Radio Communication Bureau Propagation Recommendation). Attenuation by Atmospheric Gases and Related Effects; International Telecommunication Union Radio Communication Bureau: Geneva, Switzerland, 14 August 2019. [Google Scholar]
- Liebe, H.J.; Hufford, G.A.; Cotton, M.G. Propagation modeling of moist air and suspended water/ice particles at frequencies below 1000 GHz. In Proceedings of the AGARD Conference Proceedings of Electromagnetic Wave Propagation Panel Symposium, Boulder, CO, USA, 17–20 May 1993. [Google Scholar]
- Liebe, H.J. An updated model for millimeter-wave propagation in moist air. Radio Sci. 1985, 20, 1069–1089. [Google Scholar] [CrossRef] [Green Version]
- Fencl, M.; Dohnal, M.; Bares, V. Retrieval water vapor from E-band microwave link with an empirical model not requiring in situ calibration. Earth Space Sci. 2021, 8, e2021EA001911. [Google Scholar] [CrossRef]
- Davis Wireless Vantage Pro2 Weather Station 6322. Available online: https://www.davisnet.com/weather-monitoring/ (accessed on 30 October 2021).
- SMHI. Available online: http://www.smhi.se/en/weather/sweden-weather/observations#ws=wpt-a,proxy=wpt-a,tab=vader,param=t (accessed on 30 August 2021).
- Tsidkiahu, D. Fog Classification based on Commercial Microwave Link Data. Master’s Thesis, Tel Aviv University, Tel Aviv, Israel, 2019. Available online: https://web2.eng.tau.ac.il/wtest/rainlinklab/wp-content/uploads/2020/08/Thesis_Tsidkiahu_David_after_examRS.pdf (accessed on 15 January 2022).
- Pu, K.; Liu, X.; Liu, L.; Gao, T. Water vapor retrieval using commercial microwave links based on the LSTM network. IEEE J. Sel. Top. Appl. Earth Obs. Remote Sens. 2021, 14, 4330–4338. [Google Scholar] [CrossRef]
- David, N.; Sendik, O.; Rubin, Y.; Messer, H.; Gao, H.O.; Rostkier-Edelstein, D.; Alpert, P. Analyzing the ability to reconstruct the moisture field using commercial microwave network data. Atmos. Res. 2019, 219, 213–222. [Google Scholar] [CrossRef]
- International Telecommunication Union Radio Communication Bureau. ITU-R P. 453–11 (International Telecommunication Union Radio Communication Bureau Propagation Recommendation). The Radio Refractive Index: Its Formula and Refractivity Data; International Telecommunication Union Radio Communication Bureau: Geneva, Switzerland, 29 July 2015. [Google Scholar]


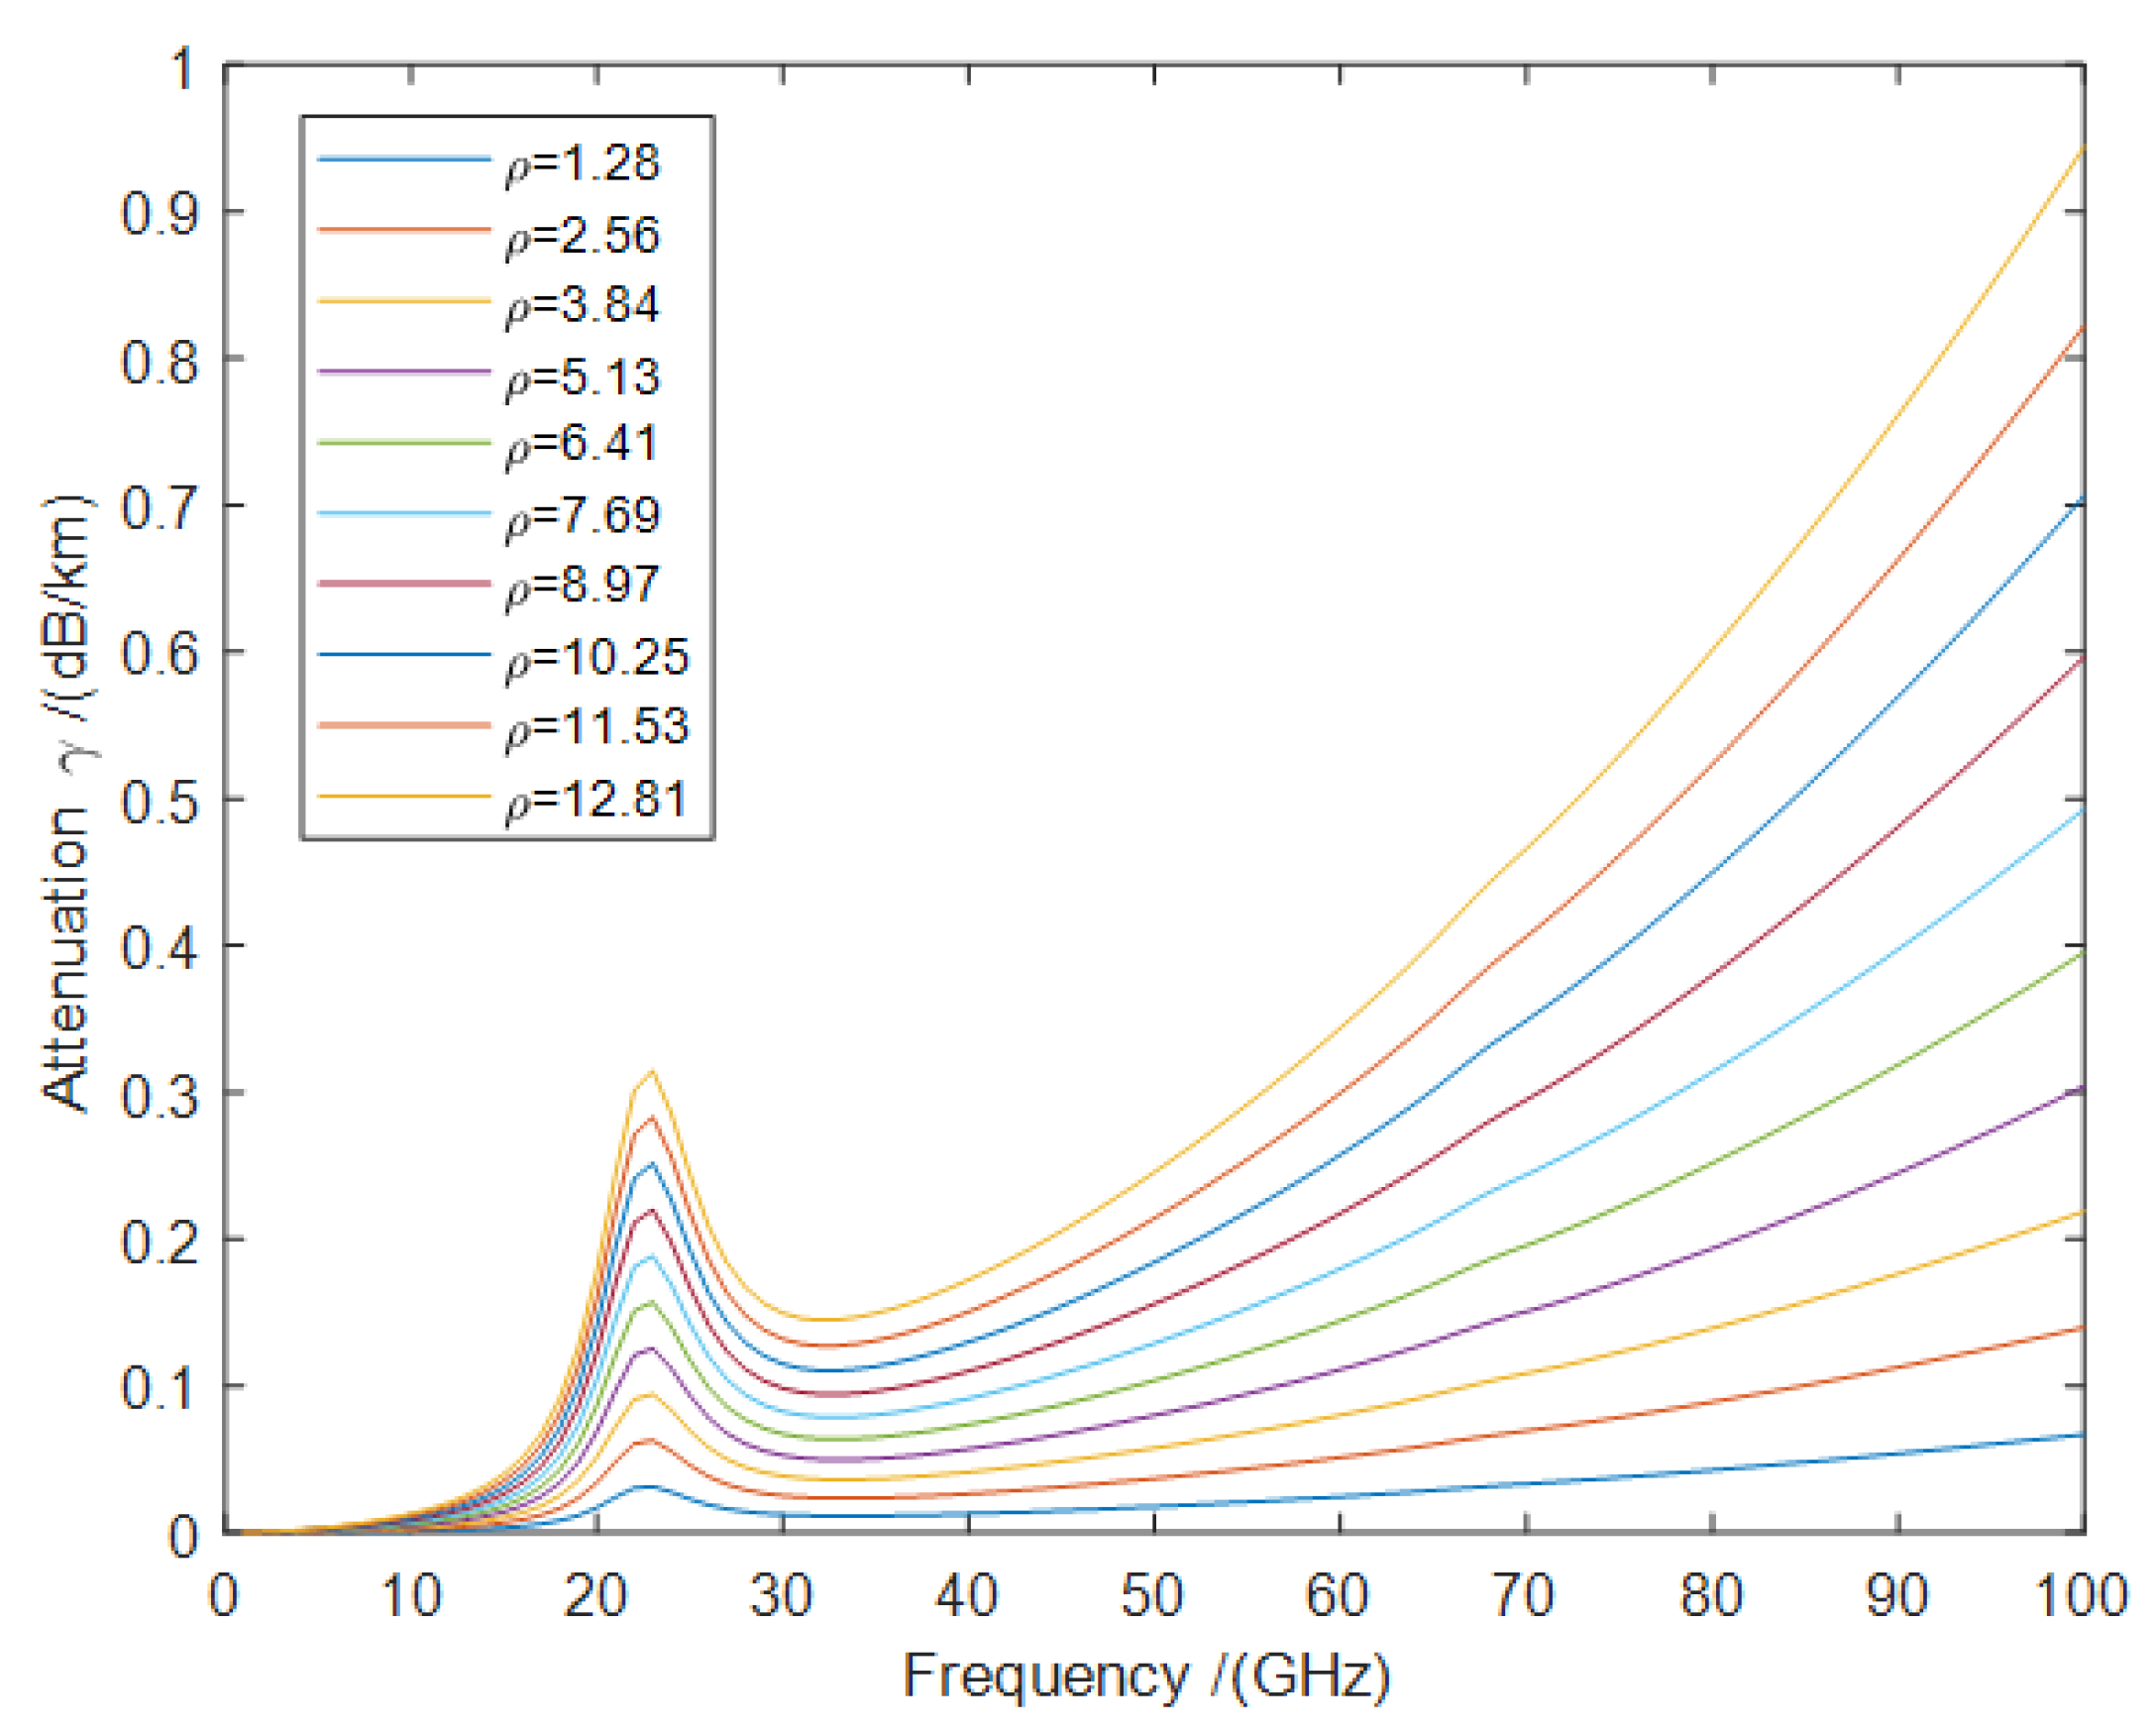
| Water Vapor Density/ Humidity | 1.28 | 2.56 | 3.84 | 5.13 | 6.41 | 7.69 | 8.97 | 10.25 | 11.53 | 11.53 | |
|---|---|---|---|---|---|---|---|---|---|---|---|
| Frequency | 10% | 20% | 30% | 40% | 50% | 60% | 70% | 80% | 90% | 100% | |
| 28 GHz | 0.014 | 0.030 | 0.045 | 0.061 | 0.078 | 0.095 | 0.113 | 0.131 | 0.150 | 0.169 | |
| 38 GHz | 0.013 | 0.026 | 0.040 | 0.055 | 0.072 | 0.089 | 0.107 | 0.125 | 0.145 | 0.166 | |
| 73 GHz | 0.037 | 0.078 | 0.122 | 0.169 | 0.219 | 0.273 | 0.329 | 0.390 | 0.453 | 0.519 | |
| 83 GHz | 0.048 | 0.100 | 0.156 | 0.217 | 0.281 | 0.350 | 0.424 | 0.501 | 0.582 | 0.668 | |
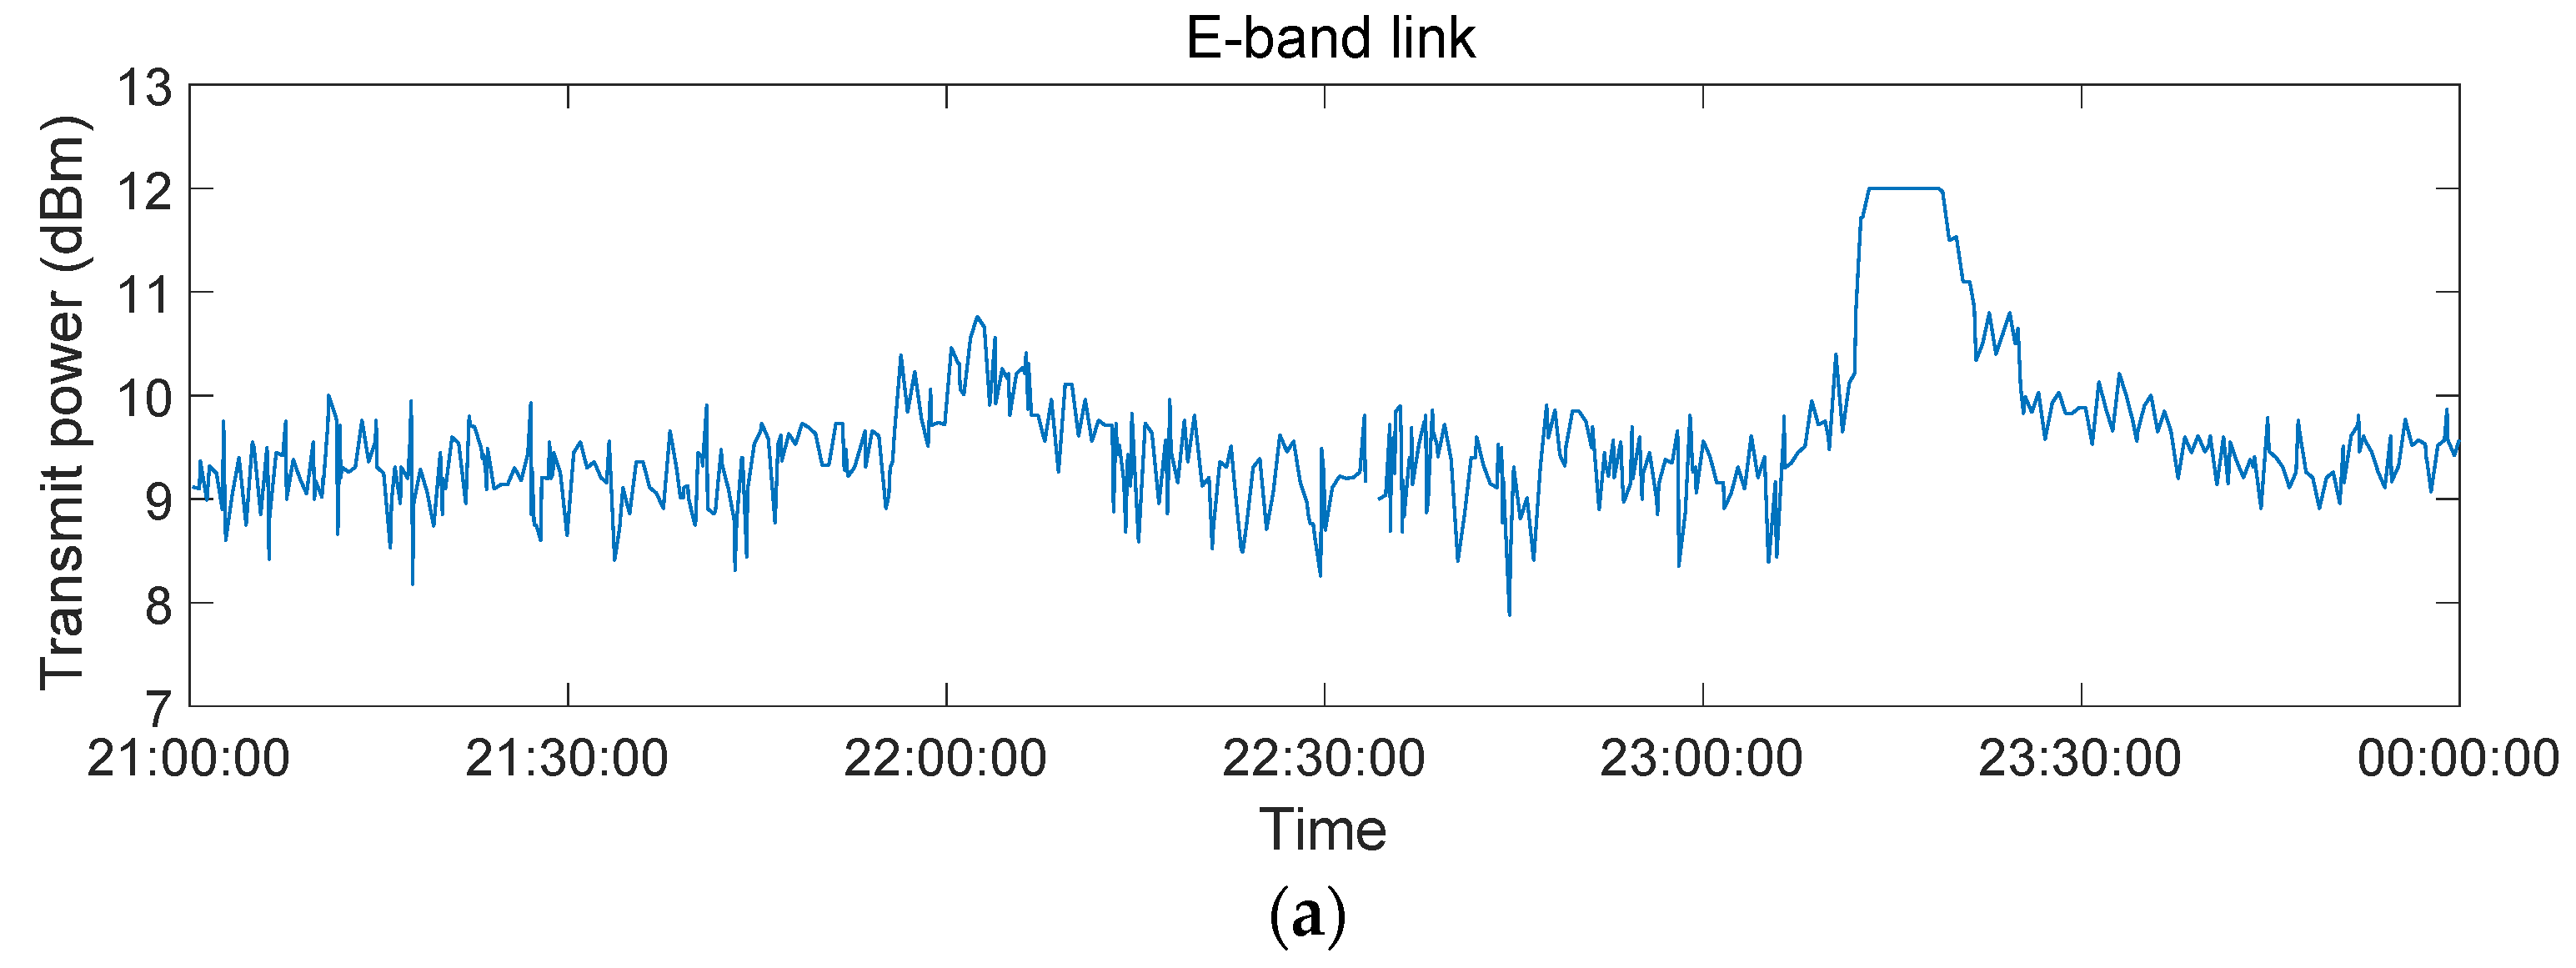
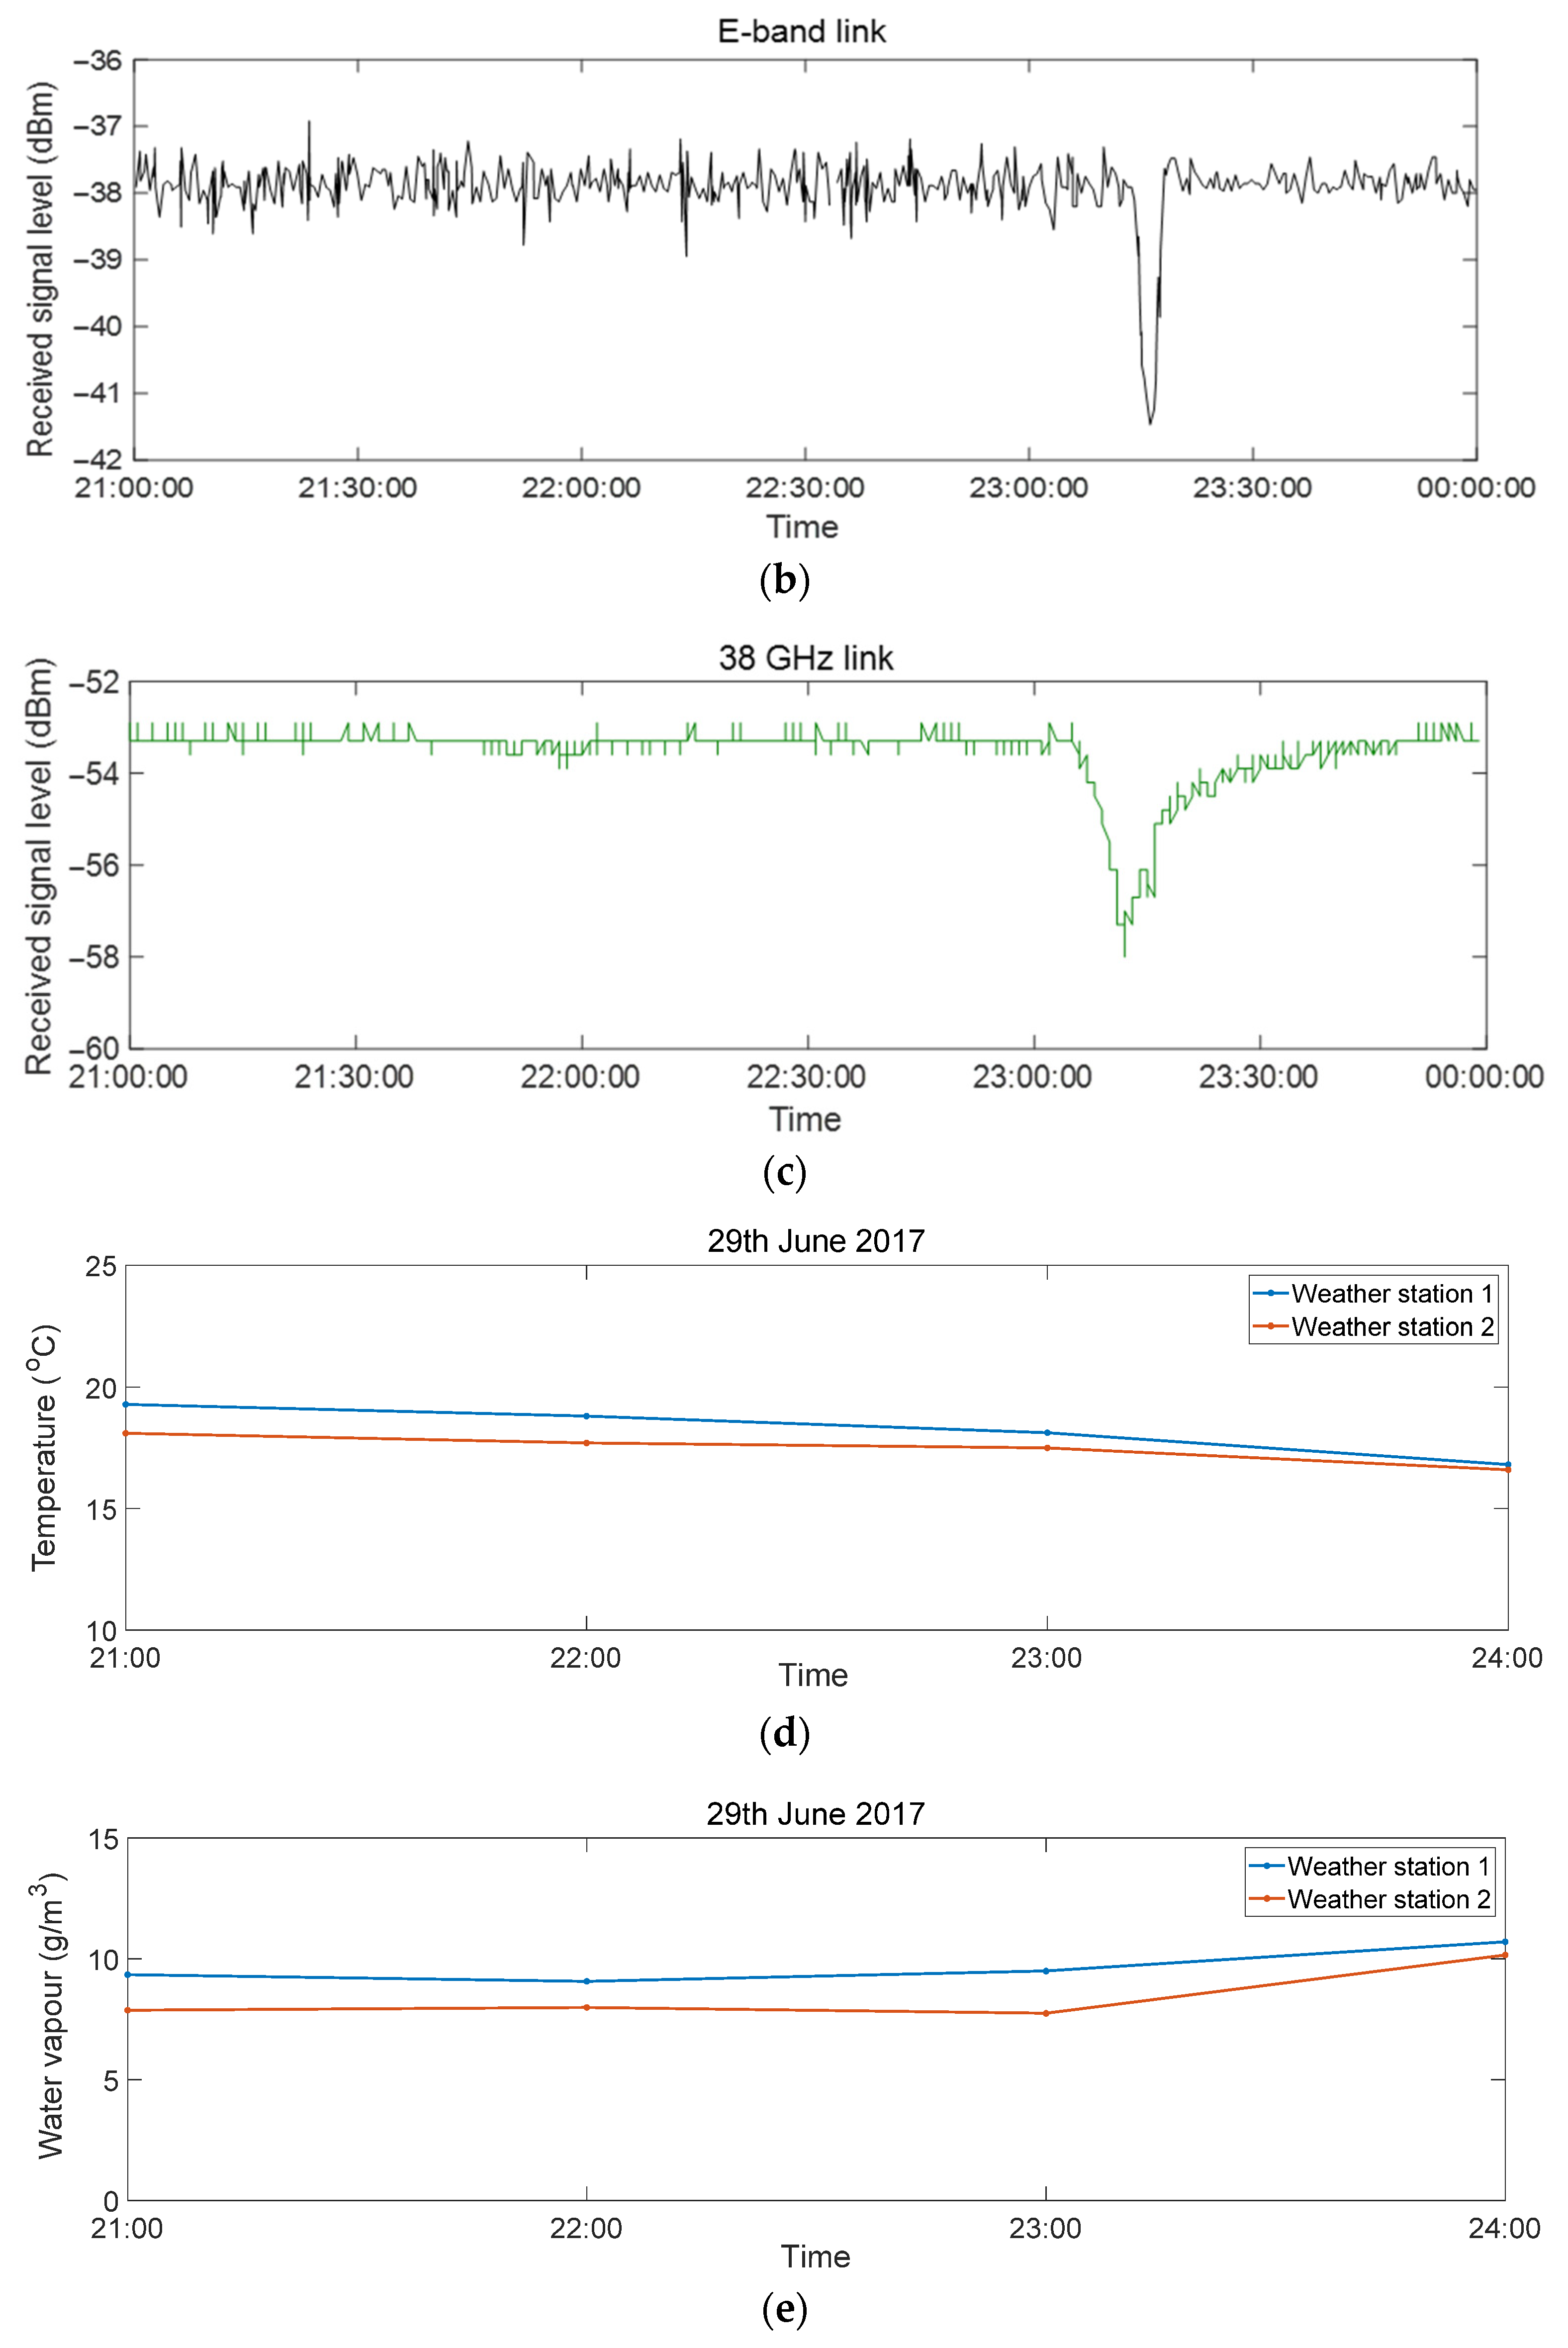
| Parameter | 38 GHz | E-band (73 GHz) |
|---|---|---|
| Sampling interval | 30 s | 30 s |
| Antenna type | Cassegrain antenna | Cassegrain antenna |
| Location | 57°42′18.97″N, 11°56′29.67″E; 57°44′52.8″N, 12°1′26.4″E | 57°42′18.97″N, 11°56′29.67″E; 57°41′20.04″N, 11°54′10.76″E |
| Link length | 6.87 km | 2.9 km |
| Setup | SISO | SISO |
| Antenna no. | 1 × 1 | 1 × 1 |
| Antenna diameter | 0.3 m | 0.6 m |
| Antenna separation | N/A | N/A |
| Transmitted power | 15 dBm | 7 dBm |
| Tx antenna gain | 40.3 dBi | 50.5 dBi |
| Tx half power beam width | 0.5° | 0.5° |
| Tx polarization | V | V |
| Rx antenna gain | 40.3 dBi | 50.5 dBi |
| Rx half power beam width | 0.5° | 0.5° |
| Rx polarization | V | V |
| Sensor Type | Resolution | Range | Accuracy |
|---|---|---|---|
| Humidity | 1% | 1–100% | 2% |
| Air pressure | 0.1 mb/hPa | 540 to 1100 mb/hPa | 1.0 mb/hPa |
| Temperature | 0.1 °C | −40 °C to +65 °C | 0.3 °C |
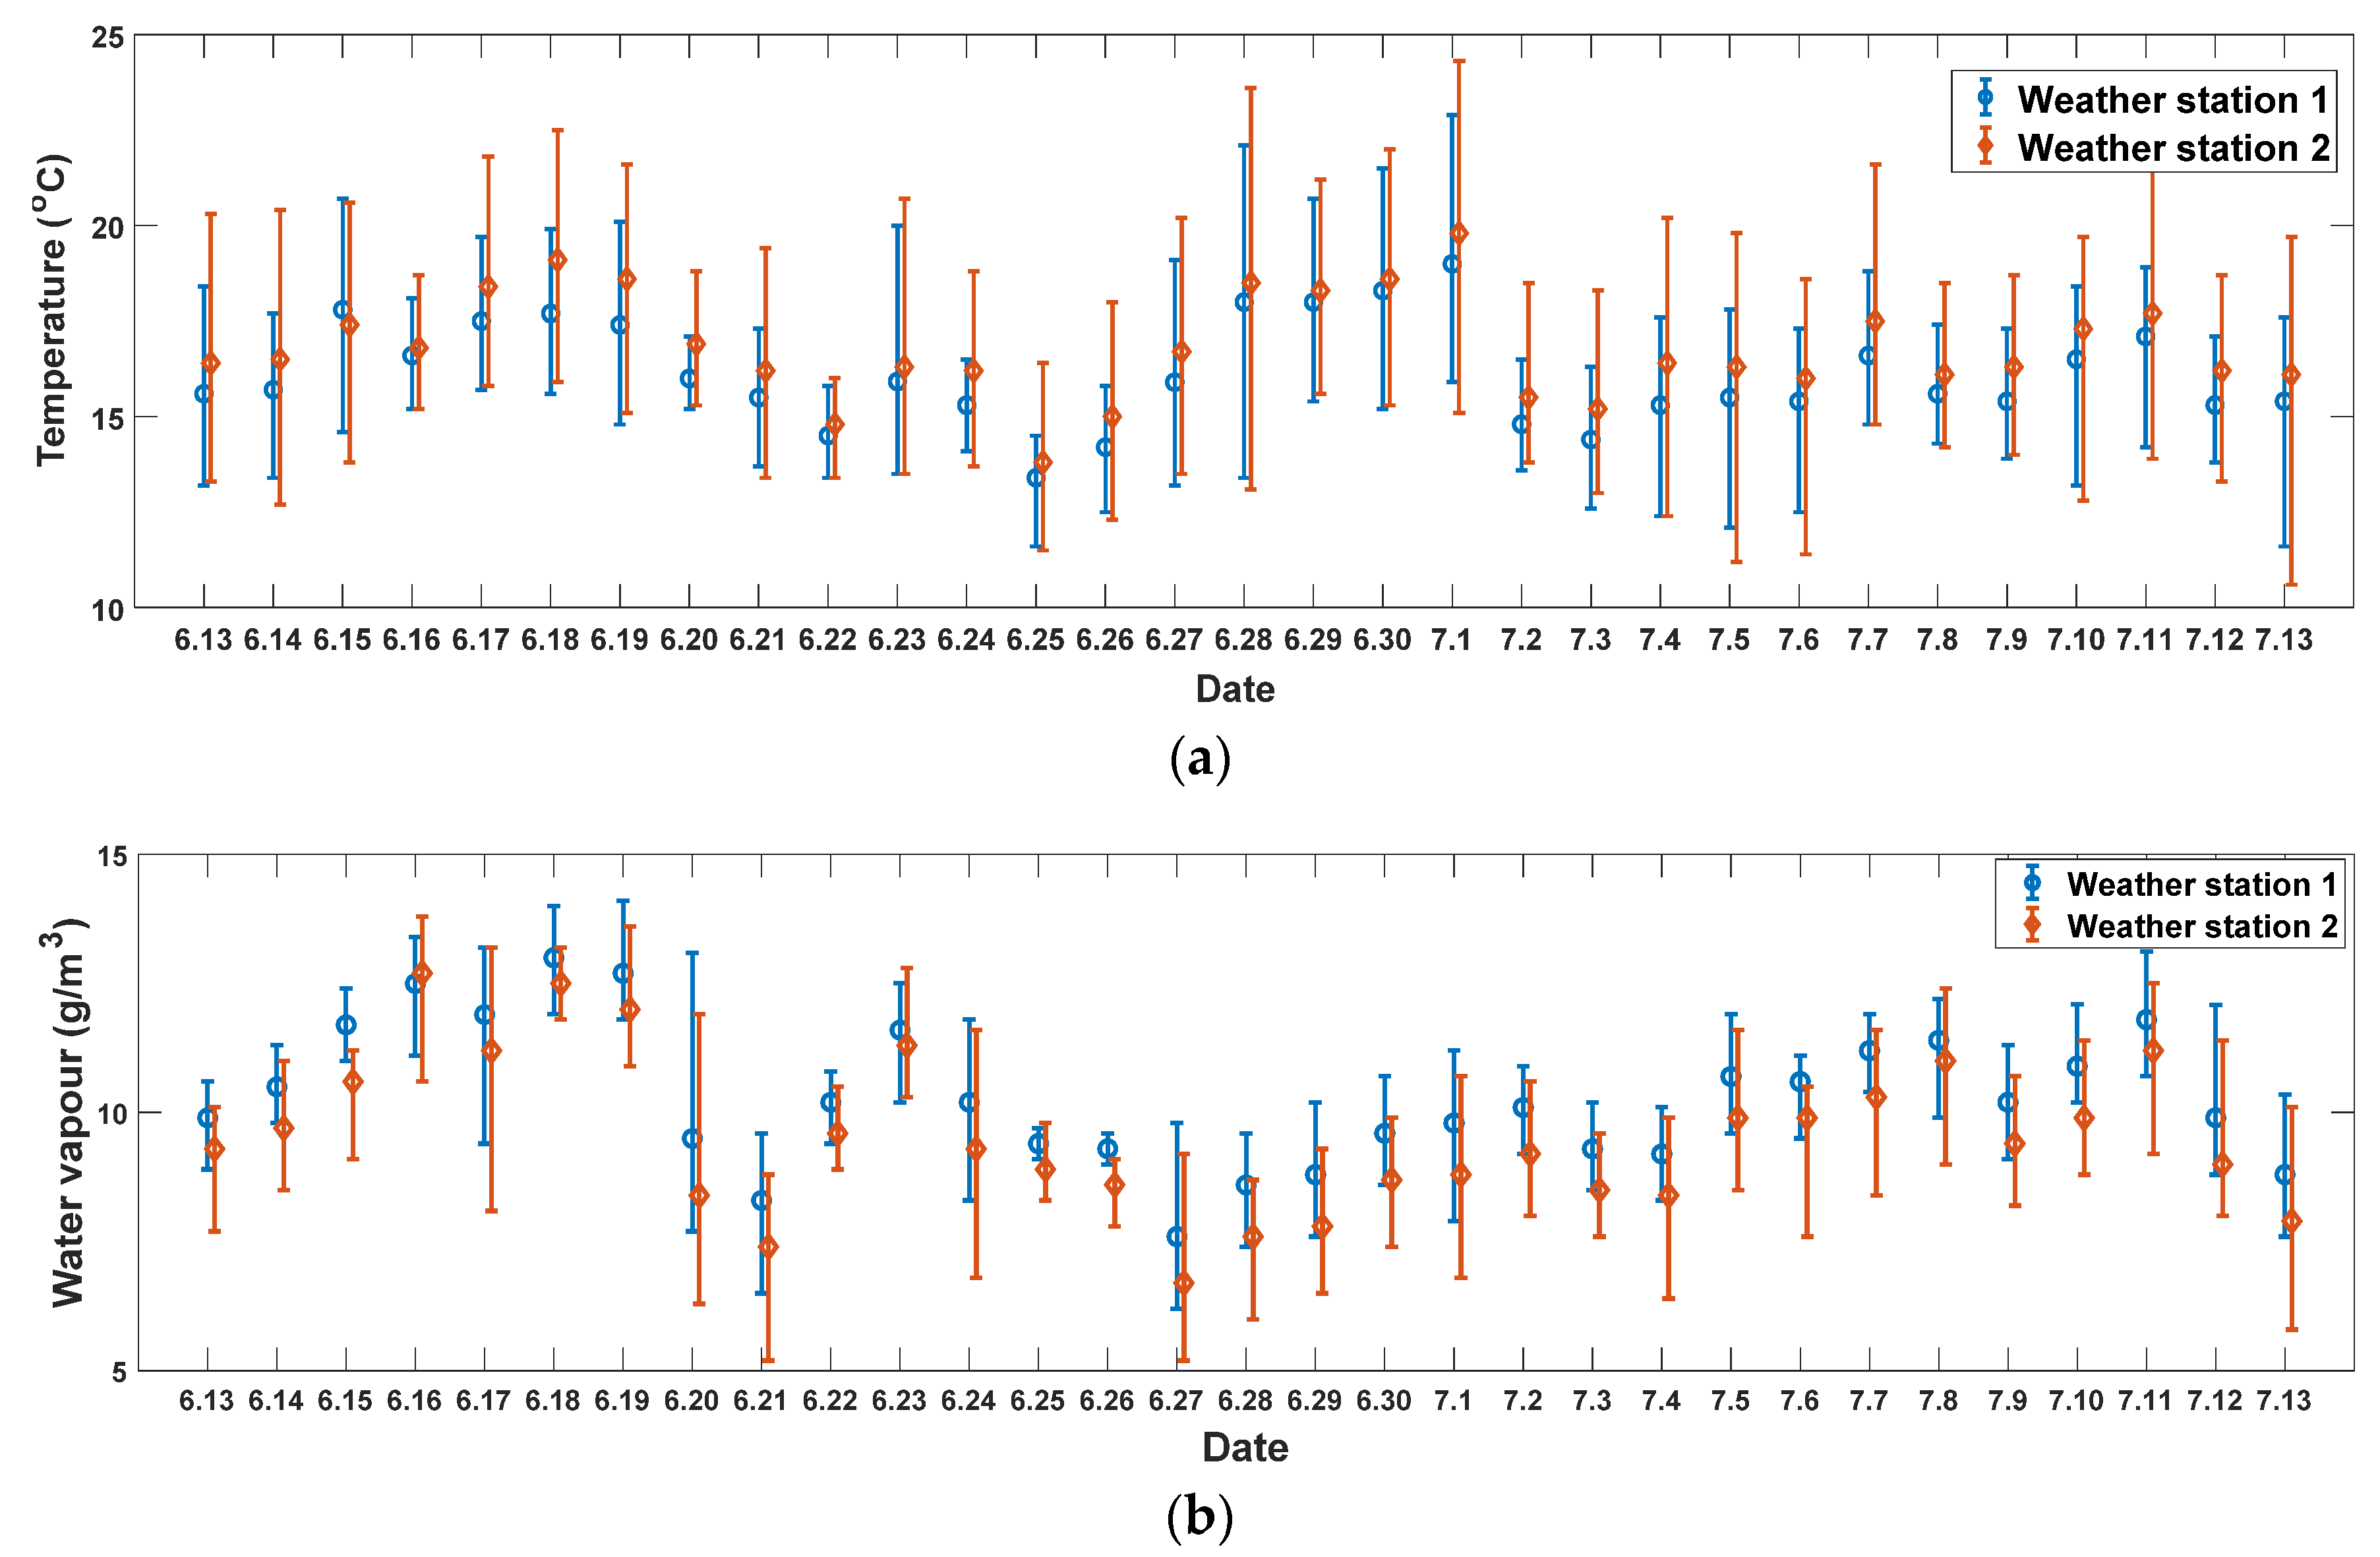
| Data Source 1 | Data Source 2 | Correlation | RMSD | BIAS |
|---|---|---|---|---|
| Weather station 1 | Weather station 2 | 0.88 | 1.15 | 0.82 |
| Weather station 1 | 38 GHz Link (24 h) | 0.83 | 0.99 | −0.04 |
| 38 GHz Link (5 a.m.) | 0.97 | 0.49 | 0.02 | |
| E-Band Link (24 h) | 0.61 | 1.71 | 0.04 | |
| E-Band Link (5 a.m.) | 0.91 | 0.72 | 0.18 | |
| Weather Station 2 | 38 GHz Link (24 h) | 0.74 | 1.48 | 0.78 |
| 38 GHz Link (5 a.m.) | 0.77 | 1.18 | 0.59 | |
| E-Band Link (24 h) | 0.54 | 2.08 | 0.86 | |
| E-Band Link (5 a.m.) | 0.67 | 1.48 | 0.74 |
| Data Source | Weather Station 1 and E-Band Link | Weather Station 2 and E-Band Link | ||||
|---|---|---|---|---|---|---|
| Time | Correlation | RMSD | BIAS | Correlation | RMSD | BIAS |
| 1:00 | 0.85 | 0.86 | −0.18 | 0.80 | 1.04 | 0.31 |
| 2:00 | 0.77 | 1.01 | −0.18 | 0.72 | 1.18 | 0.35 |
| 3:00 | 0.81 | 0.85 | −0.16 | 0.80 | 1.01 | 0.47 |
| 4:00 | 0.85 | 0.85 | −0.19 | 0.85 | 0.81 | 0.33 |
| 5:00 | 0.86 | 0.79 | −0.08 | 0.85 | 0.77 | 0.35 |
| 6:00 | 0.84 | 0.69 | 0.06 | 0.60 | 1.43 | 0.59 |
| 7:00 | 0.71 | 1.17 | 0.42 | 0.61 | 1.79 | 1.06 |
| 8:00 | 0.59 | 1.64 | 0.82 | 0.41 | 2.53 | 1.79 |
| 9:00 | 0.69 | 1.91 | 1.42 | 0.61 | 2.87 | 2.45 |
| 10:00 | 0.66 | 2.13 | 1.65 | 0.59 | 3.20 | 2.74 |
| 11:00 | 0.72 | 1.91 | 1.39 | 0.71 | 2.75 | 2.39 |
| 12:00 | 0.77 | 1.84 | 1.46 | 0.77 | 2.60 | 2.33 |
| 13:00 | 0.63 | 2.49 | 2.08 | 0.58 | 3.55 | 3.22 |
| 14:00 | 0.85 | 1.14 | 0.65 | 0.86 | 2.09 | 1.86 |
| 15:00 | 0.76 | 1.65 | −0.65 | 0.68 | 1.75 | 0.36 |
| 16:00 | 0.78 | 1.97 | −1.37 | 0.78 | 1.41 | −0.11 |
| 17:00 | 0.67 | 2.53 | −1.83 | 0.59 | 2.04 | −0.73 |
| 18:00 | 0.57 | 2.67 | −1.79 | 0.38 | 2.53 | −0.76 |
| 19:00 | 0.63 | 2.50 | −1.64 | 0.49 | 2.31 | −0.70 |
| 20:00 | 0.67 | 1.78 | −0.66 | 0.56 | 1.90 | −0.02 |
| 21:00 | 0.66 | 1.61 | −0.20 | 0.52 | 1.98 | 0.50 |
| 22:00 | 0.69 | 1.56 | 0.09 | 0.65 | 1.82 | 0.73 |
| 23:00 | 0.57 | 1.78 | −0.15 | 0.57 | 1.85 | 0.47 |
| 24:00 | 0.77 | 1.30 | 0.05 | 0.66 | 1.70 | 0.73 |
Publisher’s Note: MDPI stays neutral with regard to jurisdictional claims in published maps and institutional affiliations. |
© 2022 by the authors. Licensee MDPI, Basel, Switzerland. This article is an open access article distributed under the terms and conditions of the Creative Commons Attribution (CC BY) license (https://creativecommons.org/licenses/by/4.0/).
Share and Cite
Han, C.; Su, G.; Bao, L.; Messer, H. Water Vapor Density Retrieval Studies Using Commercial Millimeter-Wave Links at 38 GHz and E-Band. Remote Sens. 2022, 14, 946. https://doi.org/10.3390/rs14040946
Han C, Su G, Bao L, Messer H. Water Vapor Density Retrieval Studies Using Commercial Millimeter-Wave Links at 38 GHz and E-Band. Remote Sensing. 2022; 14(4):946. https://doi.org/10.3390/rs14040946
Chicago/Turabian StyleHan, Congzheng, Guiyang Su, Lei Bao, and Hagit Messer. 2022. "Water Vapor Density Retrieval Studies Using Commercial Millimeter-Wave Links at 38 GHz and E-Band" Remote Sensing 14, no. 4: 946. https://doi.org/10.3390/rs14040946
APA StyleHan, C., Su, G., Bao, L., & Messer, H. (2022). Water Vapor Density Retrieval Studies Using Commercial Millimeter-Wave Links at 38 GHz and E-Band. Remote Sensing, 14(4), 946. https://doi.org/10.3390/rs14040946