Article

Remotely Sensed Winter Habitat Indices Improve the Explanation of Broad-Scale Patterns of Mammal and Bird Species Richness in China

Shandong Provincial Key Laboratory of Water and Soil Conservation and Environmental Protection, College of Resources and Environment, Linyi University, Linyi 276000, China
*
Author to whom correspondence should be addressed.
Remote Sens. 2022, 14(3), 794; https://doi.org/10.3390/rs14030794
Submission received: 28 December 2021 / Revised: 24 January 2022 / Accepted: 4 February 2022 / Published: 8 February 2022
(This article belongs to the Special Issue Remote Sensing of Ecosystems in Cold Regions)

Abstract

:
Climate change is transforming winter environmental conditions rapidly. Shifts in snow regimes and freeze/thaw cycles that are unique to the harsh winter season can strongly influence ecological processes and biodiversity patterns of mammals and birds. However, the role of the winter environment in structuring a species richness pattern is generally downplayed, especially in temperate regions. Here we developed a suite of winter habitat indices at 500 m spatial resolution by fusing MODIS snow products and NASA MEaSUREs daily freeze/thaw records from passive microwave sensors and tested how these indices could improve the explanation of species richness patterns across China. We found that the winter habitat indices provided unique and mutually complementary environmental information compared to the commonly used Dynamic Habitat Indices (DHIs). Winter habitat indices significantly increased the explanatory power for species richness of all mammal and bird groups. Particularly, winter habitat indices contributed more to the explanation of bird species than mammals. Regarding the independent contribution, winter season length made the largest contributions to the explained variance of winter birds (30%), resident birds (27%), and mammals (18%), while the frequency of snow-free frozen ground contributed the most to the explanation of species richness for summer birds (23%). Our research provides new insights into the interpretation of broad-scale species diversity, which has great implications for biodiversity assessment and conservation.

1. Introduction

Human activities and climate changes have triggered the sixth major extinction event over the last few centuries [1,2], which alters ecological processes and undermines the resilience of ecosystems and further threatens ecosystem services and human wellbeing [3,4]. Halting biodiversity loss has been recognized as one important goal of many global initiatives and policies (e.g., the United Nations Sustainable Development Goals) [5]. To fulfil the targets, there is an indispensable need to gauge the status and trends of biodiversity in a form that is timely, global, scientifically rigorous and representative of species populations across taxa [5].
Species richness is a fundamental and commonly characterized facet of biodiversity, and understanding how environment structures the pattern of species richness has been the research focus of macro-ecology and biogeography and is helpful for informing conservation plans [6,7,8,9]. Various methods are proposed to explain and map the spatial variations of species richness at different spatial scales [7,8,10], in which reanalysis data and remote sensing products provide valuable information about climate variability [11,12], productivity [10,13], ambient energy (e.g., potential evapotranspiration) [11,14], habitat heterogeneity [15,16], etc. For climate, the WorldClim dataset, which consists of 19 bioclimatic variables [17], has been a systematic and widely used source to build species distribution models and map species richness. The extensive applications suggest that the WorldClim dataset can well capture the water-energy dynamics relevant to habitat and display a high prediction power of species richness [18]. These merits make WorldClim data a perfect reference to gauge environmental information within remote sensing–based indices, although they are biased at some regions due to the lack of weather stations for interpolation [8,19]. In contrast, remote sensing is the most cost-effective and comprehensive approach to retrieve climate, water and energy-relevant variables of the Earth’s surface [6,15,20] and offers the opportunity for broad-scale characterizations of species richness in a systematic, repeatable, and spatially exhaustive manner [21,22]. Although many indicators have been developed with remote sensing data, the essential variables for explaining and mapping species richness are still not fully considered, e.g., variables for cryospheric properties [19,22]. With increasingly available remote sensing collections and more dialogues between remote sensing and ecology, characterizing species richness with remote sensing observations is promising, but great efforts should be made to develop and test remote sensing–based variables.
Hypothesis tests suggest that the factors that shape and maintain species diversity are generally classified into four categories: productivity/energy, climate, habitat heterogeneity and evolution history [23]. Factors of different kinds can be correlated, and their explanatory power varies with the scales used. For example, both vegetation productivity and climatic variables (i.e., PET and AET) can measure energy and its seasonality, and both strongly support species-energy hypotheses [8]. Given that the positive productivity-species-richness relationships are the most common form to structure broad-scale species diversity in most terrestrial and aquatic ecosystems [10], the Dynamic Habitat Indices (DHIs) have been developed with remotely sensed vegetation productivity, such as NDVI, FPAR, and GPP [8,20,24]. The DHIs are measures of vegetation productivity over the course of a year and consist of three components: (1) cumulative annual productivity (‘cumDHI’ hereafter), (2) annual minimum productivity (‘minDHI’) and (3) seasonal variation in productivity (‘varDHI’). The DHIs have proven to be strong predictors of species richness in Canada [13], the US [20], Thailand [25], China [6,26], and across the globe [8,24] and well support the three key hypotheses in biodiversity science: the species-energy hypothesis, the environmental stress hypothesis, and the environmental stability hypothesis. Although the DHIs are integrated indices that comprehensively capture environmental information over a year, it is still unknown whether they can represent harsh winter conditions, as snow cover and freeze/thaw cycles have complicated effects on species, especially at mid- to high- latitudes [27,28,29,30,31].
Snow regimes and ground freeze/thaw cycles, which are unique to winter season, can regulate climate, soil water-heat dynamics, and biogeochemical cycling and can further influence individual species and the interactions among species that structure species diversity [28,29,31]. Snowpack provides a physically sheltered and thermally stable overwinter refuge for snow-dependent organisms, and the declines in snowpack may expose these organisms to extremely lower air temperatures than those within subnivean space [30,31,32]. Snow cover duration is an important feature of winter, whose influence extends to the growing season [28,33]. Beyond snow, ground freeze/thaw dynamics (i.e., freeze/thaw transitions, frozen season length) can directly impact animals, plants, and microbes, altering ecosystem carbon and nutrition cycling [27]. For example, the frequency of freeze/thaw events drives overwinter carbohydrate consumption of freeze-tolerant wood frogs, Rana sylvatica [34]; climate-induced freeze/thaw cycling may cause an increased frost injury of roots and shoots, increased insect pest risk, or phenological mismatch [27]. The above influences of winter environmental conditions on ecological processes and individual species further interact to structure species richness [35,36,37]. For example, snow depth negatively impacts the species richness of all groups of wintering forest birds in Japan [36]. Species richness of North American amphibian communities is most sensitive to winter environmental conditions, which is characterized by a generally negative correlation with winter temperatures and a positive correlation with snowfall [37]. The declined snow cover duration tempers the positive effect of increasing temperature on species richness in the Arctic and leads to accelerated rates of species’ local extinctions [35]. However, the effects of winter environmental conditions on species richness are still underrepresented compared to the importance that has been attached to the growing season.
Biodiversity in China is much higher than in any other country covering similar latitudes, and South-Central China is one of 25 biodiversity hotspots of the globe [38]. Multiple stressors, especially climate and human activities, threaten high proportions of amphibians, mammals, and reptiles [39]. Therefore, it is of special importance to identify suitable environmental conditions that foster species richness in China, which is helpful for setting conservation policies and achieving the targets of global initiatives and SDGs. Satellite remote sensing is well suited to retrieve ground snow cover and freeze/thaw status at high spatial and temporal resolutions and provides valuable information to characterize winter environmental conditions for biodiversity research [32,40,41]. Given this, our research aims to test how remotely sensed winter habitat indices contribute to the explanation of species richness across China. To achieve this goal, we addressed the following research questions: (1) What kinds of environmental information that fosters species richness do remotely sensed winter habitat indices represent, with the WorldClim bioclimatic variables as the benchmark? (2) Can winter habitat indices improve the explanatory power for species richness? (3) Are there any differences in the effects of winter habitat indices among different groups? We organized the results section as follows to address our proposed research questions. First, we present the spatial patterns of mammal and bird species richness and winter habitat indices in Section 3.1 and Section 3.2. Section 3.3 describes the relationships between winter habitat indices and bioclimatic variables to answer question (1). Section 3.4 shows the correlations between winter habitat indices and DHIs as well as the statistical relationships between winter habitat indices and species richness to answer questions (2) and (3).

2. Materials and Methods
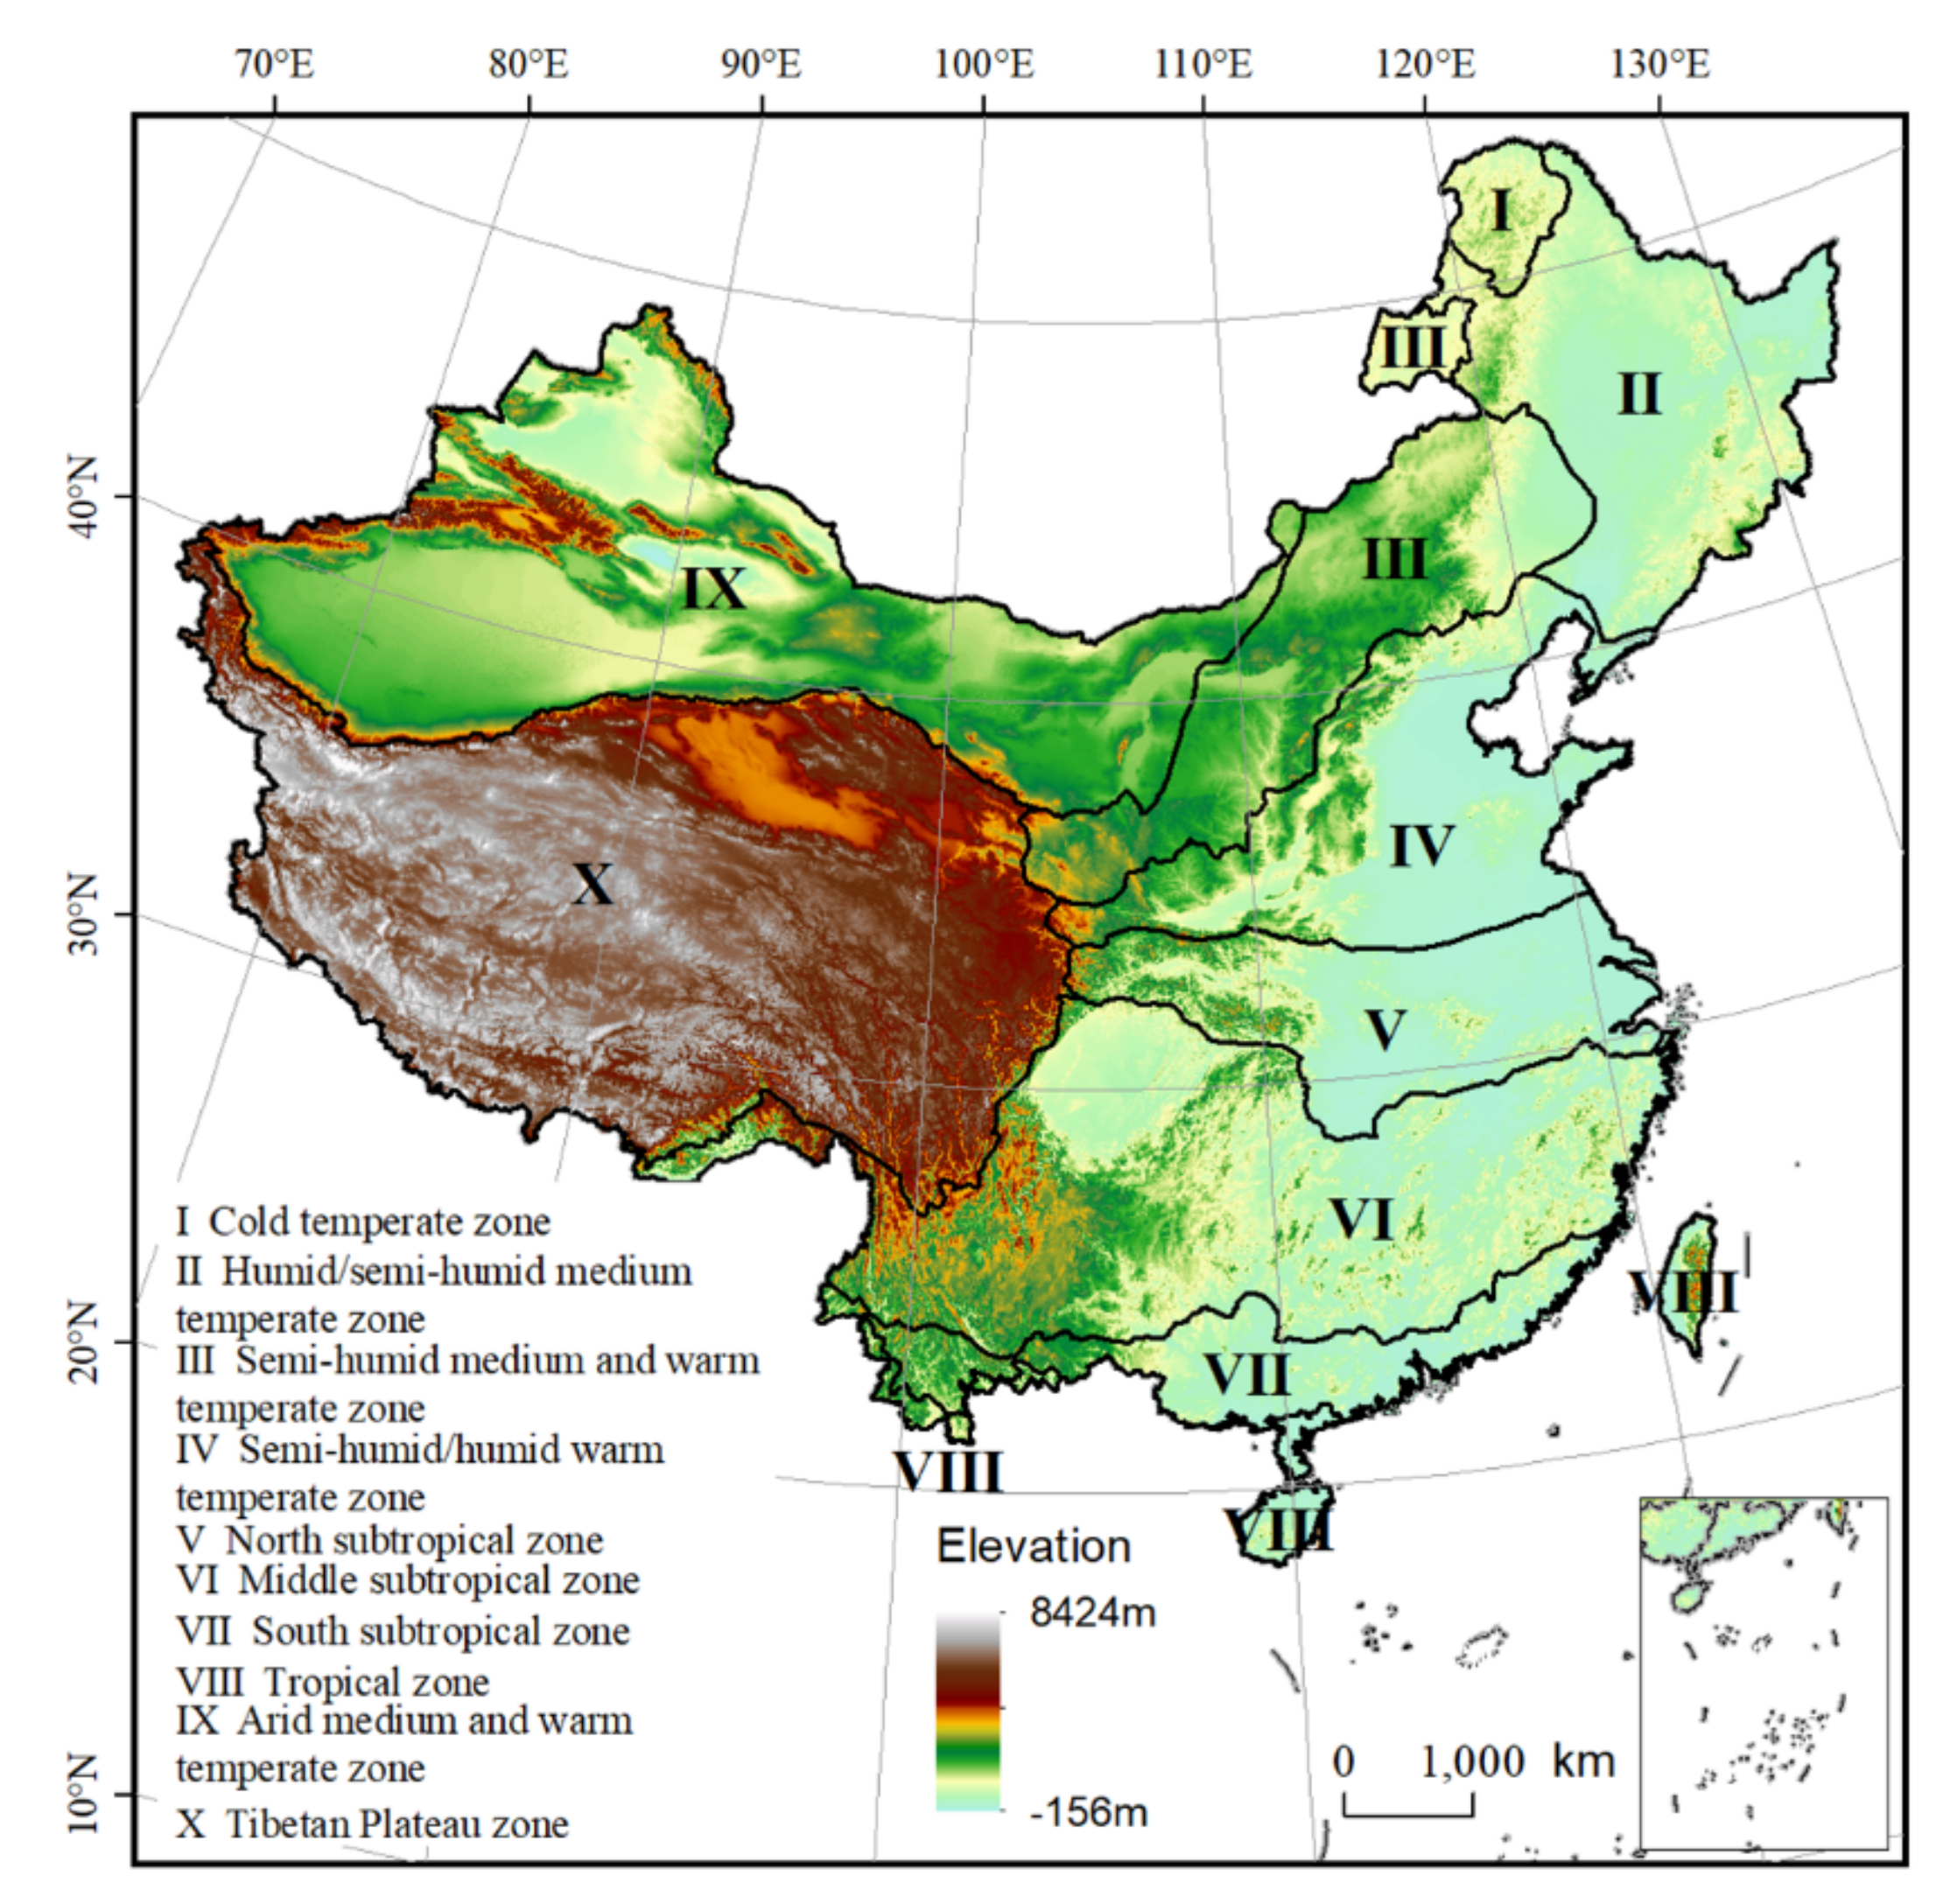
2.1. Study Area

We took China as the study area, which is located in East Asia. The topography in our study area is characterized by a “ladder-shaped” pattern (Figure 1). The elevation is highest on the Tibetan Plateau in the west, with an average value of more than 4000 m, and decreases eastwards, with an average value less than 500 m at the eastern coast. There are diverse landforms in China, with mountains, plateaus, and hills accounting for about 67%, and basins and plains accounting for about 33%. The large area and complex topography and landforms diversify the climate in our study area. From the south to the north, the climate changes from tropical to cold temperate, and from the east to west, the climate changes from monsoon to continental. Based on the differentiation of multiple natural features, such as temperature, humidity, geomorphology, vegetation type, etc., various eco-geographical zones have been created, which are important for ecological conservation and environmental management (Figure 1) [42]. Due to the diverse environmental conditions, China harbors over 35,000 higher plant species, over 2700 terrestrial vertebrate species, and over 28,000 marine species, and a large proportion are endemic.

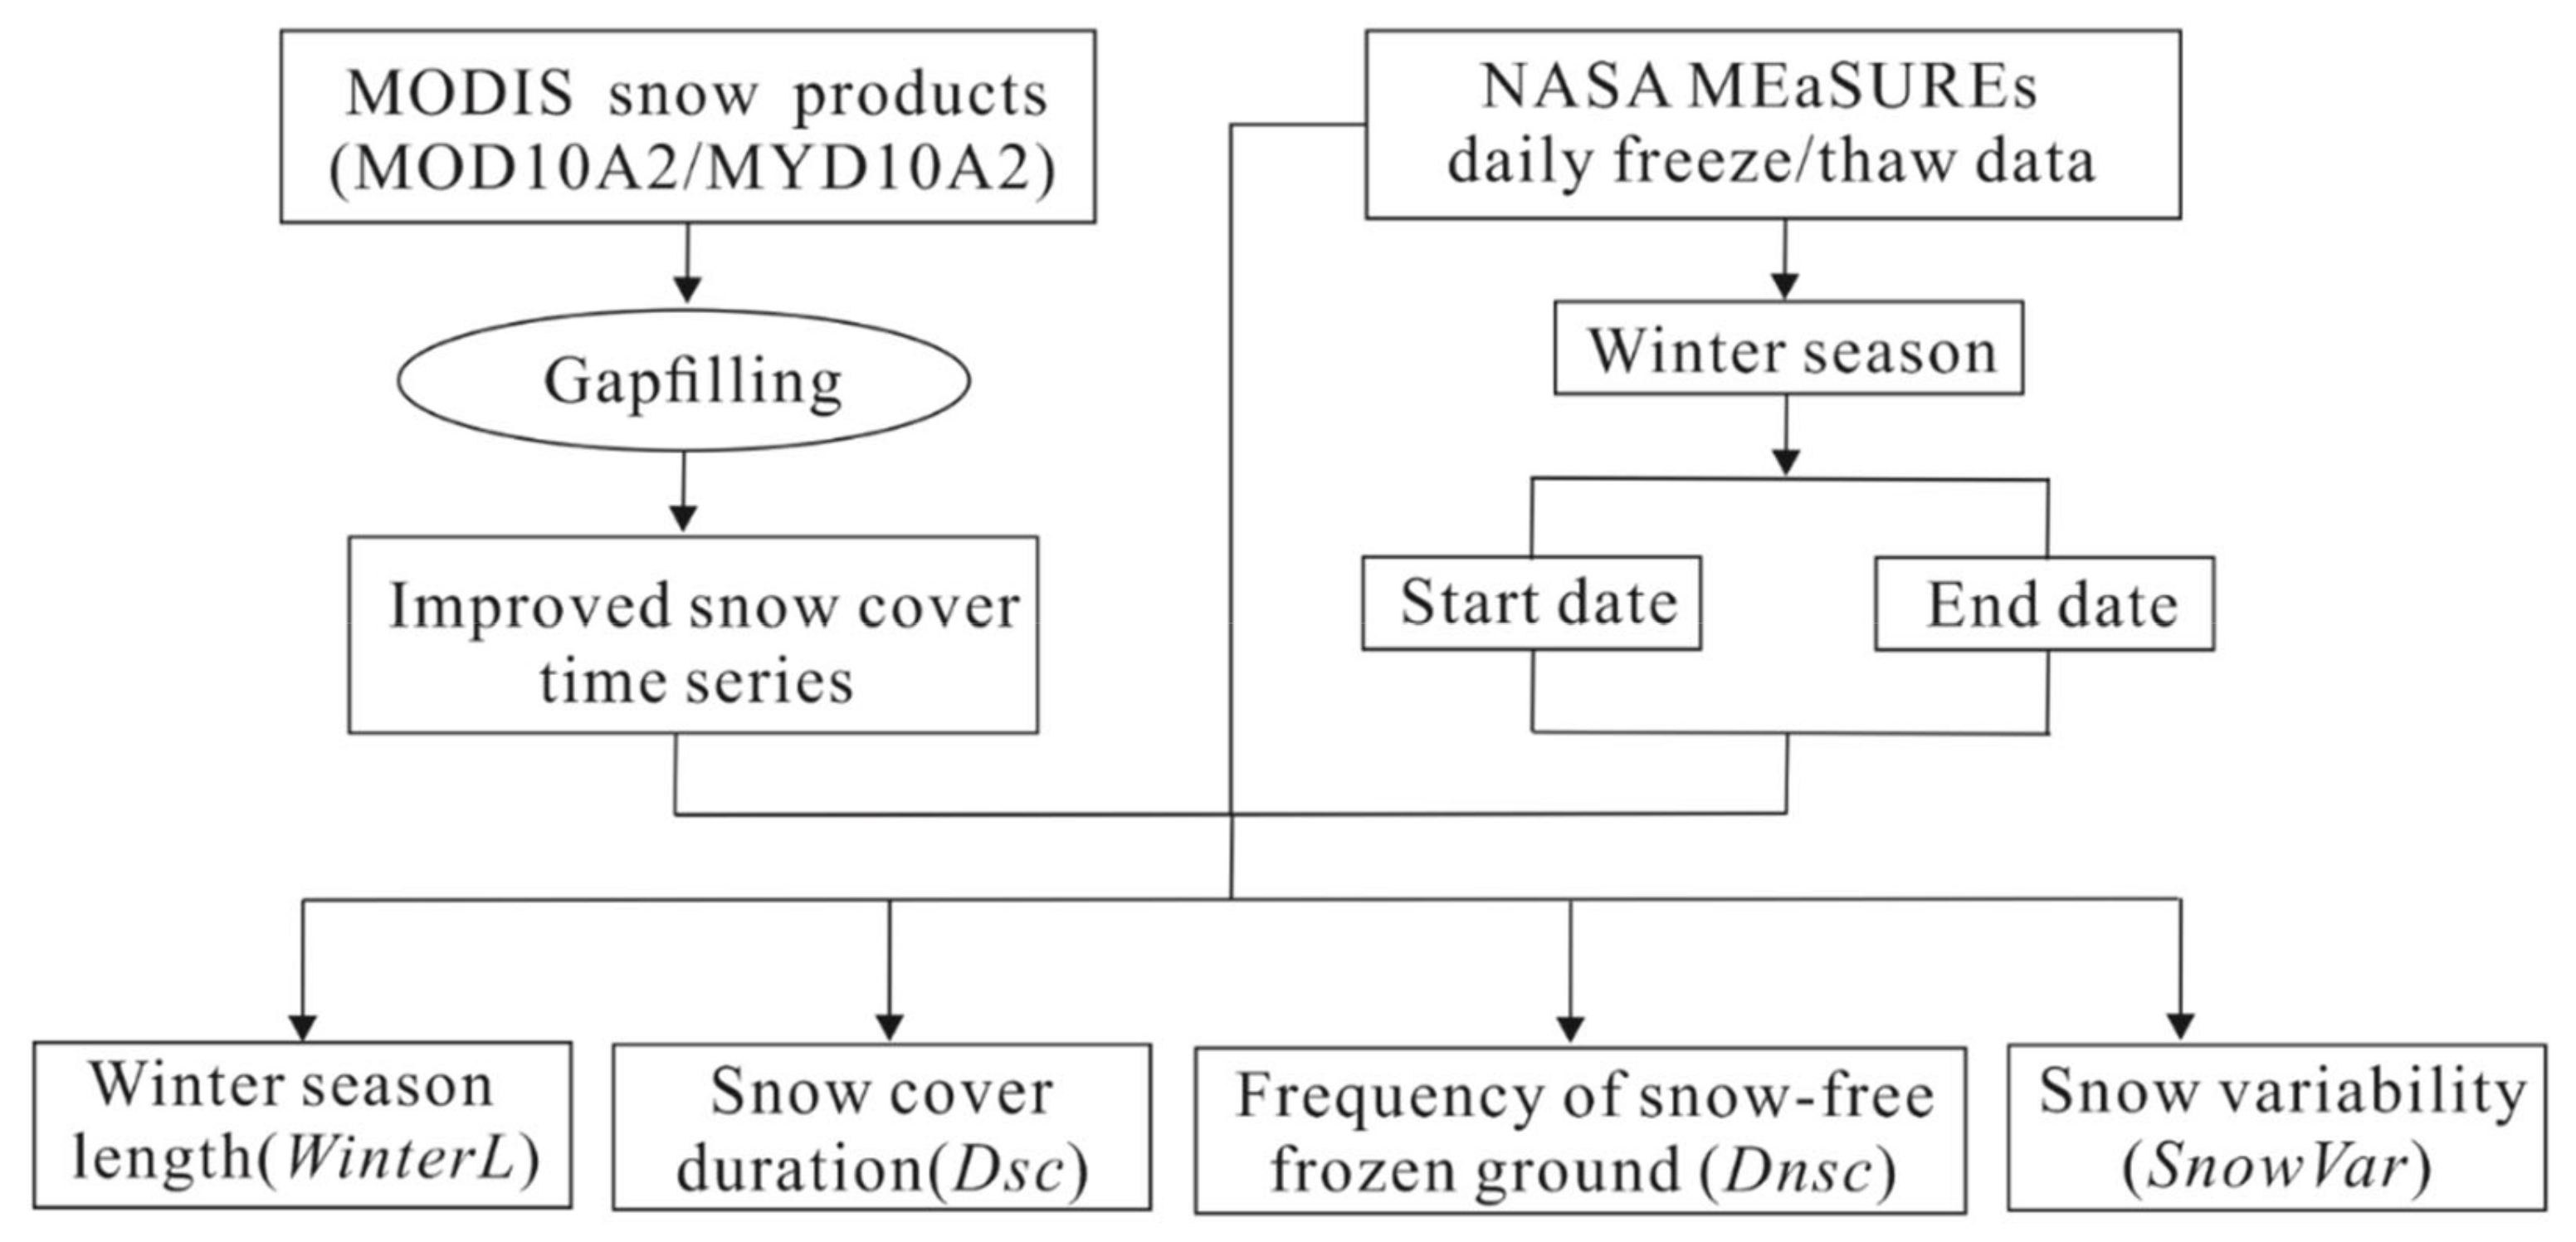
2.2. Calculating Winter Habitat Indices

We utilized MODIS snow cover products and NASA MEaSUREs global daily freeze/thaw records derived from passive microwave satellites to develop four winter habitat indices at 500 m spatial resolution from 2000 to 2018, including winter season length (WinterL), snow cover duration (Dsc), frequency of snow-free frozen ground (Dnsc), and snow variability (SnowVar) (Figure 2). Then, we used 19 year average data of these four indices to test their explanatory power for species richness. To determine ground snow cover status, we used MODIS 8 day composite snow cover products (MOD10A2 and MYD10A2), which reduces the contamination of cloud cover and ensures good observation frequency and accuracy for ground snow cover [43]. We further developed an improved spatially and temporally continuous snow cover product through multiple gapfilling procedures, including Terra and Aqua data fusion, spatial and temporal filtering, etc. [32]. We obtained the frozen ground status using the NASA MEaSUREs freeze/thaw and Daily Global Land Surface Parameters products, which were generated from multiple microwave satellite sensors, including SMMR, SSM/I, SSMIS, AMSE-R, and AMSE2 [40,44].
We defined winter season length (WinterL) as the period between the start and end dates of the frozen season, which were identified by examining daily freeze/thaw records over the course of a year (Figure 2). For each pixel, the start date was identified as the middle date of the first consecutive 14 days of frozen ground from September to January, and the end date was calculated as the middle date of the last 14 days of frozen ground from February to August.
We combined the information on snow cover status, freeze/thaw status, and winter season range to calculate snow cover duration (Dsc), frequency of snow-free frozen ground (Dnsc), and snow variability (SnowVar) (Figure 2). Dsc was defined as the number of days when the ground was frozen and covered by snow within the range of the winter season. We derived Dnsc by counting the days when the ground was frozen but snow-free and then calculating the ratio of the counted days to winter season length. SnowVar was calculated as the times of transitional events (from snow to no snow or from no snow to snow) divided by winter season length. Further detail on our calculations of winter habitat indices is available in Zhu et al. (2017) for the frozen ground–based indices [32] and Gudex-Cross et al. (2021) for snow cover variability [19].

2.3. Dynamic Habitat Indices and DEM

We included the DHIs and DEM (Digital elevation model) in our research to guarantee that our selected variables could represent the all-round environmental information that structures species richness beyond winter (Table 1). Given that satellite observations provide rich data for plant productivity, the DHIs have been developed using various MODIS vegetation measures, including NDVI, EVI, LAI, fPAR, and GPP [8,20]. Although the DHIs from different datasets were strongly correlated, their power to explain species richness varied. We selected the DHIs from the 8 day MODIS fPAR data product (MOD15A2), which showed strong correlation with species richness and was available globally for all land cover types, except deserts and permanent snow/ice [20]. For each pixel, we calculated the three DHIs using 46 fPAR observations for a year: cumDHI, which is the sum of fPAR values of a year; minDHI, which takes the minimum value of the phenological curve of a year; varDHI, the coefficient of variation of the fPAR values over the course of a year. To reduce inter-annual difference and reflect the average status, we used the composite DHIs, which were calculated based on a single composite phenology curve for all MODIS observations from 2003 to 2014. Each value within the composite phenology curve showed the median value of 12 years of observations taken at the same time each year. The detailed description of the calculations and applications of DHIs can be found in Hobi et al. (2017) [20] and Radeloff et al. (2019) [8].
The elevation from DEM was key to characterize spatial heterogeneity and the abiotic environment in a given region, subsequently influenced by climatic, hydrological, and geomorphological processes [45]. The elevation variations within and among mountain systems harbor exceptionally high biodiversity and structure clear elevational biodiversity gradients and their evolutionary origins [46,47]. Therefore, DEM has commonly been used to assess biodiversity patterns across the globe by relating species occurrences to environmental factors [48]. Here we used DEM data from WorldClim (https://worldclim.org/data/worldclim21.html, accessed on 3 February 2022) (Table 1), which have been used as an important input to retrieve climate layers and to predict biodiversity patterns.

2.4. Species Richness Estimates

We derived species richness patterns in China based on the distribution range map of individual species. Regarding mammals, we mainly collected the species range maps from the book, China’ Mammal Diversity and Geographic Distribution, which represented the most recent checklist of mammal species [49]. This book collected 673 mammal species discovered in China so far, and for each, the threat category and geographic distribution map was given. We also referred to two other books, Atlas of Mammalia of China [50] and A Guide to The Mammals of China [51], which provided more useful color pictures and descriptions of animal morphology. For birds, we mainly referenced two books, A Checklist on the Classification and Distribution of the Birds of China (Third Edition) [52] and A Photographic Guide to the Birds of China [53], which provided a complete checklist of bird species as well as an up-to-date classification system and detailed geographical distribution ranges. These range maps delineated the currently known geographic limits of species distribution and were applied to derive reliable patterns of species richness at a coarse resolution.
To derive the species richness patterns of China, we scanned the paper range maps with very high resolution for all species and then manually georeferenced the scanned images in ArcGIS software. We digitalized the boundaries of species distribution and built geodatabases to store range maps of all mammal and bird species. Since the range maps were in polygon format, we converted them to equal-area grids with a size of 100 by 100 km to avoid the effect of area on species richness [8]. We considered a species as present when the grid intersected with that species’ range and then defined species richness of a grid as the count of presence when all range maps of a given species group were overlapped. Based on seasonal migration features, we subdivided the range of each bird species into three mutually exclusive categories: resident birds, which occur all year round; summer birds, which are present during breeding season but not resident; winter birds, which occur during non-breeding season but not resident. To examine the relationships between species richness and environmental indices, we resampled the grid data for winter habitat indices and the DHIs to match the resolution of species richness. To do this, we identified the variable values of fine-resolution grids that were completely within a 100 km × 100 km grid and assigned the average to the coarser grid. One thousand random points were generated to extract information from layers of species richness and environmental indices for further statistical analysis.

2.5. Statistical Analysis

Although the DHIs could well support the specific biodiversity hypotheses, there were only moderate correlations between DHIs and bioclimate variables [8]. To assess whether winter habitat indices could complement environmental information that was underrepresented by the DHIs, we applied the Spearman rank correlation between these indices and nineteen BIOCLIM variables commonly used in macroecological and biogeographical studies (Table 1). We also used Spearman’s rank correlation among the DHIs and our developed winter habitat indices to quantify the extent to which these indices complement each other.
We applied regression models to test the explanatory power of winter habitat indices and determine their independent contributions. The above correlation analysis suggested some strong correlations among remotely sensed indices, which might cause a multicollinearity issue. To fix this issue, we selected independent variables based on the variance-inflation factors (VIF) criterion. First, the VIF values for all indices were calculated, and the variable (Dsc) with the largest VIF value (11.3) was excluded. Then we calculated the VIF values for the rest of the variables and again examined their VIFs. All VIFs were less than 5, except for cumDHI, whose VIF value was 6.4. We did not exclude cumDHI, although the threshold of VIF was set at five because studies have found that cumDHI has shown strong explanatory power for species richness and well supports the hypothesis of energy-species richness [8,20].
We initially built multiple linear regression models with the selected variables and tested whether the assumptions of linear regression held. The Kolmogorov–Smirnov test was applied to test the normal distribution of error terms, and the results showed that the null hypothesis that error is normally distributed was rejected for all species taxa. To examine the homoscedasticity of error, we utilized the Goldfeld-Quandt test, and the p values for all species groups were less than 0.05, suggesting that there was sufficient evidence to say that heteroscedasticity was present. To test whether error was spatially autocorrelated, we calculated global Moran’s I using GeoDa software. The Gaussian kernel function and adaptive kernel method to create a spatial weight matrix were chosen. The significance tests failed to reject the null hypothesis, which suggested that the error pattern was spatially random. The reason might be that our analysis data were extracted from randomly generated points. Similar results were also found in other studies [8,25].
Given the violation of assumptions of linear regression, we adopted a generalized linear model, which allowed the response variable to be count data and have an error distribution other than a normal distribution. Two measures, deviance and AIC, were used to indicate the goodness of fit. The larger the measures, the poorer the goodness of fit for the model. To examine whether winter habitat indices could improve explanatory capability, we built a full model (richness~dem+cumDHI+minDHI+varDHI+WinterL+Dnsc+SnowVar) and a reduced model (richness~dem+cumDHI+minDHI+varDHI) and used the ANOVA method for model comparison. The chi-squared test was applied to test whether additional variables provided a significant increase in the explanatory power of a model. To determine the relative contribution of each indices to the overall explained variance, we applied hierarchical partitioning analysis based on the hier.part package in R software.

3. Results

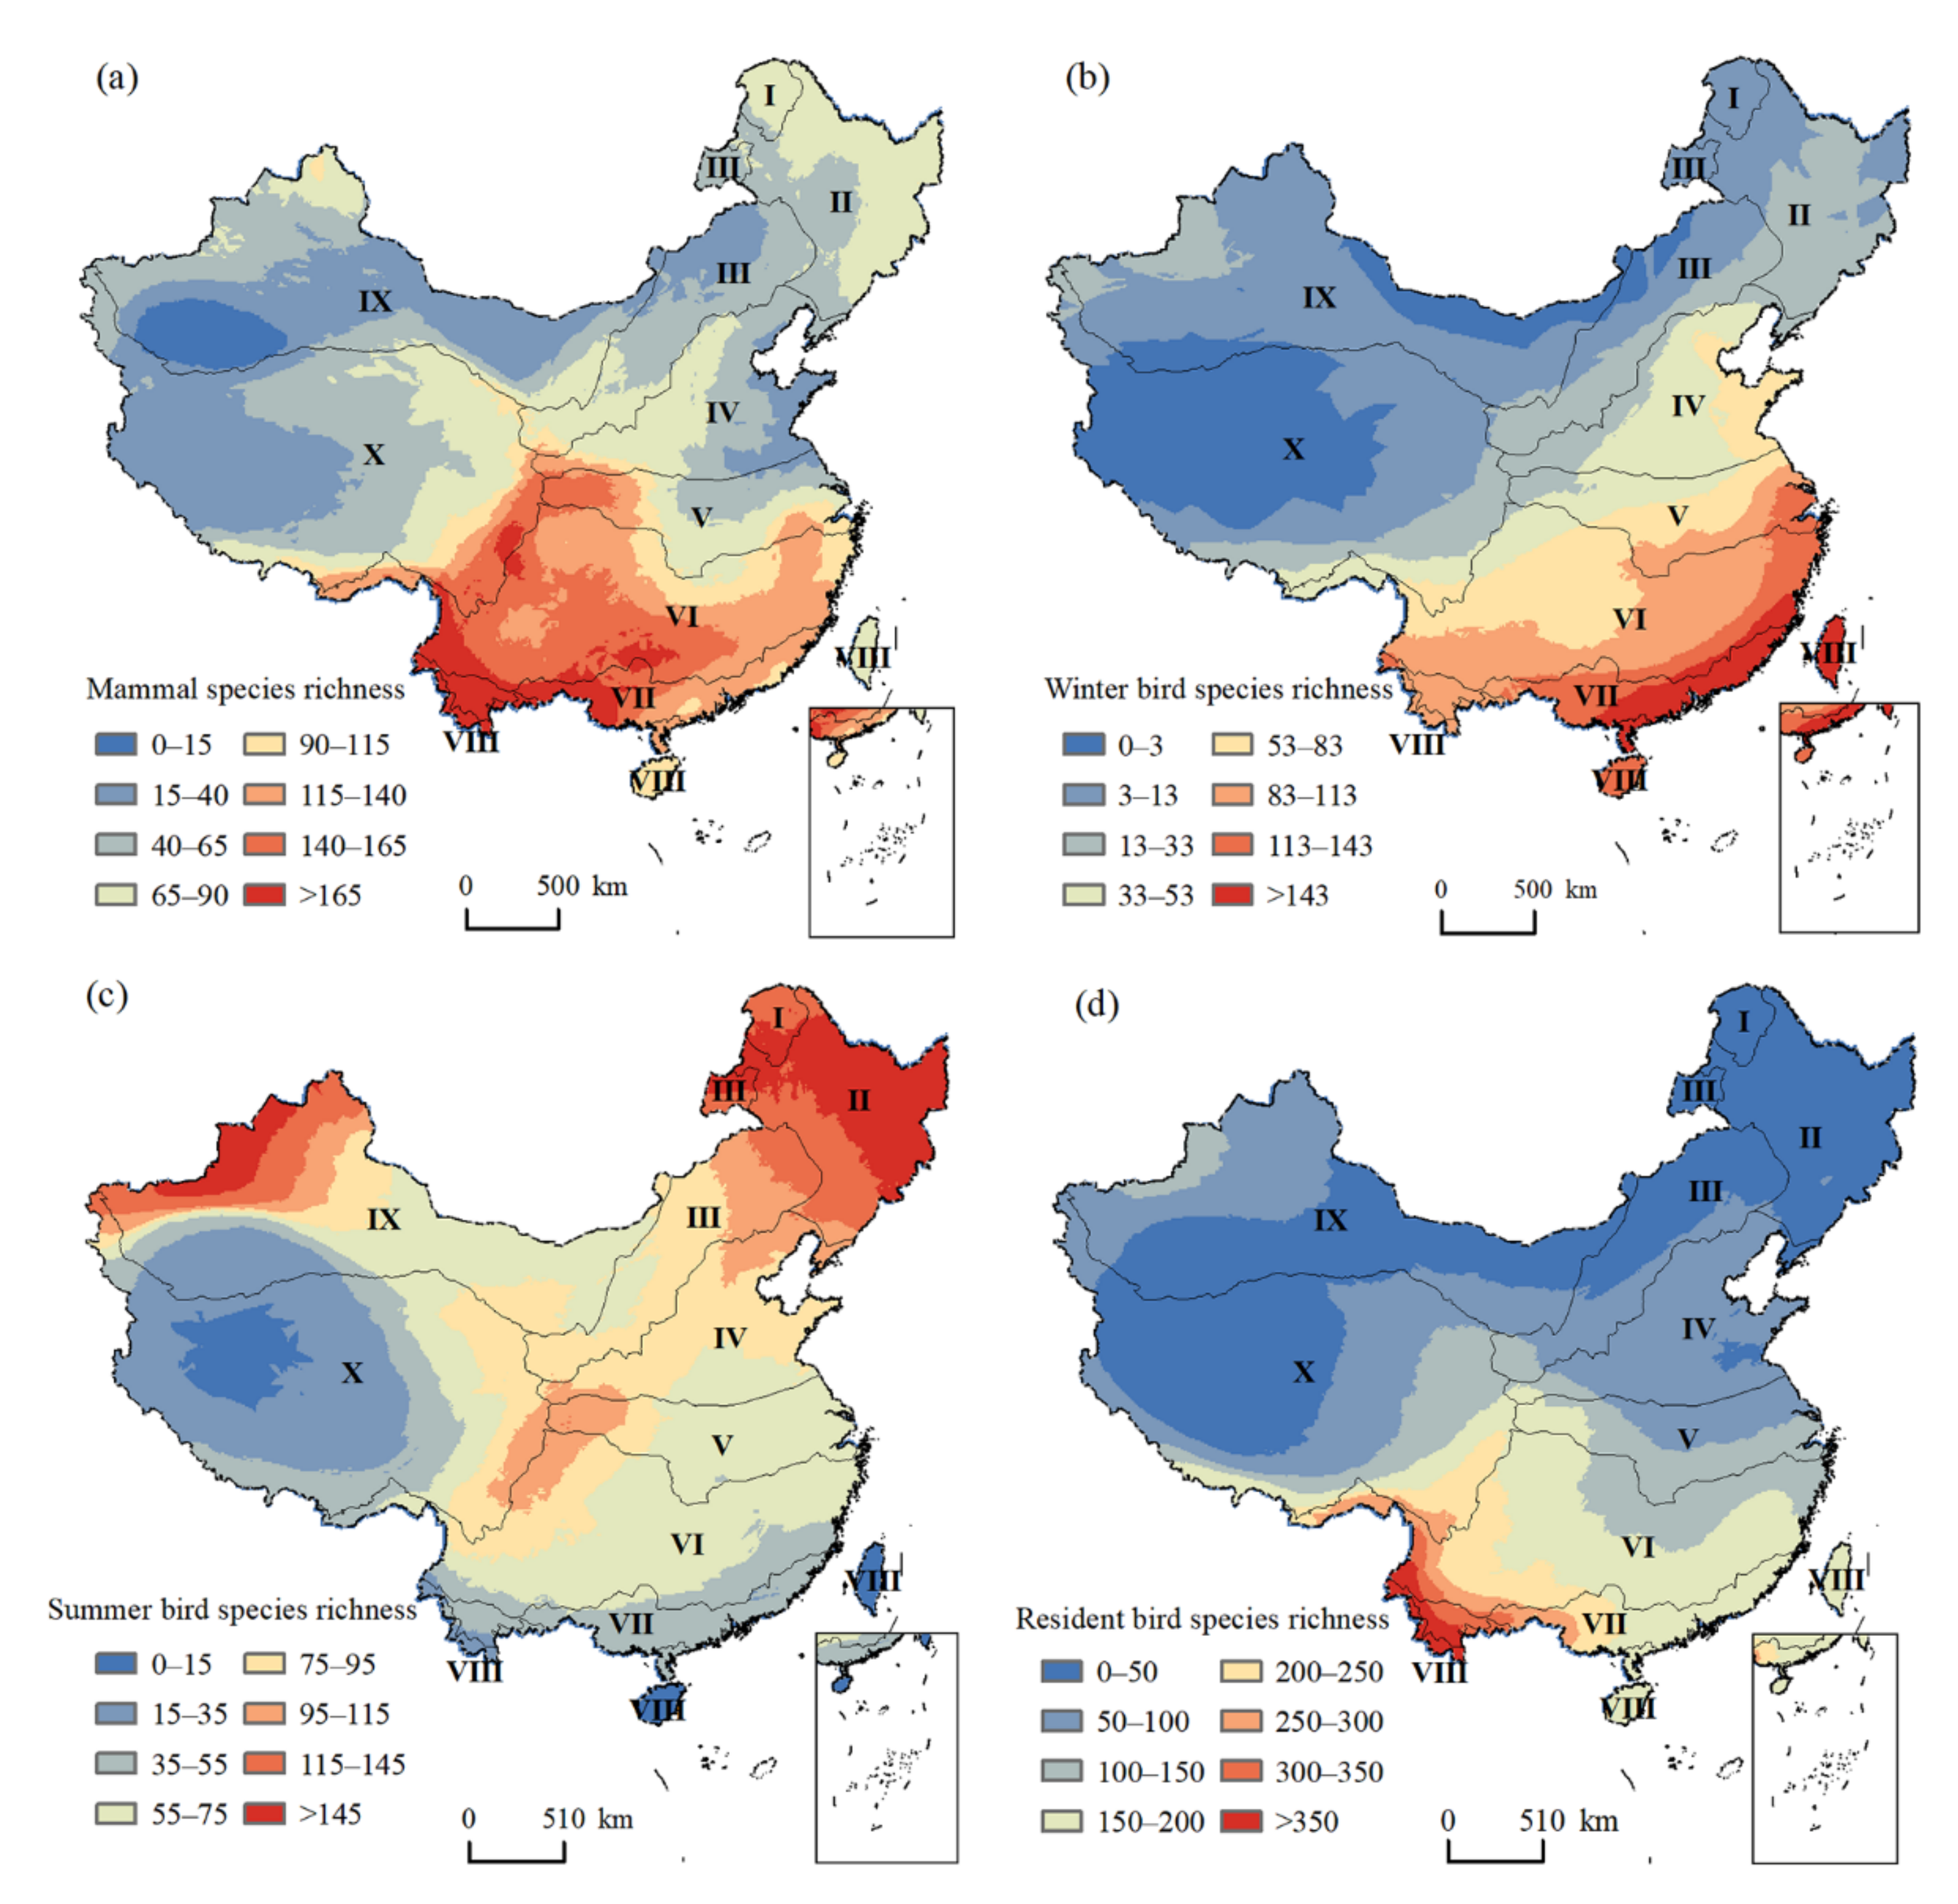
3.1. Patterns of Species Richness

Our derived patterns of species richness were highly consistent with those from other sources, with an R2 value equal to 0.87 for mammals and 0.83 for birds (Figure S1) [54,55]. Species richness was generally higher than that from other sources available at a global scale (Figure S1), because our data products represented the up-to-date checklist of species by including newly discovered species and knowledge from authoritative zoologists in China. Mammal species richness decreased from south to north in Eastern China, and for Western China, the richness was much lower (Figure 3a). Species richness of winter birds derived from the overlapped non-breeding ranges of migratory species showed a decreasing trend from the Southeast to the Northwest of China (Figure 3d). In contrast, the species richness of summer birds generated by overlapping breeding regions of migratory species showed the highest values in the Northeast and Northwest of China (Figure 3c). As expected, the hotspots of mammal species diversity were in the mountainous areas of Southwestern China, and high species diversity was also found in the mountainous areas of Northeastern and Northwestern China. Species richness patterns of resident birds showed an evident latitudinal gradient, with the highest values in the Southwest, and then decreasing northwards (Figure 3d).

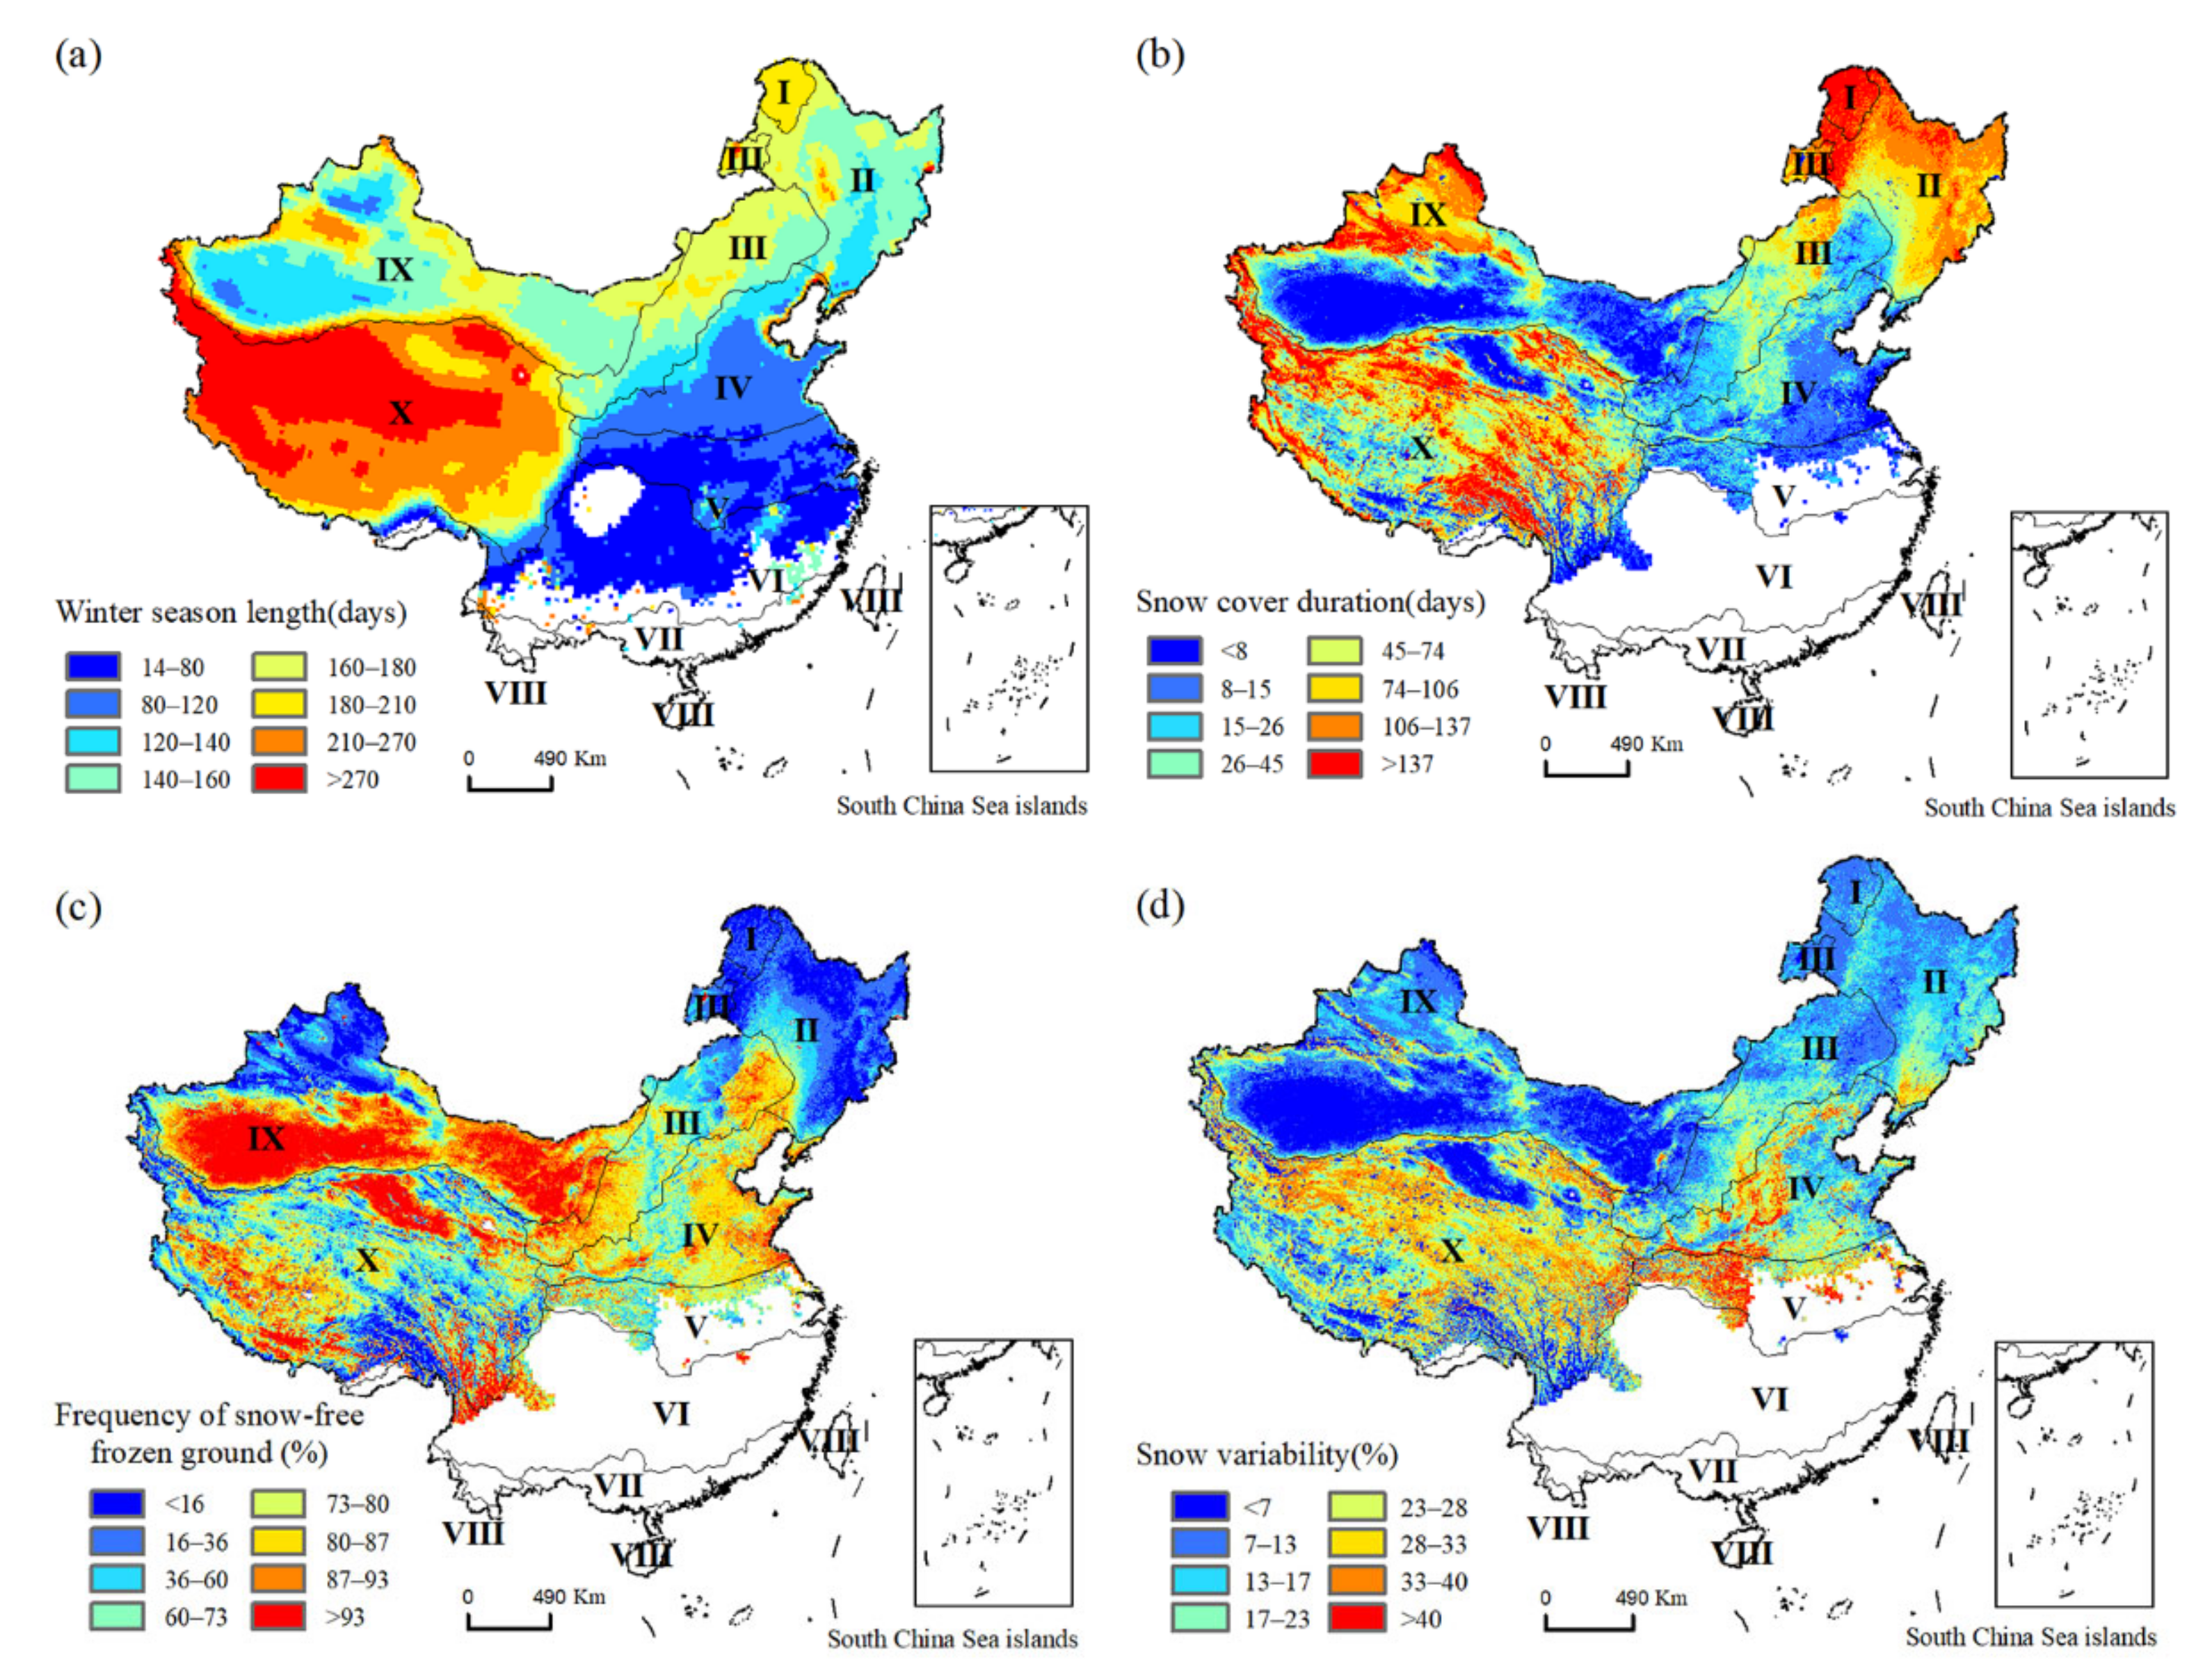
3.2. Patterns of Winter Habitat Indices

We fused satellite-based snow cover products and daily freeze/thaw records and derived accurate patterns of winter habitat indices at 500 m resolution from 2001 to 2018 (Figure 4). It was not surprising that the winter season was longer in areas with high latitudes and elevation (Figure 4a). Values on the Tibetan Plateau were the highest, while those in the temperate and subtropical regions were the lowest. It should be noted that there was no evident winter season in the tropics and some sub-tropical areas. The areas with the longest duration of snow cover were distributed in the Northeast and Northwest and on the Tibetan Plateau (Figure 4b), where the frequency of frozen ground without snow cover (Dnsc) was the lowest (Figure 4c). In contrast, Dnsc was the highest in the semi-humid, semi-arid, and arid temperate zones, where a longer winter season coincided with low temperature and dry climate zones that promoted less precipitation. The highest values of snow variability were mainly distributed on the Tibetan Plateau and in the warm temperate zone, where warmer and fluctuating temperatures were not beneficial for snow persistence (Figure 4d). The lower values of snow variability were observed in Northern China, at high latitudes where low temperatures could keep snowpack stable on the ground.

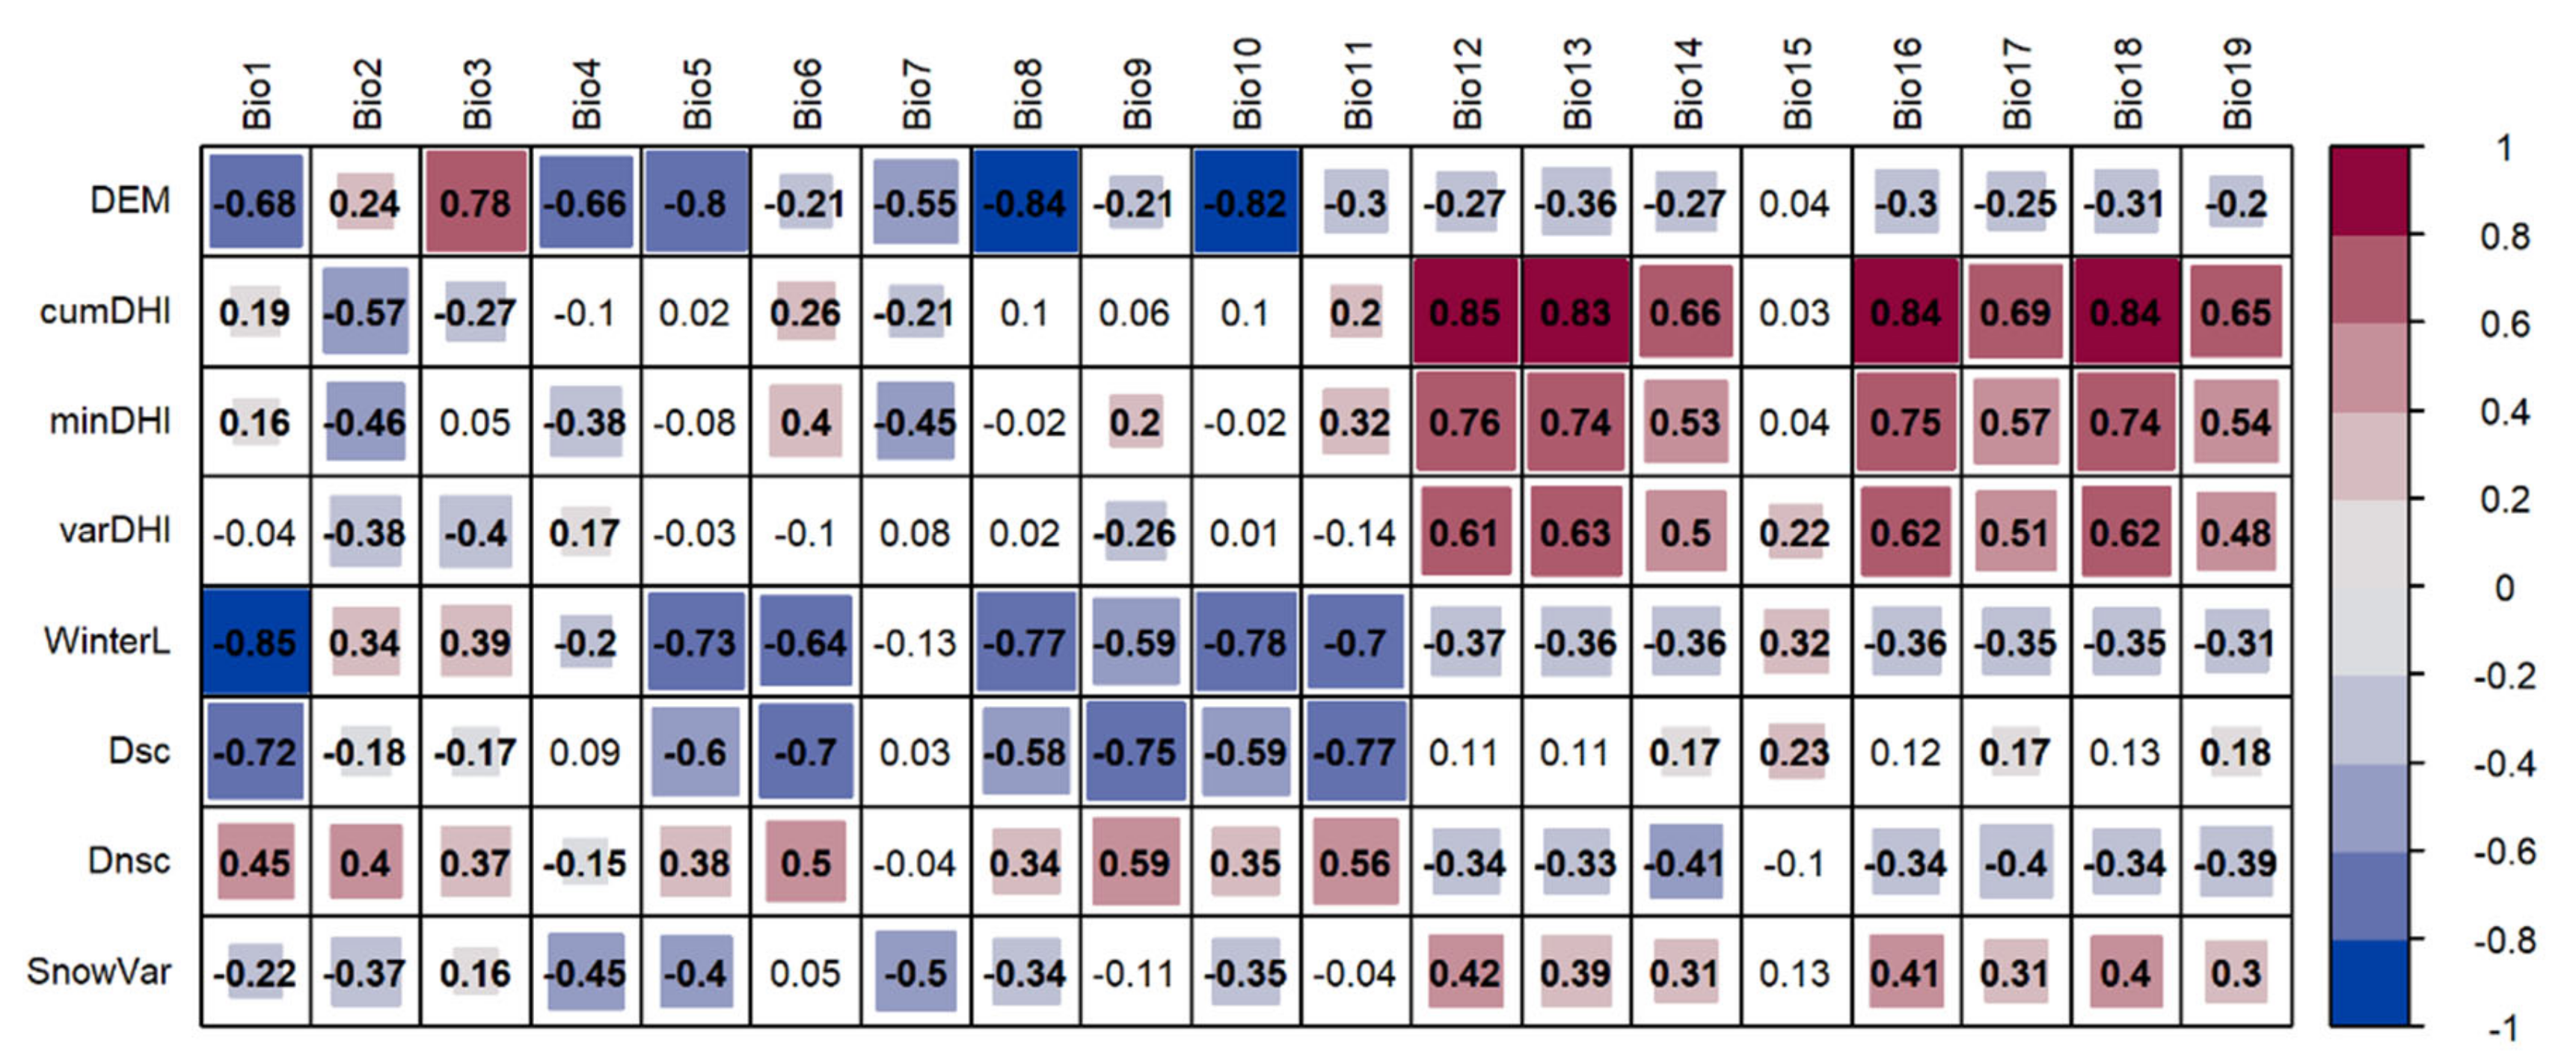
3.3. Relationship between Winter Habitat Indices and Bioclimatic Factors

We conducted Spearman’s correlation analysis between remotely sensed indices and bioclimatic variables to see how winter habitat indices represented environmental information that potentially affected species richness (Figure 5). The combined DHIs and winter habitat indices could comprehensively reflect the majority of environmental information within bioclimatic variables and could provide unique and mutually complementary information. Generally, the DHIs showed stronger correlation with precipitation-related bioclimatic variables and weaker correlation with temperature-related ones.
For winter indices, correlations with temperature-related variables were generally stronger, but no strong correlation (>0.5) was found for precipitation-related variables (Figure 5). As expected, winter season length was negatively correlated with temperature-related variables, and the strongest correlation reached −0.85 for annual mean temperature (Bio 1). Bioclimatic variables, which were strongly correlated with Dsc, were consistent with winter season length, and the strongest negative correlation was with the mean temperature of the coldest quarter (Bio 11). The frequency of frozen ground with snow cover (Dnsc) was not well correlated with bioclimatic variables. The highest value was only 0.59 for Bio9, followed by Bio11 with a value of 0.56. For snow variability (SnowVar), the highest negative correlation with a bioclimatic variable was only −0.5 (Bio7, Temperature Annual Range). The generally weak correlations of Dnsc and SnowVar with bioclimatic variables suggested that they might provide unique information.
Winter habitat indices were generally not well correlated with DHIs, which affirmed that these indices could provide complementary environmental information beyond DHIs (Figure S2). The correlations for all pairs of the four winter habitat indices were generally weak, except the correlation between Dsc and Dnsc (−0.91) (Figure S2). The strongest correlation could be explained by their definitions, which suggested that higher values of Dsc were often accompanied by lower values of Dnsc. Moderate positive correlation was observed between WinterL and Dsc, which meant that areas with longer winter season would have longer snow cover duration.

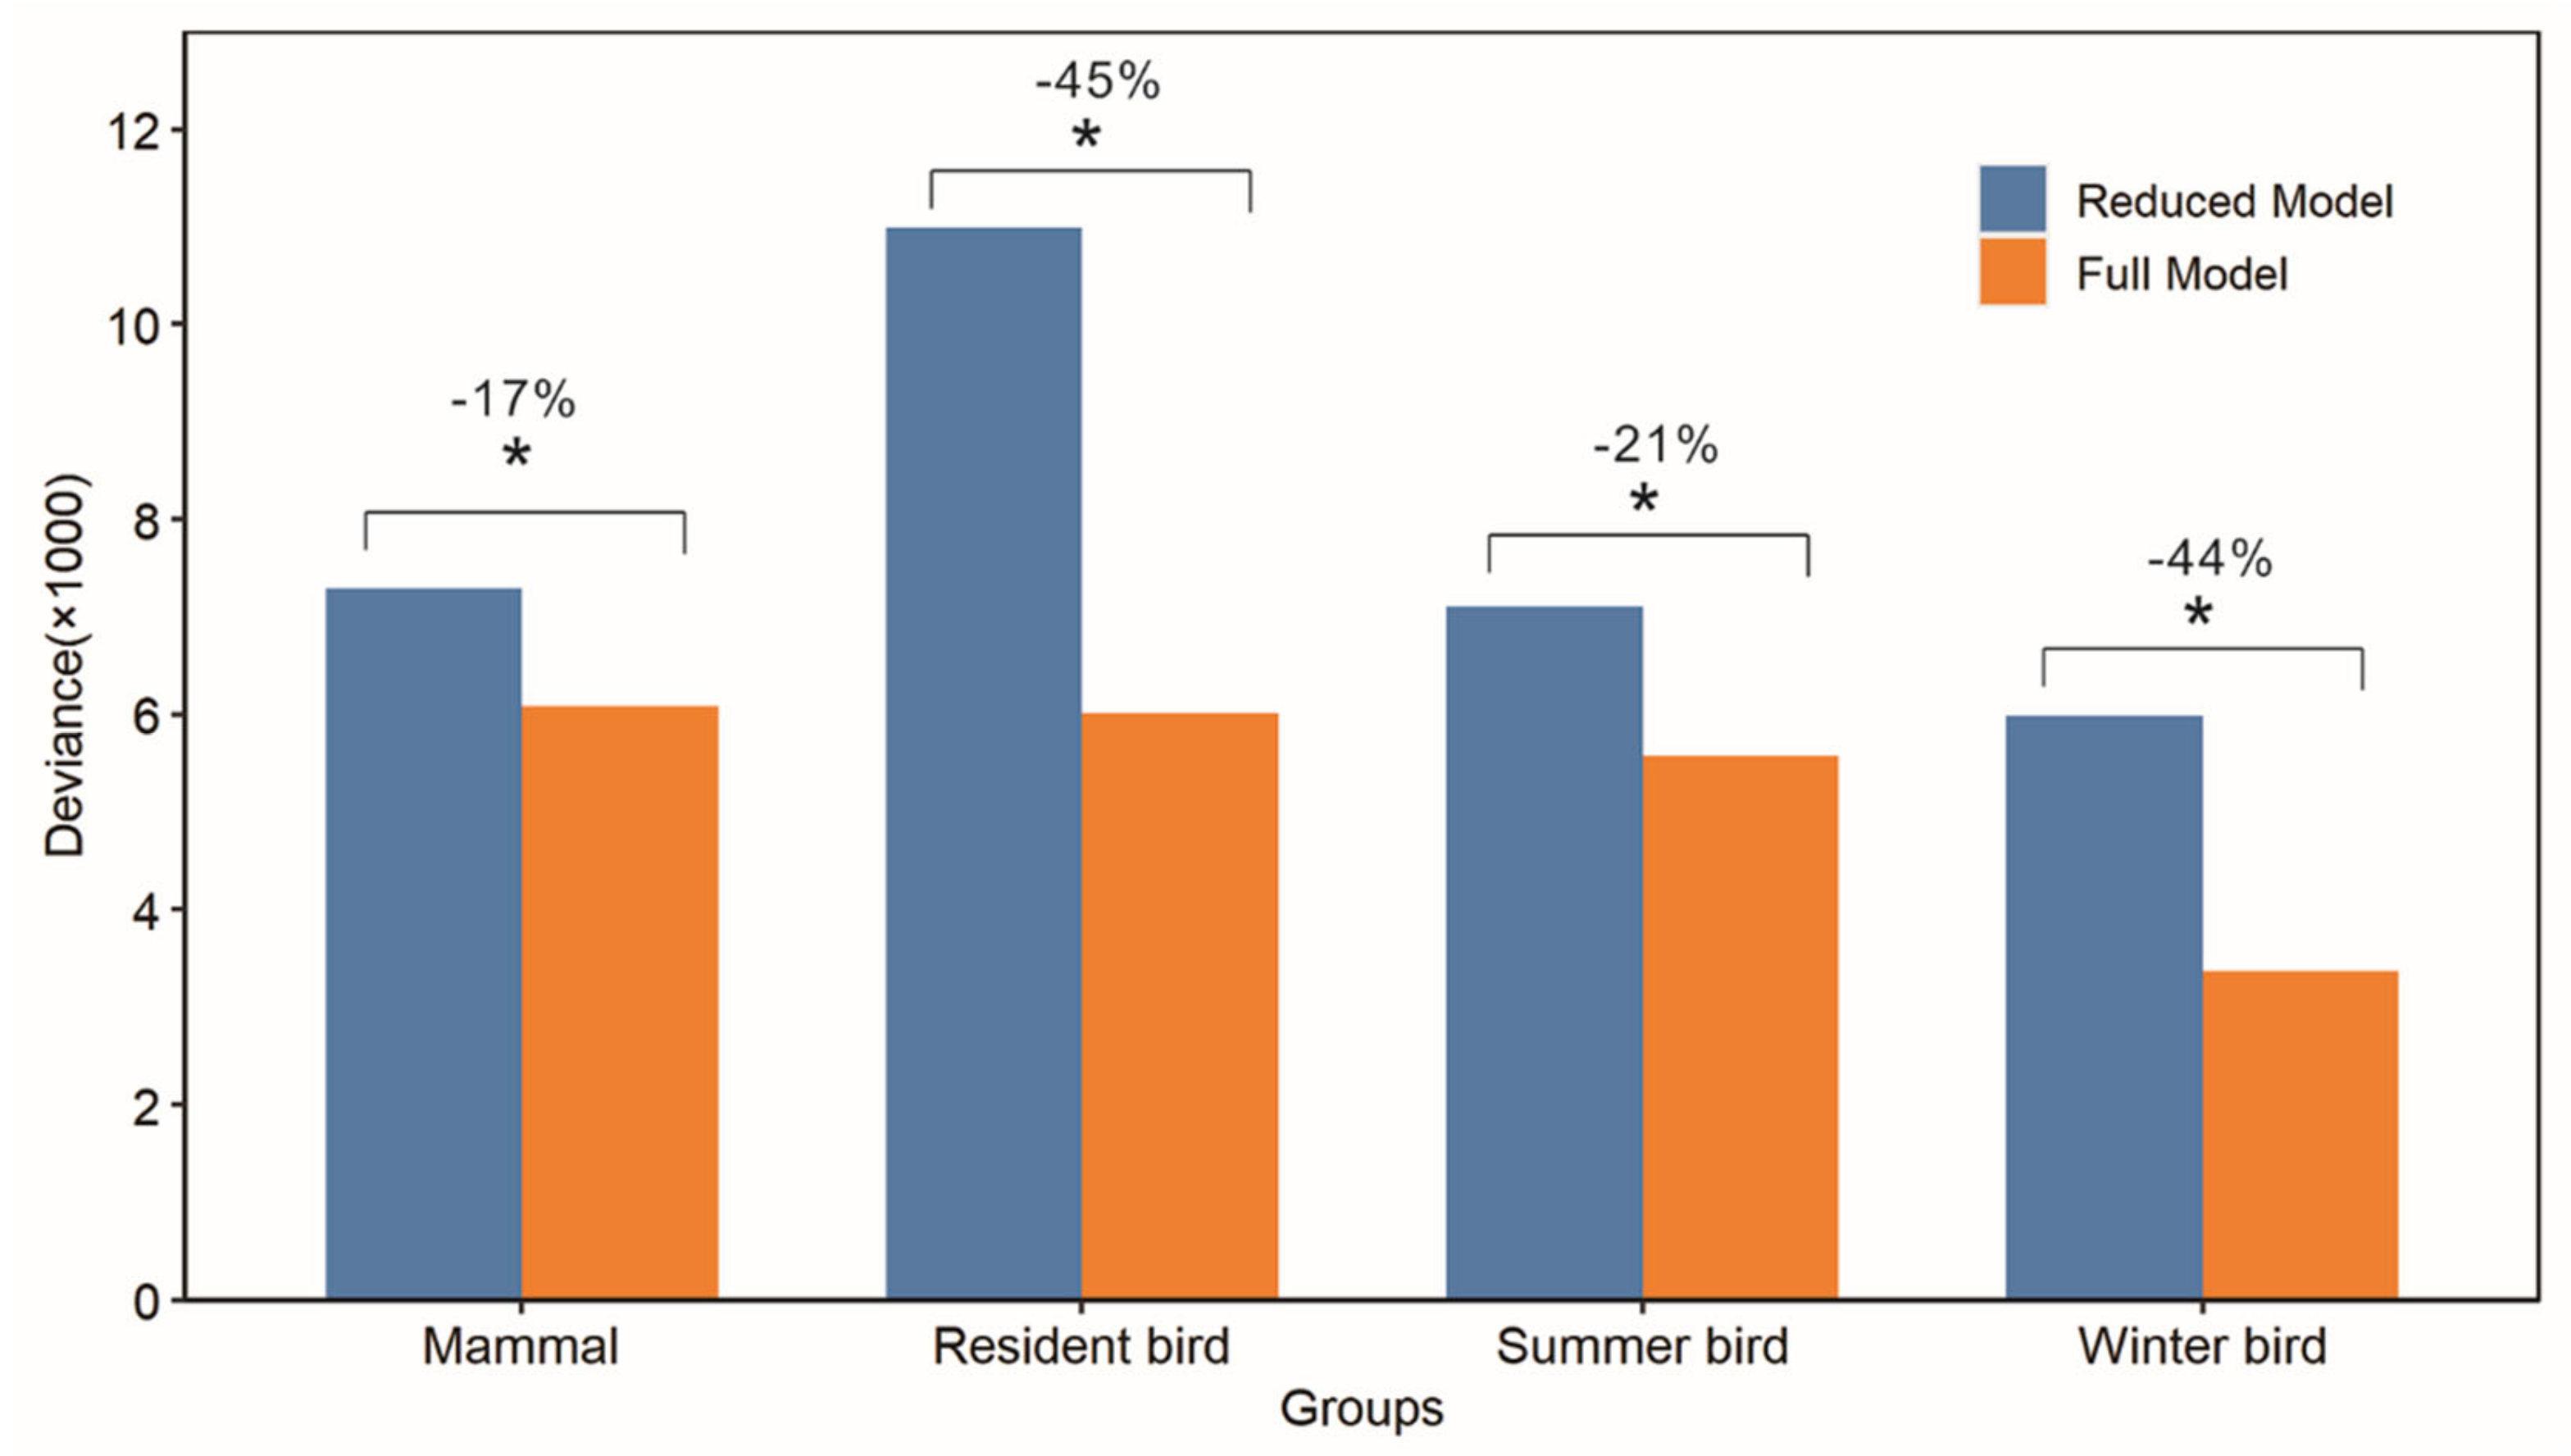
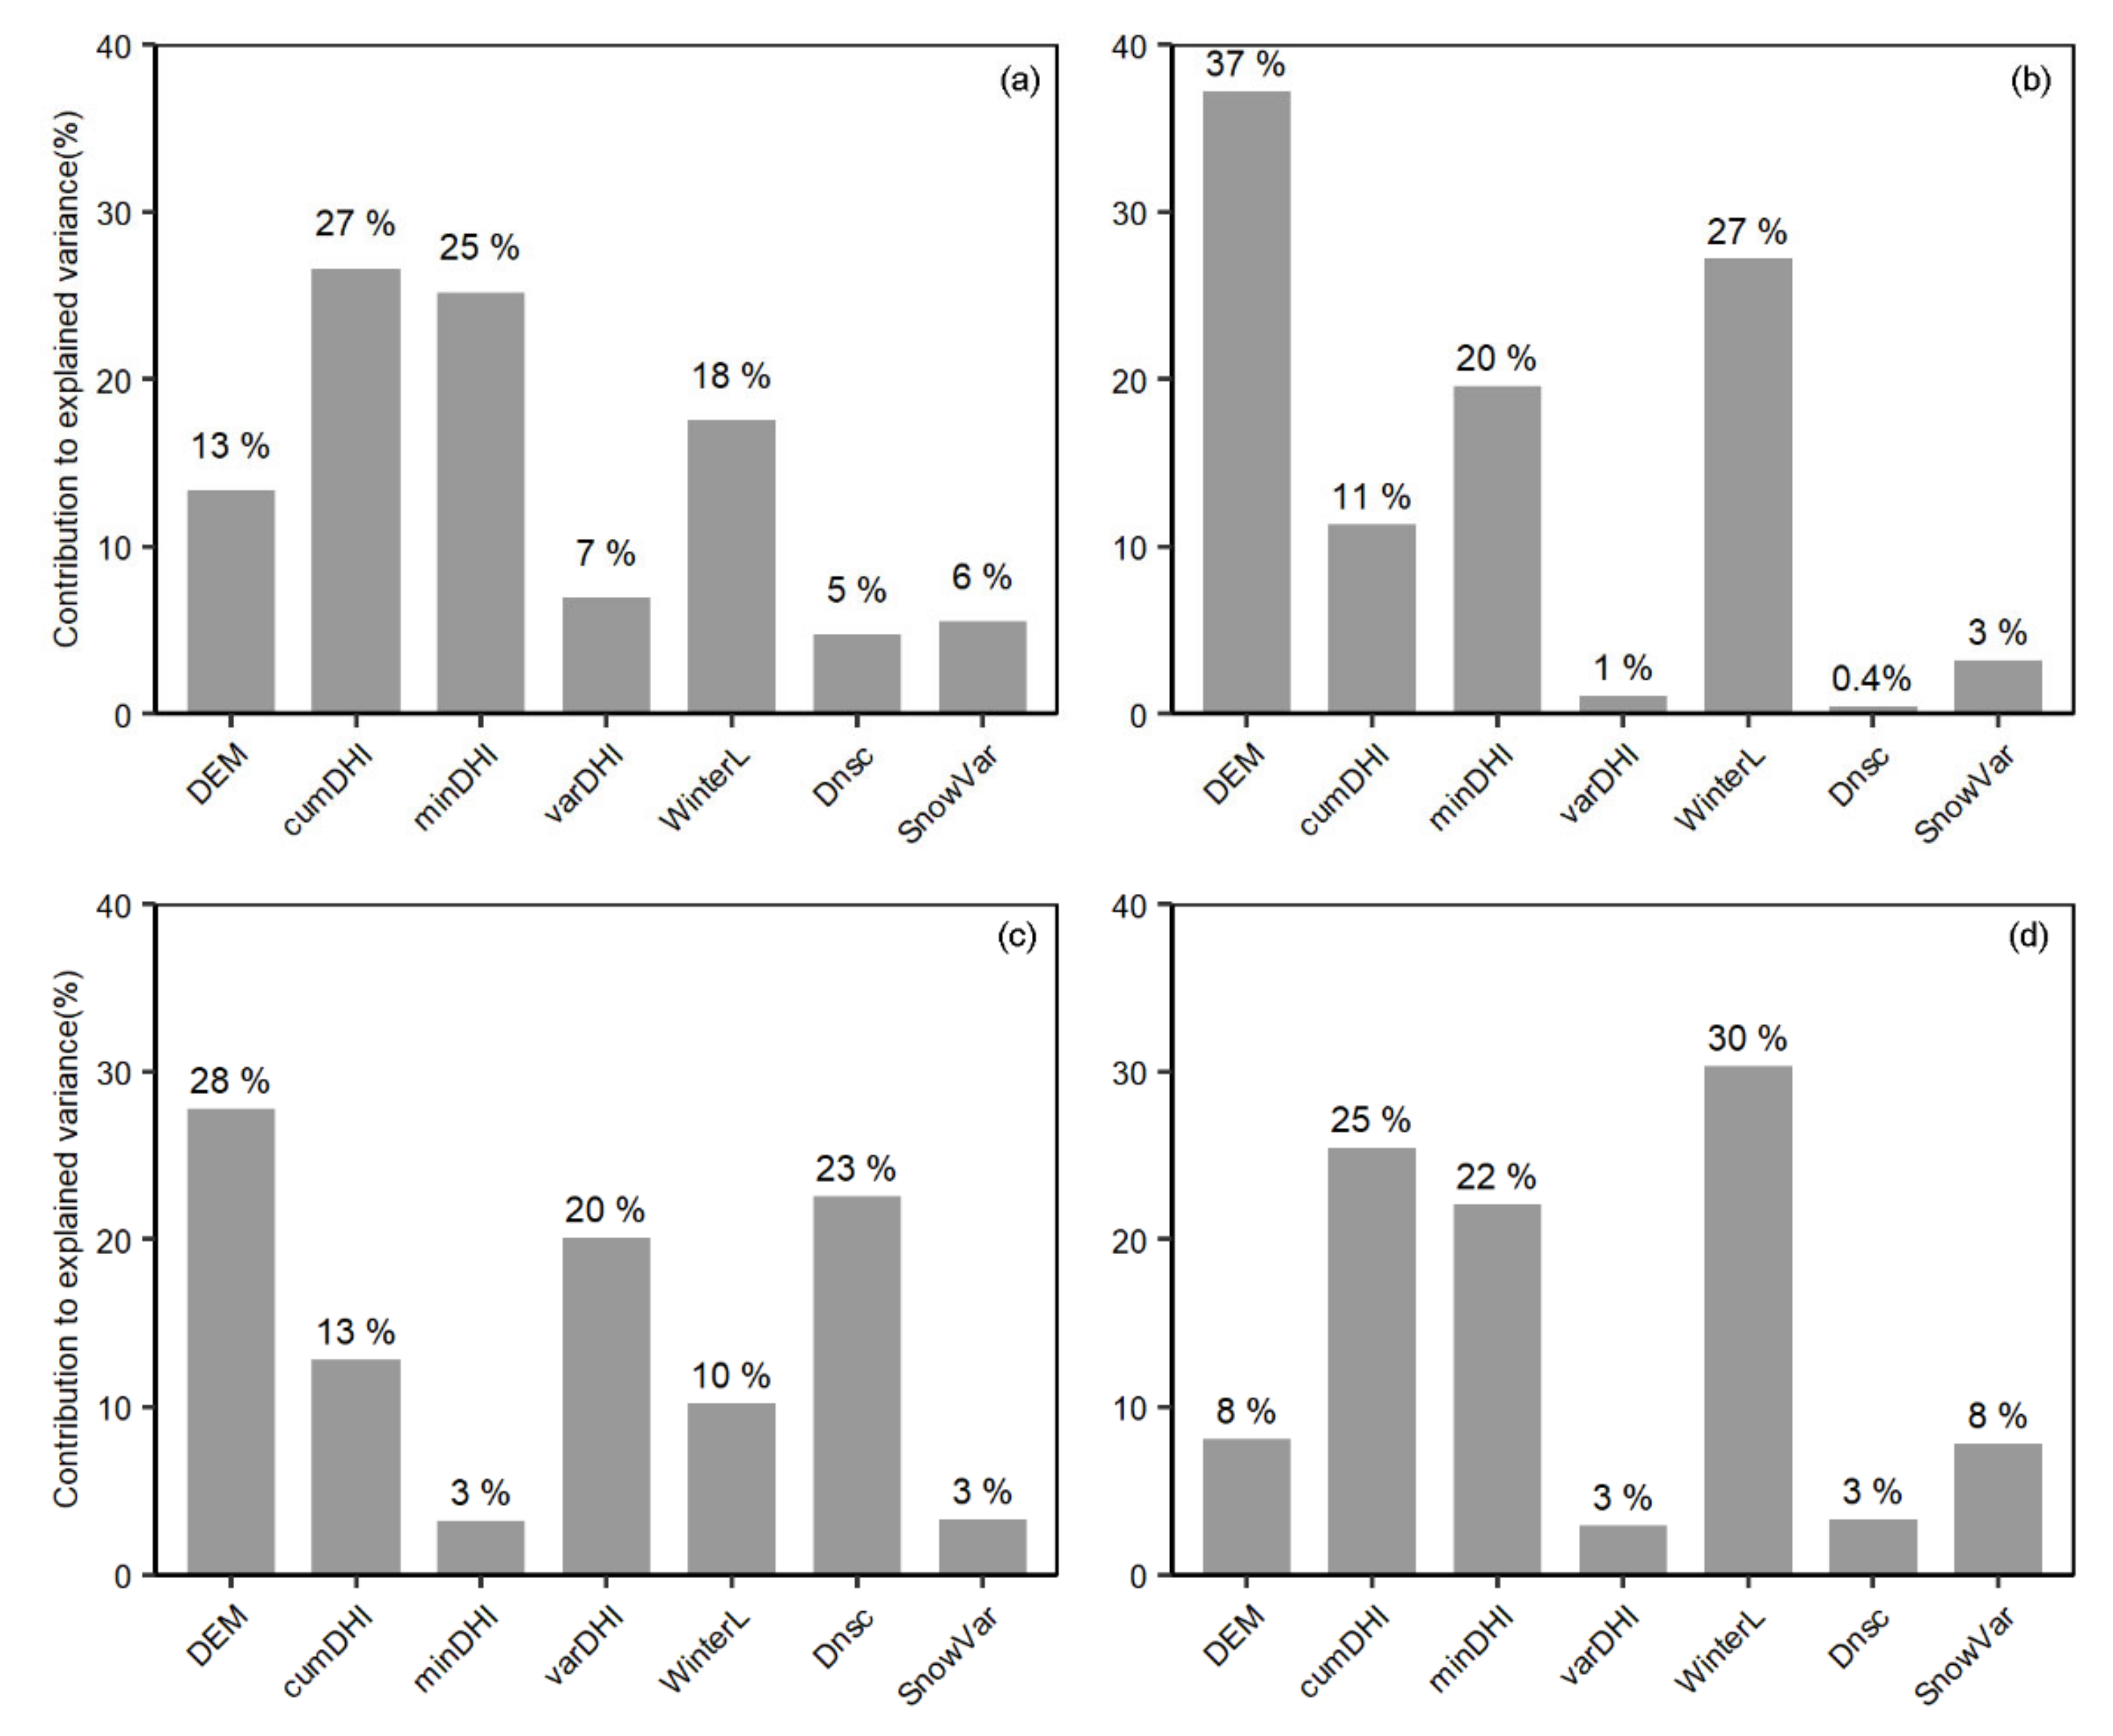
3.4. Explanatory Power of Winter Habitat Indices for Species Richness

Our statistical analysis showed that winter habitat indices could significantly improve the explanation of species richness patterns of all groups (Figure 6 and Figure S3). Without winter habitat indices, the deviance and AIC was generally higher, and the biggest difference in deviance and AIC occurred for resident birds (Figure 6 and Figure S3). When adding winter habitat indices, the explanatory power was the most increased for resident birds, whose deviance decreased by −45%, followed by winter birds, summer birds, and mammals, whose deviance decreased by −44%, −21%, and −17%, respectively. The magnitudes of model improvement were consistent with those reflected by the AIC measure (Figure S3).
With winter habitat indices, the species richness patterns of different groups could be well explained from 48% to 72% of variance, with summer birds having the highest. Each index made distinct contributions to the explanation of species richness patterns for the different groups (Figure 7). Winter season length made particularly larger contributions to the explained variances for mammals, resident birds, and winter birds compared to other winter indices. The greatest contribution was 30% for winter birds, followed by resident birds (27%) and mammals (18%). In contrast, the contributions of other winter habitat indices were smaller, ranging from less than 1% to 8%. For summer birds, the greatest contribution was 23% for frequency of snow-free frozen ground (Dnsc), followed by winter season length (10%) and snow variability (3%).

4. Discussion

We developed new datasets for winter habitat indices at a 500 m spatial resolution to characterize winter environmental conditions by fusing observations from MODIS and microwave remote sensing observations, and tested how these indices contributed to the explanation of species richness across China. We found that remotely sensed winter habitat indices could provide unique and mutually complementary information compared to the commonly used DHIs and improve the explanation of species richness patterns for different groups with distinct contributions. Our research provides new insights into the influences of winter environmental conditions on broad-scale species richness patterns, which is useful in biodiversity assessment and conservation in a changing environment.
We derived data for a suite of winter habitat indices, which well characterized winter environment across China. Our research highlights the use of solely remote sensing observations from multiple sources to generate a dataset, which is able to update annually given the rapidly increasing optical and microwave sensors retrieving snow cover and ground freeze/thaw status [41,44]. This could overcome the limitations of gridded datasets interpolated from station measurements or estimated by data assimilation models (e.g., SNODAS), which are not always available and have higher uncertainties [19]. Our derived winter habitat indices identify distinct patterns of winter conditions across China. It is not surprising that winter season length is determined by latitude and elevation, and the longest winter season is found at high latitudes and elevations (e.g., Northeastern and Northwestern China, Tibetan Plateau) [56]. Snow cover duration (Dsc) is influenced by winter temperature and snowfall. Areas with the longest Dsc are mainly distributed in the mountainous regions of the Tibetan Plateau, Xinjiang, and Northeastern China, where snowfalls are greater and lower winter temperatures are beneficial to snow accumulation [57,58]. For frequency of snow-free frozen ground (Dnsc), the highest values are counterintuitively at the temperate zones with lower latitudes, although the winter season is shorter than that at higher latitudes. These regions are characterized by temperate and dry climate zones that have less snowfall and are not favorable for snow persistence [32]. The highest rates of snow variability occur in the mountainous regions of the Tibetan Plateau and at the transitional zones from rain- to snow-dominated winters. The reason for this is that winter temperatures in lower valleys or at lower latitudes are not low enough to maintain ground snowpack [59].
Our developed winter habitat indices can provide unique and mutually complementary environmental information compared to other commonly used variables. Interestingly, winter habitat indices are strongly correlated with temperature-related variables, while the DHIs are well correlated with precipitation-related variables. Meanwhile, these indices show generally weak correlations with the DHIs. The duration of the winter season is well correlated with temperature variables, both over the course of a year and during the growing season. As expected, regions with shorter winters often have higher annual mean temperatures and higher mean temperatures during the warmest quarter. The correlations with bioclimatic variables for Dsc are consistent with those for winter length, which is due to the coupling between Dsc and WinterL [60]. Dnsc is moderately correlated with the minimum temperatures of the driest and coldest period, which well represent the harshness of winter season. This is consistent with previous findings that Dnsc is one of effective indicators of subnivium, and high values suggest the longer exposure of organisms to extremely low air temperatures due to lack of snow cover [19,30,32]. Snow variability is only strongly and negatively correlated with temperature annual range, but it can provide unique information about the variability of winter temperatures, which is important for many over-wintering species [19].
The ecological relevance of winter habitat indices is underscored by our statistical analysis of broad-scale species richness patterns across China. Winter habitat indices make significant but distinct contributions in explaining the variance of species patterns. Involving these indices can better improve the explanation of species richness for birds than for mammals. Indeed, the major bird species have evolved migratory strategies to adapt to harsh winter conditions, as they are more sensitive to winter environments [61]. Specifically, for resident and winter birds, our research demonstrates the outstanding contribution of winter season length, which is closely related with seasonality and winter season severity (e.g., minimum temperatures). The reason is that their habitats require mild winter conditions and less seasonality [36]. In contrast, for summer birds, species richness pattern is explained more by Dnsc, varDHI, and cumDHI. Summer birds migrate to their breeding regions to capitalize on abundant resources, typically in summer, which could be represented by cumDHI and varDHI [8,20,26]. They leave in winter to escape harsh conditions, which can be represented by Dnsc. Regions with longer Dnsc are often characterized by extremely cold and dry conditions, due to lack of subnivium or other thermal refugia for birds themselves and for the resources they depend on (e.g., food availability) [19,62]. As regarding mammals, our research highlights the outstanding contributions of the DHIs and the weak impact of winter habitat indices, except winter season length. The strong explanatory power of the DHIs is consistent with previous findings in which the cumDHI shows the greatest contribution, followed by minDHI and varDHI [6,8]. As expected, longer winter seasons occur at high elevations and latitudes where snowpack is deeper and food resources are limited, which is not beneficial for major mammal species.
Our research has great implications for macro-ecological research and biological conservation and makes a contribution to biodiversity assessment. We find that changes in winter environment tend to have a stronger influence on birds than mammals. More interestingly, mammal species richness is higher in areas with more prolonged and harsh winters (e.g., Northeastern China). This implies the success of the majority of mammals to adapt to seasonality and winters [63,64]. In contrast, birds are more sensitive to winter environmental changes due to their migration strategy [65,66]. We find that bird biodiversity for overwintering regions is more closely related with winter severity, whereas that for breeding regions is determined by food resources. The migrants both exploit the resource-rich summer months and avoid food resource limitations due to the detrimental effects of prolonged cold and variable snow cover. Accordingly, climate change is shifting or will continue to shift migration patterns and further restructure bird biodiversity [67,68]. Our research has useful implications for biological conservation. We find close relationships between species richness and snow conditions. For example, Dnsc, an indicator of subnivium, could strongly influence the species richness of some bird groups. With climate warming, subnivium will deteriorate, especially in middle latitudes, which will influence snow-dependent species [30]. Therefore, managers should adopt regional conservation plans for identifying threatened snow-covered environments and should control winter recreation activities and forest management practices to protect the subnivium [69]. Biodiversity assessment at broad scales relies heavily on indirect methods, which derive the patterns of species distribution, abundance, and richness from several environmental variables [5]. Our research proved that winter habitat indices can provide unique information. The data produced by these indices, derived annually at 500 m spatial resolution by fusing remote sensing observations of multiple sources, has inherent advantages over other environmental datasets from interpolations. Thus, they can improve models (e.g., species distribution model) to predict patterns for biodiversity of different dimensions. With the rapidly increasing number of satellite sensors to retrieve cryospheric elements, the data for winter habitat indices could be regularly updated, which supports the continuous monitoring of biodiversity patterns in a changing environment.

5. Conclusions

We developed nationwide dataset for winter habitat indices at 500 m resolution based on remote sensing observations from multiple sensors and examined how these indices could improve the explanation of species richness across China. Our developed indices were strongly correlated with temperature-related bioclimatic variables. This suggests that they could provide unique and mutually complementary information for the commonly used DHIs, which were well correlated with precipitation-related bioclimatic variables. The combined DHIs and winter habitat indices explained the variance of species richness from 48% to 72%. In particular, remotely sensed winter habitat indices significantly increased the explained variance for all groups. Our results suggest that winter habitat indices generally contribute more to the explanation of bird species than mammals. Among these indices, winter season length made the greatest contributions to the explained variance for resident birds, winter birds, and mammals, while the frequency of snow-free frozen ground had the strongest influence on the species richness pattern of summer birds. We concluded that remotely sensed winter habitat indices could effectively characterize the winter environment, which is promising for predicting species richness for biodiversity assessment and conservation.

Supplementary Materials

The following supporting information can be downloaded at: https://www.mdpi.com/article/10.3390/rs14030794/s1, Figure S1: Comparison of mammal and bird species richness generated in our research and that generated based on range maps from the International Union for Conservation of Nature (mammals), and BirdLife International (birds); Figure S2: Correlations between winter habitat indices and dynamic habitat indices; Figure S3: Comparison of explanatory power between full models with winter habitat indices and reduced models.

Author Contributions

Conceptualization, L.Z. and Y.G.; methodology, L.Z. and Y.G.; formal analysis, L.Z. and Y.G.; writing—original draft preparation, L.Z. and Y.G.; writing—review and editing, L.Z. and Y.G.; funding acquisition, L.Z. All authors have read and agreed to the published version of the manuscript.

Funding

This research was funded by National Natural Science Foundation of China, Grant Number 42001373.

Data Availability Statement

The data that support the findings of this study are available from the corresponding author upon request.

Acknowledgments

We thank Hui Wang, Lei Ju, Wenxue Tang, Chunyan Xing, Wenxuan Zheng, Xiuru Wang, Yujia Han, and Yaru Wang for georeferencing and digitalizing species range maps.

Conflicts of Interest

The authors declare no conflict of interest.

References

  1. Chapin, F.S., III; Zavaleta, E.S.; Eviner, V.T.; Naylor, R.L.; Vitousek, P.M.; Reynolds, H.L.; Hooper, D.U.; Lavorel, S.; Sala, O.E.; Hobbie, S.E.; et al. Consequences of changing biodiversity. Nature 2000, 405, 234–242. [Google Scholar] [CrossRef] [PubMed]
  2. Ceballos, G.; Ehrlich, P.R.; Barnosky, A.D.; Garcia, P.C.; Pringle, R.M.; Palmer, T.M. Accelerated modern human-induced species loss: Entering the sixth mass extinction. Sci. Adv. 2015, 1, e1400253. [Google Scholar] [CrossRef] [PubMed] [Green Version]
  3. Cardinale, B.J.; Duffy, J.E.; Gonzalez, A.; Hooper, D.U.; Perrings, C.; Venail, P.; Narwani, A.; Mace, G.M.; Tilman, D.; Wardle, D.A.; et al. Biodiversity loss and its impact on humanity. Nature 2012, 486, 59–67. [Google Scholar] [CrossRef] [PubMed]
  4. Soliveres, S.; van der Plas, F.; Manning, P.; Prati, D.; Gossner, M.M.; Renner, S.C.; Alt, F.; Arndt, H.; Baumgartner, V.; Binkenstein, J.; et al. Biodiversity at multiple trophic levels is needed for ecosystem multifunctionality. Nature 2016, 536, 456–459. [Google Scholar] [CrossRef]
  5. Jetz, W.; McGeoch, M.A.; Guralnick, R.; Ferrier, S.; Beck, J.; Costello, M.J.; Fernandez, M.; Geller, G.N.; Keil, P.; Merow, C.; et al. Essential biodiversity variables for mapping and monitoring species populations. Nat. Ecol. Evol. 2019, 3, 539–551. [Google Scholar] [CrossRef] [Green Version]
  6. Wu, J.; Liang, S. Developing an integrated remote sensing based biodiversity index for predicting animal species richness. Remote Sens. 2018, 10, 739. [Google Scholar] [CrossRef] [Green Version]
  7. Hawkins, B.A.; Field, R.; Cornell, H.V.; Currie, D.J.; Guegan, J.-F.; Kaufman, D.M.; Kerr, J.T.; Mittelbach, G.G.; Oberdorff, T.; O’Brien, E.; et al. Energy, water and broad-scale geographic patterns of species richness. Ecology 2003, 84, 3105–3117. [Google Scholar] [CrossRef] [Green Version]
  8. Radeloff, V.C.; Dubinin, M.; Coops, N.C.; Allen, A.M.; Brooks, T.M.; Clayton, M.K.; Costa, G.C.; Graham, C.H.; Helmers, D.P.; Ives, A.R.; et al. The Dynamic Habitat Indices (DHIs) from MODIS and global biodiversity. Remote Sens. Environ. 2019, 222, 204–214. [Google Scholar] [CrossRef]
  9. Luo, Z.; Tang, S.; Li, C.; Fang, H.; Hu, H.; Yang, J.; Ding, J.; Jiang, Z. Environmental effects on vertebrate species richness: Testing the energy, environmental stability and habitat heterogeneity hypotheses. PLoS ONE 2012, 7, e35514. [Google Scholar] [CrossRef] [Green Version]
  10. Currie, D.J.; Wright, S.D.; McBride, P.D.; Gillman, L.N. What is the form of the productivity–animal-species-richness relationship? A critical review and meta-analysis. Ecology 2012, 93, 2241–2252. [Google Scholar]
  11. Coops, N.C.; Rickbeil, G.J.M.; Bolton, D.K.; Andrew, M.E.; Brouwers, N.C. Disentangling vegetation and climate as drivers of Australian vertebrate richness. Ecography 2018, 41, 1147–1160. [Google Scholar] [CrossRef]
  12. Currie, D.J.; Mittelbach, G.G.; Cornell, H.V.; Field, R.; Guegan, J.-F.; Hawkins, B.A.; Kaufman, D.M.; Kerr, J.T.; Oberdorff, T.; O’Brien, E.; et al. Predictions and tests of climate-based hypotheses of broad-scale variation in taxonomic richness. Ecol. Lett. 2004, 7, 1121–1134. [Google Scholar] [CrossRef]
  13. Coops, N.C.; Wulder, M.A.; Iwanicka, D. Exploring the relative importance of satellite-derived descriptors of production, topography and land cover for predicting breeding bird species richness over Ontario, Canada. Remote Sens. Environ. 2009, 113, 668–679. [Google Scholar] [CrossRef]
  14. Zhang, C.; Cai, D.; Li, W.; Guo, S.; Guan, Y.; Bian, X.; Yao, W. Effect of the Long-Term Mean and the Temporal Stability of Water-Energy Dynamics on China’s Terrestrial Species Richness. ISPRS Int. J. Geo-Inf. 2017, 6, 58. [Google Scholar] [CrossRef] [Green Version]
  15. Tuanmu, M.N.; Jetz, W. A global, remote sensing-based characterization of terrestrial habitat heterogeneity for biodiversity and ecosystem modelling. Glob. Ecol. Biogeogr. 2015, 24, 1329–1339. [Google Scholar] [CrossRef]
  16. Rocchini, D.; Bacaro, G.; Chirici, G.; Da Re, D.; Feilhauer, H.; Foody, G.M.; Galluzzi, M.; Garzon-Lopez, C.X.; Gillespie, T.W.; He, K.S.; et al. Remotely sensed spatial heterogeneity as an exploratory tool for taxonomic and functional diversity study. Ecol. Indic. 2018, 85, 983–990. [Google Scholar] [CrossRef] [Green Version]
  17. Fick, S.E.; Hijmans, R.J. WorldClim 2: New 1-km spatial resolution climate surfaces for global land areas. Int. J. Climatol. 2017, 37, 4302–4315. [Google Scholar] [CrossRef]
  18. Vega, G.C.; Pertierra, L.R.; Olalla-Tarraga, M.A. MERRAclim, a high-resolution global dataset of remotely sensed bioclimatic variables for ecological modelling. Sci. Data 2017, 4, 170078. [Google Scholar] [CrossRef] [Green Version]
  19. Gudex-Cross, D.; Keyser, S.R.; Zuckerberg, B.; Fink, D.; Zhu, L.; Pauli, J.N.; Radeloff, V.C. Winter Habitat Indices (WHIs) for the contiguous US and their relationship with winter bird diversity. Remote Sens. Environ. 2021, 255, 112309. [Google Scholar] [CrossRef]
  20. Hobi, M.L.; Dubinin, M.; Graham, C.H.; Coops, N.C.; Clayton, M.K.; Pidgeon, A.M.; Radeloff, V.C. A comparison of Dynamic Habitat Indices derived from different MODIS products as predictors of avian species richness. Remote Sens. Environ. 2017, 195, 142–152. [Google Scholar] [CrossRef]
  21. Rocchini, D.; Hernández-Stefanoni, J.L.; He, K.S. Advancing species diversity estimate by remotely sensed proxies: A conceptual review. Ecol. Inform. 2015, 25, 22–28. [Google Scholar] [CrossRef]
  22. Pettorelli, N.; Owen, H.J.F.; Duncan, C.; Freckleton, R. How do we want Satellite Remote Sensing to support biodiversity conservation globally? Methods Ecol. Evol. 2016, 7, 656–665. [Google Scholar] [CrossRef]
  23. Currie, D.J. Energy and large-scale patterns of animal and plant species richness. Am. Nat. 1991, 137, 27–49. [Google Scholar] [CrossRef]
  24. Coops, N.C.; Bolton, D.K.; Hobi, M.L.; Radeloff, V.C. Untangling multiple species richness hypothesis globally using remote sensing habitat indices. Ecol. Indic. 2019, 107, 105567. [Google Scholar] [CrossRef]
  25. Suttidate, N.; Hobi, M.L.; Pidgeon, A.M.; Round, P.D.; Coops, N.C.; Helmers, D.P.; Keuler, N.S.; Dubinin, M.; Bateman, B.L.; Radeloff, V.C. Tropical bird species richness is strongly associated with patterns of primary productivity captured by the Dynamic Habitat Indices. Remote Sens. Environ. 2019, 232, 111306. [Google Scholar] [CrossRef]
  26. Zhang, C.; Cai, D.; Guo, S.; Guan, Y.; Fraedrich, K.; Nie, Y.; Liu, X.; Bian, X. Spatial-Temporal Dynamics of China’s Terrestrial Biodiversity: A Dynamic Habitat Index Diagnostic. Remote Sens. 2016, 8, 227. [Google Scholar] [CrossRef] [Green Version]
  27. Kreyling, J. Winter climate change: A critical factor for temperate vegetation performance. Ecology 2010, 91, 1939–1948. [Google Scholar] [CrossRef]
  28. Williams, C.M.; Henry, H.A.; Sinclair, B.J. Cold truths: How winter drives responses of terrestrial organisms to climate change. Biol. Rev. 2015, 90, 214–235. [Google Scholar] [CrossRef] [Green Version]
  29. Penczykowski, R.M.; Connolly, B.M.; Barton, B.T. Winter is changing: Trophic interactions under altered snow regimes. Food Webs 2017, 13, 80–91. [Google Scholar] [CrossRef]
  30. Zhu, L.; Ives, A.R.; Zhang, C.; Guo, Y.; Radeloff, V.C. Climate change causes functionally colder winters for snow cover-dependent organisms. Nat. Clim. Chang. 2019, 9, 886–893. [Google Scholar] [CrossRef]
  31. Pauli, J.N.; Zuckerberg, B.; Whiteman, J.P.; Porter, W. The subnivium: A deteriorating seasonal refugium. Front. Ecol. Environ. 2013, 11, 260–267. [Google Scholar] [CrossRef]
  32. Zhu, L.; Radeloff, V.C.; Ives, A.R. Characterizing global patterns of frozen ground with and without snow cover using microwave and MODIS satellite data products. Remote Sens. Environ. 2017, 191, 168–178. [Google Scholar] [CrossRef]
  33. Niittynen, P.; Heikkinen, R.K.; Luoto, M. Decreasing snow cover alters functional composition and diversity of Arctic tundra. Proc. Natl. Acad. Sci. USA 2020, 117, 21480–21487. [Google Scholar] [CrossRef]
  34. Sinclair, B.J.; Stinziano, J.R.; Williams, C.M.; Macmillan, H.A.; Marshall, K.E.; Storey, K.B. Real-time measurement of metabolic rate during freezing and thawing of the wood frog, Rana sylvatica: Implications for overwinter energy use. J. Exp. Biol. 2013, 216, 292–302. [Google Scholar] [CrossRef] [Green Version]
  35. Niittynen, P.; Heikkinen, R.K.; Luoto, M. Snow cover is a neglected driver of Arctic biodiversity loss. Nat. Clim. Chang. 2018, 8, 997–1001. [Google Scholar] [CrossRef]
  36. Kawamura, K.; Yamaura, Y.; Senzaki, M.; Ueta, M.; Nakamura, F. Seasonality in spatial distribution: Climate and land use have contrasting effects on the species richness of breeding and wintering birds. Ecol. Evol. 2019, 9, 7549–7561. [Google Scholar] [CrossRef]
  37. Miller, D.A.W.; Grant, E.H.C.; Muths, E.; Amburgey, S.M.; Adams, M.J.; Joseph, M.B.; Waddle, J.H.; Johnson, P.T.J.; Ryan, M.E.; Schmidt, B.R.; et al. Quantifying climate sensitivity and climate-driven change in North American amphibian communities. Nat. Commun. 2018, 9, 3926. [Google Scholar] [CrossRef] [Green Version]
  38. Myers, N.; Mittermeier, R.A.; Mittermeier, C.G.; da Fonseca, G.A.B.; Kent, J. Biodiversity hotspots for conservation priorities. Nature 2000, 403, 853–858. [Google Scholar] [CrossRef]
  39. Lu, Y.; Yang, Y.; Sun, B.; Yuan, J.; Yu, M.; Stenseth, N.C.; Bullock, J.M.; Obersteiner, M. Spatial variation in biodiversity loss across China under multiple environmental stressors. Sci. Adv. 2021, 6, eabd0952. [Google Scholar] [CrossRef]
  40. Kim, Y.; Kimball, J.S.; Glassy, J.; Du, J. An extended global Earth system data record on daily landscape freeze–thaw status determined from satellite passive microwave remote sensing. Earth Syst. Sci. Data 2017, 9, 133–147. [Google Scholar] [CrossRef] [Green Version]
  41. Riggs, G.; Hall, D. Continuity of MODIS and VIIRS Snow Cover Extent Data Products for Development of an Earth Science Data Record. Remote Sens. 2020, 12, 3781. [Google Scholar] [CrossRef]
  42. Wu, S.; Yang, Q.; Zheng, D. Delineation of eco-geographic regional system of China. J. Geogr. Sci. 2003, 13, 309–315. [Google Scholar]
  43. Hall, D.K.; Riggs, G.; Salomonson, V.; DiGirolamo, N.E.; Bayr, K.J. MODIS snow-cover products. Remote Sens. Environ. 2002, 83, 181–194. [Google Scholar] [CrossRef] [Green Version]
  44. Du, J.; Kimball, J.S.; Jones, L.A.; Kim, Y.; Glassy, J.; Watts, J.D. A global satellite environmental data record derived from AMSR-E and AMSR2 microwave Earth observations. Earth Syst. Sci. Data 2017, 9, 791–808. [Google Scholar] [CrossRef] [Green Version]
  45. Korner, C. The use of ‘altitude’ in ecological research. Trends Ecol. Evol. 2007, 22, 569–574. [Google Scholar] [CrossRef]
  46. Quintero, I.; Jetz, W. Global elevational diversity and diversification of birds. Nature 2018, 555, 246–250. [Google Scholar] [CrossRef]
  47. Zu, K.; Luo, A.; Shrestha, N.; Liu, B.; Wang, Z.; Zhu, X. Altitudinal biodiversity patterns of seed plants along Gongga Mountain in the southeastern Qinghai-Tibetan Plateau. Ecol. Evol. 2019, 9, 9586–9596. [Google Scholar] [CrossRef] [Green Version]
  48. Amatulli, G.; Domisch, S.; Tuanmu, M.N.; Parmentier, B.; Ranipeta, A.; Malczyk, J.; Jetz, W. A suite of global, cross-scale topographic variables for environmental and biodiversity modeling. Sci. Data 2018, 5, 180040. [Google Scholar] [CrossRef] [Green Version]
  49. Jiang, Z.; Ma, Y.; Wu, Y.; Wang, Y.; Zhou, K.; Liu, S.; Feng, Z. China’s Mammal Diversity and Geographic Distribution; Science Press: Beijing, China, 2015. [Google Scholar]
  50. China Wildlife Conservation Association. Atlas of Mammalia of China; Henan Science and Technology Press: Zhengzhou, China, 2005. [Google Scholar]
  51. Smith, A.T.; Xie, Y. A Guide to the Mammals of China; Hunan Education Press: Changsha, China, 2009. [Google Scholar]
  52. Zheng, G. A Checklist on the Classification and Distribution of the Birds of China, 3rd ed.; Science Press: Beijing, China, 2018. [Google Scholar]
  53. Zhao, X. A Photographic Guide to the Birds of China; The Commercial Press: Beijing, China, 2018. [Google Scholar]
  54. Jenkins, C.N.; Pimm, S.L.; Joppa, L.N. Global patterns of terrestrial vertebrate diversity and conservation. Proc. Natl. Acad. Sci. USA 2013, 110, E2602–E2610. [Google Scholar] [CrossRef] [PubMed] [Green Version]
  55. Pimm, S.L.; Jenkins, C.N.; Abell, R.; Brooks, T.M.; Gittleman, J.L.; Joppa, L.N.; Raven, P.H.; Roberts, C.M.; Sexton, J.O. The biodiversity of species and their rates of extinction, distribution, and protection. Science 2014, 344, 1246752. [Google Scholar] [CrossRef] [PubMed]
  56. Wang, K.; Zhang, T.; Guo, H.; Wang, H. Climatology of the Timing and Duration of the Near-Surface Soil Freeze-Thaw Status Across China. Arct. Antarct. Alp. Res. 2018, 48, 723–738. [Google Scholar] [CrossRef] [Green Version]
  57. Ke, C.; Liu, X.; Xie, H.; Ma, D.; Liu, X.; Kou, C. Variability in snow cover phenology in China from 1952 to 2010. Hydrol. Earth Syst. Sci. 2016, 20, 755–770. [Google Scholar] [CrossRef] [Green Version]
  58. Chen, X.; Liang, S.; Cao, Y.; He, T. Distribution, attribution, and radiative forcing of snow cover changes over China from 1982 to 2013. Clim. Chang. 2016, 137, 363–377. [Google Scholar] [CrossRef] [Green Version]
  59. Ma, N.; Yu, K.; Zhang, Y.; Zhai, J.; Zhang, Y.; Zhang, H. Ground observed climatology and trend in snow cover phenology across China with consideration of snow-free breaks. Clim. Dyn. 2020, 55, 2867–2887. [Google Scholar] [CrossRef]
  60. Kim, Y.; Kimball, J.S.; Robinson, D.A.; Derksen, C. New satellite climate data records indicate strong coupling between recent frozen season changes and snow cover over high northern latitudes. Environ. Res. Lett. 2015, 10, 084004. [Google Scholar] [CrossRef] [Green Version]
  61. Somveille, M.; Manica, A.; Rodrigues, A.S.L. Where the wild birds go: Explaining the differences in migratory destinations across terrestrial bird species. Ecography 2018, 42, 225–236. [Google Scholar] [CrossRef] [Green Version]
  62. Shipley, A.A.; Sheriff, M.J.; Pauli, J.N.; Zuckerberg, B. Snow roosting reduces temperature-associated stress in a wintering bird. Oecologia 2019, 190, 309–321. [Google Scholar] [CrossRef]
  63. Buckley, L.B.; Hurlbert, A.H.; Jetz, W. Broad-scale ecological implications of ectothermy and endothermy in changing environments. Glob. Ecol. Biogeogr. 2012, 21, 873–885. [Google Scholar] [CrossRef]
  64. Bennett, J.M.; Sunday, J.; Calosi, P.; Villalobos, F.; Martinez, B.; Molina-Venegas, R.; Araujo, M.B.; Algar, A.C.; Clusella-Trullas, S.; Hawkins, B.A.; et al. The evolution of critical thermal limits of life on Earth. Nat. Commun. 2021, 12, 1198. [Google Scholar] [CrossRef]
  65. Hurlbert, A.H.; Haskell, J.P. The effect of energy and seasonality on avian species richness and community composition. Am. Nat. 2003, 161, 83–97. [Google Scholar] [CrossRef]
  66. Somveille, M.; Rodrigues, A.S.L.; Manica, A. Why do birds migrate? A macroecological perspective. Glob. Ecol. Biogeogr. 2015, 24, 664–674. [Google Scholar] [CrossRef]
  67. Rushing, C.S.; Royle, A.J.; Ziolkowski, D.J., Jr.; Pardieck, K.L. Migratory behavior and winter geography drive differential range shifts of eastern birds in response to recent climate change. Proc. Natl. Acad. Sci. USA 2020, 117, 12897–12903. [Google Scholar] [CrossRef] [PubMed]
  68. Curley, S.R.; Manne, L.L.; Veit, R.R.; Zhan, A. Differential winter and breeding range shifts: Implications for avian migration distances. Divers. Distrib. 2020, 26, 415–425. [Google Scholar] [CrossRef]
  69. Zuckerberg, B.; Pauli, J.N. Conserving and managing the subnivium. Conserv. Biol. 2018, 32, 774–781. [Google Scholar] [CrossRef]
Figure 1. Geographical features of study area.
Remotesensing 14 00794 g001
Figure 2. Flowchart showing data processing procedures to derive the winter habitat indices based on remote sensing products.
Remotesensing 14 00794 g002
Figure 3. Spatial patterns of species richness for different groups across China. (a) Mammal species richness; (b) winter bird species richness; (c) summer bird species richness; (d) resident bird species richness. Numbers indicate eco-geographic regions of China: I—Cold temperate zone; II—Humid/semi-humid medium temperate zone; III—Semi-arid medium and warm temperate zone; IV—Humid/semi-humid warm temperate zone; V—North subtropical zone; VI—Middle subtropical zone; VII—South subtropical zone; VIII—Tropical zone; IX—Arid medium and warm temperate zone; X—Tibetan Plateau zone.
Remotesensing 14 00794 g003
Figure 4. Spatial patterns of remotely sensed winter habitat indices across China. (a) Winter season length; (b) snow cover duration; (c) frequency of snow-free frozen ground; (d) snow variability. Numbers indicate eco-geographic regions of China: I—Cold temperate zone; II—Humid/semi-humid medium temperate zone; III—Semi-arid medium and warm temperate zone; IV—Humid/semi-humid warm temperate zone; V—North subtropical zone; VI—Middle subtropical zone; VII—South subtropical zone; VIII—Tropical zone; IX—Arid medium and warm temperate zone; X—Tibetan Plateau zone.
Remotesensing 14 00794 g004
Figure 5. Correlations between remote sensing derived indices and 19 WorldClim bioclimatic variables to show how winter habitat indices (WinterL, Dsc, Dnsc, and SnowVar) represent environmental information that potentially impacts species richness. The blank grids indicate insignificant Spearman’s correlation coefficients at the significance level of 0.001.
Remotesensing 14 00794 g005
Figure 6. Comparison of explanatory power between full models with winter habitat indices and reduced models. The formula of full model with winter habitat indices is richness~dem+cumDHI+minDHI+varDHI+WinterL+Dnsc+SnowVar); the reduced model without winter habitat indices is richness~dem+cumDHI+minDHI+varDHI). The goodness of fit is measured by deviance from generalized linear model. The ANOVA method is used to compare the two models, and the “*” sign indicates that the full model shows a significant increase in the explanatory power according to the chi-squared test. Remotely sensing winter habitat indices increase the goodness of fit for models of all groups.
Remotesensing 14 00794 g006
Figure 7. Contributions of winter habitat indices to the explained variance for different groups. (a) Mammals; (b) Resident birds; (c) Summer birds; (d) Winter birds.
Remotesensing 14 00794 g007
Table 1. Description of variables used in our study.
VariableDescriptionSource
Winter lengthDays between start and end of frozen seasonGenerated by authors
Snow cover durationDays when ground is frozen and covered by snowpackGenerated by authors
Frequency of snow-free frozen groundRatio of days with snow-free and frozen ground to winter season lengthGenerated by authors
Snow variabilityRatio of transitions from snow (no snow) to no snow (snow) to winter season lengthGenerated by authors
Cumulative DHISum of fPAR values of a yearSILVIS Lab: http://silvis.forest.wisc.edu/data/dhis/ (accessed on 3 February 2022)
Minimum DHIMinimum fPAR value of the phenological curve of a yearSILVIS Lab: http://silvis.forest.wisc.edu/data/dhis/ (accessed on 3 February 2022)
Variation DHICoefficient of variation of the fPAR values over the course of a yearSILVIS Lab: http://silvis.forest.wisc.edu/data/dhis/ (accessed on 3 February 2022)
DEMElevationWorldClim: https://worldclim.org/data/index.html (accessed on 3 February 2022)
Bioclimatic variablesIncludes 19 biologically meaningful variables, which represent annual trends, seasonality, and extreme or limiting environmental conditionsWorldClim: https://worldclim.org/data/index.html (accessed on 3 February 2022)
Publisher’s Note: MDPI stays neutral with regard to jurisdictional claims in published maps and institutional affiliations.

