Article

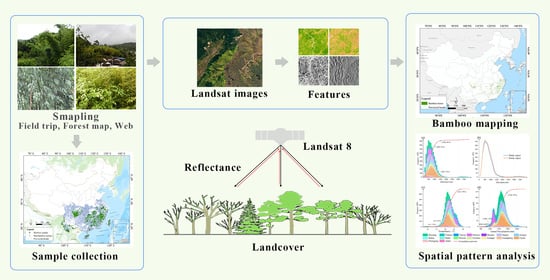
Bamboo Forest Mapping in China Using the Dense Landsat 8 Image Archive and Google Earth Engine

1
Key Laboratory of Poyang Lake Wetland and Watershed Research (Ministry of Education), School of Geography and Environment, Jiangxi Normal University, Nanchang 330022, China
2
School of Geospatial Engineering and Science, Sun Yat-sen University, Zhuhai 510275, China
3
Department of Earth Sciences, The University of Hong Kong, Pokfulam, Hong Kong 999077, China
4
Ministry of Education Key Laboratory for Earth System Modeling, Department of Earth System Science, Tsinghua University, Beijing 100084, China
*
Author to whom correspondence should be addressed.
Shuhua Qi and Bin Song contributed equally to this paper and share first authorship.
Remote Sens. 2022, 14(3), 762; https://doi.org/10.3390/rs14030762
Submission received: 2 December 2021 / Revised: 17 January 2022 / Accepted: 21 January 2022 / Published: 7 February 2022

Abstract

:
It is of great significance to understand the extent and distribution of bamboo for its valuable ecological services and economic benefits. However, it is challenging to map bamboo using remote sensing images over a large area because of the similarity between bamboo and other vegetation types, the availability of clear optical images, huge workload of image processing, and sample collection. In this study, we use the Landsat 8 times series images archive to map bamboo forests in China via the Google Earth engine. Several spectral indices were calculated and used as classification features, including the normalized difference vegetation index (NDVI), the normalized difference moisture index (NDMI) and textural features of the gray-level co-occurrence matrix (GLCM). We found that the bamboo forest covered an area of 709.92 × 10⁴ hectares, with the provinces of Fujian, Jiangxi, and Zhejiang containing the largest area concentrations. The bamboo forest map was accurate and reliable with an average producer’s accuracy of 89.97%, user’s accuracy of 78.45% and kappa coefficient of 0.7789. In addition, bamboo was mainly distributed in forests with an elevation of 300–1200 m above sea level, average annual precipitation of 1200–1500 mm and average day land surface temperature of 19–25 °C. The NDMI is particularly useful in differentiating bamboo from other vegetation because of the clear difference in canopy moisture content, whilst NDVI and elevation are also helpful to improve the bamboo classification accuracy. The bamboo forest map will be helpful for bamboo forest industry planning and could be used for evaluating the ecological service of the bamboo forest.

Graphical Abstract

1. Introduction

Bamboos (family: Poaceae; sub-family: Bambusoideae) are woody grasses found in regions with a tropical and subtropical climate. The global bamboo area is about 2200 × 104 hectares, mainly distributed in Asia, Latin America and Africa [1]. China is the leading producer of bamboo in the world. The bamboo forest area in China was 641.2 × 10⁴ hectares according to the China’s Eighth Inventory of Forest Resources (CEIFR) carried out in 2014–2018 [2,3]. More than 500 species of bamboo in 39 genera are found in China, accounting for nearly half of the bamboo species of the world [4]. The distribution of bamboo is affected by the water and thermal spatial patterns and it is mainly grown in the 16 provinces located to the south of the Qinling–Huaihe line in China.
Bamboo can provide numerous ecological and economic benefits and advantages. It provides shelter and food for some endangered animals, such as the giant panda of China [5,6,7]. Additionally, bamboo forests can be a significant carbon sink [8,9,10,11], which can assist with climate change mitigation [12] and environmental restoration [13,14,15,16]. Bamboo-based industries provide significant employment opportunities and contribute to economic development and poverty alleviation due to the remarkable growth rate of bamboo and its versatility [17]. Therefore, the accurate mapping of bamboo forest is critical for bamboo-based industry planning, bamboo resource managing, ecological protection, economic growth, and other factors.
Due to the wide distribution of bamboo in China, distribution mapping by field surveys would be laborious and time consuming. Remote sensing technology is often used for land cover and terrestrial environment mapping and monitoring because of its inherent advantages of real-time, large-area, and repeatable observations [18,19,20,21,22]. Extensive efforts have also been employed to map bamboo in various ecosystems [23,24,25]. However, it is much more difficult to detect mixed bamboo with other canopy vegetation and shrubbery bamboo in the understory layer [26]. The availability of clear optical images is often low due to the cloudy and rainy climate of tropical and subtropical areas [27]. Bamboo mapping over large regions need an extensive workload of image preprocessing.
Bamboo mapping can be improved when using satellite images of fine spatial resolution. For example, the accuracy of bamboo mapping with IKONOS or SPOT5 images can be greater than 90% [25,28,29], but the mapping extent was limited to the image frame. Bamboo mapping with Landsat images can often allow an accuracy greater than 80% [20,30,31,32]. However, it is also a challenging task to map bamboo with remote sensing images for a large area such as China because of the spectral similarity with other vegetation types [27]. It was demonstrated that the phenological characteristics revealed by the multi temporal spectral vegetation index can improve the recognition of bamboo forests [33,34]. The phenological indices was even successfully used for mapping understory bamboo [35,36]. However, bamboo mapping with multi-phase satellite images could be limited by the computational capability especially for a personal computer. Open-access Landsat images analyzed in the Google Earth engine (GEE) platform [37] have made it possible to map bamboo forest over a larger region. Provincial-scale bamboo mapping has been successful for the province of Fujian [38] and Hainan [39] in China with phenological characteristics derived from Landsat time series images based on GEE. National-level bamboo mapping in Ethiopia, Kenya, and Uganda in East Africa has also been performed using the GEE platform [40].
Samples were collected from field trips traditionally. It is very time consuming, laborious, and costly especially for a large-scale region. Therefore, sample collection by visual interpretation from images with higher spatial resolution were also widely accepted in land use/cover classification [41,42]. Moreover, the achieved data created by the surveying department also could be used as the source of samples such as the forest resource inventory dataset. Since the archived data record the past state, it is absolutely necessary to determine the correctness of the archived-source samples by visual comparison with high-resolution satellite images.
Several classification algorithms, including support vector model (SVM) [43], artificial neural networks (ANN) [44] and random forest (RF) [45], have been used for bamboo mapping successfully. However, the SVM consumes a lot of machine memory and computing time when handling multi-dimensional features for classification, and it is difficult to select certain parameters, such as the kernel function [46,47]. While ANNs are still in the development stage and is hard to use and to optimize because of the time-consuming parameter tuning procedure, there are numerous types of neural network architectures to choose from and a high number of algorithms used for training [48]. Therefore, these shortcomings make it difficult for ANNs to be applied to the classification of province-by-province strategy in this study, which is also the main reason for less classification research using the artificial neural network.
RF is a robust algorithm deriving reliable predictions based on the voting of n decision trees, which can effectively overcome the overfitting problem. After model training, it also provides an importance score for each feature, which can be used for feature ranking and selection [49]. RF was widely used in land cover mapping and monitoring because of its obvious advantages in processing high-dimensional data [50,51,52,53].
Based on our experience of bamboo mapping in the Fujian and Hainan Provinces in the past [38,39], bamboo mapping in China is carried out province by province using the RF algorithm with the Landsat 8 times series images archive and the GEE platform. The bamboo forest spatial pattern is analyzed quantitatively according to the differential of temperature, elevation, precipitation and aspect in China. This work may be helpful for bamboo forest industry planning and rural revitalization, and is of great significance for the quantitative evaluation of the ecological service of the bamboo forest ecosystem. Additionally, it will reveal the influence of hydrothermal factors on the spatial distribution pattern of bamboo forests quantitatively.

2. Study Area

China is located on the east coast of Eurasia (73°33′ E to 135°05′ E, 3°51′ N to 53°33′ N), facing the world’s largest ocean and back to the world’s largest continent. From coast to inland, climate types evolve from humid to arid climate. Influenced by the latitude of solar radiation, there are three climatic zones including tropical, subtropical and temperate from south to north in China. China’s terrain is high in the west and low in the east. There are numerous mountains running east–west and north–south and leading to the diversity of regional climate. The diverse climate types in China contribute to the diversity of habitats and provide a diverse environment for the growth of vegetation. This is also an important reason for the diversity of bamboo species in China. China is one of the richest countries in terms of bamboo coverage and diversity. Of the over 500 bamboo species found in China, moso bamboo (phyllostachys pubescen) is the most abundant one, occupying 72.96% of the nationwide bamboo area [2]. According to China’s Ninth Inventory of Forest Resources (CNIFR), there are about 641.2 × 10⁴ hectares of bamboo forest area in China, mainly distributed in 16 provinces (including Fujian, Jiangxi, Zhejiang, Hunan, Hubei, Guangdong, Guangxi, Yunnan, Guizhou, Sichuan, Chongqing, Shanxi, Hainan, Taiwan, Anhui, and Jiangsu) located at the south area of the Qinling–Huaihe Line known as the isothermal line of 0 °C in winter and 800 mm annual isoprecipitation line (Figure 1). Although there are some shrubbery bamboo forests growing in the southern Tibet Autonomous Region and at the southern foot of the Himalayas, they are not even recorded in CNIFR due to the very small number. Therefore, bamboo mapping for China was carried out province by province only for the 16 provinces framed by blue lines showed in Figure 1.

3. Materials and Methods

The flowchart of our bamboo mapping methods is shown in Figure 2, which includes data preparation, sample collection, feature selection, image classification, and accuracy assessment.

3.1. Sample Collection

Samples were collected from field trips (FT), forest resources inventory (FRI), and plantation forest maps (PFM).
Field trips for collecting samples were carried out in the Jiangxi, Zhejiang, Hainan, and Yunnan Provinces. Firstly, we went to the provincial forestry department to learn about the distribution of the bamboo forest. Then, bamboo patches greater than 30 m × 30 m were selected as samples for training or validating in the field trip, and GPS locator was used for recording the position. We also collected non-bamboo samples of the broad-leaved forest and coniferous forest for training.
China’s Inventory of Forest Resources has been conducted every five years in China since 1973. The forest resource database created by the Inventory of Forest Resources records detailed forest patch information, including dominant tree species, number, canopy height, etc. We obtained the forest resource database for the provinces of Jiangxi, Fujian, Guangdong, Yunnan, and Sichuan. The database was created in China’s Eighth Inventory of Forest Resources (CEIFR), finished in 2013. The pure bamboo patches with coverage greater than 60% and area greater than 900 m2 were selected as samples. All the selected samples unsuitable for training or validation were carefully screened from the dataset by the visual interpretation of high-resolution images on Google Earth to consider land cover changes caused by human activities.
The vectorized plantation dataset established by plantation survey during 1999–2003 was also used for bamboo forest mapping. The bamboo samples were also confirmed by visual interpretation from high resolution images on Google Earth. Additionally, a web-source natural plant survey dataset for the Taiwan Province (https://if.forest.gov.tw/landcover/index.html, accessed data: 3 November 2021) was employed. It was finished by the Forth Forest resources survey in the Taiwan Province in 2015.
We did not obtained the forest resource database created by the Inventory of Forest Resources for the Shaanxi Province and no bamboo patch was recorded in the plantation dataset. The bamboo forests in the Shaanxi Province are mainly distributed in southern Shaanxi, near the Sichuan Province. The bamboo species and morphology in the Sichuan Province are very similar to those in the Sichuan Province. Therefore, bamboo forest mapping for the Shanxi Province was conducted together with the Sichuan Province.
Samples for training and validating from FT, FRI, PFM and Web were totaled as 21,610 samples (5389 bamboo samples and 16,221 non-bamboo forest samples) were collected. The details of the final sample dataset and its spatial distribution are shown in Table 1 and Figure 3.

3.2. Data Preparation

(1) Shuttle Radar Topography Mission
The Shuttle Radar Topography Mission Version 3.0 (SRTM V3) [54] uses the radar interferometry technique to obtain the most complete near-global high-resolution database of the Earth’s topography. It is publicly available on the GEE platform (Collection snippet: “USGS/SRTMGL1_003”) with a resolution of 1 arc second (about 30 m) provided by NASA’s Jet Propulsion Laboratory (JPL). The SRTM V3 digital elevation model (DEM) was used as one of the features for classification. In addition, the aspect was produced from the DEM and was divided into shady aspect (0–90 degrees and 270–360 degrees) and sunny aspect (90–270 degrees) [55]. The elevation and aspect were used to analyze the topographical features of the bamboo forest in China.
(2) Average annual precipitation
A monthly average precipitation with a 1 km resolution during 1 January 2017 and 1 January 2019 provided by EnvirometriX Ltd. is available on the GEE platform (Collection snippet: “OpenLandMap/CLM/CLM_PRECIPITATION_SM2RAIN_M/v01”) [56]. The monthly average precipitation was estimated as a weighted average with SM2RAIN-ASCAT 2007-2018, IMERG, CHELSA Climate, and WorldClim. A 3× higher weight was given to the SM2RAIN-ASCAT data since it assumed to be the most accurate. The monthly average precipitation was accumulated as the annual average precipitation (AAP). The AAP was used to analyze the water condition characteristics of the bamboo forest in China.
(3) Land surface temperature
The MOD11A1.006 terra land surface temperature and emissivity daily global 1km dataset provided by the NASA LP DAAC at the USGS EROS Center were derived from the MOD11_L2 swath product. It has been available since 5 March 2002 and present in the GEE platform (Collection snippet: “MODIS/006/MOD11A1”) [57]. All available LST images in this collection were used for generating the average diurnal LST based on the GEE platform. The average diurnal LST was primarily used to analyze the temperature characteristics of the spatial distribution of bamboo forests.

3.3. Image Pre-Processing and Feature Selection

Landsat 8 is the eighth satellite of the US Landsat program and it is loaded with an operational land imager (OLI) and a thermal infrared sensor (TIRS). Landsat 8 (30 m) images with high spatial resolution and nice quality are widely used for land cover mapping and monitoring [58,59]. The spectral band details of Landsat 8 OLI sensor are shown in Table 2.
All available Landsat 8 surface reflectance images between 2014 and 2016 were collected as a primary data source. The detail of Landsat images used for bamboo mapping is shown in Table 3. These images were atmospherically corrected using the LaSRC algorithm, which includes a cloud, shadow, water and snow mask produced using the CFMASK algorithm [60,61], as well as a per-pixel saturation mask. The band of pixel_qa provided by GEE referring to pixel quality attributes generated from the CFMASK algorithm were used to remove cloudy pixels in each image. The cloud-free images were used to generate vegetation phenological indices.
The best-available-pixel (BAP) compositing can effectively reduce the impacts of clouds, aerosol contamination, and data volumes on satellite image application [62,63]. Therefore, a pixel-level composite strategy was employed here to composite the cloud-free images. A quality score band was calculated. We first calculated the mean square deviation (MSD) of all pixels in 6 bands (B2 to B7) for each scene image. The sum of MSD of all bands at each pixel expressed as the quality score (smaller MSD should be better). The pixels with the largest quality scores were included (gap filling) in the final composited image.
Chinese bamboo forests are mainly distributed in the tropical (including the Provinces of Hainan, Yunnan and Taiwan) and subtropical monsoon climate zone (the remaining area of 16 provinces). It is difficult to discriminate bamboo from other vegetation types only using spectral reflectance due to the spectral similarity [26]. The normalized difference vegetation index (NDVI) [64] quantifies vegetation by measuring the difference between near-infrared band and red band, which is widely used for bamboo mapping:
NDVI = ρ NIR ρ red ρ NIR + ρ red
where ρ red and ρ NIR refer to the B4 and B5 in Table 2, respectively. The normalized difference moisture index (NDMI) [65] was also employed, which can effectively quantify the water content of vegetation canopy. It can improve the accuracy of bamboo mapping because of the leaf water content difference between bamboo and other vegetation types. Additionally, using the metrics of vegetation indices to simulate the vegetation phenological changes can also improve the accuracy of bamboo mapping.
NDMI = ρ NIR ρ MIR ρ NIR + ρ MIR
where ρ NIR and ρ MIR are B5 and B6 in Table 2, respectively.
Considering the high accuracy of the previous bamboo forest map for the Hainan Province [39], the result was directly adopted for the Hainan province. The features for bamboo mapping for the remaining 15 provinces include spectral reflectance, phenological indices, textural features and topographic elevation, as shown in Table 4. Phenological indices include the maximum, minimum, mean, and standard deviation of NDVI and NDMI based on the cloud-free images. Textural features, including homogeneity, contrast, entropy, and variance of gray level co-occurrence matrix (GLCM), were derived from the first component image from a principal component analysis (PCA) [66,67,68] with the B2 to B7 of the composited image. GLCM was calculated using a 9 × 9 window and an azimuth angle of 45° and was expressed as 64-level grayscale.

3.4. Classification and Validation

The random forest classifier (RFC) is an ensemble machine learning approach that generates a series of classification trees using bootstrap samples from training data [45]. RFC can handle high-dimensional data, overcomes the overfitting problem and scores the features’ importance [48,51,52]. An “importance score” for each feature allows for the ranking and selection of variables with greater discriminatory power [63].
Due to the different sample sources and bamboo species among the provinces, the user storage space provided by the GEE is limited. The distribution of bamboo species overlaps spatially. It is difficult for us to obtain a clear spatial distribution boundary between bamboo species. Based on the above reasons, a province-by-province strategy was adopted. Although the administrative boundary is certainly different from the boundary of species distribution, it can alleviate the challenge of the variation of classification characteristics caused by the diversity of bamboo varieties.
The number of prediction variables equals to the square root of the number of total input variables. Generally, as the increase in the number of trees, the classification accuracy continues to be improved, but when the number is greater than a certain value, the classification performance tends to be stable. Through the experiment using the exhaustive method, we find that the RFC models of 16 provinces have a high classification accuracy and stable performance when the number of trees is set to 200. The number of trees was set to 500 for better stability.
A k-fold (k = 50) cross validation was conducted to evaluate the classification accuracy, which is popular for evaluating the performance of classification algorithms [69,70]. The sample set was randomly split into 50 sample subsets. A total of 1 sample subset was chosen for validation and the remaining 49 were used for training. This procedure was repeated 50 times and the average results of the accuracy assessments were adopted for mapping evaluation. The producer’s accuracy (PA), user’s accuracy (UA), overall accuracy (OA) and kappa coefficient [71] were used as four metrics of accuracy evaluation. The best classification performance of k-fold was used for mapping bamboo.
In addition, the bamboo forest area detected from satellite images were compared with the reference data from the SNIFR [2] and the fourth forest inventory (https://if.forest.gov.tw/landcover/index.html, accessed data: 3 November 2021) for the Taiwan Province, China.

3.5. Feature Importance Scoring

Feature importance was evaluated by the contribution of each feature in the classification [72,73]. Features’ contribution can effectively reveal the difference between bamboo and other types of vegetation. The importance of all features (except the bands of composited image) was detected, while the features used in the Hainan Province was not included because of the lack of representativeness. The feature importance provided by the RFC was collected from the best performance of k-fold for each province, and the average of scores was adopted. The final feature importance result was normalized based on the average scores.

3.6. Analysis of Bamboo Spatial Distribution Patterns

Influenced by the spatial heterogeneity of water and energy, bamboo forests have a unique spatial pattern [3]. The elevation, precipitation and LST were used for analyzing the bamboo forest spatial patterns. Based on the ArcMap 10.2, the satellite-derived bamboo grids were converted into points using the tool of “raster to point”. The four metrics information of all bamboo points were extracted based on the tool of “extract values to points”.

4. Results

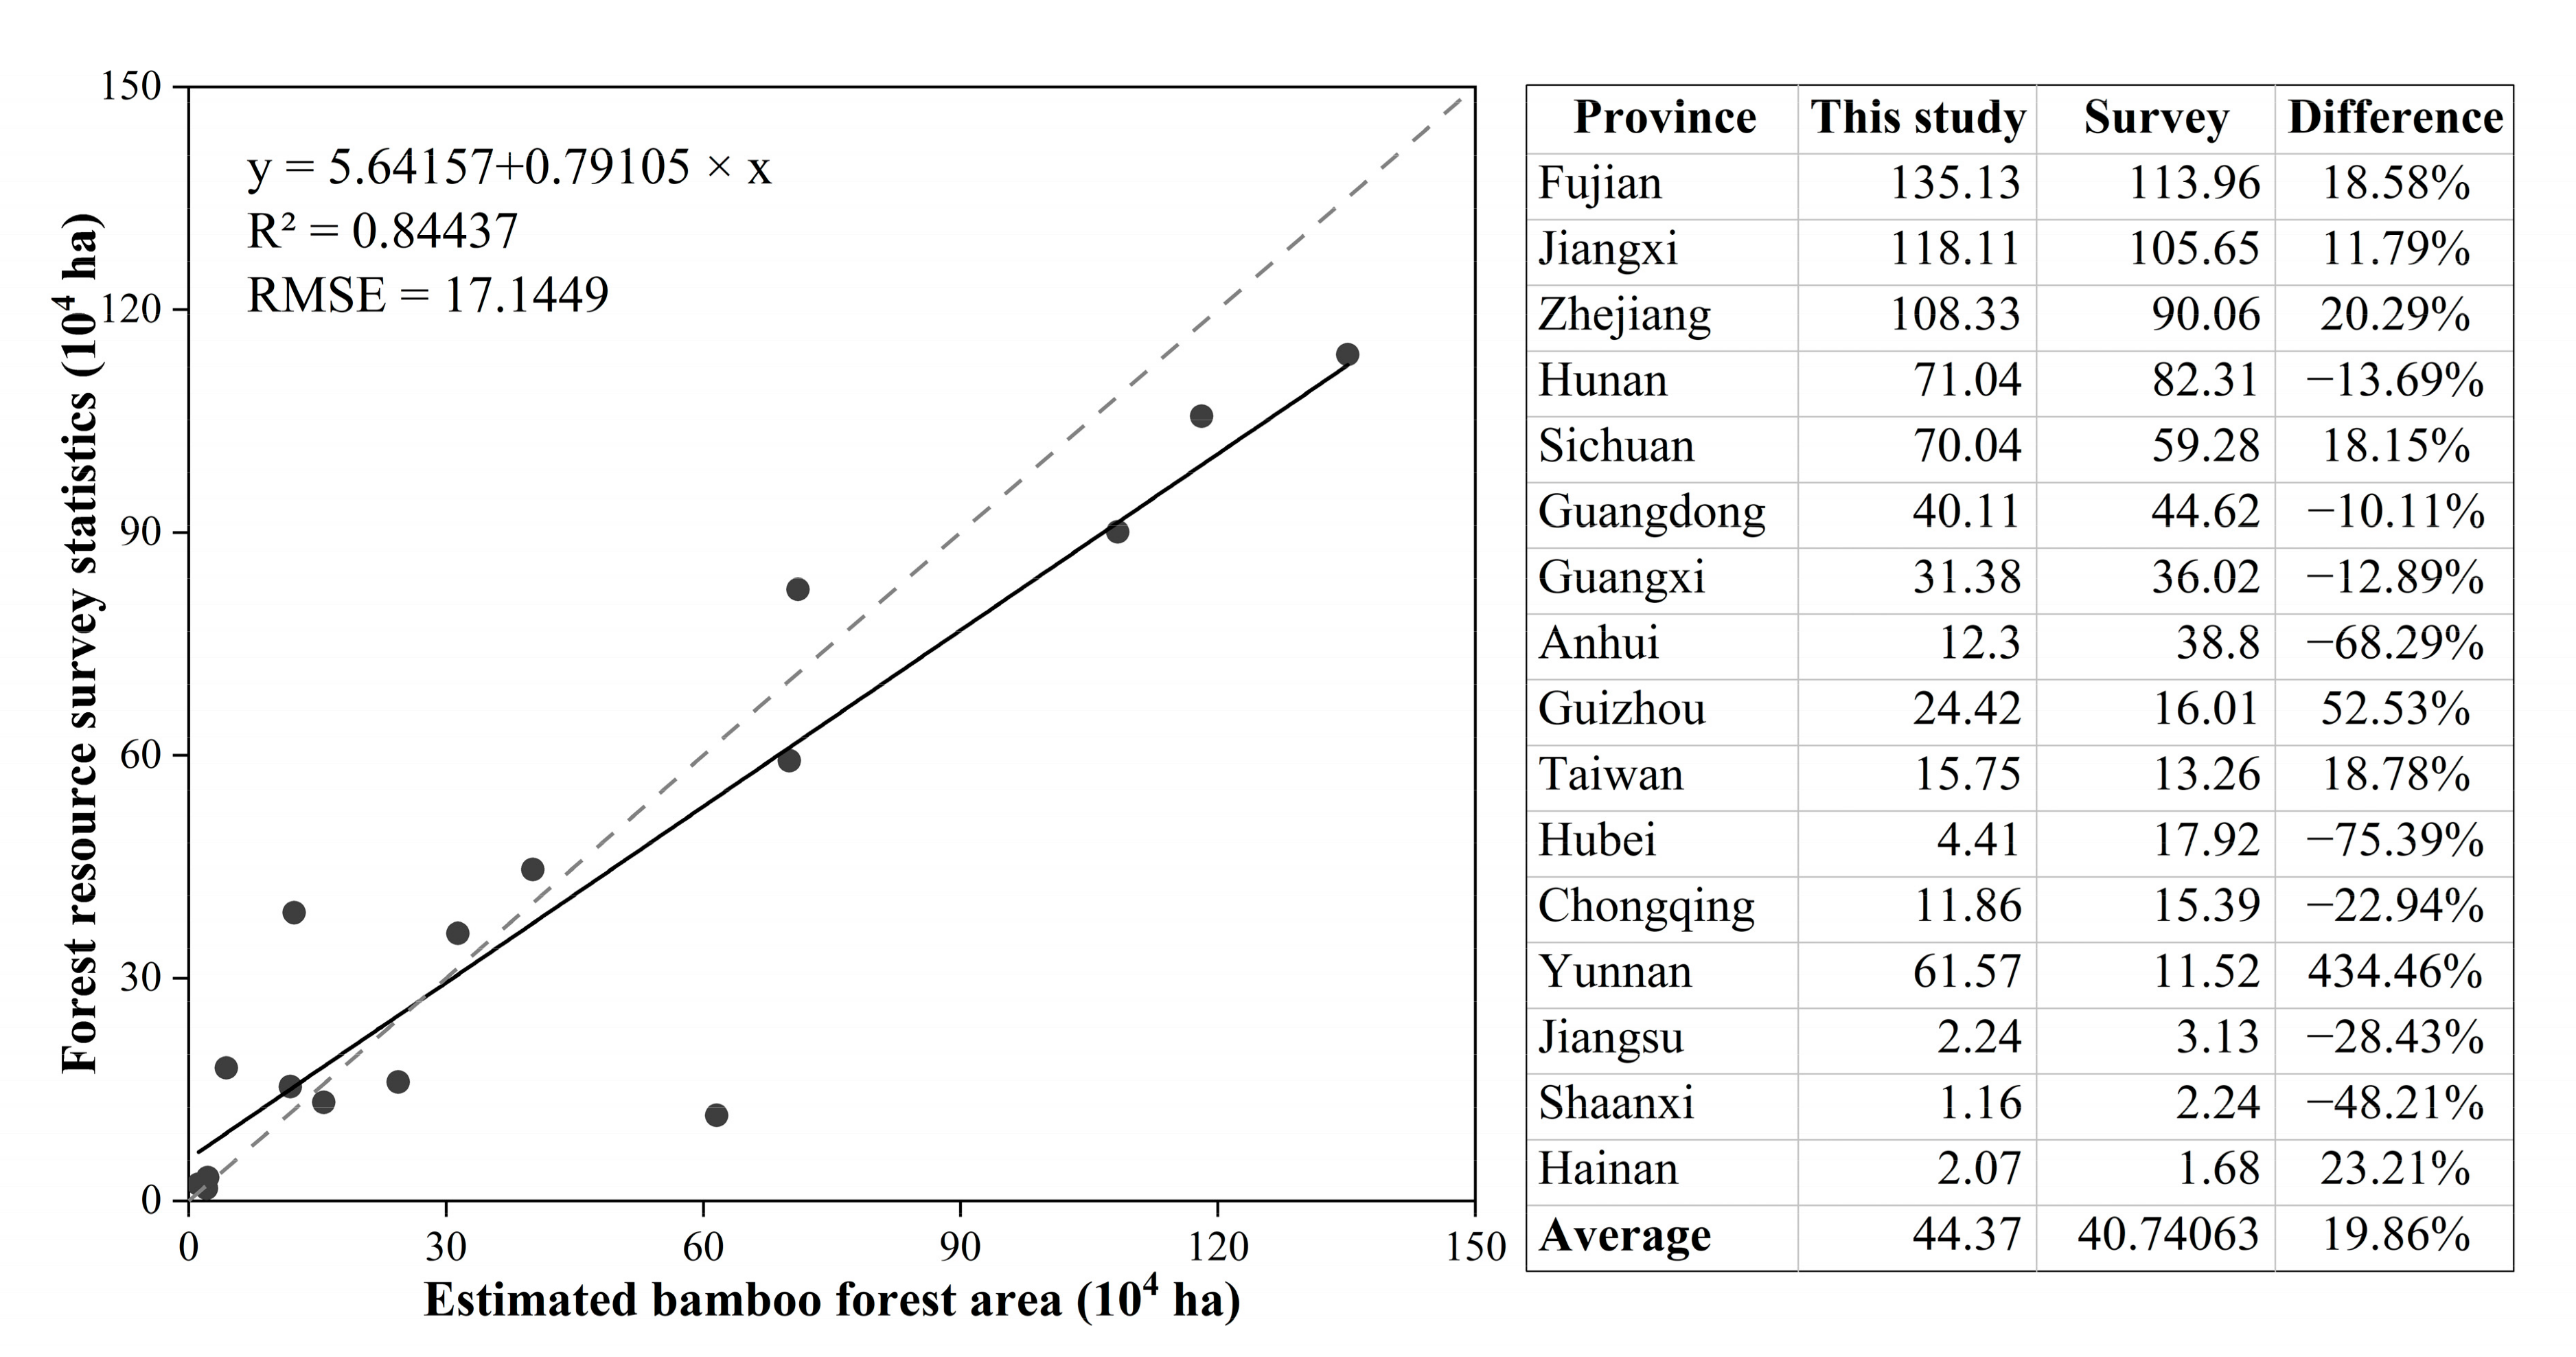
4.1. Distribution of Bamboo Forest

The bamboo forest map for China was produced using the random forest algorithm using Landsat 8 satellite images based on the GEE platform (Figure 4 and Figure 5). The total area of bamboo forests was estimated to be 709.92 × 10⁴ hectares, including the largest area in Fujian (135.13 × 10⁴ hectares), Jiangxi (118.11 × 10⁴ hectares) and Zhejiang (108.33 × 10⁴ hectares). The total bamboo forest area in the top three provinces account for more than 50% of the whole country. The area of bamboo forest in the top five provinces (Fujian, Jiangxi, Zhejiang, Hunan, and Sichuan provinces) account for more than 70% of the total area. Bamboo forests are concentrated in the southeast (Fujian, Jiangxi, Zhejiang and Hunan) and southwest regions (Sichuan, Yunnan) of China.

4.2. Classification Accuracy Assessment

The classification accuracy assessment was performed using the average result of UA, PA, OA and kappa for each k-fold (Table 5). The bamboo forest mapping of China was reasonable with a mean precision of 0.7789 in kappa, 93.74% in OA, 89.97% in PA, and 78.45% in UA. The classification accuracy for seven provinces (Jiangxi, Zhejiang, Anhui, Guizhou, Taiwan, Hubei, and Jiangsu) is highly accurate, with a PA, UA, and kappa coefficient greater than 0.8. The classification accuracy for five provinces (Hainan, Hunan, Yunnan, Fujian, and Guangxi) is moderately accurate with parameters greater than 0.6. However, the UA value for the remaining four provinces (Sichuan, Guangdong, Chongqing and Shaanxi) is less than 0.6, but the PA and kappa coefficient for these four provinces are higher. The classification accuracy with a higher PA and OA but lower UA indicates that some non-bamboo was incorrectly classified as bamboo. The main reason may be that the bamboo forest patches used as training samples were too small resulting in the lack of representativeness.
The remotely sensed bamboo forest area for the 16 bamboo-containing provinces was compared with the reference data from CNIFR (Figure 6), showing that the extracted bamboo is essentially consistent with the reference data. However, there are obvious inconsistencies seen in the Yunnan province, as the area of extracted bamboo is much greater than that of the reference data. However, some studies also revealed that the bamboo forest area was greater than 35 × 104 hectares in the Yunnan Province [3,74,75]. The gap may be mainly caused by the significantly underestimated in the forest resource inventory by the forestry administration department. In addition, there are more than 250 bamboo species, including scattered, tufted, and mixed bamboo, growing in the Yunnan Province [1]. The morphological diversity of bamboo species and the complexity of the topography where bamboo grows significantly increased the difficulty of bamboo extraction from remote sensing images. The bamboo area was underestimated for the Anhui and Hubei Provinces in this study, which may be related to the accuracy of the plantation forest map and its visual interpretation.

4.3. Environmental Characteristics of the Spatial Distribution of Bamboo Forests

4.3.1. Topological Characteristics of Bamboo Forests

An overlaying analysis of the elevation and the bamboo forest map shows that bamboo forests are mainly distributed in an elevation range of 200 m to 1200 m (Figure 7a). Bamboo forests below 1000 m account for more than 80% of the total area. Most bamboo provinces, including Fujian, Zhejiang, Jiangsu, Jiangxi, Hunan, Hubei, Anhui, Guangdong, Guangxi, Hainan and Taiwan, are low mountainous and hilly landforms. The bamboo in the Sichuan, Chongqing, Guizhou and Shaanxi Provinces is mainly grown in the Sichuan Basin where the elevation ranges from 300 to 700 m. Influenced by human activities, such as reclamation, bamboo forest grows less in regions with an elevation lower than 200 m. Highland bamboo forests were also found in the Yunnan province. The limited elevation range of the distribution of bamboo forests is due to temperature decreasing as elevation increases [76,77].
The overlaying analyses of aspect of the bamboo forest map found that the bamboo forest area in a shady aspect was less than that in the sunny aspect when the elevation was greater than 500 m, but the difference between the sunny and shady aspect for the region with an elevation lower than 500 m was not obvious (Figure 7b). This is mostly caused by differences in solar radiation. Differences in solar radiation regarding the sunny and shady aspects are more pronounced at higher altitudes [78].

4.3.2. Hydrothermal Characteristics of the Bamboo Forest

An overlaying analysis of the AAP and the bamboo forest map revealed that bamboo grows in moisture areas with an APP that ranges from 1200 mm to 2000 mm (Figure 7c). The histogram of the bamboo forest distribution with AAP shows a bimodal form. The first peak is mainly composed of bamboo forests in Yunnan, Sichuan and Chongqing with an AAP less than 1400 mm. Cloudy and foggy climate in the Sichuan basin allows for relatively little evapotranspiration loss and soil moisture is suitable for bamboo forests that meet the growth requirements of bamboo. The second peak is mainly composed of bamboo forests in Fujian, Guangdong, Guangxi, Hunan, Jiangxi, and Zhejiang. These provinces are rich in precipitation affected by subtropical monsoons. Therefore, precipitation has a great impact on the distribution of bamboo, and bamboo is difficult to grow in areas with an annual precipitation less than 800 mm.
The overlaying bamboo map with the day LST (Figure 7d) revealed that the bamboo forest was mainly distributed in regions with an average day LST range of 19 °C to 25 °C. A very small number of bamboo forests are distributed in areas with an average day LST below 15 °C.

4.4. Feature Importance

The importance scores for each feature (excluding the spectral reflectance of the composite images) shown in Table 4 was expressed as a histogram (Figure 8a). The importance scores for maximum NDMI, mean NDMI, maximum NDVI, elevation, and mean NDVI are the highest metrics. NDMI was the most helpful phenological feature for bamboo identification, which may be related to the fact that the water content of bamboo leaves is significantly lower than that of other vegetation in winter and spring [25]. The maximum NDVI performed better than other NDVI metrics, indicating that the differentiation between bamboo and other vegetation is more obvious during the growing seasons. It may be related to the fact that NDVI is sensitive to changes in precipitation and temperature [79,80]. Additionally, elevation was ranked fourth in the importance score [25]. GLCM metrics are also helpful to improve the classification accuracy of bamboo mapping. Homogeneity performed better than the other three metrics of GLCM.
The difference in importance score for every feature between 15 provinces was analyzed (Figure 8b). The importance score of elevation has the largest provincial difference. The importance score of elevation is low in provinces with little change in topographic elevation. The importance score of maximum NDMI has the smallest provincial difference. NDMI was considered the most important feature in bamboo detection, although the maximum NDVI in the Anhui and Jiangsu Provinces and the elevation in the Yunnan Province achieved the highest importance score.

5. Discussion

Bamboo forest mapping in China with satellite images of 30 m spatial resolution was an unprecedented job with great amounts of sample collection, thousands of images to process and the need of supercomputer capabilities. It was an impossible task for a personal computer. In this study, the bamboo forest mapping was finished with multi-sourced multi-source samples, images and operating environment provided by the GEE platform. The bamboo forest map in China was reliable and consistent with the reference data from CNIFR for most provinces. The coverage of bamboo forests in China was estimated to be 709.92 × 10⁴ hectares and was greater than that of CNIFR.
The spatial pattern of bamboo forests is dominated by water and solar radiation heat, which is characterized as latitudinal zonality and shaped by topographic elevation. Therefore, bamboo forests in China are distributed at a certain elevation zone (300~1200 m), day LST zone (19~25 °C) and AAP zone (1200~2000 mm). Bamboo forests at higher altitudes are mainly scrub and dwarf varieties. It was reported that bamboo forests are expanding under climate warming [77,81]. The bimodal histogram of the bamboo forest distribution with AAP reveals that the bamboo forests of China can be divided into 2 major groups: the southwest region (including Yunnan, Sichuan, and Chongqing) with an AAP less than 1400 mm, and the other 13 provinces with an AAP greater than 1500 mm. The results are generally consistent with a previous study [4].
Sample collection is challenging for bamboo mapping on a countrywide scale and the quality of samples had a significant effect on the classification results. A more convenient method is to make full use of the databases established by forest resource surveys organized by the forestry departments. All the samples obtained from the forest resources inventory need to be confirmed with satellite images with higher spatial resolution considering the land cover changes due to human activities or natural disasters. Moreover, the bamboo sample dataset should be expanded to improve the recognition accuracy of all kinds of bamboo species.
Feature selection was also important for bamboo detection, due to the spectral similarity between bamboo and other forest types. Phenological indices can greatly improve the discrimination. The “importance score” shows that NDMI was the most helpful feature for bamboo identification, which may be related to the fact that the water content of bamboo leaves is generally lower than that of other vegetation [82]. NDVI and elevation were also helpful to bamboo mapping.
More than 500 species of bamboo are found in China, including scattered, tufted, and mixed bamboo. Some bamboo patches are too small and fragmented to identify using 30 m spatial resolution Landsat 8 imagery. The morphological diversity of bamboo species and the complexity of the topography where bamboo grows significantly increases the difficulty of bamboo extraction from remote sensing images. It is much more difficult to detect bamboo mixed with other canopy or shrubbery bamboo, which grows in the understory layer. In a future study, higher-resolution satellite images, such as Sentinel, could be potential image sources for bamboo mapping.

6. Conclusions

In this study, we successfully produced a bamboo forest map for China using Landsat 8 time series images and the experience of bamboo mapping for the Fujian [38] and Hainan Provinces [39] based on the GEE platform. It was also a successful case of RFC for land cover classification. The bamboo forest area was estimated as 709.92 × 10⁴ hectares. The bamboo forest was distributed at a certain elevation zone (300~1200 m), day LST zone (19~25 °C) and AAP zone (1200~2000 mm). Bamboo forests at higher altitudes are mainly scrub and dwarf varieties. A better understanding of the spatial pattern of bamboo forest can be helpful for the bamboo forest industry and could be used to quantitatively evaluate the bamboo ecosystem service.
Bamboo mapping is challenging due to the spectral similarity between bamboo and other forest types. Feature selection is an important factor that affects classification accuracy. The canopy moisture difference between bamboo and other forest types during winter and spring characterized with phenological NDMI played an important role in bamboo detection. NDVI and elevation were also helpful to bamboo mapping.

Author Contributions

Conceptualization, C.L.; Data curation, S.Q., B.S., J.L. and T.X.; Formal analysis, B.S. and C.L.; Funding acquisition, P.G.; Investigation, J.L., M.Z. and T.X.; Methodology, S.Q. and P.G.; Resources, M.Z.; Writing—original draft, B.S.; Writing—review & editing, S.Q. and P.G. All authors have read and agreed to the published version of the manuscript.

Funding

This research was funded by International Network for Bamboo and Rattan (INBAR) Organization under Grant (grant number 041902006) and National Natural Science Foundation of China (41867012).

Institutional Review Board Statement

Not applicable.

Informed Consent Statement

Not applicable.

Data Availability Statement

The data presented in this study are available on request from the corresponding author. The data are not publicly available due to the constraint in the consent.

Conflicts of Interest

The authors declare no conflict of interest.

References

  1. Yi, T.; Shi, J.; Ma, L.; Wang, H.; Yang, L. Chinese Bamboo Pictures; Science Press: Beijing, China, 2008; p. 766. [Google Scholar]
  2. Li, Y.; Feng, P. Bamboo Resources in China Based on the Ninth National Forest Inventory Data. World Bamboo Ratt. 2019, 17, 45–48. [Google Scholar]
  3. Yang, Y.; Hui, C.; Du, F.; Wang, W.; Jin, W. China’s Bamboo: Culture/Resources/Cultivation/Utilization; International Network for Bamboo and Rattan: Beijing, China, 2010; pp. 32, 57. [Google Scholar]
  4. Sun, M.; Yan, B.; Xu, T.; Yu, L. Resources and Utilization of Bamboo Plants; Science Press: Beijing, China, 2015; pp. 1–36. [Google Scholar]
  5. Isagi, Y.; Kawahara, T.; Kamo, K.; Ito, H. Net production and carbon cycling in a bamboo Phyllostachys pubescens stand. Plant Ecol. 1997, 130, 41–52. [Google Scholar] [CrossRef]
  6. Ren, G. Remote Sensing Investigation of Giant Panda’s Staple Food Bamboo Resources. Remote Sens. Inf. 1989, 2, 34–35. [Google Scholar]
  7. Shanmughavel, P.; Francis, K. Above ground biomass production and nutrient distribution in growing bamboo (Bambusa bambos (L.) Voss). Biomass Bioenergy 1996, 10, 383–391. [Google Scholar] [CrossRef]
  8. Li, P.; Zhou, G.; Du, H.; Lu, D.; Mo, L.; Xu, X.; Shi, Y.; Zhou, Y. Current and potential carbon stocks in moso bamboo forests in China. J. Env. Manag. 2015, 156, 89–96. [Google Scholar] [CrossRef] [PubMed]
  9. Wang, B.; Wei, W.; Liu, C.; You, W.; Niu, X.; Man, R. Biomass and carbon stock in moso bamboo forests in subtropical China: Characteristics and implications. J. Trop. For. Sci. 2013, 25, 137–148. [Google Scholar]
  10. Zhou, G.; Meng, C.; Jiang, P.; Xu, Q. Review of Carbon Fixation in Bamboo Forests in China. Bot. Rev. 2011, 77, 262–270. [Google Scholar] [CrossRef]
  11. Venkatappa, M.; Anantsuksomsri, S.; Castillo, J.A.; Smith, B.; Sasaki, N. Mapping the Natural Distribution of Bamboo and Related Carbon Stocks in the Tropics Using Google Earth Engine, Phenological Behavior, Landsat 8, and Sentinel-2. Remote Sens. 2020, 12, 3109. [Google Scholar] [CrossRef]
  12. Song, Z.; Liu, H.; Li, B.; Yang, X. The production of phytolith-occluded carbon in China’s forests: Implications to biogeochemical carbon sequestration. Glob. Change Biol. 2013, 19, 2907–2915. [Google Scholar] [CrossRef]
  13. Benzhi, Z.; Maoyi, F.; Jinzhong, X.; Xiaosheng, Y.; Zhengcai, L. Ecological functions of bamboo forest: Research and Application. J. For. Res. 2015, 16, 143–147. [Google Scholar] [CrossRef]
  14. Zhu, C.; Yang, K.; Gao, Z. Identification of TIP Genes and Their Expression Patterns under Stresses in Moso Bamboo ( Phyllostachys edulis). World Bamboo Ratt. 2021, 19, 1–11. [Google Scholar]
  15. Jiang, M.; Cai, X.; Liao, J.; Yang, Y.; Chen, Q.; Gao, S.; Yu, X.; Luo, Z.; Lei, T.; Lv, B.; et al. Different strategies for lead detoxification in dwarf bamboo tissues. Ecotoxicol Environ Saf. 2020, 193, 110329. [Google Scholar] [CrossRef] [PubMed]
  16. Cai, X.; Jiang, M.; Liao, J.; Yang, Y.; Li, N.; Cheng, Q.; Li, X.; Song, H.; Luo, Z.; Liu, S. Biomass allocation strategies and Pb-enrichment characteristics of six dwarf bamboos under soil Pb stress. Ecotoxicol. Environ. Saf. 2021, 207, 111500. [Google Scholar] [CrossRef]
  17. Zhang, X.; Hou, Y.; Huo, D.; Zhou, H.; Yang, Y. Policy System Establishment for Bamboo Industry High-quality Development in Guizhou Province. World Bamboo Ratt. 2021, 19, 12–19. [Google Scholar]
  18. Dong, J.; Kuang, W.; Liu, J. Continuous land cover change monitoring in the remote sensing big data era. Sci. China Earth Sci. 2017, 60, 2223–2224. [Google Scholar] [CrossRef]
  19. Du, H.; Zhou, G.; Ge, H.; Zhao, X.; Cui, L. Method of extracting bamboo forest remote sensing information based on TM data. J. Northeast For. Univ. 2008, 36, 35–38. [Google Scholar]
  20. Wang, J.; Xiao, X.; Qin, Y.; Dong, J.; Geissler, G.; Zhang, G.; Cejda, N.; Alikhani, B.; Doughty, R.B. Mapping the dynamics of eastern redcedar encroachment into grasslands during 1984–2010 through PALSAR and time series Landsat images. Remote Sens. Environ. 2017, 190, 233–246. [Google Scholar] [CrossRef] [Green Version]
  21. Wilson, E.H.; Sader, S.A. Detection of forest harvest type using multiple dates of Landsat TM imagery. Remote Sens. Environ. 2002, 80, 385–396. [Google Scholar] [CrossRef]
  22. Wulder, M.A.; Coops, N.C.; Roy, D.P.; White, J.C.; Hermosilla, T. Land cover 2.0. Int. J. Remote Sens. 2018, 39, 4254–4284. [Google Scholar] [CrossRef] [Green Version]
  23. Mertens, B.; Hua, L.; Belcher, B.; Ruiz-Pérez, M.; Maoyi, F.; Xiaosheng, Y. Spatial patterns and processes of bamboo expansion in Southern China. Appl. Geogr. 2008, 28, 16–31. [Google Scholar] [CrossRef]
  24. Han, N.; Du, H.; Zhou, G.; Sun, X.; Ge, H.; Xu, X. Object-based classification using SPOT-5 imagery for Moso bamboo forest mapping. Int. J. Remote Sens. 2014, 35, 1126–1142. [Google Scholar] [CrossRef]
  25. Li, M.; Li, C.; Jiang, H.; Fang, C.; Yang, J.; Zhu, Z.; Shi, L.; Liu, S.; Gong, P. Tracking bamboo dynamics in Zhejiang, China, using time-series of Landsat data from 1990 to 2014. Int. J. Remote Sens. 2016, 37, 1714–1729. [Google Scholar] [CrossRef]
  26. Singh, A. Spectral separability of tropical forest cover classes. Int. J. Remote Sens. 2007, 8, 971–979. [Google Scholar] [CrossRef]
  27. McMichael, C.H.; Bush, M.B.; Silman, M.R.; Piperno, D.R.; Raczka, M.; Lobato, L.C.; Zimmerman, M.; Hagen, S.; Palace, M.; Linder, P. Historical fire and bamboo dynamics in western Amazonia. J. Biogeogr. 2013, 40, 299–309. [Google Scholar] [CrossRef]
  28. Yan, M.; Zhang, Y.; Bao, Y. Extraction of Bamboo Forest Information from IKONOS Image Based on Gray Level Co-occurrence Matrix Method. Remote Sens. Inf. 2004, 2, 31–34. [Google Scholar]
  29. Sun, X.; Du, H.; Han, N.; Ge, H.; Gu, C. Multi-Scale Segmentation, Object-Based Extraction of Moso Bamboo Forest from SPOT5 Imagery. Sci. Silvae Sin. 2013, 49, 80–87. [Google Scholar]
  30. Guan, F.; Fan, S.; Gao, Y.; Xiao, F.; Cai, H. Different Classification Methods in the Application of Remote Sensing Information Identification of Bamboo. Chin. Agric. Sci. Bull. 2013, 29, 47–52. [Google Scholar]
  31. Xu, X.; Du, H.; Zhou, G.; Dong, D.; Fan, W.; Cui, R. Spectral Mixture Analysis Based on Erf-BP Model and Applied in Extracting Forest Information. Sci. Silvae Sin. 2011, 47, 30–38. [Google Scholar]
  32. Li, M.; Peng, S.; Zhou, L.; Ma, Y. A study of automated construction and classification of decision tree classifiers based on ASTER remotely sensed datasets. Remote Sens. Land Resour. 2006, 18, 33–36. [Google Scholar]
  33. Li, L.; Li, N.; Lu, D.; Chen, Y. Mapping Moso bamboo forest and its on-year and off-year distribution in a subtropical region using time-series Sentinel-2 and Landsat 8 data. Remote Sens. Environ. 2019, 231, 111265. [Google Scholar] [CrossRef]
  34. Greig, C.; Robertson, C.; Lacerda, A.E.B. Spectral-temporal modelling of bamboo-dominated forest succession in the Atlantic Forest of Southern Brazil. Ecol. Model. 2018, 384, 316–332. [Google Scholar] [CrossRef]
  35. Tuanmu, M.-N.; Viña, A.; Bearer, S.; Xu, W.; Ouyang, Z.; Zhang, H.; Liu, J. Mapping understory vegetation using phenological characteristics derived from remotely sensed data. Remote Sens. Environ. 2010, 114, 1833–1844. [Google Scholar] [CrossRef]
  36. Wang, T.; Skidmore, A.K.; Toxopeus, A.G.; Liu, X. Understory Bamboo Discrimination Using a Winter Image. Photogramm. Eng. Remote Sens. 2009, 75, 37–47. [Google Scholar] [CrossRef] [Green Version]
  37. Gorelick, N.; Hancher, M.; Dixon, M.; Ilyushchenko, S.; Thau, D.; Moore, R. Google Earth Engine: Planetary-scale geospatial analysis for everyone. Remote Sens. Environ. 2017, 202, 18–27. [Google Scholar] [CrossRef]
  38. Liu, C.; Xiong, T.; Gong, P.; Qi, S. Improving large-scale moso bamboo mapping based on dense Landsat time series and auxiliary data: A case study in Fujian Province, China. Remote Sens. Lett. 2017, 9, 1–10. [Google Scholar] [CrossRef]
  39. Zhang, M.; Gong, P.; Qi, S.; Liu, C.; Xiong, T. Mapping bamboo with regional phenological characteristics derived from dense Landsat time series using Google Earth Engine. Int. J. Remote Sens. 2019, 40, 9541–9555. [Google Scholar] [CrossRef]
  40. Zhao, Y.; Feng, D.; Jayaraman, D.; Belay, D.; Sebrala, H.; Ngugi, J.; Maina, E.; Akombo, R.; Otuoma, J.; Mutyaba, J.; et al. Bamboo mapping of Ethiopia, Kenya and Uganda for the year 2016 using multi-temporal Landsat imagery. Int. J. Appl. Earth Obs. Geoinf. 2018, 66, 116–125. [Google Scholar] [CrossRef]
  41. Sari, I.L.; Weston, C.J.; Newnham, G.J.; Volkova, L. Assessing Accuracy of Land Cover Change Maps Derived from Automated Digital Processing and Visual Interpretation in Tropical Forests in Indonesia. Remote Sens. 2021, 13, 1446. [Google Scholar] [CrossRef]
  42. Quirós-Ramírez, G.; Herrera-Ugalde, M.E.; Arce-Benavides, H.; Obando-Vargas, G.; Ortiz-Malavasi, E.; Romero-Badilla, D. Evaluación de Collect Earth como herramienta para estimar datos de actividad para el programa REDD+ de Costa Rica. Rev. For. Mesoam. Kurú 2019, 17, 21–32. [Google Scholar]
  43. Hsu, C.; Lin, C. A comparison of methods for multiclass support vector machines. IEEE Trans. Neural Netw. 2002, 13, 415–425. [Google Scholar]
  44. Linderman, M.; Liu, J.; Qi, J.; An, L.; Ouyang, Z.; Yang, J.; Tan, Y. Using artificial neural networks to map the spatial distribution of understorey bamboo from remote sensing data. Int. J. Remote Sens. 2010, 25, 1685–1700. [Google Scholar] [CrossRef]
  45. Breiman, L. Random Forests. Mach. Learn. 2001, 45, 5–32. [Google Scholar] [CrossRef] [Green Version]
  46. Forghani, Y.; Yazdi, H.S. Robust support vector machine-trained fuzzy system. Neural Netw. 2014, 50, 154–165. [Google Scholar] [CrossRef]
  47. Liu, L.; Sun, X.; Li, C.; Lei, Y. Classification of Medical Text Data Using Convolutional Neural Network-Support Vector Machine Method. J. Med. Imaging Health Inform. 2020, 10, 1746–1753. [Google Scholar] [CrossRef]
  48. Raczko, E.; Zagajewski, B. Comparison of support vector machine, random forest and neural network classifiers for tree species classification on airborne hyperspectral APEX images. Eur. J. Remote Sens. 2017, 50, 144–154. [Google Scholar] [CrossRef] [Green Version]
  49. Belgiu, M.; Drăguţ, L. Random forest in remote sensing: A review of applications and future directions. ISPRS J. Photogramm. Remote Sens. 2016, 114, 24–31. [Google Scholar] [CrossRef]
  50. Kim, D.S.; Lee, S.M.; Park, J.S. Building Lightweight Intrusion Detection System based on Random Forest. In Advances in Neural Networks—ISNN 2006; Springer: Berlin/Heidelberg, Germany, 2006; Volume 3973, pp. 224–230. [Google Scholar]
  51. Chan, J.C.; Paelinckx, D. Evaluation of Random Forest and Adaboost tree-based ensemble classification and spectral band selection for ecotope mapping using airborne hyperspectral imagery. Remote Sens. Environ. 2008, 112, 2999–3011. [Google Scholar] [CrossRef]
  52. Ham, J.; Chen, Y.; Crawford, M.M.; Ghosh, J. Investigation of the random forest framework for classification of hyperspectral data. IEEE Trans. Geosci. Remote Sens. 2005, 43, 492–501. [Google Scholar] [CrossRef] [Green Version]
  53. Immitzer, M.; Atzberger, C.; Koukal, T. Tree Species Classification with Random Forest Using Very High Spatial Resolution 8-Band WorldView-2 Satellite Data. Remote Sens. 2012, 4, 2661–2693. [Google Scholar] [CrossRef] [Green Version]
  54. Farr, T.G.; Rosen, P.A.; Caro, E.; Crippen, R.; Duren, R.; Hensley, S.; Kobrick, M.; Paller, M.; Rodriguez, E.; Roth, L.; et al. The Shuttle Radar Topography Mission. Rev. Geophys. 2007, 45. [Google Scholar] [CrossRef] [Green Version]
  55. Ye, Q.; Yu, S.; Liu, J.; Zhao, Q.; Zhao, Z. Aboveground biomass estimation of black locust planted forests with aspect variable using machine learning regression algorithms. Ecol. Indic. 2021, 129. [Google Scholar] [CrossRef]
  56. Tomislav Hengl. Monthly precipitation in mm at 1 km resolution based on SM2RAIN-ASCAT 2007-2018, IMERGE, CHELSA Climate and WorldClim; 0.2; 2018. Available online: https://zenodo.org/record/3256275#.YfZMQfgo9PY (accessed on 3 November 2021).
  57. Wan, Z.; Hook, S.; Hulley, G. MOD11A1 MODIS/Terra Land Surface Temperature/Emissivity Daily L3 Global 1km SIN Grid V006. 2015. Available online: https://lpdaac.usgs.gov/products/mod11a1v006/ (accessed on 3 November 2021).
  58. Zhang, X.; Xiao, X.; Wang, X.; Xu, X.; Chen, B.; Wang, J.; Ma, J.; Zhao, B.; Li, B. Quantifying expansion and removal of Spartina alterniflora on Chongming island, China, using time series Landsat images during 1995–2018. Remote Sens. Environ. 2020, 247, 111916. [Google Scholar] [CrossRef]
  59. Pan, L.; Xia, H.; Yang, J.; Niu, W.; Wang, R.; Song, H.; Guo, Y.; Qin, Y. Mapping cropping intensity in Huaihe basin using phenology algorithm, all Sentinel-2 and Landsat images in Google Earth Engine. Int. J. Appl. Earth Obs. Geoinf. 2021, 102, 102376. [Google Scholar] [CrossRef]
  60. Zhu, Z.; Wang, S.; Woodcock, C.E. Improvement and expansion of the Fmask algorithm: Cloud, cloud shadow, and snow detection for Landsats 4–7, 8, and Sentinel 2 images. Remote Sens. Environ. 2015, 159, 269–277. [Google Scholar] [CrossRef]
  61. Zhu, Z.; Woodcock, C.E. Object-based cloud and cloud shadow detection in Landsat imagery. Remote Sens. Environ. 2012, 118, 83–94. [Google Scholar] [CrossRef]
  62. Cihlar, J.; Manak, D.; Iorio, M.D. Evaluation of Compositing Algorithms for AVHRR Data Over Land. IEEE Trans. Geosci. Remote Sens. 1994, 32, 427–437. [Google Scholar] [CrossRef]
  63. Xu, H.; Qi, S.; Li, X.; Gao, C.; Wei, Y.; Liu, C. Monitoring three-decade dynamics of citrus planting in Southeastern China using dense Landsat records. Int. J. Appl. Earth Obs. Geoinf. 2021, 103, 102518. [Google Scholar] [CrossRef]
  64. Rouse, J.W.; Haas, R.H.; Schell, J.A.; Deering, D.W. Monitoring vegetation systems in the Great Plains with ERTS. NASA Spec. Publ. 1974, 351, 309. [Google Scholar]
  65. Gao, B. NDWI—A normalized difference water index for remote sensing of vegetation liquid water from space. Remote Sens. Environ. 1996, 58, 257–266. [Google Scholar] [CrossRef]
  66. Jolliffe, I.T.; Cadima, J. Principal component analysis: A review and recent developments. Philos. Trans. R. Soc. A:Math. Phys. Eng. Sci. 2016, 374, 20150202. [Google Scholar] [CrossRef]
  67. Chatziantoniou, A.; Psomiadis, E.; Petropoulos, G. Co-Orbital Sentinel 1 and 2 for LULC Mapping with Emphasis on Wetlands in a Mediterranean Setting Based on Machine Learning. Remote Sens. 2017, 9, 1259. [Google Scholar] [CrossRef] [Green Version]
  68. Bharati, M.H.; Liu, J.J.; MacGregor, J.F. Image texture analysis: Methods and comparisons. Chemom. Intell. Lab. Syst. 2004, 72, 57–71. [Google Scholar] [CrossRef]
  69. Rodriguez, J.D.; Perez, A.; Lozano, J.A. Sensitivity analysis of kappa-fold cross validation in prediction error estimation. IEEE Trans. Pattern Anal. Mach. Intell. 2010, 32, 569–575. [Google Scholar] [CrossRef] [PubMed]
  70. Wong, T. Performance evaluation of classification algorithms by k-fold and leave-one-out cross validation. Pattern Recognit. 2015, 48, 2839–2846. [Google Scholar] [CrossRef]
  71. Cohen, J. A Coefficient of Agreement for Nominal Scales. Educ. Psychol. Meas. 1960, 20, 37–46. [Google Scholar] [CrossRef]
  72. Zhang, L.; Duan, Q. A Feature Selection Method for Multi-Label Text Based on Feature Importance. Appl. Sci. 2019, 9. [Google Scholar] [CrossRef] [Green Version]
  73. al Sagri, H.; Ykhlef, M. Quantifying Feature Importance for Detecting Depression using Random Forest. IJCSNS Int. J. Comput. Sci. Netw. Secur. 2019, 19, 29–39. [Google Scholar]
  74. Tan, H. The advantages, disadvantages and development direction of the bamboo industry in Yunnan Province. Yunnan For. 2001, 22, 6–7. [Google Scholar]
  75. Zhang, M.; Fan, S.; Yan, X.; Zhou, Y.-Q.; Guan, F. Relationships between stand spatial structure characteristics and influencing factors of bamboo and broad-leaved mixed forest. J. For. Res. 2020, 25, 83–91. [Google Scholar] [CrossRef]
  76. Liu, Y.; Wu, C.; Hu, X.; Gao, H.; Wang, Y.; Luo, H.; Cai, S.; Li, G.; Zheng, Y.; Lin, C.; et al. Transcriptome profiling reveals the crucial biological pathways involved in cold response in Moso bamboo (Phyllostachys edulis). Tree Physiol. 2020, 40, 538–556. [Google Scholar] [CrossRef] [Green Version]
  77. Li, X.; Mao, F.; Du, H.; Zhou, G.; Xing, L.; Liu, T.; Han, N.; Liu, Y.; Zhu, D.; Zheng, J.; et al. Spatiotemporal evolution and impacts of climate change on bamboo distribution in China. J. Env. Manag. 2019, 248, 109265. [Google Scholar] [CrossRef] [PubMed]
  78. Zhao, J.; Shi, Y.; Huang, Y.; Fu, J. Uncertainties of snow cover extraction caused by the nature of topography and underlying surface. J. Arid Land 2015, 7, 285–295. [Google Scholar] [CrossRef]
  79. Li, Y.; Wu, D.; Yang, L.; Zhou, T. Declining Effect of Precipitation on the Normalized Difference Vegetation Index of Grasslands in the Inner Mongolian Plateau, 1982–2010. Appl. Sci. 2021, 11, 8766. [Google Scholar] [CrossRef]
  80. Sun, J.; Qin, X. Precipitation and temperature regulate the seasonal changes of NDVI across the Tibetan Plateau. Environ. Earth Sci. 2016, 75, 291. [Google Scholar] [CrossRef]
  81. Heo, I.; Kwon, W.T.; Ho, L.S. The Impact of Temperature Rising on the Distribution of Plant—In Case of Bamboos and Garlics. J. Environ. Impact Assess. 2006, 15, 67–78. [Google Scholar]
  82. Fadrique, B.; Gann, D.; Nelson, B.W.; Saatchi, S.; Feeley, K.J.; Jucker, T. Bamboo phenology and life cycle drive seasonal and long-term functioning of Amazonian bamboo-dominated forests. J. Ecol. 2020, 109, 860–876. [Google Scholar] [CrossRef]
Figure 1. Location and elevation map of China, with the 16 provinces where bamboo forests are mainly distributed outlined by the blue line.
Remotesensing 14 00762 g001
Figure 2. Bamboo mapping methodology and workflow in this study. The SRTM, RF and RFC refer to the Shuttle Radar Topography Mission, random forest and random forest classifier.
Remotesensing 14 00762 g002
Figure 3. Spatial distribution of the bamboo and non-bamboo samples that we used in this study.
Remotesensing 14 00762 g003
Figure 4. Spatial distribution map of bamboo in China that we obtained using the Landsat 8 time-series image archive.
Remotesensing 14 00762 g004
Figure 5. The spatial distribution of bamboo in the 16 provinces analyzed.
Remotesensing 14 00762 g005
Figure 6. Scatter plot of the comparison between the reference and estimated results of the bamboo areas at the provincial level. The solid line is the fitting line between reference and estimated results, and the mathematical meaning of the dotted line is y = x.
Remotesensing 14 00762 g006
Figure 7. Spatial patterns of elevation (a), aspect (b), temperature (c), and annual precipitation (d) of bamboo forests in China.
Remotesensing 14 00762 g007
Figure 8. Histogram of average normalized importance scores of classification features (a) and the box plot of features’ importance difference in 15 provinces (b). G_c: GLCM_contrast; G_e: GLCM_entropy; G_v: GLCM_variance; G_h: GLCM_homogeny; V_v: NDVI_min; V_p: NDVI_max; V_m: NDVI_mean; V_s: NDVI_stdDev; M_v: NDMI_min; M_p: NDMI_max; M_m: NDMI_mean; M_s: NDMI_stdDev; Ele: Elevation.
Remotesensing 14 00762 g008
Table 1. Details of collected samples, where FT represents the field under investigation, FRI represents the forest resources inventory, and PFM represents the plantation forest map.
IDProvincesSourcesTimeNo. of Samples
BambooNon-Bamboo
1HainanFT2016–2017153991
2ZhejiangFT2015373444
3JiangxiFT20165861101
FRI2014
4YunnanFT20179201089
FRI2016–2017
5FujianFRI2015611974
6GuangdongFRI20023231189
7SichuanFRI20074712382
8GuangxiPFM1999–2003245710
9GuizhouPFM1999–2003183680
10HubeiPFM1999–20031341217
11HunanPFM1999–20034901801
12JiangsuPFM1999–2003124348
13ChongqingPFM1999–2003124596
14AnhuiPFM1999–2003209709
15TaiwanWEB20154361997
16Shaanxi--------
Sum------538216228
Table 2. Spectral band details for Landsat 8 OLI sensor.
NameDescriptionCenters/μmWavelength/μmResolution/m
B1ultra blue0.4430.435–0.45130
B2blue0.4820.452–0.51230
B3green0.56150.533–0.59030
B4red0.65450.636–0.67330
B5near infrared0.8650.851–0.87930
B6shortwave infrared 11.60851.566–1.65130
B7shortwave infrared 22.20052.107–2.29430
B8panchromatic0.58950.503–0.67615
B9Cirrus1.37351.363–1.38430
Table 3. The collection snippets and number of Landsat 8 images during the target period we used in this study.
Collection SnippetTimeImages Count
LANDSAT/LC08/C01/T1_SR20142883
20152823
20162856
LANDSAT/LC08/C01/T2_SR201490
2015105
2016110
Total8867
Table 4. Variables used for bamboo mapping in all bamboo provinces of China, except Hainan.
IndicesMetricsNo. of Variables
Composited imageB2–B76
DEMElevation1
GLCMHomogeneity1
GLCMContrast1
GLCMVariance1
GLCMEntropy1
NDVI, NDMIMaximum2
NDVI, NDMIMinimum2
NDVI, NDMIMean2
NDVI, NDMIStandard deviation2
Table 5. The average of 50-fold cross validation results in this study.
IDProvinceBambooOAKappa
UAPA
1Fujian74.59%83.46%84.58%0.6625
2Jiangxi87.61%90.83%93.33%0.8325
3Zhejiang97.37%94.87%96.10%0.922
4Hunan74.59%83.46%97.04%0.6197
5Sichuan58.90%97.73%92.78%0.7018
6Guangdong56.06%90.24%89.62%0.6332
7Guangxi77.50%93.94%93.99%0.8122
8Anhui84.62%94.29%95.48%0.8634
9Guizhou90.63%96.67%97.67%0.9213
10Taiwan83.12%90.14%95.58%0.8385
11Hubei82.35%96.55%97.43%0.8744
12Chongqing59.26%94.12%90.55%0.6736
13Yunnan85.20%65.30%93.59%0.7038
14Jiangsu95.65%95.65%98.17%0.9449
15Shaanxi58.90%97.73%92.78%0.7018
16Hainan88.80%74.60%84.13%0.757
Average78.45%89.97%93.74%0.7789
Publisher’s Note: MDPI stays neutral with regard to jurisdictional claims in published maps and institutional affiliations.

