
Understanding Haze: Modeling Size-Resolved Mineral Aerosol from Satellite Remote Sensing


Abstract
:
1. Introduction
2. Materials and Methods
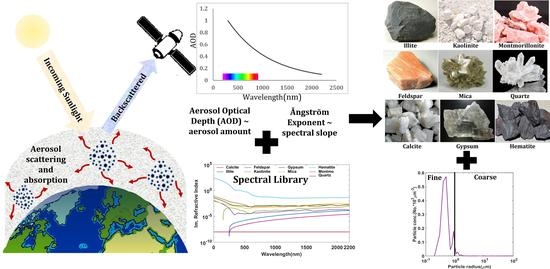
2.1. Remote Sensing Input
- (a)
- AOD centered at 550, 860, 2100 nm over the sea.
- (b)
- AOD centered at 412, 470, and 650 nm over the land.
2.2. Dust Mineral Suit Input
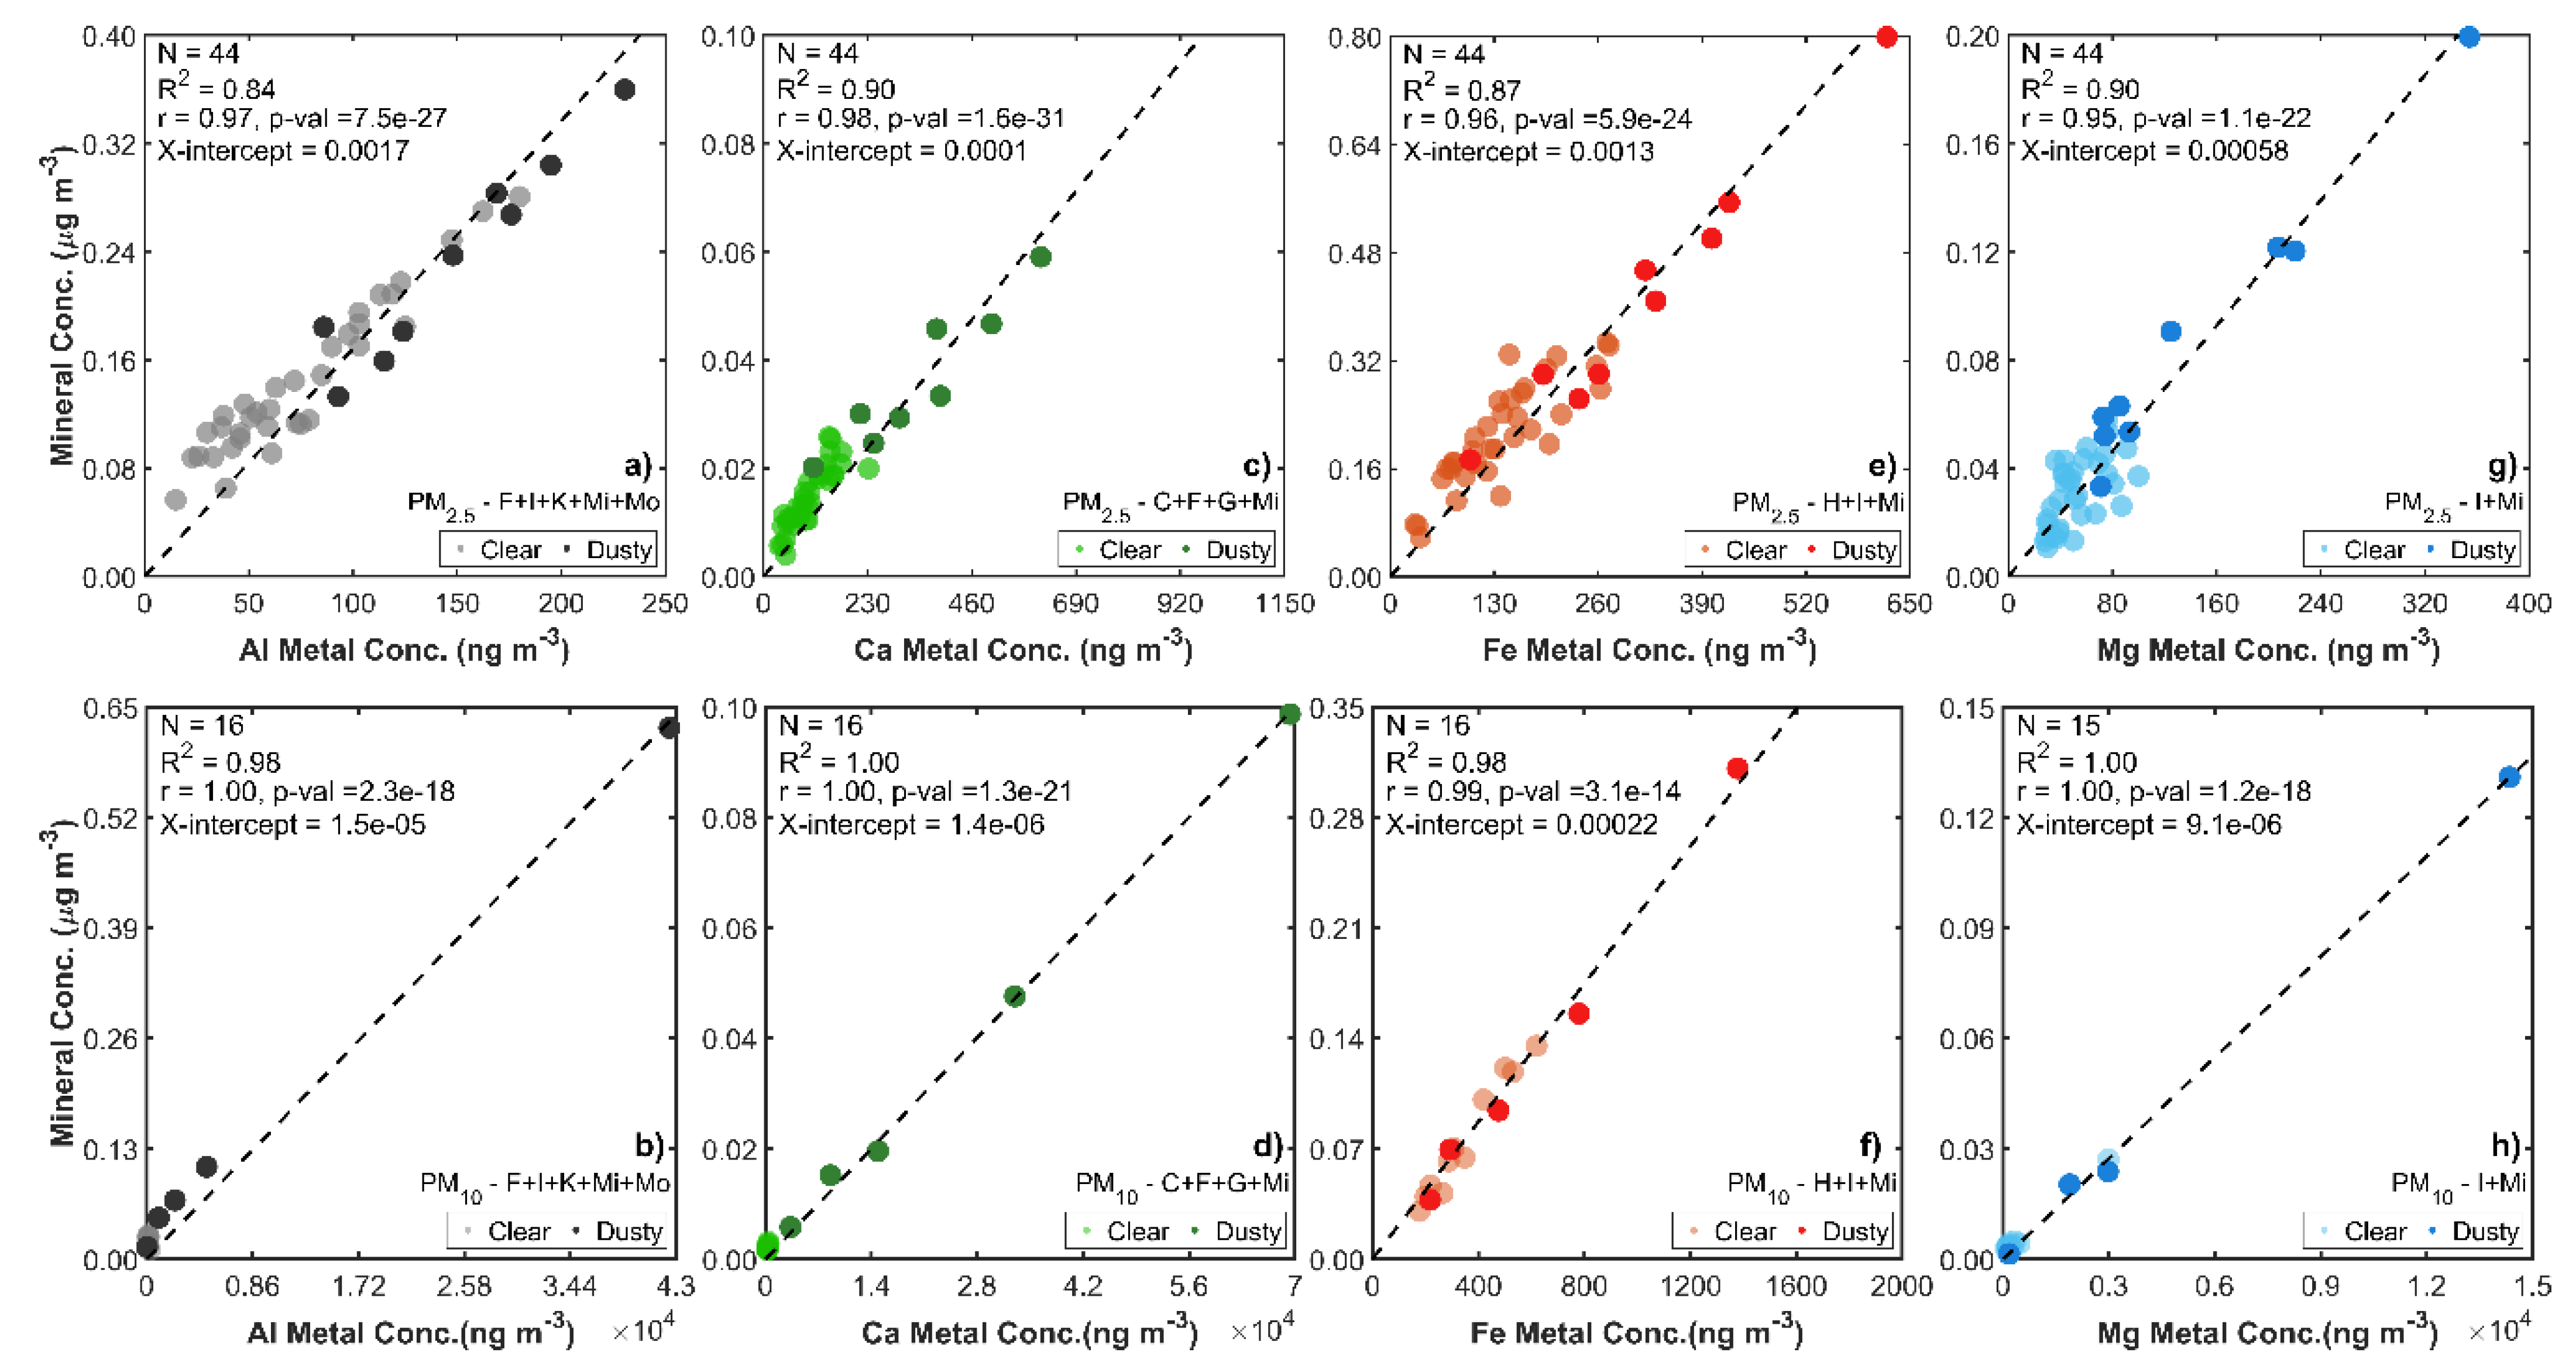
2.3. Elemental Metal Measurements for Validation
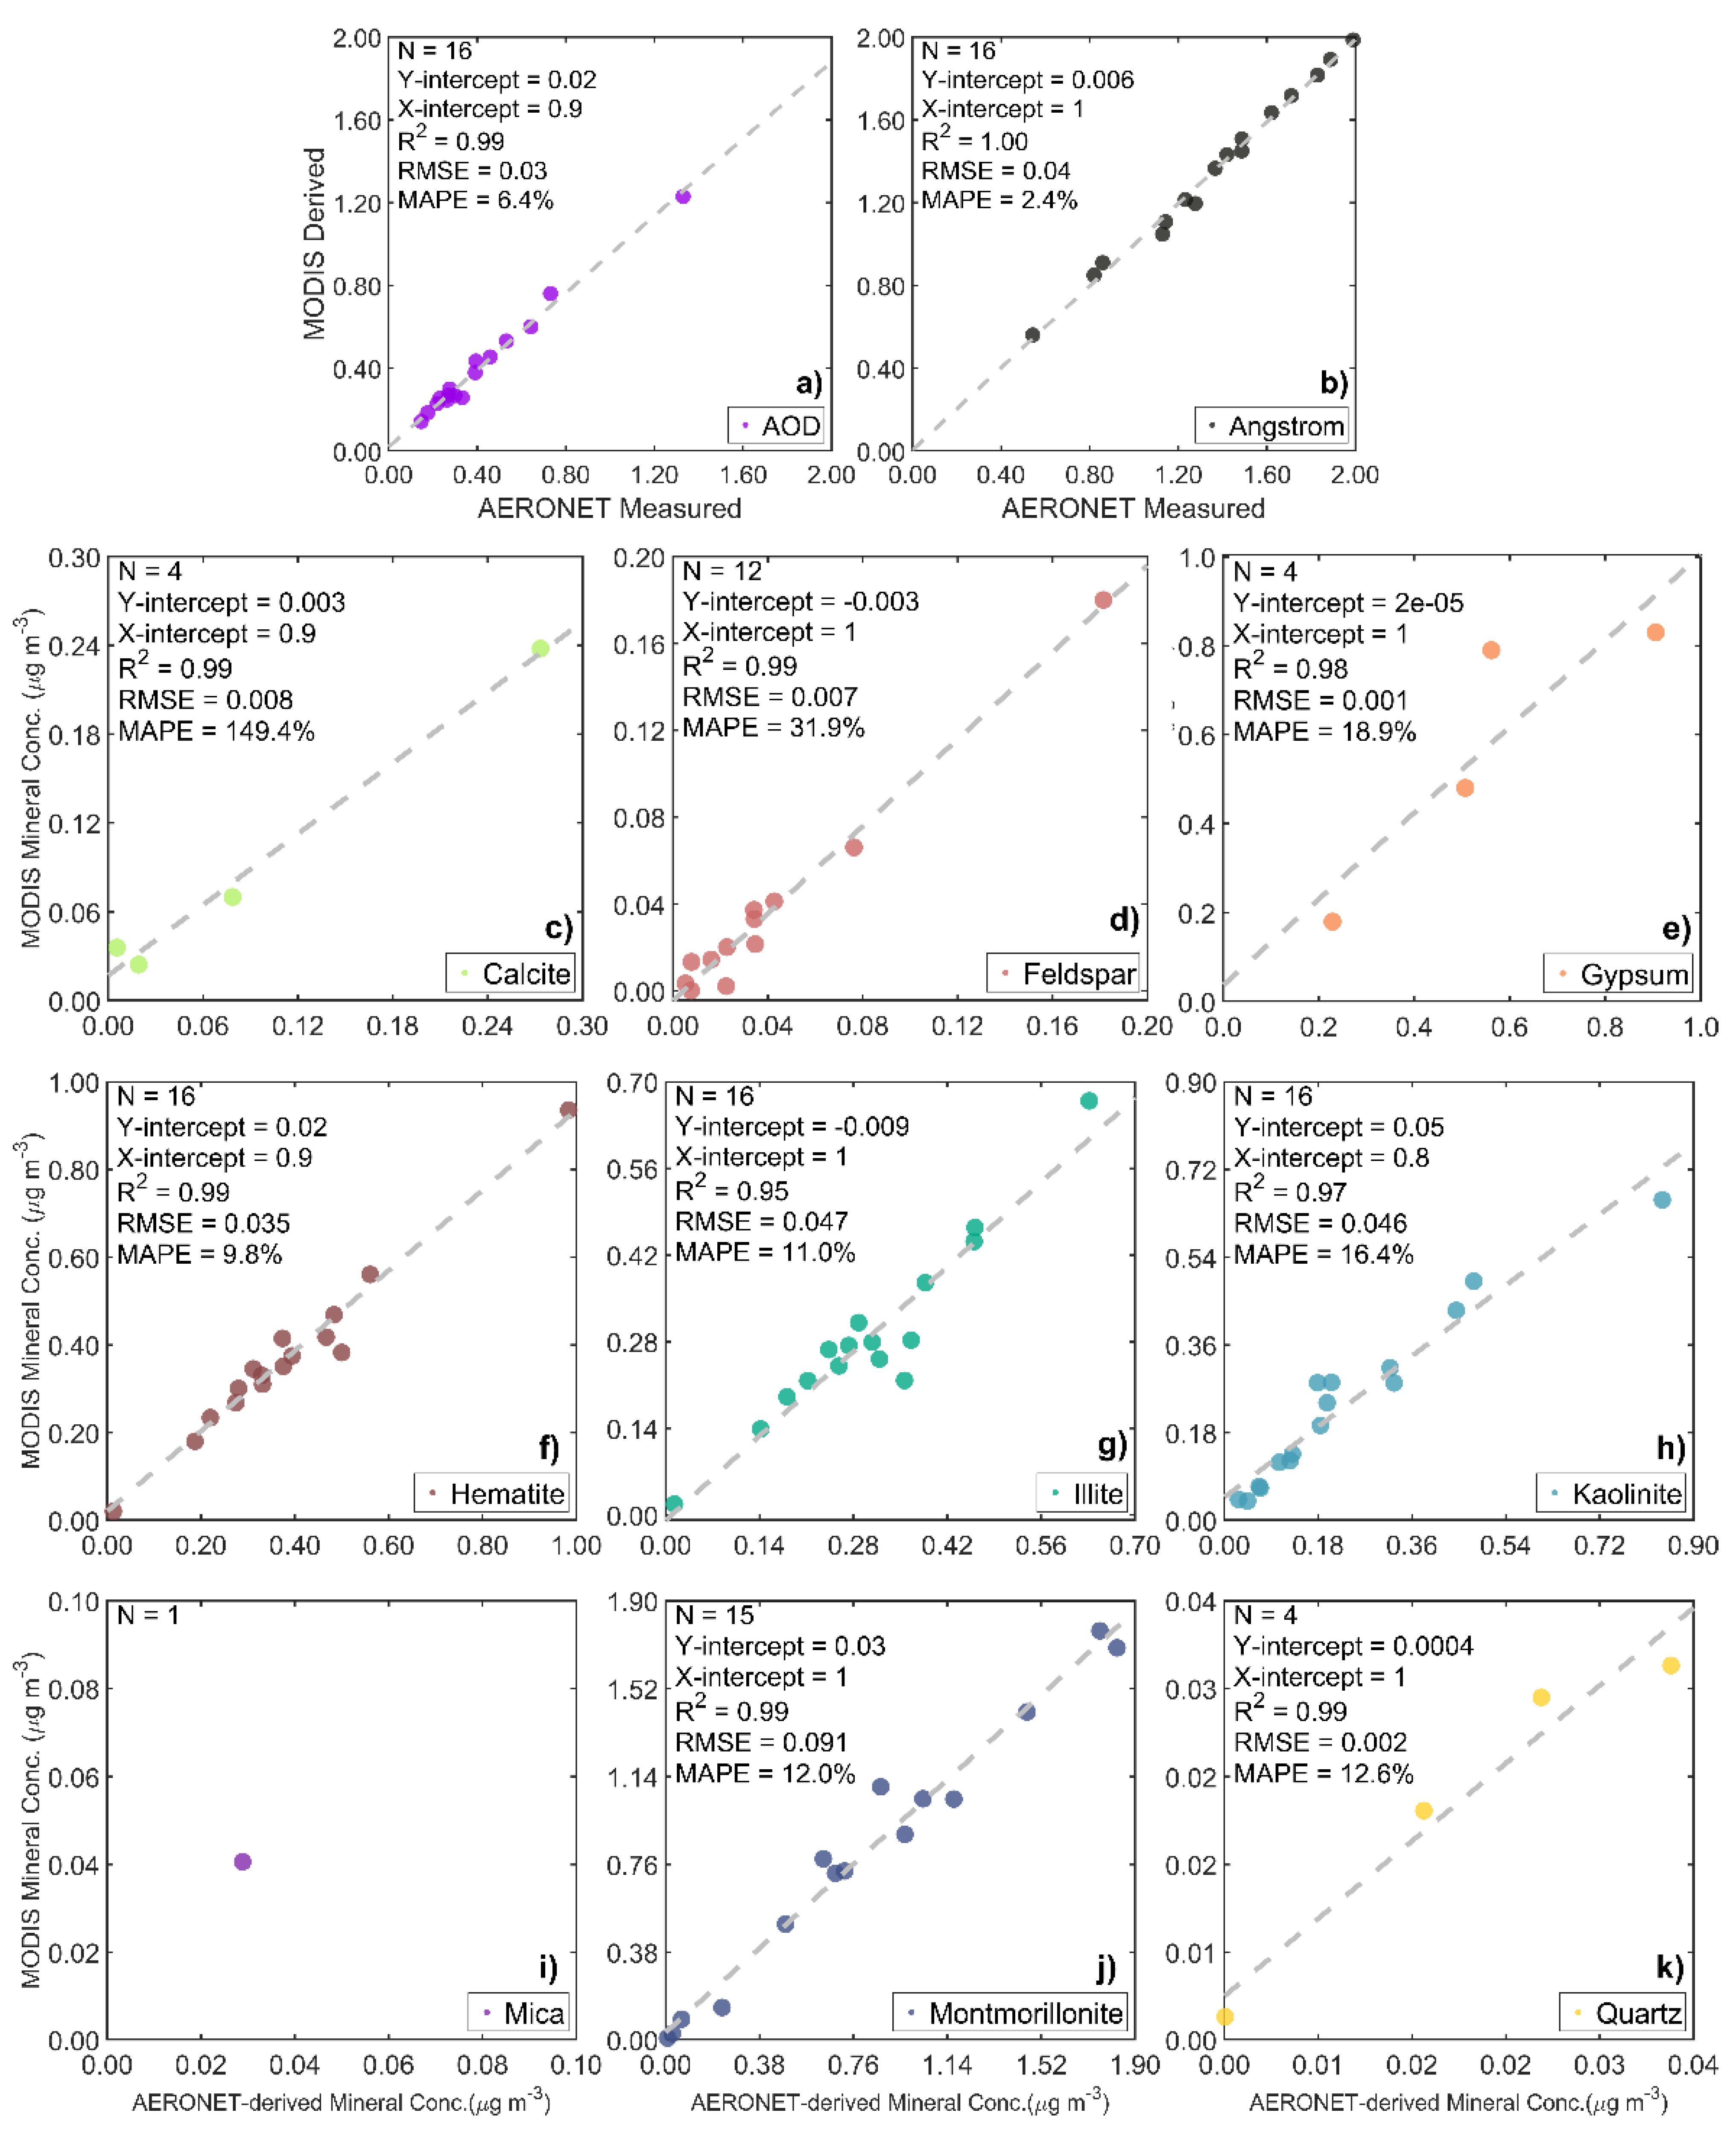
2.4. Ground-Based AERONET-AOD Data for Validation
2.5. Modeling Size-Resolved Mineralogical Composition
2.6. Limitations of Mineral Aerosol Model
3. Results
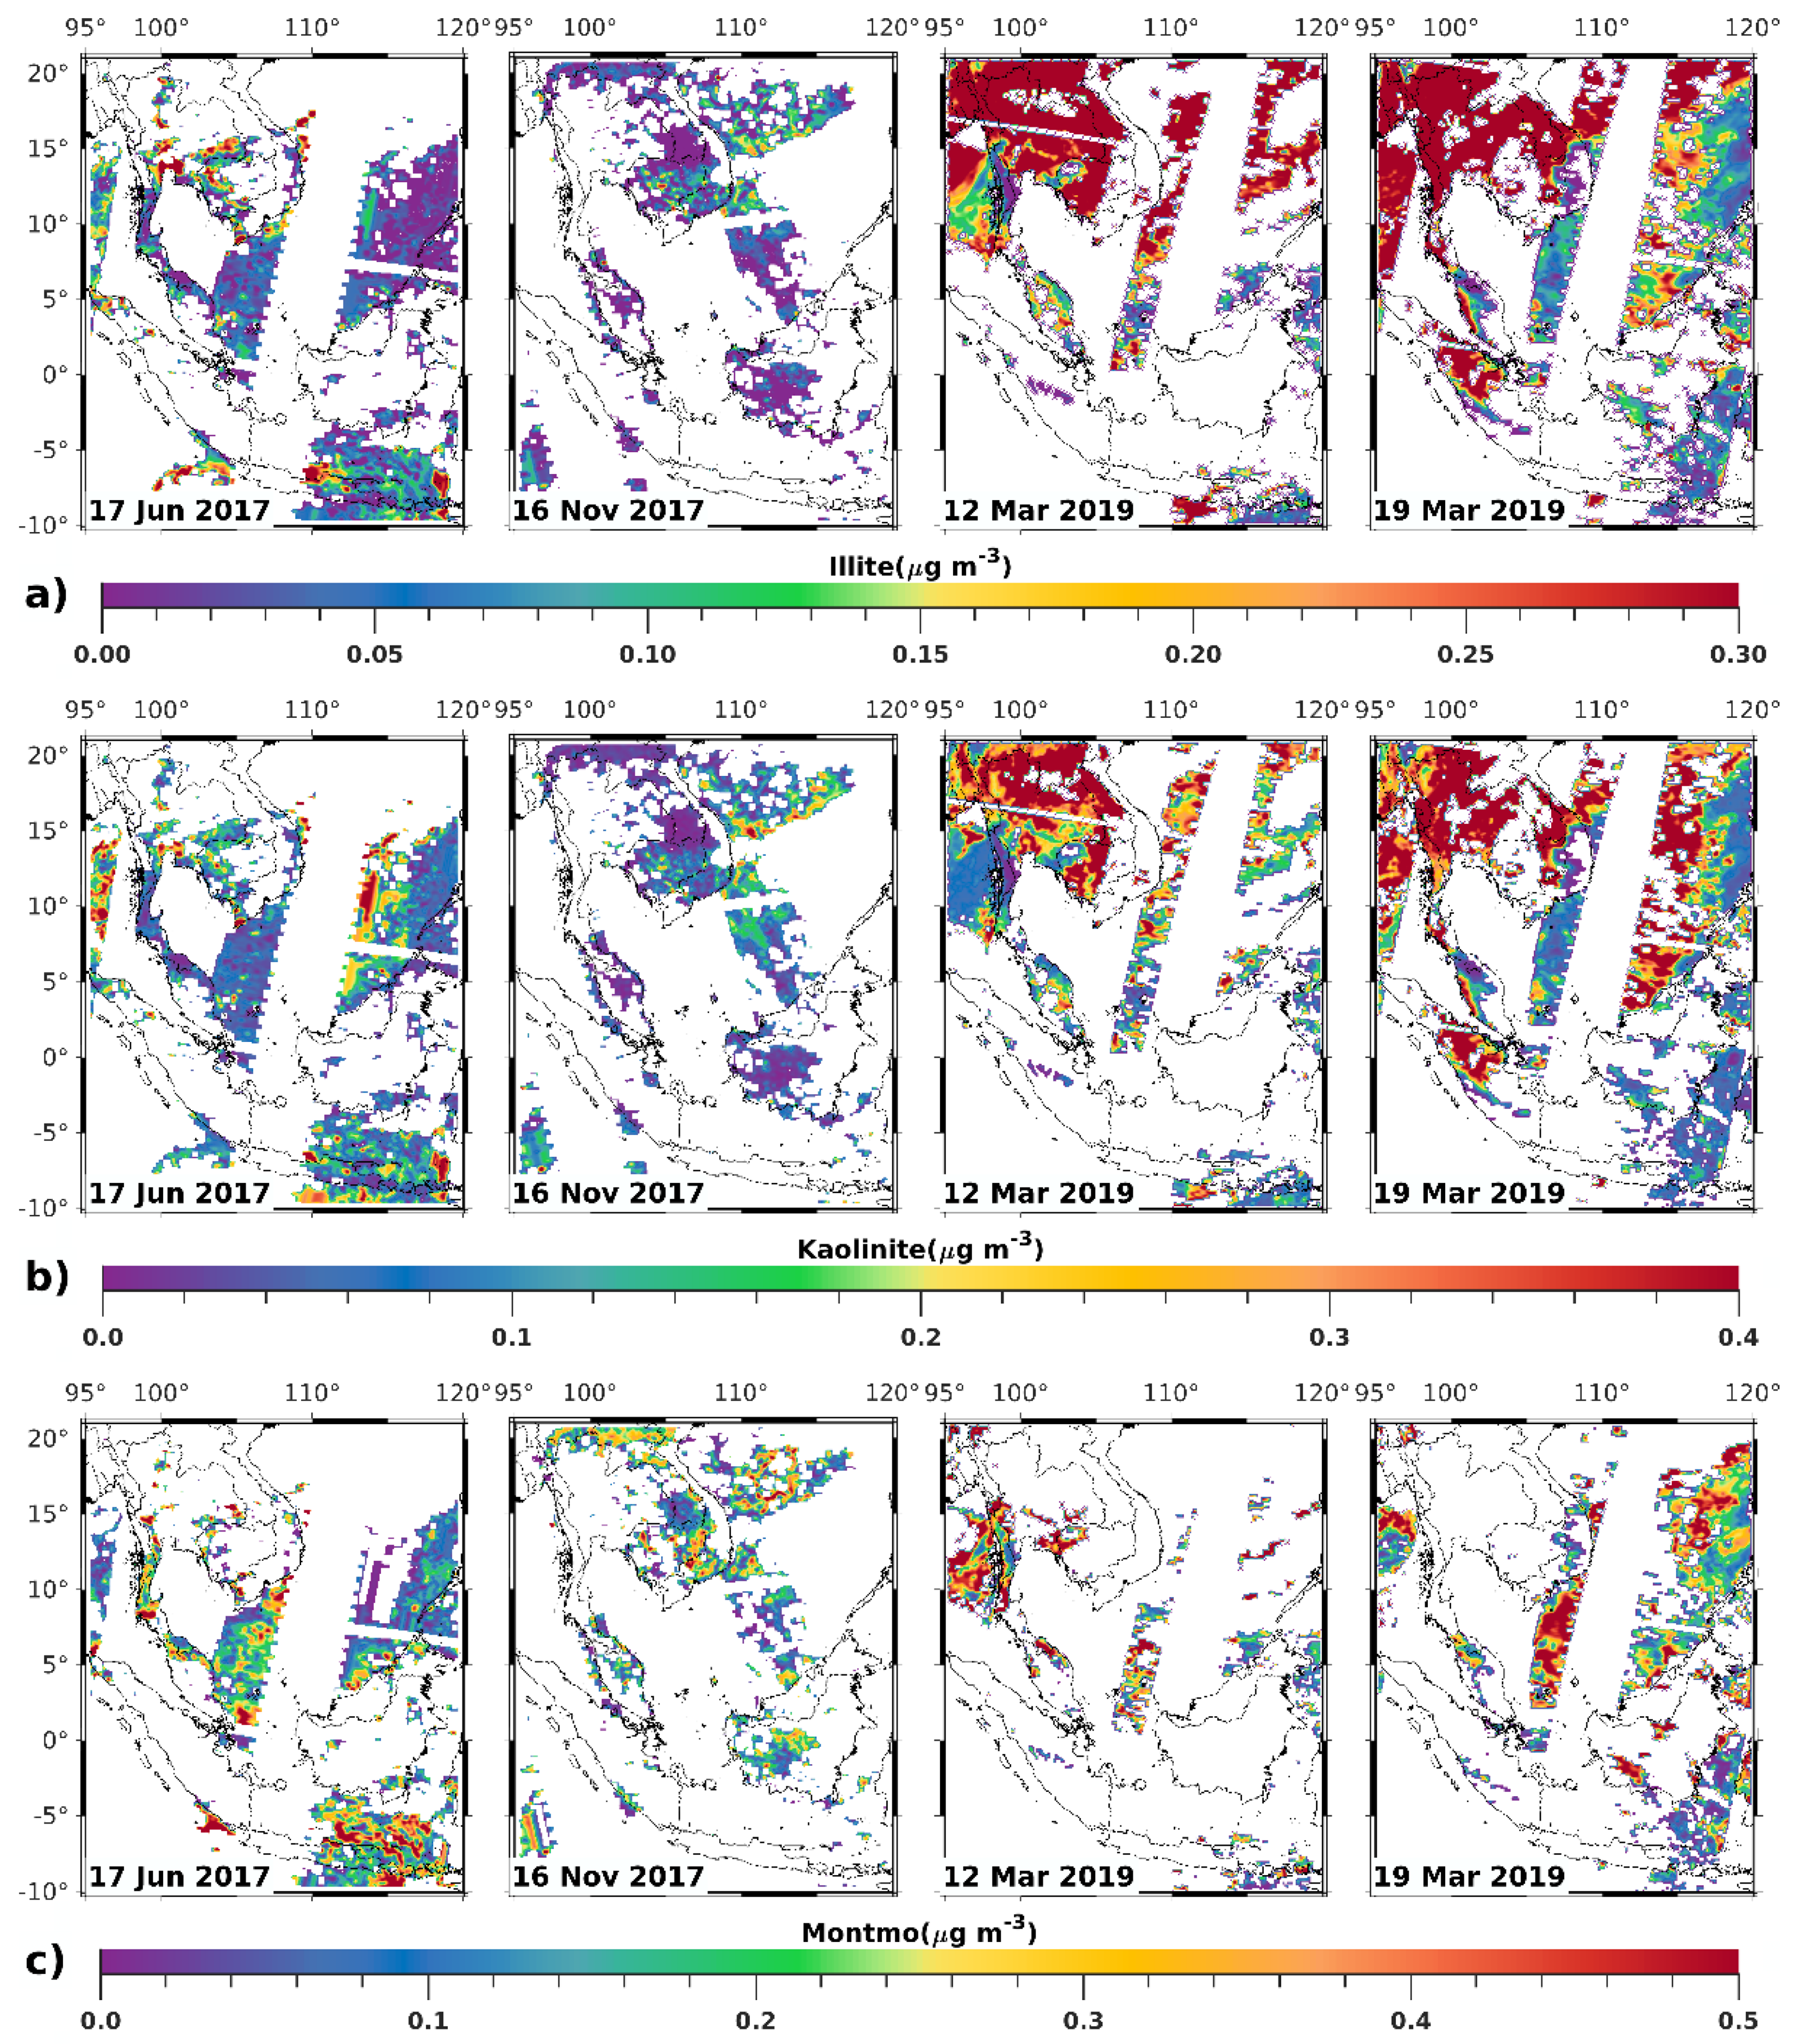
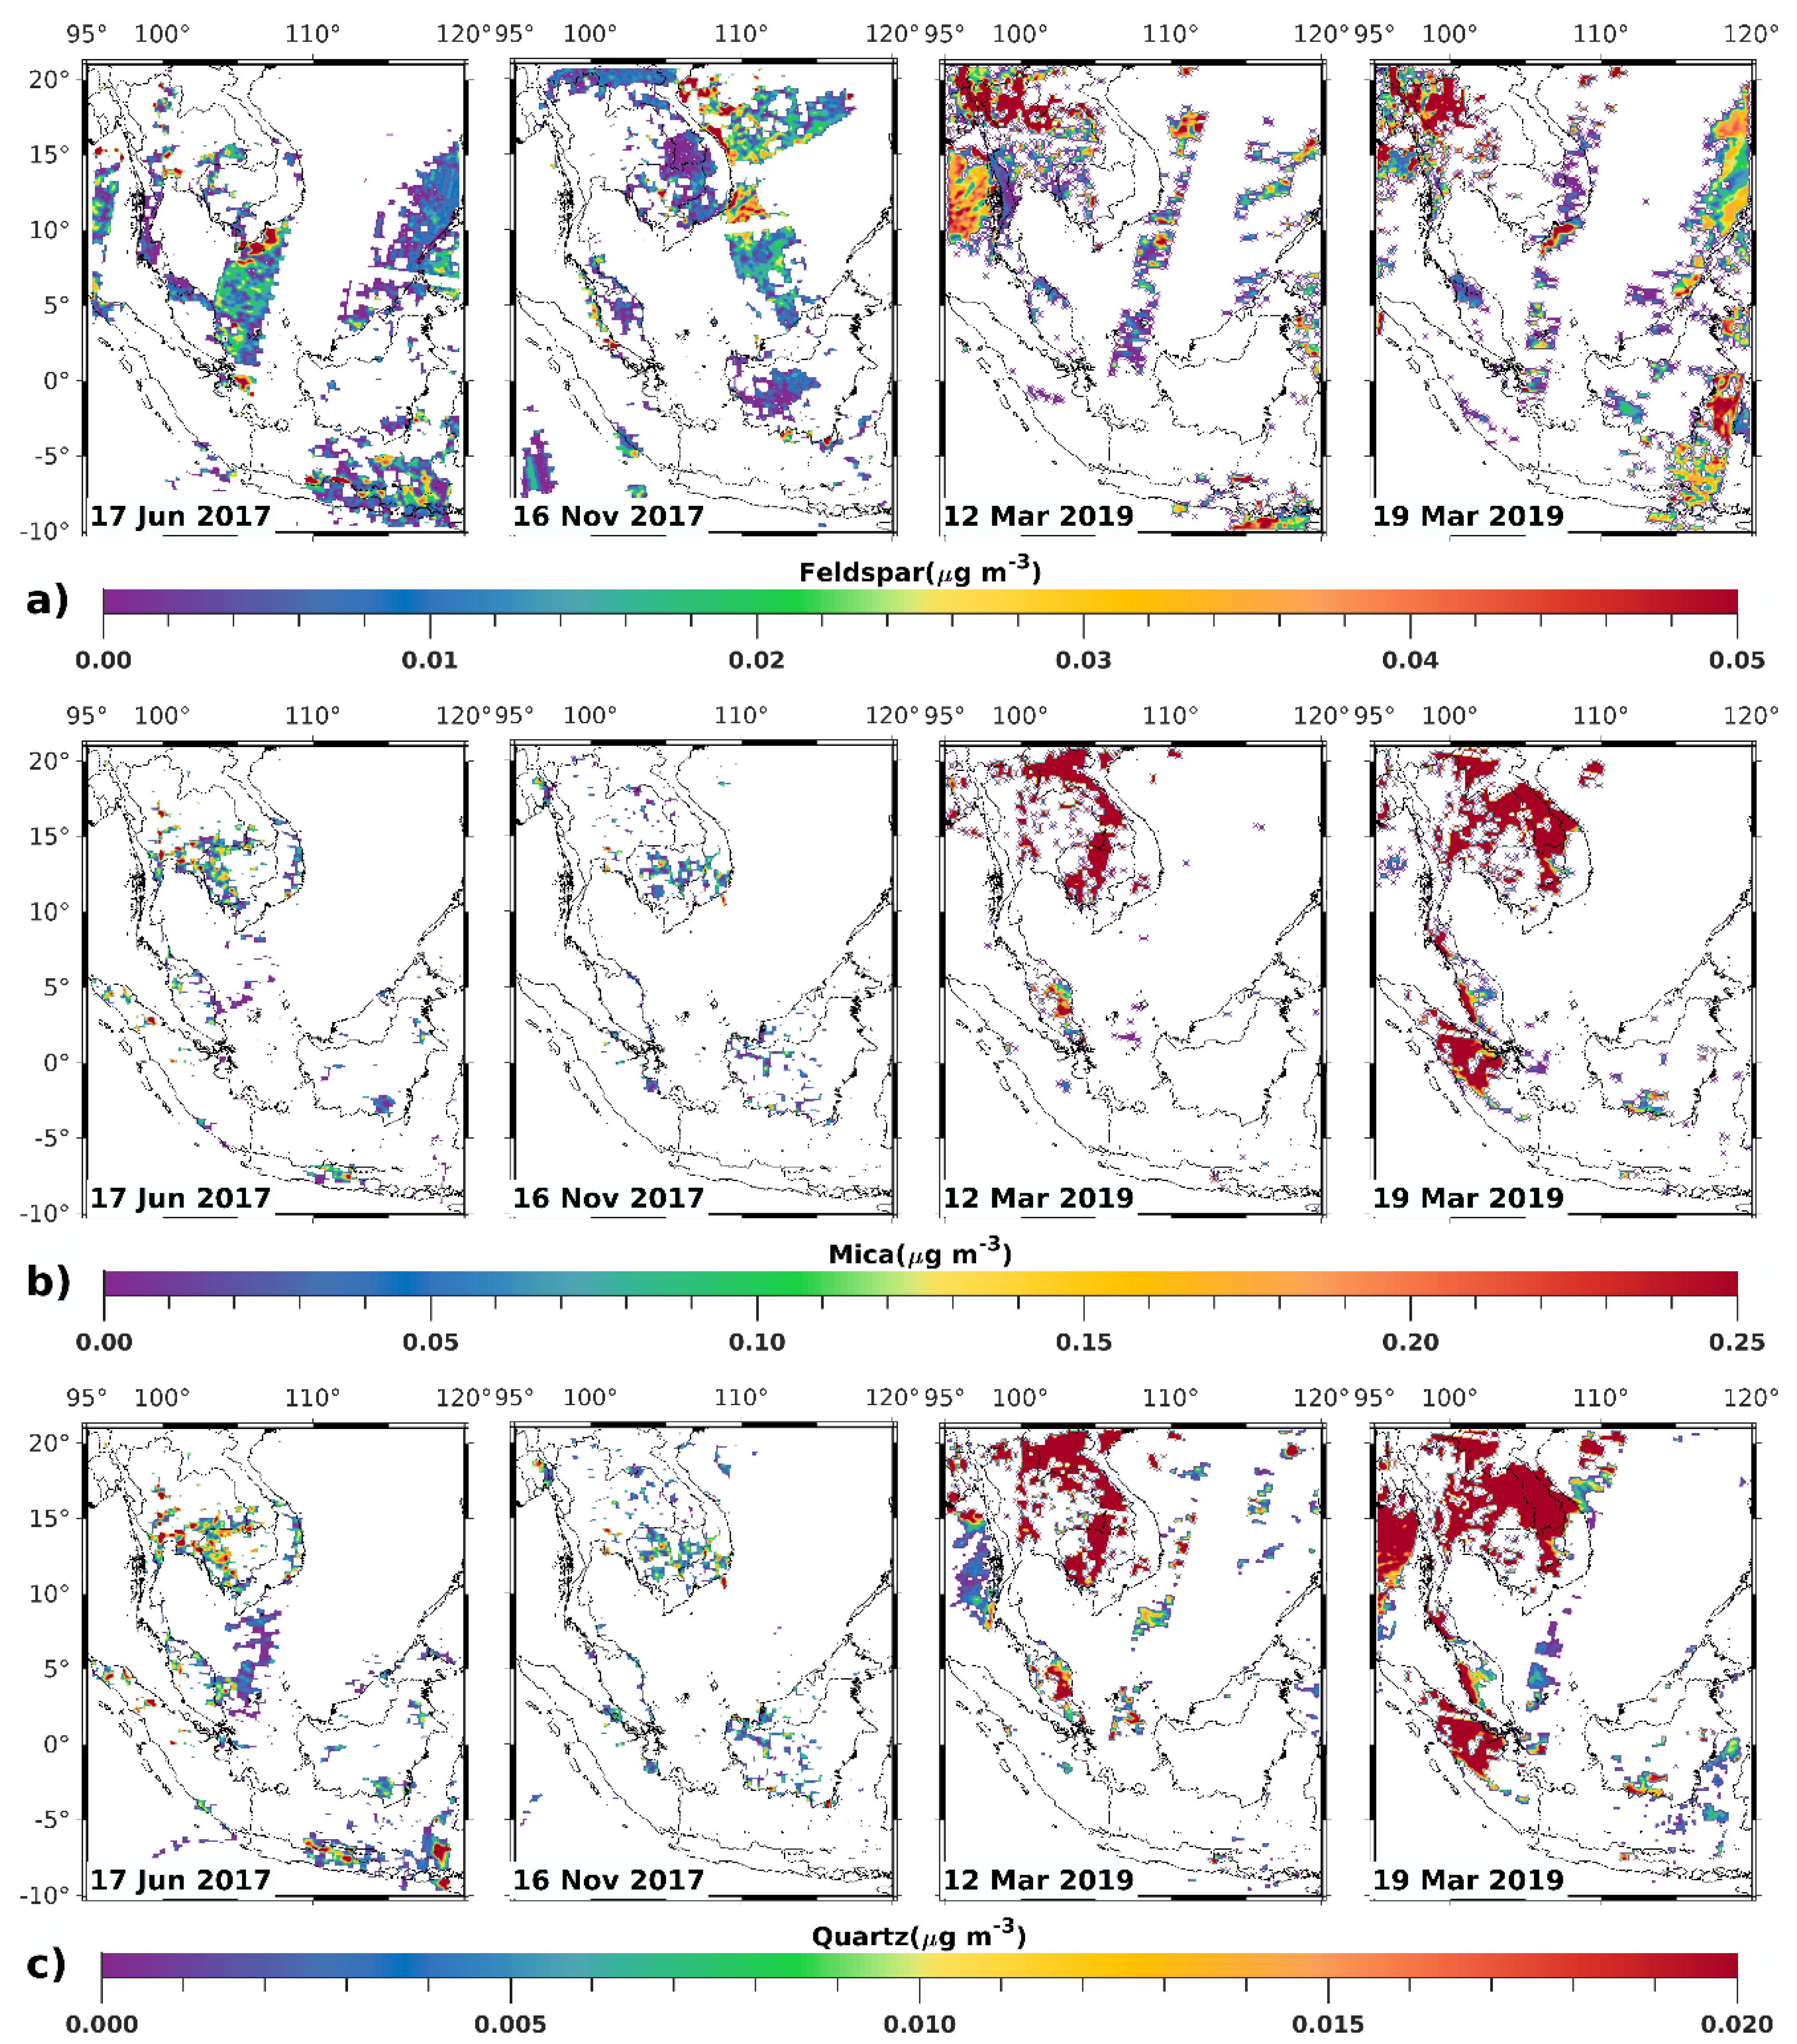
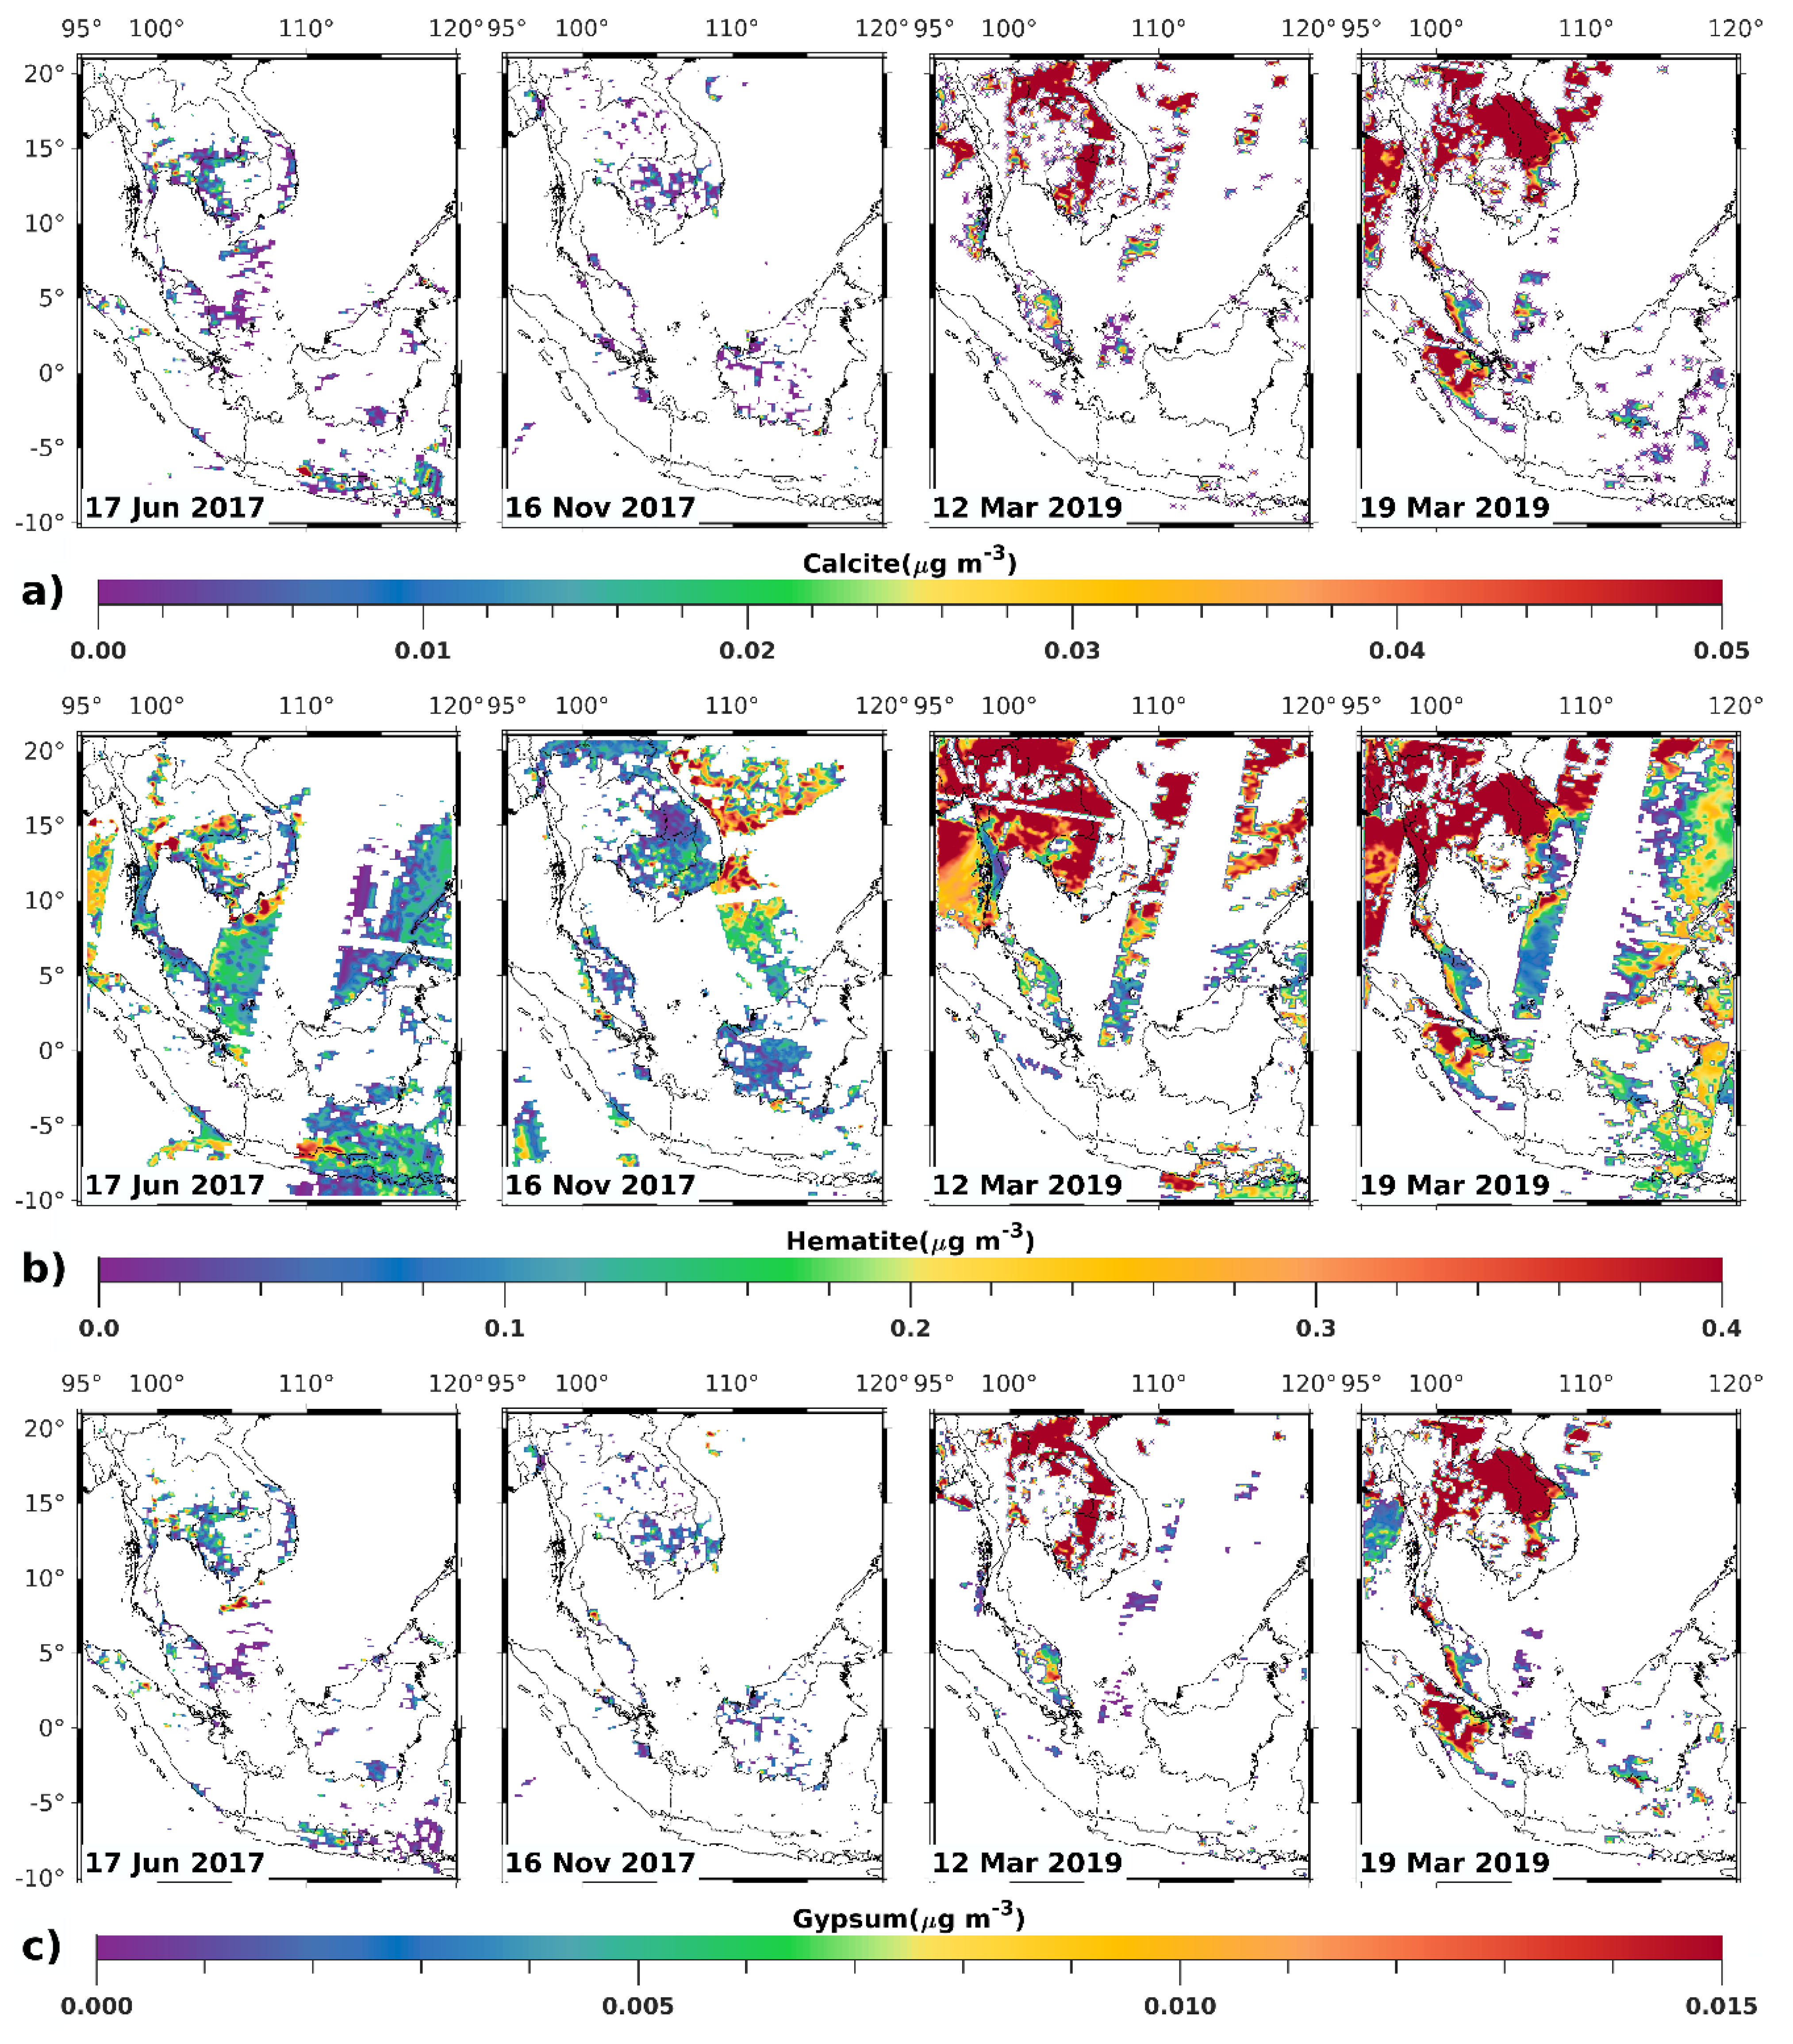
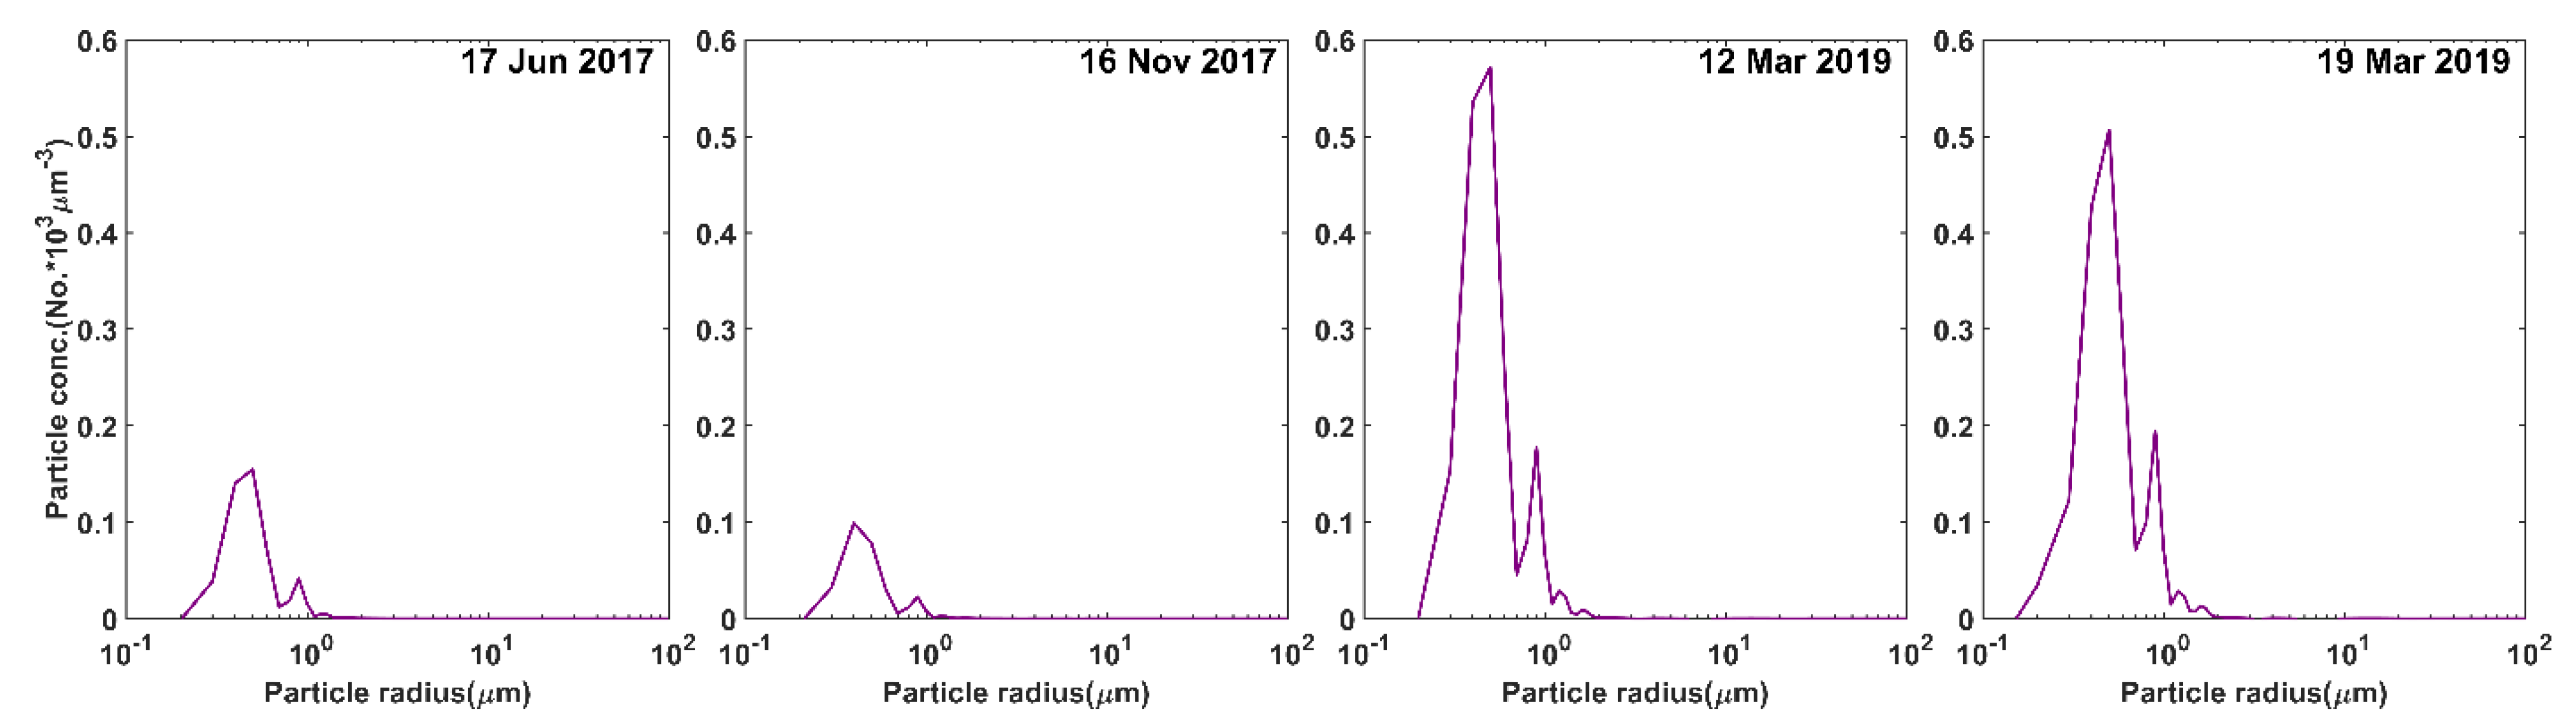
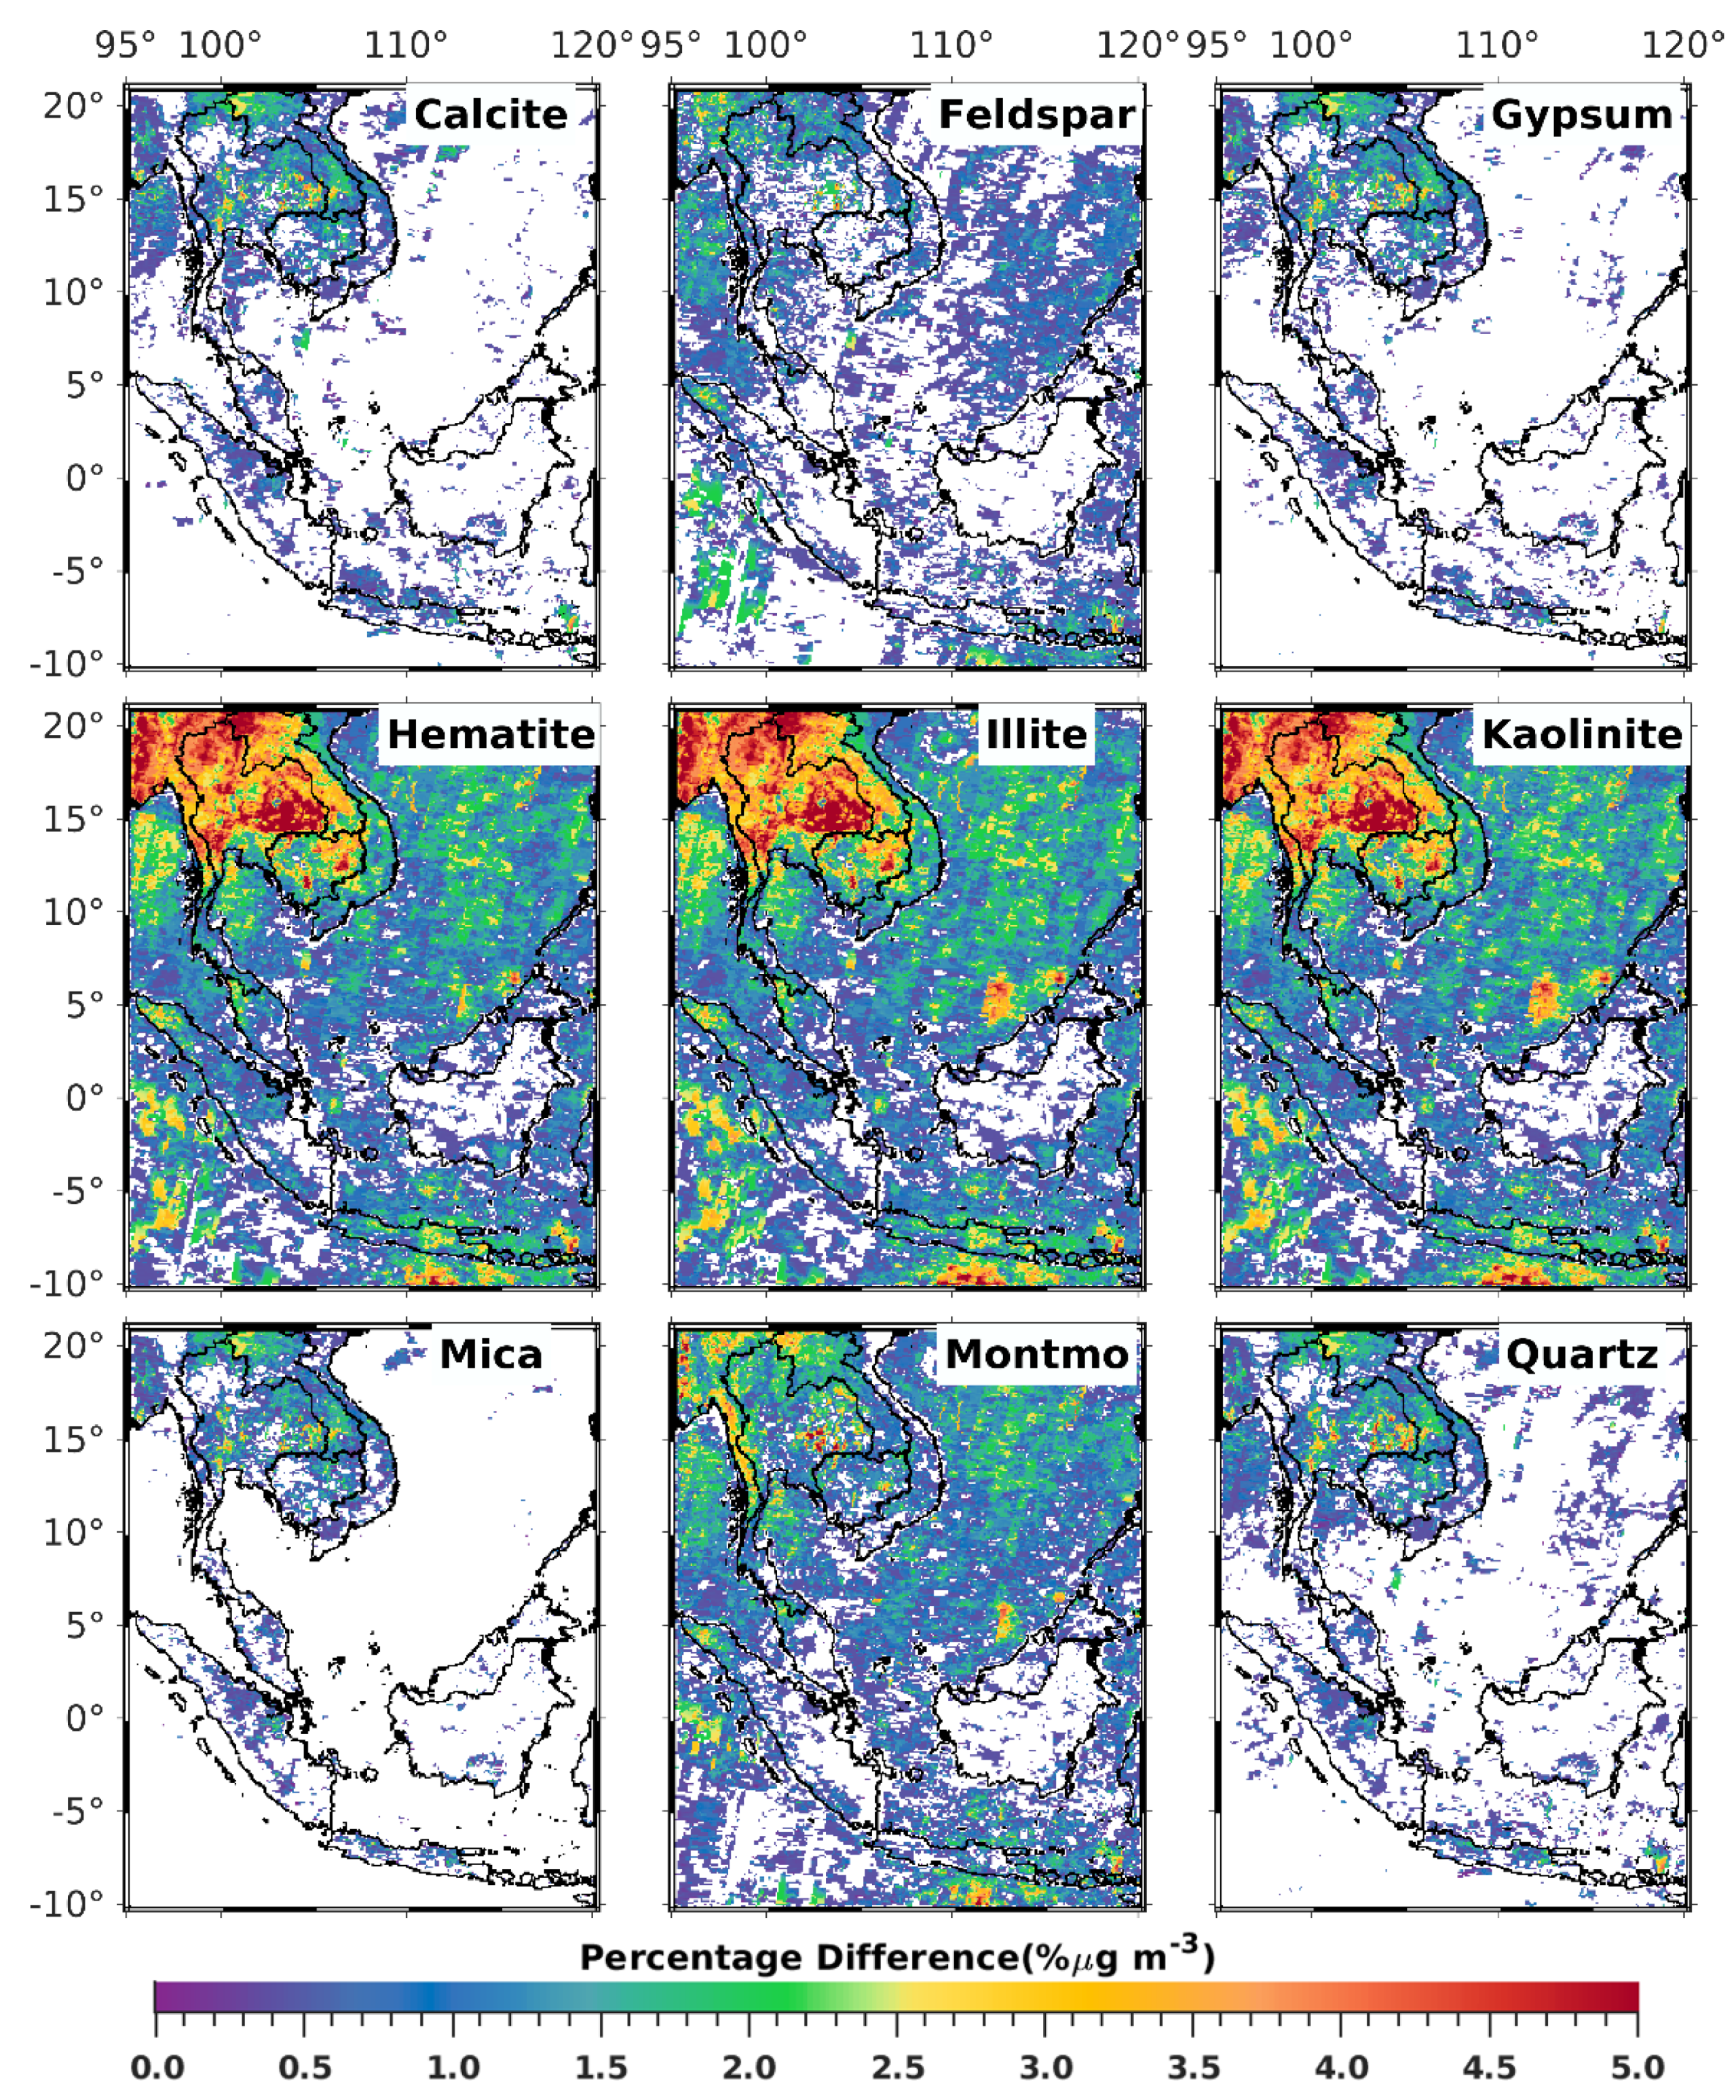
3.1. Satellite-Derived Size-Resolved Mineral Aerosol Composition
3.2. Validation of the Size-Resolved Mineral Aerosol Model
4. Discussions
5. Conclusions
Author Contributions
Funding
Data Availability Statement
Acknowledgments
Conflicts of Interest
Appendix A

| Minerals | Particle Size (Diameter) | Source |
|---|---|---|
| Illite | 0.4–2.0 μm at an interval of 0.2 μm (100%Clay) | [65,66] |
| Kaolinite | 0.4–2.0 μm at an interval of 0.2 μm (100%Clay) | [65,66] |
| Montmorillonite | 0.4–2.0 μm at an interval of 0.2 μm (100%Clay) | [65,66] |
| Hematite | 0.4–2.0 μm at an interval of 0.2 μm (100%Clay) | [67] |
| Quartz | 0.4–2.0 μm at an interval of 0.4 μm (Clay) 4.0–10 μm at an interval of 2 μm (Silt) 20–50 μm at an interval of 20 μm (Silt) | [68] |
| Calcite | 0.4–2.0 μm at an interval of 0.2 μm (Clay) 4.0–10 μm at an interval of 2 μm (Silt) 20–50 μm at an interval of 20 μm (Silt) | [66,69,70] |
| Feldspar | 0.4–2.0 μm at an interval of 0.2 μm (Clay) 4.0–10 μm at an interval of 2 μm (Silt) 20–50 μm at an interval of 20 μm (Silt) 80–100 μm at an interval of 20 μm (Sand) 100–500 μm at an interval of 250 μm (Sand) | [65] |
| Gypsum | 0.4–2.0 μm at an interval of 0.2 μm (Clay) 4.0–10 μm at an interval of 2 μm (Silt) 20–50 μm at an interval of 20 μm (Silt) 80–100 μm at an interval of 20 μm (Sand) 100–500 μm at an interval of 250 μm (Sand) | [70] |
| Mica | 2.0–10 μm at an interval of 2 μm (Silt) 20–50 μm at an interval of 20 μm (Silt) | [65] |
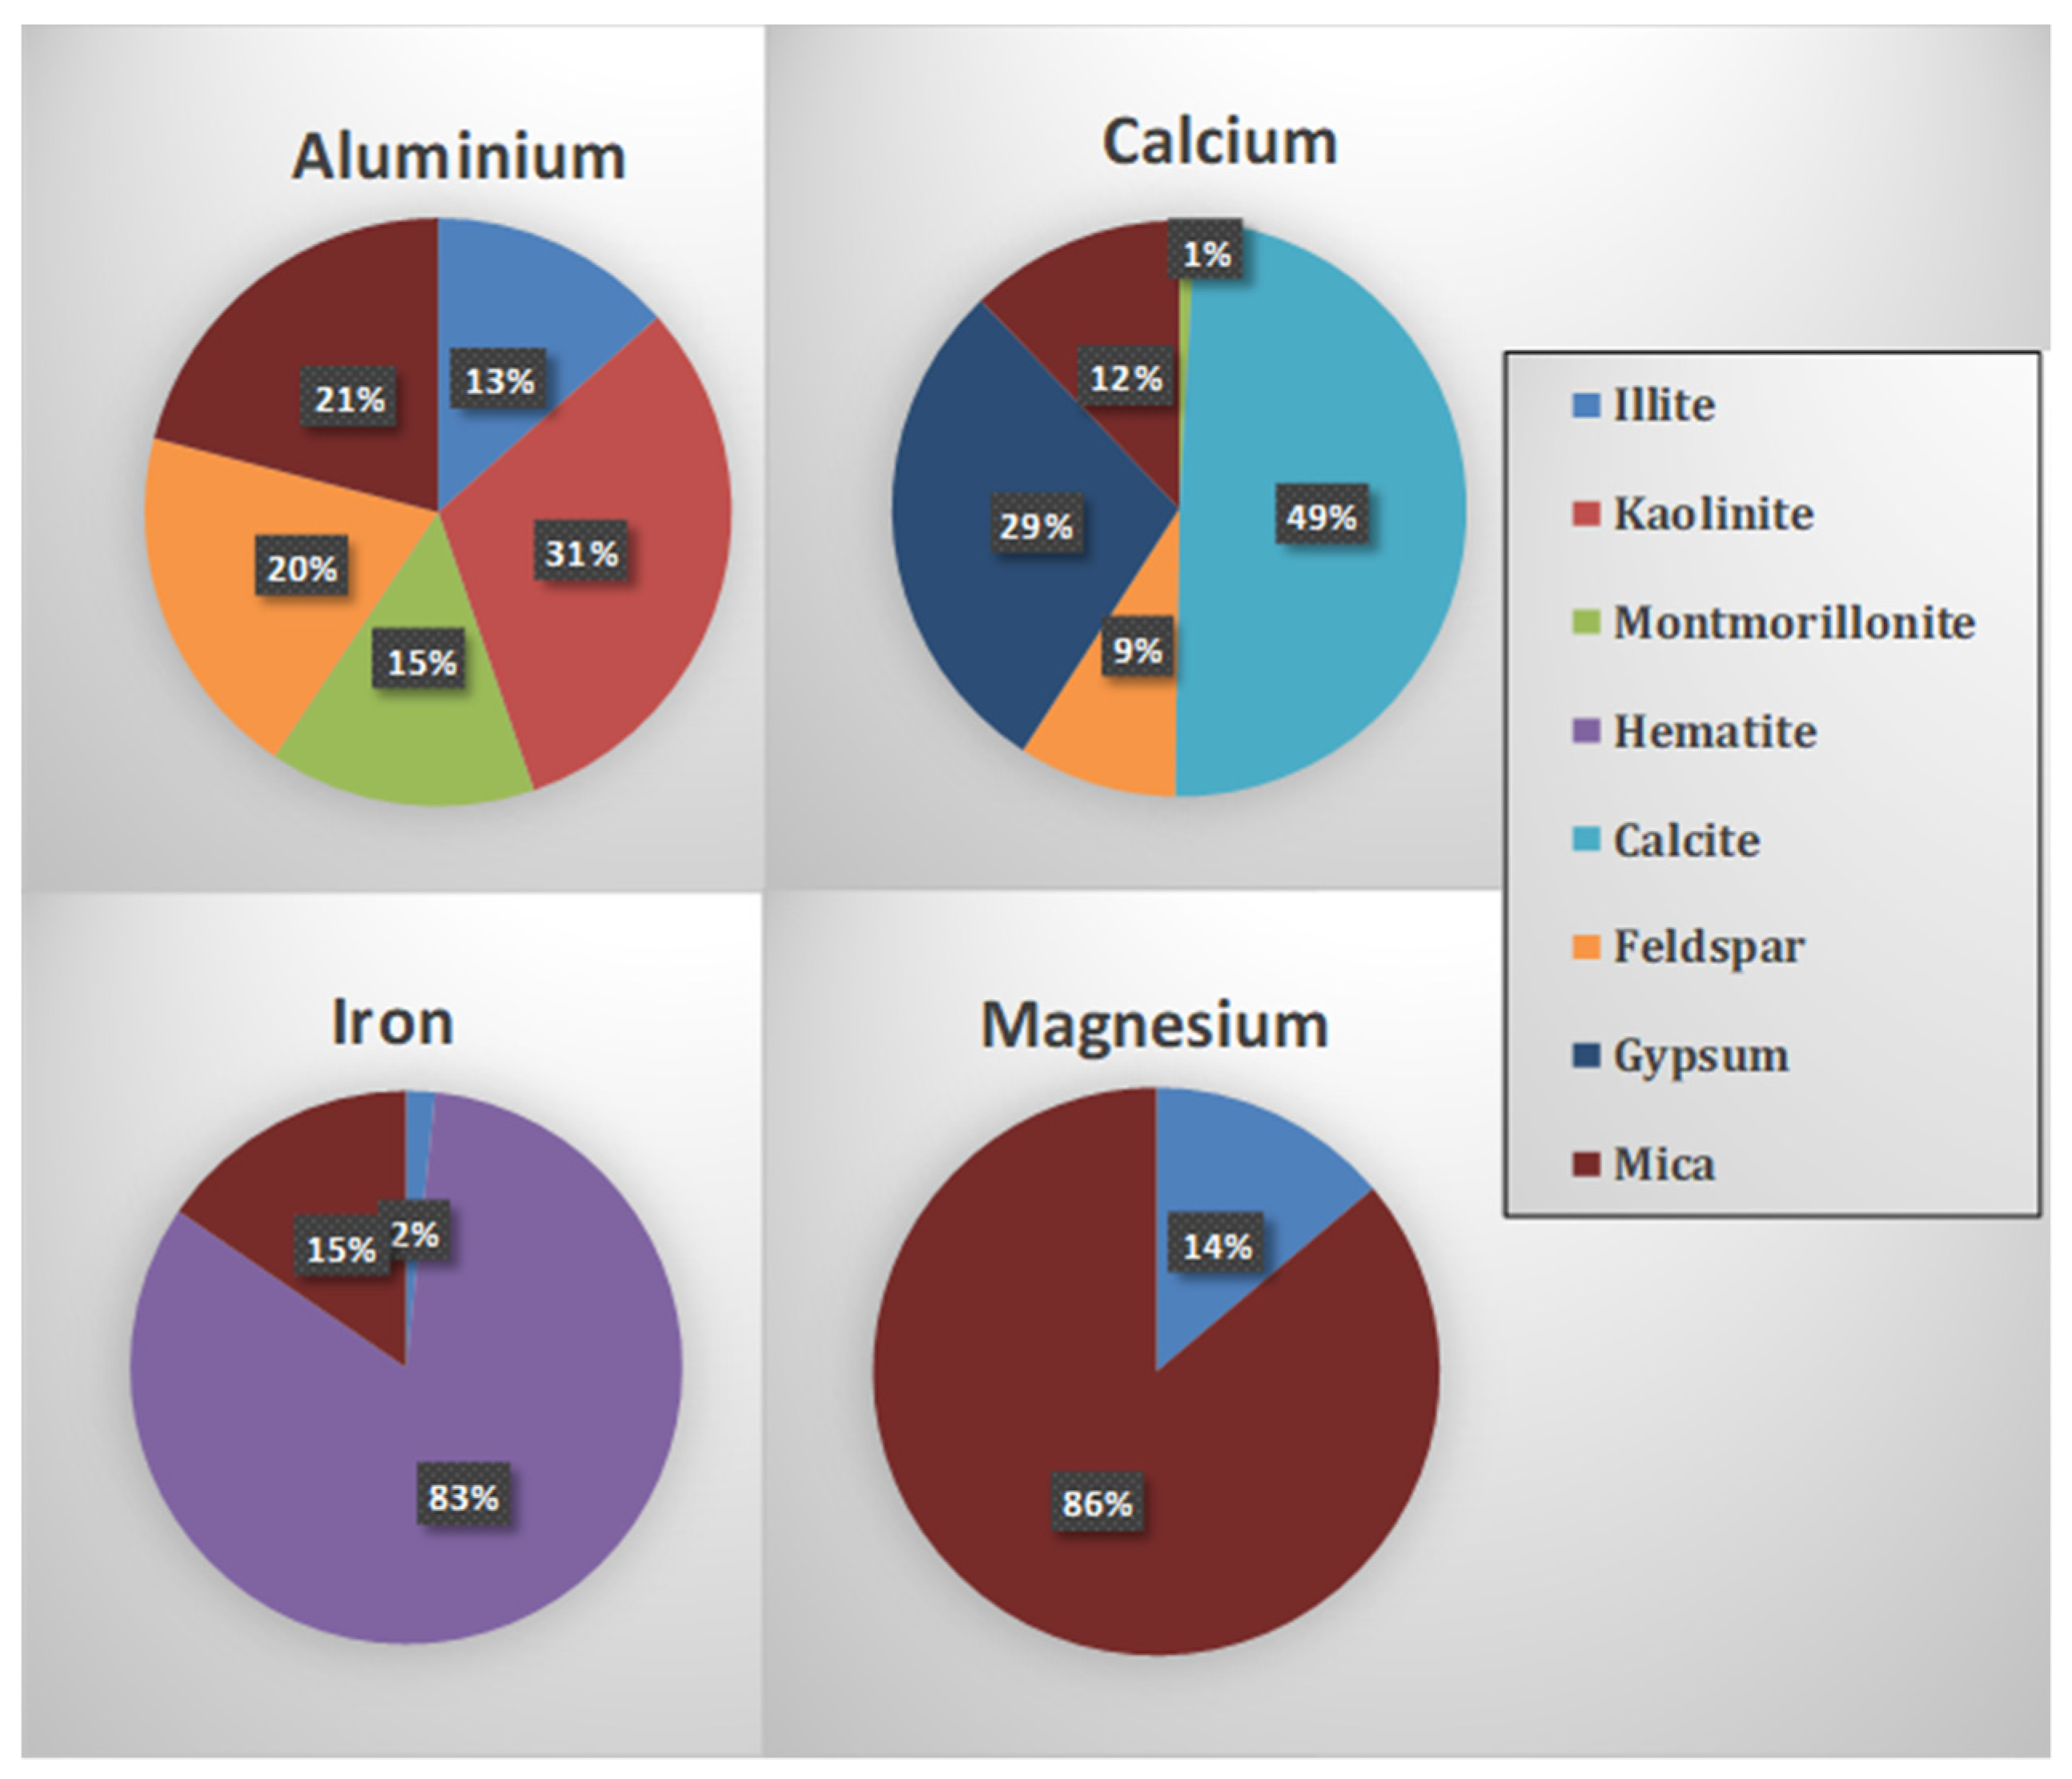
| Mineral | Empirical Formula | Al% | Fe% | Ca% | Mg% |
|---|---|---|---|---|---|
| Illite | (K,H3O)(Al,Mg,Fe)2(Si,Al) 4O10[(OH)2,(H2O)] | 9 | 1.4 | 1.9 | |
| Kaolinite | Al2Si2O5(OH)4 | 20.9 | |||
| Montmorillonite | Na0.2Ca0.1Al2Si4O10 (OH)2(H2O)10 | 9.8 | 0.7 | ||
| Hematite | Fe2O3 | 69.9 | |||
| Quartz | SiO2 | ||||
| Calcite | CaCO3 | 40 | |||
| Feldspar | (Na,Ca,K)(Al, Si)4O8 | 0 | 0 | 0 | 0 |
| Potassium Feldspar | KAlSi3O8 | 9.7 | |||
| Albite | NaAlSi3O8 | 10.8 | 0.8 | ||
| Anorthite | CaAl2Si2O8 | 19 | 13.7 | ||
| Gypsum | CaSO4. 2H2O | 23.3 | |||
| Mica | |||||
| Biotite | K(Mg,Fe++)3[AlSi3O10(OH,F)2 | 6.2 | 6.4 | 14 | |
| Muscovite | KAl2(Si3Al)O10(OH,F)2 | 20.3 | |||
| Phlogopite | KMg3(Si3Al)O10(F,OH)2 | 6.4 | 17.4 | ||
| Lepidolite | KLi2AlSi4O10F(OH) | 7 | |||
| Paragonite | NaAl3Si3O10(OH)2 | 21.2 | |||
| Glauconite | (K,Na)(Fe+++,Al,Mg)2(Si,Al) 4O10(OH)2 | 1.9 | 19.6 | 2.3 | |
| Margarite | CaAl2(Al2Si2)O10(OH)2 | 27.1 | 10.1 | ||
| Clintonite | Ca(Mg,Al)3(Al3Si)O10(OH)2 | 22.1 | 9.6 | 12.9 |

References
- Boucher, O.; Randall, D.; Artaxo, P.; Bretherton, C.; Feingold, G.; Forster, P.; Kerminen, V.-M.; Kondo, Y.; Liao, H.; Lohmann, U.; et al. Clouds and Aerosols. In Climate Change 2013: The Physical Science Basis. Contribution of Working Group I to the Fifth Assessment Report of the Intergovernmental Panel on Climate Change; Stocker, T.F., Qin, D., Plattner, G.-K., Tignor, M., Allen, S.K., Boschung, J., Nauels, A., Xia, Y., Bex, V., et al., Eds.; Cambridge University Press: Cambridge, UK; New York, NY, USA, 2013. [Google Scholar]
- Aciego, S.M.; Riebe, C.; Hart, S.C.; Blakowski, M.; Carey, C.J.; Aarons, S.M.; Dove, N.; Botthoff, J.K.; Sims, K.W.W.; Aronson, E.L. Dust outpaces bedrock in nutrient supply to montane forest ecosystems. Nat. Commun. 2017, 8, 14800. [Google Scholar] [CrossRef] [PubMed]
- Mahowald, N.M.; Scanza, R.; Brahney, J.; Goodale, C.L.; Hess, P.G.; Moore, J.K.; Neff, J. Aerosol Deposition Impacts on Land and Ocean Carbon Cycles. Curr. Clim. Chang. Rep. 2017, 3, 16–31. [Google Scholar] [CrossRef] [Green Version]
- Tegen, I.; Schepanski, K. Climate Feedback on Aerosol Emission and Atmospheric Concentrations. Curr. Clim. Chang. Rep. 2018, 4, 1–10. [Google Scholar] [CrossRef] [Green Version]
- Lelieveld, J. Clean air in the Anthropocene. Faraday Discuss. 2017, 200, 693–703. [Google Scholar] [CrossRef] [PubMed] [Green Version]
- Reid, C.E.; Brauer, M.; Johnston, F.H.; Jerrett, M.; Balmes, J.R.; Elliott, C.T. Critical Review of Health Impacts of Wildfire Smoke Exposure. Environ. Health Perspect. 2016, 124, 1334–1343. [Google Scholar] [CrossRef] [Green Version]
- Schulze, F.; Gao, X.; Virzonis, D.; Damiati, S.; Schneider, M.R.; Kodzius, R. Air Quality Effects on Human Health and Approaches for Its Assessment through Microfluidic Chips. Genes 2017, 8, 244. [Google Scholar] [CrossRef] [PubMed]
- Cohen, A.J.; Brauer, M.; Burnett, R.; Anderson, H.R.; Frostad, J.; Estep, K.; Balakrishnan, K.; Brunekreef, B.; Dandona, L.; Dandona, R.; et al. Estimates and 25-year trends of the global burden of disease attributable to ambient air pollution: An analysis of data from the Global Burden of Diseases Study. Lancet 2017, 389, 1907–1918. [Google Scholar] [CrossRef] [Green Version]
- Xing, Y.-F.; Xu, Y.-H.; Shi, M.-H.; Lian, Y.-X. The impact of PM2.5 on the human respiratory system. J. Thorac. Dis. 2016, 8, E69–E74. [Google Scholar]
- Perlwitz, J.P.; García-Pando, C.P.; Miller, R.L. Predicting the mineral composition of dust aerosols—Part 1: Representing key processes. Atmos. Chem. Phys. 2015, 15, 11593–11627. [Google Scholar] [CrossRef] [Green Version]
- Scanza, R.A.; Mahowald, N.; Ghan, S.; Zender, C.S.; Kok, J.F.; Liu, X.; Zhang, Y.; Albani, S. Modeling dust as component minerals in the Community Atmosphere Model: Development of framework and impact on radiative forcing. Atmos. Chem. Phys. 2015, 15, 537–561. [Google Scholar] [CrossRef] [Green Version]
- Xie, Y.; Li, Z.; Li, D.; Xu, H.; Li, K. Aerosol Optical and Microphysical Properties of Four Typical Sites of SONET in China Based on Remote Sensing Measurements. Remote Sens. 2015, 7, 9928–9953. [Google Scholar] [CrossRef] [Green Version]
- García-Pando, C.P.; Miller, R.L.; Perlwitz, J.P.; Rodríguez, S.; Prospero, J.M. Predicting the mineral composition of dust aerosols: Insights from elemental composition measured at the Izaña Observatory. Geophys. Res. Lett. 2016, 43, 10–520. [Google Scholar]
- Hu, Z.; Zhao, C.; Huang, J.; Leung, L.R.; Qian, Y.; Yu, H.; Kalashnikova, O.V. Trans-Pacific transport and evolution of aerosols: Evaluation of quasi-global WRF-Chem simulation with multiple obser-vations. Geosci. Model Dev. 2016, 9, 1725–1746. [Google Scholar] [CrossRef] [Green Version]
- Baumgardner, D.; Brenguier, J.L.; Bucholtz, A.; Coe, H.; DeMott, P.; Garrett, T.J.; Chuang, P. Airborne instruments to measure atmospheric aerosol particles, clouds and radiation: A cook’s tour of mature and emerging technology. Atmos. Res. 2011, 102, 10–29. [Google Scholar] [CrossRef] [Green Version]
- Formenti, P.; Schütz, L.; Balkanski, Y.; Desboeufs, K.; Ebert, M.; Kandler, K.; Petzold, A.; Scheuvens, D.; Weinbruch, S.; Zhang, D. Recent progress in understanding physical and chemical properties of African and Asian mineral dust. Atmos. Chem. Phys. 2011, 11, 8231–8256. [Google Scholar] [CrossRef] [Green Version]
- Dubovik, O.; Sinyuk, A.; Lapyonok, T.; Holben, B.N.; Mishchenko, M.; Yang, P.; Eck, T.F.; Volten, H.; Muñoz, O.; Veihelmann, B.; et al. Application of spheroid models to account for aerosol particle nonsphericity in remote sensing of desert dust. J. Geophys. Res. Atmos. 2006, 111. [Google Scholar] [CrossRef] [Green Version]
- Kaufman, Y.J.; Gitelson, A.; Karnieli, A.; Ganor, E.; Fraser, R.S.; Nakajima, T.; Mattoo, S.; Holben, B.N. Size distribution and scattering phase function of aerosol particles retrieved from sky brightness measurements. J. Geophys. Res. Earth Surf. 1994, 99, 10341–10356. [Google Scholar] [CrossRef] [Green Version]
- Li, Z.; Gu, X.; Wang, L.; Li, D.; Xie, Y.; Li, K.; Dubovik, O.; Schuster, G.; Goloub, P.; Zhang, Y.; et al. Aerosol physical and chemical properties retrieved from ground-based remote sensing measurements during heavy haze days in Beijing winter. Atmos. Chem. Phys. 2013, 13, 10171–10183. [Google Scholar] [CrossRef] [Green Version]
- Schuster, G.L.; Dubovik, O.; Arola, A. Remote sensing of soot carbon—Part 1: Distinguishing different absorbing aerosol species. Atmos. Chem. Phys. 2016, 16, 1565–1585. [Google Scholar] [CrossRef] [Green Version]
- Levy, R.C.; Mattoo, S.; Munchak, L.A.; Remer, L.A.; Sayer, A.M.; Patadia, F.; Hsu, N.C. The Collection 6 MODIS aerosol products over land and ocean. Atmos. Meas. Tech. 2013, 6, 2989–3034. [Google Scholar] [CrossRef] [Green Version]
- Hsu, N.C.; Jeong, M.-J.; Bettenhausen, C.; Sayer, A.M.; Hansell, R.; Seftor, C.S.; Huang, J.; Tsay, S.-C. Enhanced Deep Blue aerosol retrieval algorithm: The second generation. J. Geophys. Res. Atmos. 2013, 118, 9296–9315. [Google Scholar] [CrossRef]
- Wei, J.; Peng, Y.; Guo, J.; Sun, L. Performance of MODIS Collection 6.1 Level 3 aerosol products in spatial-temporal variations over land. Atmos. Environ. 2019, 206, 30–44. [Google Scholar] [CrossRef]
- Wei, J.; Sun, L.; Peng, Y.; Wang, L.; Zhang, Z.; Bilal, M.; Ma, Y. An Improved High-Spatial-Resolution Aerosol Retrieval Algorithm for MODIS Images Over Land. J. Geo-Phys. Res. Atmos. 2018, 123, 12291–12307. [Google Scholar] [CrossRef]
- Torres, O.; Tanskanen, A.; Veihelmann, B.; Ahn, C.; Braak, R.; Bhartia, P.; Veefkind, P.; Levelt, P.P. Aerosols and surface UV products from Ozone Monitoring Instrument observations: An overview. J. Geophys. Res. Earth Surf. 2007, 112, D24S47. [Google Scholar] [CrossRef] [Green Version]
- Journet, E.; Balkanski, Y.; Harrison, S.P. A new data set of soil mineralogy for dust-cycle modeling. Atmos. Chem. Phys. 2014, 14, 3801–3816. [Google Scholar] [CrossRef] [Green Version]
- Nickovic, S.; Vukovic, A.; Vujadinovic, M.; Djurdjevic, V.; Pejanovic, G. Technical Note: High-resolution mineralogical database of dust-productive soils for atmospheric dust modeling. Atmos. Chem. Phys. 2012, 12, 845–855. [Google Scholar] [CrossRef] [Green Version]
- Miller, R.L.; Cakmur, R.V.; Perlwitz, J.; Geogdzhayev, I.V.; Ginoux, P.; Koch, D.; Kohfeld, K.; Prigent, C.; Ruedy, R.; Schmidt, G.; et al. Mineral dust aerosols in the NASA Goddard Institute for Space Sciences ModelE atmospheric general circulation model. J. Geophys. Res. Earth Surf. 2006, 111, D06208. [Google Scholar] [CrossRef]
- Kalashnikova, O.; Sokolik, I. Modeling the radiative properties of nonspherical soil-derived mineral aerosols. J. Quant. Spectrosc. Radiat. Transf. 2004, 87, 137–166. [Google Scholar] [CrossRef]
- Sokolik, I.N.; Toon, O.B. Incorporation of mineralogical composition into models of the radiative properties of mineral aerosol from UV to IR wavelengths. J. Geophys. Res. Earth Surf. 1999, 104, 9423–9444. [Google Scholar] [CrossRef]
- Shen, Z.; Cao, J.; Zhang, X.-Y.; Arimoto, R.; Ji, J.; Balsam, W.; Wang, Y.; Zhang, R.; Li, X. Spectroscopic analysis of iron-oxide minerals in aerosol particles from northern China. Sci. Total Environ. 2006, 367, 899–907. [Google Scholar] [CrossRef]
- Kayee, J.; Sompongchaiyakul, P.; Sanwlani, N.; Bureekul, S.; Wang, X.; Das, R. Metal Concentrations and Source Apportionment of PM2.5 in Chiang Rai and Bangkok, Thailand during a Biomass Burning Season. ACS Earth Space Chem. 2020, 4, 1213–1226. [Google Scholar] [CrossRef]
- Kayee, J.; Bureekul, S.; Sompongchaiyakul, P.; Wang, X.; Das, R. Sources of atmospheric lead (Pb) after quarter century of phasing out of leaded gasoline in Bangkok, Thailand. Atmos. Environ. 2021, 253, 118355. [Google Scholar] [CrossRef]
- Rudnick, R.L.; Gao, S. Composition of the Continental Crust. In Treatise on Geochemistry; Rudnick, R.L., Holland, H.D., Turekian, K.K., Eds.; Elsevier: Amsterdam, The Netherlands, 2003; pp. 1–64. [Google Scholar]
- Chew, B.N.; Campbell, J.; Reid, J.S.; Giles, D.; Welton, E.J.; Salinas, S.V.; Liew, S.C. Tropical cirrus cloud contamination in sun photometer data. Atmos. Environ. 2011, 45, 6724–6731. [Google Scholar] [CrossRef]
- Ångström, A. Techniques of Determinig the Turbidity of the Atmosphere. Tellus 1961, 13, 214–223. [Google Scholar] [CrossRef] [Green Version]
- King, M.; Byrne, D.M.; Herman, B.M.; Reagan, J.A. Aerosol Size Distributions Obtained by Inversions of Spectral Optical Depth Measurements. J. Atmos. Sci. 1978, 35, 2153–2167. [Google Scholar] [CrossRef]
- Almeida, D.C.; Koepke, P.; Shettle, E. Atmos. Aerosols Global Clima-tology and Radiative Characteristics; A. Deepak Publishing: Hampton, VA, USA, 1991. [Google Scholar]
- Wang, M.; Su, J.; Li, X.; Wang, C.; Ge, J. Parameterization of The Single-Scattering Properties of Dust Aerosols in Radiative Flux Calculations. Atmosphere 2019, 10, 728. [Google Scholar] [CrossRef] [Green Version]
- Yu, X.; Shi, Y.; Wang, T.; Sun, X. Dust-concentration measurement based on Mie scattering of a laser beam. PLoS ONE 2017, 12, e0181575. [Google Scholar] [CrossRef] [Green Version]
- Lawson, C.L.; Hanson, R.J. Solving Least Squares Problems; Prentice-Hall: Englewood Cliffs, NJ, USA, 1974. [Google Scholar]
- Tripathi, M.K.; Govil, H. Evaluation of AVIRIS-NG hyperspectral images for mineral identification and mapping. Heliyon 2019, 5, e02931. [Google Scholar] [CrossRef]
- van der Meer, F.D.; van der Werff, H.M.A.; van Ruitenbeek, F.J.A.; Hecker, C.A.; Bakker, W.H.; Noomen, M.F.; van der Meijde, M.; Carranza, E.J.M.; de Smeth, J.B.; Woldai, T. Multi- and hyperspectral geologic remote sensing: A review. Int. J. Appl. Earth Obs. Geoinf. 2012, 14, 112–128. [Google Scholar] [CrossRef]
- Kahn, R.A.; Gaitley, B.J.; Garay, M.J.; Diner, D.J.; Eck, T.F.; Smirnov, A.; Holben, B.N. Multiangle Imaging SpectroRadiometer global aerosol product assessment by comparison with the Aerosol Robotic Network. J. Geophys. Res. Earth Surf. 2010, 115, 23. [Google Scholar] [CrossRef]
- Vadrevu, K.P.; Lasko, K.; Giglio, L.; Justice, C. Vegetation fires, absorbing aerosols and smoke plume characteristics in diverse biomass burning regions of Asia. Environ. Res. Lett. 2015, 10, 105003. [Google Scholar] [CrossRef] [Green Version]
- Reid, J.S.; Hyer, E.J.; Johnson, R.S.; Holben, B.N.; Yokelson, R.; Zhang, J.; Campbell, J.; Christopher, S.A.; Di Girolamo, L.; Giglio, L.; et al. Observing and understanding the Southeast Asian aerosol system by remote sensing: An initial review and analysis for the Seven Southeast Asian Studies (7SEAS) program. Atmos. Res. 2013, 122, 403–468. [Google Scholar] [CrossRef] [Green Version]
- Eck, T.F.; Holben, B.N.; Reid, J.S.; Dubovik, O.; Smirnov, A.; O’Neill, N.T.; Slutsker, I.; Kinne, S. Wavelength Dependence of the Optical Depth of Biomass Burning, Urban, and Desert Dust Aerosols. J. Geophys. Res. Atmos. 1999, 104, 31333–31349. [Google Scholar] [CrossRef]
- Satheesh, S.K.; Moorthy, K.K.; Babu, S.S.; Vinoj, V.; Nair, V.S.; Beegum, N.; Dutt, C.B.S.; Alappattu, D.P.; Kunhikrishnan, P.K. Vertical structure and horizontal gradients of aerosol extinction coefficients over coastal India inferred from airborne lidar measurements during the Integrated Campaign for Aerosol, Gases and Radiation Budget (ICARB) field campaign. J. Geophys. Res. Earth Surf. 2009, 114, D05204. [Google Scholar] [CrossRef]
- Iglesias, T.; Cala, V.; Gonzalez, J. Mineralogical and chemical modifications in soils affected by a forest fire in the Mediterranean area. Sci. Total Environ. 1997, 204, 89–96. [Google Scholar] [CrossRef]
- Ulery, A.L.; Graham, R.C.; Amrhein, C. Wood-Ash Composition and Soil Ph Following Intense Burning. Soil Sci. 1993, 156, 358–364. [Google Scholar] [CrossRef]
- Kumar, B.; Rai, S.P.; Kumar, U.S.; Verma, S.K.; Garg, P.; Kumar, S.V.V.; Jaiswal, R.; Purendra, B.K.; Pande, N.G. Isotopic characteristics of Indian precipitation. Water Resour. Res. 2010, 46. [Google Scholar] [CrossRef]
- Xu, Z.; Wu, Y.; Liu, W.-J.; Liang, C.-S.; Ji, J.; Zhao, T.; Zhang, X. Chemical composition of rainwater and the acid neutralizing effect at Beijing and Chizhou city, China. Atmos. Res. 2015, 164, 278–285. [Google Scholar] [CrossRef]
- Formenti, P.; Caquineau, S.; Chevaillier, S.; Klaver, A.; Desboeufs, K.; Rajot, J.L.; Belin, S.; Briois, V. Dominance of goethite over hematite in iron oxides of mineral dust from Western Africa: Quantitative partitioning by X-ray absorption spectroscopy. J. Geophys. Res. Atmos. 2014, 119, 12740–12754. [Google Scholar] [CrossRef]
- Shi, Z.; Krom, M.D.; Jickells, T.D.; Bonneville, S.; Carslaw, K.S.; Mihalopoulos, N.; Baker, A.R.; Benning, L.G. Impacts on iron solubility in the mineral dust by processes in the source region and the atmosphere: A review. Aeolian Res. 2012, 5, 21–42. [Google Scholar] [CrossRef]
- Reynolds, R.L.; Goldstein, H.L.; Moskowitz, B.M.; Bryant, A.C.; Skiles, S.M.; Kokaly, R.F.; Flagg, C.B.; Yauk, K.; Berquó, T.; Breit, G.; et al. Composition of dust deposited to snow cover in the Wasatch Range (Utah, USA): Controls on radiative properties of snow cover and comparison to some dust-source sediments. Aeolian Res. 2014, 15, 73–90. [Google Scholar] [CrossRef]
- Jickells, T.D.; An, Z.S.; Andersen, K.K.; Baker, A.R.; Bergametti, G.; Brooks, N.; Cao, J.J.; Boyd, P.W.; Duce, R.A.; Hunter, K.A.; et al. Global Iron Connections Between Desert Dust, Ocean Biogeochemistry, and Climate. Science 2005, 308, 67–71. [Google Scholar] [CrossRef] [Green Version]
- Takahashi, Y.; Miyoshi, T.; Higashi, M.; Kamioka, H.; Kanai, Y. Neutralization of Calcite in Mineral Aerosols by Acidic Sulfur Species Collected in China and Japan Studied by Ca K-edge X-ray Absorption Near-Edge Structure. Environ. Sci. Technol. 2009, 43, 6535–6540. [Google Scholar] [CrossRef] [PubMed]
- See, S.W.; Balasubramanian, R.; Rianawati, E.; Karthikeyan, S.; Streets, D.G. Characterization and Source Apportionment of Particulate Matter ≤ 2.5 μm in Sumatra, Indonesia, during a Recent Peat Fire Episode. Environ. Sci. Technol. 2007, 41, 3488–3494. [Google Scholar] [CrossRef] [PubMed]
- Betha, R.; Pradani, M.; Lestari, P.; Joshi, U.M.; Reid, J.; Balasubramanian, R. Chemical speciation of trace metals emitted from Indonesian peat fires for health risk assessment. Atmos. Res. 2013, 122, 571–578. [Google Scholar] [CrossRef]
- Lin, N.-H.; Tsay, S.-C.; Maring, H.B.; Yen, M.-C.; Sheu, G.-R.; Wang, S.-H.; Chi, K.H.; Chuang, M.-T.; Ou-Yang, C.-F.; Fu, J.; et al. An overview of regional experiments on biomass burning aerosols and related pollutants in Southeast Asia: From BASE-ASIA and the Dongsha Experiment to 7-SEAS. Atmos. Environ. 2013, 78, 1–19. [Google Scholar] [CrossRef] [Green Version]
- Hammer, M.S.; Martin, R.V.; van Donkelaar, A.; Buchard, V.; Torres, O.; Ridley, D.A.; Spurr, R.J.D. Interpreting the ultraviolet aerosol index observed with the OMI satellite instrument to understand absorption by organic aerosols: Implications for atmospheric oxidation and direct radiative effects. Atmos. Chem. Phys. 2016, 16, 2507–2523. [Google Scholar] [CrossRef] [Green Version]
- Marey, H.S.; Gille, J.C.; El-Askary, H.M.; Shalaby, E.A.; El-Raey, M.E. Aerosol climatology over Nile Delta based on MODIS, MISR and OMI satellite data. Atmos. Chem. Phys. 2011, 11, 10637–10648. [Google Scholar] [CrossRef] [Green Version]
- Kumar, K.R.; Yin, Y.; Sivakumar, V.; Kang, N.; Yu, X.; Diao, Y.; Adesina, J.; Reddy, R. Aerosol climatology and discrimination of aerosol types retrieved from MODIS, MISR and OMI over Durban (29.88°S, 31.02°E), South Africa. Atmos. Environ. 2015, 117, 9–18. [Google Scholar] [CrossRef]
- Bhatia, N.; Tolpekin, V.A.; Stein, A.; Reusen, I. Estimation of AOD Under Uncertainty: An Approach for Hyperspectral Airborne Data. Remote Sens. 2018, 10, 947. [Google Scholar] [CrossRef] [Green Version]
- Egan, W.G.; Hilgeman, T.W. Optical Properties of Inhomogeneous Materials: Applications to Geology, Astronomy, Chemistry, and Engineering; Academic Press: San Diego, CA, USA, 1979. [Google Scholar]
- Querry, M.R.; Osborne, G.; Lies, K.; Jordon, R.; Coveney, R.M. Complex refractive index of limestone in the visible and infrared. Appl. Opt. 1978, 17, 353–356. [Google Scholar] [CrossRef] [PubMed] [Green Version]
- Querry, M.R. Optical Constants; U.S. Army Chemical Research and Development Center (CRDC): Aberdeen, MD, USA, 1985; p. 418. 21001.
- Malitson, I.H. Interspecimen comparison of the refractive index of fused silica. J. Opt. Soc. Am. 1965, 55, 1205–1209. [Google Scholar] [CrossRef]
- Ghosh, G. Dispersion-equation coefficients for the refractive index and birefringence of calcite and quartz crystals. Opt. Commun. 1999, 163, 95–102. [Google Scholar] [CrossRef]
- Long, L.; Querry, M.; Bell, R.; Alexander, R. Optical properties of calcite and gypsum in crystalline and powdered form in the infrared and far-infrared. Infrared Phys. 1993, 34, 191–201. [Google Scholar] [CrossRef]
Publisher’s Note: MDPI stays neutral with regard to jurisdictional claims in published maps and institutional affiliations. |
© 2022 by the authors. Licensee MDPI, Basel, Switzerland. This article is an open access article distributed under the terms and conditions of the Creative Commons Attribution (CC BY) license (https://creativecommons.org/licenses/by/4.0/).
Share and Cite
Sanwlani, N.; Das, R. Understanding Haze: Modeling Size-Resolved Mineral Aerosol from Satellite Remote Sensing. Remote Sens. 2022, 14, 761. https://doi.org/10.3390/rs14030761
Sanwlani N, Das R. Understanding Haze: Modeling Size-Resolved Mineral Aerosol from Satellite Remote Sensing. Remote Sensing. 2022; 14(3):761. https://doi.org/10.3390/rs14030761
Chicago/Turabian StyleSanwlani, Nivedita, and Reshmi Das. 2022. "Understanding Haze: Modeling Size-Resolved Mineral Aerosol from Satellite Remote Sensing" Remote Sensing 14, no. 3: 761. https://doi.org/10.3390/rs14030761
APA StyleSanwlani, N., & Das, R. (2022). Understanding Haze: Modeling Size-Resolved Mineral Aerosol from Satellite Remote Sensing. Remote Sensing, 14(3), 761. https://doi.org/10.3390/rs14030761