Article

From SMOS Soil Moisture to 3-hour Precipitation Estimates at 0.1° Resolution in Africa

by
Thierry Pellarin
1,*,
Alexandre Zoppis
1,
Carlos Román-Cascón
2,
Yann H. Kerr
3,
Nemesio Rodriguez-Fernandez
3,
Geremy Panthou
1,
Nathalie Philippon
1 and
Jean-Martial Cohard
1
1
CNRS, IRD, Univ. Grenoble Alpes, Grenoble INP, IGE, F-38000 Grenoble, France
2
Departamento de Física de la Tierra y Astrofísica, Universidad Complutense de Madrid, 28040 Madrid, Spain
3
Centre d’Etudes Spatiales de la Biosphère (CESBIO), Toulouse University, 31013 Toulouse, France
*
Author to whom correspondence should be addressed.
Remote Sens. 2022, 14(3), 746; https://doi.org/10.3390/rs14030746
Submission received: 23 December 2021 / Revised: 28 January 2022 / Accepted: 3 February 2022 / Published: 5 February 2022

Abstract

:
Several recent studies have shown that knowledge of the spatiotemporal dynamics of soil moisture intrinsically contains information on precipitation. In this study, we show how SMOS measurements can be used to generate a near-real-time precipitation product with a spatial resolution of 0.1° and a temporal resolution of 3 h. The principle consists of assimilating the SMOS data into a model that simulates the evolution of soil moisture, which is forced by a satellite precipitation product. The assimilation of SMOS soil moisture leads to an adjustment of the satellite precipitation rates. Using data from more than 200 rain gauges set up in Africa between 2010 and 2021, we show that the PrISM algorithm (for Precipitation Inferred from Soil Moisture) almost systematically improves the initial precipitation product. One of the original features of this study is that we used the IMERG-Early satellite precipitation product, which has a finer spatial resolution (0.1°) than SMOS (~0.25°). Despite this, the methodology reduces both the RMSE and bias of IMERG-Early. The RMSE is reduced from 8.0 to 6.3 mm/day, and the absolute bias is reduced from 0.81 to 0.63 mm/day on average over the 200 rain gauges. PrISM performs even slightly better on average than IMERG-Final in terms of RMSE (6.8 mm/day for IMERG-Final) but better scores are obtained by IMERG-Final in terms of absolute bias (0.35 mm/day), which utilizes a network of field measurements to correct the biases of the IMERG-Early product with a 2.5-month delay. Therefore, the use of SMOS soil moisture measurements for Africa can be an advantageous alternative to the use of gauge measurements for debiasing rainfall satellite products in real time.

1. Introduction

Precipitation is a vital resource in Africa, where a large proportion of the population depends on rain-fed agriculture. Africa is also one of the most vulnerable regions in the world to climate change, which has an impact on natural resources (water, vegetation) and consequently on the well-being of populations in societies where the economy is mainly based on agriculture [1]. Knowledge of the spatiotemporal distribution of rainfall is essential for various applications such as water resources management, flood forecasting, dam management, agricultural crop yield estimates, groundwater recharge estimation and irrigation demand. Rain gauges provide the most common and direct measurement of precipitation at a point and are therefore generally considered the most accurate method of measuring rainfall. However, Africa does not have a dense network of rain gauges and operational radar facilities are almost non-existent [2]. The number of rain gauges is often below the minimum recommended by the World Meteorological Organization (WMO) and rain gauge networks of several countries have deteriorated significantly over the past few decades [3].
To compensate for this lack of in situ measurements, satellite precipitation products represent an attractive alternative to provide information about rainfall in Africa. Numerous studies have been carried out over the last few decades to evaluate the quality of different satellite precipitation products. In the context of Africa, one can cite the following papers [4,5,6,7,8,9,10,11]. While significant progress has been made in satellite precipitation estimation in recent years, there are still significant uncertainties and biases (wet or dry) so that products have to use rain gauge measurements to reduce them [12]. Thus, most satellite precipitation products are available in two versions: a real-time version that relies only on satellite data or model outputs, and a final version (sometimes called adjusted or debiased) that uses information from ground-based rain gauge networks to correct the biases of the real-time version. These versions are often available after a delay, 1 to 3 months between measurement and availability of the product.
Since the first use of military radar (active microwave sensor) for precipitation estimation by David Atlas in the 1950s, precipitation estimation algorithms have been continuously improved to consider the complexity of a precipitation field. Indeed, a precipitation field generally contains icy hydrometeors at high altitudes, which turn into snow around 0 °C, then into raindrops above 0 °C. All these hydrometeors are of different sizes and shapes, which makes the relationship between radar reflectivity and precipitation rate very difficult to find, and leads to radar precipitation fields that are still uncertain today. The difficult conversion of radar measurements into precipitation rates is even more difficult with satellite-based radar measurements. The acquisition frequency of satellite microwave sensors (active and passive) is only a few measurements per day, whereas ground-based radar obtains measurements every 5 min. To compensate for the limited temporal sampling available from satellites, current precipitation algorithms combine as many microwave satellite sensors as possible, as well as geosynchronous infrared (IR) imagers mainly used to propagate in time precipitation estimates between microwave measurements. Currently, IMERG—the most advanced and widely used satellite precipitation product—uses 16 microwave sensors, 3 low-orbit IR sensors, and 5 geostationary IR satellites [13]. Despite this, it is still necessary to apply a bias correction procedure to IMERG by incorporating a precipitation gauge analysis that controls the bias.
Recently, several studies have been conducted to assess how the soil moisture measured from space-based sensors can be used to improve satellite-based precipitation estimates. Pioneer studies, [14,15] studied the potential of soil moisture to correct existing satellite precipitation products. Later, the SM2RAIN methodology [16,17,18,19] was developed to derive precipitation estimates from a water balance model and satellite soil moisture measurements. Other methodologies were also developed and applied to different regions of the world [20,21,22,23]. Among these methods, the PrISM (Precipitation Inferred from Soil Moisture) methodology [24] was recently developed to improve the CMORPH precipitation product using SMOS measurements over Africa at the 0.25° spatial resolution. The results showed that the PrISM resulting precipitation estimates significantly improved the CMORPH estimates and often performed better than other existing satellite products (IMERG, TRMM, PERSIANN, TAMSAT, CHIRPS) including those rescaled with rain gauge measurements.
The aim of this study is to assess the impact of using satellite-based soil moisture measurements to improve satellite-based precipitation estimates at higher resolution than the soil-moisture product. We use the PrISM methodology with IMERG-Early, an unscaled precipitation product at a finer spatial resolution (0.1°) than SMOS (~0.25°). The idea is to investigate whether knowledge of soil moisture at a coarse resolution can be useful to correct a fine-resolution precipitation field. More than 200 rain gauge stations in West, Central and East Africa are used to assess the methodology. At the same time, the paper investigates the use of a real time SMOS product (SMOS-NN) which can improve the availability of the PrISM precipitation product from 6 days to 1 day after the measurement.

2. Materials and Methods

2.1. Ground-Based Precipitation Measurements
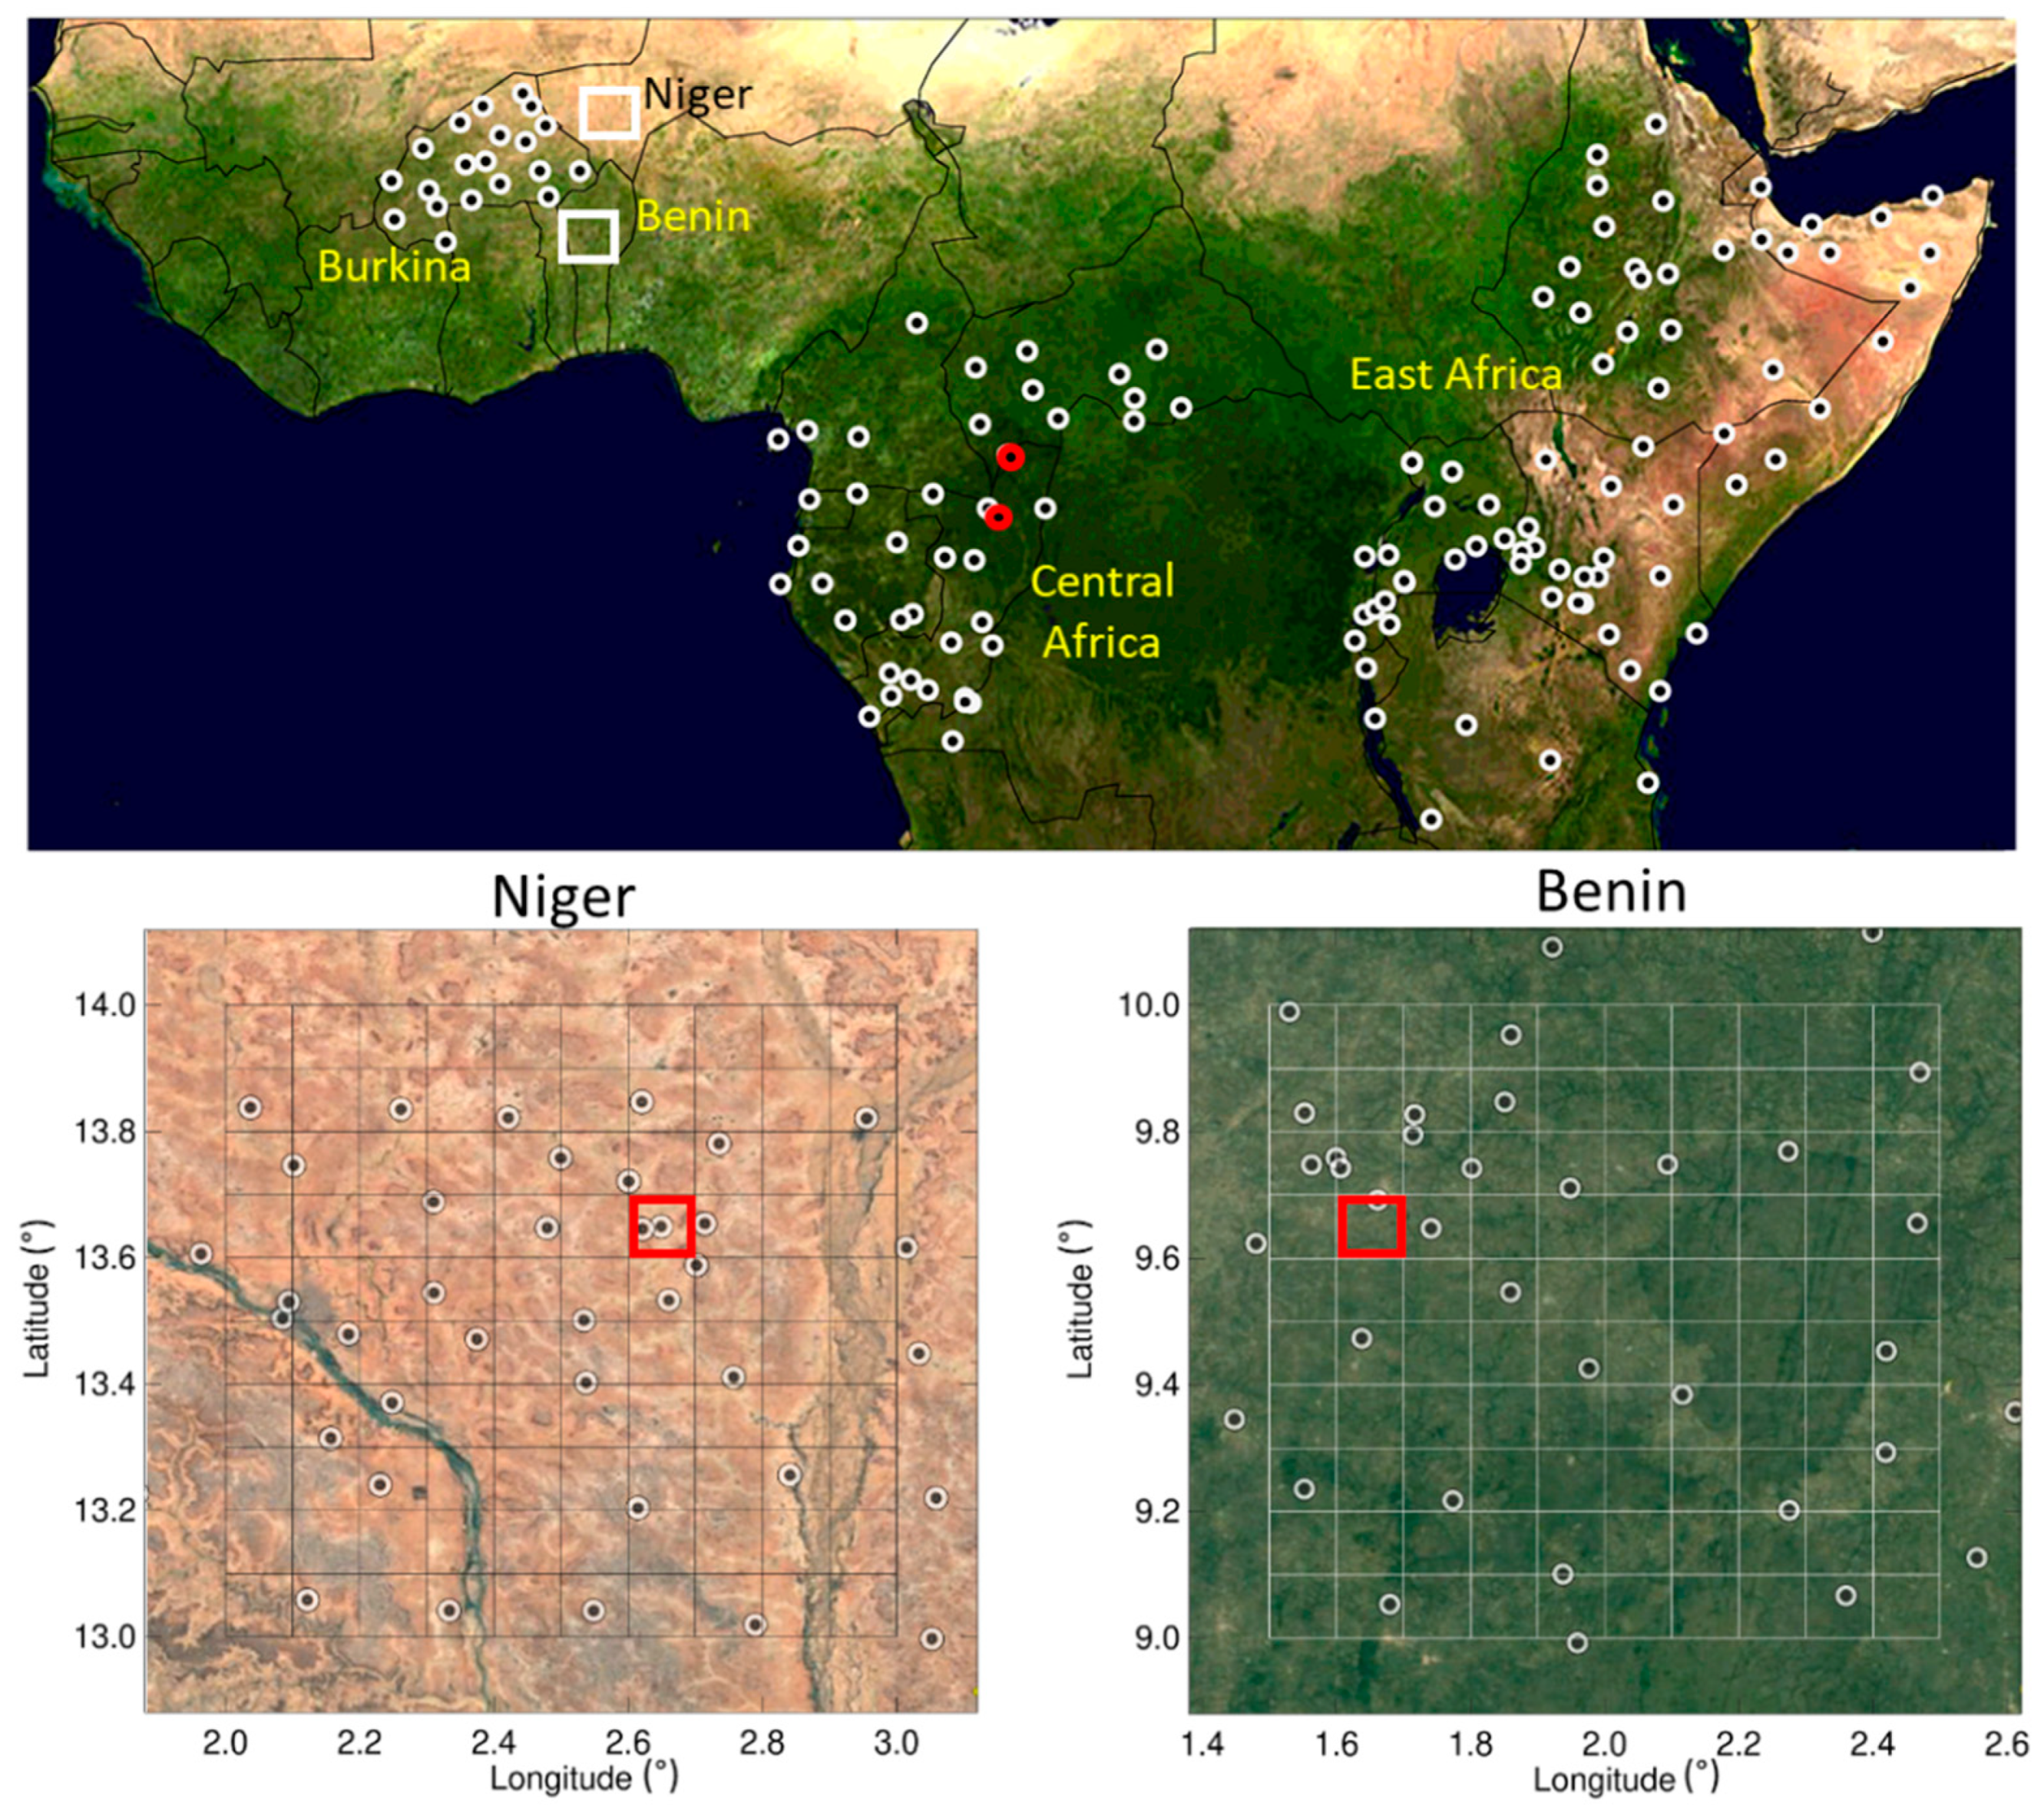
Five in situ rain gauge networks were used in this study (Table 1). The first two networks are provided by the AMMA-CATCH (African Monsoon Multidisciplinary Analysis—Coupling the Tropical Atmosphere and the Hydrological Cycle) Observatory located in Niger and Benin [25,26]. Both networks cover an area of 100 × 100 km² (Figure 1) and include 41 and 40 rain gauges, respectively. For both networks, a spatial interpolation (block kriging) of data was performed at the 0.1 × 0.1° spatial resolution in order to compare directly with IMERG. The 0.1° grid is presented in Figure 1. The third rain gauge network was provided by the National Meteorological Department of Burkina Faso. This precipitation network contains 20 stations located in Burkina Faso. The amount of missing data is rather small (13%). The fourth rain gauge network is the “WaTFor” dataset in Central Africa. This precipitation network contains stations located in Gabon, Cameroon, Central Africa, the Republic and the Congo and were provided by monitoring projects and National Meteorological Services [7]. The ratio of missing data is quite significant (48%). Last of all, a rain gauge network of 65 stations located in seven countries in East Africa (Ethiopia, Somalia, Djibouti, Uganda, Rwanda, Kenya and Tanzania) was used [27]. As in Central Africa, this network exhibits a significant ratio of missing data (53%).
Figure 1. Location of the 221 rain gauges located in Burkina Faso (20 stations), Central Africa (55 stations), East Africa (65 stations), and of those in the two AMMA-CATCH sites located in South Western Niger (41 stations) and North Benin (40 stations). The bottom graphs represent the 0.1° grids used to derive precipitation fields using a block-kriging procedure. Red pixels are those shown in Figure 2.
Remotesensing 14 00746 g001
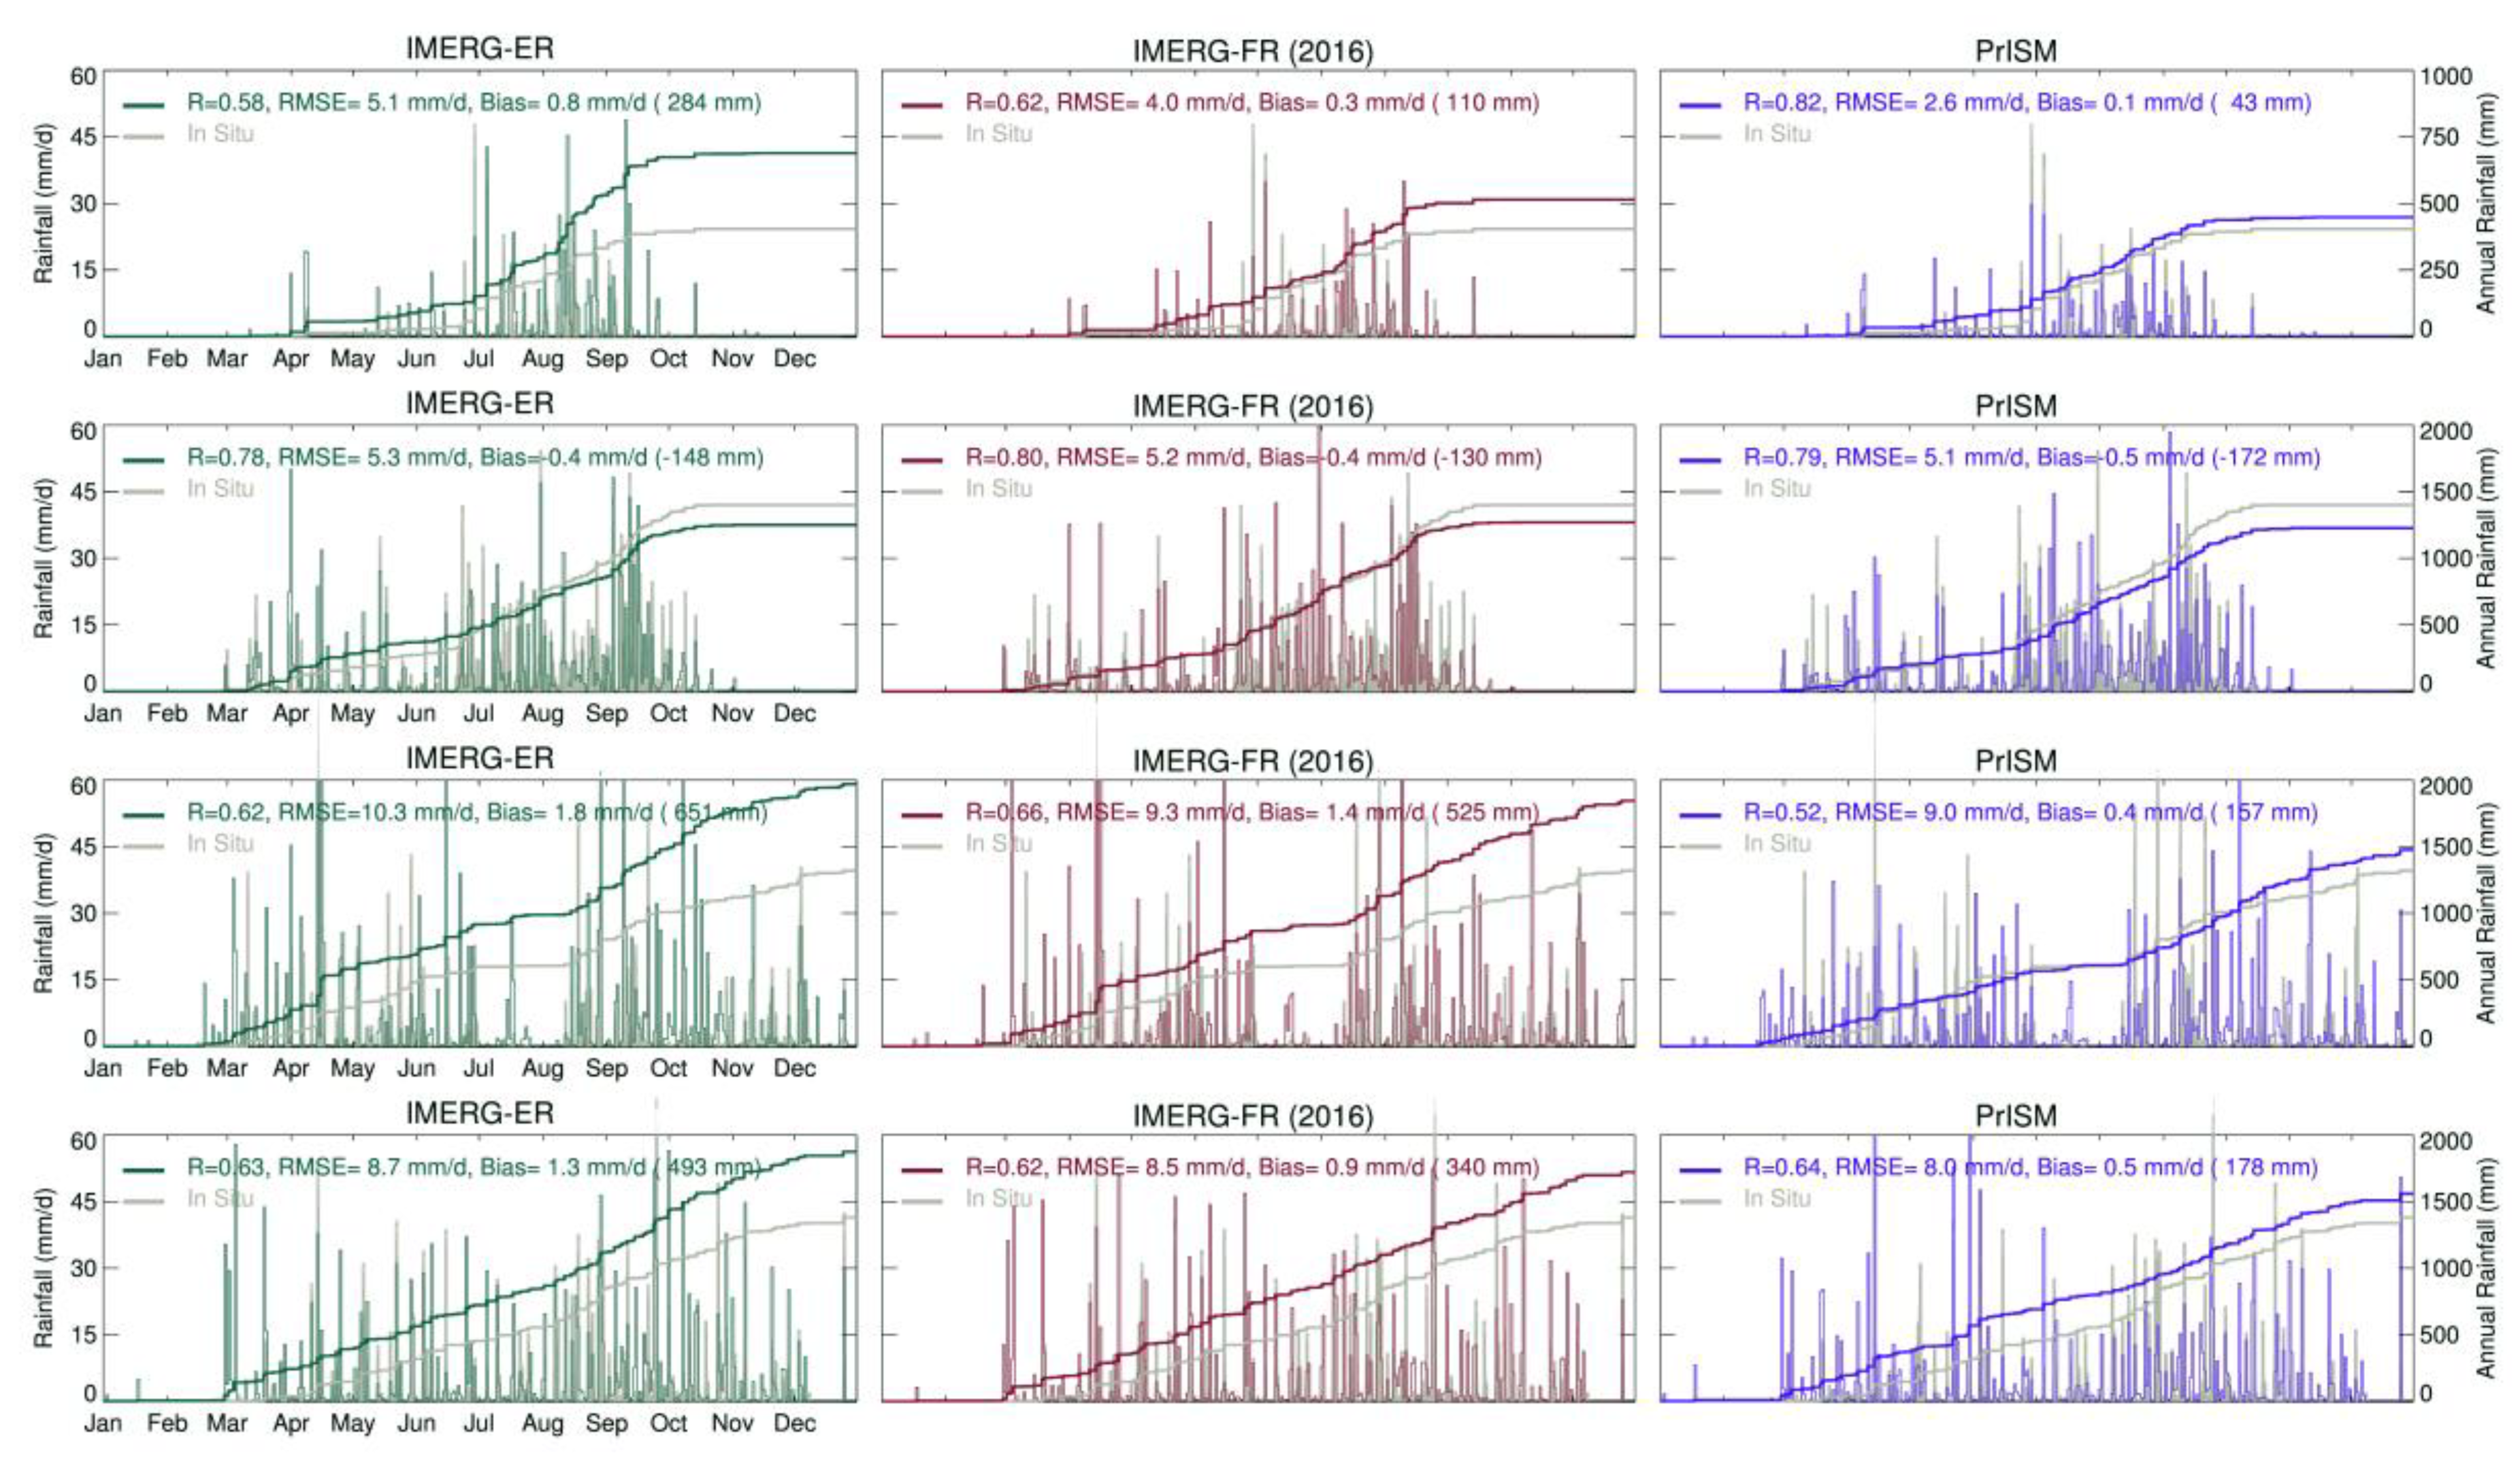
Figure 2. Comparison between daily rain gauge stations (in gray) and the 3 satellite rainfall products (IMERG-Early (green), IMERG-Final (red) and PrISM (blue)) at 4 sites located in Niger (13.65° N, 2.65° E), Benin (9.65° N, 1.65° E), north Congo (3.28° N; 16.76° E) and central Congo (1.41° N, 16.32° E) from top to bottom (see Figure 1 for localization). Cumulative rainfall are plotted in the right y-axis. Statistical scores are indicated in each graph.
Remotesensing 14 00746 g002

2.2. Satellite-Based Precipitation Products

In this study, the IMERG product (Integrated Multi-satellitE Retrievals for GPM) was used. The IMERG algorithm was designed to interpolate many satellite microwave rainfall estimates, together with infrared satellite estimates and rain gauge analyses [13]. Firstly, released in early 2015 [28], the IMERG product is provided at 0.1 × 0.1° spatial resolution and 30 min temporal resolution. Three modes are provided with different accuracies and latencies: “Early” run (latency of 4–6 h after observation), “Late” run (12–18 h), and “Final” run (~2.5 months). Conversely to the “Early” and the “Late” run products, the “Final” run product uses monthly gauge data to produce a research-level product available with a 2.5-month delay. In this study, the IMERG-Early and IMERG-Final runs were used. The two products were upscaled to a 3-hourly timestep. Note also that IMERG is available from 2000 (Table 2).

2.3. SMOS Soil Moisture Datasets

The Soil Moisture and Ocean Salinity [29,30] satellite (launched in late 2009) started delivering data in January 2010. The goals of this ESA mission were to determine surface soil moisture over land, and sea surface salinity over the oceans at a global scale. In this study, two SMOS products were used: the SMOS-L3SM product from CATDS (Centre Aval de Traitement des Données SMOS, CNES, https://www.catds.fr) (accessed on 10 October 2021) and the SMOS NRT soil moisture product developed by [31,32,33] using a neural network and available in near real-time from the ESA website (https://smos-diss.eo.esa.int/oads/access) (accessed on 10 October 2021) and the EUMETCast service by EUMETSAT. The two SMOS products were regridded to the IMERG 0.1° × 0.1° regular grid using NCO internal routines to perform bilinear interpolation on gridded data sets. The bilinear interpolation used in this study is the function “bilinear_interp_wrap” which performs wrapping (Y) and extrapolation (X) for points off the edge of the grid.
The SMOS-NRT soil moisture dataset was used to provide near-real-time PrISM products since it is available with a 24-hour delay, whereas SMOS-L3SM is only available with a 6-day delay. As described in [31,32], there are slight differences between the two products in terms of soil moisture estimates and number of soil moisture retrievals. The swath width used to generate the SMOS-NRT product is smaller than that of SMOS-L3SM. For this reason, the procedure chosen was to use the SMOS-NRT to generate the near-real-time precipitation product (d + 1 to d + 5) and to use the SMOS-L3SM to generate all other dates. In other words, in the final PrISM product, only the SMOS-L3SM data are used, except for the 5 days close to present time.

2.4. The PrISM Algorithm

The PrISM (Precipitation Inferred from Soil Moisture) algorithm was published in a recent article [24]. The concept is to exploit satellite soil moisture measurements (SMOS in this study) to correct the rainfall intensities of an existing satellite rainfall product (IMERG-Early in this study). The algorithm uses of a simple soil moisture model (S2M) and an assimilation scheme (Particle Filter).

2.4.1. The Soil Moisture Model (S2M)

A simple soil moisture model (S2M) has been developed in previous studies [24,34] to generate a surface soil moisture time series from a precipitation time series. The soil moisture model (hereafter denoted as the S2M model) can be expressed as:
θ ( t ) = ( θ ( t 1 ) θ r e s ) · e t τ + ( θ s a t ( θ ( t 1 ) + θ r e s ) ) · ( 1 e P ( t ) d s o i l ) + θ r e s
where θ(t) is the surface soil moisture in m3/m3, P(t) is the cumulative rainfall amount (mm) during the Δt period (in h) and τ is the soil moisture drying-out rate (in h). The soil moisture value at saturation (in m3/m3) is represented by θsat; dsoil is an equivalent soil thickness (in mm), and θres is the residual soil moisture (in m3/m3). To correctly assimilate SMOS ascending (6 am) or descending (6 pm) measurements, the S2M model requires the use of a rainfall product at sub-daily resolution (3 h or less) to determine the timing of precipitation with respect to SMOS orbits. Based on previous works [34], a calibration of the τ, θres, θsat and dsoil parameter of the S2M model was conducted over 10 sites at a global scale. It was shown that a constant value for θsat = 0.45 m3/m3 provided reliable results. To the contrary, the θres, dsoil and τ parameters require a spatial distribution. Finally, the τ parameter was also found to be variable in time to consider the effect of the seasons on the drying-out velocity, even if this effect is weak in Africa. Based on surface soil moisture measurements obtained over the 10 sites presented in [34], the simple following formulation of the τ, θres and dsoil parameter was proposed:
θ r e s = 0.04676 + 0.05936 ( N D V I ¯ ) 0.00136 ( T a i r ¯ )
d s o i l = 120 80 1 + 178482301 e ( 100 N D V I ¯ )
τ ( t ) = 400 ( 350 ( 1 + e 0.1 ( T a i r 7.5 ) ) )
The residual soil moisture θres was assumed to be proportional to the annual mean 2 m air temperature T a i r ¯ (in °C) and to the annual mean N D V I ¯ value (value calculated from ESA-CCI-LC-L4-NDVI). In Africa, calculated residual soil moisture values range from 0.016 to 0.060 m3/m3 which is consistent with ground measurements obtained in Niger and Benin. The dsoil coefficient (in mm) can be seen as the soil thickness. It expresses the rate of soil moisture dampening during a precipitation event. A dsoil value of 35 mm was found consistent over 9 out of the 10 sites studied in [34], but a value of dsoil equal to 100 mm was found in the only semi-arid site (Niger). Paradoxically, infiltration in the Sahel, which has a very sandy texture, is much lower than in areas with a more clayey texture. This paradox is known in the Sahel and is linked to the presence of a very impermeable surface crust (1 or 2 mm) which forms during the dry season and results in very low-permeability soils all year round. Consequently, the dsoil parameter was related to the presence/absence of vegetation, using a simple relationship (sigmoid) proportional to annual mean N D V I ¯ value (Equation (3)). Over Africa, the dsoil values are quite binary: 120 mm in arid and semi-arid areas and 40 mm elsewhere. Finally, the τ parameter in Equation (4), which is related to the drying-out rate of the surface soil moisture, was assumed to be proportional to air temperature. It was also considered that there is a seasonal variation of the drying-out velocity of the soil, and then the τ parameter was calculated using 30-day smoothed Tair values (°C) obtained from MERRA-2 database (2013). Over Africa, the τ parameter was found to range between 80 h (hot regions and hot seasons) and 350 h (more temperate regions and colder seasons).

2.4.2. The Particle Filter Assimilation Scheme

The PrISM algorithm uses the S2M soil moisture model (Equation (1)) complemented by an assimilation of SMOS soil moisture. Before any assimilation implementation, it is necessary to scale observations (SMOS soil moisture) to the S2M outputs using the cumulative distribution function (CDF)-matching procedure. To this end, the S2M model (Equation (1)) was used with the IMERG-Final precipitation product (assumed to be a reference and unbiased precipitation product) in order to obtain a reference soil moisture simulation at the Africa scale. Then, this reference soil moisture simulation (2016) is used to calculate the two linear CDF-matching pixel-based coefficients (p1 and p2) to obtain SMOSCDF values whose mean value and variance are identical to the soil moisture simulations. SMOSCDF values are related to SMOS initial values as:
S M O S C D F = p 1 + p 2 . ( S M O S ) p 2 = σ S M m o d e l σ S M s m o s p 1 = S M m o d e l ¯ p 2 . ( S M s m o s ¯ )
In a second step, the PrISM methodology consists of using the Particle Filter (PF) assimilation scheme to correct the IMERG-Early precipitation product. The PF assimilation scheme is based on random stochastic perturbations of a given variable (rainfall rate in this study) with the aim of propagating the precipitation uncertainties in the associated soil moisture outputs [35,36,37]. This method is particularly suitable when the main source of uncertainties of a model is identified, as well as for non-linear models. For a more formal description of the PF, the reader should refer to [38].
An example of the PF assimilation scheme is shown in Figure 3 (Benin site, 25 September to 3 October 2012) which is used to illustrate the technical details of the methodology. During each of the three 5-day assimilation periods shown, 100 stochastic perturbations (gray bars) of the IMERG-Early initial precipitation rate (red bar) are generated, producing an ensemble of 100 soil moisture potential trajectories (gray curves). Then, the SMOSCDF values available over the 5-day period (red diamonds) are used to choose the 30 most likely changes in soil moisture (orange curves) and to determine the mean soil moisture (blue curve) associated with the PrISM rainfall rate (blue bars). In this example, it can be noted that for the first 5-day assimilation period (Figure 3a), the IMERG-Early precipitation rate is reduced for the two first rain events (26/09 and 27/09) which is consistent with the rain gauge station (black bars). On the contrary, the 29/09 rain event is initially unchanged (and largely overestimated) due to a lack of SMOS soil moisture measurements after the rain event (Figure 3a). At this stage, it is interesting to observe that the PrISM uncertainty associated with the 29/09 (Figure 3a) is large as there is no data to assess the relevance of the IMERG-Early precipitation rate. The uncertainty of PrISM is calculated as the maximum and the minimum value of the 30 most likely rainfall time series. The availability of a new SMOS measurement on 30/09 leads to a sharp decrease in IMERG-Early rainfall rate for the 29/09 event in agreement with in situ measurements (Figure 3b). This decrease is confirmed successively for the next 5-day assimilation period covering this rain event (Figure 3b–e). Ultimately, the PrISM precipitation rate is calculated as the average of the 5 successive precipitation estimations.
The length of the assimilation window (5 days), the choice of the number of perturbations (100 particles), and number of selected best perturbations (30) were chosen after a sensitivity analysis. A 5-day assimilation period represents a compromise between too short periods with too few SMOS retrievals (e.g., giving a lot of weight to individual SMOS measurements) and longer periods which can be conducted to consider 3 or more soil moisture measurements after a rainfall event. Similarly, an increased performance of the methodology was observed from 10 to 100 perturbations and become stable after 100 perturbations. Lastly, keeping the 30 most probable perturbations was found to be optimal compared to 10–20 or 40–50. Similar to [24], the perturbations of rainfall were built using a random multiplicative factor ranging from 0 to 2 following a uniform distribution. Thus, each rainfall event can be multiplied by a factor between 0 (rainfall event removed) and 2 (rainfall rate multiplied by 2).

3. Results

To assess the performance of the PrISM product, we compare its performance against those of (i) IMERG-Early—the initial precipitation product to be corrected—and (ii) IMERG-Final—the debiased product based on rain gauge measurements and available 2.5 months later. The performance assessment was conducted using 221 daily rain gauge measurements for different periods between 2010 and 2021 and using three statistical scores: the Pearson correlation coefficient (R), the Root-Mean-Square Error (RMSE) and the Bias. This evaluation was performed at a daily time-step and using the full temporal depth of each ground-based precipitation time-series available. In Niger and Benin, the density of the rain gauge network allowed us to produce reference daily precipitation maps at a resolution of 0.1° using a block kriging method. At the other sites (Burkina, Central Africa and East Africa), a direct comparison between the local measurements (rain gauge) and the satellite estimates was carried out.

3.1. Temporal Assessment

To get the first general overview of the accuracy of the three precipitation products, Figure 2 presents time series of daily rainfall observed at four locations in Niger (13.65° N; 2.65° E), Benin (9.65° N; 1.65° E), north Congo (3.28° N; 16.76° E) and central Congo (1.41°N, 16.32° E) in 2016. In situ precipitation measurements are presented in gray and the 3 precipitation products are presented in color (IMERG-Early in green; IMERG-Final in red; PrISM in blue). The three statistical scores (R, RMSE and Bias) are also provided. In these four examples, IMERG-Early shows lower performances and tends to overestimate the annual rainfall, except in the Benin site where the annual rainfall is close to the in situ rainfall compared to the two other products. IMERG-Final systematically reduces the annual bias of IMERG-Early and almost systematically improves the R and RMSE scores. Similarly, the PrISM product also systematically reduces the annual bias and almost systematically produces better scores than IMERG-Early and similar statistical scores to IMERG-Final.
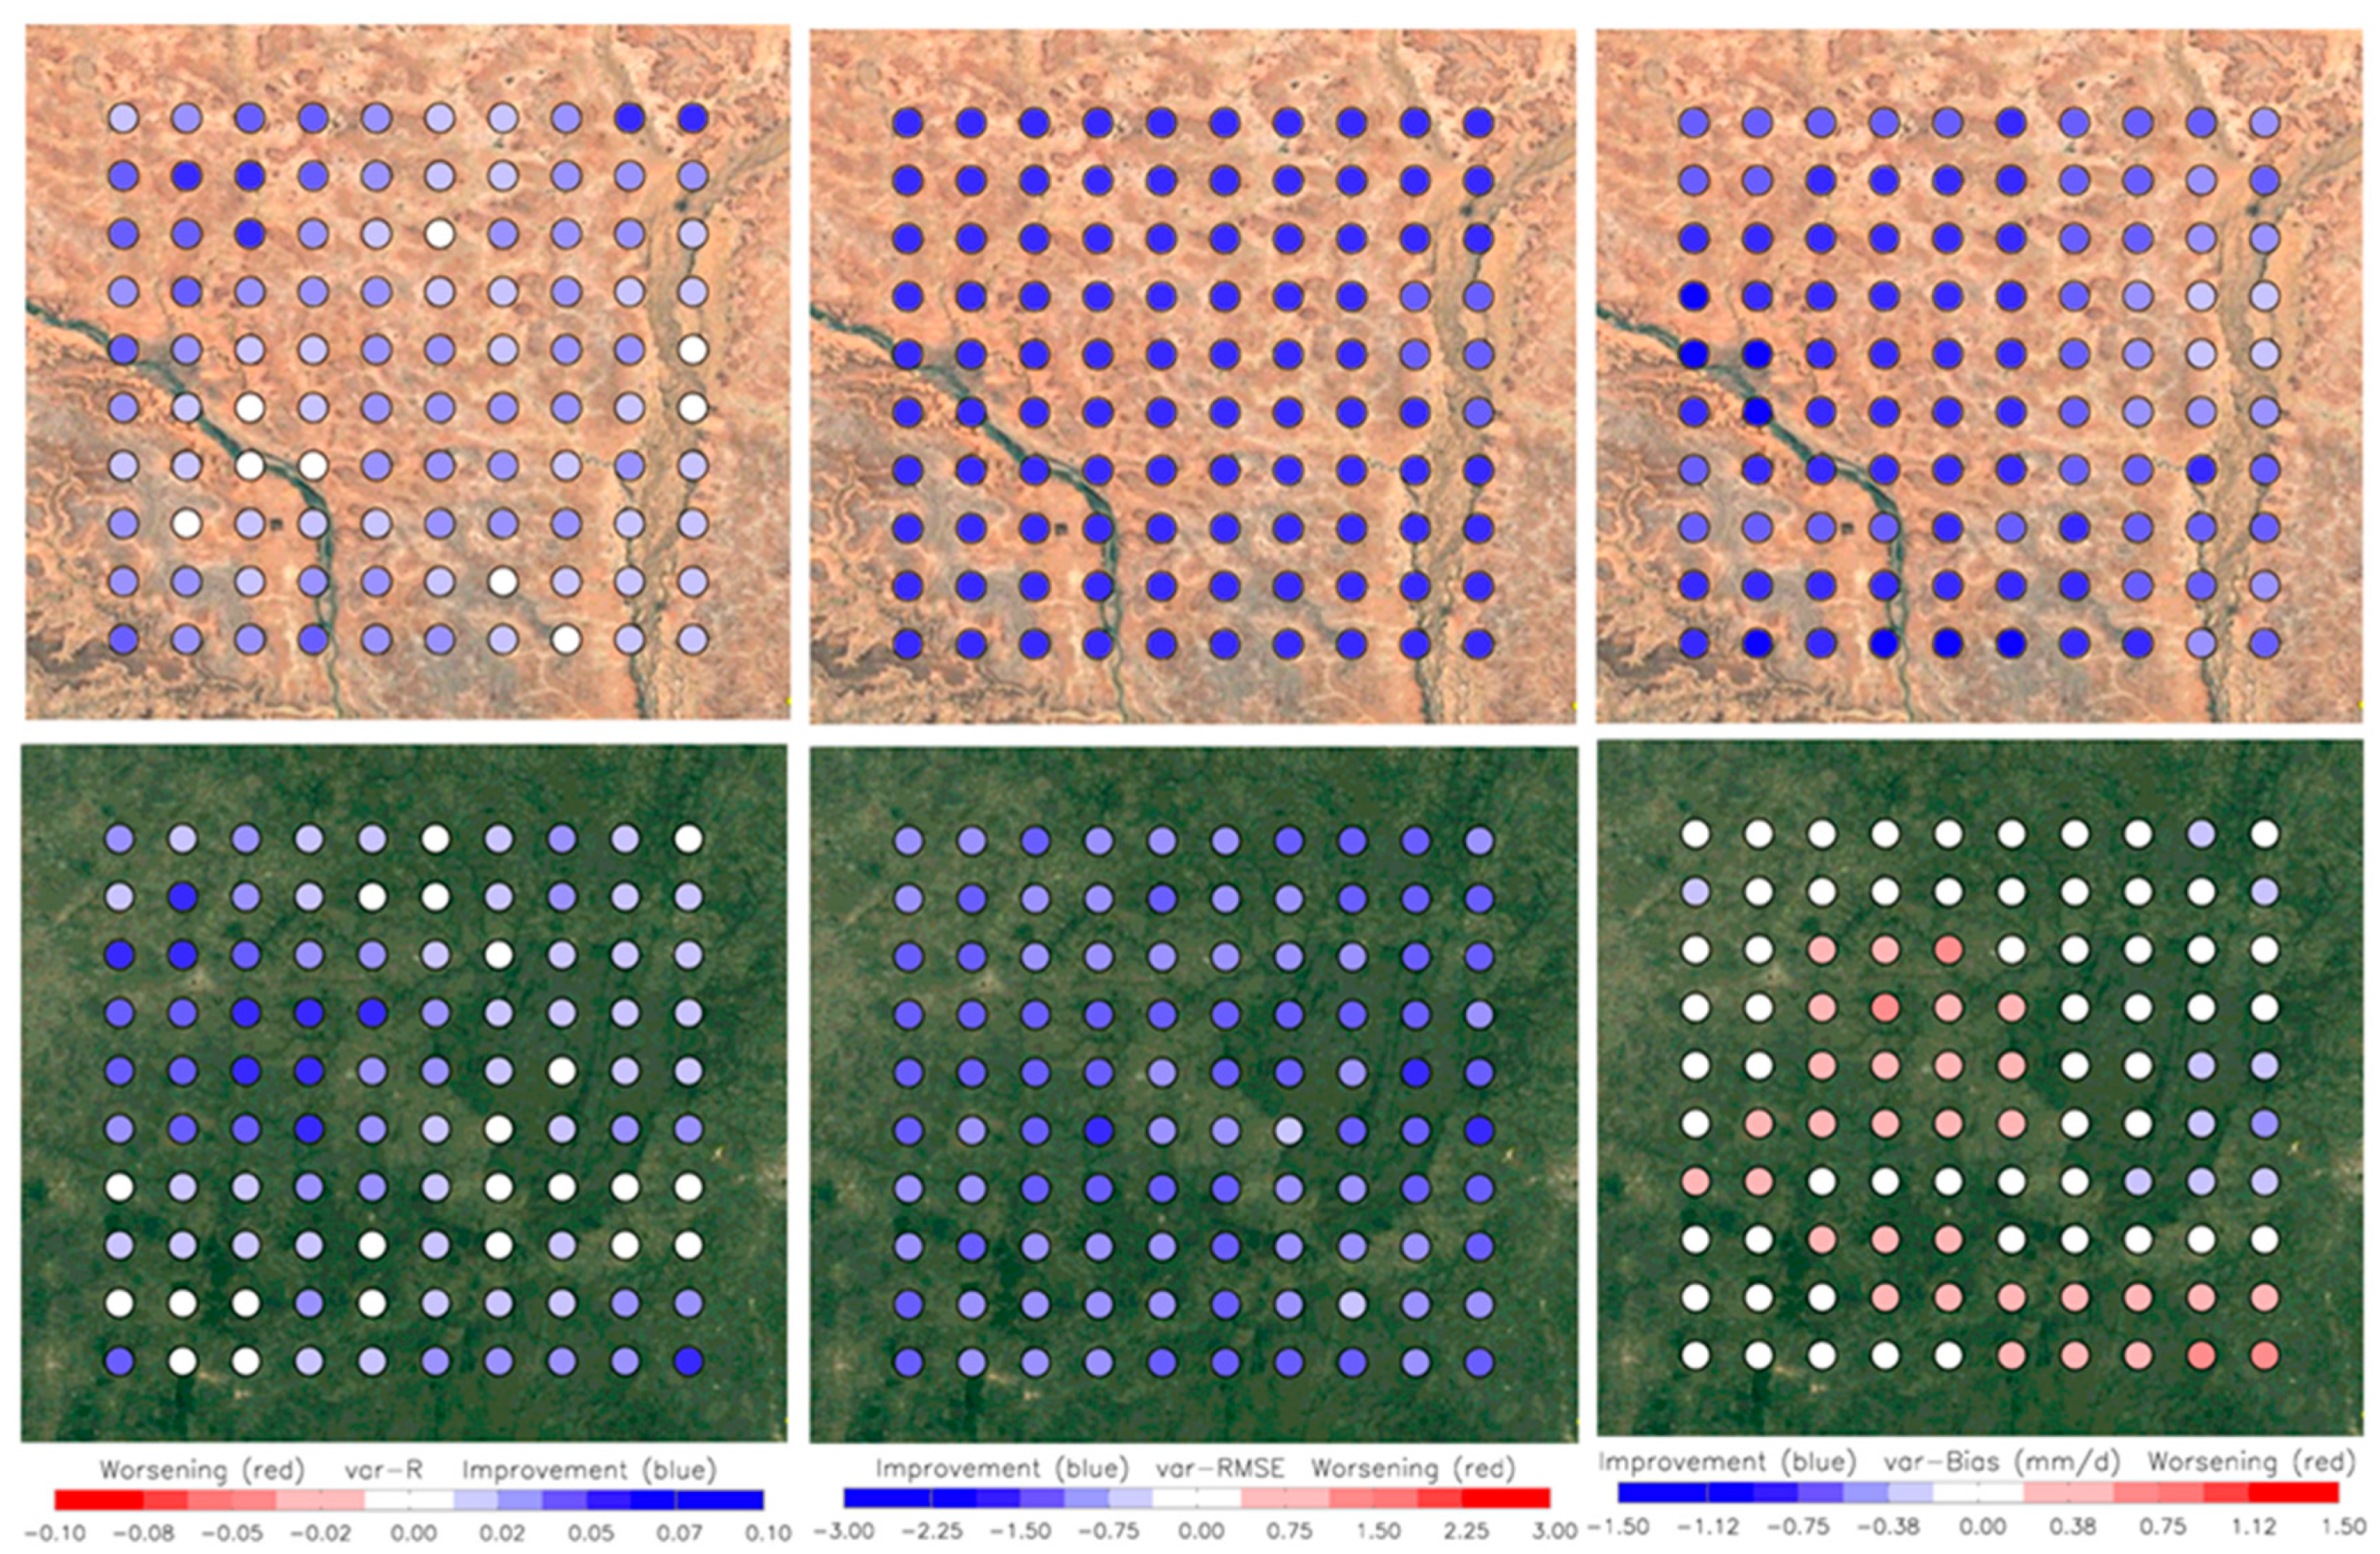
A statistical analysis was conducted at the Niger and Benin sites where a block-kriging procedure was carried out to provide 0.1° resolution daily precipitation measurements for the 2010–2020 period. The 0.1° spatial resolution precipitation maps were created to allow a direct comparison between satellite products and ground-based precipitation measurements. Based on this reference dataset, Figure 4 shows the potential improvement (in blue) or deterioration (in red) gained with the PrISM methodology compared to IMERG-Early. The two left graphs of Figure 4 show that the correlation coefficients (R) for the PrISM product are always better than IMERG-Early product in both sites (+0.032 in Niger, +0.028 in Benin in average). Similarly, the two middle graphs of Figure 4 show that the Root Mean Square Error (RMSE) is reduced on each pixel of Niger (−2.61 mm/day in average) and Benin (−1.32 mm/day). Lastly, the daily bias between IMERG-Early and PrISM is also reduced from +0.97 to −0.06 mm/day for the Niger site (i.e., a reduction in the absolute bias of 0.91 mm/day). On the contrary, the bias is slightly deteriorated from +0.14 to −0.24 mm/day for the Benin site, i.e., a deterioration of the absolute bias of 0.10 mm/day.
A more comprehensive study was carried out using the three other rain gauge networks located in Burkina Faso (20 stations), Central Africa (55 stations) and East Africa (65 stations) using the longest possible time series (from 4 years in East Africa to 6 years in Burkina Faso and Central Africa). For these three networks, and in contrast to Niger and Benin, comparison was made between a point (rain gauge station) and a satellite pixel at a spatial resolution of 0.1°. Statistical scores are examined using box plots averaged over the five regional networks (Niger, Benin, Burkina Faso, Central Africa and East Africa). The results are presented in Figure 5 as box plots with the median value, the 5 and 95% quantiles and the minimum and maximum score values.
The very first observation in Figure 5 concerns the much better scores associated with lower variability for Niger and Benin (and, to a lesser extent, Burkina Faso) compared to Central and Eastern Africa. This behavior is firstly due to the presence of a dry season in West Africa (Niger, Benin, Burkina Faso) which artificially reduces the RMSE and the bias compared to Central Africa and part of East Africa. Secondly, the in situ measurements in Niger and Benin (AMMA-CATCH network) and Burkina Faso contain very few gaps, whereas the measurements in the Central and East African networks contain a lot of missing data (48 and 53%, respectively), which leads to the calculation of scores on small samples (less than 50 measurements in four years for some cases). Moreover, the missing values imply that many zero values of precipitation are also not considered, which mechanically increases the bias and RMSE.
The left graph in Figure 5 presents the multi-year correlation coefficient (R). In Niger and Benin, PrISM performs slightly better than IMERG-Early and IMERG-Final, respectively. The correlation coefficients of the three products are quite high with a median value around 0.8 for Niger and around 0.75 for Benin. Note that the R values given in Figure 2 are slightly weaker because they were obtained using a single year (2016) while R values given in Figure 4 are obtained using 11 years. On the contrary, in Burkina Faso, Central Africa and East Africa, IMERG-Final performs slightly better than PrISM and IMERG-Early.
The middle graph in Figure 5 shows the performances of the three satellite precipitation products in terms of RMSE. For all the networks, the PrISM methodology leads to substantial improvements over IMERG-Early. Larger decreases in the RMSE scores are observed in Niger (from 6.2 to 3.5 mm/day), Benin (from 5.8 to 5.1 mm/day) and Burkina Faso (from 7.8 to 6.5 mm/day). Although RMSE scores remain high in Central Africa and East Africa, they decrease from 12.7 to 11.7 mm/day in Central Africa and from 7.5 to 6.7 mm/day in East Africa. It is worth noting that PrISM also leads to better RMSE scores than IMERG-Final on average for the 5 networks.
The right graph in Figure 5 illustrates the bias scores expressed in mm/day. Here again, the bias of IMERG-Early is much higher than the ones of IMERG-Final and PrISM. In Niger, IMERG-Early bias is close to 1 mm/day, i.e., about 360 mm/year for a mean annual rainfall of 600 mm. This is a considerable overestimation of the precipitation rate. In IMERG-Final the bias is decreased to 0.04 mm/day (i.e., 14 mm/year). Similarly, PrISM reduces the initial bias to −0.08 mm/day (i.e., −29 mm/year). In Benin, IMERG-Early shows a slight positive bias of +0.14 mm/day (i.e., 51 mm/year) while IMERG-Final bias is reduced to −0.05 mm/day (i.e., −18 mm/year) and PrISM bias is −0.23 mm/day (i.e., −84 mm/year). Similar results can be observed in Burkina Faso, where the initial positive bias of IMERG-Early is reduced in IMERG-Final and PrISM (from 0.58 to 0.08 and 0.10 mm/day, respectively). In Central and East Africa, results show also a positive impact of the PrISM methodology to correct IMERG-Early. The median bias of IMERG-Early decreases from 1.44 to 0.74 mm/day (PrISM) and 0.90 mm/day (IMERG-Final) in Central Africa and from 0.47 to 0.27 mm/day (PrISM) and 0.19 mm/day (IMERG-Final) in East Africa.
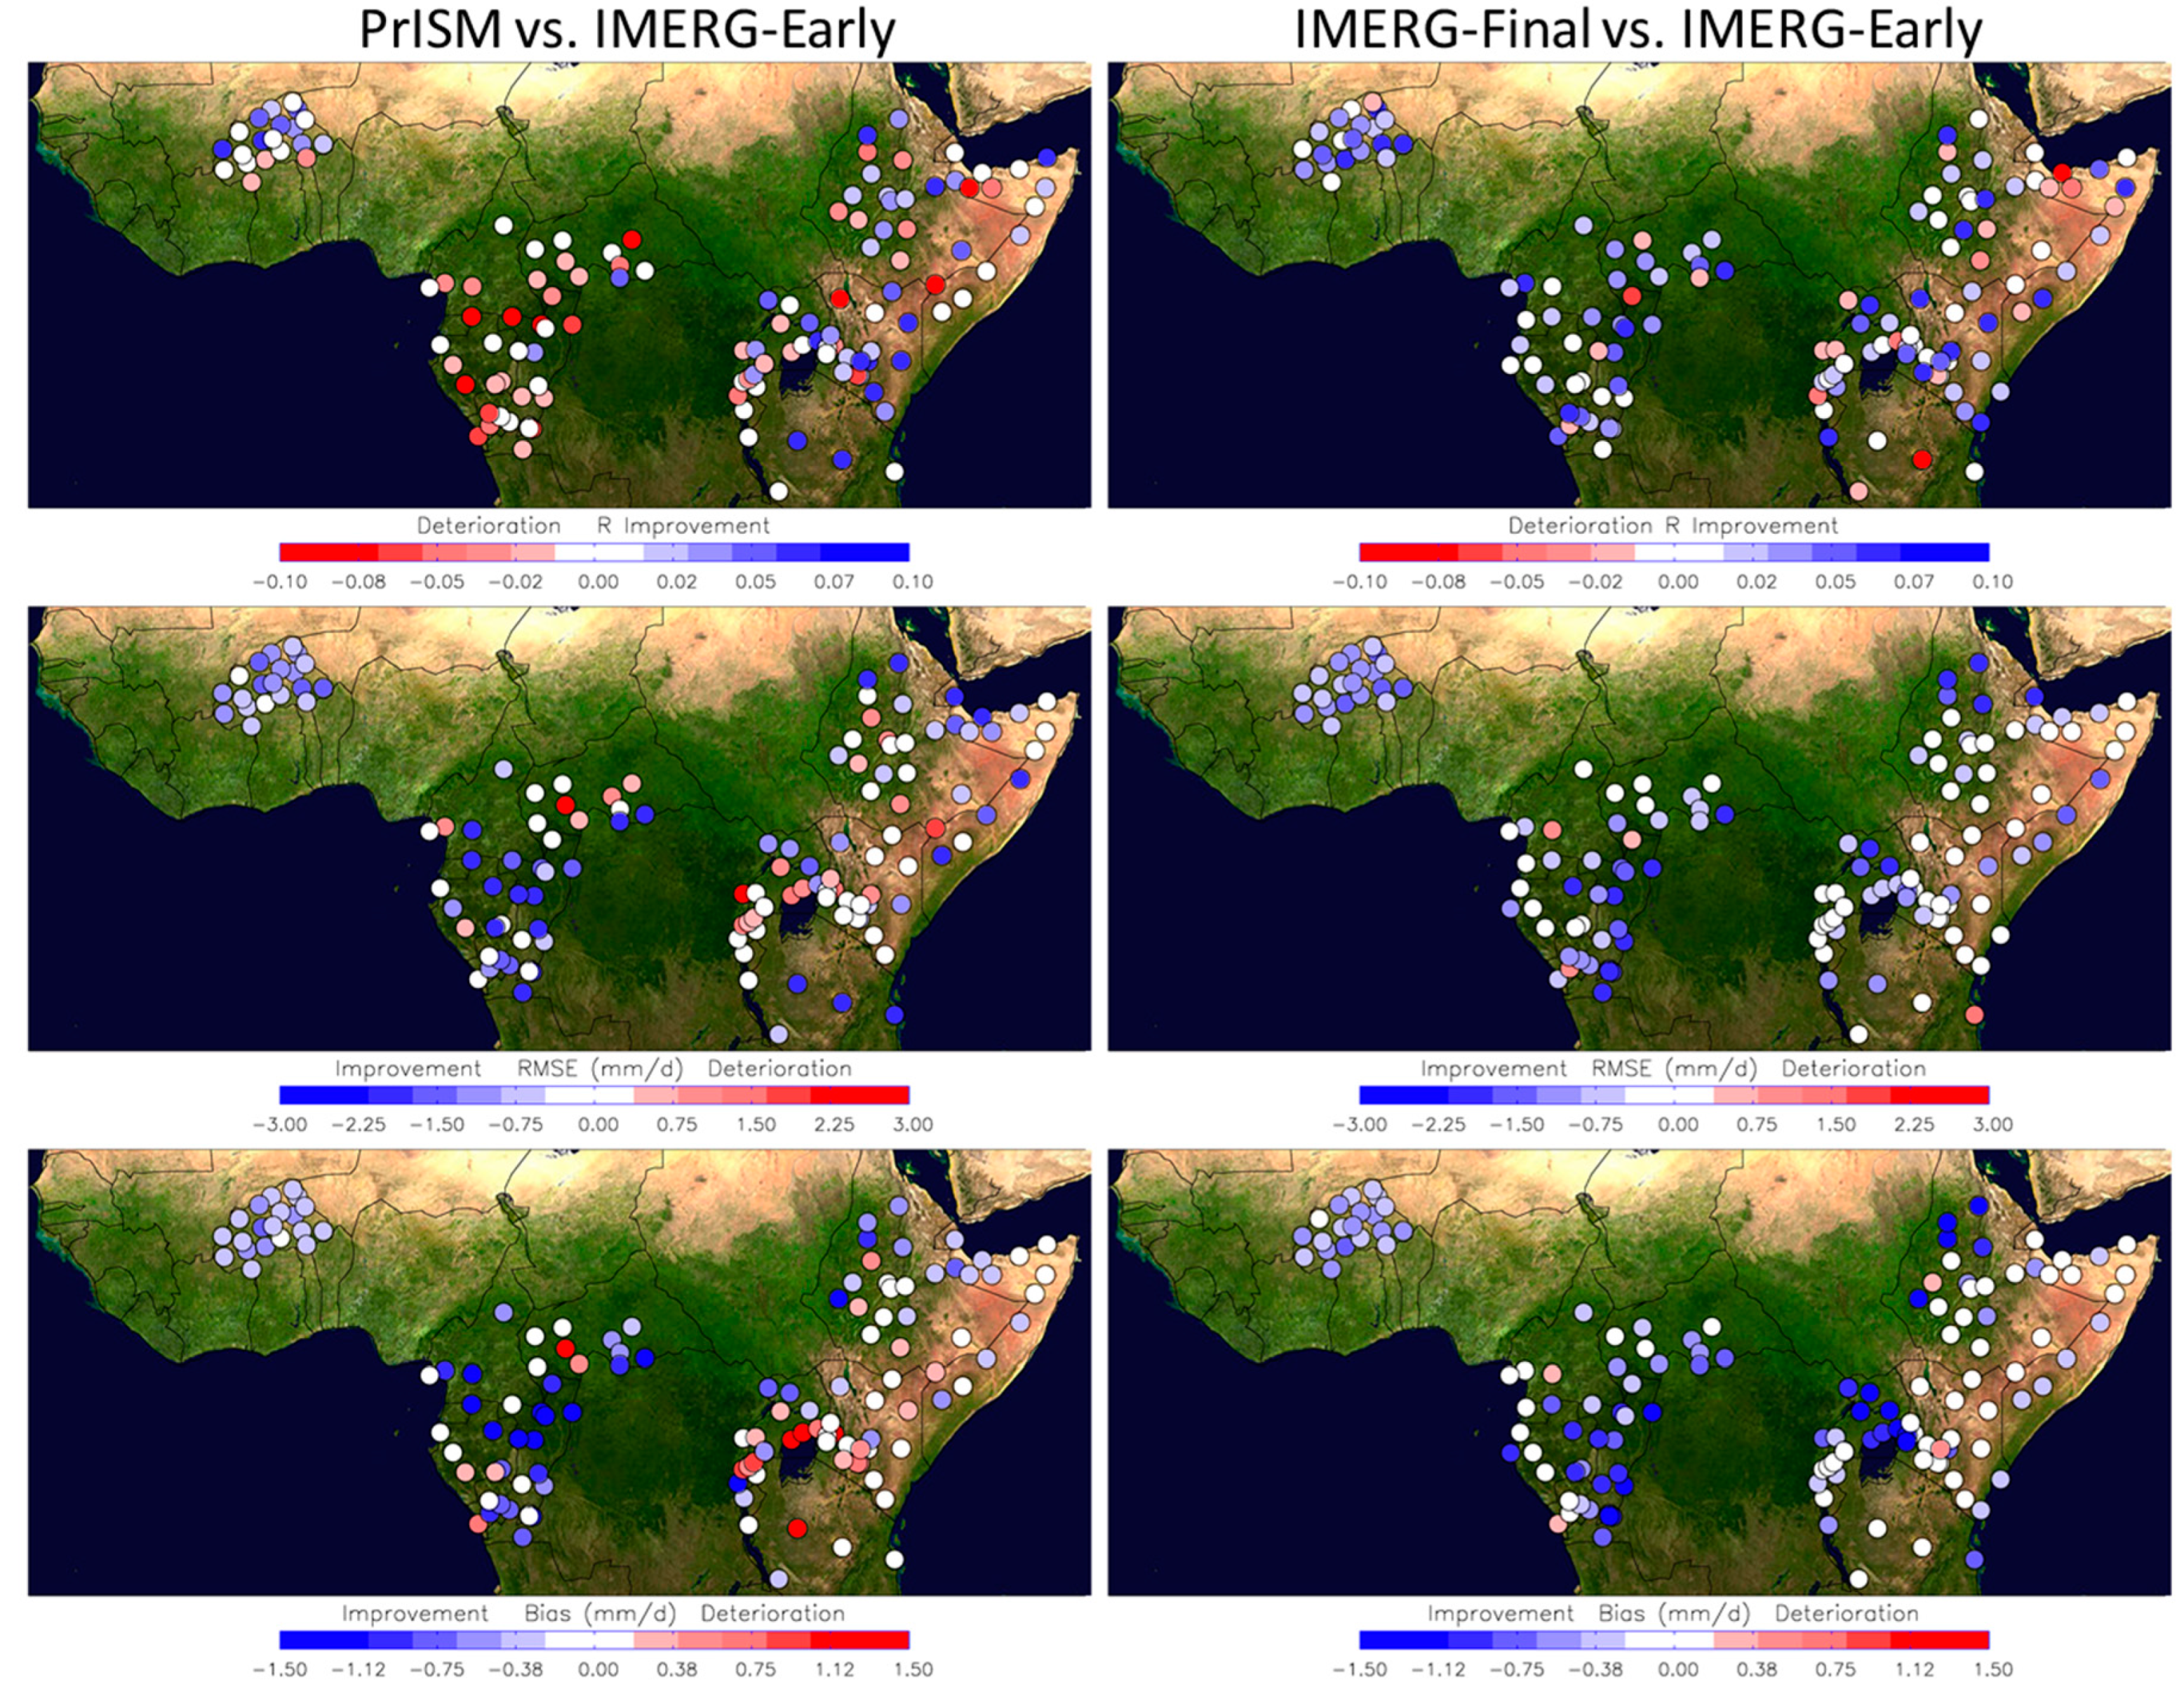
The spatial distribution of the three scores (R, RMSE and Bias) is examined in Figure 6 and shows the improvement (or deterioration) of PrISM (left) and IMERG-Final (right) compared to the IMERG-Early precipitation product.
The three graphs on the left of Figure 6 show the improvement (blue circles) or deterioration (red circles) of PrISM compared to IMERG-Early in terms of correlation coefficient (top), RMSE (middle), and bias (bottom). As shown in Figure 5, it can be observed that the PrISM methodology tends to improve statistical scores, except for the correlation coefficient in Central Africa. PrISM’s methodology is particularly efficient in terms of RMSE and bias scores. Geographically, better results are observed for Burkina Faso with better scores obtained for almost all stations (except a few in terms of R score). On the other hand, despite good performance in Central Africa in terms of RMSE and bias, PrISM slightly deteriorates the correlation. A typical example is in the north Congo in Figure 2, where the R score decreases from 0.62 to 0.52, whereas the RMSE score is improved from 10.2 to 9.0 mm/day and the annual bias is reduced from +652 to +157 mm. Finally, as the results show a slight improvement in East Africa (Figure 5), there are almost as many improvements as deteriorations.
The three graphs on the right of Figure 6 present the same analysis for the IMERG-Final product. Globally, the IMERG-Final product performs better than the IMERG-Early product despite some sites with poor performance. In terms of correlation, IMERG-Final performs better than PrISM on average for the three networks. On the other hand, results are more equivocal in terms of RMSE and bias scores.

3.2. Spatial Modification of the Precipitation Fields

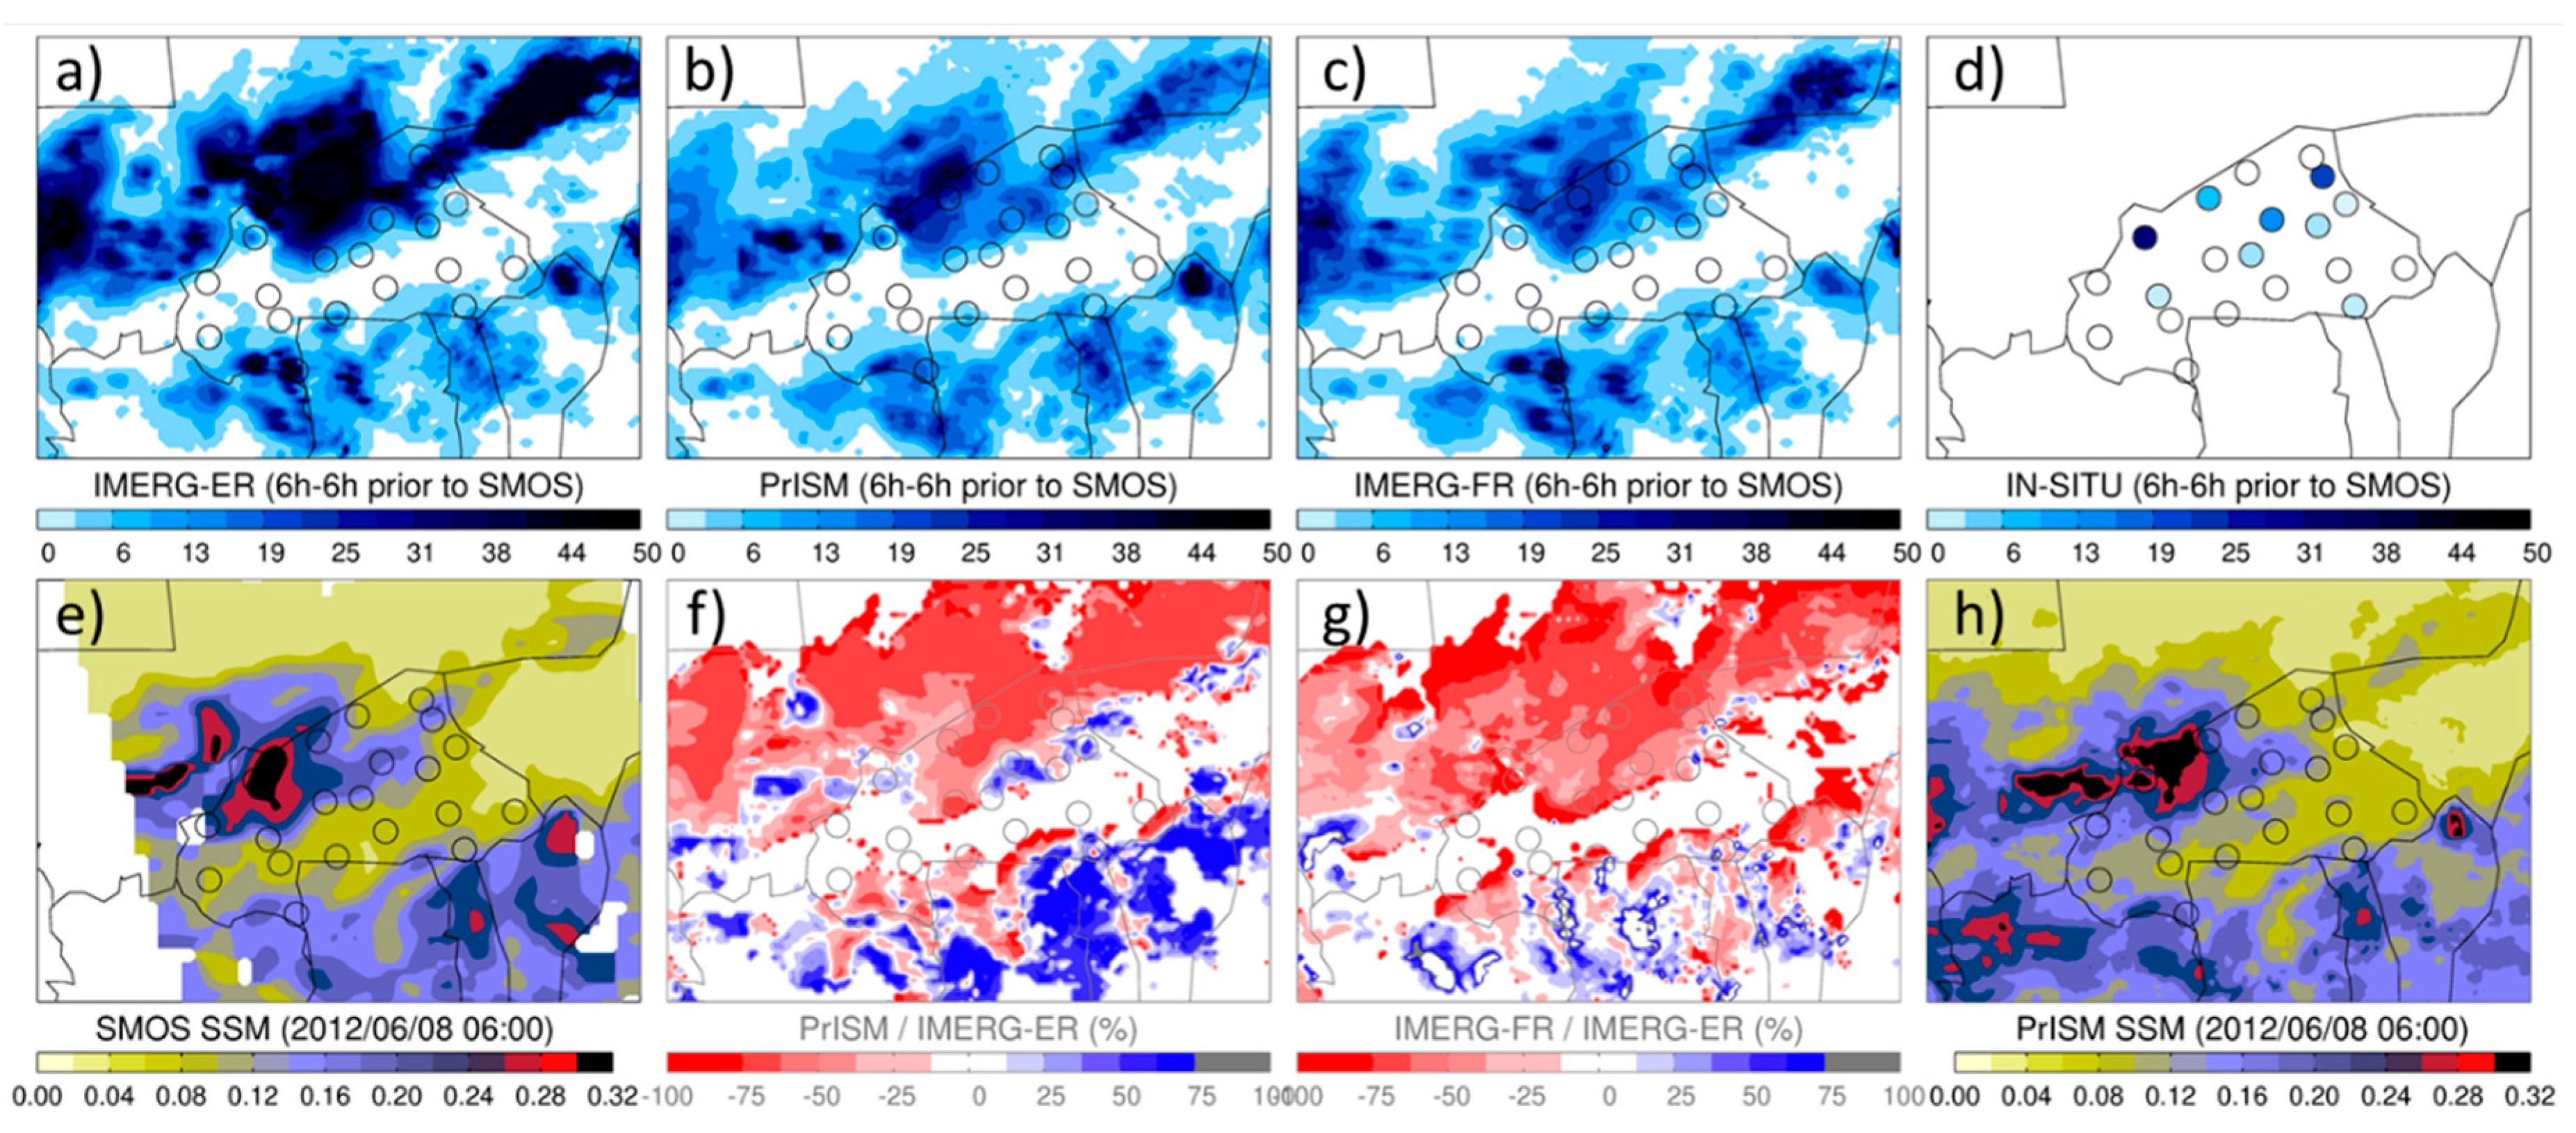
It is instructive to look at how the initial precipitation fields from IMERG-Early are spatially modified using the PrISM algorithm. Figure 7 gives an example of a daily precipitation map (2012, June 7–8th 6:00 to 6:00) for the Burkina Faso. It can be observed how the IMERG-Early rainfall map (a) is modified into the PrISM rainfall map (b) when assimilating the SMOS soil moisture information shown in (e). Figure 7 also shows the IMERG-Final rainfall map (c) and the rain gauge precipitation measurements (d). Graphs (f) and (g) show the differences (in % of precipitation) observed between PrISM and IMERG-Early (f), respectively, and between IMERG-Final and IMERG-Early (g). Finally, the last graph (h) presents the PrISM soil moisture map derived from the PrISM methodology.
On 8 June at 5:55 UTC, the SMOS satellite flew over Burkina Faso and provided a spatial distribution of soil moisture (Figure 7e). This soil moisture distribution reveals wet conditions in the North-West of Burkina Faso as well as in Northern Ivory Coast, Ghana, Togo and Benin. On the other hand, dry soil conditions are detected in central and northern Burkina Faso, Niger and central Mali. The IMERG-Early precipitation map is globally consistent with SMOS as rainy conditions are observed over wet soils, while there is no precipitation over dry soils. IMERG-Early is also in good agreement with rain gauge measurements (Figure 7d) except for two rain gauges in the extreme North and one in the extreme South of Burkina Faso. In addition, the SMOS soil moisture map indicates that the spatial extend of precipitations in IMERG-Early seems overestimated in the north of the domain. The PrISM precipitation map (Figure 7b) shows a significant reduction in the precipitation rate in the north of the domain and a slight increase in the south. This can be clearly observed in Figure 7f, which shows the spatial differences (in %) between PrISM and IMERG-Early. Red areas indicate lower precipitation rates, whereas blue areas indicate higher rates. It is worth noting that the correction performed in IMERG-Final is very similar to the PrISM correction: a significant reduction in the precipitation rate in the north of the domain (with local increases), and a mixture of a reduction/increase in the south of the domain. This point is quite important, since the IMERG-Final uses rain gauge measurements available with a delay of 2.5 months, whereas PrISM uses SMOS measurements available with a delay of 1 day only.
More precisely, it can be observed that the two rain gauges located at the north of Burkina Faso which do not record any rain have both reduced rain rates in PrISM and IMERG-Final. Looking at the rain gauge at the southern tip of the domain and which does not record any rain, PrISM strongly reduces the precipitation rate by about −75%, whereas IMERG-Final indicates a precipitation rate similar to IMERG-Early.
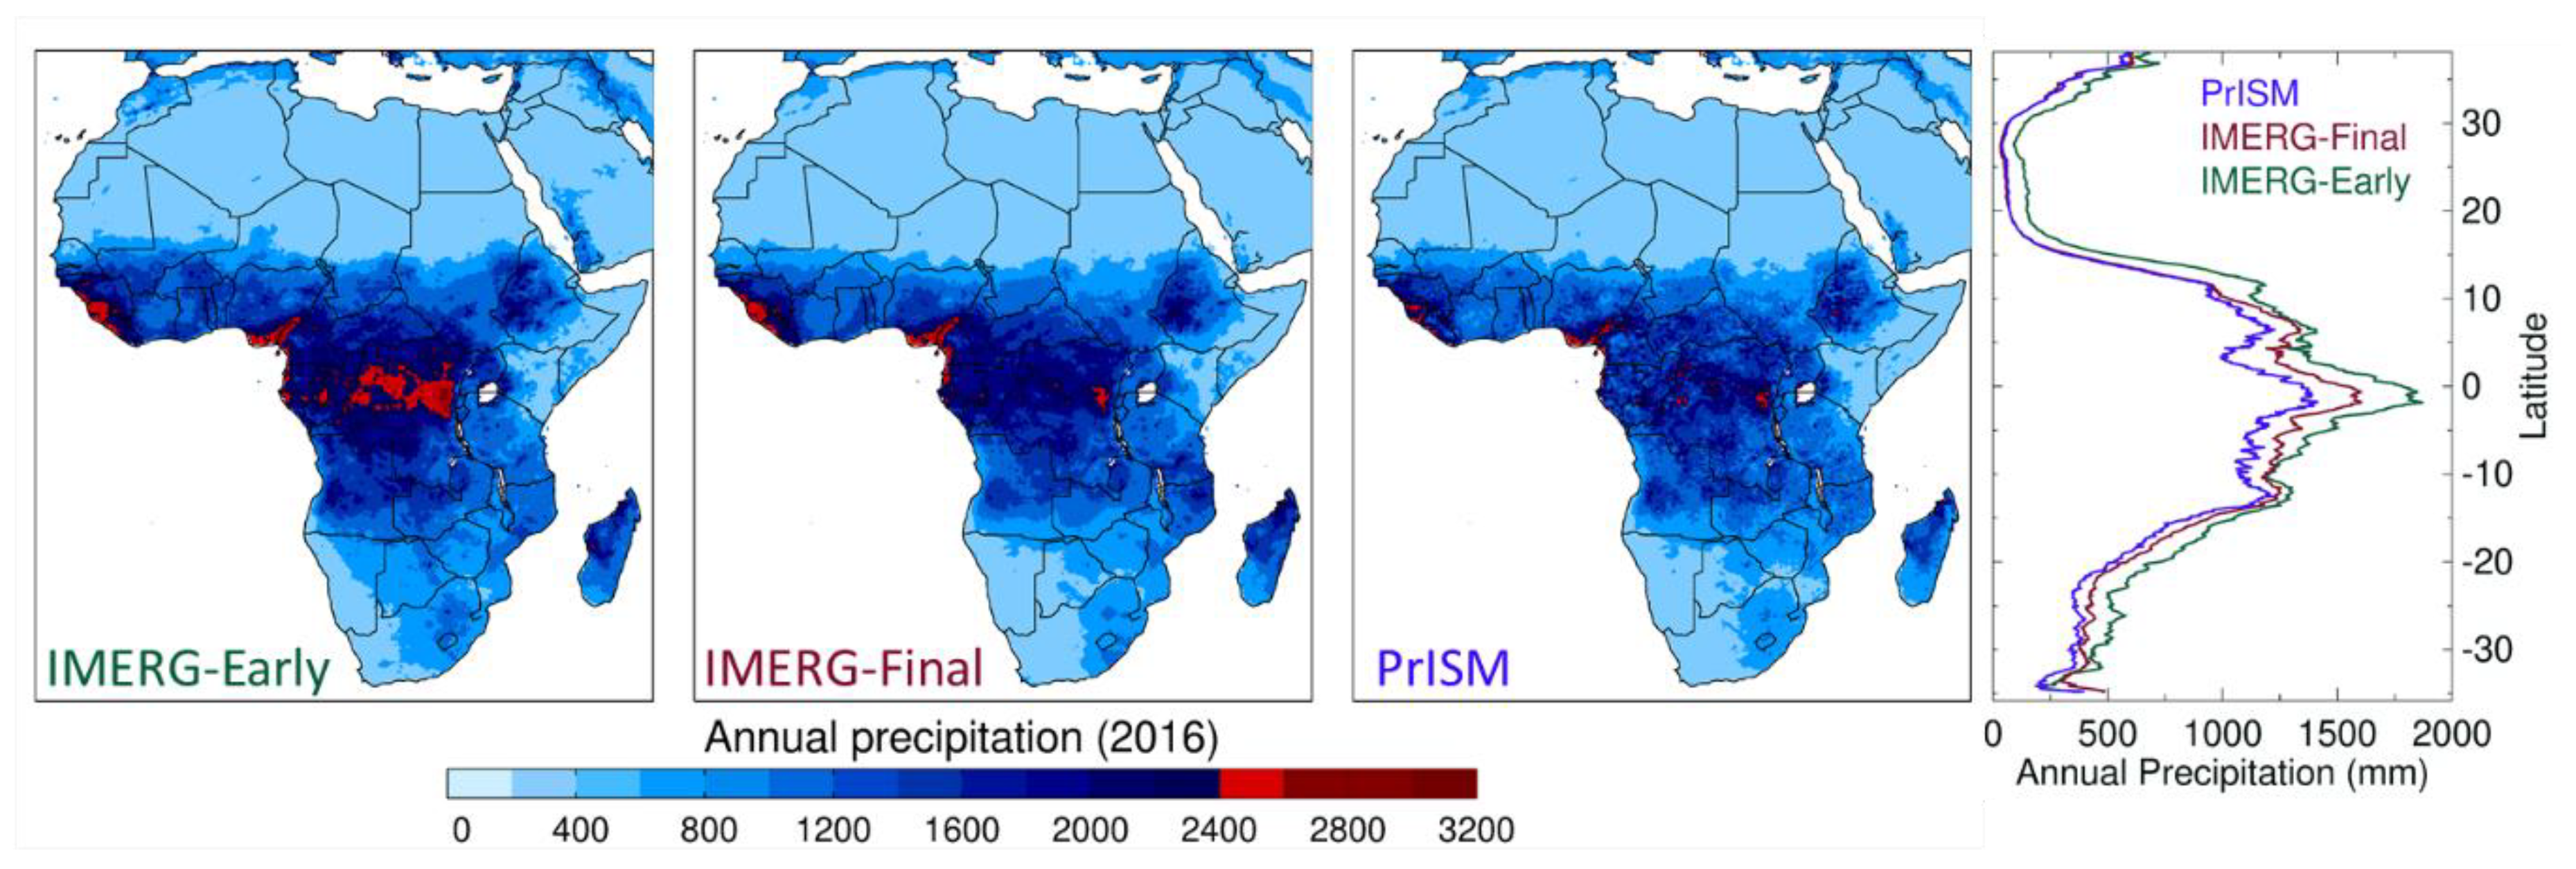
As the objective of the methodology is to provide an unbiased near-real-time precipitation product in Africa, this last section presents an overview of the spatial distribution of annual precipitation across the whole Africa for the year 2016 (Figure 8). We can observe a high degree of similarity between IMERG-Final and PrISM. Both products result in a reduction in the precipitation rate over most regions, except in certain regions (Ethiopia, Tanzania, Mozambique) where there is a slight increase in cumulative annual rainfall. This is interesting because this identical change in rainfall rate is achieved using two independent sources of information: a rain gauge network for IMERG-Final, and the SMOS soil moisture measurements for PrISM. The graph on the right shows the latitudinal distribution of annual precipitation values. Distributions for IMERG-Final and PrISM are similar with the exception of the tropics (from 10° S to 10° N) where PrISM produces 100–200 mm (i.e., 0.27 to 0.55 mm/day) less precipitation than IMERG-Final. This result is consistent with the observed positive bias of IMERG-Final in Central Africa (about 0.8 mm/day, Figure 5). Elsewhere, the two products are very similar. Finally, PrISM generates more spatial variability than IMERG-Final. This has not been investigated, but it may be due either to a kriging method that attenuates the spatial variability of the IMERG-Final precipitation product, or due to noise in the SMOS measurements that introduces non-real spatial variability into PrISM.

4. Discussion

In this study, we show that SMOS satellite soil moisture measurements at 0.25° spatial resolution can be used to successfully correct a satellite precipitation product with a finer spatial resolution. The methodology referred to as “PrISM” is based on the assimilation of SMOS soil moisture measurements into a simple soil moisture/precipitation model driven by an initial satellite precipitation product, IMERG-Early, at 0.10° resolution in this study. The performance assessment conducted using rainfall measurements issued from more than 200 rain gauges located in various climatic regions of Africa and for the period 2010 to 2020 leads to the following results. In average over all the 221 rain gauges, the RMSE is reduced from 8.0 mm/day (IMERG-Early) to 6.3 mm/day (PrISM), and the absolute bias is reduced from 0.81 to 0.63 mm/day. It is also found that PrISM precipitation product performs slightly better on average than IMERG-Final (RMSE = 6.8 mm/day and bias = 0.20 mm/day) which is a quite remarkable conclusion, since the latter uses a network of field measurements (rain gauges) to correct IMERG-Early biases and therefore provides its rainfall estimates with a 2.5-month delay. In that respect, the use of PrISM methodology which allows to remove biases in near-real-time (day + 1) is undoubtedly an advantageous alternative to the use of gauge measurements for debiasing satellite precipitation products.
A limitation of the PrISM approach is that it is not possible to create any rainfall event which was not detected by the initial precipitation product. However, as IMERG-Early generally contains more rainy days than those observed at the ground level, this can be considered a minor limitation of the methodology. For example (not shown), the probability of detection (the fraction of correctly predicted events) of IMERG-Early is always higher than 85% in the four left graphs in Figure 2, while the false alarm ratio (the fraction of predicted events that are actually non-events) is 36% on average. IMERG-Early, as is the case for many satellite precipitation products, tends to overestimate the number of rainfall events, which is an advantage for PrISM. This rate is slightly reduced to 29% with PrISM at these four sites.
The PrISM dataset can be freely downloaded on the zenodo website (https://zenodo.org/record/5780061#.Ybn2Md_jI2w) (accessed on 10 October 2021) which is updated annually. The near-real-time version of the product can be downloaded on the Observatoire des sciences de l’Univers de Grenoble (OSUG) website at http://osug-smos-rea.osug.fr:8081/erddap/index.html (accessed on 10 October 2021). Note that the near-real-time PrISM product is available with a latency of 1 day, but the product can be modified until day+5 due to the successive assimilation of SMOS measurements during the 5-day assimilation window. The definitive version of the PrISM precipitation product is obtained after 5 days.
One of the possible perspectives of this work will be to apply the PrISM algorithm to data from NASA’s SMAP space mission. Beyond the comparison of the performances of the algorithm using SMOS or SMAP, it could be also interesting to evaluate the contribution of the two soil moisture measurements used simultaneously in the PrISM algorithm. Doubling the number of soil moisture measurements should theoretically further improve the performance of PrISM in estimating rainfall.
In the longer term, although we have shown that SMOS can correct precipitation at a finer resolution, even better results can be expected in the future with a native resolution of the order of 0.1° as proposed in the SMOS-HR satellite project [39].
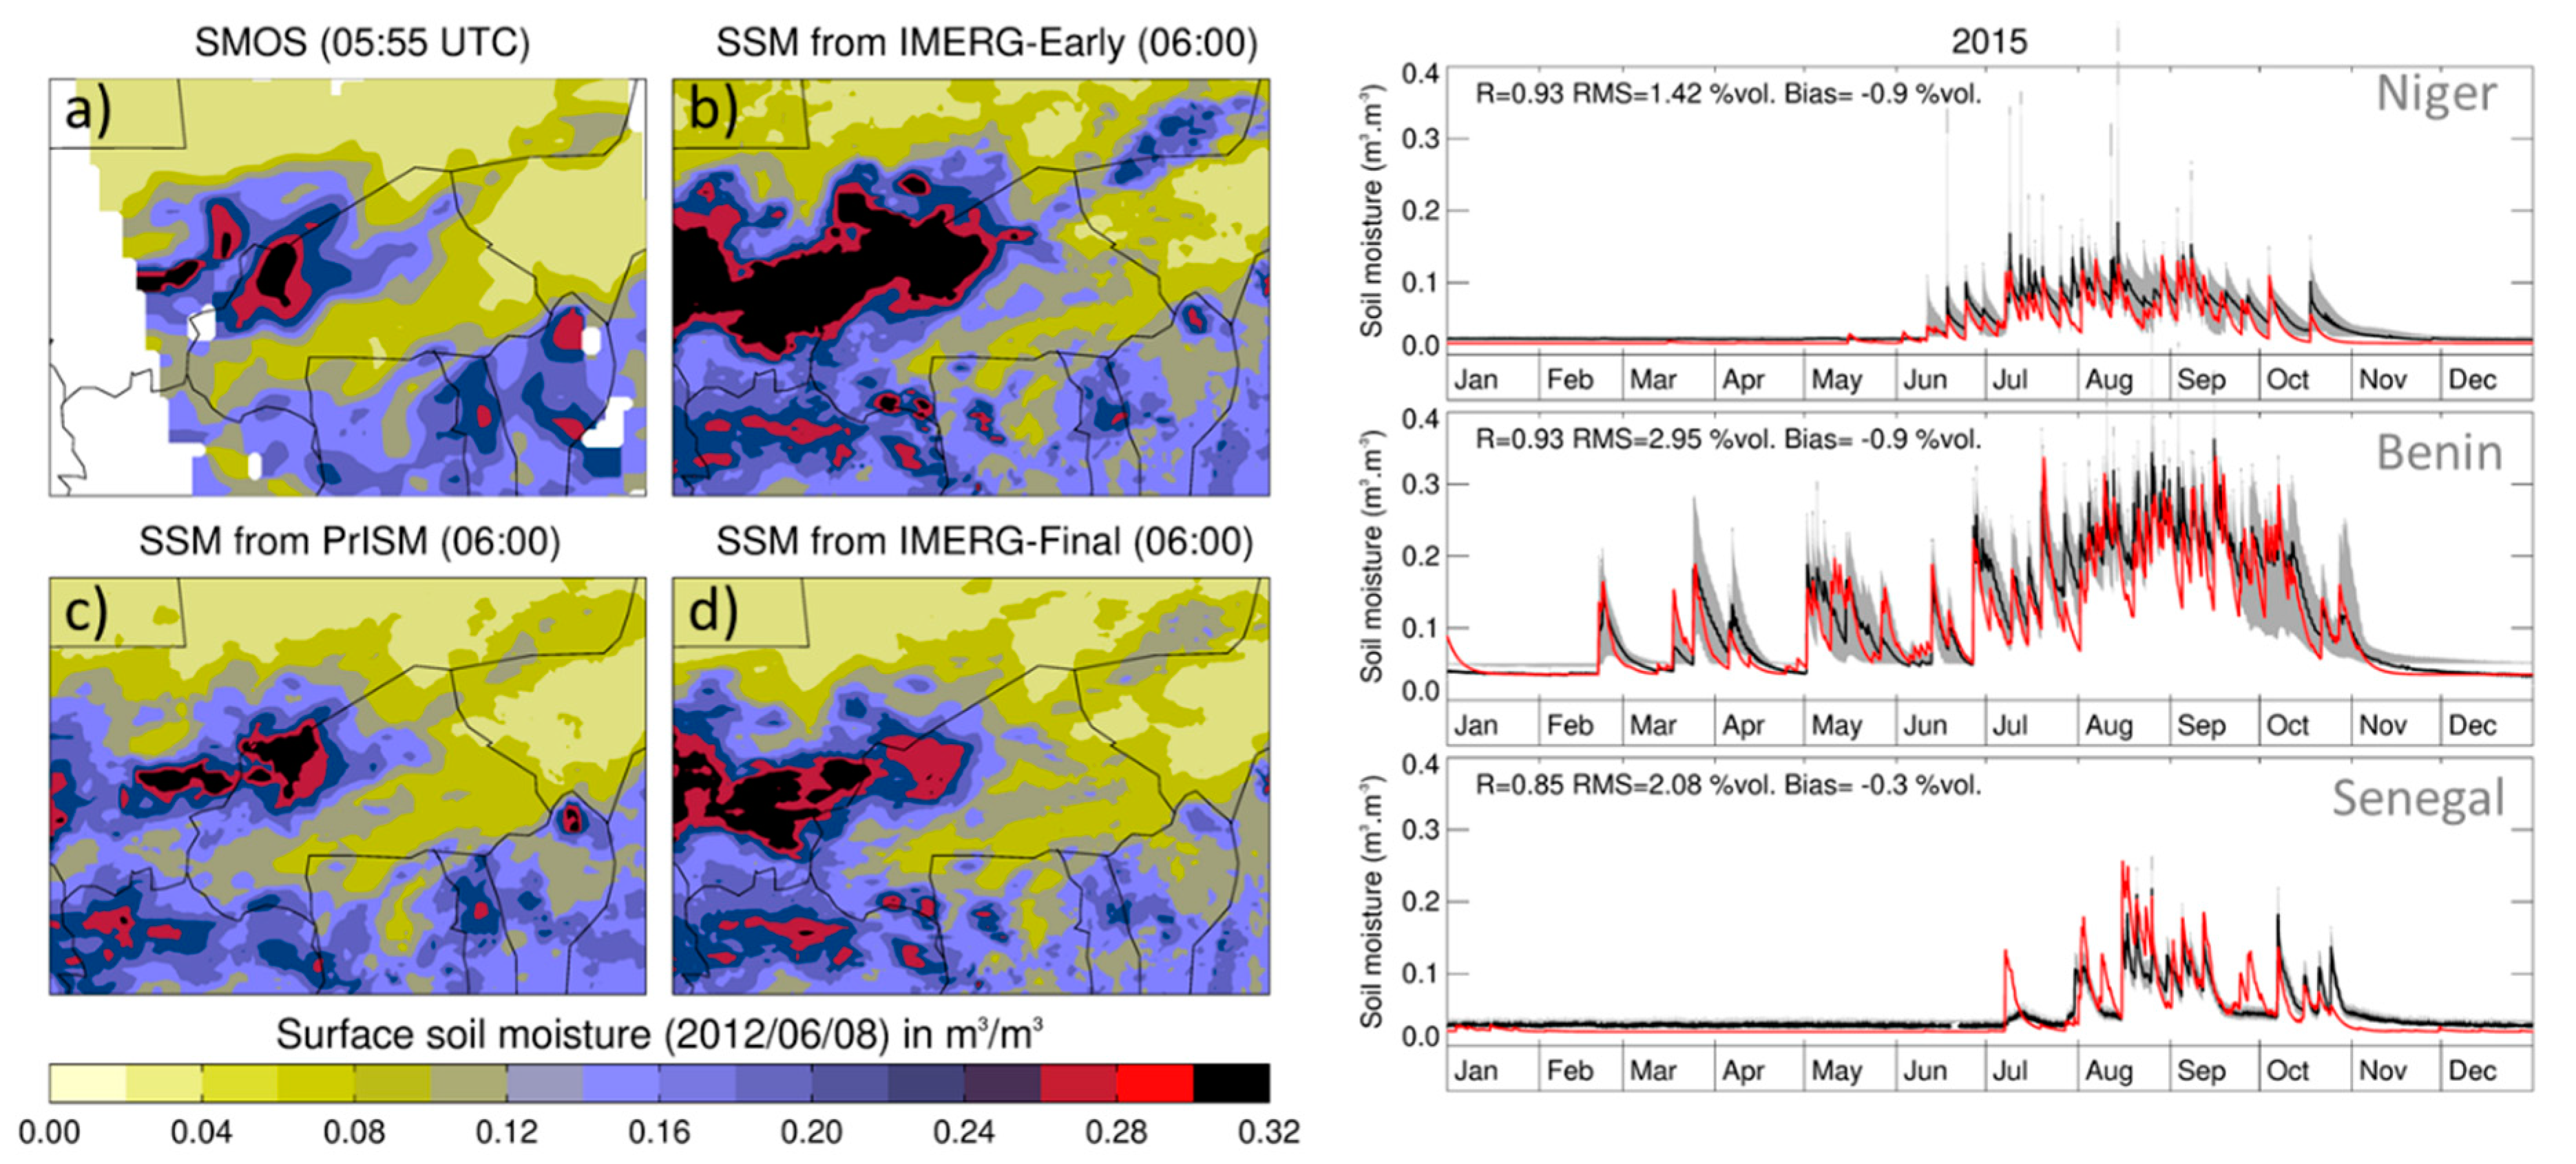
Another interesting perspective of this work will be to analyze and exploit the 5 cm soil moisture maps generated in addition to the precipitation estimates every 3 h and at the 0.1° resolution from the PrISM methodology. Indeed, these soil moisture maps are expected to be better correlated with the soil moisture observed by SMOS than those derived from IMERG. A quick overview of the quality of these soil moisture fields is given in Figure 9. On the left, the maps represent, respectively, the SMOS measurements (a), the soil moisture simulated with IMERG-Early and (Equation (1)) (b), the PrISM soil moisture (c) and the soil moisture simulated with IMERG-Final and (Equation (1)) (d). Unsurprisingly, the PrISM soil moisture map is in good agreement with the SMOS measurements, whereas the other two maps show disagreements both in spatial distribution and soil moisture values (especially map b). Finally, the three graphs on the right show a direct comparison of the PrISM soil moisture product with in situ soil moisture measurements obtained at three sites in Niger (Wankama site, 13.65° N; 2.65° E), Benin (Nalohou site, 9.65°N, 1.65°E) and Senegal (Dahra site [40], 15.45° N; 15.35° W). The detailed analysis of the soil moisture information provided by PrISM is an interesting aspect that should be performed in the future in order to detect advantages and limitations of the methodology, for example those related to the soil and land cover type of the studied area.

Author Contributions

T.P. suggested the original idea, conducted the experimental design, analyzed the data, and wrote the paper. A.Z. adapted the PrISM processing chain to the 0.1° resolution, set up the automatic acquisition of SMOS and IMERG data and participated in the validation of the algorithm, C.R.-C. contributed to the PrISM algorithm implementation, N.P. and G.P. provide rain gauge datasets; Y.H.K., N.R.-F. and J.-M.C. contribute to the original idea. All authors have read and agreed to the published version of the manuscript.

Funding

This research was funded by TOSCA (CNES, Centre national d’études spatiales, France) through the salary of A.Z during one year. The study was financially supported by ESA (grant number ESA/AO/1-7875/14/I-NC (4000114738/15/I-SBO).

Data Availability Statement

The PrISM dataset can be freely downloaded on the zenodo website (https://zenodo.org/record/5780061#.Ybn2Md_jI2w) (accessed on 10 October 2021). The SMOS L3 measurements from CATDS can be downloaded from https://www.catds.fr (accessed on 10 October 2021). The SMOS NRT soil moisture product using a neural network can be downloaded from the ESA website (https://smos-diss.eo.esa.int/oads/access, accessed on 10 October 2021) and the EUMETCast service by EUMETSAT. The IMERG data are available on the NASA website, and in particular on the GES DISC: https://disc.gsfc.nasa.gov/datasets/GPM_3IMERGHHE_06/summary?keywords=%22IMERG%20Early%22 (accessed on 10 October 2021). The AMMA-CATCH precipitation measurements (Niger and Benin sites) can be downloaded from the AMMA-CATCH database (http://www.amma-catch.org, accessed on 10 October 2021). The Watfor precipitation product (Central Africa) and the East Africa database are not freely available but can be obtained with the agreement of Pierre Camberlin.

Acknowledgments

The authors would like to thank the AMMA-CATCH Observatory: a hydrological, meteorological and ecological observatory in West Africa. IRD, CNRS-INSU, OSUG, OMP, OREME. doi:10.17178/AMMA-CATCH.all (AMMA-CATCH (1990). The authors would also like to acknowledge the following institutions: the University of Douala, the University Omar-Bongo in Libreville, the University of Bangui, the University of Liège, the CIRAD of Montpellier, the National Meteorological Department of Burkina Faso, and the CRC of Dijon (Pierre Camberlin) for providing the in situ rainfall dataset.

Conflicts of Interest

The authors declare no conflict of interest.

References

  1. Sultan, B.; Barbier, B.; Fortilus, J.; Mbaye, S.M.; Leclerc, G. Estimating the Potential Economic Value of Seasonal Forecasts in West Africa: A Long-Term Ex-Ante Assessment in Senegal. Weather. Clim. Soc. 2010, 2, 69–87. [Google Scholar] [CrossRef]
  2. Washington, R.; Harrison, M.; Conway, D.; Black, E.; Challinor, A.; Grimes, D.; Jones, R.; Morse, A.; Kay, G.; Todd, M. African climate change—Taking the shorter route. Bull. Am. Meteorol. Soc. 2006, 87, 1355–1366. [Google Scholar] [CrossRef]
  3. Nicholson, S.E.; Some, B.; McCollum, J.; Nelkin, E.; Klotter, D.; Berte, Y.; Diallo, B.M.; Gaye, I.; Kpabeba, G.; Ndiaye, O.; et al. Validation of TRMM and other rainfall estimates with a high-density gauge dataset for West Africa. Part I: Validation of GPCC rainfall product and pre-TRMM satellite and blended products. J. Appl. Meteorol. 2003, 42, 1337–1354. [Google Scholar] [CrossRef]
  4. Serrat-Capdevila, A.; Merino, M.; Valdes, J.B.; Durcik, M. Evaluation of the Performance of Three Satellite Precipitation Products over Africa. Remote Sens. 2016, 8, 836. [Google Scholar] [CrossRef] [Green Version]
  5. Guilloteau, C.; Roca, R.; Gosset, M. A Multiscale Evaluation of the Detection Capabilities of High-Resolution Satellite Precipitation Products in West Africa. J. Hydrometeorol. 2016, 17, 2041–2059. [Google Scholar] [CrossRef]
  6. Gosset, M.; Viarre, J.; Quantin, G.; Alcoba, M. Evaluation of several rainfall products used for hydrological applications over West Africa using two high-resolution gauge networks. Q. J. R. Meteorol. Soc. 2013, 139, 923–940. [Google Scholar] [CrossRef]
  7. Camberlin, P.; Barraud, G.; Bigot, S.; Dewitte, O.; Imwangana, F.M.; Mateso, J.C.M.; Martiny, N.; Monsieurs, E.; Moron, V.; Pellarin, T.; et al. Evaluation of remotely sensed rainfall products over Central Africa. Q. J. R. Meteorol. Soc. 2019, 145, 2115–2138. [Google Scholar] [CrossRef]
  8. Pomeon, T.; Jackisch, D.; Diekkruger, B. Evaluating the performance of remotely sensed and reanalysed precipitation data over West Africa using HBV light. J. Hydrol. 2017, 547, 222–235. [Google Scholar] [CrossRef]
  9. Maidment, R.I.; Grimes, D.I.F.; Allan, R.P.; Greatrex, H.; Rojas, O.; Leo, O. Evaluation of satellite-based and model re-analysis rainfall estimates for Uganda. Meteorol. Appl. 2013, 20, 308–317. [Google Scholar] [CrossRef] [Green Version]
  10. Roca, R.; Chambon, P.; Jobard, I.; Kirstetter, P.E. Comparing Satellite and Surface Rainfall Products over West Africa at Meteorologically Relevant Scales during the AMMA Campaign Using Error Estimates. J. Appl. Meteorol. Climatol. 2010, 49, 715–731. [Google Scholar] [CrossRef]
  11. Jobard, I.; Chopin, F.; Berges, J.C.; Roca, R. An intercomparison of 10-day satellite precipitation products during West African monsoon. Int. J. Remote Sens. 2011, 32, 2353–2376. [Google Scholar] [CrossRef]
  12. Le Coz, C.; Van De Giesen, N. Comparison of Rainfall Products over Sub-Saharan Africa. J. Hydrometeorol. 2020, 21, 553–596. [Google Scholar] [CrossRef]
  13. Huffman, G.; Bolvin, D.T.; Braithwaite, D.; Hsu, K.; Joyce, R.; Kidd, C.; Nelkin, E.J.; Sorooshian, S.; Tan, J.; Xie, P. NASAGlobal Precipitation Measurement (GPM) Integrated Multi-Satellite Retrievals for GPM (IMERG). Algorithm Theoretical Basis Doc. Version 5.2; p. 35. Available online: https://pmm.nasa.gov/sites/default/files/document_files/IMERG_ATBD_V5.2_0.pdf (accessed on 10 October 2021).
  14. Crow, W.T. A novel method for quantifying value in spaceborne soil moisture retrievals. J. Hydrometeorol. 2007, 8, 56–67. [Google Scholar] [CrossRef] [Green Version]
  15. Pellarin, T.; Ali, A.; Chopin, F.; Jobard, I.; Berges, J.C. Using spaceborne surface soil moisture to constrain satellite precipitation estimates over West Africa. Geophys. Res. Lett. 2008, 35, L02813. [Google Scholar] [CrossRef] [Green Version]
  16. Brocca, L.; Moramarco, T.; Melone, F.; Wagner, W. A new method for rainfall estimation through soil moisture observations. Geophys. Res. Lett. 2013, 40, 853–858. [Google Scholar] [CrossRef]
  17. Brocca, L.; Ciabatta, L.; Massari, C.; Moramarco, T.; Hahn, S.; Hasenauer, S.; Kidd, R.; Dorigo, W.; Wagner, W.; Levizzani, V. Soil as a natural rain gauge: Estimating global rainfall from satellite soil moisture data. J. Geophys. Res.-Atmos. 2014, 119, 5128–5141. [Google Scholar] [CrossRef]
  18. Koster, R.D.; Brocca, L.; Crow, W.T.; Burgin, M.S.; De Lannoy, G.J.M. Precipitation estimation using L-band and C-band soil moisture retrievals. Water Resour. Res. 2016, 52, 7213–7225. [Google Scholar] [CrossRef] [Green Version]
  19. Massari, C.; Crow, W.; Brocca, L. An assessment of the performance of global rainfall estimates without ground-based observations. Hydrol. Earth Syst. Sci. 2017, 21, 4347–4361. [Google Scholar] [CrossRef] [Green Version]
  20. Wanders, N.; Pan, M.; Wood, E.F. Correction of real-time satellite precipitation with multi-sensor satellite observations of land surface variables. Remote Sens. Environ. 2015, 160, 206–221. [Google Scholar] [CrossRef]
  21. Louvet, S.; Pellarin, T.; Al Bitar, A.; Cappelaere, B.; Galle, S.; Grippa, M.; Gruhier, C.; Kerr, Y.; Lebel, T.; Mialon, A.; et al. SMOS soil moisture product evaluation over West-Africa from local to regional scale. Remote Sens. Environ. 2015, 156, 383–394. [Google Scholar] [CrossRef]
  22. Zhan, W.; Pan, M.; Wanders, N.; Wood, E.F. Correction of real-time satellite precipitation with satellite soil moisture observations. Hydrol. Earth Syst. Sci. 2015, 19, 4275–4291. [Google Scholar] [CrossRef] [Green Version]
  23. Zhang, Z.; Wang, D.G.; Wang, G.L.; Qiu, J.X.; Liao, W.L. Use of SMAP Soil Moisture and Fitting Methods in Improving GPM Estimation in Near Real Time. Remote Sens. 2019, 11, 368. [Google Scholar] [CrossRef] [Green Version]
  24. Pellarin, T.; Román-Cascón, C.; Baron, C.; Bindlish, R.; Brocca, L.; Camberlin, P.; Fernández-Prieto, D.; Kerr, Y.H.; Massari, C.; Panthou, G.; et al. The Precipitation Inferred from Soil Moisture (PrISM) near Real-Time Rainfall Product: Evaluation and Comparison. Remote Sens. 2020, 12, 481. [Google Scholar] [CrossRef] [Green Version]
  25. Galle, S.; Grippa, M.; Peugeot, C.; Moussa, I.B.; Cappelaere, B.; Demarty, J.; Mougin, E.; Panthou, G.; Adjomayi, P.; Agbossou, E.K.; et al. AMMA-CATCH, a Critical Zone Observatory in West Africa Monitoring a Region in Transition. Vadose Zone J. 2018, 17. [Google Scholar] [CrossRef] [Green Version]
  26. Lebel, T.; Cappelaere, B.; Galle, S.; Hanan, N.; Kergoat, L.; Levis, S.; Vieux, B.; Descroix, L.; Gosset, M.; Mougin, E.; et al. AMMA-CATCH studies in the Sahelian region of West-Africa: An overview. J. Hydrol. 2009, 375, 3–13. [Google Scholar] [CrossRef] [Green Version]
  27. Camberlin, P. Temperature trends and variability in the Greater Horn of Africa: Interactions with precipitation. Clim. Dyn. 2017, 48, 477–498. [Google Scholar] [CrossRef]
  28. Huffman, G.J.; Bolvin, D.T.; Nelkin, E.J. Day 1 IMERG Final Run Release Notes. NASA Doc. 2015; p. 9. Available online: https://pmm.nasa.gov/sites/default/files/document_files/IMERG_FinalRun_Day1_release_notes.pdf (accessed on 10 October 2021).
  29. Kerr, Y.H.; Waldteufel, P.; Wigneron, J.P.; Martinuzzi, J.M.; Font, J.; Berger, M. Soil moisture retrieval from space: The Soil Moisture and Ocean Salinity (SMOS) mission. IEEE Trans. Geosci. Remote Sens. 2001, 39, 1729–1735. [Google Scholar] [CrossRef]
  30. Kerr, Y.H.; Al-Yaari, A.; Rodriguez-Fernandez, N.; Parrens, M.; Molero, B.; Leroux, D.; Bircher, S.; Mahmoodi, A.; Mialon, A.; Richaume, P.; et al. Overview of SMOS performance in terms of global soil moisture monitoring after six years in operation. Remote Sens. Environ. 2016, 180, 40–63. [Google Scholar] [CrossRef]
  31. Rodriguez-Fernandez, N.J.; Aires, F.; Richaume, P.; Kerr, Y.H.; Prigent, C.; Kolassa, J.; Cabot, F.; Jimenez, C.; Mahmoodi, A.; Drusch, M. Soil Moisture Retrieval Using Neural Networks: Application to SMOS. IEEE Trans. Geosci. Remote Sens. 2015, 53, 5991–6007. [Google Scholar] [CrossRef]
  32. Rodríguez-Fernández, N.J.; Muñoz Sabater, J.; Richaume, P.; Rosnay, P.D.; Kerr, Y.H.; Albergel, C.; Drusch, M.; Mecklenburg, S. SMOS near-real-time soil moisture product: Processor overview and first validation results. Hydrol. Earth Syst. Sci. 2017, 21, 5201–5216. [Google Scholar] [CrossRef] [Green Version]
  33. Rodríguez-Fernández, N.; de Rosnay, P.; Albergel, C.; Richaume, P.; Aires, F.; Prigent, C.; Kerr, Y. SMOS neural network soil moisture data assimilation in a land surface model and atmospheric impact. Remote Sens. 2019, 11, 1334. [Google Scholar] [CrossRef] [Green Version]
  34. Román-Cascón, C.; Pellarin, T.; Gibon, F.; Brocca, L.; Cosme, E.; Crow, W.; Fernandez-Prieto, D.; Kerr, Y.H.; Massari, C. Correcting satellite-based precipitation products through SMOS soil moisture data assimilation in two land-surface models of different complexity: API and SURFEX. Remote Sens. Environ. 2017, 200, 295–310. [Google Scholar] [CrossRef]
  35. Doucet, A.; Godsill, S.; Andrieu, C. On sequential Monte Carlo sampling methods for Bayesian filtering. Stat. Comput. 2000, 10, 197–208. [Google Scholar] [CrossRef]
  36. Moradkhani, H.; Hsu, K.L.; Gupta, H.; Sorooshian, S. Uncertainty assessment of hydrologic model states and parameters: Sequential data assimilation using the particle filter. Water Resour. Res. 2005, 41. [Google Scholar] [CrossRef] [Green Version]
  37. Van Leeuwen, P.J. Particle Filtering in Geophysical Systems. Mon. Weather. Rev. 2009, 137, 4089–4114. [Google Scholar] [CrossRef]
  38. Yan, H.X.; DeChant, C.M.; Moradkhani, H. Improving Soil Moisture Profile Prediction With the Particle Filter-Markov Chain Monte Carlo Method. IEEE Trans. Geosci. Remote Sens. 2015, 53, 6134–6147. [Google Scholar] [CrossRef]
  39. Rodriguez-Fernandez, N.; Anterrieu, E.; Rouge, B.; Boutin, J.; Picard, G.; Pellarin, T.; Escorihuela, M.-J.; Al Bitar, A.; Richaume, P.; Mialon, A.; et al. SMOS-HR: A high resolution l-band passive radiometer for earth science and applications. In Proceedings of the IGARSS 2019—2019 IEEE International Geoscience and Remote Sensing Symposium, Yokohama, Japan, 28 July–2 August 2019; pp. 8392–8395. [Google Scholar]
  40. Tagesson, T.; Fensholt, R.; Guiro, I.; Rasmussen, M.; Huber, S.; Mbow, C.; Garcia, M.; Horion, S.; Sandholt, I.; Holm-Rasmussen, B.; et al. Ecosystem properties of semi-arid savanna grassland in West Africa and its relationship to environmental variability. Glob. Chang. Biol. 2015, 21, 250–264. [Google Scholar] [CrossRef] [Green Version]
Figure 3. Illustration of 3 (out of 5) successive PF assimilation schemes for a 5-day assimilation window in the Benin site in 2012. A first assimilation period ((a), 25–29 September) is followed by a second one ((b), 26–30 September) and so on until (e). The 29/09 rainfall event is therefore corrected 5 times. One hundred stochastic perturbations (gray bars) of the initial IMERG-Early rainfall rate (red bars) produce an ensemble of 100 soil moisture potential trajectories (gray curves). The SMOSCDF measurements (red diamonds) are used to choose the 30 most likely changes in soil moisture (orange curves) and to determine the mean soil moisture evolution (blue curve), associated with the PrISM rainfall rate (blue bars). In situ measurements of rainfall are provided as black bars.
Remotesensing 14 00746 g003
Figure 4. Improvement (blue circles) and deterioration (red circles) gained with the PrISM methodology compared to IMERG-Early for Niger (upper panels) and for Benin (bottom panels). Pearson correlation (left), RMSE (middle), and bias (right).
Remotesensing 14 00746 g004
Figure 5. Statistical scores (R, RMSE, Bias) obtained for the 5 regional precipitation networks and the 3 satellite precipitation products (IMERG-Early, IMERG-Final and PrISM).
Remotesensing 14 00746 g005
Figure 6. Evaluation of PrISM compared to IMERG-ER (left graphs) and IMERG-FR compared to IMERG-ER (right graphs) based on 140 rain gauges located in Burkina Faso, Central Africa and East Africa. Blue pixels indicate an improvement in scores (R (top), RMSE (middle), Bias (bottom)) while red pixels indicate a deterioration.
Remotesensing 14 00746 g006
Figure 7. Illustration of the spatial modification of IMERG-Early precipitation product using the PrISM methodology (region of Burkina Faso). The four top graphs show the 24 h cumulative rainfall (from 2012 June 7th 06:00 to June 8th 06:00) respectively with IMERG-Early (a), PrISM (b), IMERG-Final (c), and in situ rain gauges (d). The four bottom graphs show respectively the SMOS soil moisture measurements at 5:55 UTC (e), the difference of precipitation (in %) between PrISM and IMERG-Early (f), and between IMERG-Final and IMERG-Early (g), and PrISM soil moisture at 6:00 UTC (h).
Remotesensing 14 00746 g007
Figure 8. Annual rainfall amount in 2016 in Africa for IMERG-Early, IMERG-Final and PrISM. The right graph displays the latitudinal distribution of the annual rainfall amount.
Remotesensing 14 00746 g008
Figure 9. (Left) Spatial distribution of soil moisture on 2012, June 8th 06:00 around Burkina Faso from SMOS (a) and from simulated soil moisture using (Equation (1)) and IMERG-Early (b), PrISM (c) and IMERG-Final (d) precipitation products, respectively. (Right), the PrISM soil moisture product (red) is compared to in situ soil moisture measurements (black and gray) in Niger (13.65° N, 2.65° E), Benin (9.65° N, 1.65° E) and Senegal (15.45° N, 15.35° W).
Remotesensing 14 00746 g009
Table 1. Precipitation networks used for assessment in this study.
Data SetNb StationsPeriodTime-ScaleMissing Data
Niger41 2010–20213 h0%
Benin402010–20213 h0%
Burkina Faso202010–2015Daily13%
Central Africa552010–2015Daily48%
East Africa652010–2013Daily53%
Table 2. Satellite precipitation products used in this study.
Data SetSpatial ResolutionTime-ScalePeriodLatencyGround Calibration
IMERG-Early0.1°0.5 h -> 3 h2000-present~4 hno
IMERG-Final0.1°0.5 h -> 3 h2000-present~2.5 monthyes
PrISM0.1°3 h2010-present~24 hno
Publisher’s Note: MDPI stays neutral with regard to jurisdictional claims in published maps and institutional affiliations.