Article

Comparing the Ability of Burned Area Products to Detect Crop Residue Burning in China

1
College of Mining Engineering, Taiyuan University of Technology, Taiyuan 030024, China
2
Key Laboratory of Wetland Ecology and Environment, Northeast Institute of Geography and Agroecology, Chinese Academy of Sciences, Changchun 130102, China
*
Author to whom correspondence should be addressed.
Remote Sens. 2022, 14(3), 693; https://doi.org/10.3390/rs14030693
Submission received: 7 December 2021 / Revised: 27 January 2022 / Accepted: 28 January 2022 / Published: 1 February 2022

Abstract

:
Burning crop residues is a common way to remove them during the final stages of crop ripening in China. To conduct research effectively, it is critical to reliably and quantitatively estimate the extent and location of a burned area. Here, we investigated three publicly available burned area products—MCD64A1, FireCCI 5.1, and the Copernicus Burnt Area—and evaluated their relative performance at estimating total burned areas for cropland regions in China between 2015 and 2019. We compared these burned area products at a fine spatial and temporal scale using a grid system comprised of three-dimensional cells spanning both space and time. In general, the Copernicus Burnt Area product detected the largest annual average burned area (37,095.1 km2), followed by MCD64A1 (21,631.4 km2) and FireCCI 5.1 (12,547.99 km2). The Copernicus Burnt Area product showed a consistent pattern of monthly burned areas during the study period, whereas MCD64A1 and FireCCI 5.1 showed frequent changes in monthly burned area peaks. The greatest spatial differences between all three products occurred in Northeast and North China, where cultivated land is concentrated. The burned area detected by Copernicus in Xinjiang Province was larger than that detected by the other two products. In conclusion, we found that all three products underestimated the amount of crop residues present in a burned area. This limits the ability of end users to understand fire-related impacts and burned area characteristics, and hinders them in making an informed choice of which product is most appropriate for their application.

1. Introduction

Biomass burning is an important driver of climate change, and impacts both the carbon cycle and plant succession processes. It is essential to accurately constrain a fire’s location and extent in order to conduct reliable fire-related research, and several methods have been developed to detect and monitor fires using remote sensing. Several multiannual burned areas have been developed worldwide since the late 1990s and are freely available for study [1]. These were developed for different purposes, occur at different scales, and offer different spatial resolutions, such that they vary considerably in distribution, size, and frequency of mapped fires [2]. Significant discrepancies in areal estimates and spatial patterns of fire damage have also been observed among them [3].
To support the case for a systematic investigation of the differences among burned area products, numerous studies have validated the products using independent reference data, such as ground-truthing data [4,5] or higher spatial resolution images that have minimal errors (e.g., Landsat or Sentinel) [6,7,8,9,10]; however, such efforts are expensive and time consuming. Comparison between burned area products is therefore a necessary step and practical tool for characterizing each product according to their performance, especially when field-based validation data are not available [11]. This should be recognized as a complementary assessment to product validation. Furthermore, since no product can perfectly represent burned area characteristics, as all have limitations, the choice of which product to use should consider the advantages and disadvantages of each. A key consideration in such a choice is a study’s research objective and intended application of any acquired data, making the regional performance of each product an important criterion. Pessôa et al. [11] compared four fire products in the Amazon region and analyzed their individual impacts on a forest’s carbon emissions. A similar study was performed by Valencia et al. [12], where five forested burned area products were compared with each other. However, there is still remarkable uncertainty within the community regarding the worldwide burned area extent in cropland areas. Currently, there are very few studies that have provided a global or regional comparison of burned area products for crop residues that have burned areas smaller than 100 ha, which results in large detection errors due to the relatively coarse spatial resolution of these data [13]. Therefore, additional analysis of crop residue burning is needed to provide new insights into the relative performance of burned area products.
Fires are often used as a tool to eliminate crop residues during the final stages of crop ripening in China, as there are no alternative methods for treating them [14]. Knowledge about the current state of fire dynamics in China relies heavily on satellite-derived analyses of burned areas. Nevertheless, very few studies have compared the consistency of available satellite products detailing the location and extent of burned areas in this region. Given the importance of this assessment to improve fire products in China, it is critical to evaluate the relative performances of the most-used global burned area products in cropland regions, which can provide clear insight into their limitations. Here, we performed a comparison of three global burned area products by considering the total cropland burned area detected in China from 2015 to 2019. The specific objectives of this study were as follows: (i) evaluate the differences and similarities among the MCD64A1, FireCCI 5.1, and the Copernicus Burnt Area products, specifically regarding the total burned area detected over cropland regions; (ii) compare the temporal differences and similarities between the products, with MCD64A1 used as a reference; and (iii) compare the spatial differences and similarities between the products, with MCD64A1 used as a reference.

2. Materials and Methods
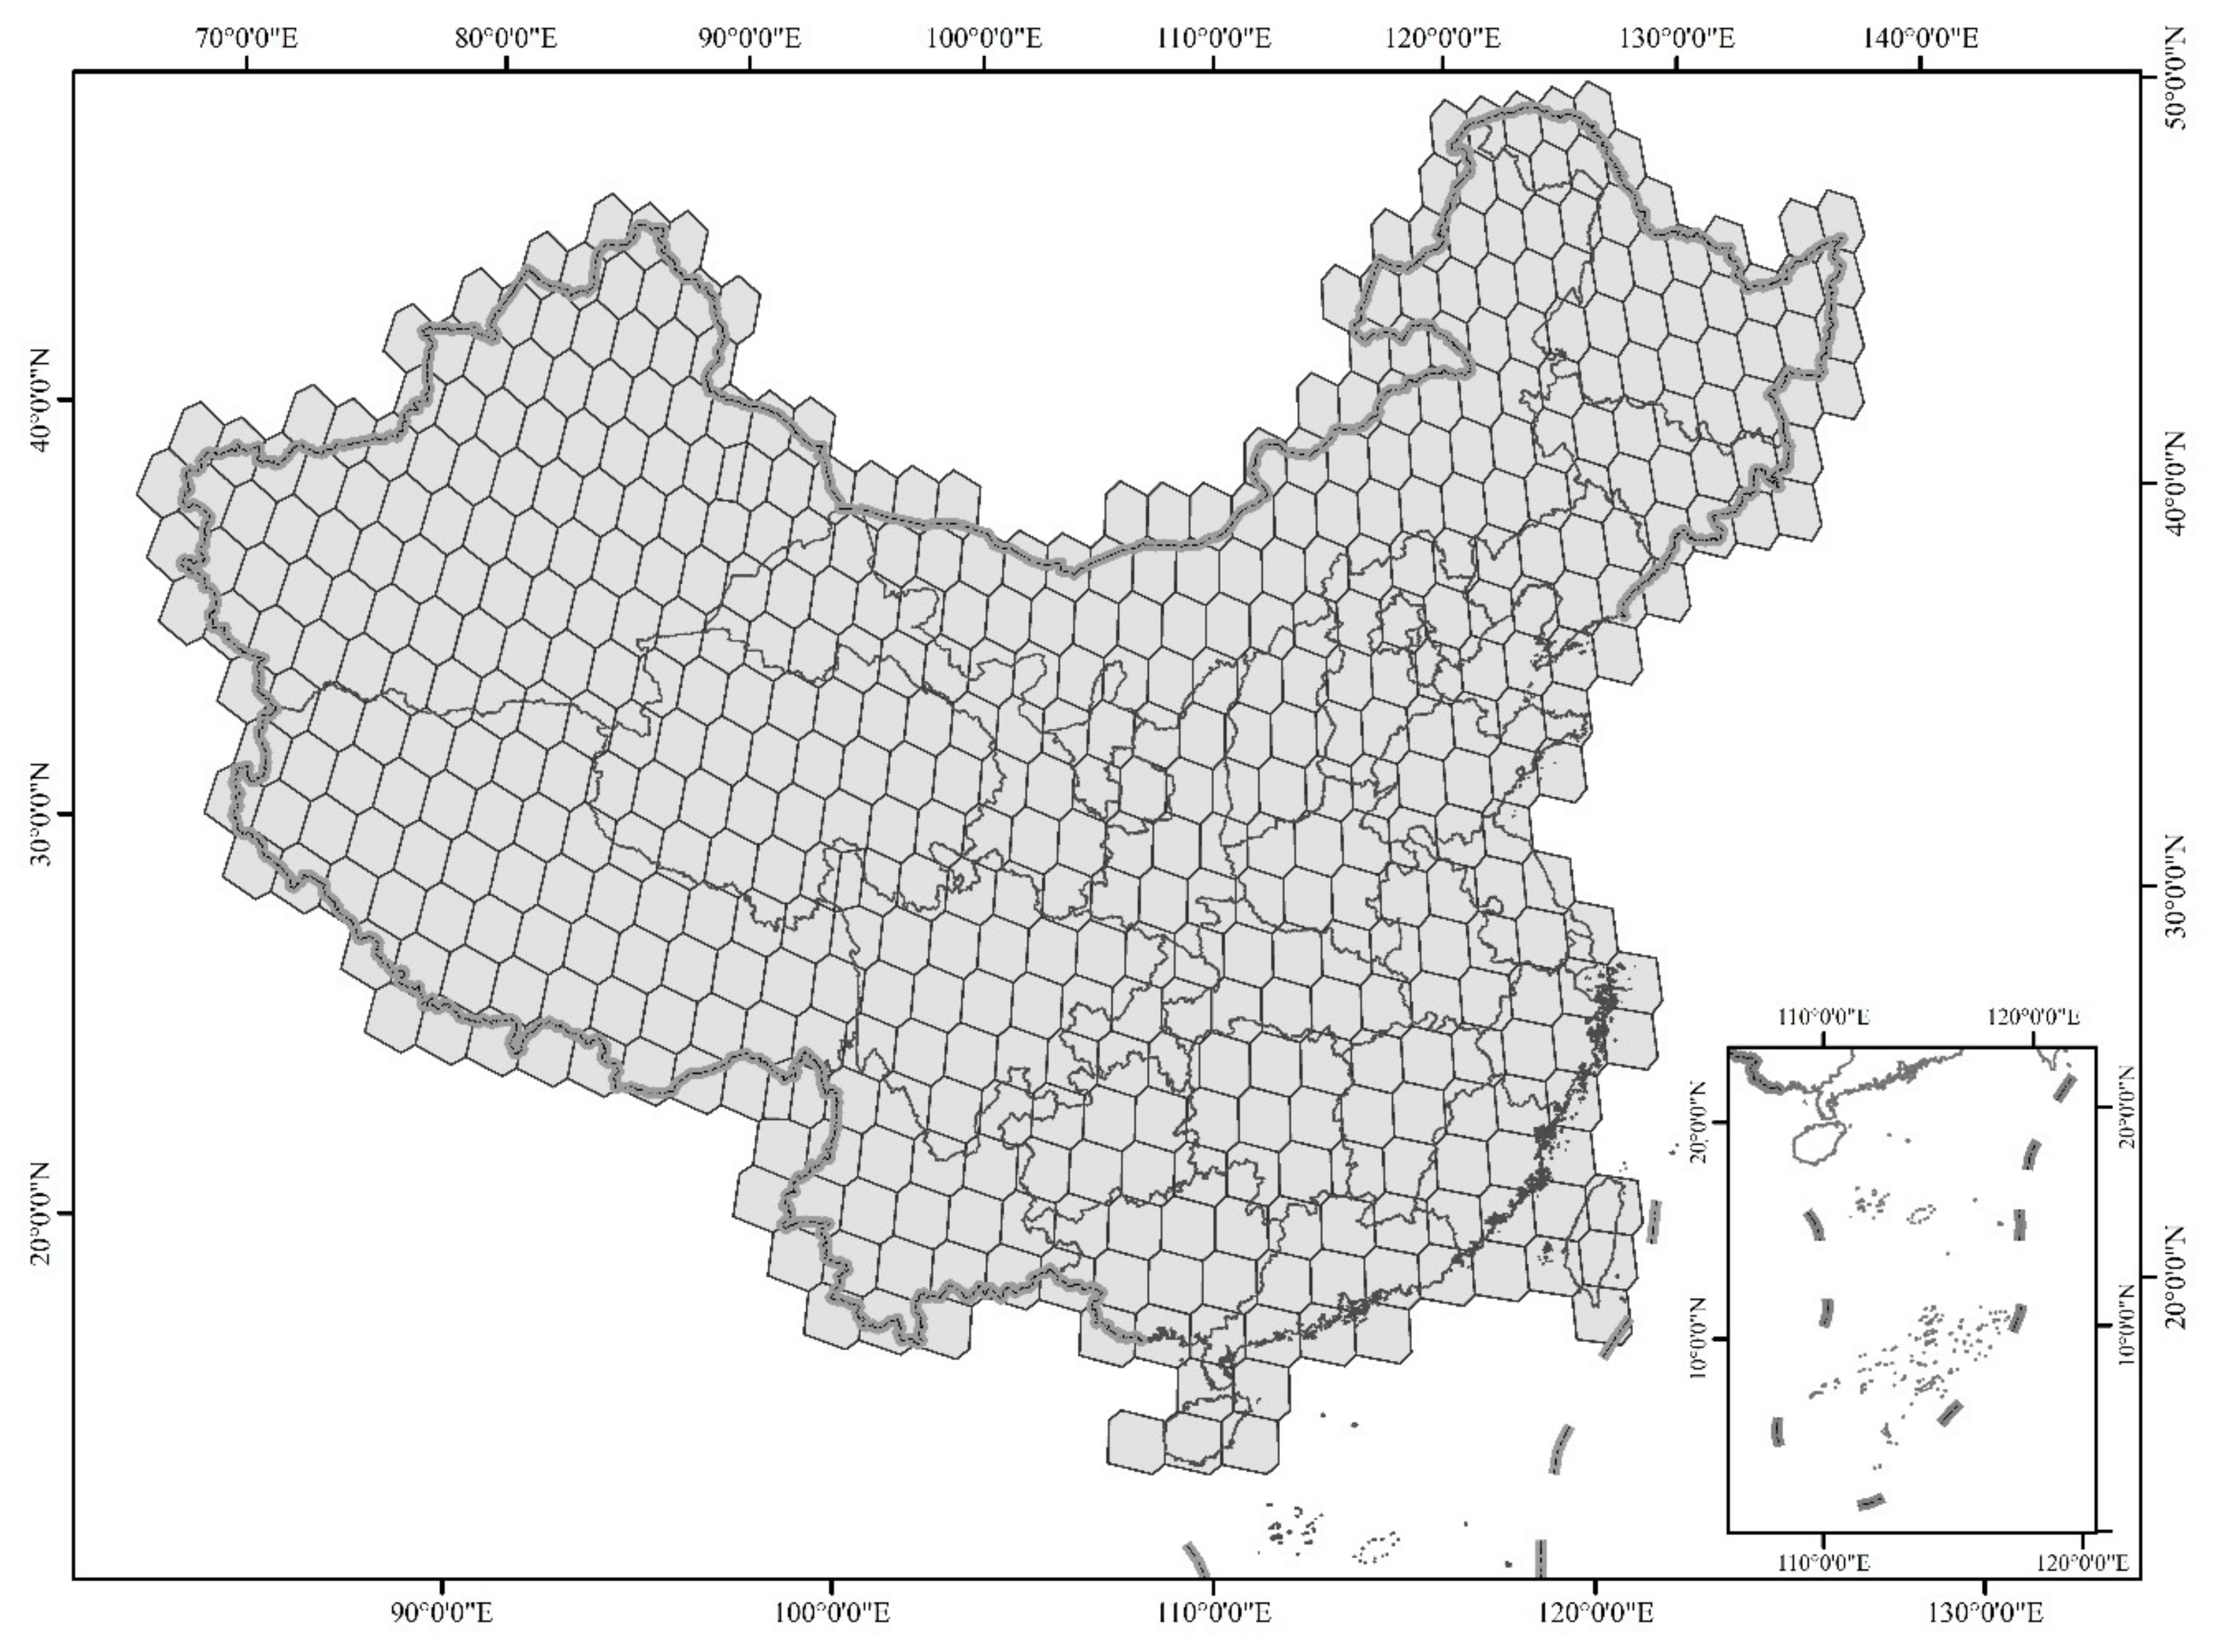
2.1. Study Area

China is one of the largest agricultural nations in the world and produces more agricultural crop residues than any other country [15]. Regions of China that are used largely for agricultural purposes include plains situated in Northeast and North China, and the Sichuan Basin in Southwest China [16]. Slash-and-burn cultivation and crop residue burning are traditional agricultural practices [17], and a large amount of crop residue is burned in China [14] during the summer/autumn harvest season in order to eliminate agricultural straw [16]. Northeast and North China each have two main fire seasons: spring (February to May, with a peak in March) and autumn (late October to early November) in the former, and summer (late May to early June) and autumn (September to October) in the latter. The main characteristics of burning crop residues in China are: (i) a large number of fire spots that are widely distributed; (ii) random occurrence times; and (iii) small burned areas [18]. These characteristics make it difficult to accurately detect all of the residues that occur in a burned area with coarse-resolution satellite data, leading to large errors in the detection results. This study considered the entire land surface of China (Figure 1).

2.2. Data

2.2.1. Global Burned Area Products

Most satellite-derived global fire data sets fall into two broad categories: burned area products and active fire products [19]. Burned area products demarcate the location of a burned area, its spatial extent, and its approximate data of occurrence, which are all needed to assess crop residue burning activities. In this study, three global burned area products were selected for analysis and comparison: the Copernicus Burnt Area product, FireCCI 5.1 burned area product, and MODIS MCD64A1 burned area product. Brief descriptions of these products are provided in Table 1 and their algorithms are described below. April 2014 to December 2019 represents a common period of time in which these products have data available; therefore, the five-year period between 2015 and 2019 was considered in this study.
The MCD64A1 based on a hybrid approach is generated from the active-fire and MODIS cloud-free surface reflectance imagery. First, a daily burn-sensitive vegetation index (VI) derived from MODIS time series using the red, near-infrared and short-wave infrared channels. Then, the algorithm calculates descriptive statistics based on the VI data time series and defines a measure of temporal separability through dynamic thresholds, yielding composites images of these parameters. Finally, cumulative active fire maps are used to generate regional probability density functions for the classification of burned and unburned training samples that will guide the final determination of burned and unburned pixels [20,21]. The main inputs to derive FireCCI 5.1 product based on a two-phase approach are the daily MODIS near infrared reflectance and thermal anomalies data. Firstly, only hotspots that have a high probability of being burned are selected as seed pixels. Then, a contextual growing algorithm is applied from the seed pixels to reduce omission errors by detecting the whole burned patch. Both phases use detection thresholds better adapted to local fuel and fire conditions [22].
The algorithm of Copernicus is based on a breakpoint analysis that identifies sudden spectral changes related to burns on temporal series of reflectance observations. Active fires location and timing are used as seeds in a spatio-temporal regional growing algorithm. The region (burn patch) grows through the detections of sudden burn-like spectral changes, across the spatial and temporal domains. It uses fixed thresholds to identifies the sudden spectral changes [23].
Table 1. Overview of burned area and land cover products used for comparison.
Name of ProductSatellite SensorTime SpanTemporal ResolutionSpatial ResolutionAlgorithm SourceDownload Website
MCD64A1 Collection 6MODIS Aqua and Terra2001 to presentmonthly500 m[24]https://modis-fire.umd.edu/ba.html (accessed on 26 September 2021)
FireCCI 5.1MODIS Aqua and Terra2001–2019monthly250 m[25]https://data.ceda.ac.uk/neodc/esacci/fire/data/burned_area/MODIS/pixel/v5.1/compressed (accessed on 26 September 2021)
Copernicus Burnt AreaPROBA-V2014 to present10 days300 m[23]https://land.copernicus.eu/global/products/BA (accessed on 26 September 2021)
Land coverPROBA-V2015–2019annual100 m[26]https://land.copernicus.eu/global/products/lc (accessed on 26 September 2021)

2.2.2. Land Cover Data

Land cover information was extracted from operational products made available through the Copernicus Land Monitoring Service. Corine Land Cover (CLC) versions with a 100-m pixel resolution and spanning the 2015–2019 study period was used to obtain cropland distribution information.

2.3. Methods

2.3.1. Pre-Processing of Burned Area Products

The HDF files of MCD64A1 were converted into GeoTIFF and reprojected from sinusoidal to geographic coordinates to calculate the burned areas. This product provides the approximate burn date, burn date uncertainty, quality assurance (QA), first day and last day layers. The data type of FireCCI 5.1 used in this study is pixel-version with 250 m spatial resolution. FireCCI 5.1 provides a monthly GeoTIFF dataset with three layers, estimated first day of burn (Julian-date), confidence level, and land cover type of a detected burn pixel. All the pixels of MCD64A1 and FireCCI 5.1 regardless the confidence level was used for this analysis. Copernicus has two 10-day products. One contains the pixel that have been flagged as being burned during the 10-day period. The second contains a file value indicating the date of detection expressed as a Julian date for those pixels that were detected as being burned in the 10-day period. These 10-day products were composited into monthly dataset in order to be consistent with the other two products. Before the three products were calculated with land cover data to obtain the cropland distribution area, all these three products were resampled to 100 m to keep their spatial resolution consistent with the land cover product.

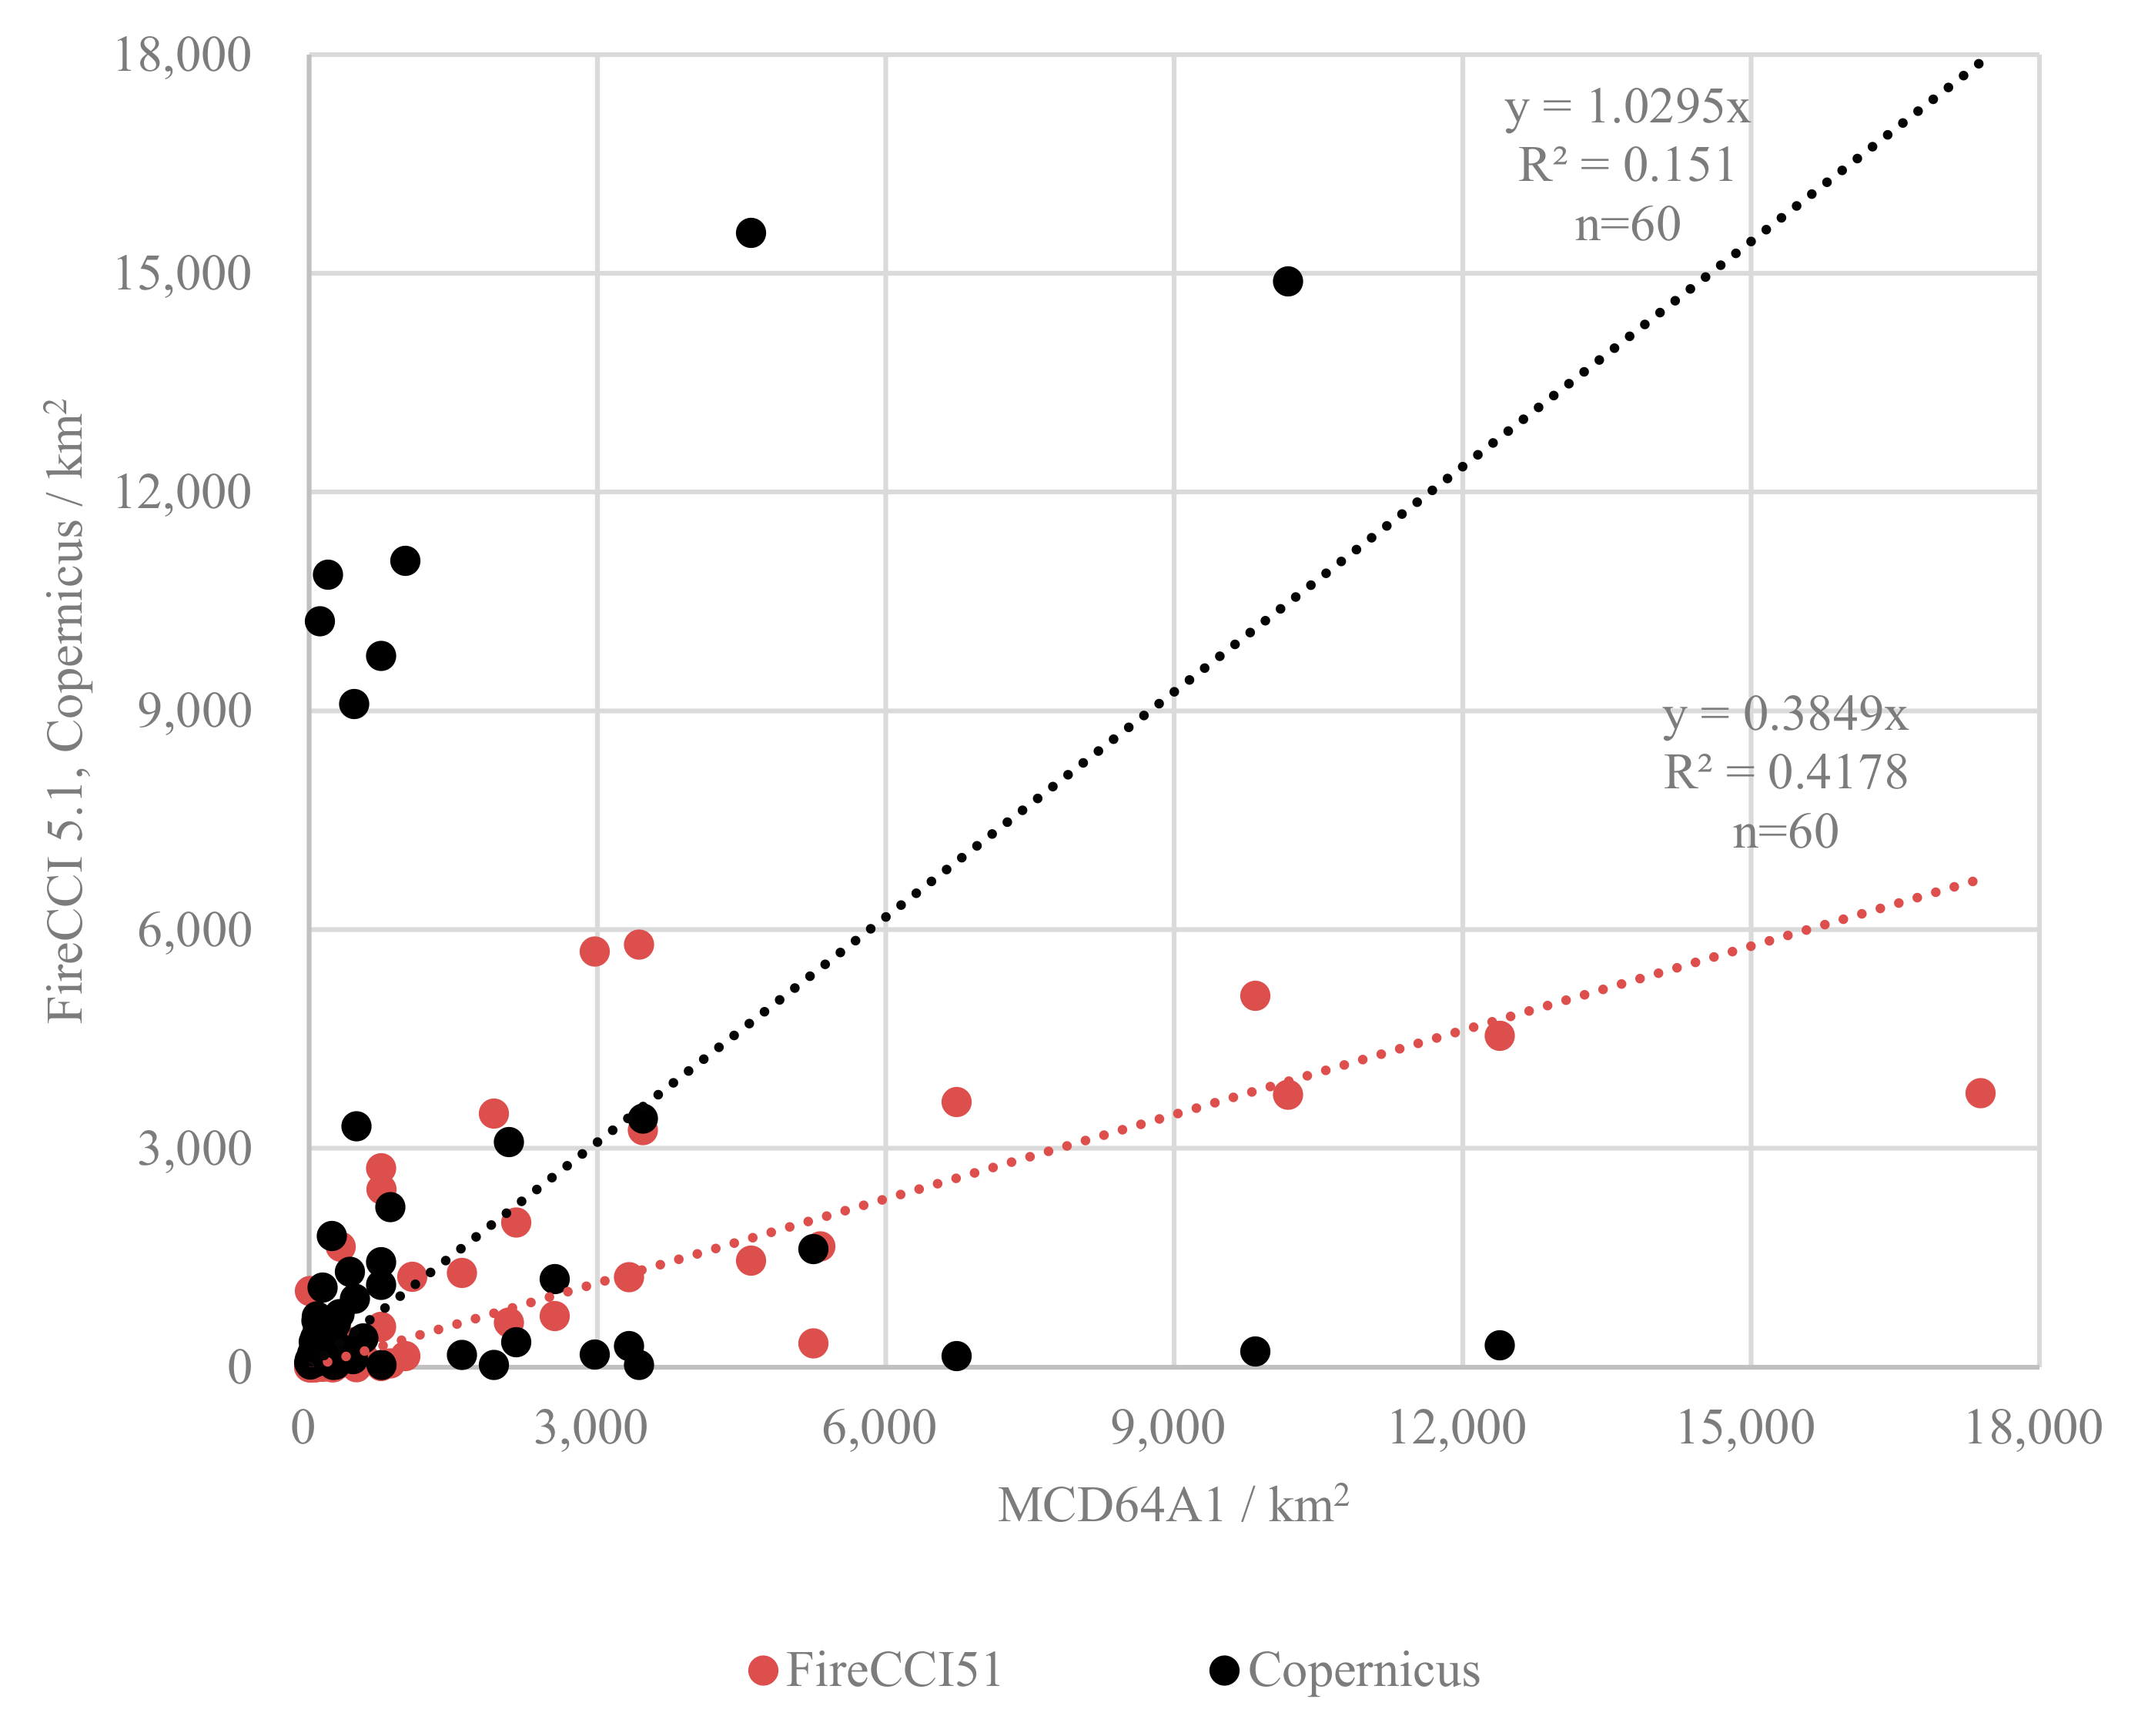
2.3.2. Comparison of Burned Area Products

This study compared products by using a grid of fine-resolution temporal and spatial data comprised of voxels [1], which were defined spatially by Landsat Thiessen scene areas (TSAs) and temporally defined by calendar month. These TSA polygons have been used as one of the validation bases for global burned area products in previous studies [1,6,27]. Together, the entire land surface of China is covered by 531 TSAs and the entire cropland surface of China is covered by 447 TSAs. Here, the cropland area refers to that present in 2019.
Comparisons among products were made with respect to MCD64A1, as it is the product most commonly used to monitor burned areas at regional and global scales [8], and was also the most recently updated product at the time of analysis [1]. Thus, burned area differences between products were calculated as MCD64A1 minus FireCCI 5.1 and MCD64A1 minus Copernicus.
Our methodology involved six steps performed at both temporal and spatial scales. At the temporal scale, analyses were conducted in three steps: (1) comparing the total burned areas on both annual and monthly scales for each product; (2) analyzing the consistency between FireCCI 5.1, Copernicus, and MCD64A1 data, which involved using monthly burned area data to fit linear regressions and calculate goodness-of-fit values in a least-squares model (R2); and (3) comparing the monthly burned area differences between FireCCI 5.1, Copernicus, and MCD64A1. At the spatial scale, analyses were conducted in three steps: (1) comparing the spatial distribution of burned area difference in each TSA; (2) fit linear regressions and consider goodness-of-fit values in a least-squares model (R2) between FireCCI 5.1, Copernicus, and MCD64A1, which was achieved by using a TSA as a sample to analyze spatial consistency; and (3) comparing the ability of all three products by using typical TSAs as examples.

3. Results

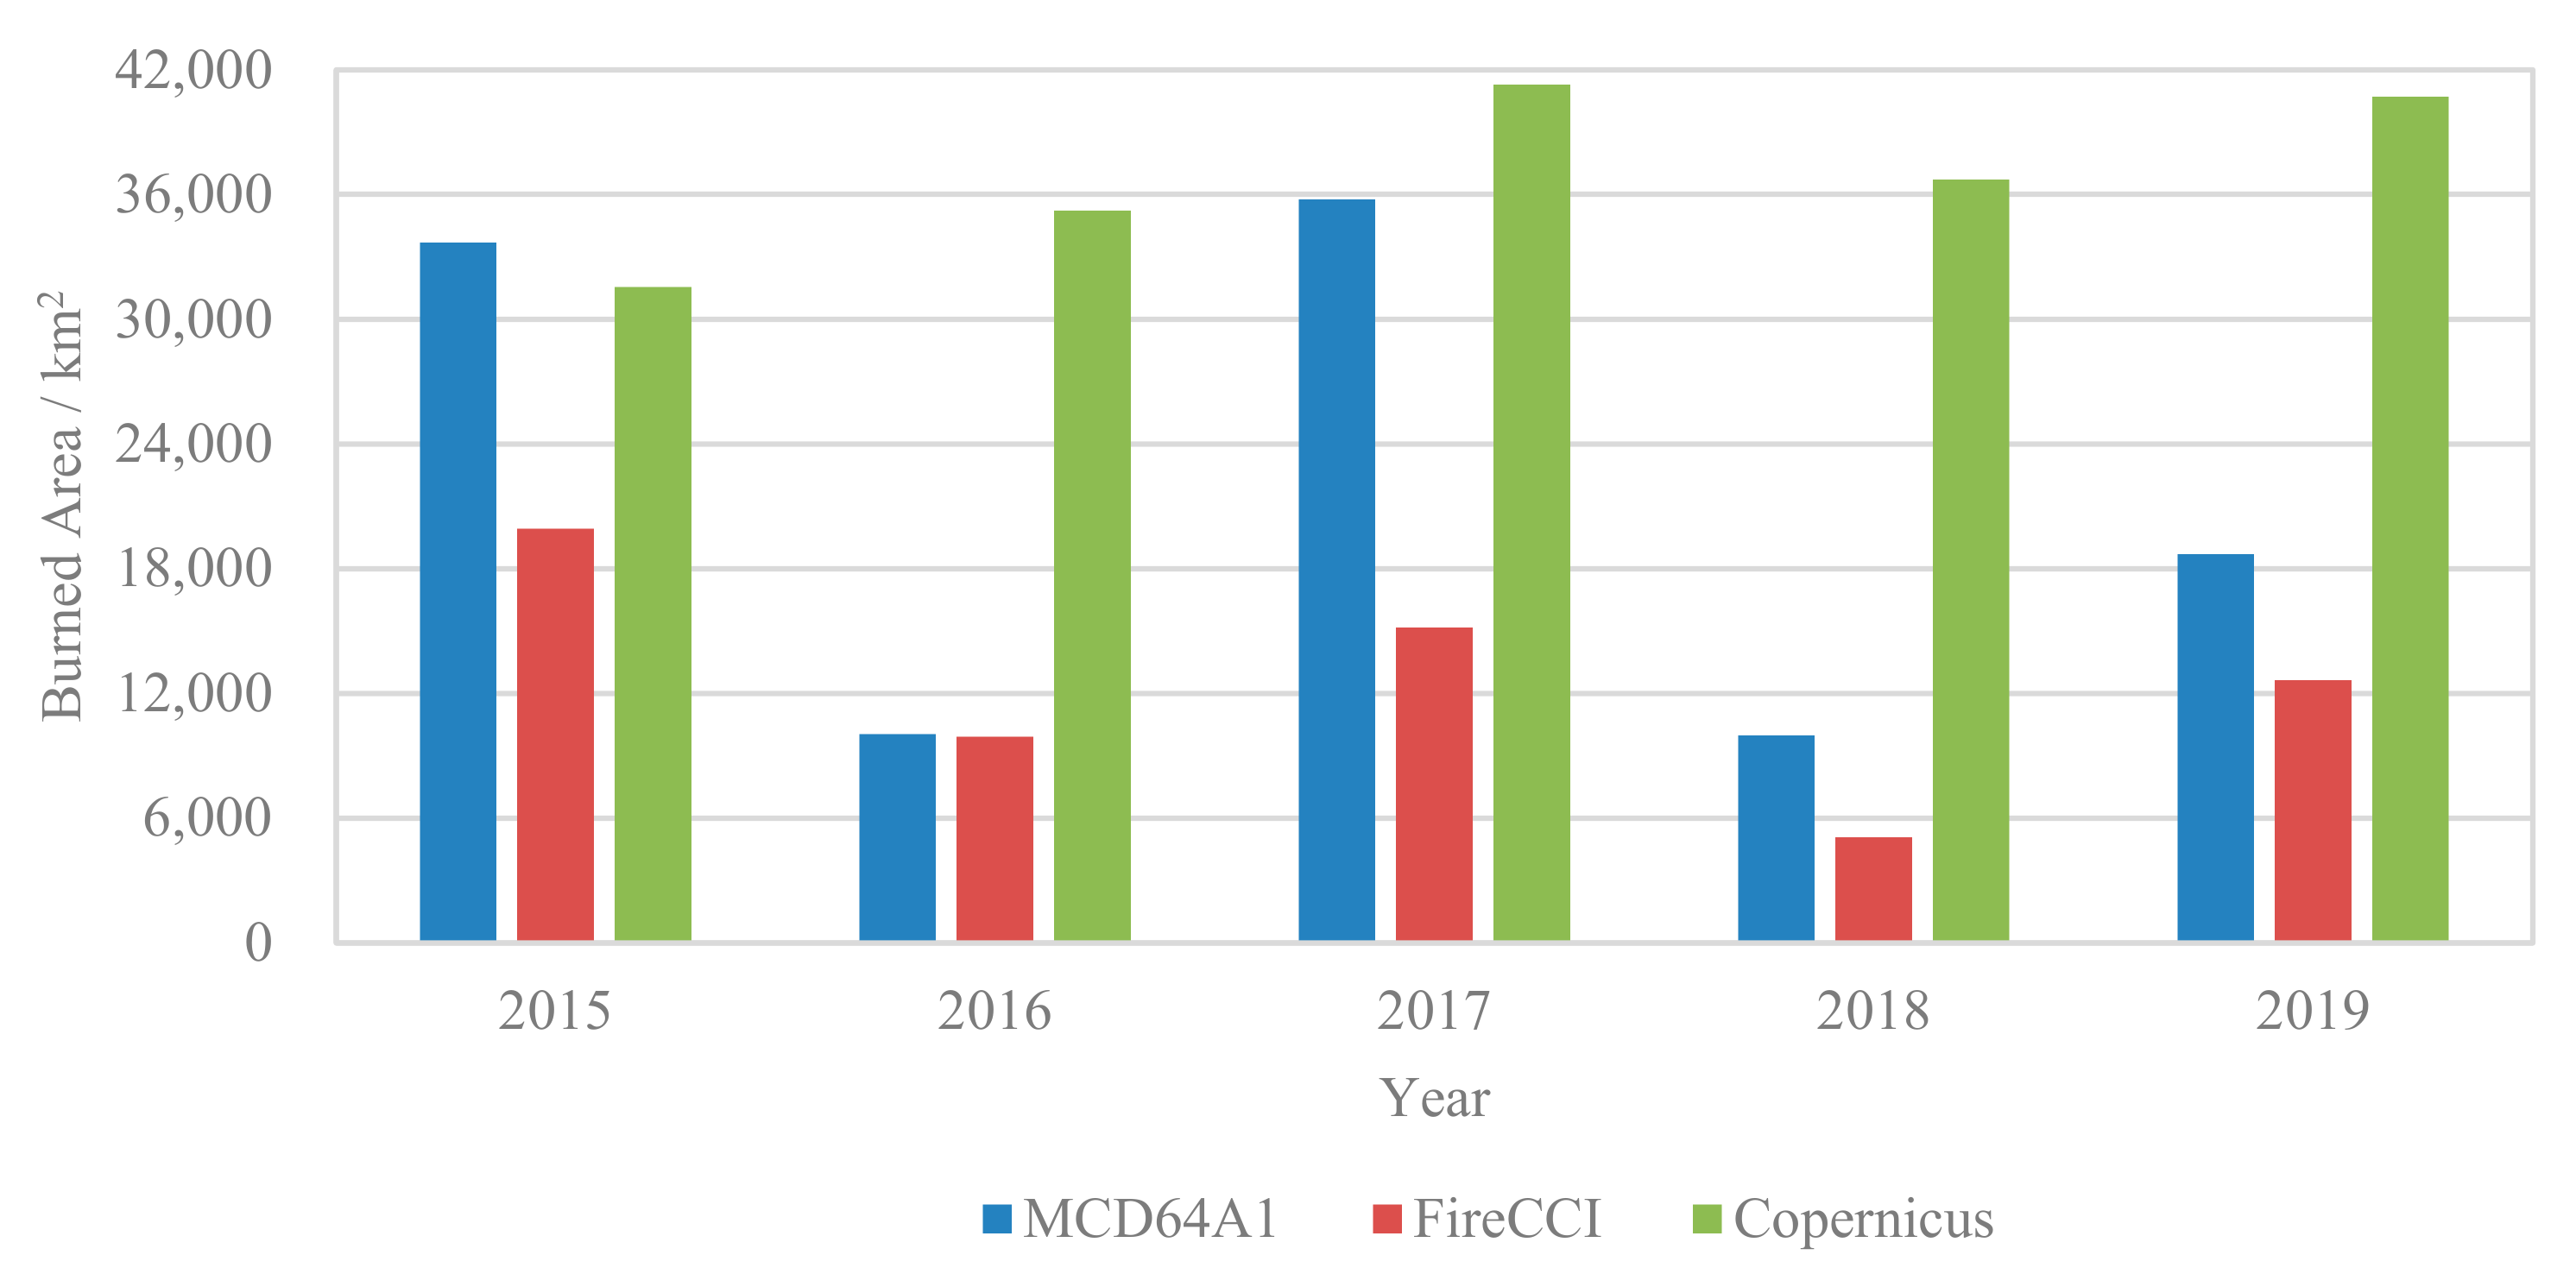
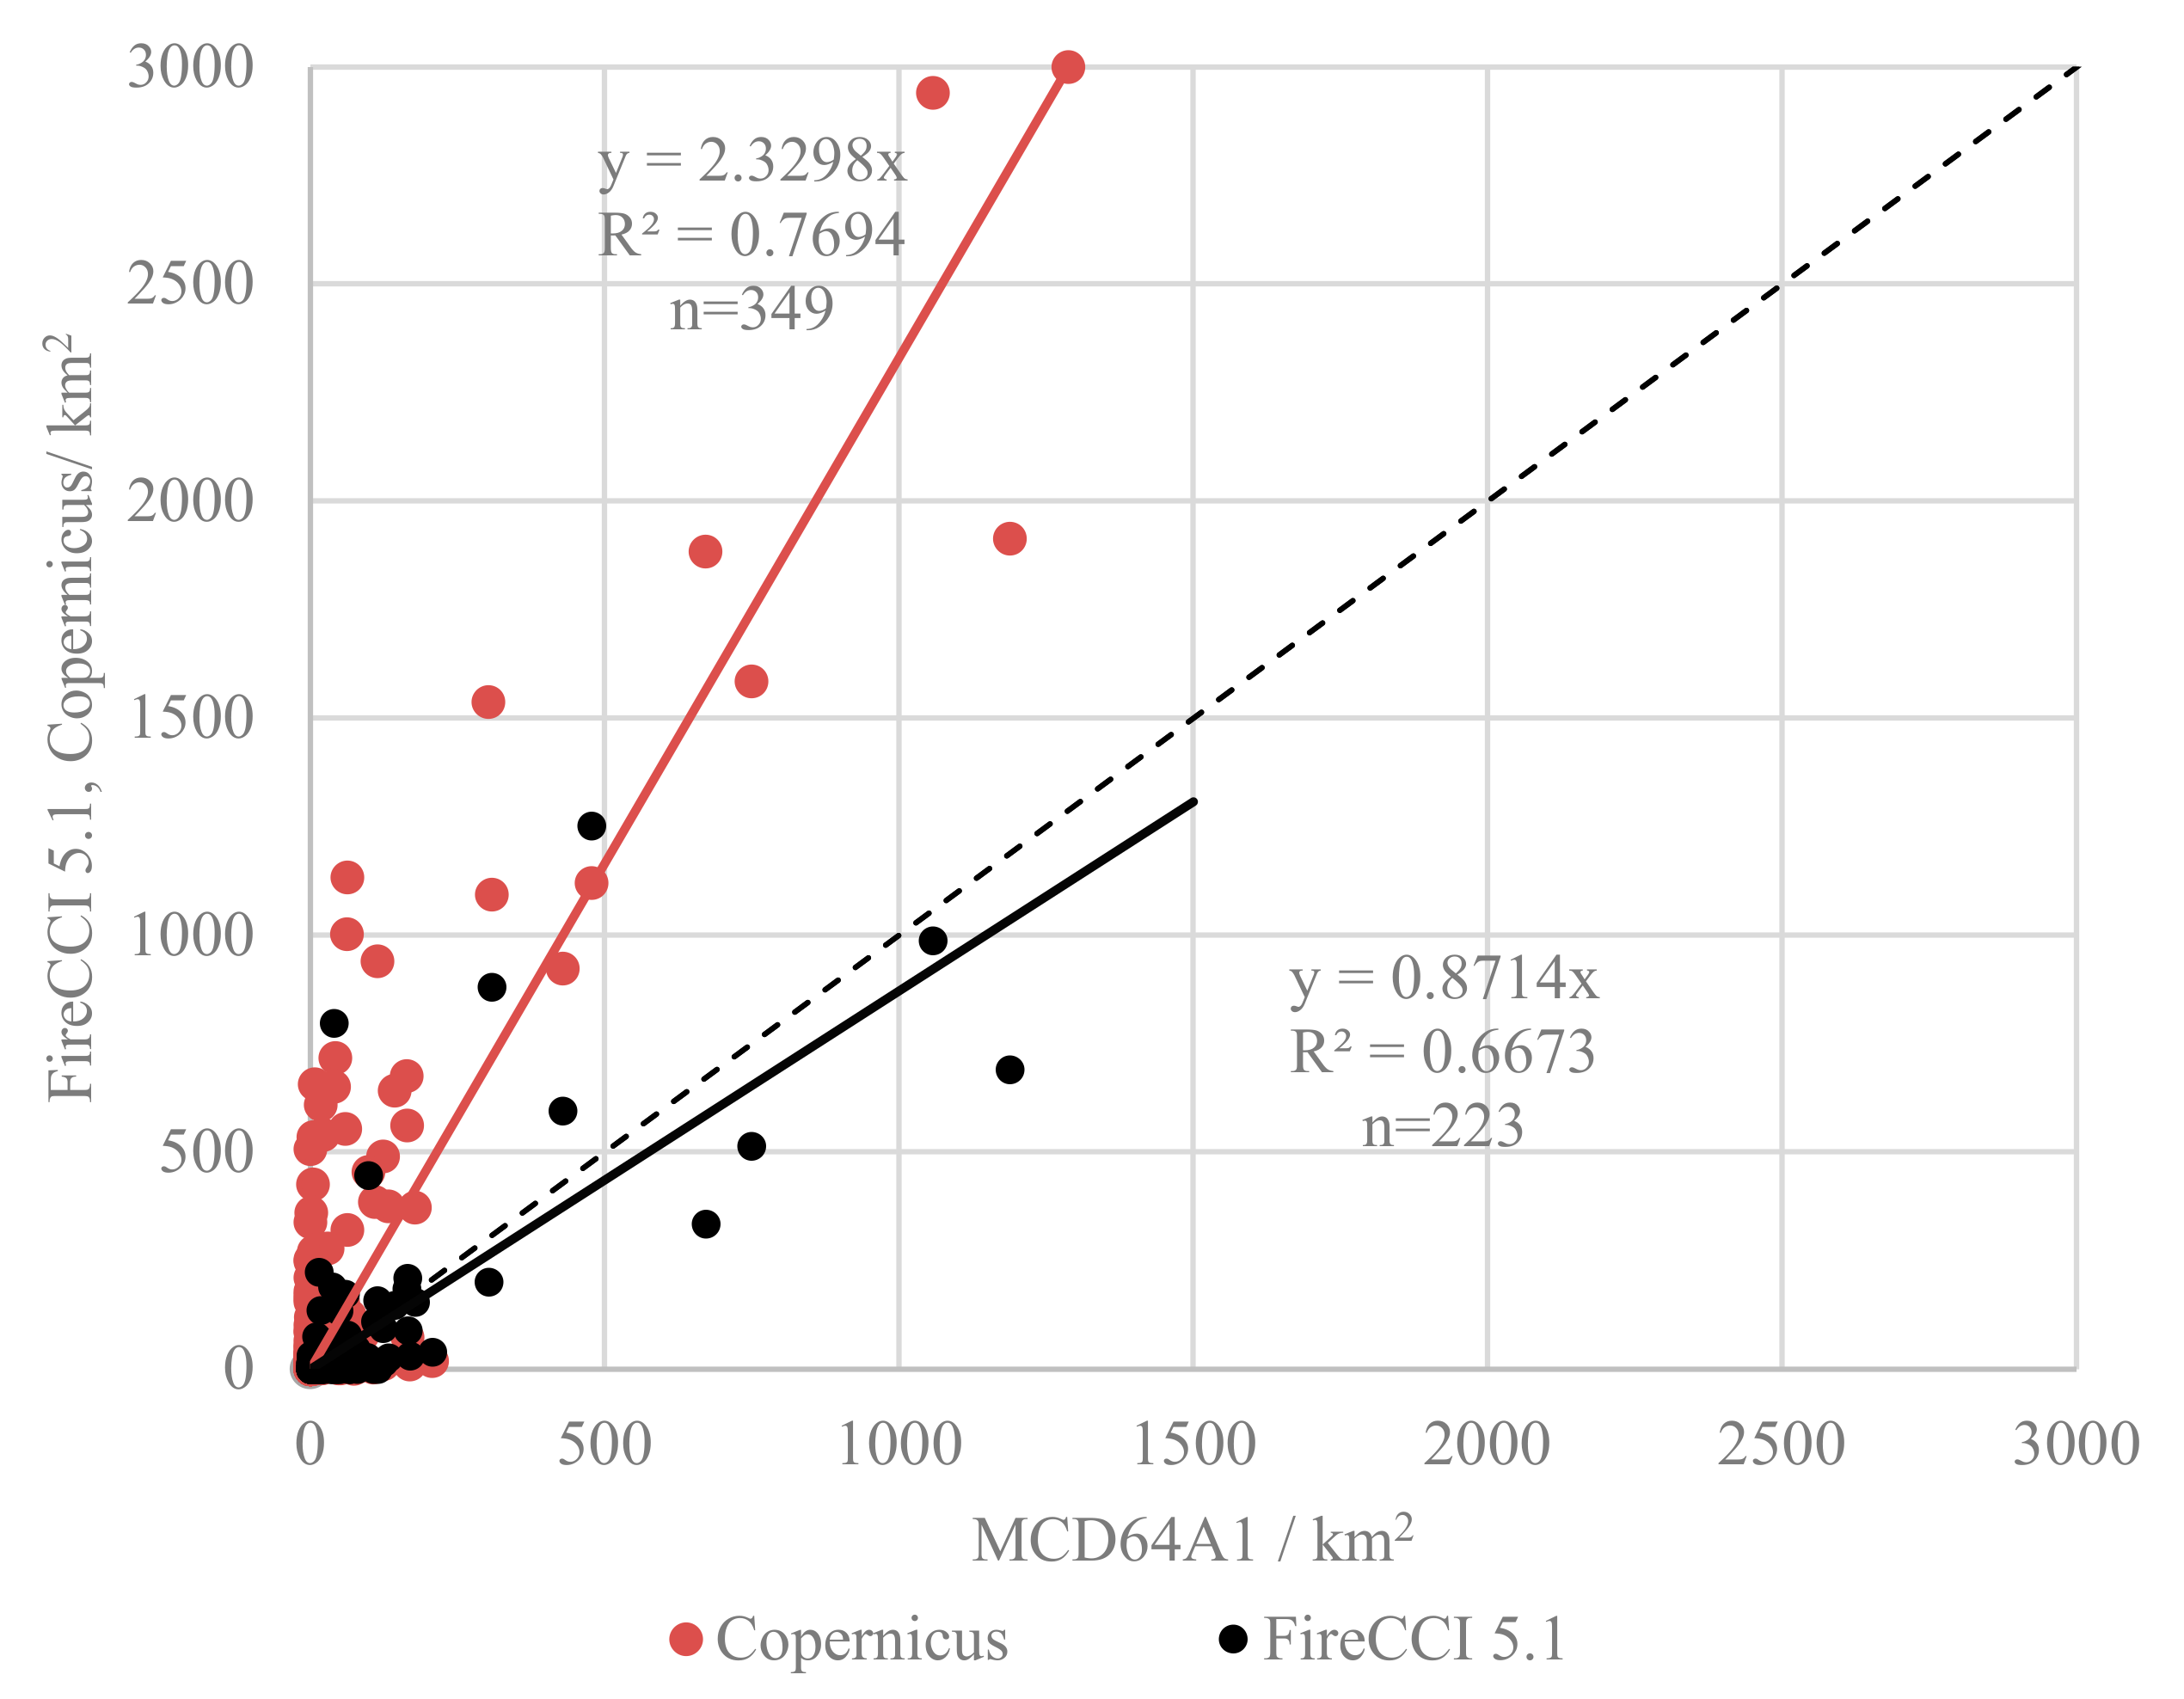
3.1. Total Burned Area

Annual total burned areas in cropland regions in China detected by each global burned area product are reported in Figure 2. Copernicus calculated total burned areas of 31,547.7, 35,223.21, 41,291.37, 36,709.47, and 40,703.76 km2 for the five years from 2015 to 2019, respectively. MCD64A1 calculated totals of 33,692, 10,041.75, 35,753, 9978.75, and 18,691.5 km2, respectively, for the same period. By contrast, FireCC 5.1 detected the lowest total burned areas, with 19,931, 9927.94, 15,161.06, 5076.94, and 12,643 km2 in each year of the study period, respectively. In general, Copernicus detected the largest annual totals, except with data for 2015, when the MCD64A1 product detected the largest. Overall, Copernicus detected the largest amount of burned area throughout the study period, exceeding the totals detected by MCD64A1 and FireCCI 5.1 by approximately 71.5% and 195.6%, respectively. These results are consistent with the study by Pessôa et al. [11], which assessed differences among burned area products in a forested region of the Amazon and reported that MCD64A1 detected a larger burned area than FireCCI 5.1, and that Copernicus detected a larger burned area in Asia than MCD64 did in 2019 [28]. Older versions of Copernicus and MCD64A1 (i.e., L3JRC and MCD45A1) gave the same results, whereby MCD45A1 burned areas were relatively larger than areas calculated using L3JRC [4]. However, in a global study that did not distinguish land cover type [1], results showed that Copernicus detected the smallest total burned area when compared to MCD64A1 and FireCCI 5.1, which shows the opposite pattern to our results.
The biggest discrepancy between MCD64A1 and FireCCI 5.1 occurred in data for 2017, where the former product detected 20,591.94 km2 more burned area than the latter, while the least burned area difference between these two products occurred in 2016 data, where the former product detected 113.81 km2 more burned area than the latter. When MCD64A1 and Copernicus are compared, the greatest difference in burned area also occurred in 2019, with a disparity of 77,318.51 km2, while the smallest difference in burned area occurred in 2015, where MCD64A1 detected 2144.3 km2 more than Copernicus.

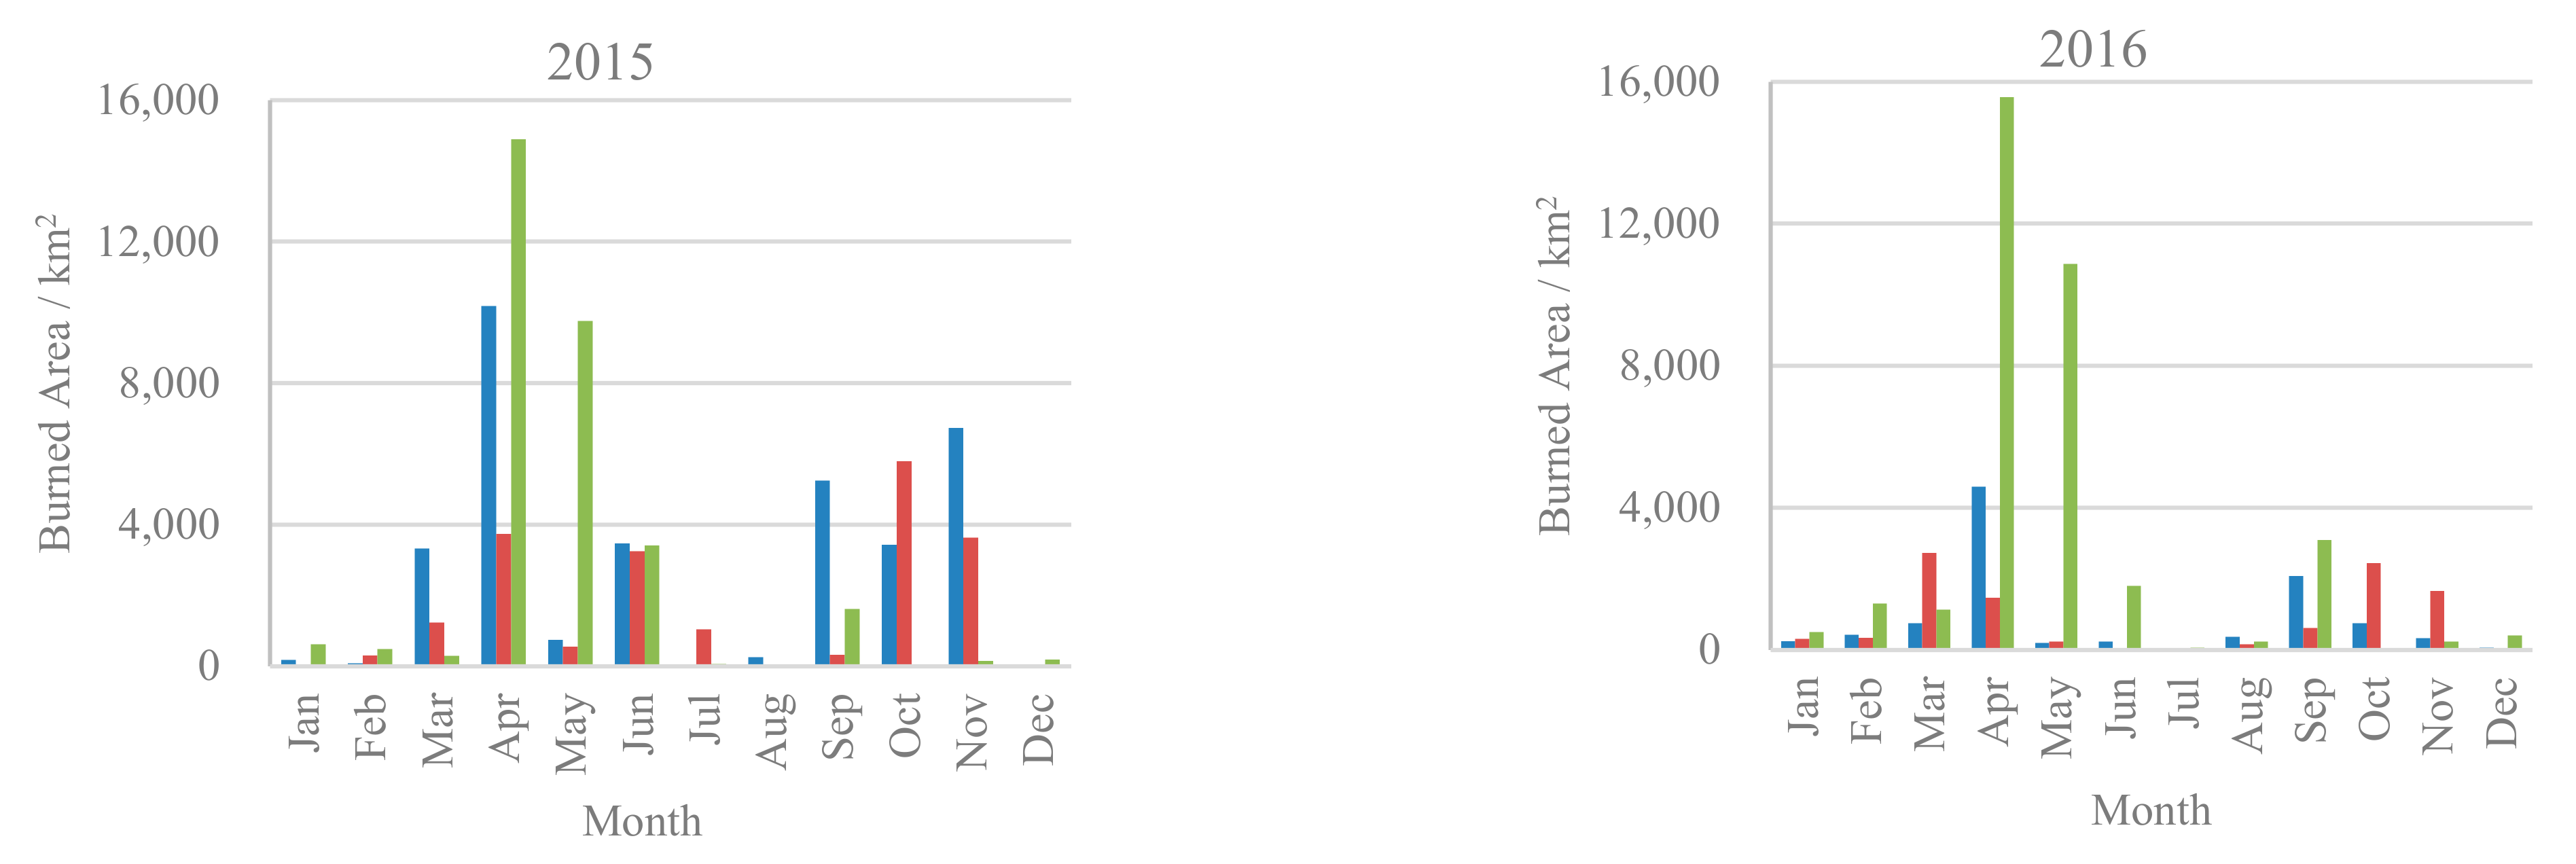
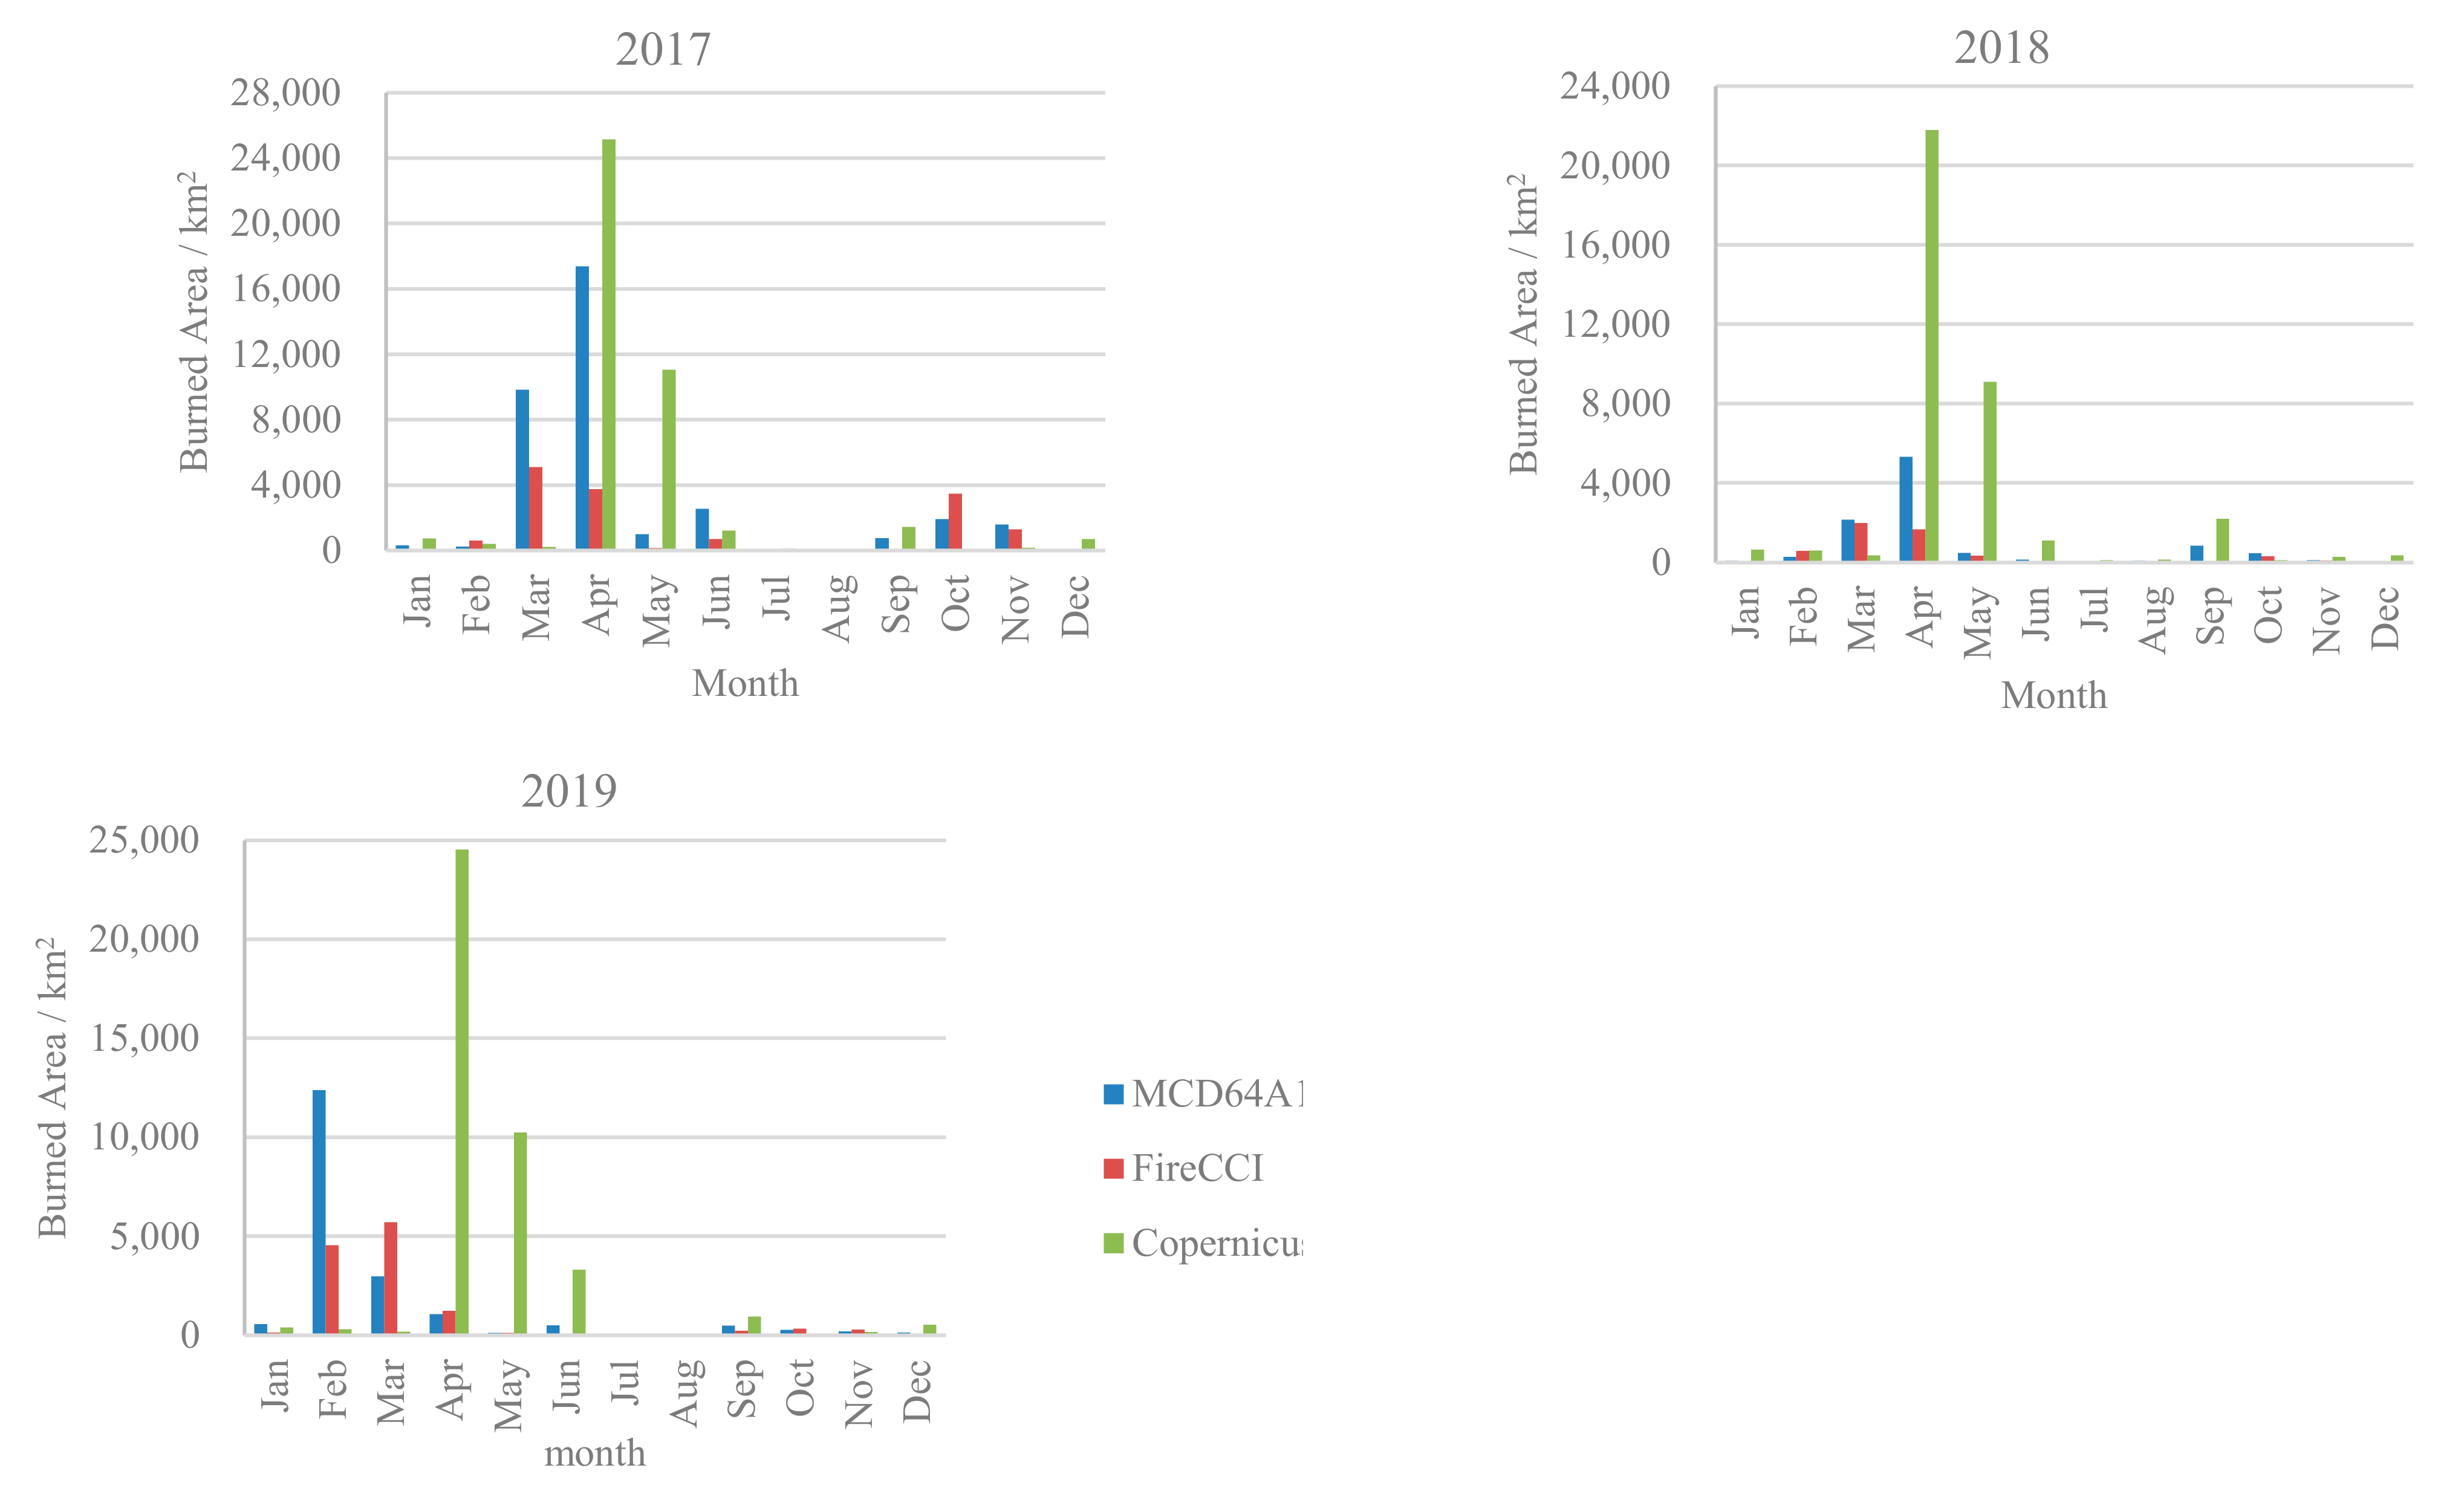
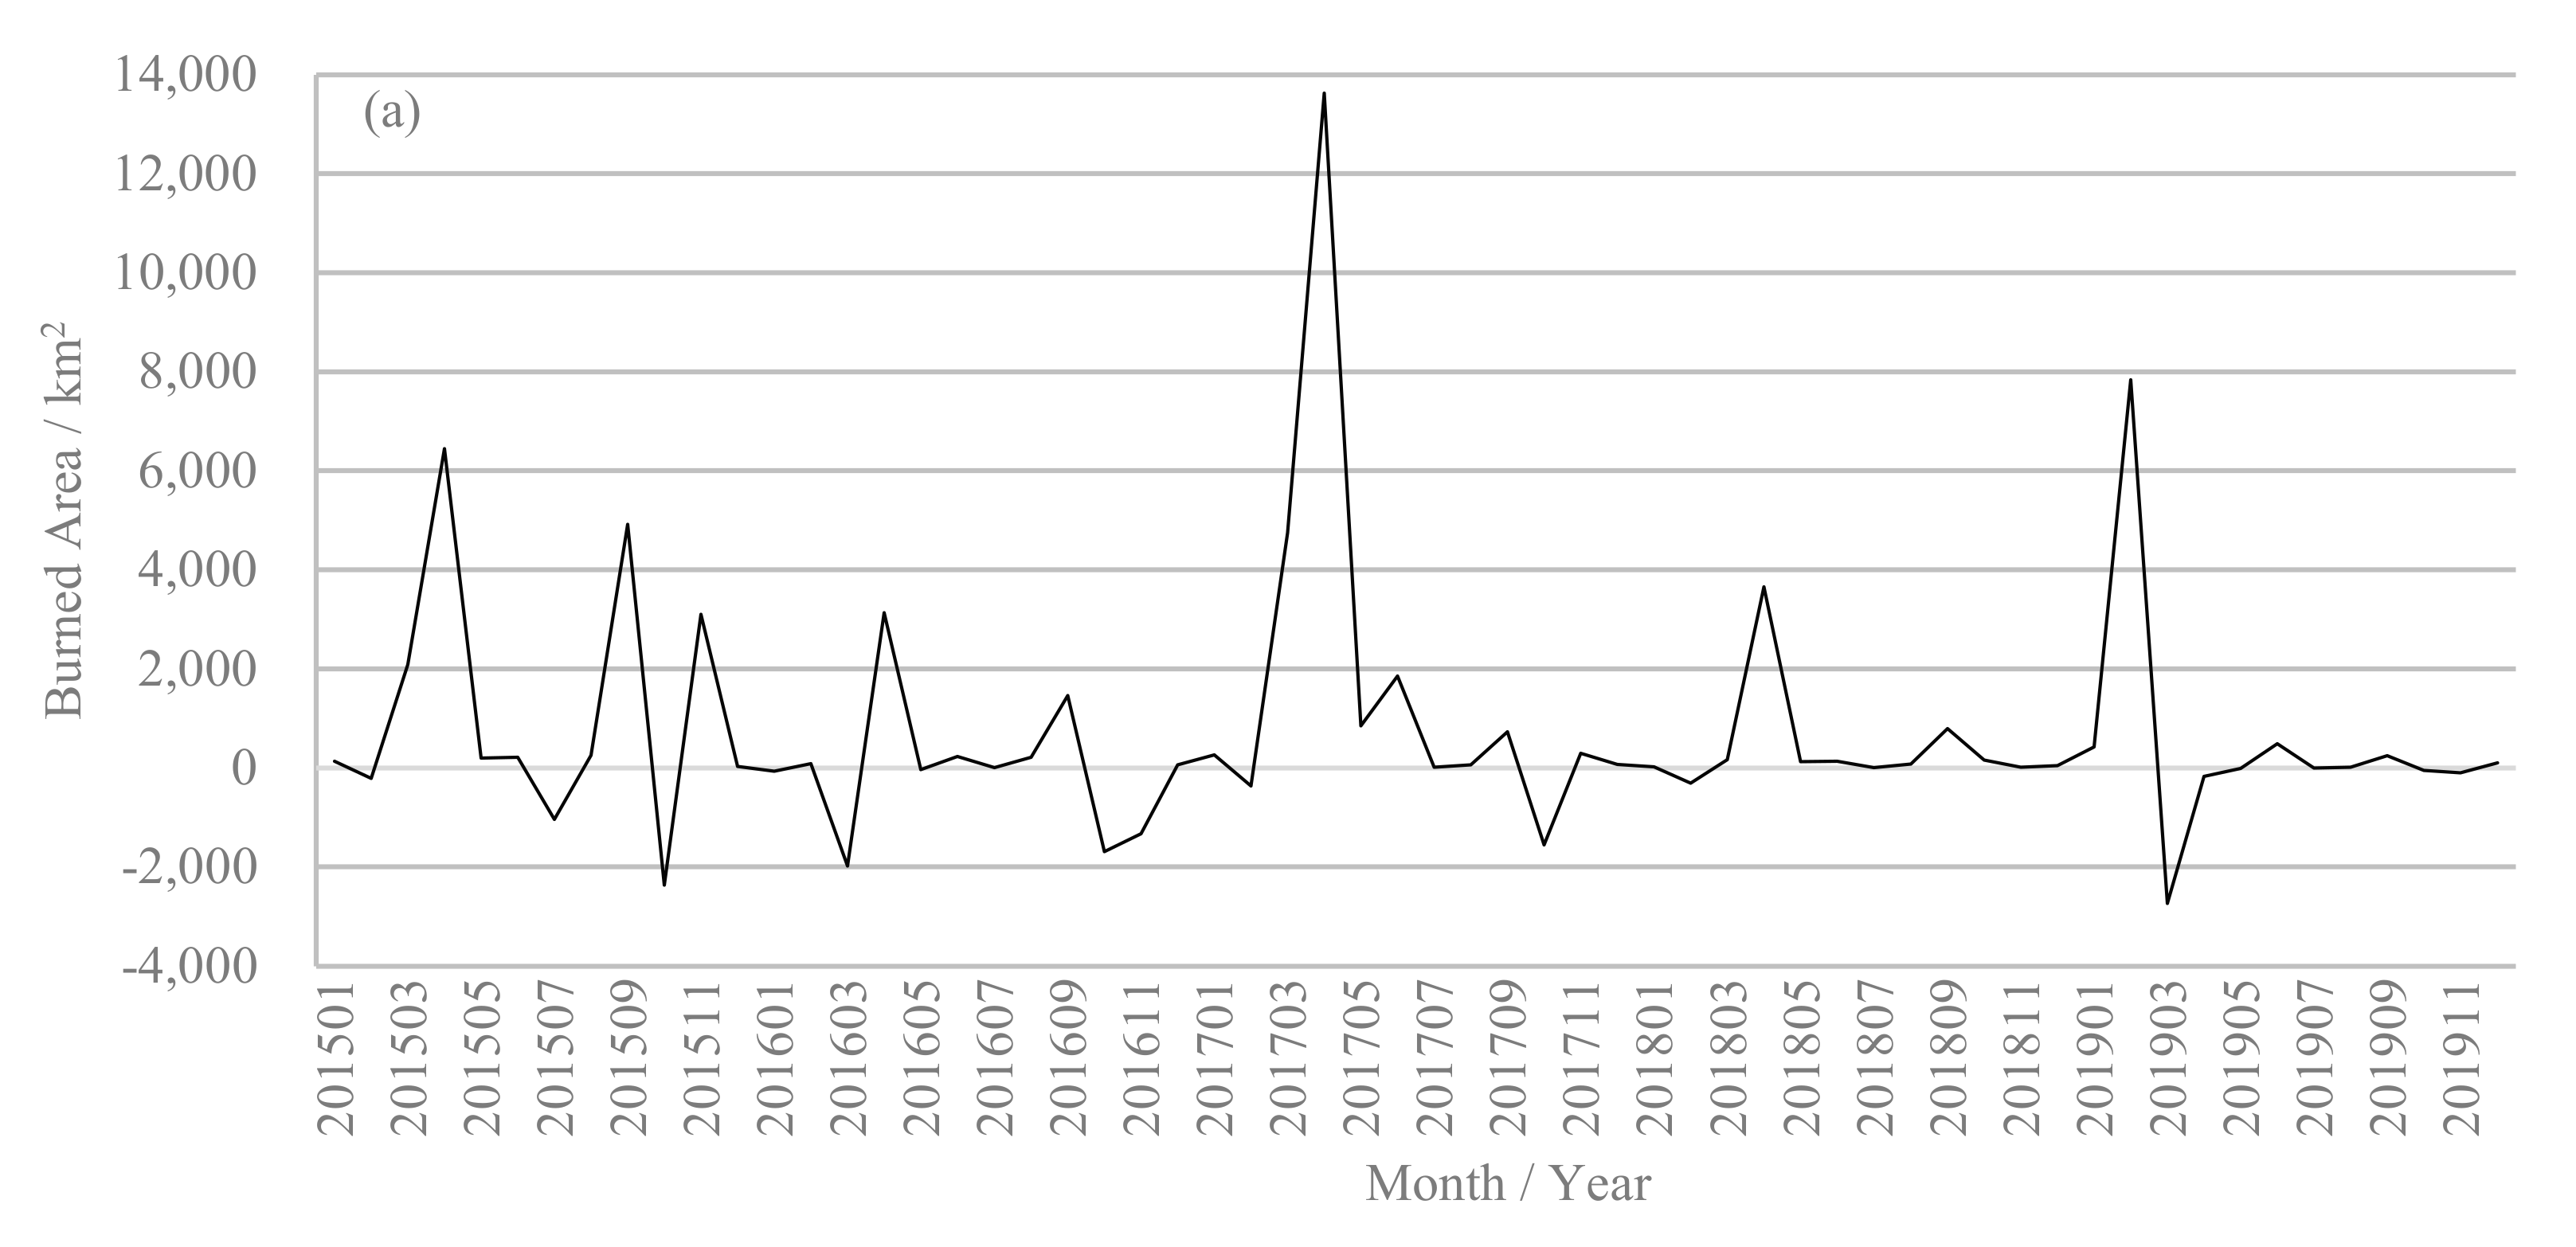
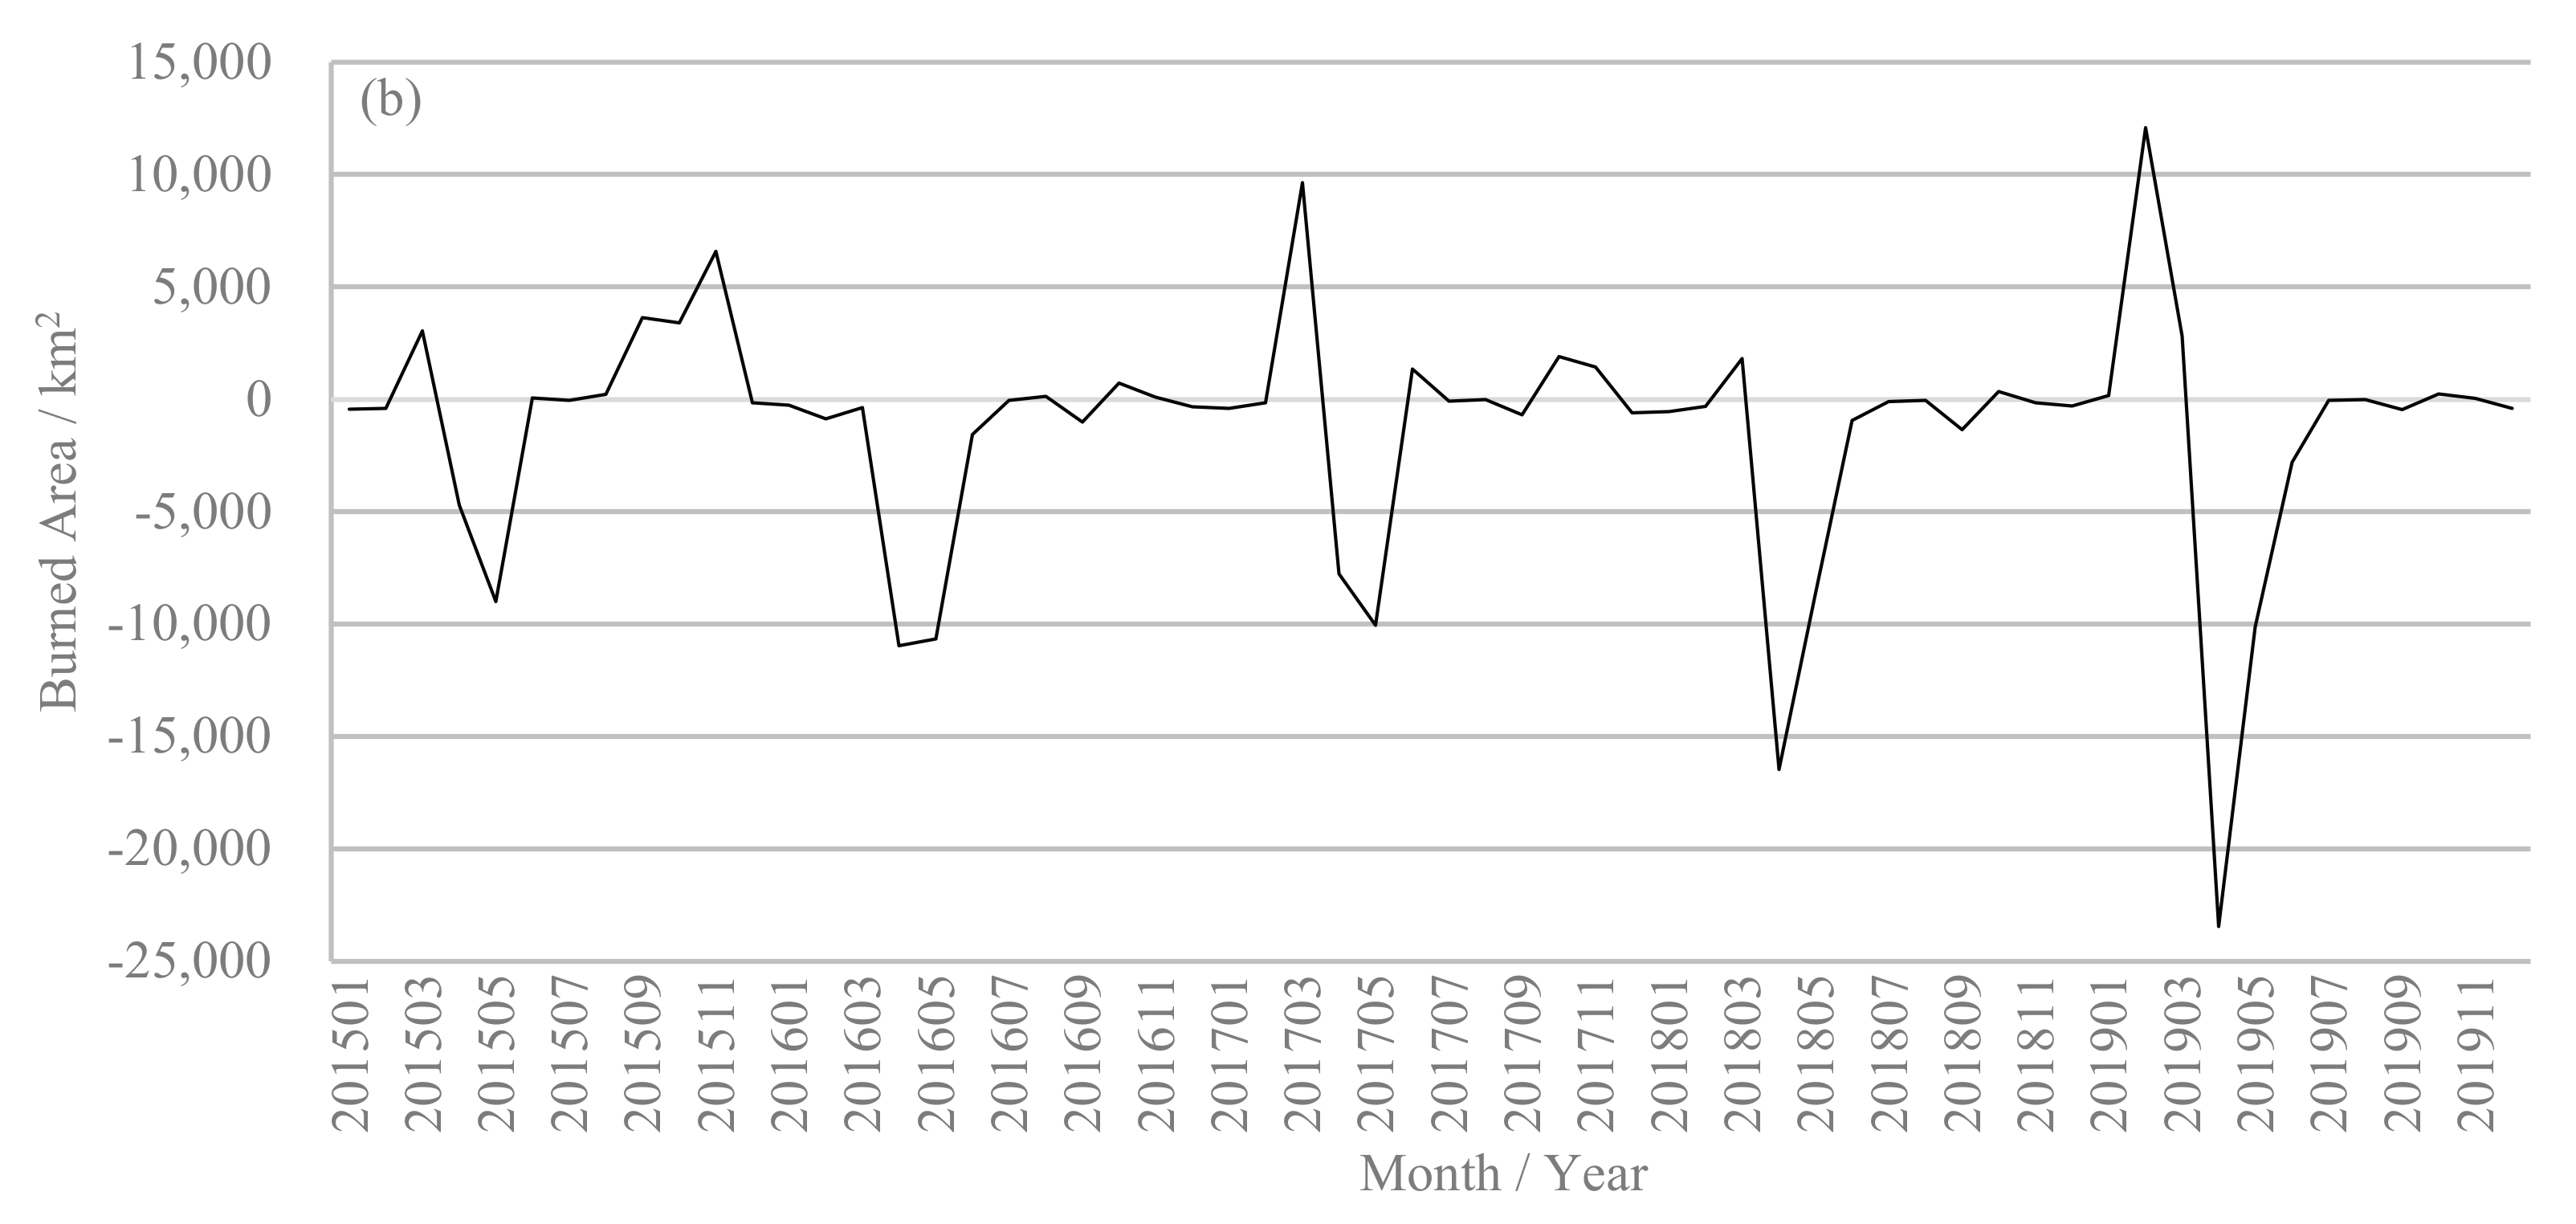
3.2. Temporal Comparison

Figure 3 presents the interannual and monthly variations of cropland burned areas detected by MCD64A1, FireCCI 5.1, and Copernicus. The Copernicus results showed a persistent burning pattern from 2015 to 2019, with burned area peaks in April and September each year. Larger April peaks in the Copernicus data reflect cropland burning in Northeast China, while the September peak is related to burning in the North China Plain. Curves showing MCD64A1 and FireCCI 5.1 data show stronger fluctuations than those of Copernicus, they have significant interannual variability, and their peak values are lower than those of Copernicus. There is a significant discrepancy between all three products during the burning season. During the Northeast China burning season (March to April), Copernicus detected more burned areas than MCD64A1 and FireCCI 5.1, while in the North Plain China burning season (September to October), the burned areas identified by these three products are comparable in size.
Figure 4 shows the correlation between burned areas detected by FireCCI 5.1, Copernicus, and MCD64A1 from 2015 to 2019. The linear regression equation and the coefficient of determination (R2) are reported. The slope of the regression line for FireCCI 5.1 and MCD64A1 is 0.3849 and the R2 is 0.4178, indicating that FireCCI 5.1 compares well with MCD64A1, with relatively little underestimation. However, the correlation between Copernicus and MCD64A1 burned areas is poorer (R2 = 0.151) and has a slight bias (slope = 1.0295), showing that the relationship between these two products is not significant and that the former makes an overestimation compared with the latter. It is notable that there are few anomalous points that lie away from the regression line between FireCCI 5.1 and MCD64A1, although many points lie away from the regression line between Copernicus and MCD64A1. This indicates that the consistency between Copernicus and MCD64A1 monthly burned data is low. Furthermore, as the values of these abnormal points are very high, an analyst must be very cautious when using these data to estimate fire-related emissions.
To further illustrate the variation in monthly burned area detected by all three products, absolute differences were determined by subtracting FireCCI 5.1 data from MCD64A1 data, and subtracting Copernicus data from MCD64A1 data, and their temporal variation patterns were plotted (Figure 5).
According to Figure 5, burned area differences determined between FireCCI 5.1 and MCD64A1, and between Copernicus and MCD64A1 have very different temporal patterns. The peak values of difference changes between FireCCI 5.1 and MCD64A1 are irregular and show a degree of randomness; however, the peak values of negative differences between Copernicus and MCD64A1 systematically appear in May in every year of the study period, and positive peak values appear in March in every year. The negative peaks in May can be explained by the summer fire season in the North China Plain, while the positive peaks in March can be explained by the spring fire season in Northeast China. The largest difference of monthly burned area between MCD64A1 and FireCCI 5.1 occurred in April 2017, with the former product detecting 13,624.56 km2 more burned area than the latter, while the smallest difference occurred in July 2019, with only 0.375 km2 less burned area detected by former than the latter. For Copernicus and MCD64A1, the maximum difference was in April 2019, with the former detecting 23,454.02 km2 more than the latter, and the minimum difference was in August 2017, with the latter detecting 8.06 km2 less than the former.

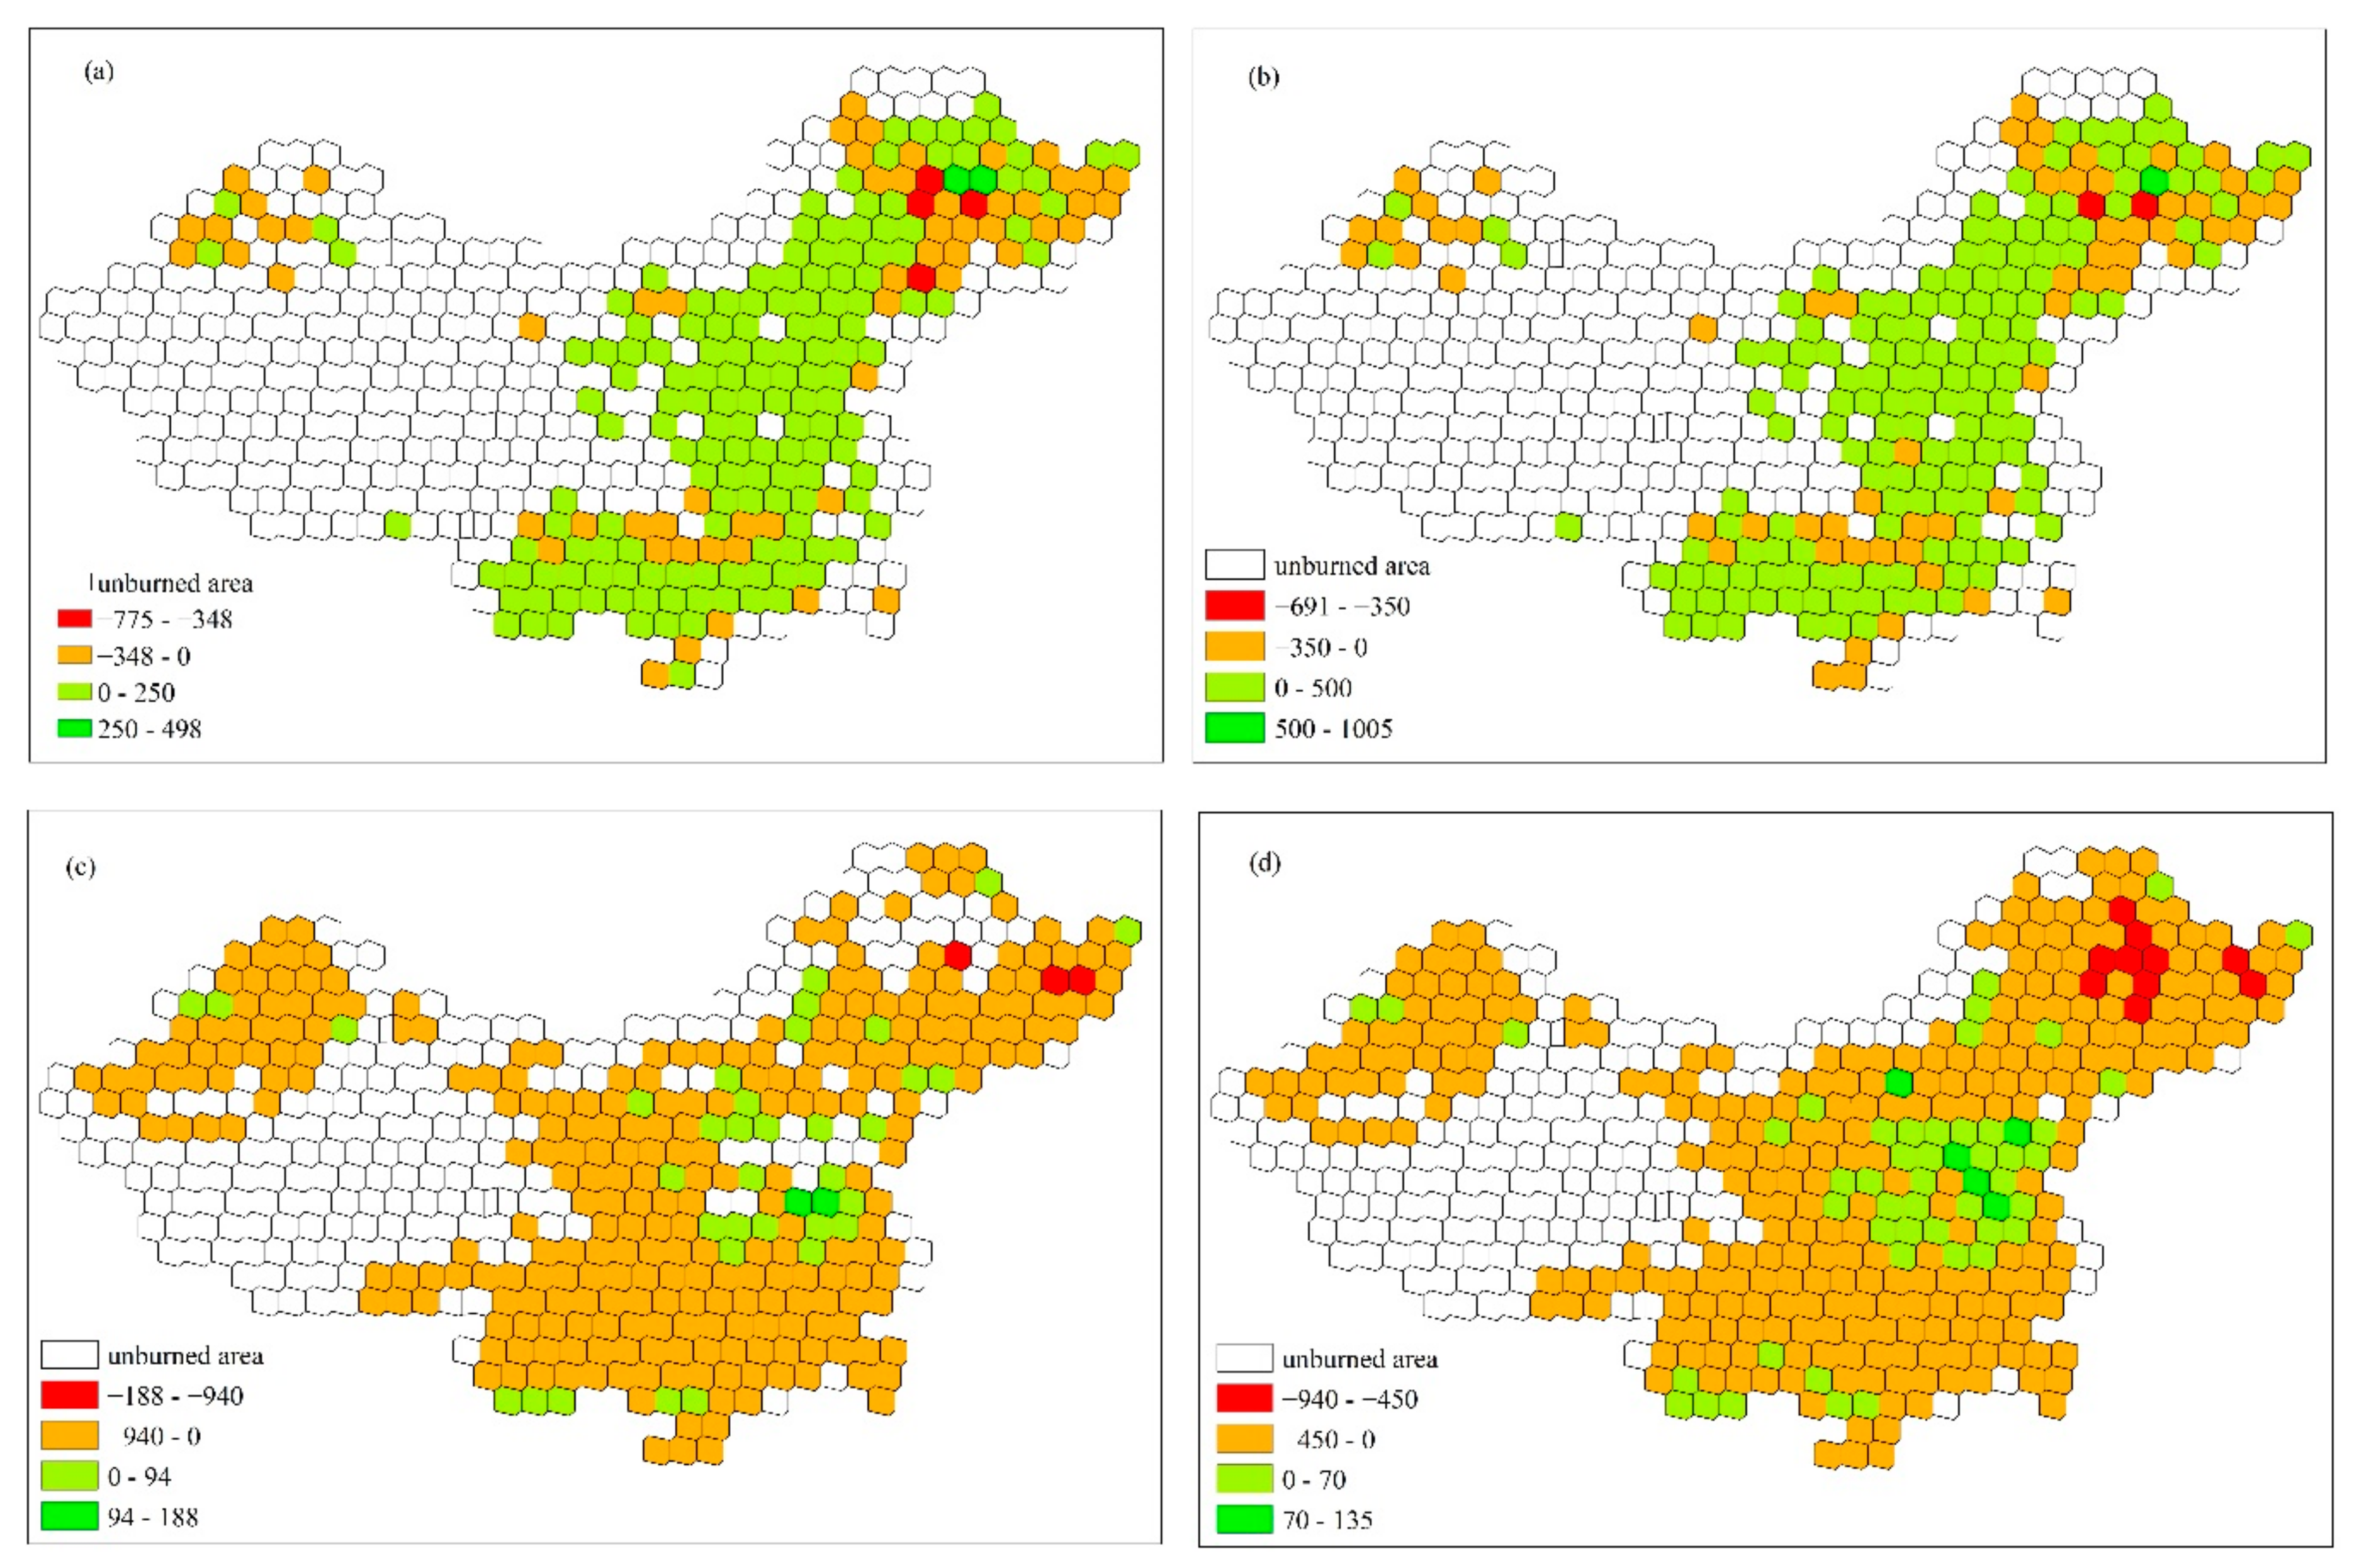
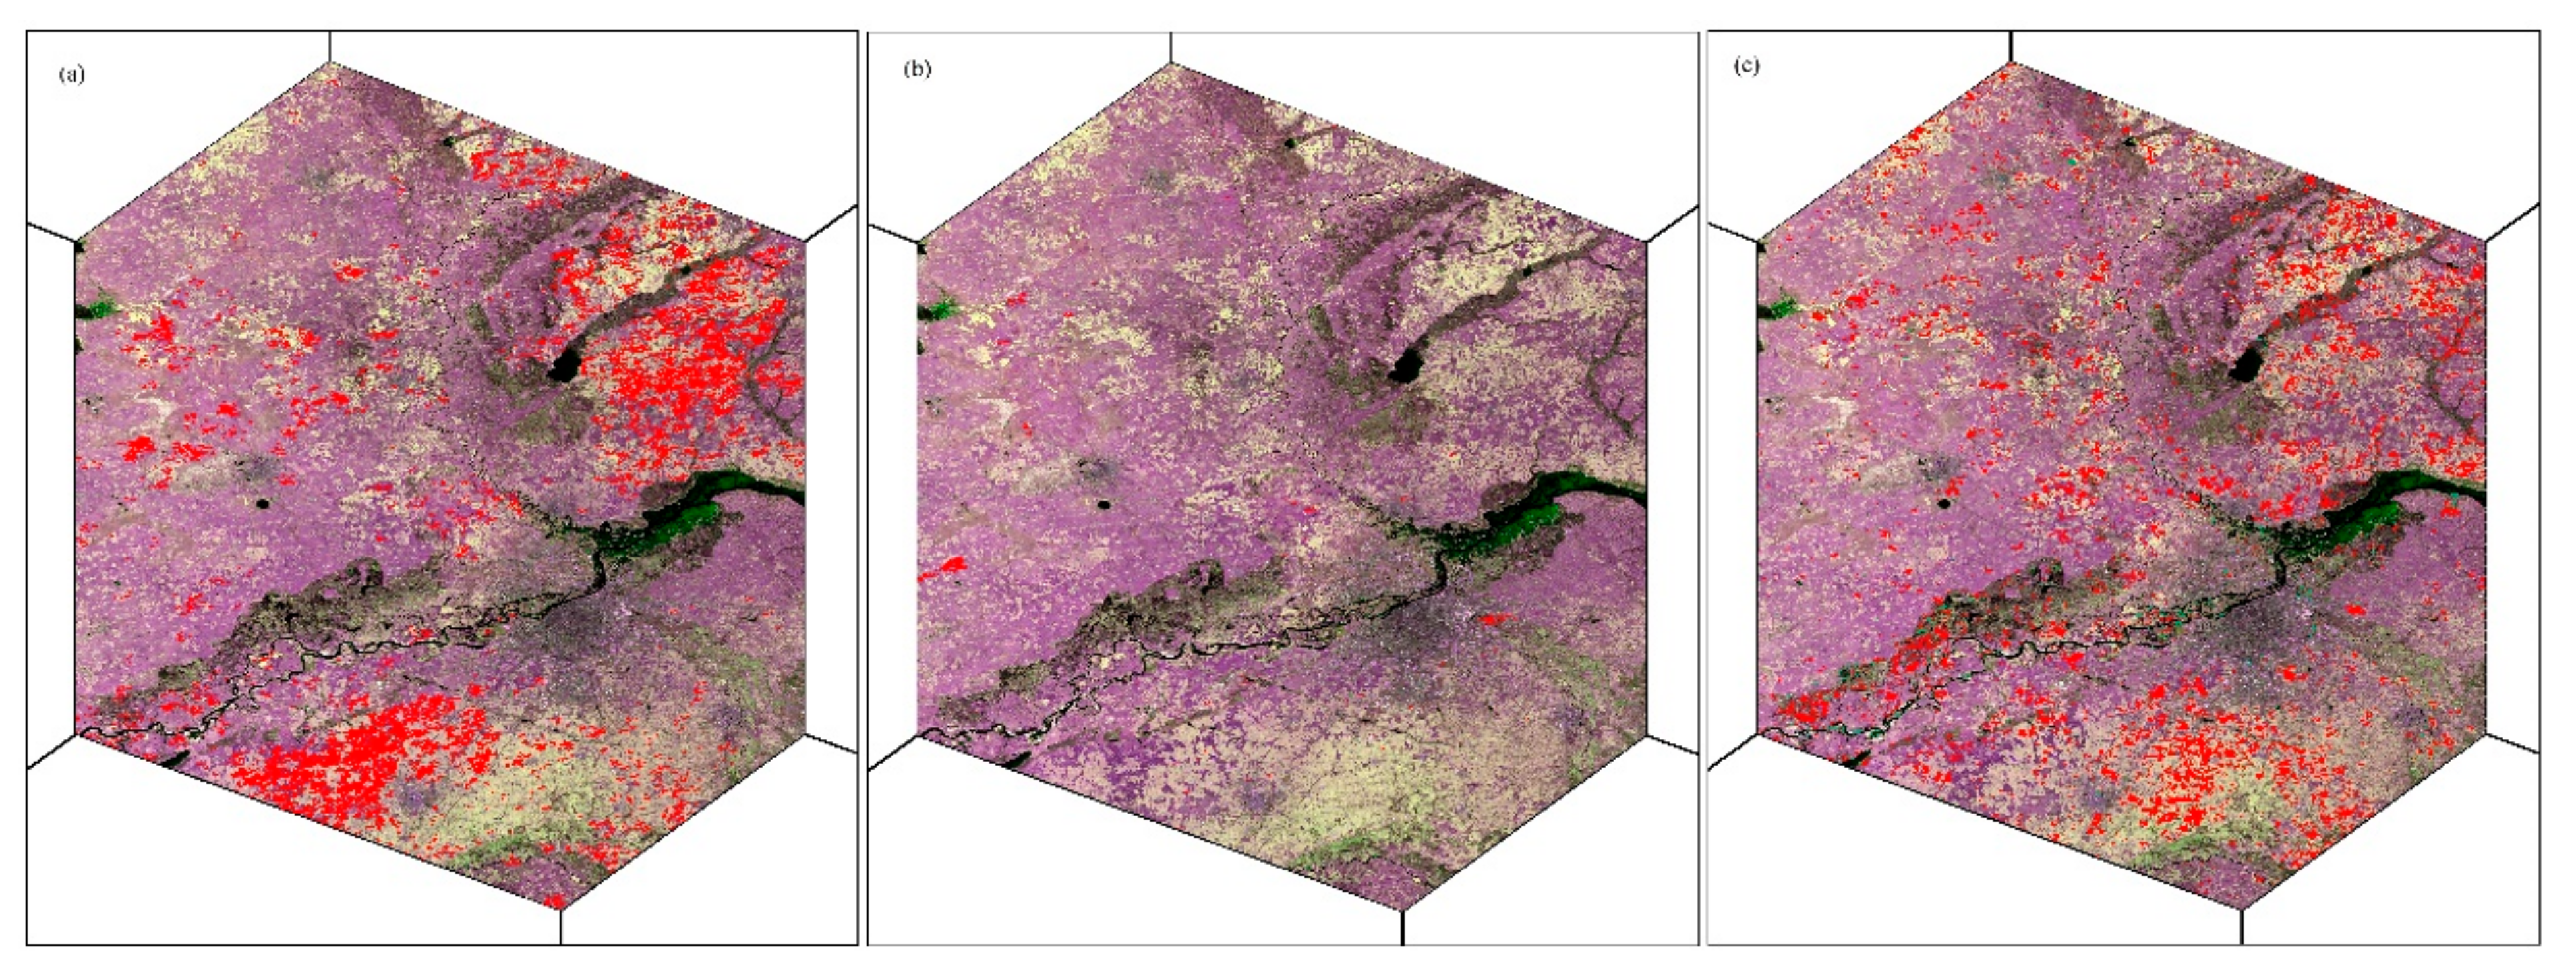
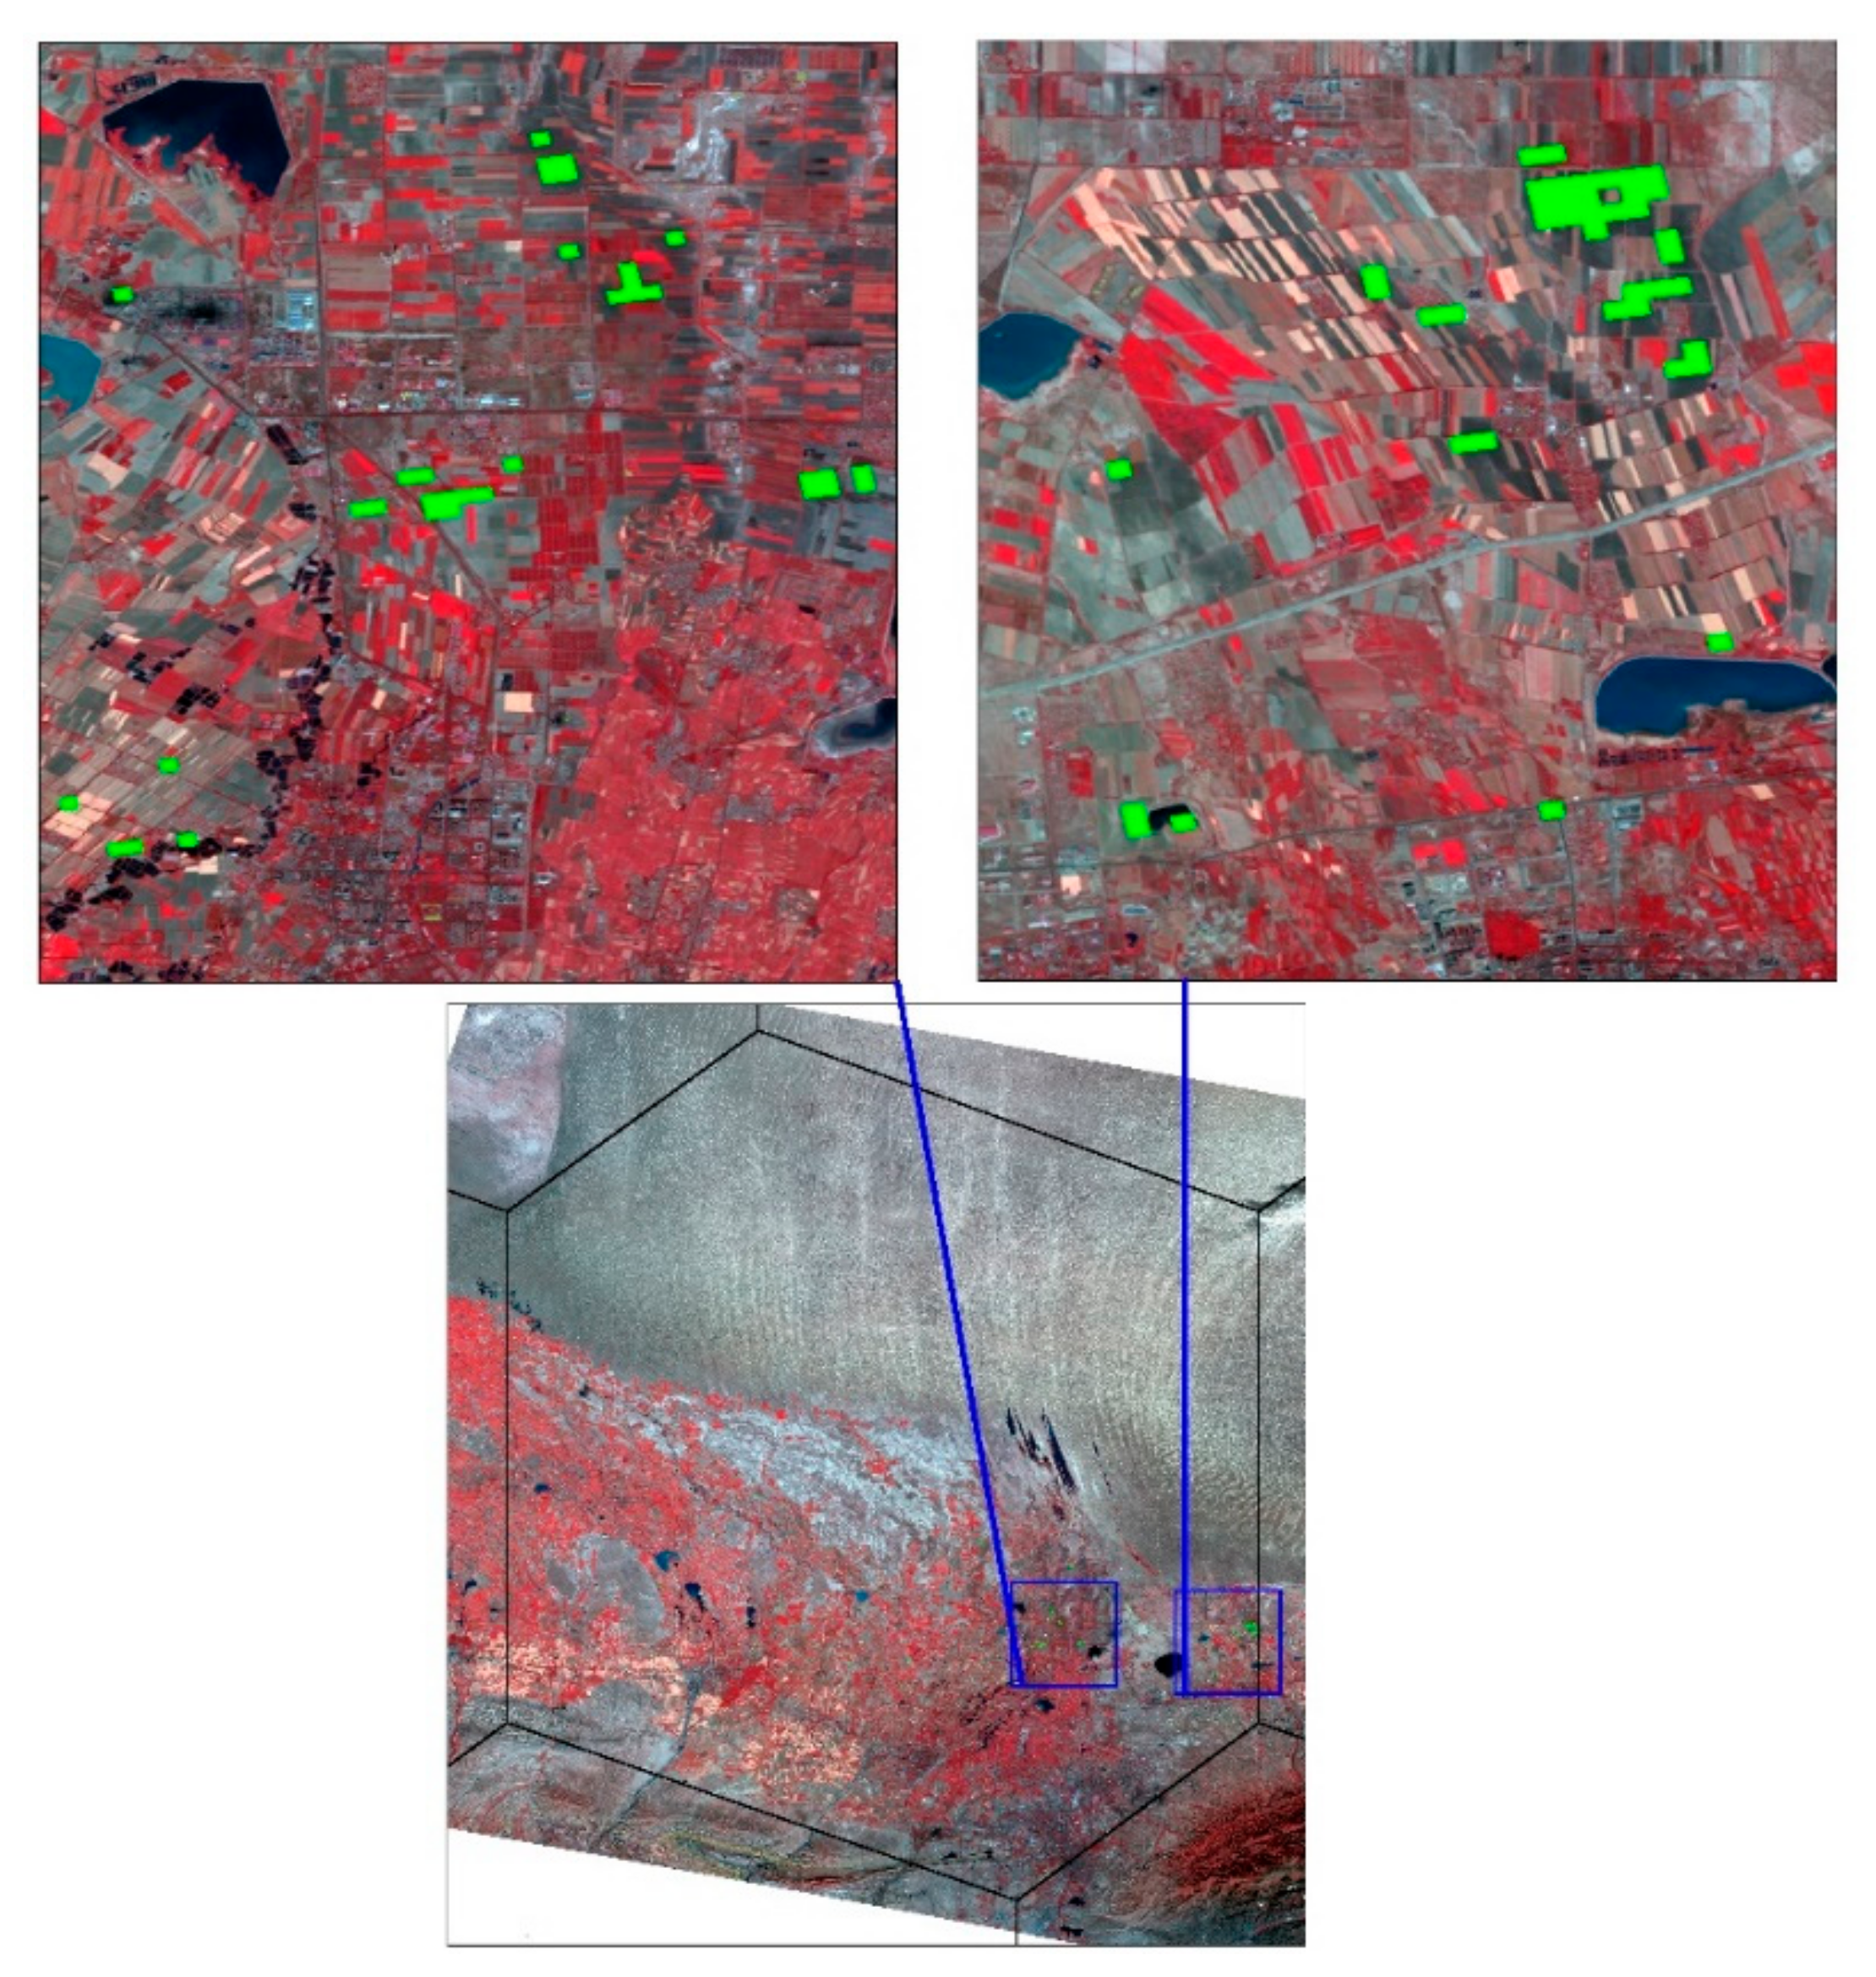
3.3. Spatial Comparison

Spatial comparison involved considering each TSA as a unit and calculating the difference between their burned areas, as determined by FireCCI 5.1, Copernicus, and MCD64A1. These TSA spatial distribution patterns show the same characteristics from 2015 to 2019; as such, only the magnitude of the differences determined for 2016 are shown in Figure 6. Further, Figure 7 shows the results of taking each TSA as a sample, plotting burned area scatter plots between FireCCI 5.1, Copernicus, and MCD64A1 in the same year, and fitting a linear regression to the data.
Figure 6 shows that FireCCI 5.1 and MCD64A1 had a difference in the number of TSAs that experienced cropland burning of 222, while Copernicus and MCD64A1 had a difference of 349, indicating that Copernicus detected a larger spatial range of cropland burned areas than MCD64A1 and FireCCI 5.1. The spatial consistency region among these three products are mainly distributed in the central and Southern China, where the farmland are often small and crop residues burning phenomenon is unusual since agricultural burning is banned in China. Therefore, the three products gave near-unanimous result with little discrepancy. The extra TSAs detected by Copernicus mainly occur in Western China, namely in the Xinjiang region. The largest differences for annual total amount and maximum monthly amount were both located in Northeast China and the North China Plain, which are also the regions with the highest concentration of crops in China. This spatial distribution feature is exacerbated in MCD64A1 and Copernicus data. The positive and passive differences between Copernicus and MCD64A1 data mainly occur in the North China Plain and Northeast China, while the largest difference between MCD64A1 and FireCCI 5.1 mainly occurs in Northeast China, and has both positive and passive extreme differences.
A regression line between FireCCI 5.1 and MCD64A1 (Figure 7) has a slope of 0.8714 and R2 value of 0.6673, indicating that FireCCI 5.1 and MCD64A1 are closely comparable, and that there is no significant underestimation in each TSA. This result is consistent with the results in Figure 4 that show changes through time, meaning that burned area calculations derived by FireCCI 5.1 and MCD64A1 are similar at both spatial and temporal scales. One reason for these similarities between MCD64A1 and FireCCI 5.1 may be that they are both MODIS-based products. However, the correlation between Copernicus and MCD64A1 burned areas is less clear (R2 = 0.7694) and has a slight bias (slope = 2.3298), showing that the relationship between Copernicus and MCD64A1 is significant and the former makes overestimations compared with the latter. This result is very different from that shown in Figure 4, such that the discrepancy between Copernicus and MCD64A1 is more significant at the spatial scale than at the temporal scale. Thus, it is essential for users to understand these characteristics in order to make informed choices of which product is most appropriate for their intended spatial analysis and comparison.
Notably, there are several outliers that deviate far away from the regression line between FireCCI 5.1 and MCD64A1, meaning that there were some analyzed areas where the results obtained by these two products were very different. However, there are fewer outliers situated away from the regression line between Copernicus and MCD64A1; therefore, although the difference between these two products is large, the calculated values have the same spatial characteristics. The results shown in Figure 7 are opposite to the results shown in Figure 4, revealing that differences between FireCCI 5.1, Copernicus, and MCD64A1 are inconsistent in both space and time. In summary, when choosing a burned area product for analyzing fire emission studies and ecosystem management, the user must consider whether to focus on a spatial or a temporal characteristic.
Figure 7 also shows that some of the outliers situated away from the best-fit curve represent the largest differences in burned area detected between FireCCI 5.1, Copernicus, and MCD64A1. To investigate this, we selected the TSAs that represent areas of MCD64A1 larger than 25.0 km2 (Figure 7) and those that represent areas of Copernicus larger than 80.0 km2 (Figure 7). As these TSAs are all located in the Songnen Plain and Sanjiang Plain in Northeast China, we analyzed the similarities and differences of cropland burned areas detected by all three products by choosing a single TSA that has Landsat images coverage of both regions.
Figure 8 and Figure 9 illustrate the differences among product in two representative sample TSAs. The TSA shown in Figure 8 is located in Songnen Plain, where spring burning season is from March to April. The TSA shown in Figure 9 is located in Xinjiang Province, and shows evidence of a long fire season by the occurrence of small and fragmented scars.
As shown in Figure 8, the burned area presented by three products are shown in red patchs, which means the burned area products have been filtered to only show the burning before April 2nd. All three products underestimate the burned area and have frequent omission errors, with the FireCCI 5.1 product having the most. Meanwhile, commission errors are common; for example, the bottom parts of each image show large areas of non-burning cropland, although both MCD64A1 and Copernicus products identify these as burned areas.
As shown in Figure 9, the burned area obtained by Copernicus are shown with green symbol, which means the burned area product has been filtered to only show the burning before 26 September. Copernicus identified some bare farmland areas as burned areas, whereas MCD64A1 and FireCCI 5.1 both identified them as non-burning areas, which resulted in large commission errors.

4. Discussion

A systematic comparison of three global burned area products was performed in this study, and has identified spatial and temporal similarities and differences in cropland burned area detections in China from 2015 to 2019. On the whole, the Copernicus product identified the largest total burned area and the FireCCI 5.1 product detected the smallest total burned area. The MCD64A1 and FireCCI 5.1 products underestimated the burned areas in China’s cropland region, whereas the Copernicus product overestimated the burned areas, especially in Xinjiang Province. The findings of this study match those of study [11], which reported that MCD64A1 detected a larger burned area than FireCCI 5.1 in an Amazonian forest region and study [29] which reported that MCD64A1 failed to identify cropland burned area in Eastern China where dominated by very large numbers of individually small fires. However, the result reported here differs from study [2], which reported that the FireCCI 5.1 product’s annual burned area average in 2001–2018 was 11% higher than that for MCD64A1. Other research [4,7,30,31] has also pointed out that MCD64A1 underestimates the extent of burned areas in a region. Underestimation by the MCD64A1 and FireCCI 5.1 products may be associated with large unmapped areas in a studied region, which are often caused by cloud cover and missing data. By contrast, overestimation by the Copernicus product is mostly related to excessive detection of cropland burned areas during periods outside of fire seasons.
In general, differences in burned areas detected by different products may be caused by variations in burned area algorithms and spectral and spatial domains. For example, the MCD64A1 product uses information about hotspots detected by MODIS instrumentation, and combines a burn-sensitive vegetation index based on short-wave infrared (SWIR) channels with a measure of temporal texture [30]. The smallest burned area detected by FireCCI 5.1 may therefore be a function of the resolution of a single NIR reflectance band that does not consider SWIR, which is a very sensitive tool to discriminate burned areas. Second, the underestimation of FireCCI 5.1 areas may be due to (i) the absence of an unmapped class, which likely increased the possibility of unclear pixels being labeled as unburned [32], or (ii) a result of the short duration when residues were burning. All algorithms use a thermal infrared band to capture active fires in order to reduce omission errors, although these algorithms are incapable of identifying short-duration incidences of residue burning.
This study focused on comparing the spatial and temporal correlations between three products for detecting burning crop residues, but without analyzing their accuracy, as the accuracy of the products is directly affected by land cover type. The accuracy of the MCD64A1 product at a global scale, as reported by the developers, is that it has omission errors (OE) exceeding >35% and commission errors (CE) exceeding >23% [24]. By contrast, the FireCCI 5.1 product has a reported OE count of 54.5% and CE count of 25.7% [25]. However, the accuracy of these three products is also different for different types of land cover. Santana et al. [8] reported that Brazilian biomes containing savanna and grassy areas have an OE count of 64.05% and a CE count of 45.85%. Hall et al. [10] found that MCD64A1 and FireCCI 5.1 suffer from very high OE counts of 71–76% and 63–99%, respectively, and CE counts of 62–81% and 49–93%, respectively, in cropland regions. Chang et al. [4] noted a characteristic delay between burning in an area and fire-related emissions, which is significantly influenced by the combustion efficiency of different land cover types. Alonso-Canas et al. [31] showed that the signs of burning in an area can be removed quickly due to climatic conditions and the rate of vegetation regeneration depends on the time that has elapsed after the fire has been extinguished. Therefore, it is very important to specifically compare the burned areas of crop residues.
We have compared the capability of three major products used to detect crop residue burning events in abnormal TSAs in China, and report large different between them. In particular, we found that their OE data are consistently large, most likely due to the small and discrete nature of burned patch residues, although the level of agreement for different burned area products increases proportionally with the size of the fires [5]. Zhu et al. [33] reported that the ability for a product to detect a burned area changes according to vegetation type, and is particularly low in cropland regions that have small fires. Ramo et al. [9] showed that Sentinel-2 images can detect 80% more burned area than when using a MODIS product, with this difference interpreted to be predominately related to small fires (<100 ha). Campagnolo et al. [34] pointed out that the accuracy of fire products is lower than 36% for fires that are smaller than 250 ha. Moreover, the large omission of burned area detection is known to be related to the short duration of fires. Olive et al. [35] stated explicitly limitations associated with the traditional burned area product include long revisit time of the satellite data. McCarty et al. [36] reported that some burned area commission errors are likely due to the practice of tilling directly after burning and stated that active fire with higher temporal resolution are useful for this situation. Liu et al. [37] also concluded that the temporal resolutions of MODIS and Landsat are both too coarse to accurately classify cropland burned area because of the quick harvest to sowing turnover period in India. Whereas, study [33] used the sampling interval on temporal scale is less than 20 days for cropland burned area estimation in Eastern Europe, and considered this interval is the best attempt of this kind of study. These studies can fully demonstrate that the duration of crop residues burned area is a region-specific phenomenon. For example, the characteristics of cropland burning in different regions of China are quite different. In the Songnen Plain in this study, farmers do not plow immediately after burning because this region dominated by one year one ripe area and there is a longer time between burning and sowing next season crop. Whereas, in the South China, farmers need plowing immediately after burning in order to plant next season crops because the crops could be harvested for two times per year, or three times every two years here. Thus, it is reasonable to conclude that the studied global burned area products are based on coarse spatial resolution sensors (>250 m) and are unsuitable to detect small fires that burn only within a fraction of a pixel in satellite imagery. Additionally, the spatial and temporal resolutions of the data for cropland burned area estimation are region specific. It is thus important to develop a product to detect crop residue burned areas that is based on higher spatial resolution satellite data and high revisit frequency.

5. Conclusions and Perspectives

In this study, we systematically compared three global burned area products and their ability to identify burned areas of cropland in mainland China between 2015 and 2019. We focused on both spatial and temporal correlations between products. In that period, the Copernicus product detected the largest annual average burned area (37,095.1 km2) in the study regions, followed by MCD64A1 and FireCCI 5.1, with 21,631.4 km2 and 12,547.99 km2, respectively. At the temporal scale, interannual variation of Copernicus monthly burned areas showed a consistent pattern from 2015 to 2019, whereas the monthly burned area peaks according to MCD64A1 and FireCCI 5.1 often changed during this period. At the spatial scale, the primary differences between the three products occur in Xinjiang province, especially in Northeast and North China, where the cropland burned areas are most concentrated.
The comparison of burned area products in this study only considered their correlations in space and time. Whereas, the accuracy and associated uncertainty are much important for fire emission study, end users might want to use a range of burned area for their emission estimates (i.e., error bars) and not simply choose which burned area product best suits their needs. Further work is needed to evaluate the accuracy of the burned area products and validate the uncertainty associated with the products, especially as the same burned area may not be identified in some instances when analyses are performed at different spatial resolutions [12]. Whether a small fire can be detected successfully during such an investigation is an important factor affecting the accuracy of calculated burned area products; therefore, further research should be conducted to improve the ability to detect small fires. This can be readily achieved by developing new burned area algorithms that use medium-resolution sensors and consider the morphologies of fire patches, which themselves influence burned area distributions.

Author Contributions

S.Z. and H.Z. conceived and designed the study; Z.W. and L.T. analyzed the data; S.Z. wrote the paper. All authors have read and agreed to the published version of the manuscript.

Funding

This work is financially supported by the National Natural Science Foundation of China (No. 42101414, 41771504) and the National Natural Science Foundation of Jilin Province (No.20200201214JC).

Institutional Review Board Statement

The study did not involve humans or animals.

Informed Consent Statement

The study did not involve humans.

Data Availability Statement

Not applicable.

Acknowledgments

We thank the NASA Earth Data Open Access for Open Science, Copernicus Global Land Service.

Conflicts of Interest

The authors declare no conflict of interest.

References

  1. Humber, M.L.; Boschetti, L.; Giglio, L.; Justice, C.O. Spatial and temporal intercomparison of four global burned area products. Int. J. Digit. Earth. 2019, 12, 460–484. [Google Scholar] [CrossRef] [PubMed]
  2. Mouillot, F.; Schultz, M.G.; Yue, C.; Cadule, P.; Tansey, K.; Ciais, P.; Chuvieco, E. Ten years of global burned area products from spaceborne remote sensing—A review: Analysis of user needs and recommendations for future developments. Int. J. Appl. Earth. Obs. Geoinf. 2014, 26, 64–79. [Google Scholar] [CrossRef] [Green Version]
  3. Boschetti, L.; Flasse, S.P.; Brivio, P.A. Analysis of the conflict between omission and commission in low spatial resolution dichotomic thematic products: The Pareto boundary. Remote Sens. Environ. 2004, 91, 280–292. [Google Scholar] [CrossRef]
  4. Chang, D.; Song, Y. Comparison of L3JRC and MODIS global burned area products from 2000 to 2007. J. Geophys. Res. Atmos. 2009, 114, D16106. [Google Scholar] [CrossRef]
  5. Vilar, L.; Camia, A.; San-Miguel-Ayanz, J. A comparison of remote sensing products and forest fire statistics for improving fire information in Mediterranean Europe. Eur. J. Remote Sens. 2015, 48, 345–364. [Google Scholar] [CrossRef] [Green Version]
  6. Padilla, M.; Stehman, S.V.; Chuvieco, E. Validation of the 2008 MODIS MCD45 global burned area product using stratified random sampling. Remote Sens. Environ. 2014, 144, 187–196. [Google Scholar] [CrossRef]
  7. Padilla, M.; Stehman, S.V.; Ramo, R.; Corti, D.; Hantson, S.; Oliva, P.; Alonso-Canas, I.; Bradley, A.V.; Tansey, K.; Mota, B.; et al. Comparing the accuracies of remote sensing global burned area products using stratified random sampling and estimation. Remote Sens. Environ. 2015, 160, 114–121. [Google Scholar] [CrossRef] [Green Version]
  8. Santana, N.C.; Carvalho, O.; Gomes, R.; Guimares, R.F. Accuracy and spatiotemporal distribution of fire in the Brazilian biomes from the MODIS burned-area products. Int. J. Wildland Fire. 2020, 29, 907–918. [Google Scholar] [CrossRef]
  9. Ramo, R.; Roteta, E.; Bistinas, I.; Wees, D.V.; Werf, G.R.V.D. African burned area and fire carbon emissions are strongly impacted by small fires undetected by coarse resolution satellite data. Proc. Natl. Acad. Sci. USA 2021, 118, e2011160118. [Google Scholar] [CrossRef]
  10. Hall, J.V.; Argueta, F.; Giglio, L. Validation of MCD64A1 and FireCCI 51 cropland burned area mapping in Ukraine. Int. J. Appl. Earth. Obs. Geoinf. 2021, 102, 102443. [Google Scholar] [CrossRef]
  11. Pessôa, A.; Anderson, L.O.; Carvalho, N.S.; Campanharo, W.A.; Arago, L.E.O.C. Intercomparison of Burned Area Products and Its Implication for Carbon Emission Estimations in the Amazon. Remote Sens. 2020, 12, 3864. [Google Scholar] [CrossRef]
  12. Valencia, G.M.; Anaya, J.A.; Velásquez, V.A.; Ramo, R.; Caro-Lopera, F.J. About Validation-Comparison of Burned Area Product. Remote Sens. 2020, 12, 3972. [Google Scholar] [CrossRef]
  13. Belenguer-Plomer, M.A.; Chuvieco, E.; Tanase, M.A. Temporal decorrelation of C-Band backscatter coefficient in Mediterranean burned areas. Remote Sens. 2019, 11, 2661. [Google Scholar] [CrossRef] [Green Version]
  14. Ke, H.; Gong, S.; He, J.; Zhou, C.; Zhang, L.; Zhou, Y. Spatial and temporal distribution of open bio-mass burning in China from 2013 to 2017. Atmos. Environ. 2019, 210, 156–165. [Google Scholar] [CrossRef]
  15. Bi, Y.Y.; Wang, Y.J.; Gao, C.Y. Straw resource quantity and its regional distribution in China. J. Agric. Mechanizat. Res. 2010, 3, 1–7. [Google Scholar]
  16. Chen, J.; Li, C.; Ristovski, Z.; Milic, A.; Gu, Y.; Islam, M.S.; Wang, S.X.; Hao, J.M.; Zhang, H.F.; He, C.J.; et al. A review of biomass burning: Emissions and impacts on air quality, health and climate in china. Sci. Total Environ. 2017, 579, 1000–1034. [Google Scholar] [CrossRef] [PubMed] [Green Version]
  17. Tian, X.; Zhao, F.; Shu, L.; Wang, M. Distribution characteristics and the influence factors of forest fires in China. For. Ecol. Manag. 2013, 310, 460–467. [Google Scholar] [CrossRef]
  18. Zhang, J.Y.; Yang, X.H.; Tu, X.M.; Ning, K.X.; Luan, X.C. Spatio-temporal change of straw burning fire points in field of China from 2014 to 2018. Trans. Chin. Soc. Agric. Eng. 2019, 35, 191–199. [Google Scholar]
  19. Justice, C.O.; Giglio, L.; Korontzi, S.; Owens, J.; Morisette, J.T.; Roy, D.; Descloitres, J.; Alleaume, S.; Petitcolin, F.; Kaufman, Y. The MODIS fire products. Remote Sens. Environ. 2002, 83, 244–262. [Google Scholar] [CrossRef]
  20. Ruiz, J.A.M.; Lázaro, J.R.G.; Cano, I.D.Á.; Leal, P.H. Burned area mapping in the North American boreal forest using terra-MODIS LTDR (2001–2011): A comparison with the MCD45A1, MCD64A1 and BA GEOLAND-2 products. Remote Sens. 2014, 6, 815–840. [Google Scholar] [CrossRef] [Green Version]
  21. Fornacca, D.; Ren, G.; Xiao, W. Performance of Three MODIS Fire Products (MCD45A1, MCD64A1, MCD14ML), and ESA Fire_CCI in a Mountainous Area of Northwest Yunnan, China, Characterized by Frequent Small Fires. Remote Sens. 2017, 9, 1131. [Google Scholar] [CrossRef] [Green Version]
  22. Vetrita, Y.; Cochrane, M.A.; Priyatna, M.; Sukowati, K.A.D.; Khomarudin, M.R. Evaluating accuracy of four MODIS-derived burned area products for tropical peatland and non-peatland fires. Environ. Res. Lett. 2021, 16, 035015. [Google Scholar] [CrossRef]
  23. Tansey, K.; Wolfs, D. Copernicus Global Land Service: Burnt Area and Seasonality Collection 300 m; Version 1; Algorithm Theoretical Basis Document; Zenodo: Geneve, Switzerland, 2017; p. I1.20. [Google Scholar]
  24. Giglio, L.; Boschetti, L.; Roy, D.P.; Humber, M.L.; Justice, C.O. The Collection 6 MODIS burned area mapping algorithm and product. Remote Sens. Environ. 2018, 217, 72–85. [Google Scholar] [CrossRef] [PubMed]
  25. Lizundia-Loiola, J.; Otón, G.; Ramo, R.; Chuvieco, E. A spatio-temporal active-fire clustering approach for global burned area mapping at 250m from MODIS data. Remote Sens. Environ. 2020, 236, 111493. [Google Scholar] [CrossRef]
  26. Buchhorn, M.; Bertels, L.; Smets, B.; De Roo, B.; Lesiv, M.; Tsendbazar, N.E.; Masiliunas, D.; Linlin, L. Copernicus Global Land Service: Land Cover 100 m: Version 3 Globe 2015–2019: Algorithm Theoretical Basis Document; Zenodo: Geneve, Switzerland, 2020; p. I3.4. [Google Scholar]
  27. Boschetti, L.; Stehman, S.V.; Roy, D.P. A stratified random sampling design in space and time for regional to global scale burned area product validation. Remote Sens. Environ. 2016, 186, 465–478. [Google Scholar] [CrossRef]
  28. Tansey, K.; Rasul, A.; Ibrahim, S. Scientific Quality Evaluation Report 2019 Burned Areas 300 m V1; Zenodo: Geneve, Switzerland, 2020; p. I1.00. [Google Scholar]
  29. Zhang, T.; Wooster, M.J.; De Jong, M.C.; Xu, W. How well does the ‘small fire boost’methodology used within the GFED4. 1s fire emissions database represent the timing, location and magnitude of agricultural burning? Remote Sens. 2018, 10, 823. [Google Scholar] [CrossRef] [Green Version]
  30. Libonati, R.; DaCamara, C.C.; Setzer, A.W.; Morelli, F.; Melchiori, A.E. An algorithm for burned area detection in the Brazilian Cerrado using 4 μm MODIS imagery. Remote Sens. 2015, 7, 15782–15803. [Google Scholar] [CrossRef] [Green Version]
  31. Alonso-Canas, I.; Chuvieco, E. Global burned area mapping from ENVISAT-MERIS and MODIS active fire data. Remote Sens. Environ. 2015, 163, 140–152. [Google Scholar] [CrossRef]
  32. Korontzi, S.; Roy, D.P.; Justi Ce, C.O.; Ward, D.E. Modeling and sensitivity analysis of fire emissions in southern Africa during SAFARI 2000. Remote Sens. Environ. 2004, 92, 376–396. [Google Scholar] [CrossRef]
  33. Zhu, C.; Kobayashi, H.; Kanaya, Y.; Saito, M. Size-dependent validation of MODIS MCD64A1 burned area over six vegetation types in boreal Eurasia: Large underestimation in croplands. Sci. Rep. 2017, 7, 4181. [Google Scholar] [CrossRef]
  34. Campagnolo, M.L.; Libonati, R.; Rodrigues, J.A.; Pereira, J. A comprehensive characterization of MODIS daily burned area mapping accuracy across fire sizes in tropical savannas. Remote Sens. Environ. 2021, 252, 112115. [Google Scholar] [CrossRef]
  35. Oliva, P.; Schroeder, W. Assessment of VIIRS 375 m active fire detection product for direct burned area mapping. Remote Sens. Environ. 2015, 160, 144–155. [Google Scholar] [CrossRef]
  36. McCarty, J.L.; Korontzi, S.; Justice, C.O.; Loboda, T. The spatial and temporal distribution of crop residue burning in the contiguous United States. Sci. Total Environ. 2009, 407, 5701–5712. [Google Scholar] [CrossRef]
  37. Liu, T.; Marlier, M.E.; Karambelas, A.; Jain, M.; Singh, S.; Singh, M.K.; Gautam, R.; DeFries, R.S. Missing emissions from post-monsoon agricultural fires in northwestern India: Regional limitations of MODIS burned area and active fire products. Environ. Res. Commun. 2019, 1, 011007. [Google Scholar] [CrossRef]
Figure 1. The study area with a superimposed polygon of Thiessen scene areas (TSA).
Remotesensing 14 00693 g001
Figure 2. Total burned area identified per year by each product.
Remotesensing 14 00693 g002
Figure 3. Monthly burned areas detected by each product from 2015 to 2019.
Remotesensing 14 00693 g003aRemotesensing 14 00693 g003b
Figure 4. Scatterplot of monthly burned areas calculated from 2015 to 2019 between MCD64A1 and FireCCI 5.1, Copernicus.
Remotesensing 14 00693 g004
Figure 5. Calculated burned area differences between FireCCI 5.1 and MCD64A1 (a), and Copernicus and MCD64A1 (b).
Remotesensing 14 00693 g005aRemotesensing 14 00693 g005b
Figure 6. Burned area differences and maximum differences among the three products: (a) burned area difference between FireCCI 5.1 and MCD64A1 in 2016; (b) maximum difference between FireCCI 5.1 and MCD64A1 in concurrent months in 2016; (c) burned area difference between Copernicus and MCD64A1 in 2016; (d) maximum difference between Copernicus and MCD64A1 in concurrent months in 2016.
Remotesensing 14 00693 g006
Figure 7. Scatter plot illustrating burned areas detected in each TSA polygon in 2016 by MCD64A1, FireCCI 5.1, and Copernicus.
Remotesensing 14 00693 g007
Figure 8. Satellite image comparison of Songnen Plain, China, during the April 2017 burning season. The three panels show MCD64A1 (a), FireCCI 5.1 (b), and Copernicus (c) burned area coverage in Landsat imagery (2 April 2017) with a R(SWIR1)–G(NIR)–B(SWIR2) composite.
Remotesensing 14 00693 g008
Figure 9. Copernicus burned areas in Xinjiang Province, China, covered by Landsat images dated 26 September 2016, with a R (NIR)–G (Red)–B (Green) composite overlay.
Remotesensing 14 00693 g009
Publisher’s Note: MDPI stays neutral with regard to jurisdictional claims in published maps and institutional affiliations.

