
Ground Deformation Pattern Analysis and Evolution Prediction of Shanghai Pudong International Airport Based on PSI Long Time Series Observations


 , , and
Abstract
:1. Introduction
2. Study Area and Datasets
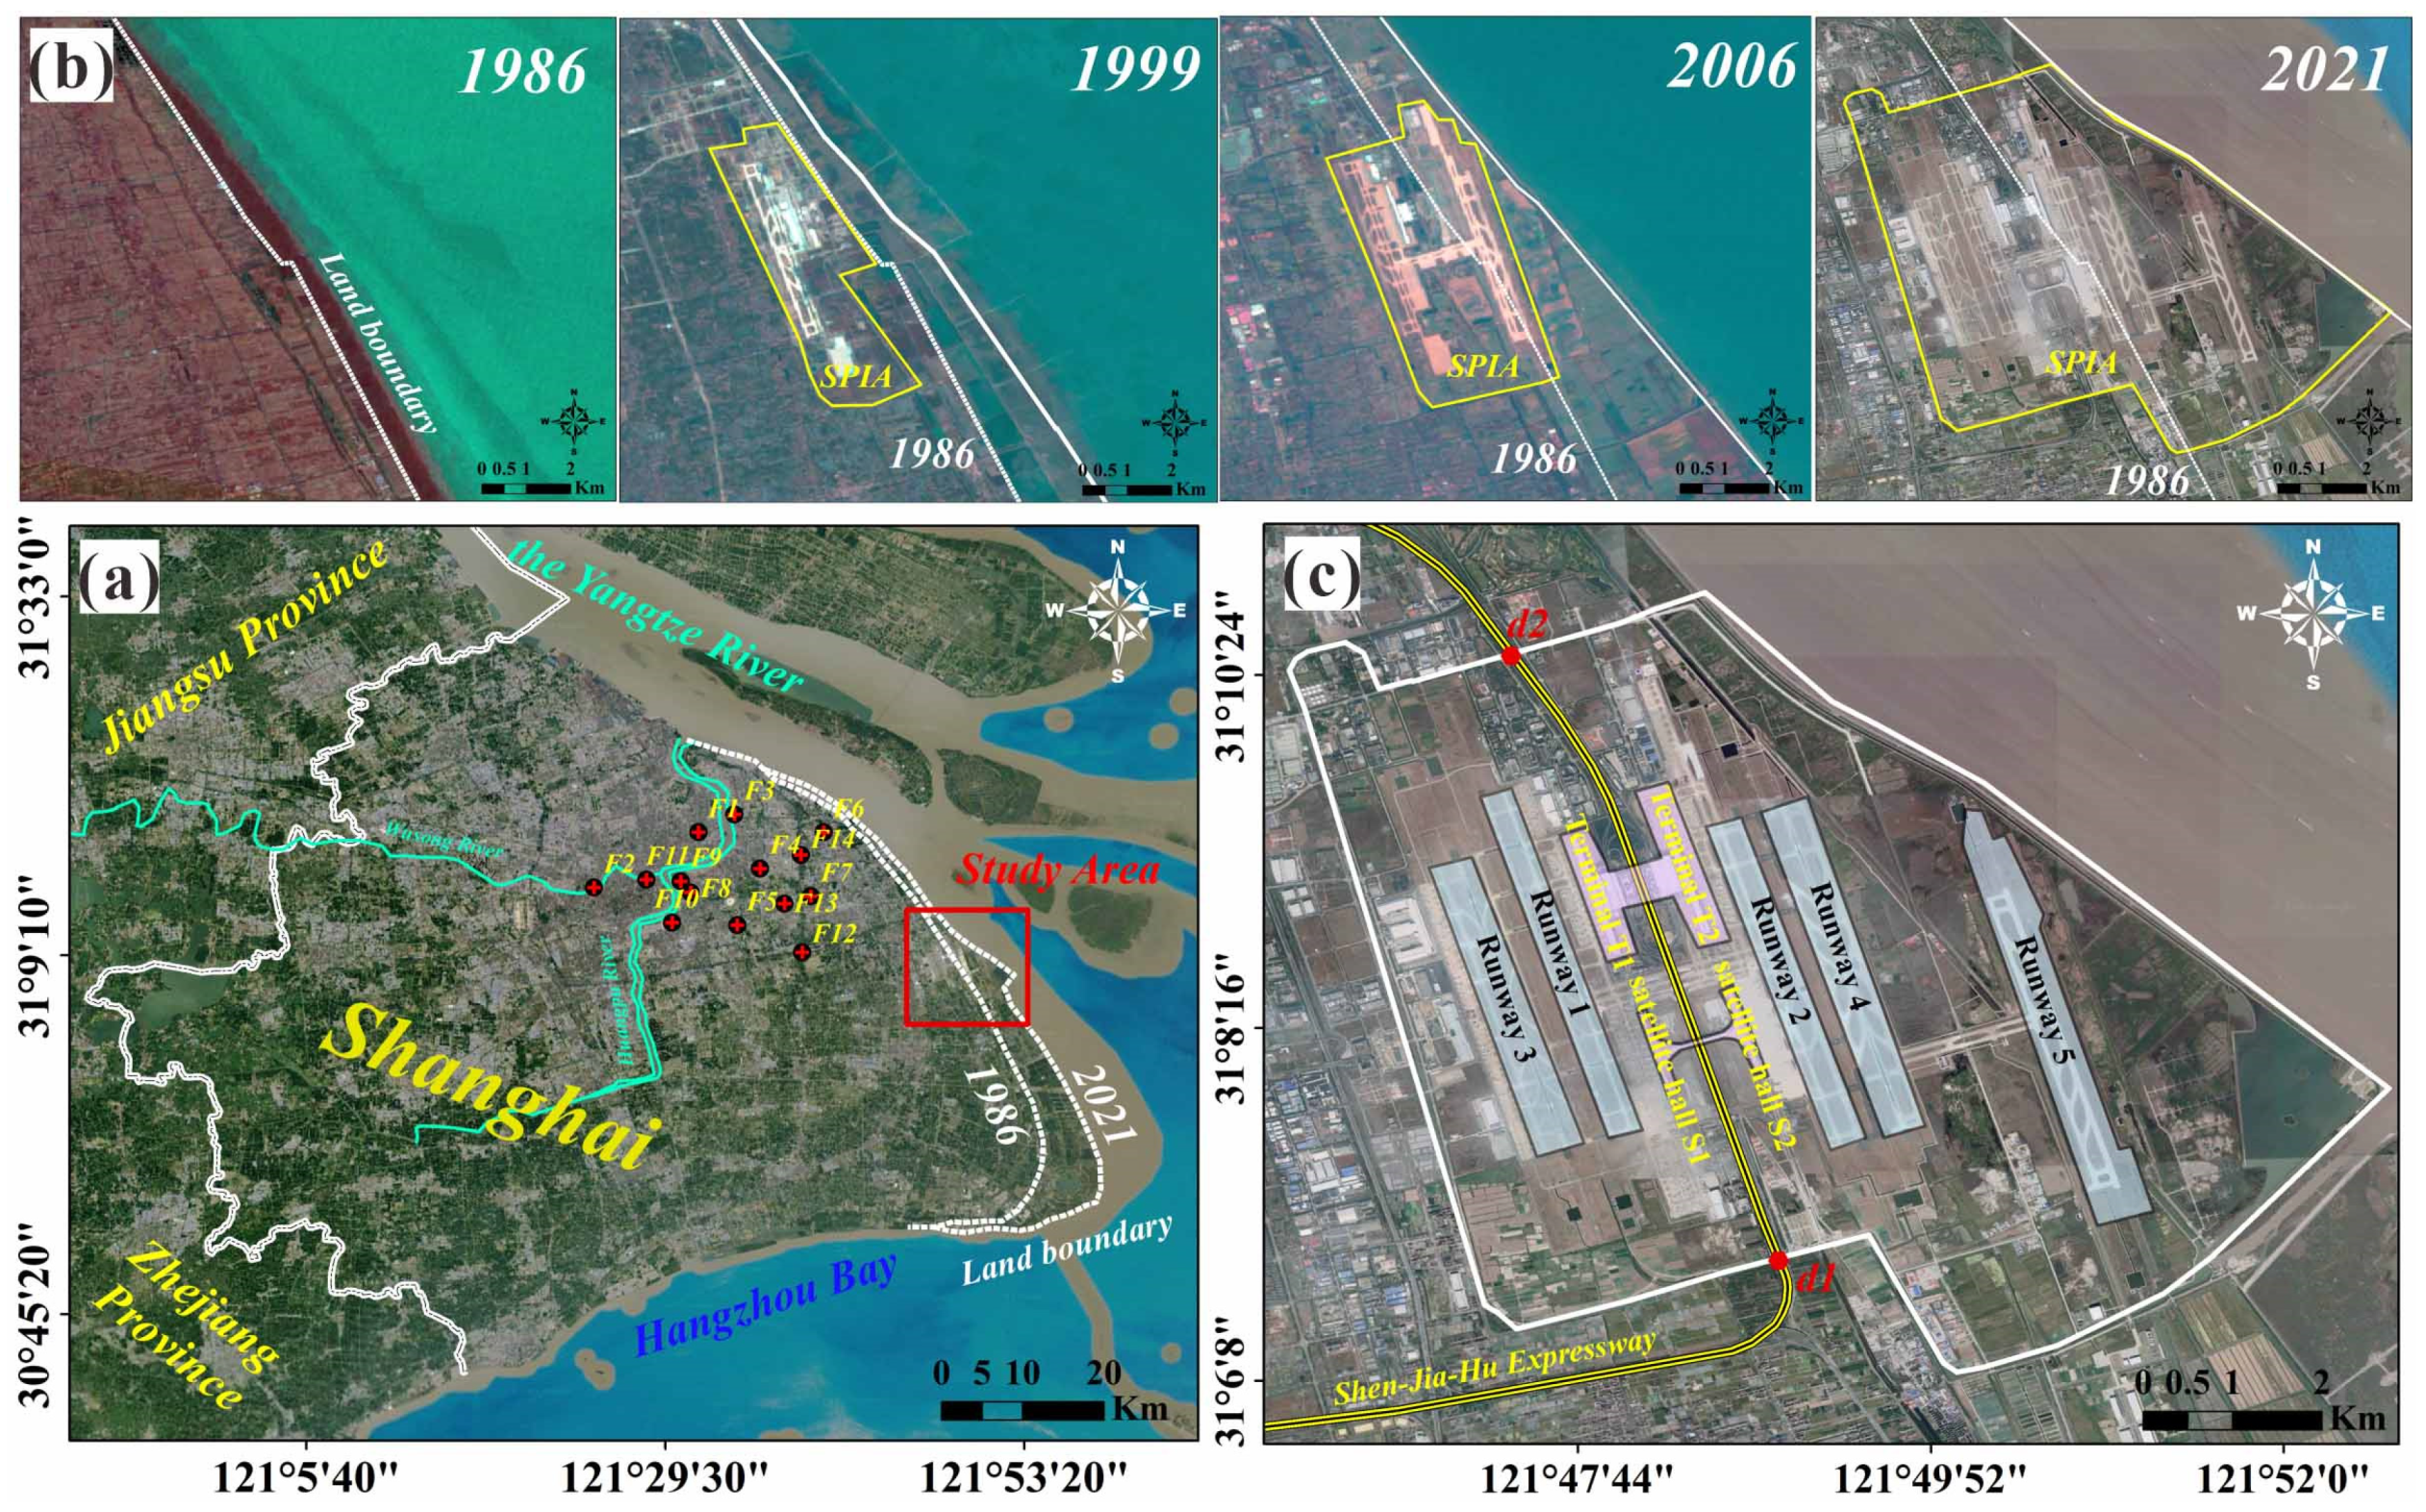
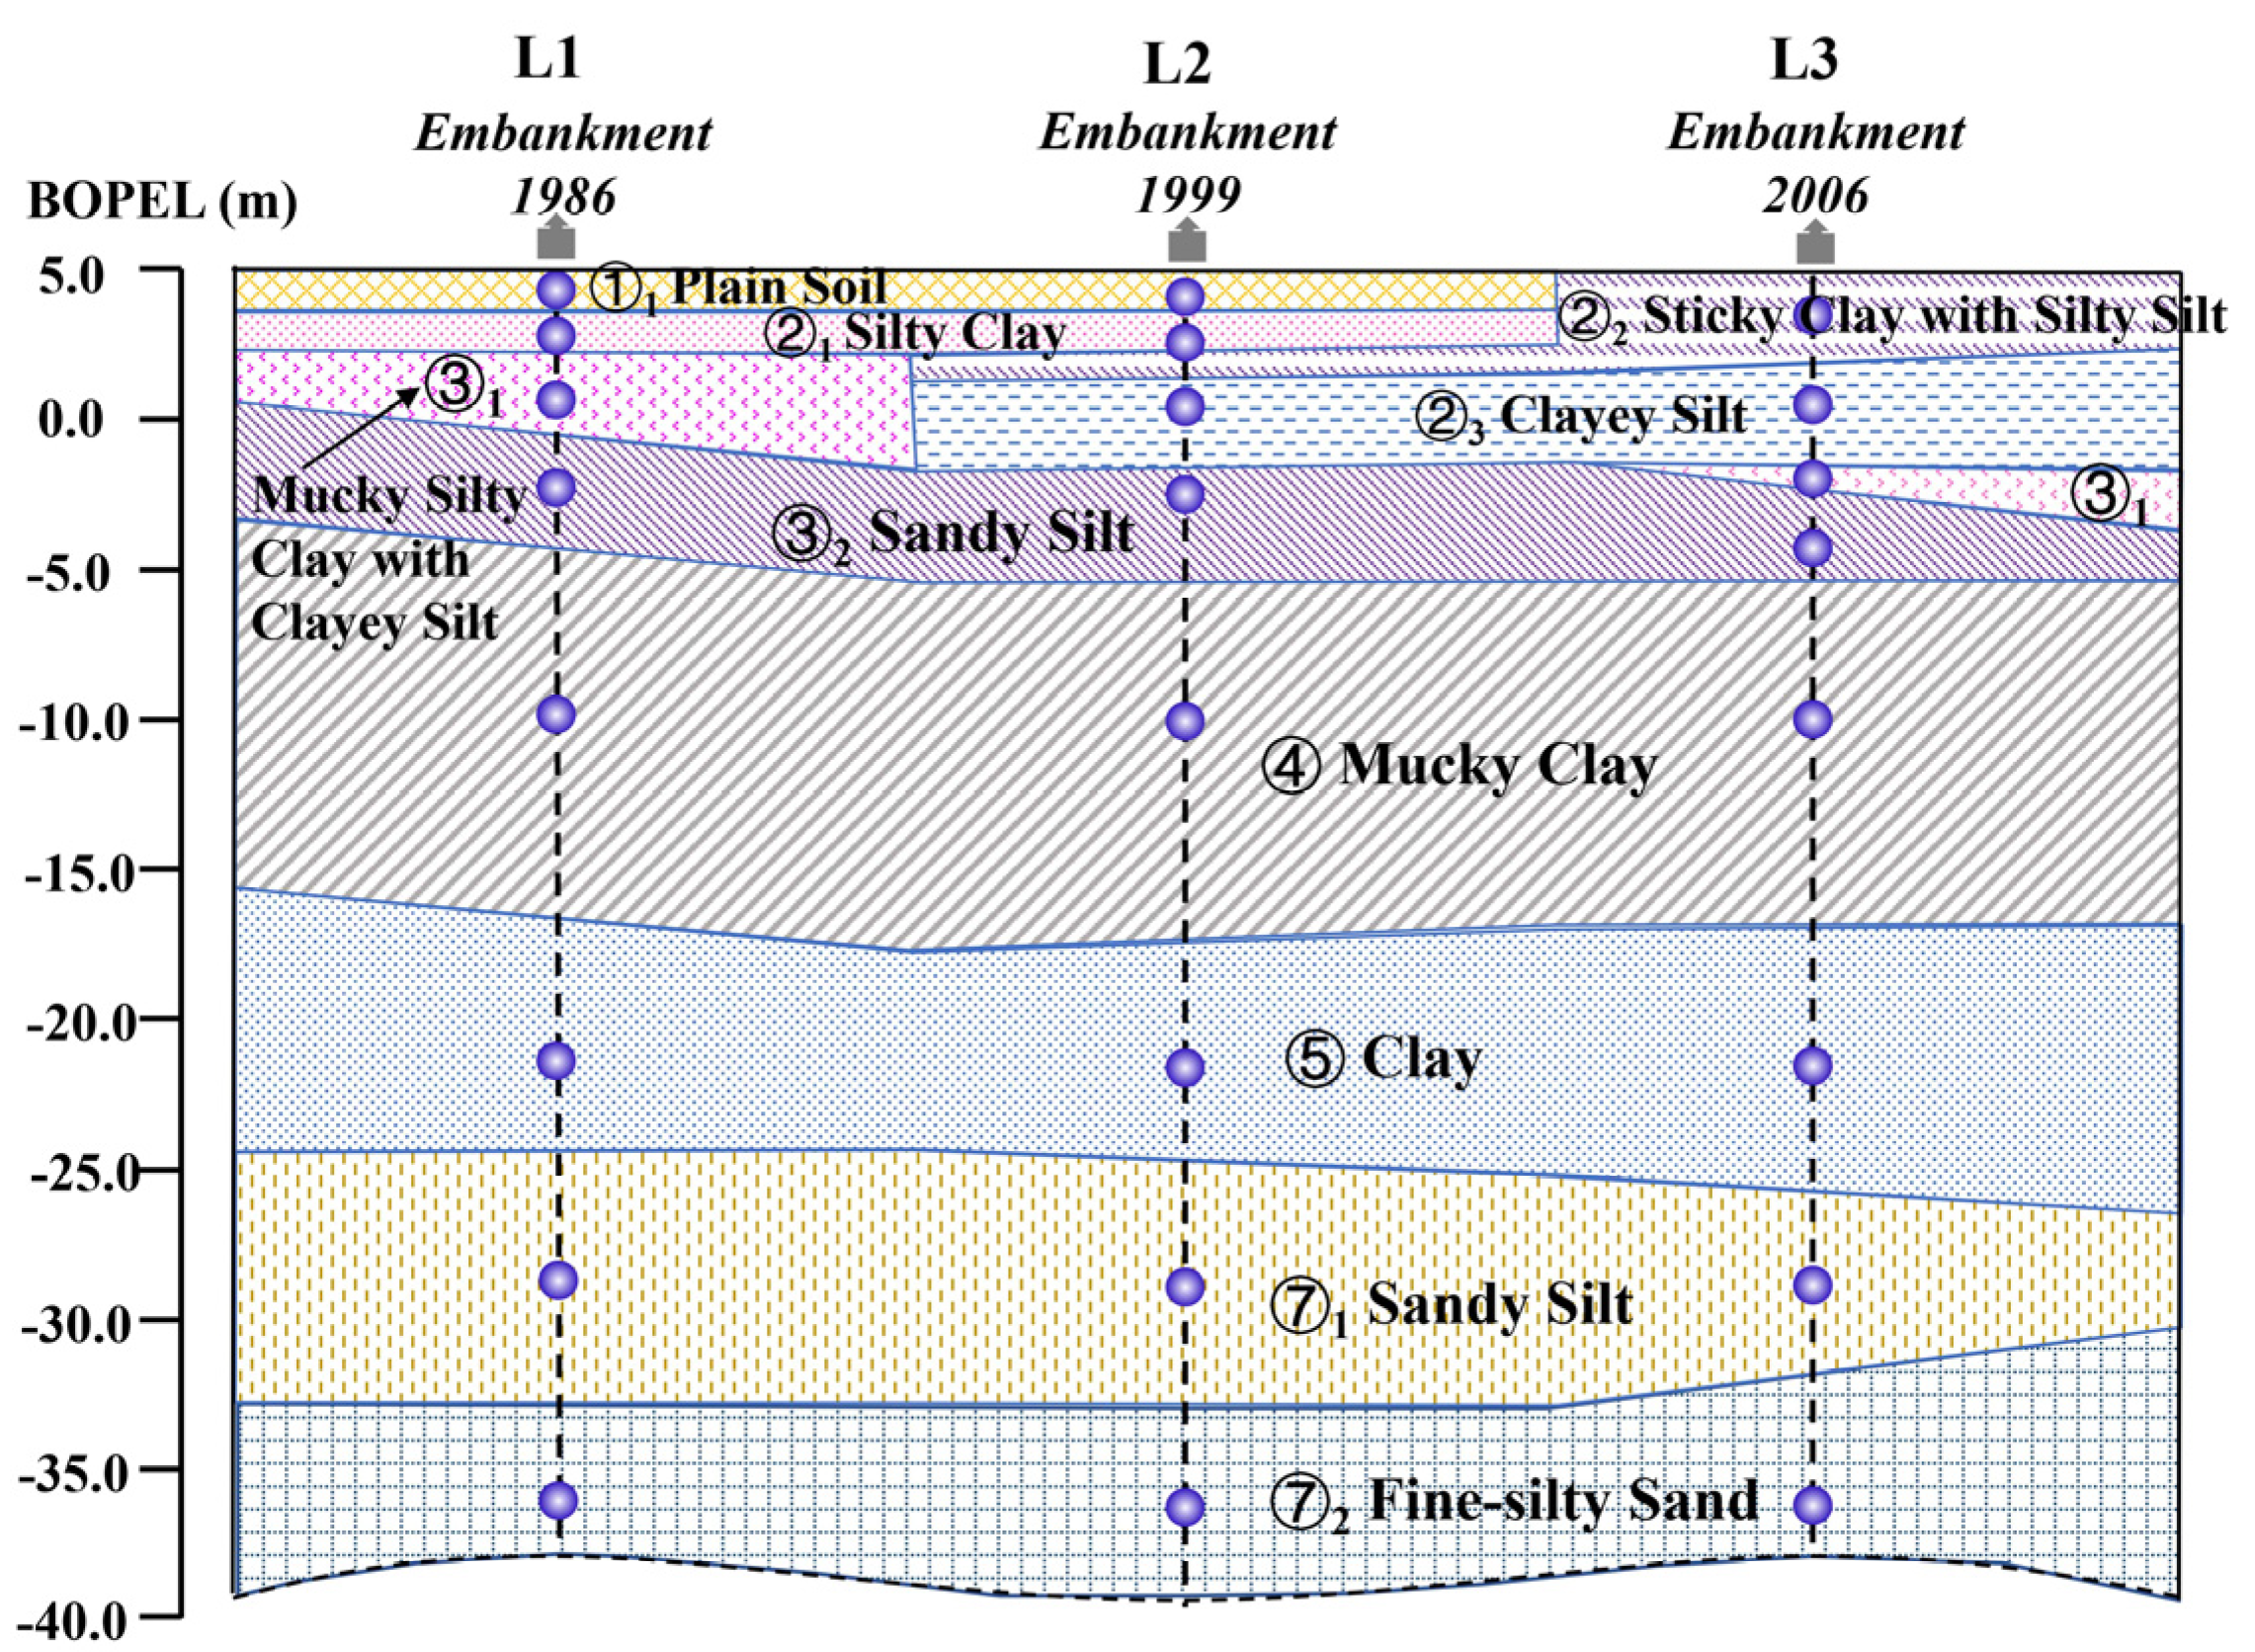
2.1. SPIA and Its Reclamation History
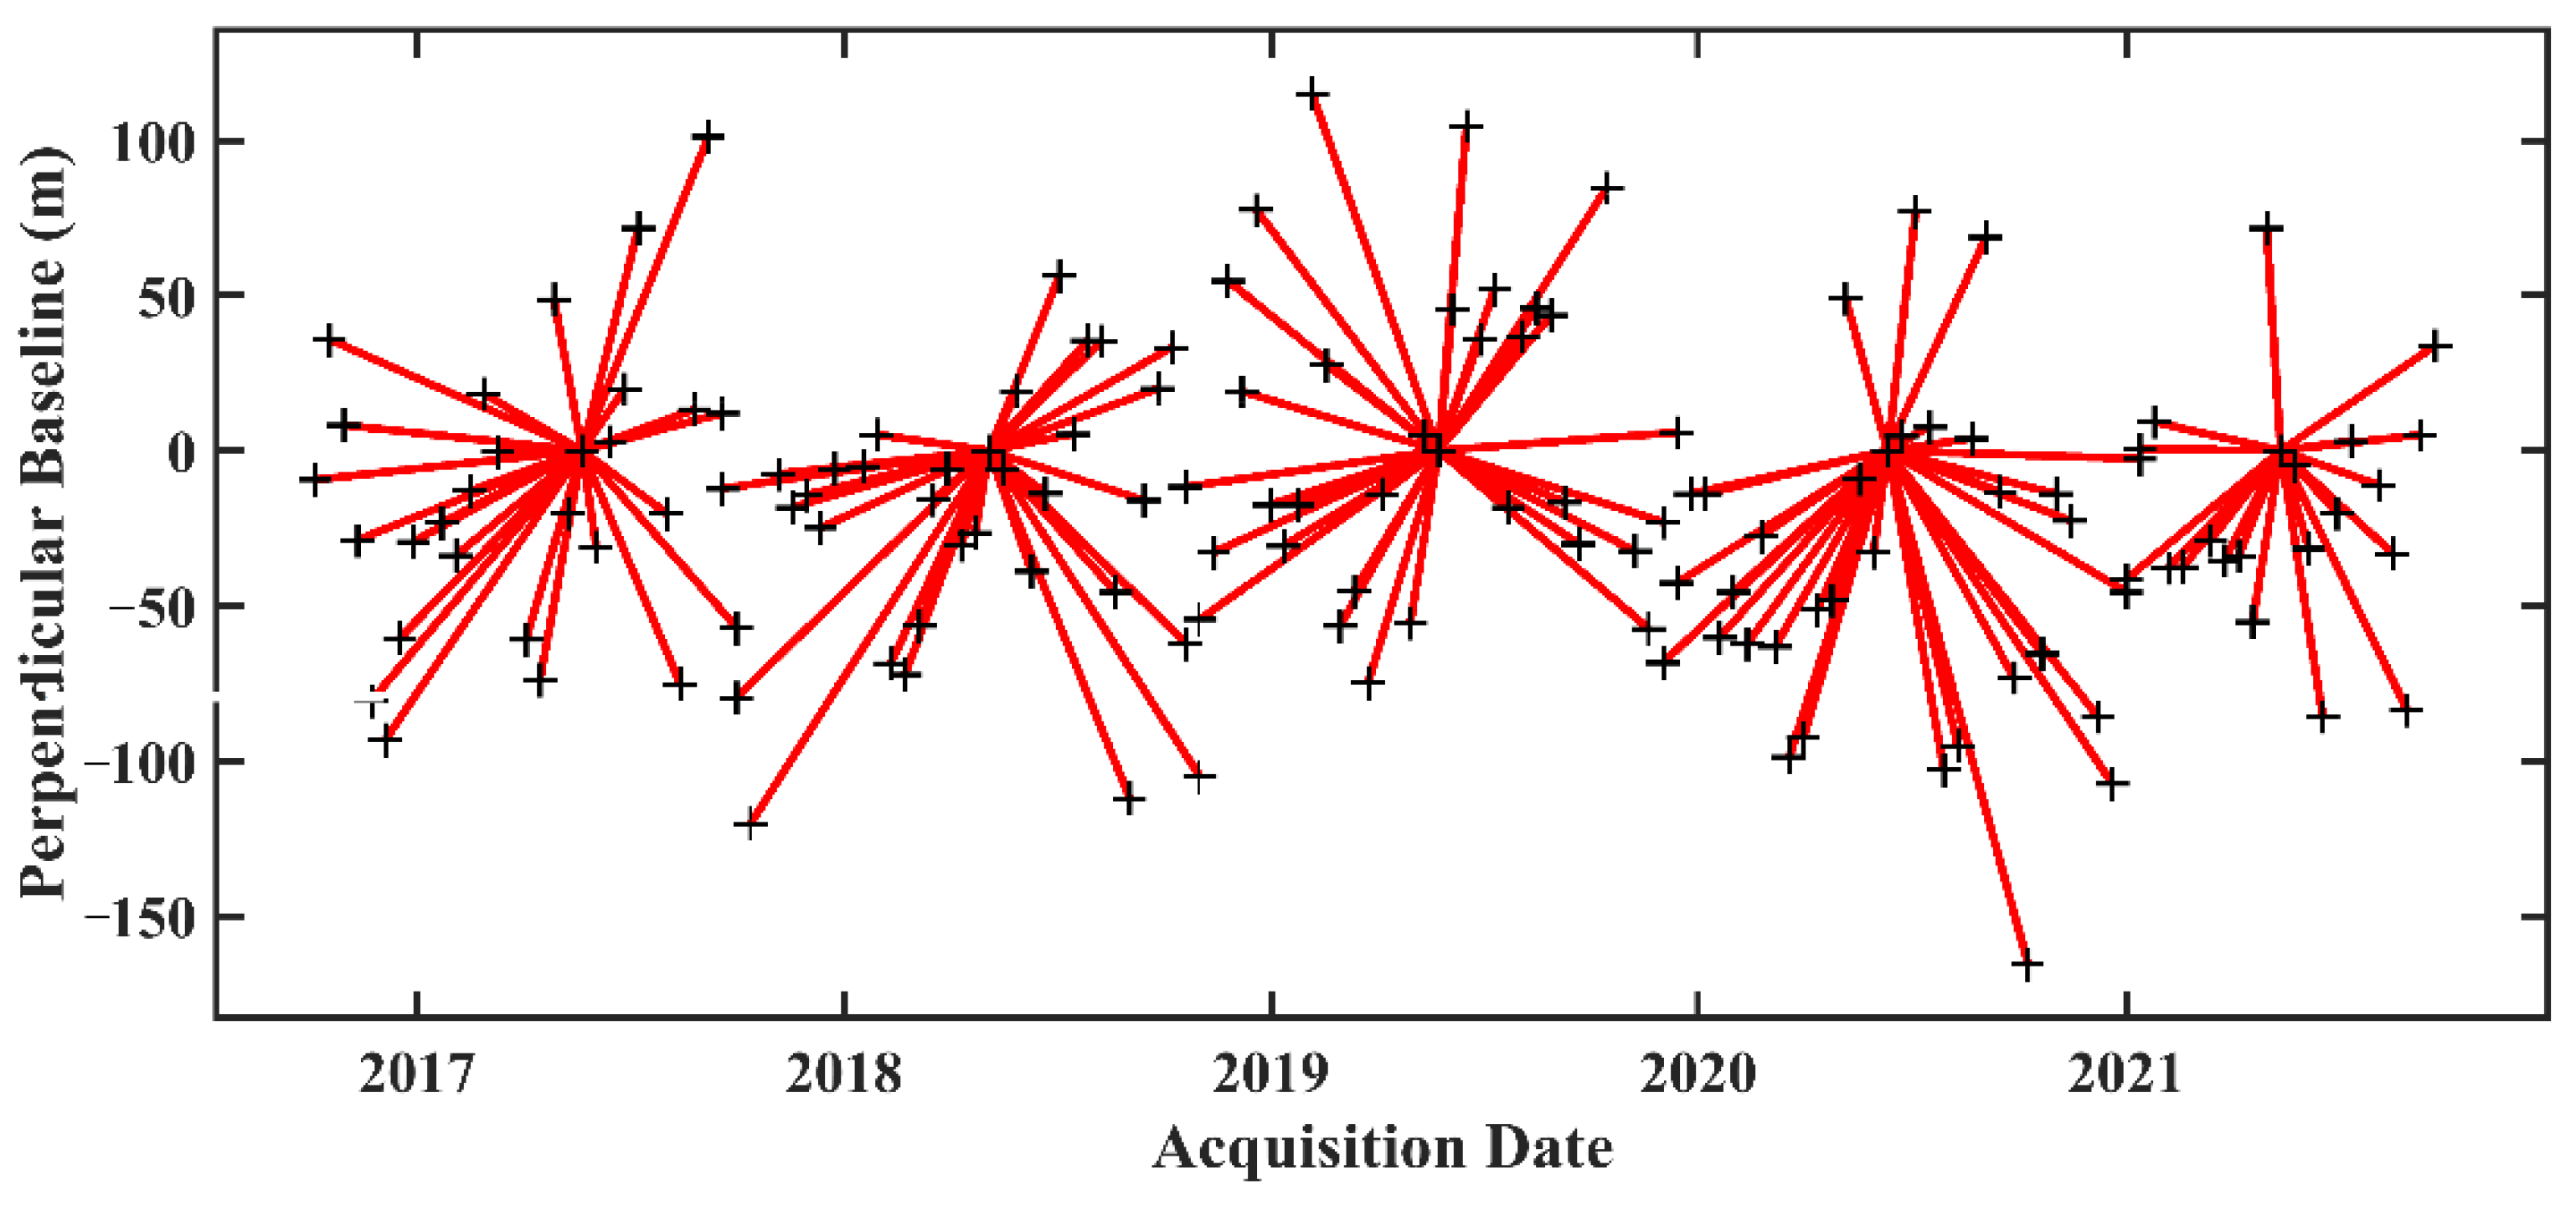
2.2. Datasets
3. Methodology
3.1. StaMPS PSI
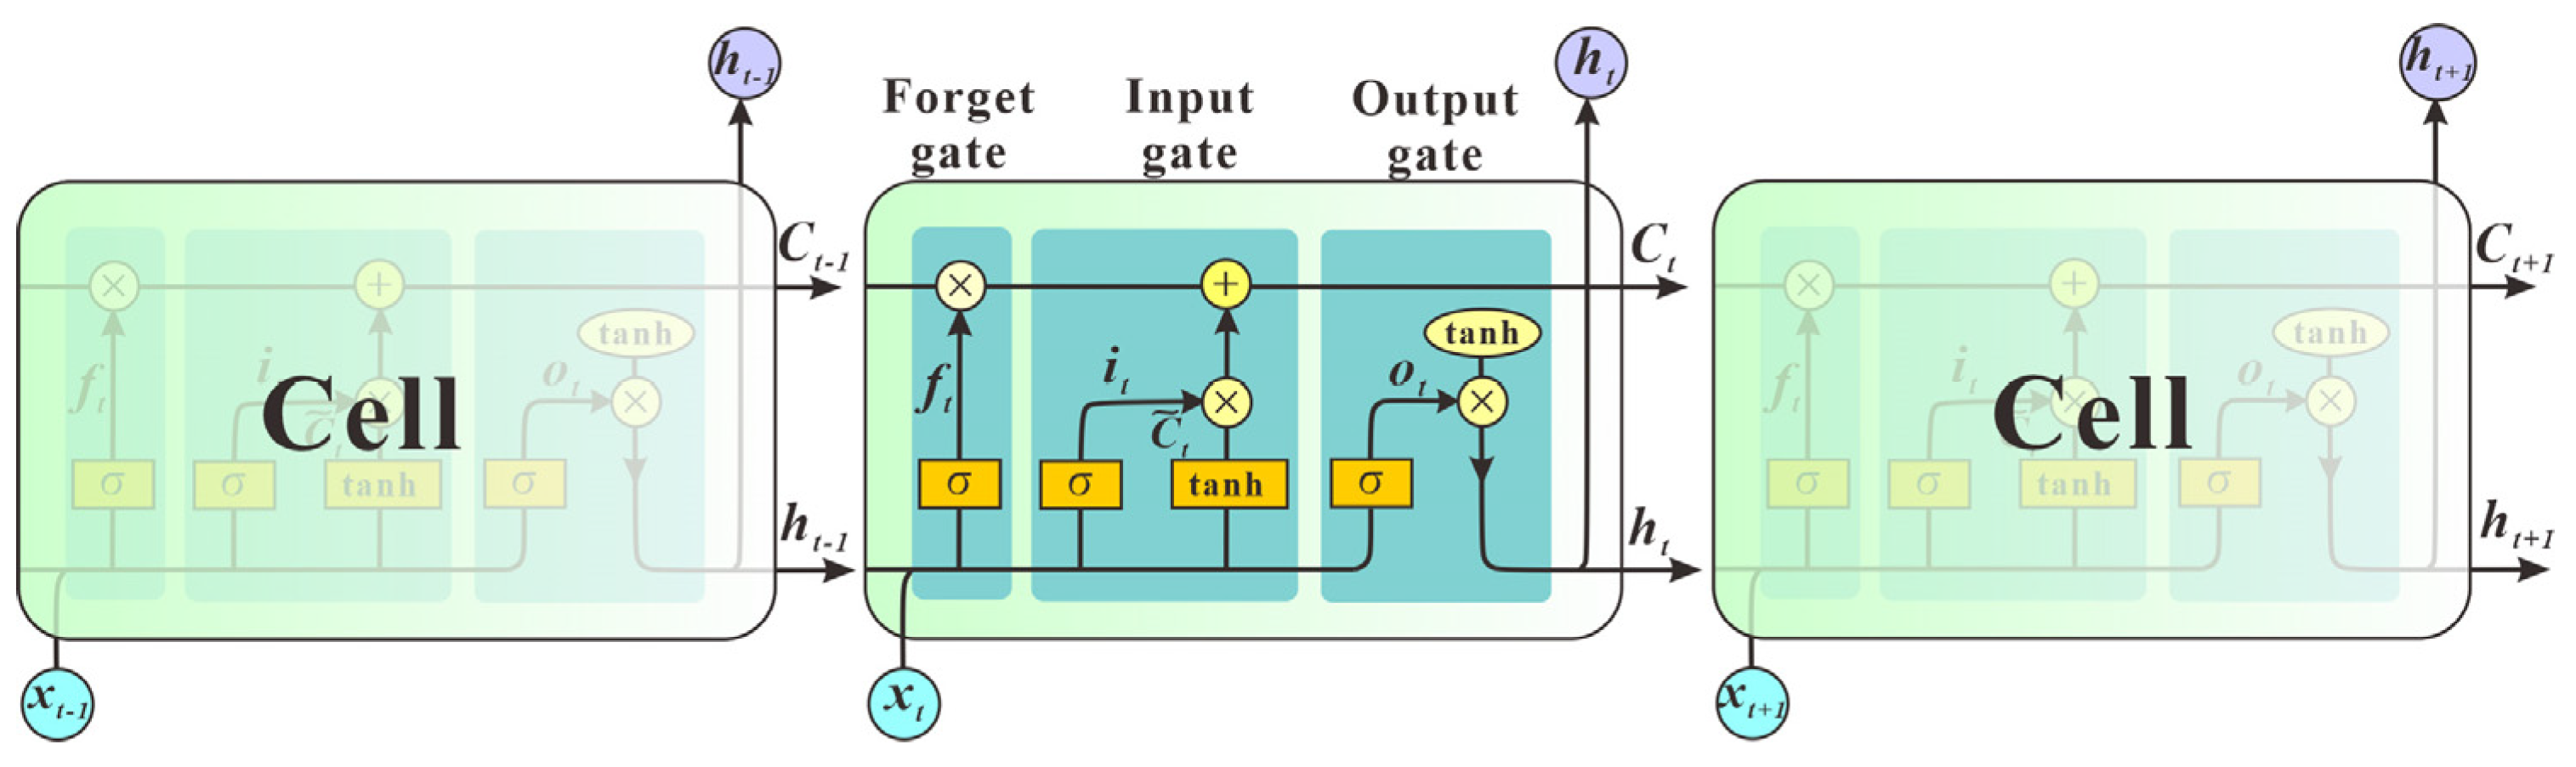
3.2. Long Short Term Memory Neural Network
4. Results
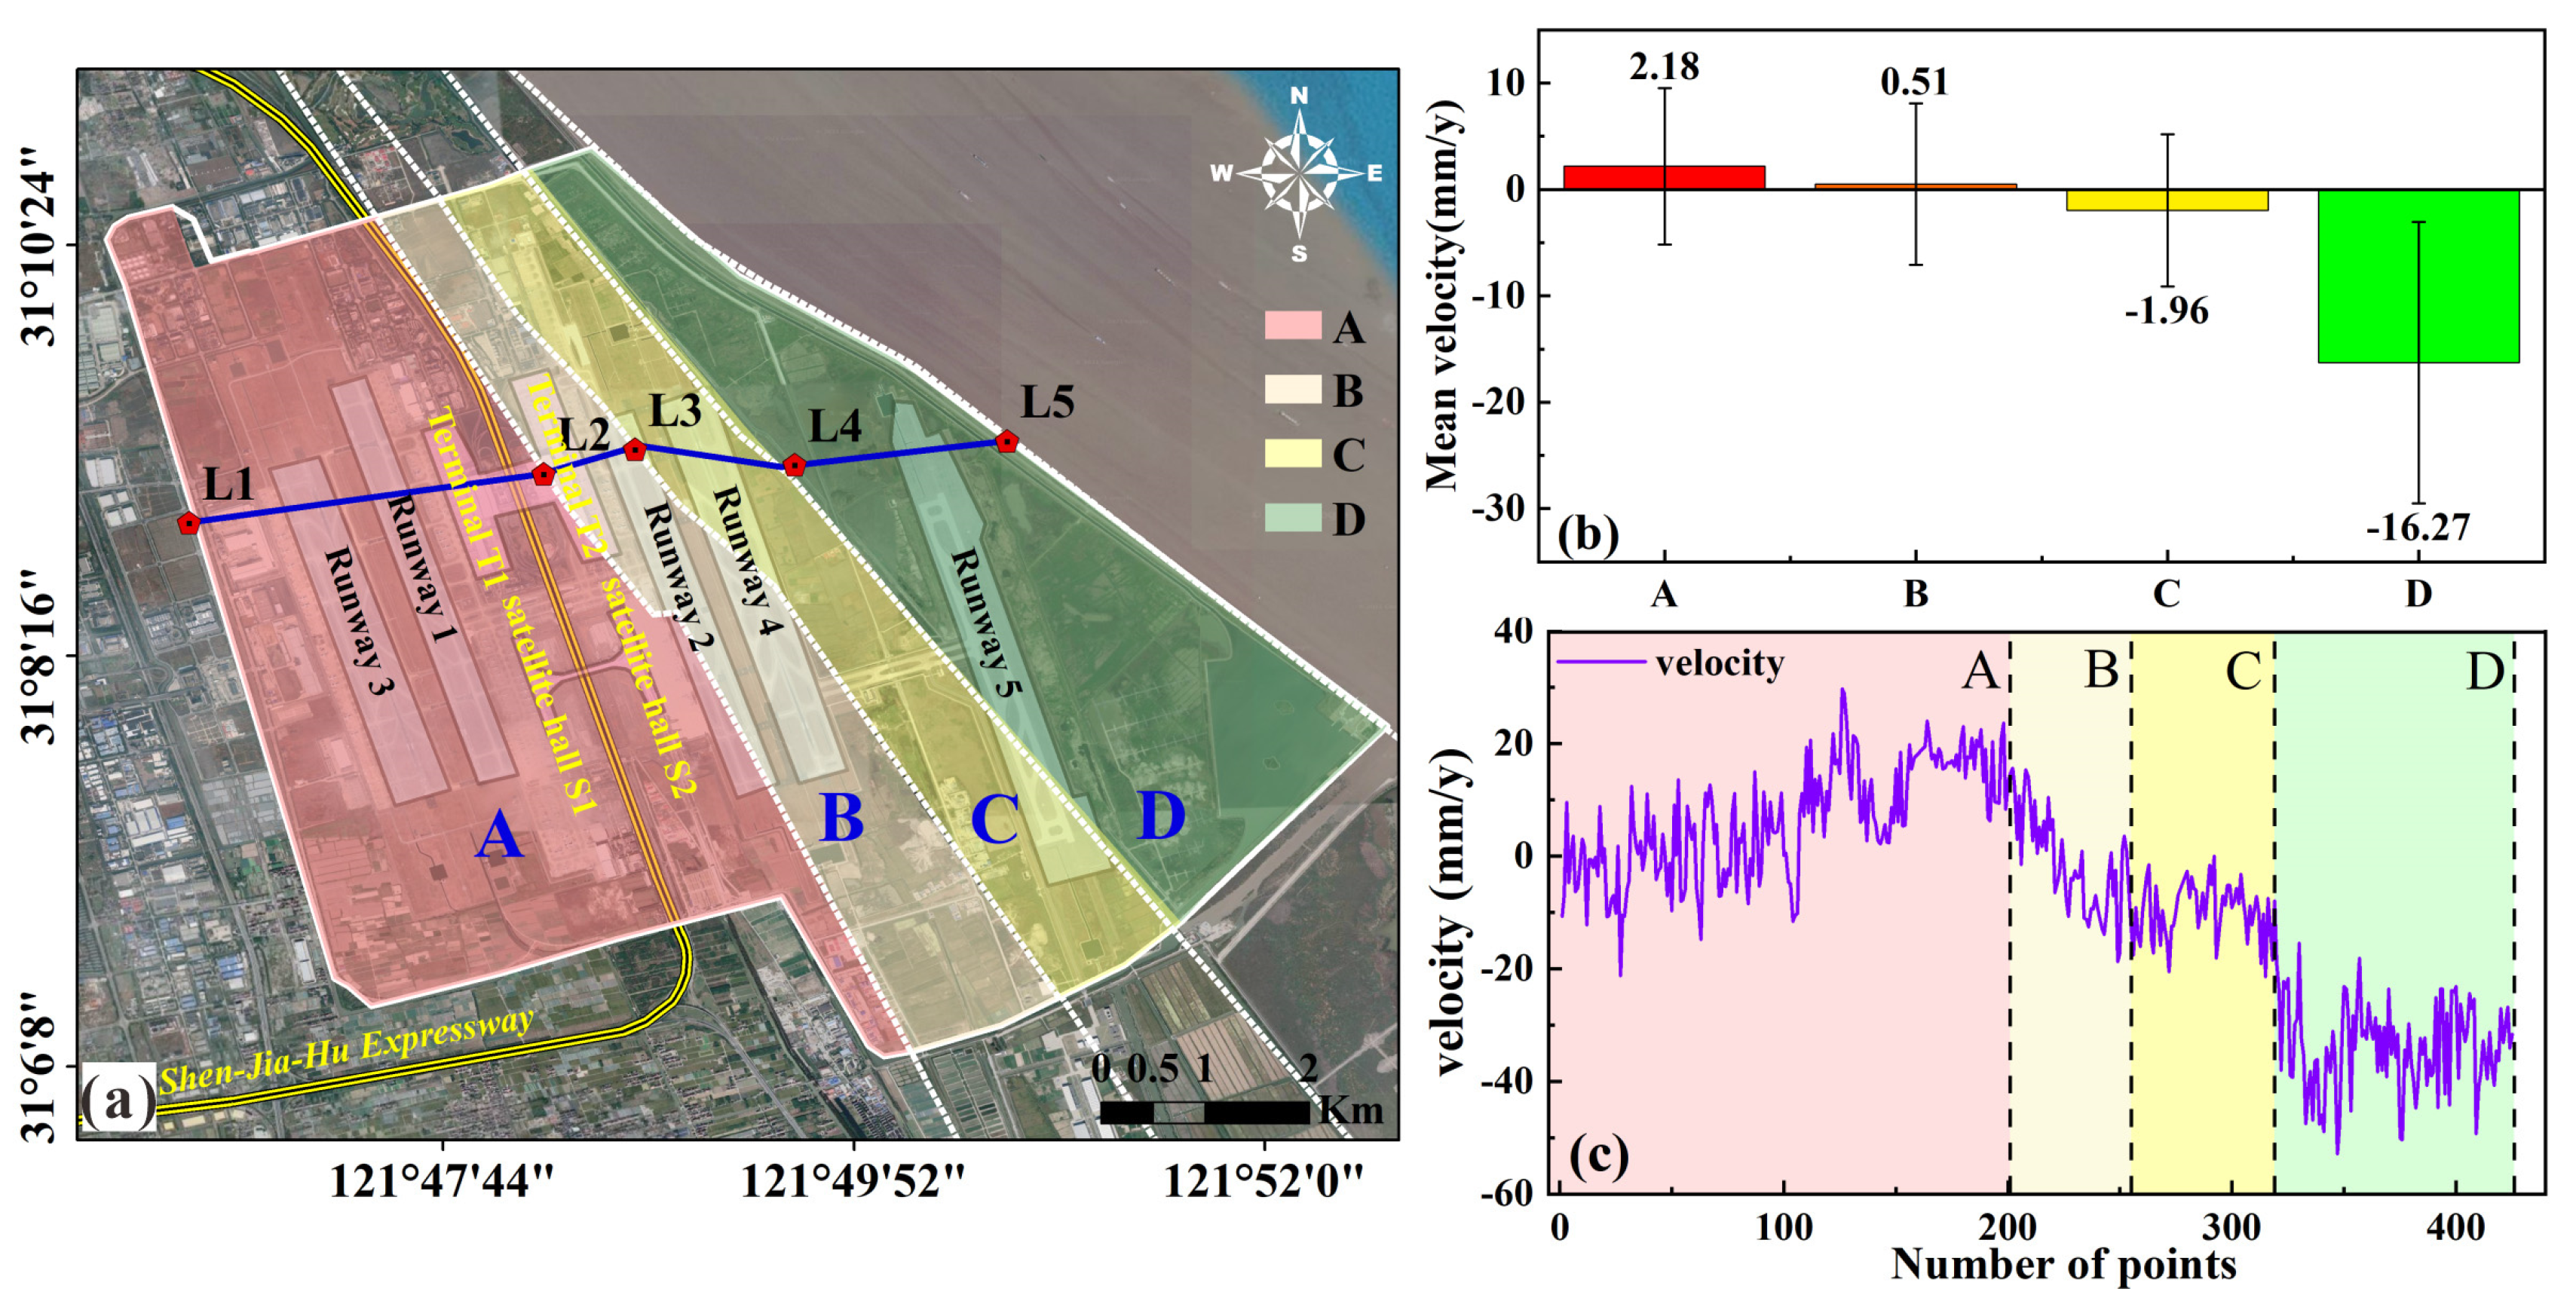
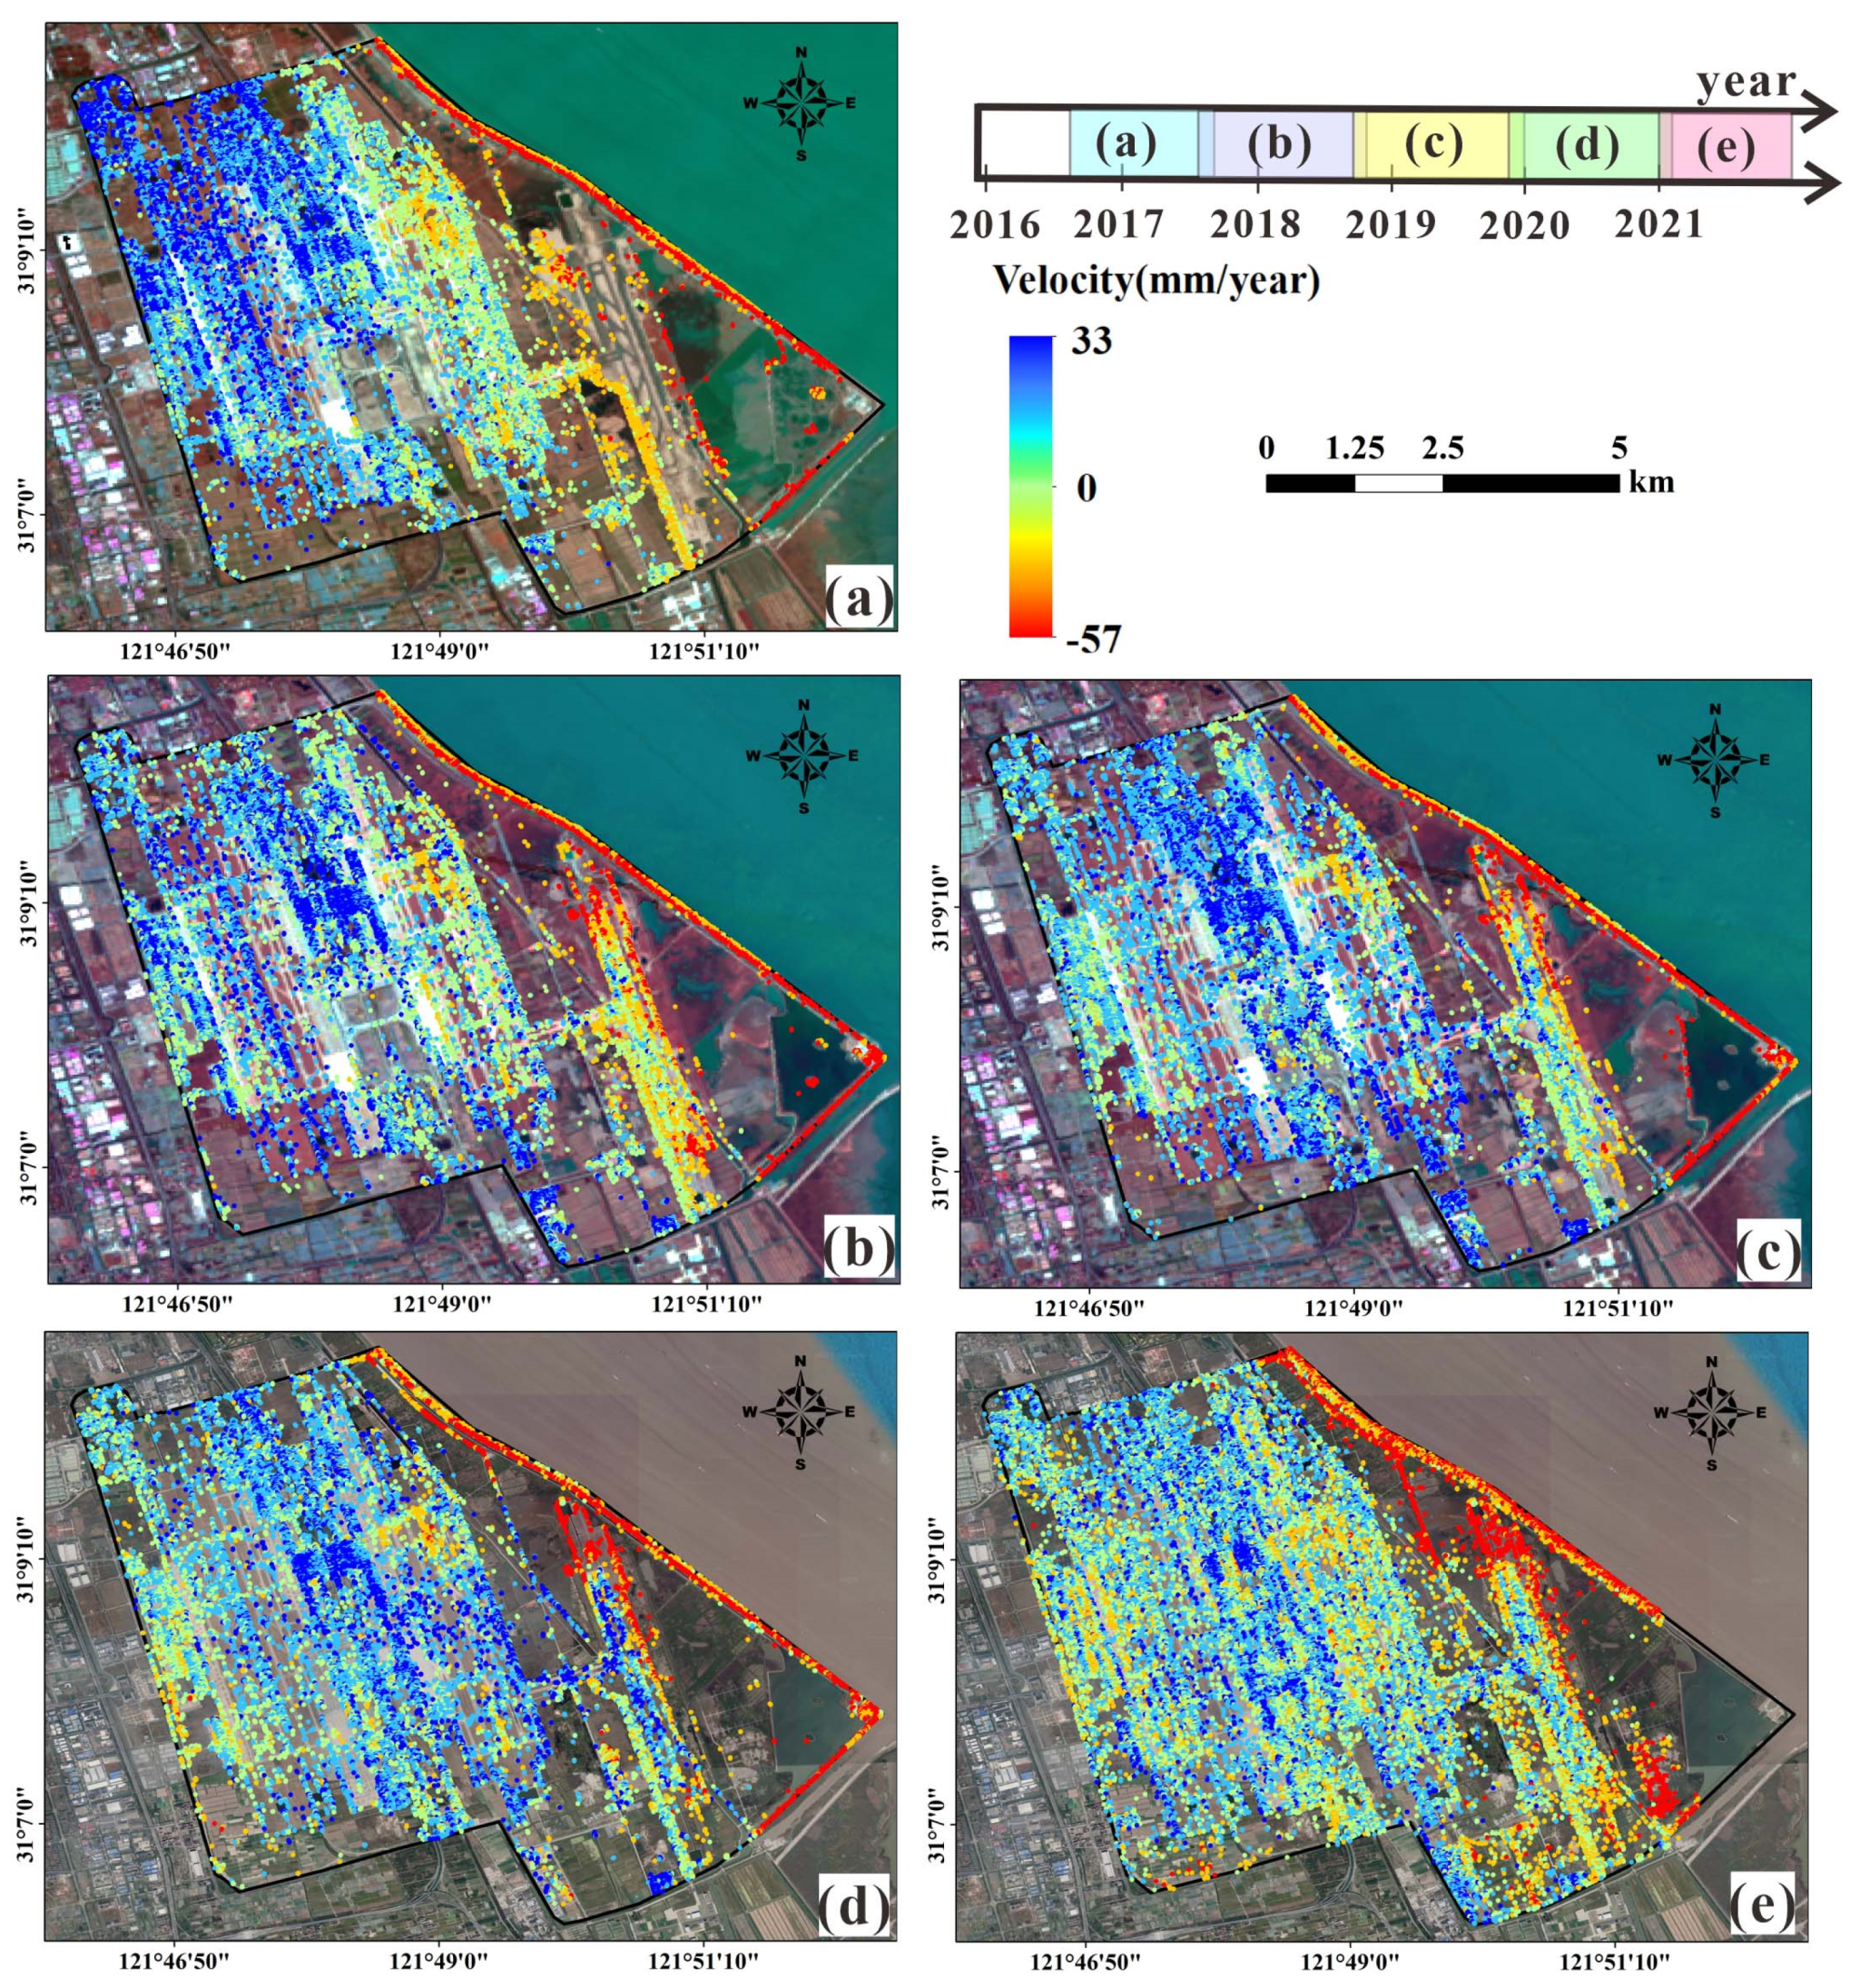
4.1. Spatial Distribution of Deformation
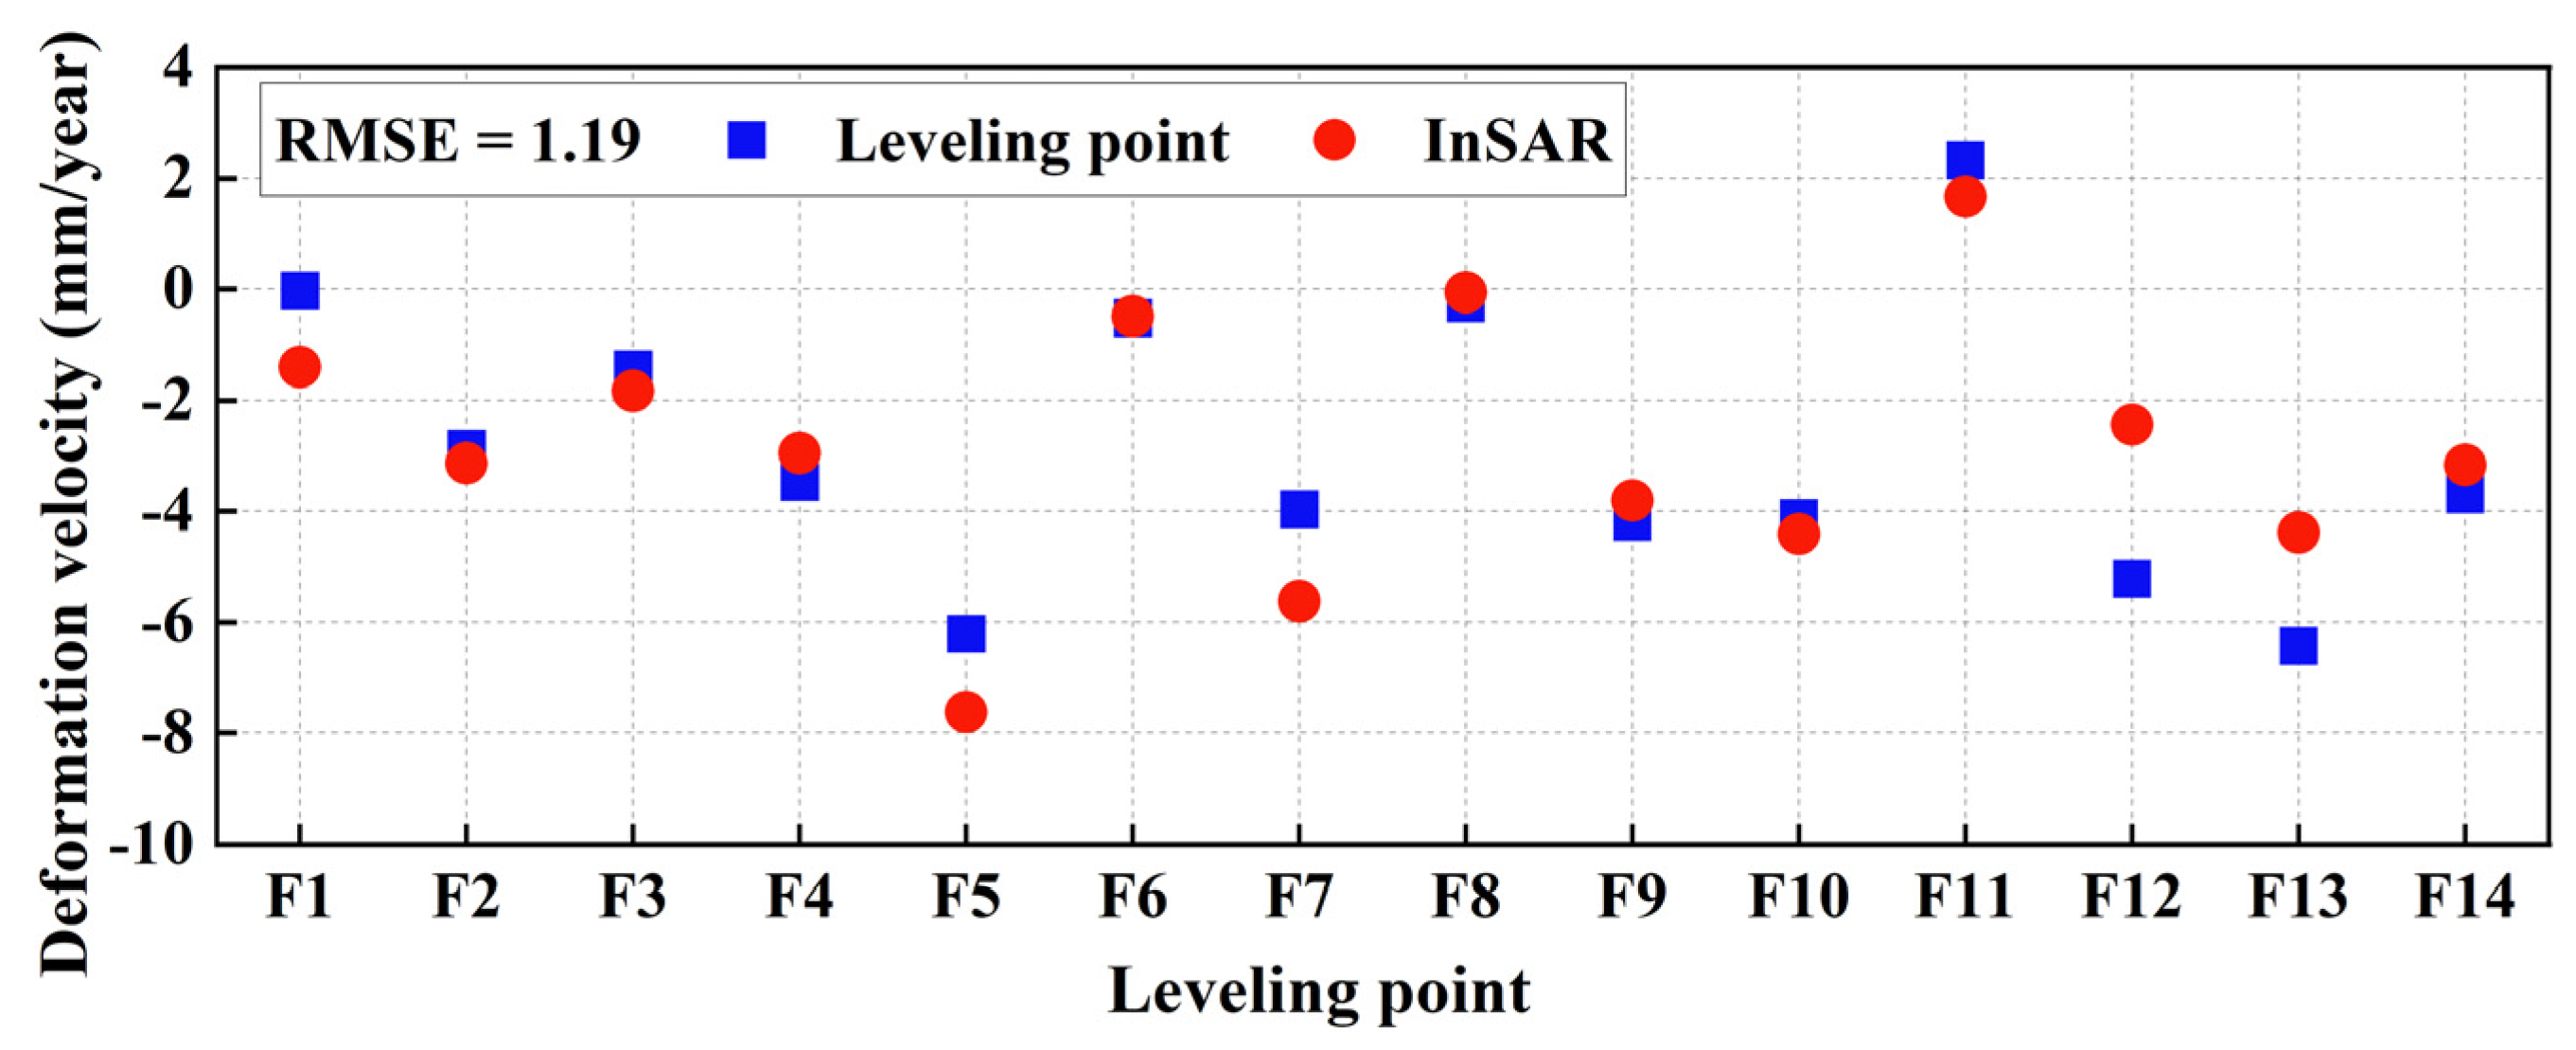
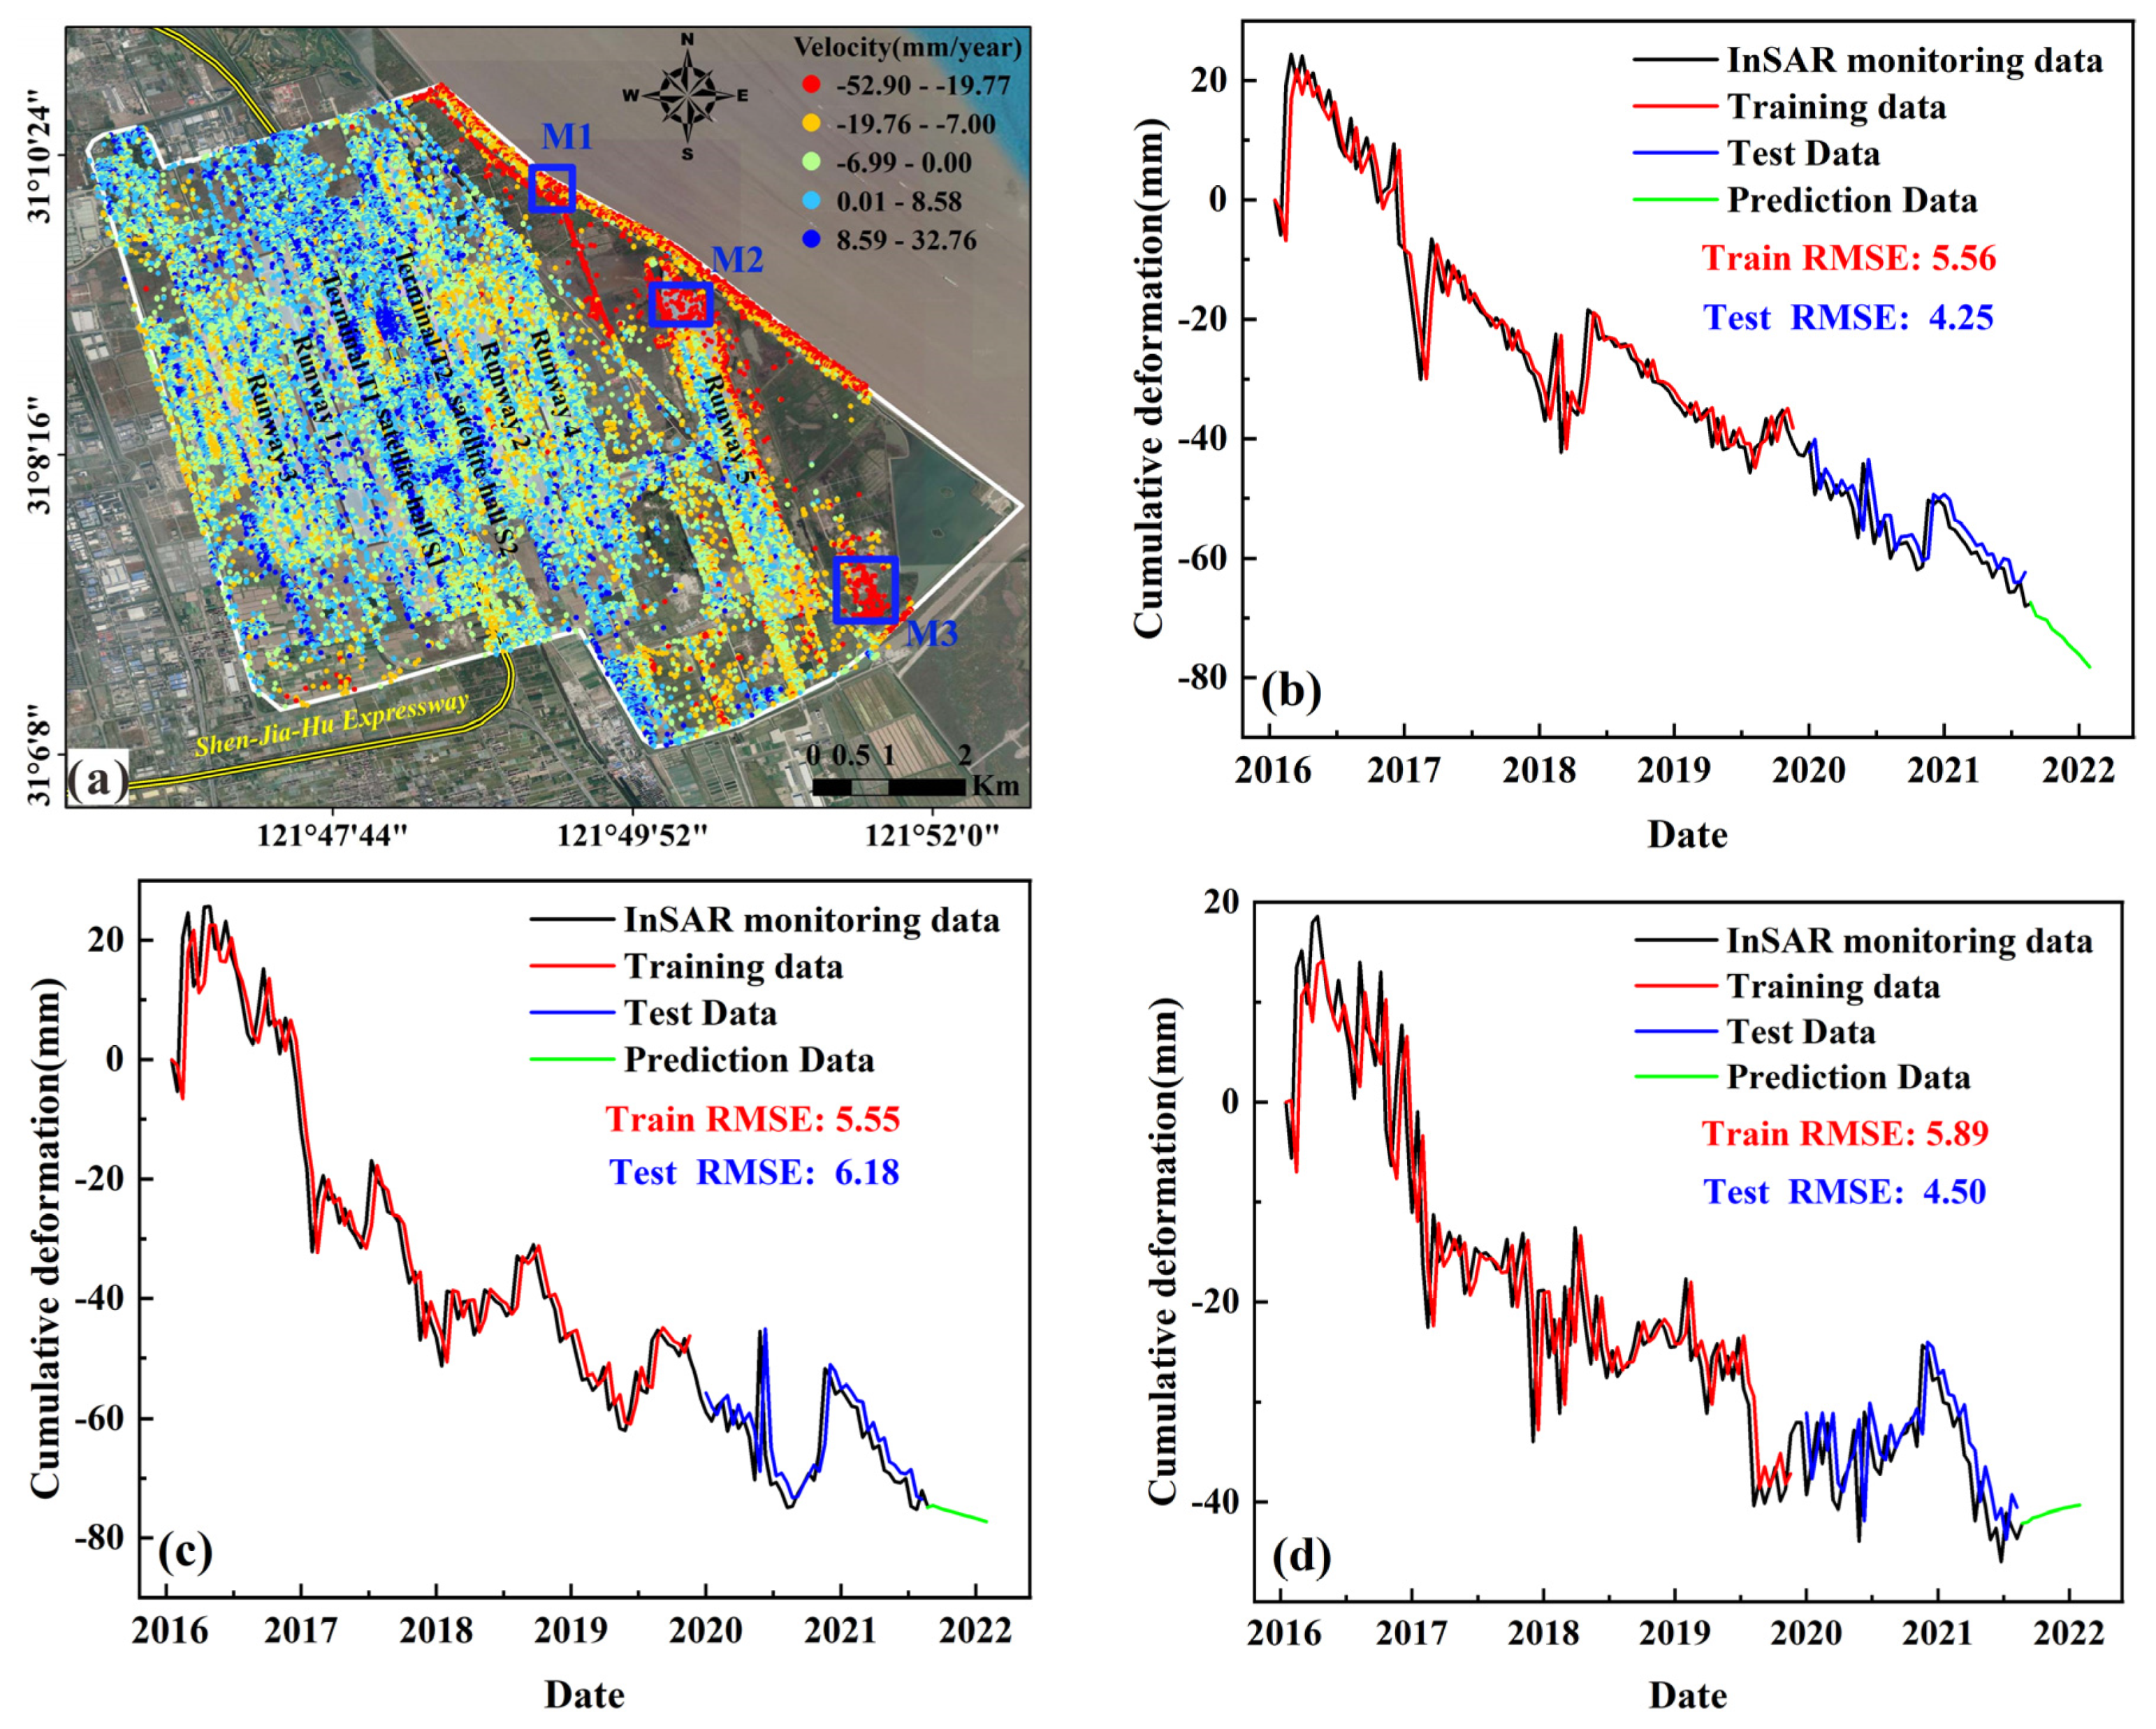
4.2. Accuracy Validation
5. Discussion
5.1. SPIA Ground Deformation Prediction
5.2. Correlation Analysis of Ground Deformation with Reclamation Time and Airport Construction
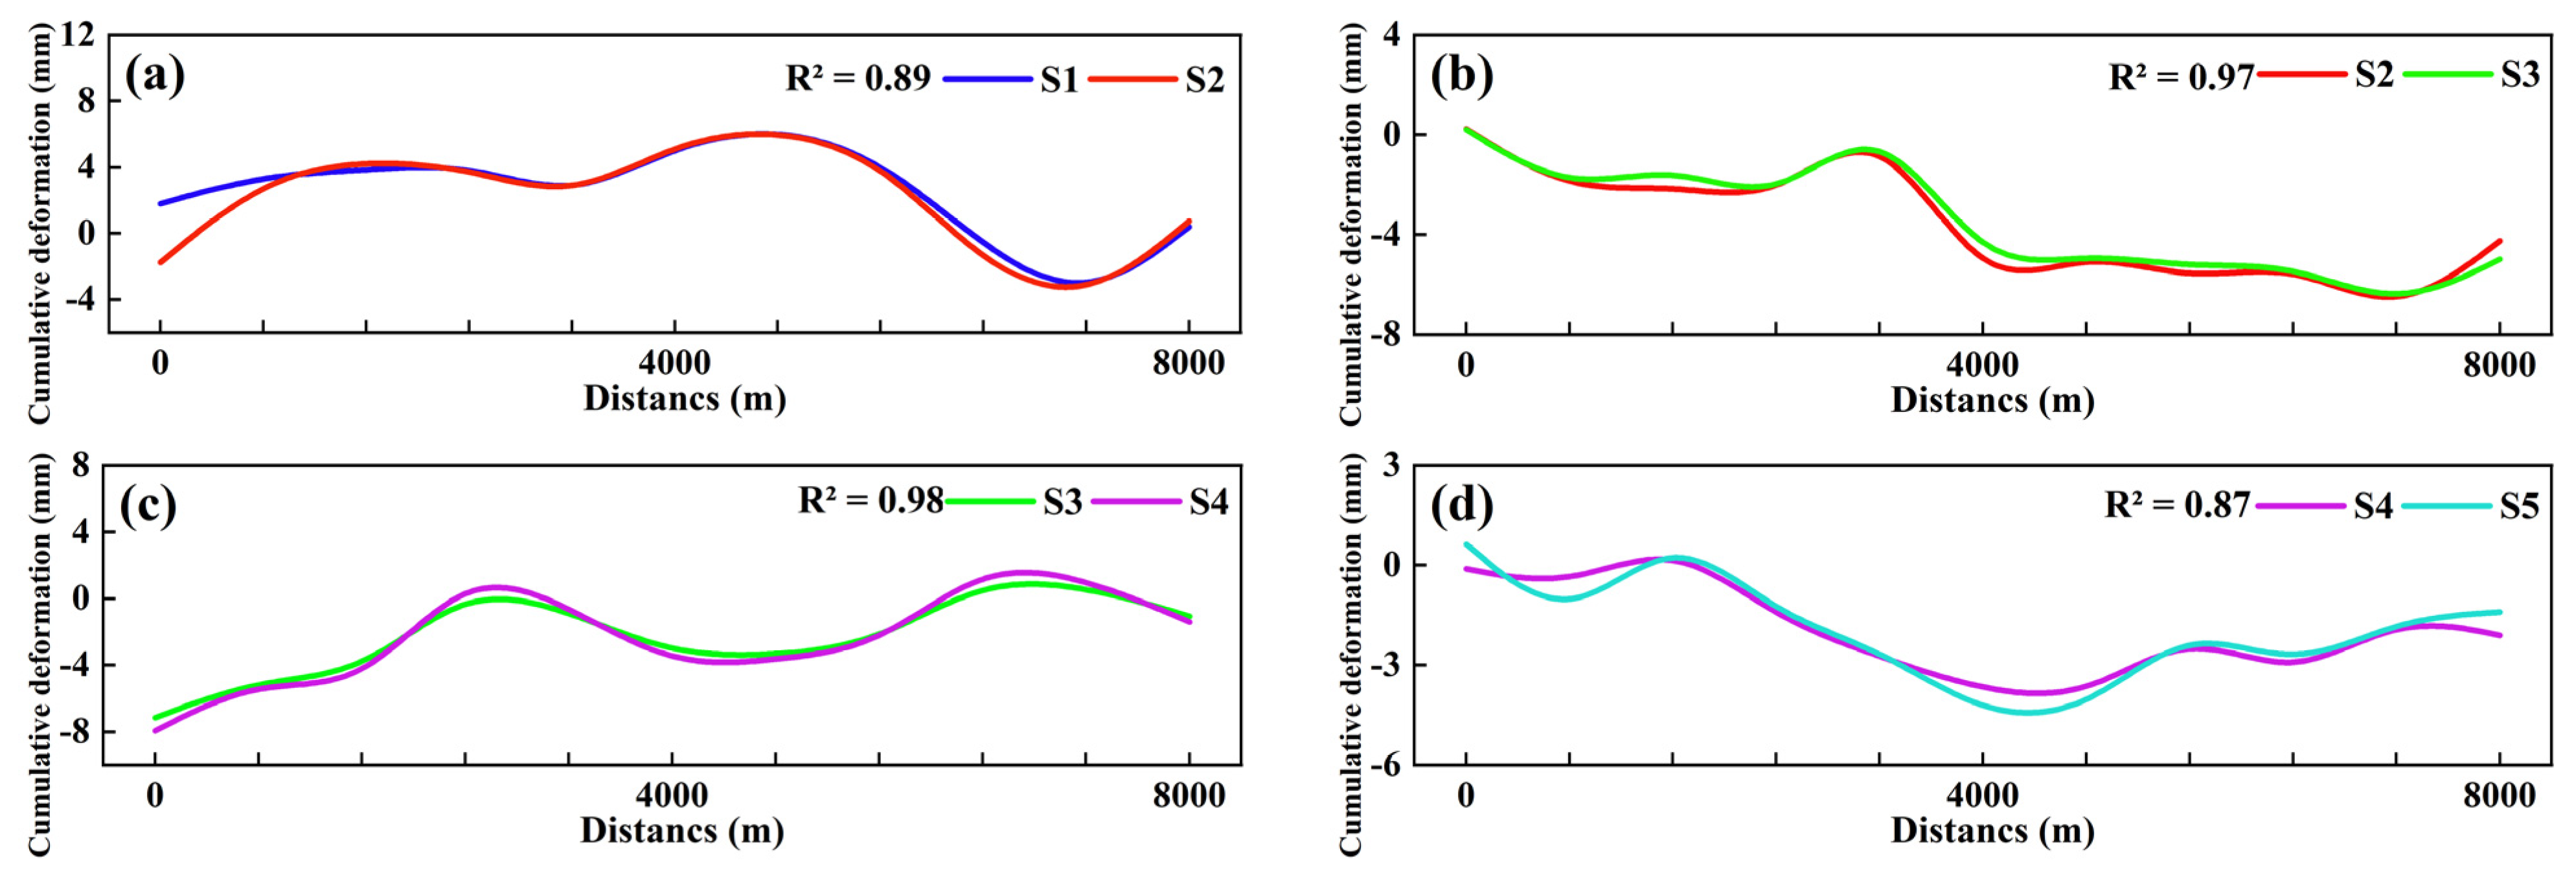
5.3. SPIA Deformation Pattern Analysis
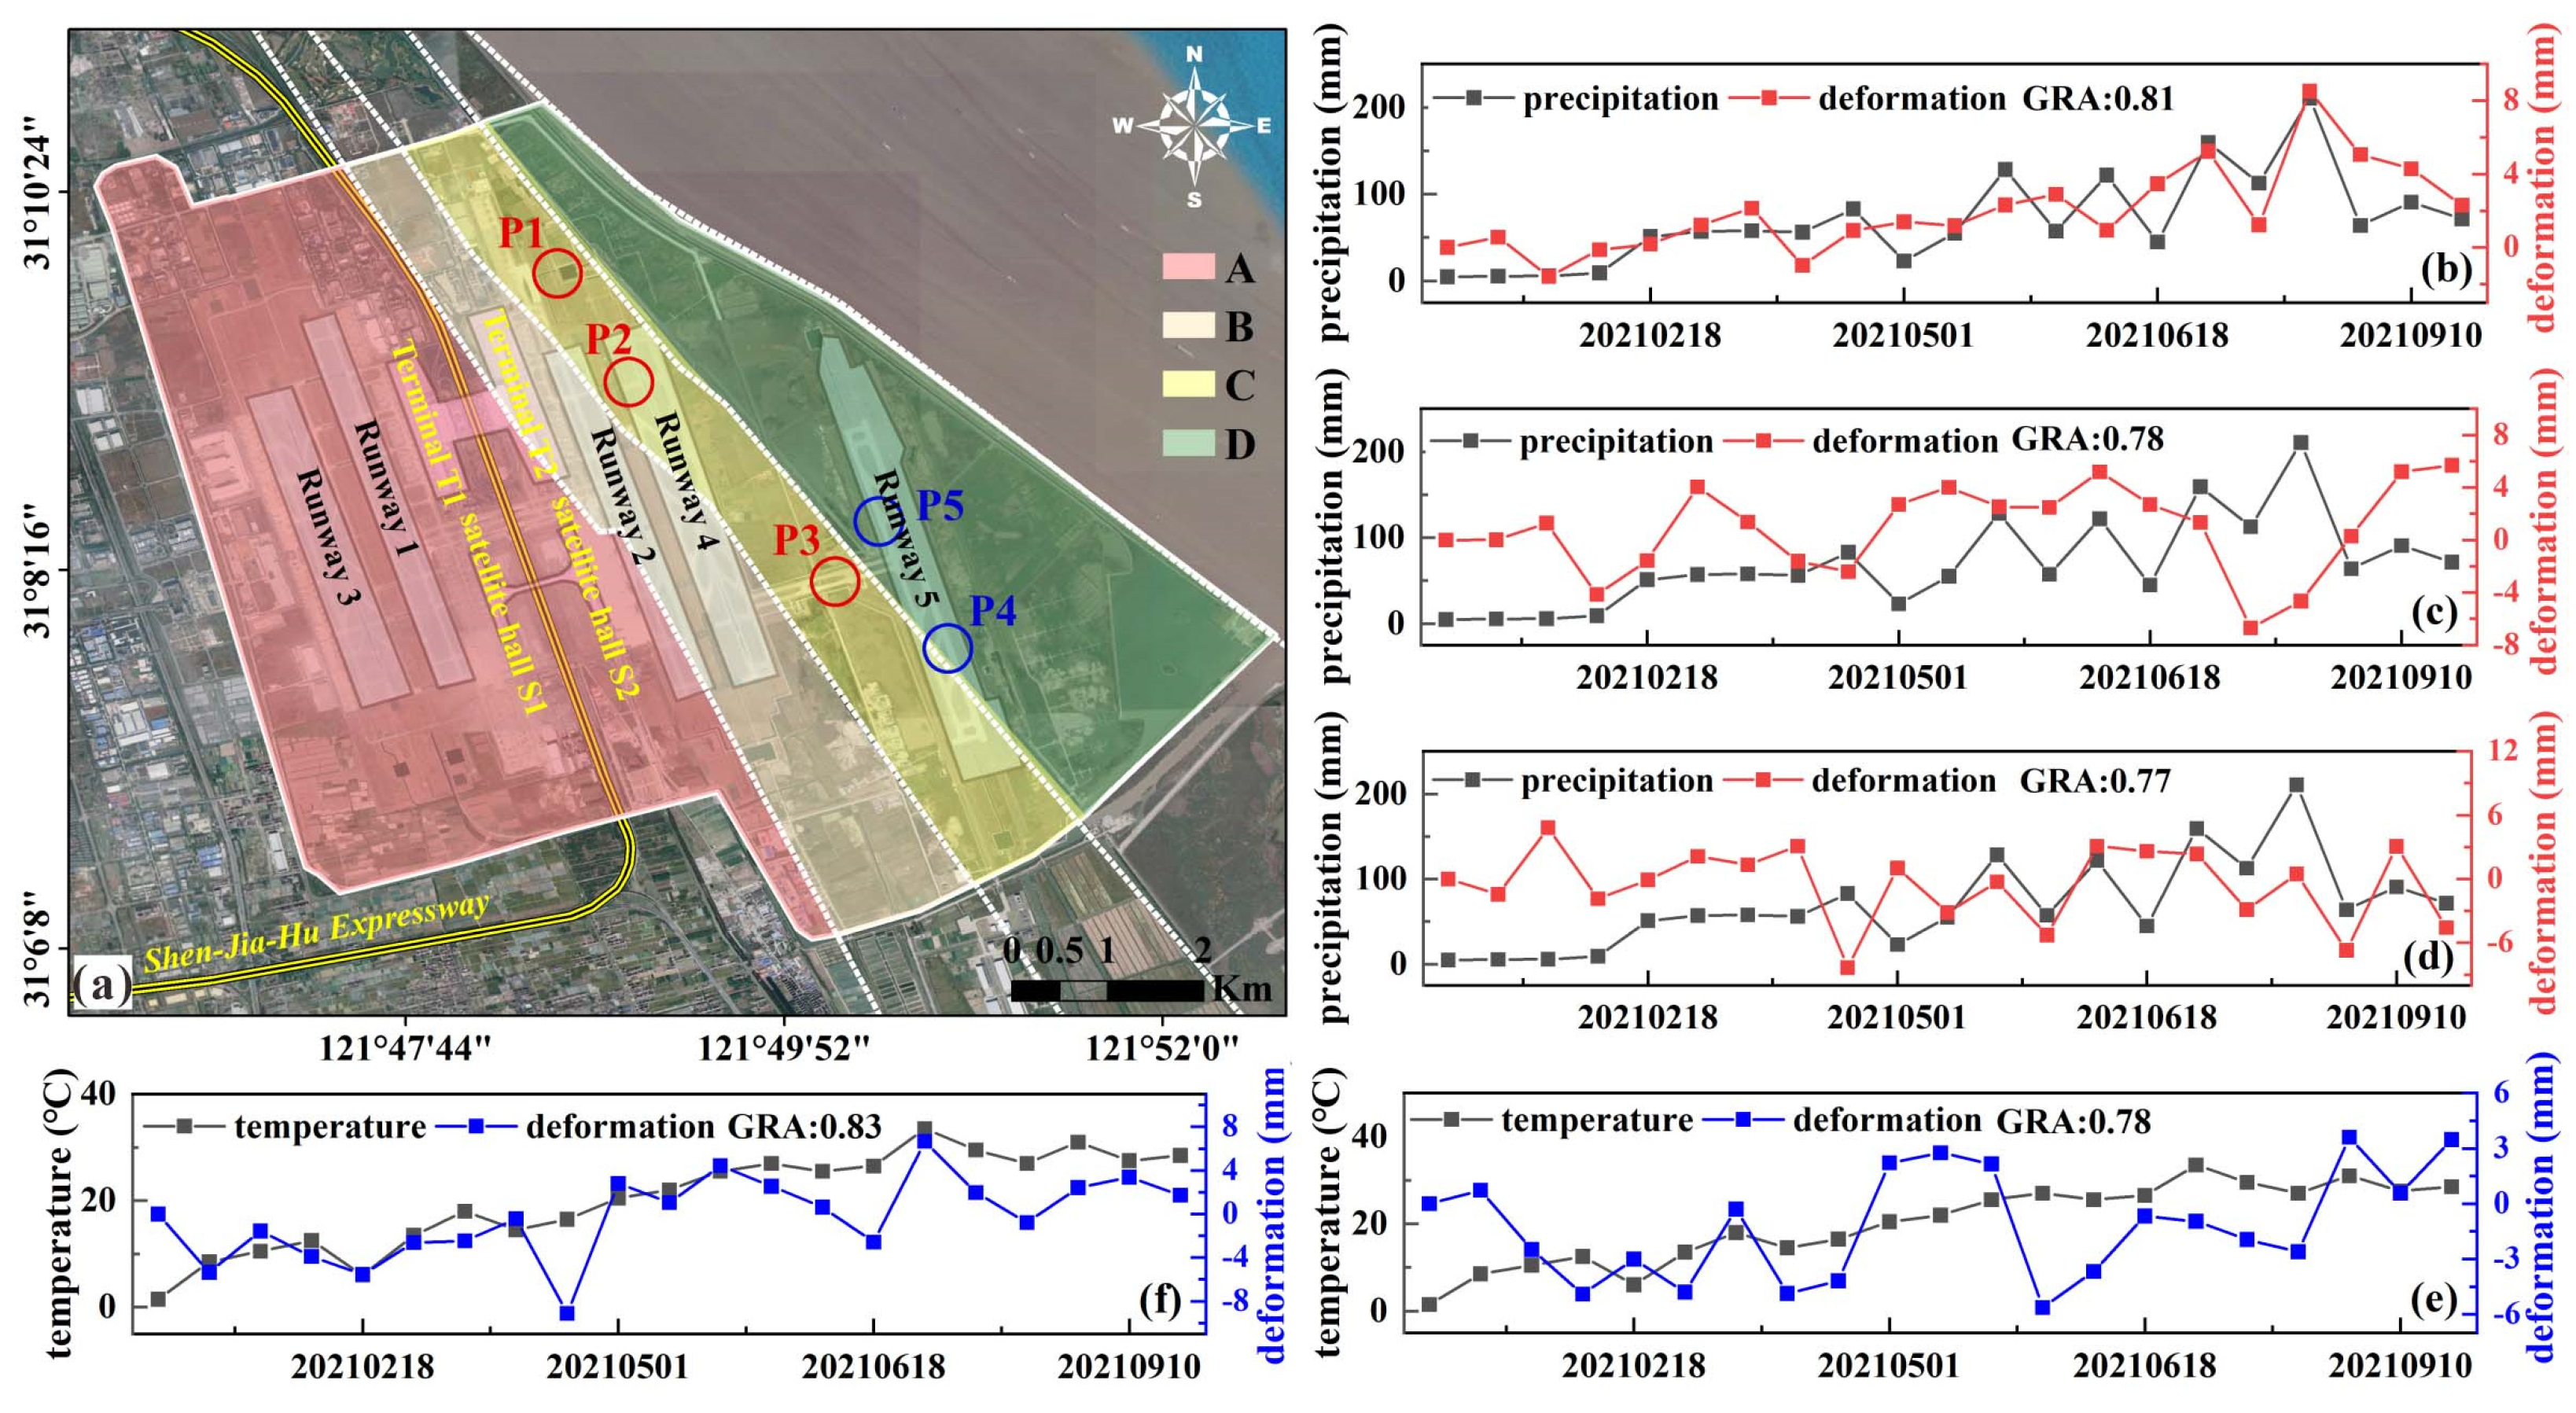
5.4. Effects of Precipitation and Temperature on Ground Deformation
5.5. Recommendations and Strategies for Ground Deformation at Reclamation Airports
6. Conclusions
Author Contributions
Funding
Data Availability Statement
Acknowledgments
Conflicts of Interest
References
- Ma, Z.; Melville, D.S.; Liu, J.; Chen, Y.; Yang, H.; Ren, W.; Zhang, Z.; Piersma, T.; Li, B. Rethinking China’s new great wall. Science 2014, 346, 912–914. [Google Scholar] [CrossRef] [PubMed] [Green Version]
- Sengupta, D.; Chen, R.; Meadows, M.E. Building beyond land: An overview of coastal land reclamation in 16 global megacities. Appl. Geogr. 2018, 90, 229–238. [Google Scholar] [CrossRef]
- Martín Antón, M.; Negro, V.; del Campo, J.M.; López-Gutiérrez, J.S.; Esteban, M.D. Review of coastal land reclamation situation in the world. J. Coast. Res. 2016, 667–671. [Google Scholar] [CrossRef]
- Wu, S.; Yang, Z.; Ding, X.; Zhang, B.; Zhang, L.; Lu, Z. Two decades of settlement of hong kong international airport measured with multi-temporal InSAR. Remote Sens. Environ. 2020, 248, 111976. [Google Scholar] [CrossRef]
- Sheng, N.; Tang, U.W.; Grydehøj, A. Urban morphology and urban fragmentation in Macau, China: Island city development in the Pearl River Delta megacity region. Isl. Stod. J. 2017, 12, 199–212. [Google Scholar] [CrossRef]
- Jiang, Y.; Liao, M.; Wang, H.; Zhang, L.; Balz, T. Deformation monitoring and analysis of the geological environment of Pudong international airport with persistent scatterer SAR interferometry. Remote Sens. 2016, 8, 1021. [Google Scholar] [CrossRef] [Green Version]
- Yu, L.; Yang, T.; Zhao, Q.; Pepe, A.; Dong, H.; Sun, Z. Residual settlements detection of ocean reclaimed lands with multi-platform SAR time series and SBAS technique: A case study of Shanghai Pudong International Airport. In Proceedings of the Remote Sensing and Modeling of Ecosystems for Sustainability XIV, San Diego, CA, USA, 1 September 2017; p. 104050X. [Google Scholar]
- Zheng, L.; Zhu, L.; Wang, W.; Guo, L.; Chen, B. Land subsidence related to coal mining in China revealed by L-band InSAR analysis. Int. J. Environ. Res. Public Health 2020, 17, 1170. [Google Scholar] [CrossRef] [Green Version]
- Xiang, W.; Zhang, R.; Liu, G.; Wang, X.; Mao, W.; Zhang, B.; Fu, Y.; Wu, T. Saline-Soil Deformation Extraction Based on an Improved Time-Series InSAR Approach. ISPRS Int. J. Geo-Inf. 2021, 10, 112. [Google Scholar] [CrossRef]
- Liu, G.; Jia, H.; Zhang, R.; Zhang, H.; Jia, H.; Yu, B.; Sang, M. Exploration of subsidence estimation by persistent scatterer InSAR on time series of high resolution TerraSAR-X images. IEEE J. Sel. Top. Appl. Earth Obs. Remote Sens. 2010, 4, 159–170. [Google Scholar] [CrossRef]
- Xue, F.; Lv, X.; Chai, H.; Huang, H. Application of particle swarm optimization to the estimation of the TSInSAR deformation parameter. Remote Sens. Lett. 2019, 10, 756–765. [Google Scholar] [CrossRef]
- Karamvasis, K.; Karathanassi, V. Performance Analysis of Open Source Time Series InSAR Methods for Deformation Monitoring over a Broader Mining Region. Remote Sens. 2020, 12, 1380. [Google Scholar] [CrossRef]
- Liu, G.; Jia, H.; Nie, Y.; Li, T.; Zhang, R.; Yu, B.; Li, Z. Detecting subsidence in coastal areas by ultrashort-baseline TCPInSAR on the time series of high-resolution TerraSAR-X images. IEEE Trans. Geosci. Remote Sens. 2013, 52, 1911–1923. [Google Scholar] [CrossRef]
- Hooper, A.; Zebker, H.; Segall, P.; Kampes, B. A new method for measuring deformation on volcanoes and other natural terrains using InSAR persistent scatterers. Geophys. Res. Lett. 2004, 31, L23611. [Google Scholar] [CrossRef]
- Hooper, A.; Bekaert, D.; Spaans, K.; Arıkan, M. Recent advances in SAR interferometry time series analysis for measuring crustal deformation. Tectonophysics 2012, 514, 1–13. [Google Scholar] [CrossRef]
- Ma, G.; Zhao, Q.; Wang, Q.; Liu, M. On the effects of InSAR temporal decorrelation and its implications for land cover classification: The case of the ocean-reclaimed lands of the Shanghai megacity. Sensors 2018, 18, 2939. [Google Scholar] [CrossRef] [Green Version]
- Qiao, G.; Mi, H.; Wang, W.; Tong, X.; Li, Z.; Li, T.; Liu, S.; Hong, Y. 55-year (1960–2015) spatiotemporal shoreline change analysis using historical DISP and Landsat time series data in Shanghai. Int. J. Appl. Earth Obs. Geoinf. 2018, 68, 238–251. [Google Scholar] [CrossRef]
- Miao, L.; Deng, K.; Feng, G.; Li, K.; Xiong, Z.; Wang, Y.; He, S. Reclaimed-Airport Surface-Deformation Monitoring by Improved Permanent-Scatterer Interferometric Synthetic-Aperture Radar: A Case Study of Shenzhen Bao’an International Airport, China. Photogramm. Eng. Remote Sens. 2021, 87, 105–116. [Google Scholar] [CrossRef]
- Zhao, Q.; Lin, H.; Gao, W.; Zebker, H.A.; Chen, A.; Yeung, K. InSAR detection of residual settlement of an ocean reclamation engineering project: A case study of Hong Kong International Airport. J. Oceanogr. 2011, 67, 415–426. [Google Scholar] [CrossRef]
- Pitcher, L.H.; Smith, L.C.; Gleason, C.J.; Yang, K. CryoSheds: A GIS modeling framework for delineating land-ice watersheds for the Greenland ice sheet. GISci. Remote Sens. 2016, 53, 707–722. [Google Scholar] [CrossRef]
- Ye, S.; Luo, Y.; Wu, J.; Yan, X.; Wang, H.; Jiao, X.; Teatini, P. Three-dimensional numerical modeling of land subsidence in Shanghai, China. Hydrol. J. 2016, 24, 695–709. [Google Scholar] [CrossRef]
- Li, Y.; Zuo, X.; Ma, Y.; Xiong, P.; Yany, F. Surface subsidence monitoring and prediction based on PS-InSAR technology and genetic neural network algorithm. Prog. Geophys. 2020, 35, 845–851. [Google Scholar]
- Chen, Y.; He, Y.; Zhang, L.; Chen, Y.; Pu, H.; Chen, B.; Gao, L. Prediction of InSAR deformation time-series using a long short-term memory neural network. Int. J. Remote Sens. 2021, 42, 6919–6942. [Google Scholar] [CrossRef]
- Ding, Q.; Shao, Z.; Huang, X.; Altan, O.; Zhuang, Q.; Hu, B. Monitoring, analyzing and predicting urban surface subsidence: A case study of Wuhan City, China. Int. J. Appl. Earth Obs. Geoinf. 2021, 102, 102422. [Google Scholar] [CrossRef]
- Liu, Q.; Zhang, Y.; Deng, M.; Wu, H.; Kang, Y.; Wei, J. Time series prediction method of large-scale surface subsidence based on deep learning. Acta Geod. Cartogr. Sin. 2021, 50, 396–404. [Google Scholar]
- Wang, S. Analysis of Financial Statements—Shanghai Airport as an Example. Ind. Technol. Forum 2021, 20, 82–83. [Google Scholar]
- The Silver Gull Spreads Its Wings, the Blue Sky Is Connected with the Yellow earth, and the Scenery and Services Are Beautiful Together. Available online: http://shanghai.xinmin.cn/msrx/2017/09/10/31271572.html (accessed on 10 January 2022).
- Deciphering the “Code” of Pudong Airport II. Available online: http://news.sina.com.cn/c/2006-01-18/11308902649.shtml (accessed on 10 January 2022).
- Wang, R.; Yang, T.; Yang, M.; Liao, M.; Lin, J.; Zhang, L. Attribution Analysis on Deformation Feature of the ShanghaiElevated Highway by Persistent Scatterer SAR Interferometry. Geomat. Inf. Sci. Wuhan Univ. 2018, 43, 2050–2057. [Google Scholar]
- Hooper, A. Persistent scatterer InSAR for crustal deformation analysis, with application to Volcán Alcedo, Galápagos. J. Geophys. Res. B 2007, 112, 1–19. [Google Scholar] [CrossRef] [Green Version]
- Sun, H.; Zhang, Q.; Zhao, C.; Yang, C.; Sun, Q.; Chen, W. Monitoring land subsidence in the southern part of the lower Liaohe plain, China with a multi-track PS-InSAR technique. Remote Sens. Environ. 2017, 188, 73–84. [Google Scholar] [CrossRef] [Green Version]
- Ferretti, A.; Prati, C.; Rocca, F. Permanent scatterers in SAR interferometry. IEEE Trans. Geosci. Remote Sens. 2001, 39, 8–20. [Google Scholar] [CrossRef]
- Dwivedi, R.; Varshney, P.; Tiwari, A.; Narayan, A.B.; Singh, A.K.; Dikshit, O.; Pallav, K. Monitoring of landslides in Nainital, Uttarakhand, India: Validation of PS-InSAR results. In Proceedings of the 2015 Joint Urban Remote Sensing Event (JURSE), Lausanne, Switzerland, 30 March–1 April 2015; pp. 1–4. [Google Scholar]
- Wei, L.; Guan, L.; Qu, L.; Guo, D. Prediction of Sea Surface Temperature in the China Seas Based on Long Short-Term Memory Neural Networks. Remote Sens. 2020, 12, 2697. [Google Scholar] [CrossRef]
- Yuan, Q.; Shen, H.; Li, T.; Li, Z.; Li, S.; Jiang, Y.; Xu, H.; Tan, W.; Yang, Q.; Wang, J. Deep learning in environmental remote sensing: Achievements and challenges. Remote Sens. Environ. 2020, 241, 111716. [Google Scholar] [CrossRef]
- Liu, Q.; Zhang, Y.; Wei, J.; Wu, H.; Deng, M. HLSTM: Heterogeneous Long Short-Term Memory Network for Large-Scale InSAR Ground Subsidence Prediction. IEEE J. Sel. Top. Appl. Earth Obs. Remote Sens. 2021, 14, 8679–8688. [Google Scholar] [CrossRef]
- Hochreiter, S.; Schmidhuber, J. Long short-term memory. Neural Comput. 1997, 9, 1735–1780. [Google Scholar] [CrossRef] [PubMed]
- Yang, M.; Yang, T.; Zhang, L.; Lin, J.; Qin, X.; Liao, M. Spatio-temporal characterization of a reclamation settlement in the Shanghai coastal area with time series analyses of X-, C-, and L-band SAR datasets. Remote Sens. 2018, 10, 329. [Google Scholar] [CrossRef] [Green Version]
- Schmidt, D.A.; Bürgmann, R. Time-dependent land uplift and subsidence in the Santa Clara valley, California, from a large interferometric synthetic aperture radar data set. J. Geophys. Res. Solid Earth 2003, 108. [Google Scholar] [CrossRef] [Green Version]
- Yu, L.; Yang, T.; Zhao, Q.; Liu, M.; Pepe, A. The 2015–2016 ground displacements of the Shanghai coastal area inferred from a combined COSMO-SkyMed/Sentinel-1 DInSAR analysis. Remote Sens. 2017, 9, 1194. [Google Scholar] [CrossRef] [Green Version]
- Liu, D. Settlement Deformation Characteristics of Soft Soil and Its Control Measures of the Four Runway of Pudong Airport. Ph.D. Thesis, China University of Mining & Technology, Beijing, China, 2018. [Google Scholar]
- Kingma, D.P.; Ba, J. Adam: A method for stochastic optimization. arXiv 2014, arXiv:1412.6980. [Google Scholar]
- Chai, J.C.; Shen, S.L.; Zhu, H.H.; Zhang, X.L. 1D analysis of land subsidence in Shanghai. Lowl. Technol. Int. 2005, 7, 33–41. [Google Scholar]
- Hong, Z.S.; Zeng, L.L.; Cui, Y.J.; Cai, Y.Q.; Lin, C. Compression behaviour of natural and reconstituted clays. Géotechnique 2012, 62, 291–301. [Google Scholar] [CrossRef] [Green Version]
- Stamatopoulos, C.; Petridis, P.; Parcharidis, I.; Foumelis, M. A method predicting pumping-induced ground settlement using back-analysis and its application in the Karla region of Greece. Nat. Hazards 2018, 92, 1733–1762. [Google Scholar] [CrossRef]
- Ortiz-Zamora, D.; Ortega-Guerrero, A. Evolution of long-term land subsidence near Mexico City: Review, field investigations, and predictive simulations. Water Resour. Res. 2010, 46. [Google Scholar] [CrossRef]
- Lanari, R.; Berardino, P.; Bonano, M.; Casu, F.; Manconi, A.; Manunta, M.; Manzo, M.; Pepe, A.; Pepe, S.; Sansosti, E. Surface displacements associated with the L’Aquila 2009 Mw 6.3 earthquake (central Italy): New evidence from SBAS-DInSAR time series analysis. Geophys. Res. Lett. 2010, 37. [Google Scholar] [CrossRef]
- Al-Barwani, H.; Purnama, A. Re-assessing the impact of desalination plants brine discharges on eroding beaches. Desalination 2007, 204, 94–101. [Google Scholar] [CrossRef]
- Douglas, I.; Lawson, N. Airport construction: Materials use and geomorphic change. J. Air Transp. Manag. 2003, 9, 177–185. [Google Scholar] [CrossRef]
- Shen, S. Geological environmental character of Lin-Gang new city and its influences to the construction. Shanghai Geol. 2008, 1. [Google Scholar]
- Terzaghi, K.; Peck, R.B.; Mesri, G. Soil Mechanics in Engineering Practice; John Wiley & Sons: Hoboken, NJ, USA, 1996. [Google Scholar]
- Crosetto, M.; Monserrat, O.; Cuevas-González, M.; Devanthéry, N.; Crippa, B. Analysis of X-Band Very High Resolution Persistent Scatterer Interferometry Data Over Urban Areas. In Proceedings of the ISPRS—International Archives of the Photogrammetry, Remote Sensing and Spatial Information Sciences, Hannover, Germany, 1–24 May 2013; pp. 21–24. [Google Scholar]
- Crosetto, M.; Monserrat, O.; Cuevas-González, M.; Devanthéry, N.; Luzi, G.; Crippa, B. Measuring thermal expansion using X-band persistent scatterer interferometry. ISPRS J. Photogramm. Remote Sens. 2015, 100, 84–91. [Google Scholar] [CrossRef] [Green Version]
- Chen, J.; Wu, J.; Zhang, L.; Zou, J.; Liu, G.; Zhang, R.; Yu, B. Deformation trend extraction based on multi-temporal InSAR in Shanghai. Remote Sens. 2013, 5, 1774–1786. [Google Scholar] [CrossRef] [Green Version]
- Wang, H. The Risk Assessment System and RiskManagement of Land Subsidence in Shanghai. Ph.D. Thesis, Shanghai University, Shanghai, China, 2013. [Google Scholar]
- Yue, L.; Shujun, Y.; Jichun, W.; Xun, J.; Hanmei, W. Characterization of land subsidence during recovery of groundwater levels in Shanghai. Geol. J. China Univ. 2015, 21, 243. [Google Scholar]
- Lorenzo-Lacruz, J.; Garcia, C.; Morán-Tejeda, E. Groundwater level responses to precipitation variability in Mediterranean insular aquifers. J. Hydrol. 2017, 552, 516–531. [Google Scholar] [CrossRef]
- Qi, P.; Zhang, G.; Xu, Y.J.; Wang, L.; Ding, C.; Cheng, C. Assessing the influence of precipitation on shallow groundwater table response using a combination of singular value decomposition and cross-wavelet approaches. Water 2018, 10, 598. [Google Scholar] [CrossRef] [Green Version]
- Yi, P.; Dong, Q.; Li, W.; Wang, L. Measurement of city sustainability based on the grey relational analysis: The case of 15 sub-provincial cities in China. Sustain. Cities Soc. 2021, 73, 103143. [Google Scholar] [CrossRef]
- Kishore, R.A.; Bianchi, M.V.; Booten, C.; Vidal, J.; Jackson, R. Enhancing building energy performance by effectively using phase change material and dynamic insulation in walls. Appl. Energy 2021, 283, 116306. [Google Scholar] [CrossRef]
- Qin, Y.; Perissin, D. Monitoring ground subsidence in Hong Kong via spaceborne Radar: Experiments and validation. Remote Sens. 2015, 7, 10715–10736. [Google Scholar] [CrossRef] [Green Version]


| Parameter/Groups | S1 | S2 | S3 | S4 | S5 | |||||
|---|---|---|---|---|---|---|---|---|---|---|
| Acquisition dates | 20161006–20171001 | 20170919–20181101 | 20181020–20191214 | 20191201–20210113 | 20210101–20210922 | |||||
| Repeat data | 20170919–20171001 | 20181020–20181101 | 20191202–20191214 | 2021010–20210113 | ||||||
| Imaging Mode | Interferometric wide swath mode (IW) | |||||||||
| Swath | 250 km | |||||||||
| Ground resolution | 20 m | |||||||||
| Polarization | Vertical polarization (VV) | |||||||||
| Orbit number | 171 | |||||||||
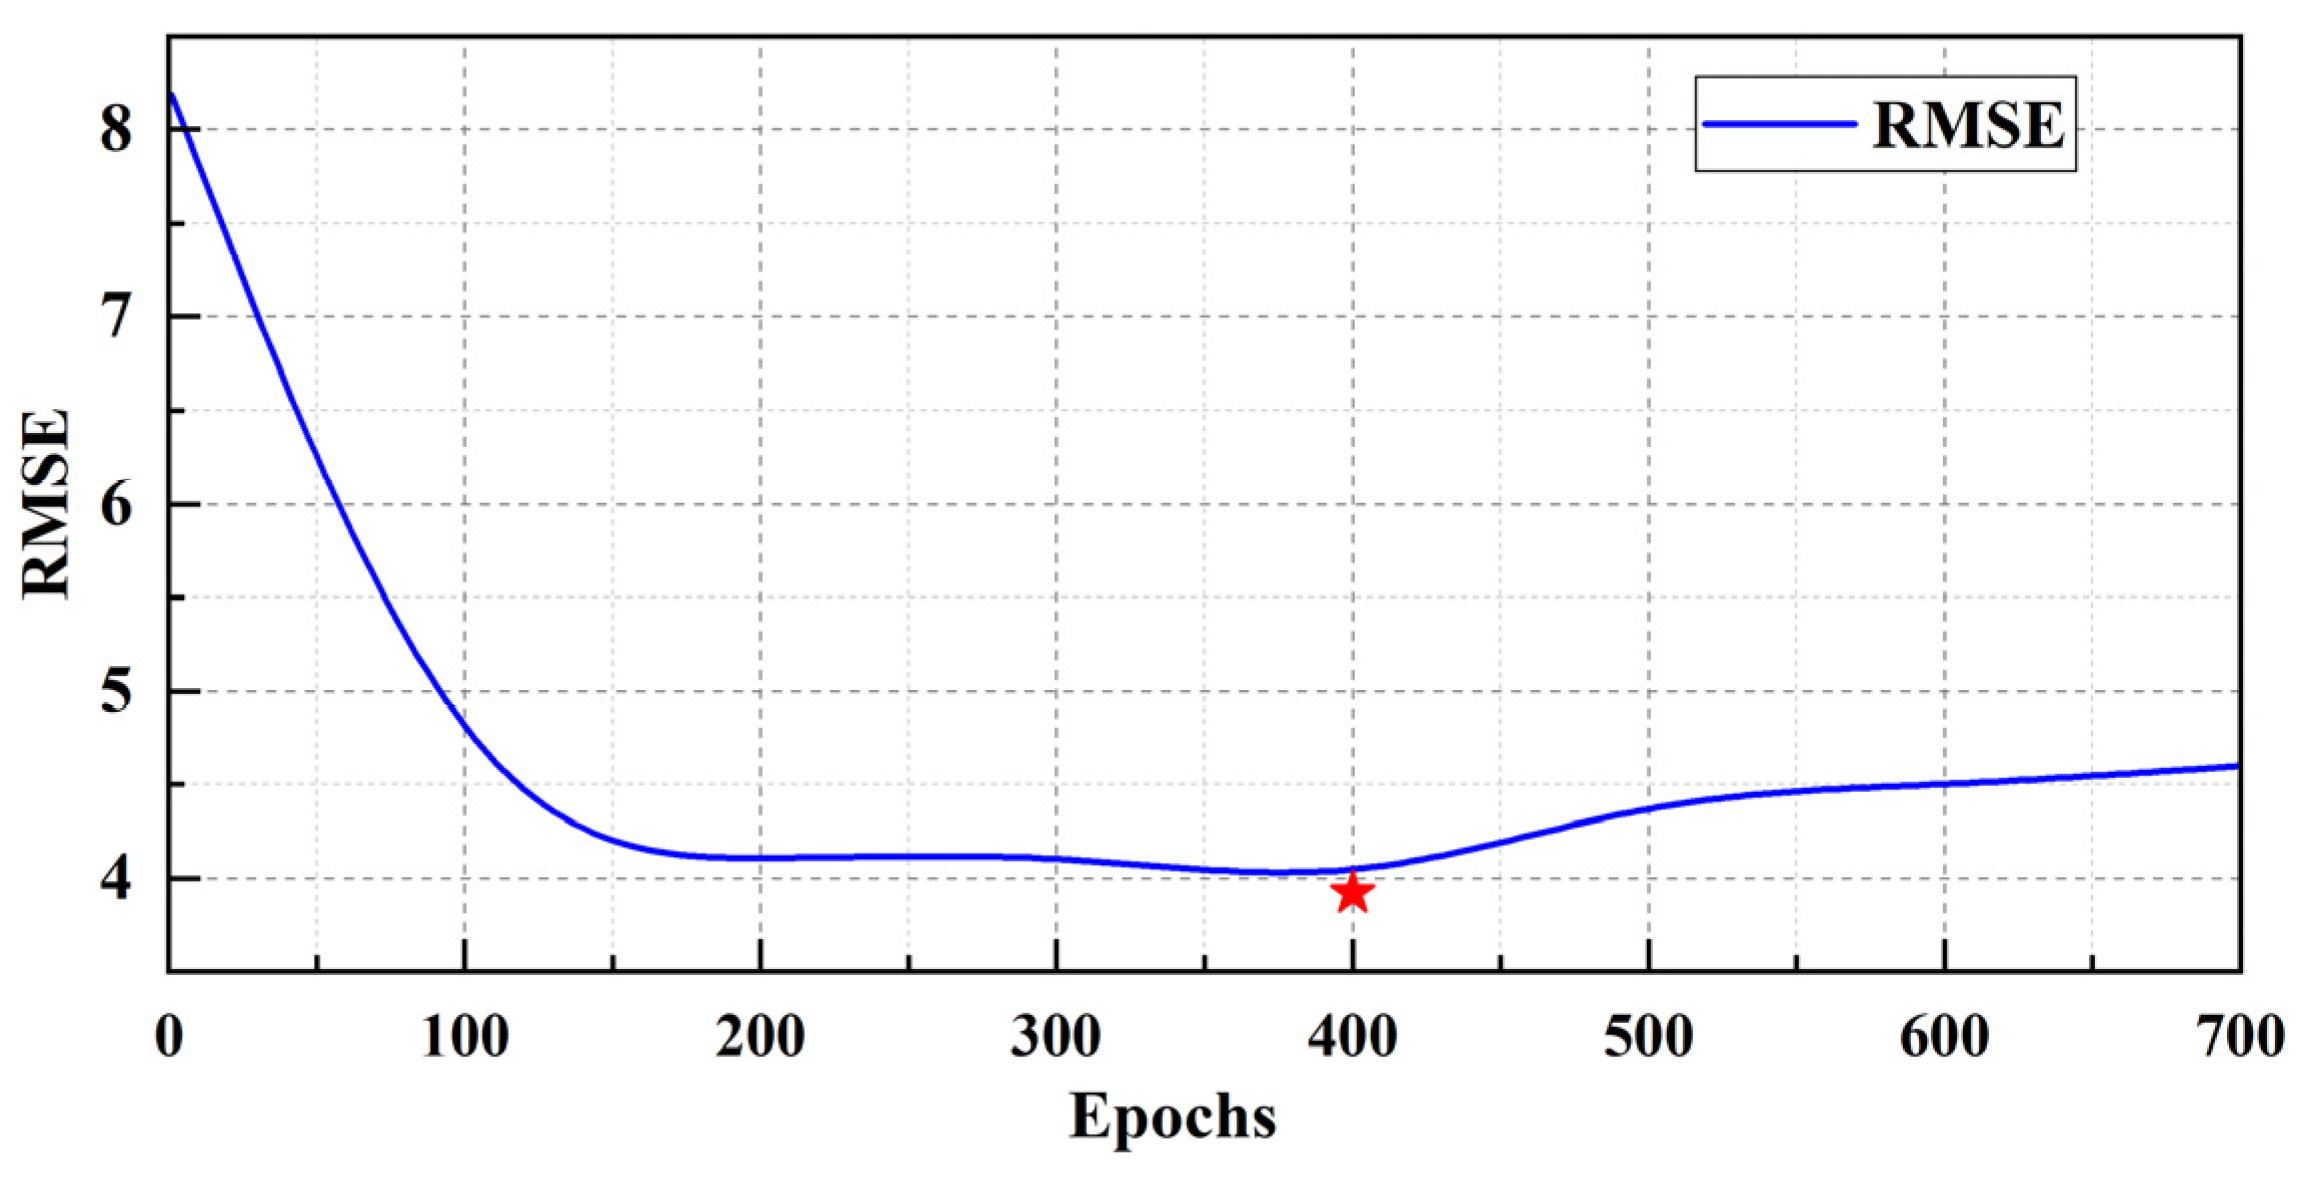
| Hyper Parameter | Training Data | Testing Data | Layers of LSTM | Nodes in the Hidden Layer | Optimizer Ware | Loss Function | Epochs |
|---|---|---|---|---|---|---|---|
| Value setting | 70% | 30% | 3 | 12 | ADAM | MSE | 200 |
Publisher’s Note: MDPI stays neutral with regard to jurisdictional claims in published maps and institutional affiliations. |
© 2022 by the authors. Licensee MDPI, Basel, Switzerland. This article is an open access article distributed under the terms and conditions of the Creative Commons Attribution (CC BY) license (https://creativecommons.org/licenses/by/4.0/).
Share and Cite
Bao, X.; Zhang, R.; Shama, A.; Li, S.; Xie, L.; Lv, J.; Fu, Y.; Wu, R.; Liu, G. Ground Deformation Pattern Analysis and Evolution Prediction of Shanghai Pudong International Airport Based on PSI Long Time Series Observations. Remote Sens. 2022, 14, 610. https://doi.org/10.3390/rs14030610
Bao X, Zhang R, Shama A, Li S, Xie L, Lv J, Fu Y, Wu R, Liu G. Ground Deformation Pattern Analysis and Evolution Prediction of Shanghai Pudong International Airport Based on PSI Long Time Series Observations. Remote Sensing. 2022; 14(3):610. https://doi.org/10.3390/rs14030610
Chicago/Turabian StyleBao, Xin, Rui Zhang, Age Shama, Song Li, Lingxiao Xie, Jichao Lv, Yin Fu, Renzhe Wu, and Guoxiang Liu. 2022. "Ground Deformation Pattern Analysis and Evolution Prediction of Shanghai Pudong International Airport Based on PSI Long Time Series Observations" Remote Sensing 14, no. 3: 610. https://doi.org/10.3390/rs14030610
APA StyleBao, X., Zhang, R., Shama, A., Li, S., Xie, L., Lv, J., Fu, Y., Wu, R., & Liu, G. (2022). Ground Deformation Pattern Analysis and Evolution Prediction of Shanghai Pudong International Airport Based on PSI Long Time Series Observations. Remote Sensing, 14(3), 610. https://doi.org/10.3390/rs14030610