Article

Assessing Railway Landscape by AHP Process with GIS: A Study of the Yunnan-Vietnam Railway

by
Kun Sang
1,
Giovanni Luigi Fontana
2 and
Silvia Elena Piovan
2,*
1
Department of Advertising, Xiamen University Malaysia, Sepang 43900, Malaysia
2
Department of Historical and Geographical Sciences and the Ancient World, University of Padua, 35141 Padua, Italy
*
Author to whom correspondence should be addressed.
Remote Sens. 2022, 14(3), 603; https://doi.org/10.3390/rs14030603
Submission received: 22 December 2021 / Revised: 20 January 2022 / Accepted: 20 January 2022 / Published: 27 January 2022
(This article belongs to the Special Issue Application of GIS, BIM and Linked Digitisations in Urban Heritage)

Abstract

:
Landscape quality is a crucial factor for the heritage attractiveness of tourism, allowing tourists to experience both natural and cultural aspects along railway journeys. Moreover, railway landscape is a comprehensive system that defines the landscape observed and perceived by passengers and is characterized by the diversity and continuity of the train’s movement. Yunnan-Vietnam railway (YVR) heritage is the research object of this research, whose area encompasses various landscape types and heritage sites, providing great landscape enjoyment. Currently, the assessment methods specifically for railway landscape have been discussed less than for other landscape types, especially for a series of large linear sites like the YVR. To evaluate the value of railway heritage landscape along the railway, this paper proposes a methodology combining the Analytic Hierarchy Process (AHP), Delphi method, and GIS as an integrated spatial assessment. Creatively, this paper seeks to: (1) discuss the relationship between railway and landscape; (2) build a comprehensive evaluation system for the railway heritage landscape, covering the topics of history, tourism, ecology, heritage, social-culture, and visual quality; (3) quantify the landscape value of the YVR areas. Thus, the results of this research can be useful to future urban planning, development, and policymaking.

Graphical Abstract

1. Introduction

Landscape is an interdisciplinary research object, which is defined differently in various fields and can be perceived differently by individuals. It refers to the appearance of areas on the Earth that can be viewed because of a synthesis of people and the land of livings [1]. The quality of landscape lies in its construction, integrity, diversity, aesthetics, and environmental quality [2], which implies that landscape should be understood as a system within a wide environmental scale, not as isolated features [3]. With the emergence of steam trains, the railway became a bearer of both industrial and technological achievements in modern history, its construction having both positive and negative impacts on the landscape and environment [4,5]. The relationship between railway and landscape has been transited from opposition to integration as the human appreciation of landscape has changed. In the early days of its invention, as a large industrial machine of noise and pollution, the train/railway was in conflict with the concept of “picturesque,” when the landscape aesthetic was tied closely to nature and wildness. At the same time, the early experience with the train was described as “unpleasant, anxious, and fearful” [6]. As time went by, with the publicity of railway through travel literature and other advertisements, people began to accept it as a daily medium for transportation, and the attractiveness of railway travel also increased. The new spatiotemporal network of railway unsettled the understanding of time and space. In the twentieth century, railway elements, including rail, steam locomotives, bridges, etc., were widely utilized in landscape paintings and steampunk art [7]. In the form of photographs or postcards conserved in museums or personal collections, railway images became part of the valuable heritage of recording the golden age of the railway.
Recently, there has been a resurgence in traveling by historic train, and railway heritage tourism has become of particular interest in tourism. More attention was gained on the reuse of some old rail-lines as tourism-oriented facilities, namely the scenic railway or railway heritage, referring to those trains used for the purpose of transporting tourists for recreation, a scenic tour, or heritage experience [8], which can meet the taste of nostalgia for the railway age, curiosity for appreciating diverse scenes along a linear route, and traveling leisurely at a slower pace [9]. It is noted that conservation and recreation are two topics for railway tourism [10]. Other attractions for tourists include railways’ cultural significance, political situation, and landscape value [11]. For example, historical routes with deserted railway stations and viaducts can be renovated as railway attractions for tourists. Some railways own the natural beauties in some sections and the modern remains distributed along the route, such as the Yunnan-Vietnam Railway in this study. The landscape quality has become a crucial factor in the railway heritage attractiveness for experiencing both the natural and cultural aspects of scenery along the line. In the process of selection of railway heritage of the United Nations Educational, Scientific and Cultural Organization (UNESCO), the significance of landscape is highlighted in the cases of Darjeeling Railway and Bernina railway. Therefore, railway is not only a tool for connecting spaces but as a force that helps to transfigure itself as an inner part of aesthetic objects for both recreation and perception [12].
Along with the scenic railway and railway heritage, the term “railway landscape” has emerged, combining railway heritage and landscape [13]. Assessing the landscape along railway heritage has multiple meanings: (1) figure out the places with high value for further development of railway tourism; (2) improve the railway experience, attracting more visitors and reactivating the historical railways; (3) combine landscape with heritage value, serving for the railway heritage protection in a broad landscape context; (4) monitor the changes of landscape; (5) offer a quantitative basis and scientific guidance for the coordination of the railway, its touristic resources, environmental protection, and the opportunities for sustainable development [14].

2. Literature Review

2.1. Comparison of Landscape Assessment Methods

Landscape assessment is only about evaluating the visual landscape quality, but the various landscape dimensions and factors should be involved in its structure and function. Landscape assessment from a regional scale and strategic level is necessary for urban planning and for a complete understanding of the effects of transportations, regardless of whether it takes place before the railway’s construction or after its operation [15]. Although the literature contains numerous publications on landscape assessment, the assessment of railway landscape gets less attention compared with other types of transportation. The aesthetic value of roads is emphasized [16], especially for those located in some tourist areas. Some assessment tools were developed for the road landscape, such as the visual impact assessment focusing on the vividness, unity, and integrity of the linear area along the highway [17]; visual resource management, including the factors of landform, vegetation, color, scenery, scarcity, and cultural modifications [18]; landscape character assessment to evaluate the coherence, disturbance, historicity, visual scale, complexity, naturalness, and ephemera [19]; landscape comparison method, etc. However, the introduction of spatial technologies and 3D visualization has improved the scientific process of landscape evaluation.
According to previous study [20], landscape evaluation methods can be classified into four main groups: cognitive, empirical, psychophysical, and expert methods. All have their advantages and disadvantages. For example, the expert method is mainly applied in large-scale territorial planning and forest resource management. It has good practicability, but the evaluation accuracy and completeness are not good as others. The psychophysical method focuses on the quantitative relationship between the subjectivity and objectivity of landscape; however, this kind of photo-based assessment lacks a sense of on-site reality. The cognitive way emphasizes the immersive experience between the subjectivity and objectivity of the landscape through information media; however, it is limited to natural landscape and lacks social and cultural analysis. The empirical way is difficult to obtain a universally agreed result from because it relies too much on the individual factors of artistic aspects. Thus, previous evaluation methods are generally based on empirical judgments or subjective questionnaire results, missing some scientific supports, or cannot meet the requirements of being objective and accurate. To solve these problems, spatial technologies have gradually gained attention and application in landscape analysis and evaluation [21]. Thus, a comprehensive assessment method based on spatial technologies has its advantages compared with previously proposed methods. Unlike photo-based assessment and cognitive methods, collecting spatial data for the evaluation process can be more objective and scientific. In contrast to the disadvantage of only using the expert method, a way combining several methods together can be more comprehensive and universal, and the result will be more valuable in guiding further constructions and developments.

2.2. Spatial Technologies for Landscape Assessment

During the landscape assessment, Geographic Information Systems (GIS) and remote sensing (RS) provide more possibilities for recent research. The role of GIS in landscape assessment has been tested in many cases because of its advantages in data overlaying and multiple functions for spatial analysis [22,23]. Remote sensing is also a significant process for large scale landscape studies. The satellite imagery is always combined with quantitative analysis of landscape dynamics and monitoring the land-use/land-cover (LULC) transformations [24], such as in the case of the evaluation of landscape-water quality [25], and in the assessment of urban sprawl using Landsat satellite imagery in South Africa [26]. Particularly, more and more satellite data are freely available for related large-scale landscape and environmental studies. For example, the Landsat data from NASA (The National Aeronautics and Space Administration) are widely used in the fields of water quality, ice movement, glacier recession, invasive species, coral reef health, land use change, as well as the monitoring of landscape and heritages [27]. Besides, the Moderate Resolution Imaging Spectroradiometer (MODIS) data (https://nsidc.org/data/modis/index.html, accessed on 10 December 2021) are also applied in many situations. The system offers 44 standard data products that have helped to better understand global dynamics and processes from the perspectives of land, sea, and atmosphere. MODIS plays a key role in the creation of global models for climate change prediction, deforestation monitoring, etc. The Copernicus Sentinel-2 satellite (https://scihub.copernicus.eu/, accessed on 11 December 2021) contains information on water contamination, floods dynamics, volcanic eruptions, and landslides, aiding catastrophe mapping and reducing humanitarian operations. Due to the accessibility of these satellite images, this research will collect landscape-related data from these open sources, as discussed in the next chapter.
Among those methods, it can be seen that there are some inadequacies in the methods, specifically for evaluating and analyzing the railway landscape. There are limited case studies focused on the evaluation of railway landscape. A dynamic method was proposed for assessing landscape along the Tibet railway in China, based on the landscape quality perceived by the tourists during the travel, the selected landscape indexes including the diversity of landform, the ornamentation of vegetation, the richness of cultural landscapes, viewshed analysis, beauty of the landscape, etc. The Chinese Eastern railway has also been the object of classified landscape quality assessment regarding its picturesque beauty and visual sensitivity [28]. The scenic beauty is evaluated by the questionnaire with site photos for visitors, and the visual sensitivity is reflected by the relative slope, relative distance, probability of appearance, and degree of visibility. The Chengjiu Railway has also been evaluated from the landscape sensitivity, visual quality, and ecological quality [29].

2.3. AHP Method and This Research

The AHP as a structured technique is both qualitative and quantitative. It is widely used to analyze and make decisions, transforming complex problems into a mathematical process. The goal of decision-making is divided into multiple layers, including the essence of the problem, influencing factors, and alternatives. The hierarchy structure is easy to operate, which enables a clear understanding of the relationship between the indicators [30]. In this paper, the AHP method serves for selecting the related landscape indicators and indexes and building the evaluation system for the YVR. The Delphi method [31] combined with AHP is also a useful (and much-discussed) tool used to identify landscape factors and choose a proper alternative for dealing with multi-objective decisions [32]. A horizontal comparison is made to determine the weights of factors hierarchically by experts’ opinions for avoiding subjective evaluations and saving time from numerous questionnaires. It is applied to the evaluation of landscape quality [33], eco-environment quality [34], heritage management [35], and so on. This paper introduces the Delphi method as a tool for deciding the weight of each landscape index in the evaluation system. Moreover, for overlaying the different indicators/indexes and displaying an overall AHP result for a specific area on the map, GIS provides adequate supports in this process.
In summary, faced with the current situation of inadequacy in the methods for evaluating and analyzing railway landscape, the objective of this paper is to discuss and design a landscape assessment method based on previous research and with the help of spatial technologies for the railway landscape along the YVR, and to bring multiple benefits for the future development of this whole area. The methodology in this paper combines the AHP, Delphi method, and GIS, and is proposed as an integrated spatial tool for the assessment of railway landscape, taking the Yunnan-Vietnam Railway as the object for the application and testing of this method. This paper aims to: (1) discuss the relationship between railway and landscape; (2) build a comprehensive evaluation system for the assessment of railway landscape, covering the topic of history, tourism, ecology, heritage, social-culture, and landscape quality along the railway; (3) quantify the landscape value of the areas passed by the Yunnan-Vietnam Railway, which serves for its future planning and development. The creative point in this research is the combination of landscape quality with heritage value in the railway landscape assessment. Moreover, a cross-regional study from the aspect of landscape assessment covering the area from Yunnan (southwest of China) to North Vietnam is proposed for the very first time in this paper, which makes it ground-breaking research for this international railway.

3. Materials and Methods

3.1. Study Area

The Yunnan-Vietnam Railway is a representative historical and colonial railway in Southeast Asia. It was constructed by France in the 1900s between the Yunnan province in China and the Tonkin area of French Indochina (1887–1954). The historical, social, economic, cultural, political, and technical meanings of the railway give it value, and it has been nominated as a national industrial heritage in China. However, the railway and its related regions are facing both challenges and opportunities because of all the economic and political changes of the past years. Compared with the standard railway, the service of the YVR is more time-consuming and has higher maintenance costs. In particular, the one-meter railway cannot fit with other rail networks out of Yunnan province. Since then, those colonial stations along the YVR route have become dilapidated, and this one-century-old railway cannot avoid a downward trend in quality. Nowadays, the redevelopment of this heritage railway and the related railway regions is a big challenge for both Yunnan and Vietnam.
This paper selects the railway landscape of the YVR as its research object. The study focuses on both the Chinese section (Kunming—Hekou) and the Vietnamese part (Laocai—Haiphong), with a total length of 855 km. An international perspective dealing with both these two sections has never been discussed in the previous research. The railway route in this area passes various landscape types: urban space, countryside, forest, mountainous area, and different cultural landscape such as the French-style stations, stone or metallic bridges, and so on, which provides landscape enjoyment along the trip. Not only should the heritage sites along the railway be protected, but also those landscapes of outstanding beauty. The related administrative bodies include 13 counties in Yunnan and nine counties in North Vietnam, covering an area of nearly 51,000 km2, from 102°43′12″E—106°42′54″E to 20°51′53″N—25°03′35″N (Figure 1).
To facilitate the study, according to the theory of buffer zone proposed by the Operational Guidelines for the Implementation of the World Heritage Convention (WHC) [36] and related research experience [37], this paper delimits the area with a distance of 10 km to the railway line as the buffer zone for the YVR railway landscape. As a result, a corridor with a width of 20 km is created for further landscape analysis and evaluation, and the rest of the study area is considered as the context for the whole railway corridor. In order to complete a comprehensive railway landscape evaluation, various spatial data are collected from open sources. After pre-processing and systemizing, the data used in this research and their formats and sources are listed in Table 1.
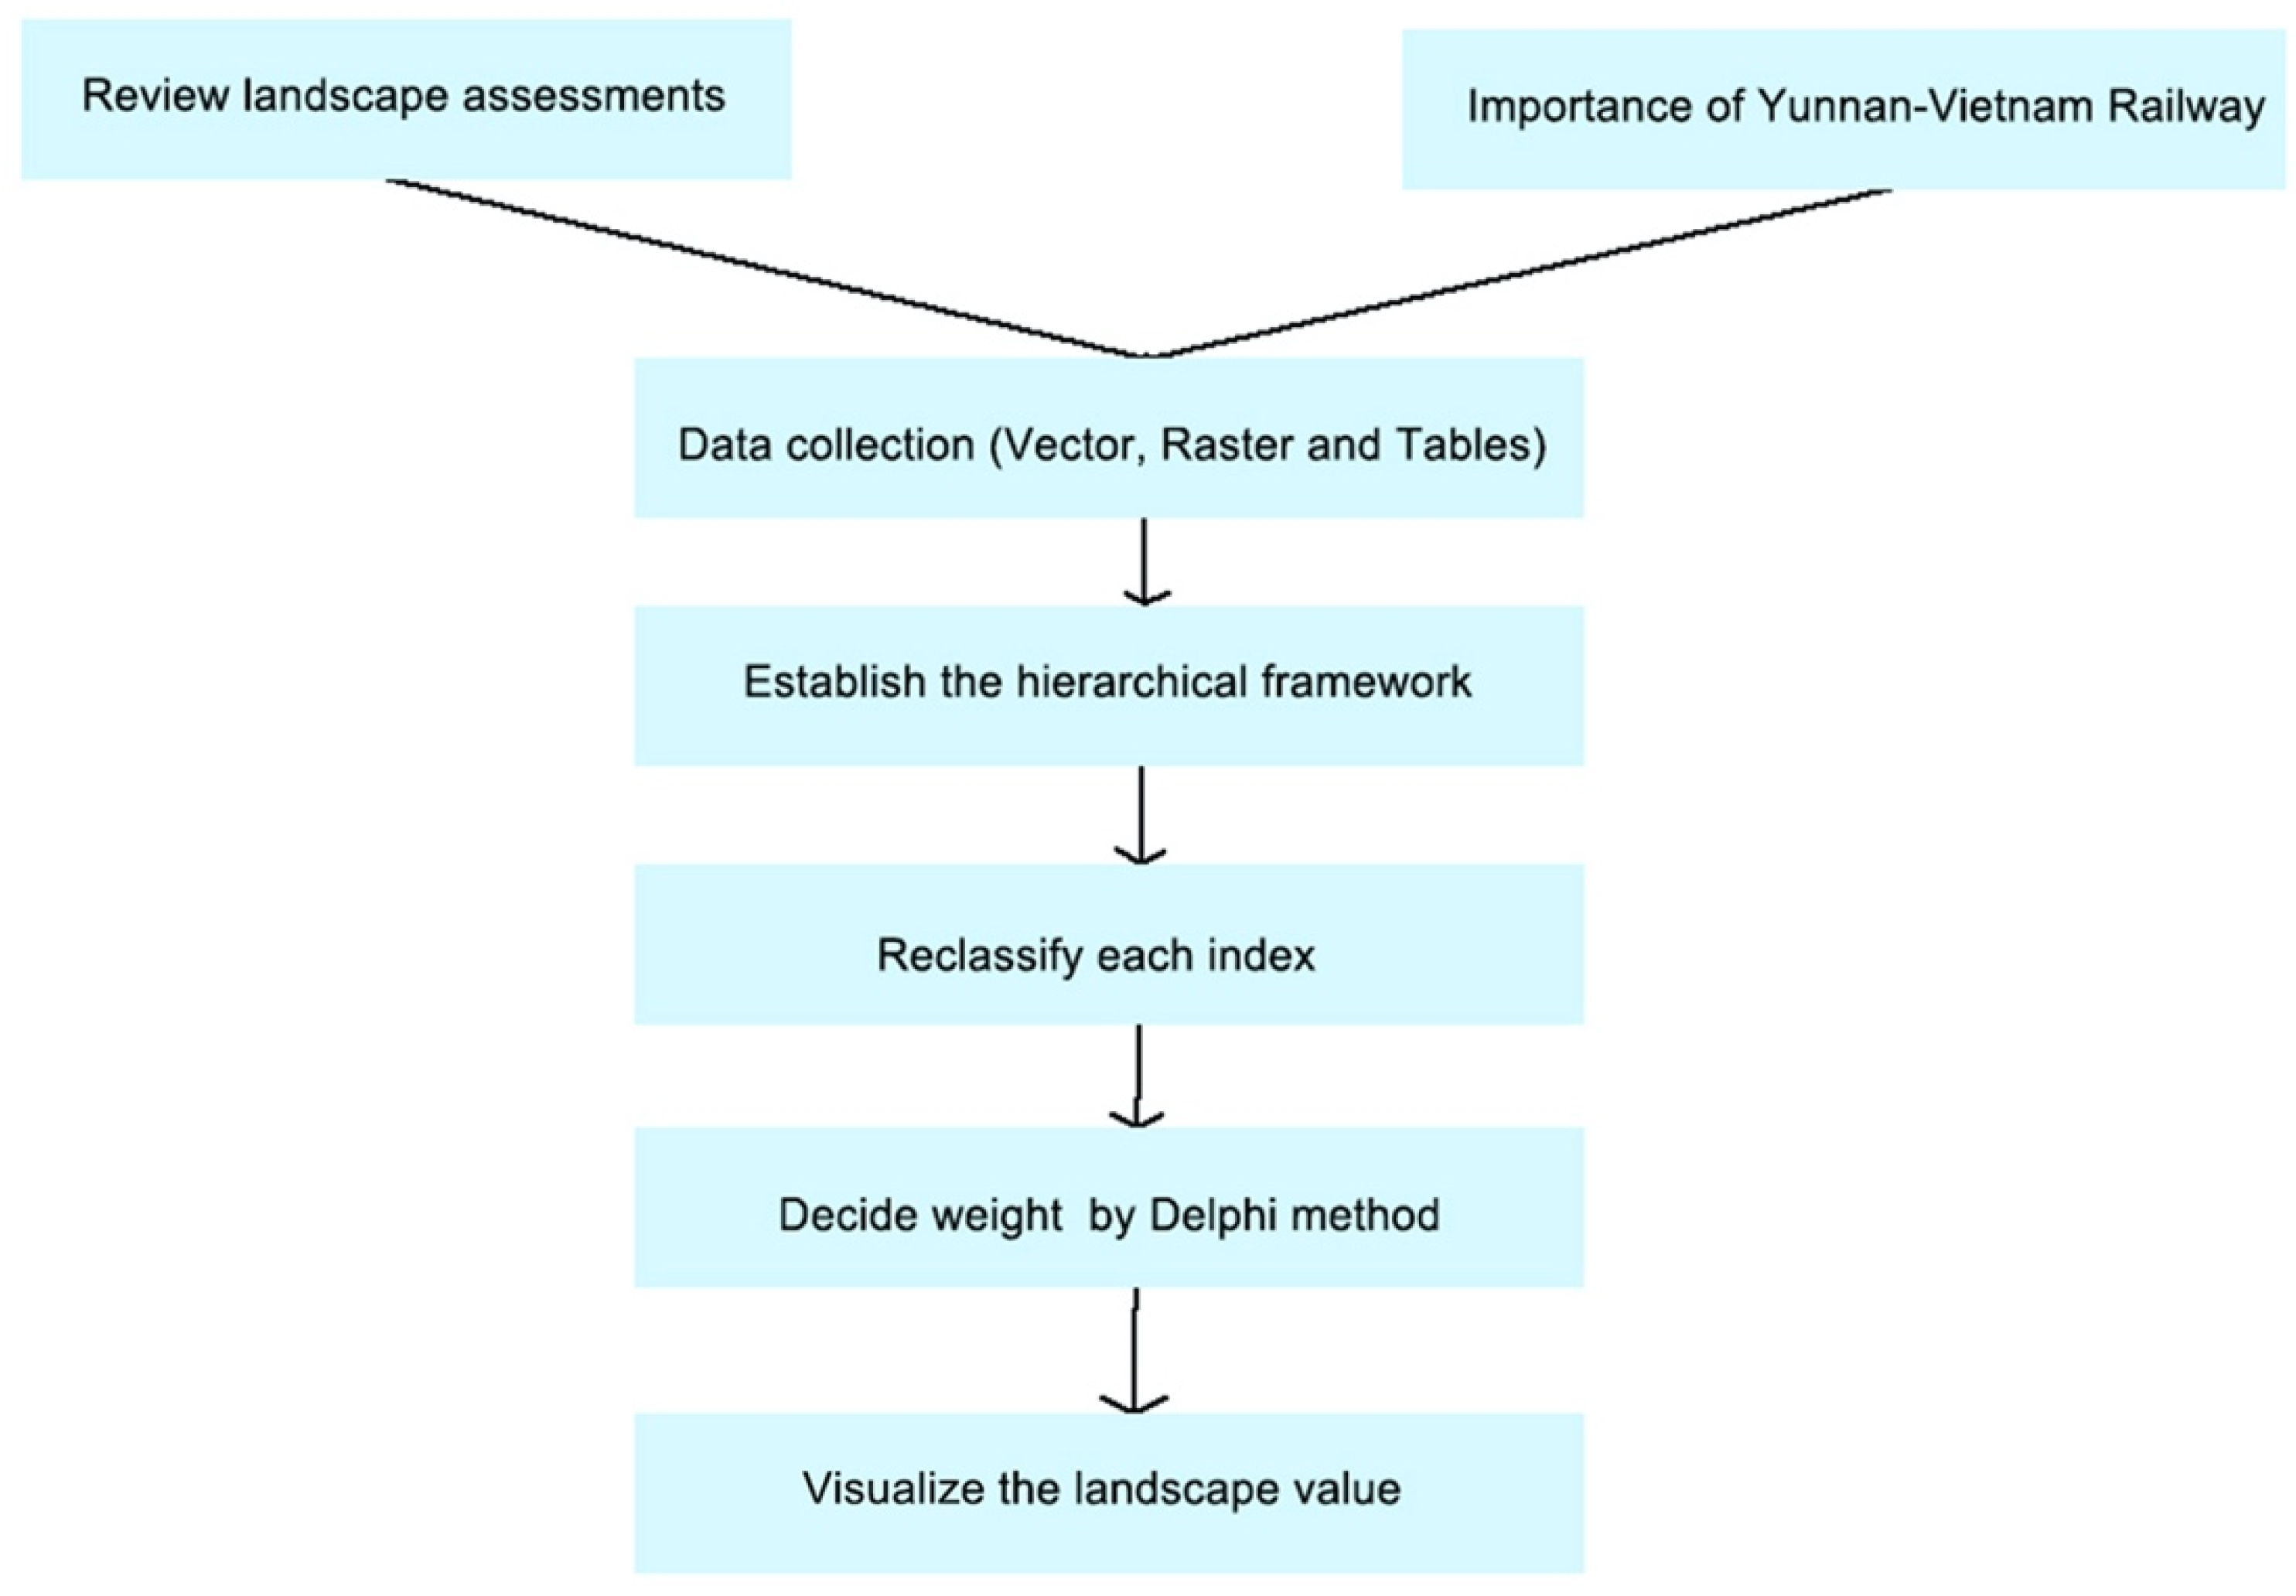
Based on the collected data, this paper integrates AHP, Delphi Method, and GIS as a spatially integrated assessment method to establish a hierarchy model of the evaluation system in the comprehensive conservation and development of the YVR railway landscape [38]. The process of the whole landscape evaluation is as follows: (1) select the landscape indicators and indexes for railway landscape and constructing the AHP system of evaluation for the YVR; (2) reclassify the landscape indexes and define the weight of each index by the Delphi method; (3) calculate the landscape value by overlaying the related raster; (4) check the correlation coefficient of indexes; (5) use the zonal statistic tool to visualize the landscape value in each county. The detailed process is shown in Figure 2.

3.2. Select Relative Indicators and Establish the Hierarchical Framework

Landscape indicators are considered an effective tool for analyzing landscape quality. Railway landscape is a complex system related to both landscape factors and railway heritage elements due to the intersection of their dimensions. A comprehensive evaluation of railway landscape should make an extensive analysis of the existing relationship between different landscape indicators within a specific context, as well as an evaluation of the heritages along the rail. According to previous studies on landscape evaluation [39,40], the landscape indicators can be generally divided into six groups: ecological, structural, visual, economic, historical, and social. Various landscape indicators are discussed and used, and, within each indicator, there are also many indexes developed in different areas of study [41].
At the same time, a comprehensive system with industrial heritage such as the YVR emphasizes its scientific and technological value in history. The railway heritage, as an internal part of the landscape system, should also be evaluated along with other landscape indicators. For assessing industrial heritage, the International Committee for the Conservation of the Industrial Heritage (TICCIH) has developed an evaluation framework, which focuses on the social value of heritage for the recording of the lives of ordinary laborers, providing the following things: a sense of identity; scientific and technological value in the history of construction, manufacturing, and engineering; and aesthetic value for the quality of its architecture, design, or planning [42]. Moreover, the indicators used specifically for railway heritage are summarized as four types: technical value, historical value, cultural value, and social value [43].
Based on the above discussion, while selecting the indicators, some requirements need to be met, such as data availability, accuracy, reliability, and being up to date [44]. According to the site investigations, it can be known that the landscape along the YVR is influenced by various factors both natural and cultural, such as railway relics, historical monuments, natural sites, environmental quality, human activities, etc. [45] reviewed the related and similar research (listed in Table 2), taking ecology, tourism, and heritage protection into consideration, and the criteria of landscape indicators of the YVR landscape are explained in Table 2 after a discussion with experts. As a result, the indicators for the YVR railway landscape applied in this research are specified into five indicators: visual quality (B1), technology (B2), ecology (B3), social culture (B4), and tourism (B5), which can be regarded as five topics of the railway heritage corridor. Then, each indicator is further classified into a few indexes (C1-C15), referenced by previous research (Table 2):

3.3. Reclassify Each Index and Use the Delphi Method

According to the reclassification rule for every index (Table 3), each raster layer of the landscape index is reclassified into five classes with a score between 1 and 5 (from a lower value to higher value), among which the value indicates a comparative result within the study area. After the reclassification of each index, to figure out the weight of each index, the Delphi method is introduced. A total of five experts are invited to compare the relative importance of the two indexes, giving them value according to the rule that numbers 1–9 mean an increase of importance of the indexes, that the expression 1/1 means that the first and second index are of equal significance, and that 9/1 means that the first index is of far more importance than the second one [51]. After a questionnaire research and discussion with experts, the importance comparison between every two indexes from the same indicator is obtained, as shown in Table 4.

3.4. Calculate the Landscape Value in GIS

After obtaining the importance comparison for every two indexes, the matrix model needs to be made to calculate the weight of each index with the help of the designed application named “Yaahp (http://www.metadecsn.com/product/ (accessed on 9 October 2020)”. The calculation process includes building a comparison matrix, obtaining the result of the weight of every index, and checking the consistency of indicators. The result of the weight calculation is also shown in Table 4. Afterwards, the landscape value can be obtained by overlaying the raster of these indexes. The raster calculator in GIS is used to overlay all of the raster layers with their weights by the following equation:
C 1 weight + C 2 weight + + C 15 weight

3.5. Check the Correlation Coefficient of Landscape Value

The correlation coefficient of the selected indexes needs to be checked to avoid overfitting. The “CORREL” function is used in Excel to get the Pearson product-moment correlation coefficient (r) [55]. The value of r is usually between −1 and 1. When the obtained correlation coefficient amounts to higher than 0.8 [56], it means that the selection of indexes is not valid, and one of the two correlated indices needs to be reconsidered and replaced. The Pearson correlation coefficient is calculated as follows by the formula (x and y indicate the sample value of the indexes):
In the study area, the railway stations are selected as the sample points used to obtain the value from the raster of each index. There are, in all, 85 stations being used as samples along the route. The result of each calculation is shown in Table 5, and the correlation values among most indexes are qualified to be smaller than 0.8, which means that the evaluation system is valid.

3.6. Visualize the Landscape Value in Each County

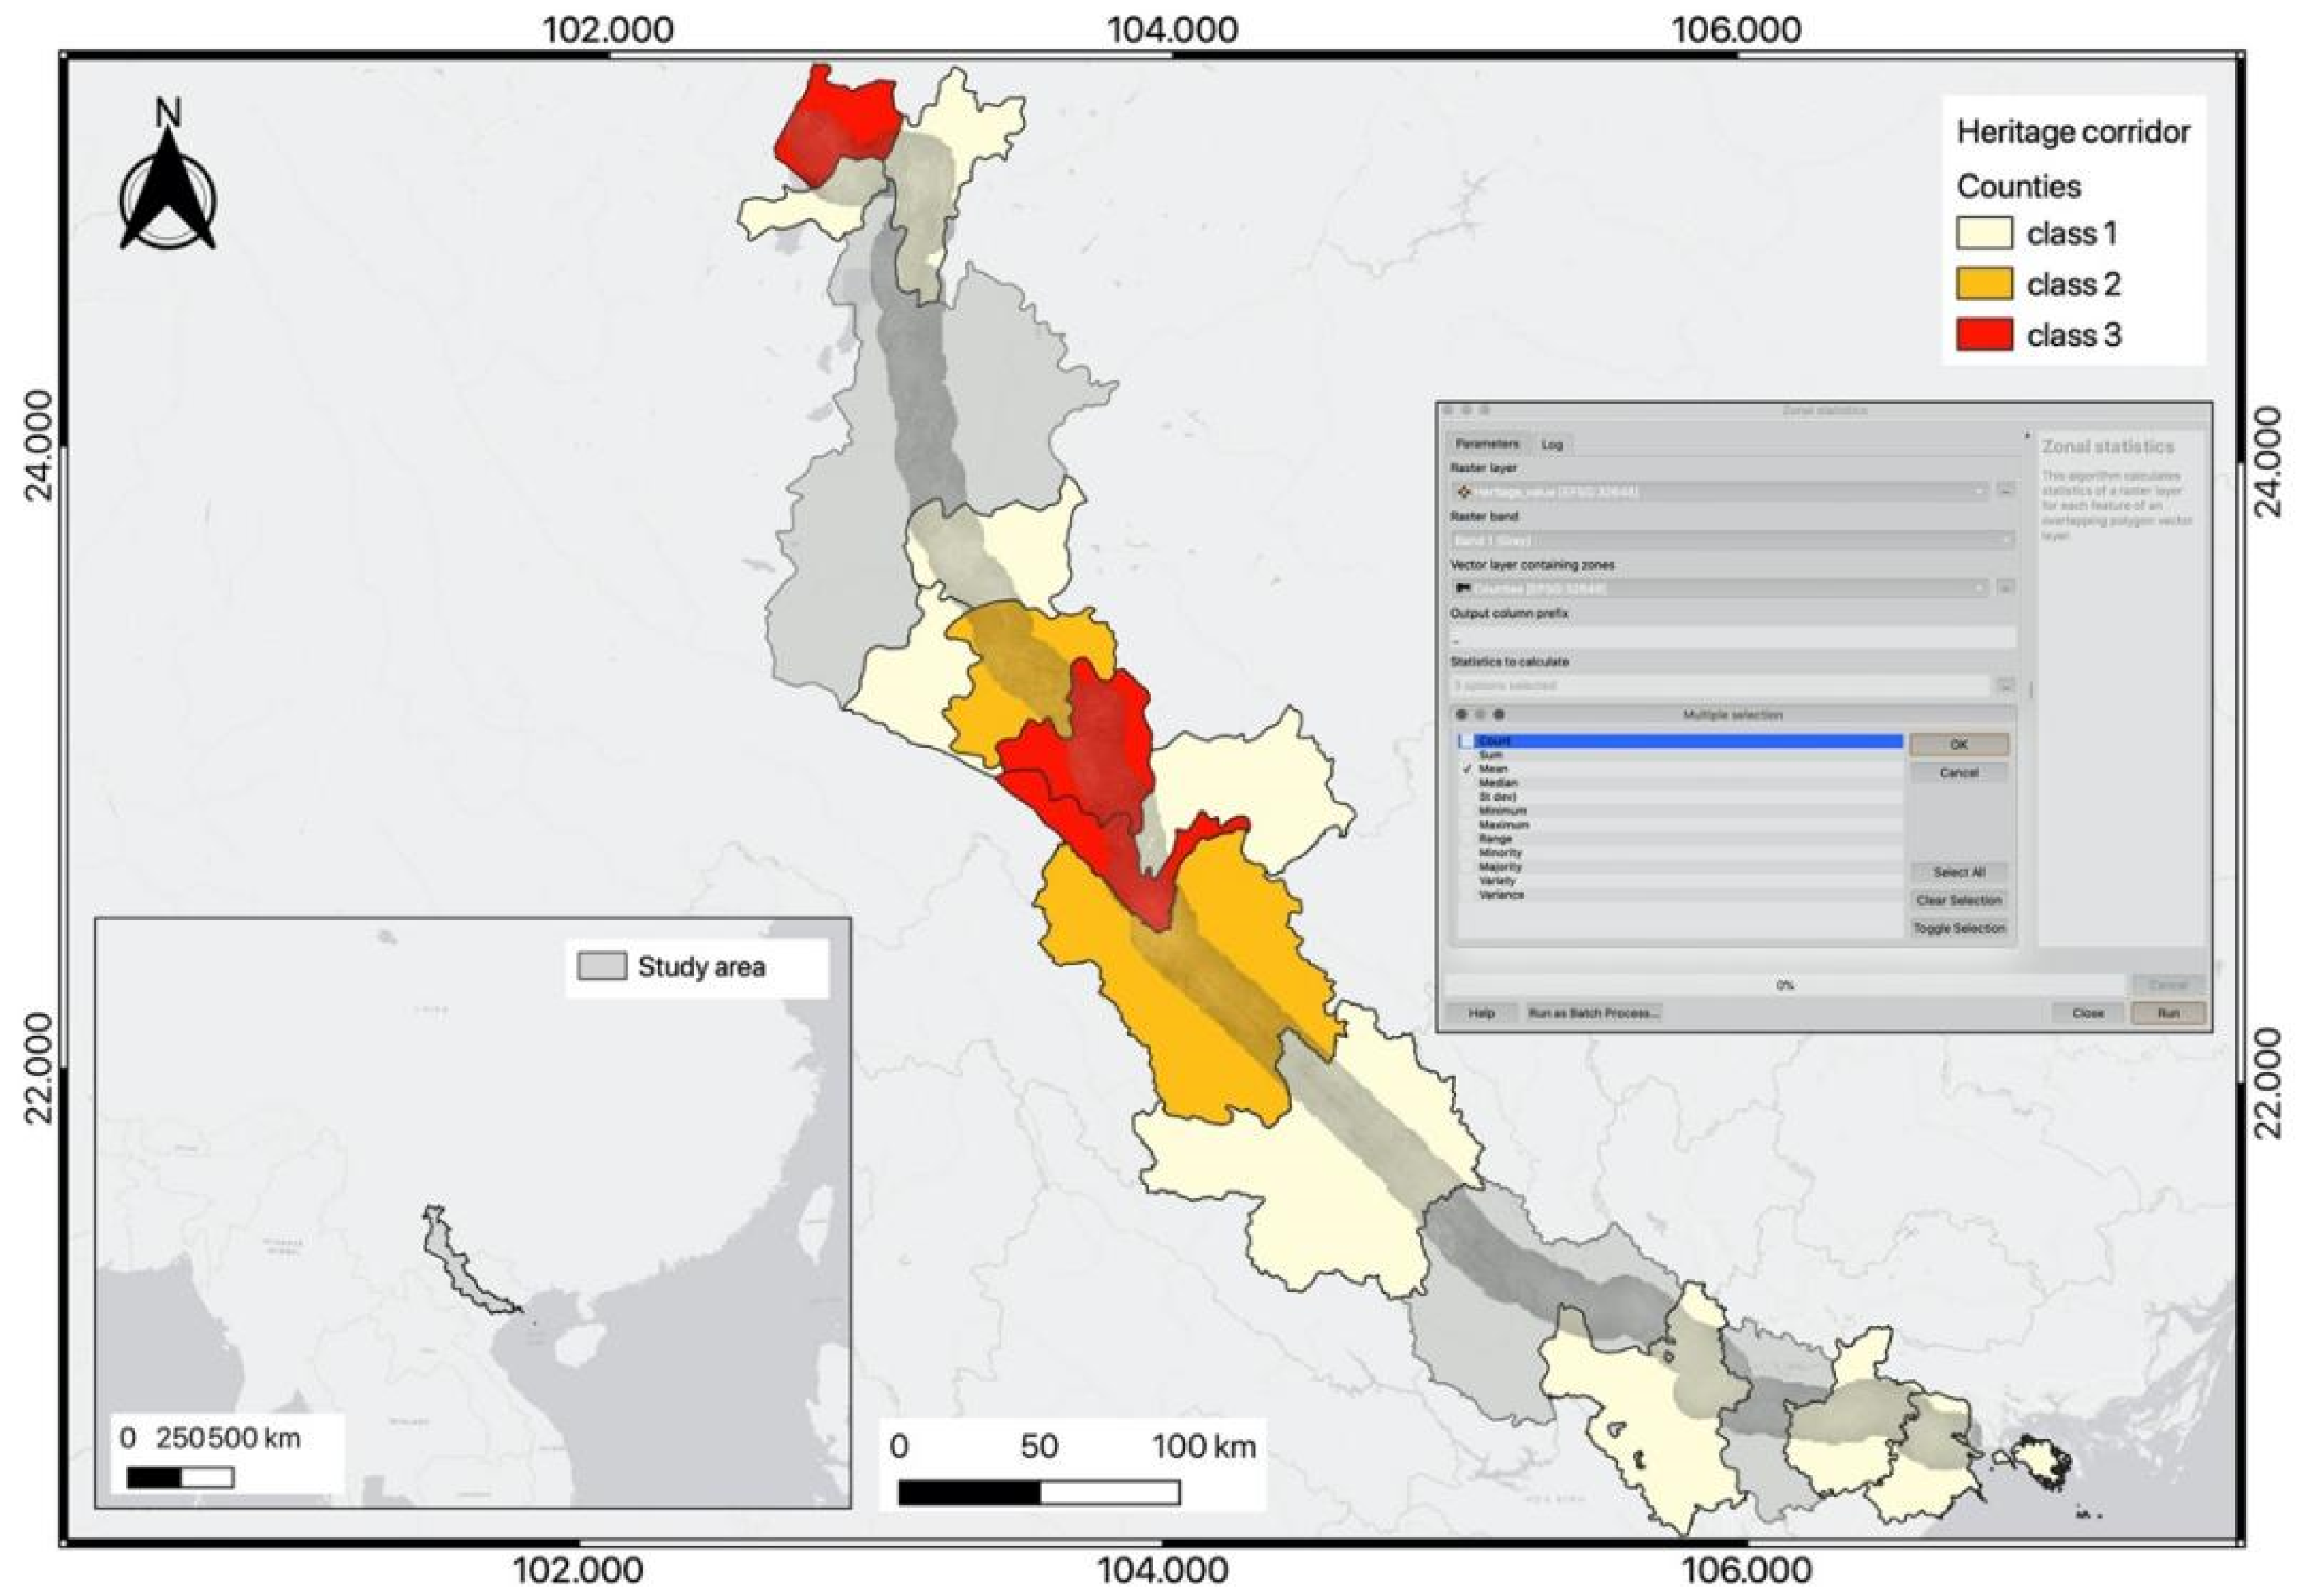
Next, to figure out the landscape value in each county, the value from the calculated landscape raster is extracted to the vector layer of cities/counties in the study area. The zonal statistics tool in GIS is utilized to calculate for each county based on the mean value of the landscape value in raster.

4. Results

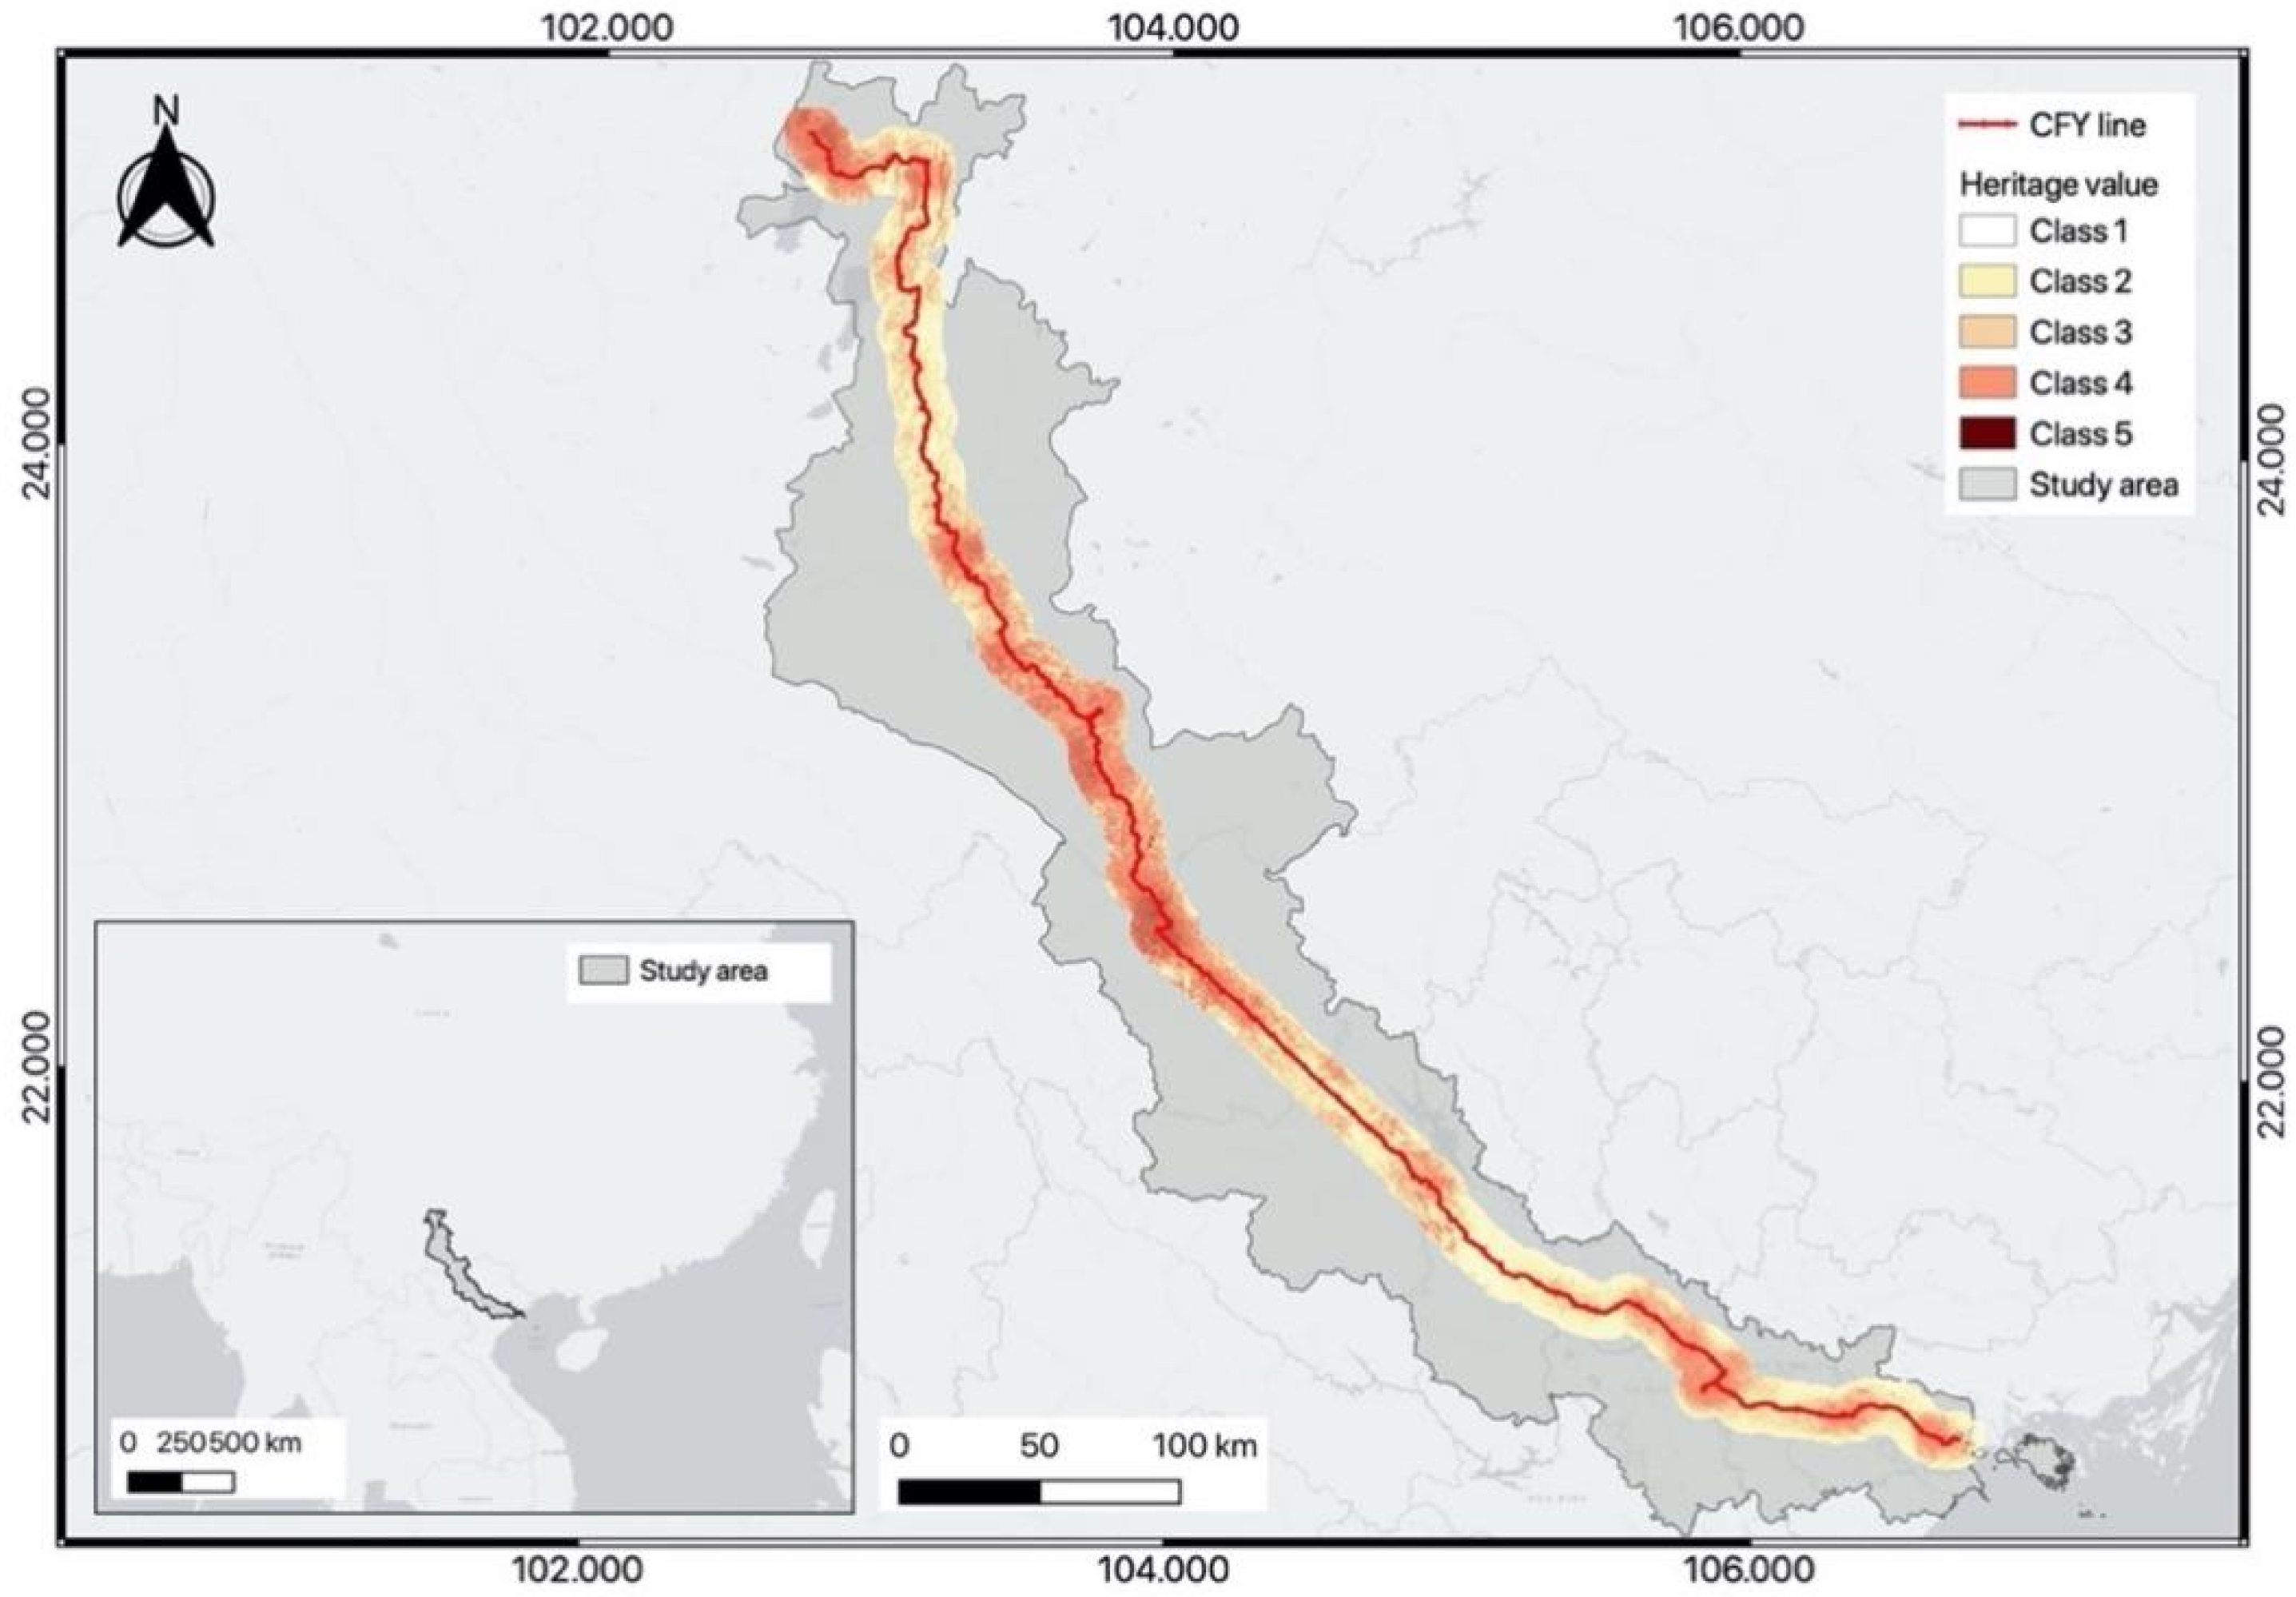
The result of the landscape value in the railway corridor is displayed in Figure 3. The total landscape value is 25 in the corridor of the study area (each indicator owns a value of 5). Then, the overall landscape value is reclassified into five classes (high, higher-middle, middle, lower-middle, low) [57], showing the areas with higher value (red to orange) to lower value (yellow to white). The classes are defined according to the rule below (classification type: quantile, interpolation mode: discrete): class 1: 0–8.6; class 2: 8.6–10.0; class 3: 10.0–11.3; class 4: 11.3–12.9; class 5: 12.9–25.
The statistical analysis displayed in Figure 4 indicates that Kunming, Pingbian, and Hekou are the three cities with a higher landscape value in the study area. Then, Chenggong, Yiliang, Laocai, and Mengzi have a medium value, while Chenggong, Yiliang, Gejiu, Maguan, Kaiyuan, Haiduong, Yenbai, Hanoi, and Haiphong have a lower value. Every topic of the indicators can also be visualized in the map, deriving the value by the tool of the zonal statistic (Figure 5). The results reveal the following: that the areas with the highest ecological value are Kunming, Chenggong, Yiliang, Mengzi, Pingbian, Hekou, and Laocai; that Kunming, Kaiyuan, Mengzi, Hanoi, Bacninh, Haiduong, and Haiphong have the highest tourism value; that the areas of Jianshui, Kaiyuan, Pingbian, Maguan, Vinphuc, and Hanoi have the highest visual quality; that the areas of Kunming, Chenggong, Hanoi, Bacninh, Haiduong, and Haiphong have the highest social-cultural value; that the areas of Yiliang, Huaning, Mile, Jianshui, Pingbian, Maguan and Hekou are the regions with the highest technological value.

5. Discussions

Landscape and railway interact and coexist with each other. The construction of railway influenced the landscape ecology, but railway elements, in turn, have also become part of the landscape’s aesthetics. The changes brought to society by the mobility of railway are called the discovery of landscape along the rail. The feature of railway landscape in this research lies in the combination of railway heritage elements and the regional ecological and landscape elements for its tourism development, seeing the cultural and natural elements linked closely with each other. In the past, the analysis of industrial heritage value mainly focused on its technological value. But the heritages are always located in an environment and as part of their surroundings. Railway landscape can be regarded as a part of railway heritage, and the landscape quality influences the attractiveness of the heritage sites and their value. In particular, the study on the specific evaluation of visual railway landscape quality is still lacking.
In the process of developing railway heritage, scholars should pay attention to not only the physical remains as isolated railway elements, but the value of landscape should also be taken into consideration. Protecting the overall landscape along railway should be one of the scopes of railway heritage conservation. All kinds of natural and human landscape along the route can be included in the railway heritage system, and the landscape quality needs to be one of the factors for the evaluation of the value of the railway heritage. There are also more topics awaiting further research and practices, such as the combination of transportation management and service with the heritage protection, dynamic evaluation of visual quality along the railway, the construction of 3D visualization of railway landscape for tourists, the reconstruction of historical railway landscape, and so on. Moreover, the evaluation system proposed in this paper can be a reference for other railway landscapes along with the railway heritage, serving for further railway tourism, landscape planning, and development policies. A dynamic landscape assessment is also needed in future to fulfill the monitoring of the changes of landscape in this region.
From the perspective of remote sensing, the satellite images functioned important roles in this research. With the help of the open-source data from The National Aeronautics and Space Administration (NASA), Copernicus, etc., the landscape evaluation system can be created. The last step of calculation was also based on the reclassified rasters. As is seen, raster data including satellite images are the essential parts of this system. However, due to the diversity of satellites, the accuracy of these images in the landscape assessment should still be discussed and tested. A proper choice of spatial data and their reliability in landscape evaluation need to be studied in the future [58].
The application of landscape value in urban construction and planning is necessary. Different areas or cities may emphasize different indicators in their planning process. There is not a universal landscape evaluation method for all kinds of landscape or places. However, the landscape value in this research involves visual quality, ecology, technology, social culture, and tourism value as a comprehensive evaluation. Thus, for local tourism development, a higher landscape value means the sites with higher ecological importance, aesthetic significance, sense of place, and potentials of future social and cultural development. Accordingly, the governments and related stakeholders can make better decisions based on this study. Moreover, the development strategies for each area should focus on different aspects according to the landscape evaluation. For example, for the areas with highest tourism values (Kunming, Kaiyuan and Hanoi, etc.), more investments can be introduced to support related heritage tourism. The areas with higher ecological values should pay more attention to the balance between human activities and nature protection in their future plans, such as in Yiliang, Chenggong, Laocai, and Hekou. The local authorities should focus more on a sustainable ecological development and take better use of the natural and ecological sources; places with higher technological meanings are more suitable for developing theme parks and touristic trains, such as the county of Mile, Jianshui, Pingbian, etc. [59].
At last, the advantage of the proposed evaluation method is discussed: it is a comprehensive method combining several ways of fulfilling an overall landscape evaluation. It avoids the problem of subjectivity using only the expert method. The introduction of spatial data and technologies is more efficient and objective compared with questionnaire or photo assessment. At the same time, five perspectives of railway development with 15 indexes are discussed in this process, which provides an example for other railway landscape evaluations. However, the main shortcoming of this method is the problem of data updating. Different datasets have different resolutions and accuracies, and how to update the data along the railway to form a dynamic assessment should be studied more in the future.

6. Conclusions

In this paper, the relationship between landscape and railway is reviewed by the authors, which mainly transited from opposition to integration. The concept of railway landscape was also introduced. Then, based on previous related research, a methodology was designed combining GIS with the Delphi method and AHP process, and the landscape value of railway was interpreted as five aspects, namely a railway landscape evaluation system composed of visual quality, ecology, technology, social culture, and tourism value. Each aspect was further classified and reflected from a few indexes, after the process of checking the correlation coefficient, defining the weight of every landscape index by the Delphi method, and calculating the landscape value in the buffer zone of YVR by overlaying the related raster. Finally, the result of the overall landscape value was visualized on the map. It was thus found that the landscape evaluation system is successfully built for the assessment of landscape along the YVR. Based on the obtained landscape value of the YVR area, further heritage planning can be fulfilled, concentrating on the places with higher landscape and heritage value. This research result will serve for future urban planning and policymaking, which will figure out the shortcomings and strengths in regional development.

Author Contributions

K.S.: Conceptualization, Methodology, Writing—original draft. S.E.P.: Conceptualization, Methodology, Writing—review and editing, Supervision. G.L.F.: Supervision. All authors have read and agreed to the published version of the manuscript.

Funding

This research was supported by Xiamen University Malaysia Research Fund, Grant Number: XMUMRF/2022-C9/IART/0013.

Institutional Review Board Statement

The study did not require ethical approval.

Informed Consent Statement

Informed consent was obtained from all subjects involved in the study.

Data Availability Statement

These data were obtained or derived from publicly available resources, as indicated below: DIVA-GIS: https://www.diva-gis.org (accessed on 9 October 2020). Contains information licensed under the GNU General Public License. World Clim: https://www.worldclim.org (accessed on 9 October 2020). Contains information licensed under the World Clim. Center for International Earth Science Information Network: http://www.ciesin.org (accessed on 9 October 2020). Contains information licensed under the CIESIN. Earth Explorer: https://earthexplorer.usgs.gov (accessed on 9 October 2020). Contains information licensed under the USGS. Global Forest Watch: https://www.globalforestwatch.org (accessed on 9 October 2020). Contains information licensed under the World Resources Institute. Earth data (NASA): https://Earthdataearthdata.nasa.gov (accessed on 9 October 2020). Contains information licensed under the Earth data. Baidu map: https://map.baidu.com (accessed on 9 October 2020). Contains information licensed under the Baidu map. Open Street Map: https://www.openstreetmap.org (accessed on 9 October 2020). Contains information licensed under the Open Data Commons Open Database License. Social media (Flickr): https://www.flickr.com/photos/tags/flicker/ (accessed on 9 October 2020). Contains information licensed under the Flickr.

Conflicts of Interest

The authors declare no conflict of interest.

References

  1. Council of Europe. European Landscape Convention European Treaty Series; Council of Europe: Florence, Italy, 2000; p. 176. Available online: https://www.coe.int/en/web/landscape (accessed on 2 June 2021).
  2. Gulinck, H.; Múgica, M.; De Lucio, J.V.; Atauri, J.A. A framework for comparative landscape analysis and evaluation based on land cover data, with an application in the Madrid region (Spain). Landsc. Urban Plan. 2001, 55, 257–270. [Google Scholar] [CrossRef]
  3. Selman, P.H. Planning at the Landscape Scale; Routledge: London, UK, 2006. [Google Scholar]
  4. Hall, D.R. Conceptualising tourism transport: Inequality and externality issues. J. Transp. Geogr. 1999, 7, 181–188. [Google Scholar] [CrossRef]
  5. Löfgren, S.; Nilsson, K.L.; Johansson, C.M. Considering landscape in strategic transport planning. Transp. Res. Part. Trans. Environ. 2018, 65, 396–408. [Google Scholar] [CrossRef]
  6. Thompson, M. Modernity, anxiety, and the development of a popular railway landscape aesthetic, 1809–1879. In Trains, Literature, and Culture: Reading and Writing Rails; Lexington Books: Lanham, MD, USA, 2012; pp. 119–123. [Google Scholar]
  7. Bowser, R.; Croxall, B. Annihilated time, smooth surfaces, and rough edges in Steampunk and Schivelbusch’s the rail-way journey: A departure point. In Proceedings of the Interdisciplinary Nineteenth-Century Studies Conference, Atlanta, GA, USA, 16–19 April 2015; pp. 1–8. [Google Scholar]
  8. Blancheton, B.; Marchi, J.J. The three systems of rail tourism: French case. Tour. Manag. Perspect. 2013, 5, 31–40. [Google Scholar] [CrossRef]
  9. Prideaux, B. Tracks to tourism: Queensland Rail joins the tourist industry. Int. J. Tour. Res. 1999, 1, 73–86. [Google Scholar] [CrossRef]
  10. Tillman, J.A. Sustainability of heritage railways: An economic approach. Jap. Rail and Transp. Res. 2002, 32, 38–45. [Google Scholar]
  11. Orbaşli, A.; Woodward, S. A railway ‘route’ as a linear heritage attraction: The Hijaz Railway in the Kingdom of Saudi Arabia. J. Herit. Tour. 2008, 3, 159–175. [Google Scholar] [CrossRef]
  12. Baker, J.C. Mobility, tropicality and landscape: The Darjeeling Himalayan Railway, 1881–1939. J. Hist. Geogr. 2014, 44, 133–144. [Google Scholar] [CrossRef]
  13. Zhang, R.; Xi, J.; Yao, Y.; Ge, Q. Evaluation of tourism dynamic landscape along Qinghai-Tibet railway based on the visual corridor. Acta Ecol. Sin. 2014, 34, 3320–3330. [Google Scholar]
  14. Mason, R. Assessing values in conservation planning: Methodological issues and choices. In Assessing the Values of Cultural Heritage; Getty Conservation Institute: Los Angeles, CA, USA, 2002. [Google Scholar]
  15. Antonson, H. Bridging the gap between research and planning practice concerning landscape in Swedish infrastructural planning. Land Use Policy 2009, 26, 169–177. [Google Scholar] [CrossRef]
  16. Clay, G.R.; Smidt, R.K. Assessing the validity and reliability of descriptor variables used in scenic highway analysis. Landsc. Urban Plan. 2004, 66, 239–255. [Google Scholar] [CrossRef]
  17. US Federal Highway Administration (US FHWA). Visual Impact Assessment for Highway Projects. 1981. Available online: https://www.placer.ca.gov/DocumentCenter/View/8259/FHWA-1981-Visual-Impact-Assessment-PDF (accessed on 7 July 2021).
  18. Smardon, R.C. Historical evolution of visual resource management within three federal agencies. J. Environ. Manag. 1986, 22, 301–317. [Google Scholar]
  19. Martín, B.; Ortega, E.; Otero, I.; Arce, R.M. Landscape character assessment with GIS using map-based indicators and photographs in the relationship between landscape and roads. J. Environ. Manag. 2016, 180, 324–334. [Google Scholar] [CrossRef] [PubMed]
  20. Wang, B.; Wang, B.; He, P. Aesthetics theory and method of landscape resource assessment. Chin. J. Appl. Ecol. 2006, 9, 1733–1739. [Google Scholar]
  21. Pastor, I.O.; Martínez, M.A.C.; Canalejoa, A.E.; Mariño, P.E. Landscape evaluation: Comparison of evaluation methods in a region of Spain. J. Environ. Manag. 2007, 85, 204–214. [Google Scholar] [CrossRef]
  22. Lee, J.T.; Elton, M.J.; Thompson, S. The role of GIS in landscape assessment: Using land-use-based criteria for an area of the Chiltern Hills Area of Outstanding Natural Beauty. Land Use Policy 1999, 16, 23–32. [Google Scholar] [CrossRef]
  23. Palmer, J.F. The contribution of a GIS-based landscape assessment model to a scientifically rigorous approach to visual impact assessment. Landsc. Urban Plan. 2019, 189, 80–90. [Google Scholar] [CrossRef]
  24. Jaafari, S.; Sakieh, Y.; Shabani, A.A.; Danehkar, A.; Nazarisamani, A.A. Landscape change assessment of reservation areas using remote sensing and landscape metrics (case study: Jajroud reservation, Iran). Environ. Dev. Sustain. 2016, 18, 1701–1717. [Google Scholar] [CrossRef]
  25. Griffith, J.A. Geographic techniques and recent applications of remote sensing to landscape-water quality studies. Water Air and Soil Pollut. 2002, 138, 181–197. [Google Scholar] [CrossRef]
  26. Magidi, J.; Ahmed, F. Assessing urban sprawl using remote sensing and landscape metrics: A case study of City of Tshwane, South Africa (1984–2015). Egypt. J. Remote Sens. Space Sci. 2019, 22, 335–346. [Google Scholar] [CrossRef]
  27. Banerjee, R.; Srivastava, P.K. Reconstruction of contested landscape: Detecting land cover transformation hosting cultural heritage sites from Central India using remote sensing. Land Use Policy 2013, 34, 193–203. [Google Scholar] [CrossRef]
  28. Zhang, L. Research on Visual Quality of the Natural Landscape Along Chinese Eastern Railway. Master’s Thesis, Harbin Institute of Technology, Harbin, China, 2015. [Google Scholar]
  29. Li, X. Evaluation of the Current Landscape Along the Chengdu-Jiuzhaigou Railway. Master’s Thesis, Sichuan Agricultural University, Sichuan, China, 2011. [Google Scholar]
  30. Saaty, T.L. What is the analytic hierarchy process? In Mathematical Models for Decision Support; Springer: Berlin/Heidelberg, Germany, 1988; pp. 109–121. [Google Scholar]
  31. Linstone, H.A.; Turoff, M. The Delphi Method; Addison-Wesley: Reading, MA, USA, 1975. [Google Scholar]
  32. Turskis, Z.; Zavadskas, E.K.; Kutut, V. A model based on ARAS-G and AHP methods for multiple criteria prioritizing of heritage value. Int. J. Inf. Technol. Decis. Mak. 2013, 12, 45–73. [Google Scholar] [CrossRef]
  33. Srdjevic, Z.; Lakicevic, M.; Srdjevic, B. Approach of decision making based on the analytic hierarchy process for urban landscape management. Environ. Manag. 2013, 51, 777–785. [Google Scholar] [CrossRef] [PubMed]
  34. Ying, X.; Zeng, G.M.; Chen, G.Q.; Tang, L.; Wang, K.L.; Huang, D.Y. Combining AHP with GIS in synthetic evaluation of eco-environment quality—A case study of Hunan Province, China. Ecol. Model. 2007, 209, 97–109. [Google Scholar] [CrossRef]
  35. Kutut, V.; Zavadskas, E.K.; Lazauskas, M. Assessment of priority alternatives for preservation of historic buildings using model based on ARAS and AHP methods. Arch. Civ. Mech. Eng. 2014, 14, 287–294. [Google Scholar] [CrossRef]
  36. UNESCO. Operational Guidelines for the Implementation of the World Heritage Convention. 2012. Available online: http://whc.unesco.org/archive/opguide12-en.pdf (accessed on 8 August 2021).
  37. Zhang, Q.; Guo, H. Suitability Analysis of Heritage Corridor Based on GIS and RS. Planners. 2015. Available online: https://en.cnki.com.cn/Article_en/CJFDTotal-GHSI2015S1066.htm (accessed on 9 October 2020).
  38. Girard, L.F.; De Toro, P. Integrated spatial assessment: A multicriteria approach to sustainable development of cultural and environmental heritage in San Marco dei Cavoti, Italy. Central Eur. J. Oper. Res. 2007, 15, 281–299. [Google Scholar] [CrossRef]
  39. Cassatella, C.; Peano, A. Landscape Indicators: Assessing and Monitoring Landscape Quality; Springer: Amsterdam, The Netherlands, 2011. [Google Scholar]
  40. Vizzari, M. Spatial modelling of potential landscape quality. Appl. Geogr. 2011, 31, 108–118. [Google Scholar] [CrossRef]
  41. Uuemaa, E.; Mander, Ü.; Marja, R. Trends in the use of landscape spatial metrics as landscape indicators: A review. Ecol. Indic. 2013, 28, 100–106. [Google Scholar] [CrossRef]
  42. TICCIH. The Nizhny Tagil Charter for the Industrial Heritage. In the TICCIH XII International Congress. Moscow, Russia. 17 July 2003, pp. 169–175. Available online: https://www.icomos.org/18thapril/2006/nizhny-tagil-charter-e.pdf (accessed on 21 July 2021).
  43. Jiang, P.; Shao, L.; Baas, C. Interpretation of Value Advantage and Sustainable Tourism Development for Railway Heritage in China Based on the Analytic Hierarchy Process. Sustainability 2019, 11, 6492. [Google Scholar] [CrossRef] [Green Version]
  44. Sowińska-Świerkosz, B.; Michalik-Śnieżek, M. The Methodology of Landscape Quality (LQ) Indicators Analysis Based on Remote Sensing Data: Polish National Parks Case Study. Sustainability 2020, 12, 2810. [Google Scholar] [CrossRef] [Green Version]
  45. Li, Q. Historical Reconstruction and Complementary Development: A Preliminary Study on the Heritage Protection and Tourism Development of the Yunnan Section of the Yunnan-Vietnam Railway Heritage Corridor. Arch. Cult. 2011, 8, 100–101. [Google Scholar]
  46. Brunsden, D.; Thornes, J.B. Landscape sensitivity and change. Trans. Inst. Br. Geogr. 1979, 4, 463–484. [Google Scholar] [CrossRef] [Green Version]
  47. Tudor, C. An Approach to Landscape Sensitivity Assessment—To Inform Spatial Planning and Land Management. Natural England. 2019. Available online: https://www.gov.uk/government/organisations/natural-england (accessed on 20 April 2020).
  48. Tveit, M.; Ode, Å.; Fry, G. Key concepts in a framework for analysing visual landscape character. Landsc. Res. 2006, 31, 229–255. [Google Scholar] [CrossRef]
  49. Dika, I.R.; Aničić, B.; Krklec, K.; Andlar, G.; Hrdalo, I.; Pereković, P. Cultural landscape evaluation and possibilities for future development–a case study of the island of Krk (Croatia). Acta Geogr. Slov. 2011, 51, 129–150. [Google Scholar] [CrossRef]
  50. Gnanapala, W.A. Tourists perception and satisfaction: Implications for destination management. Am. J. Market. Res. 2015, 1, 7–19. [Google Scholar]
  51. Saaty, T.L. Decision making—The analytic hierarchy and network processes (AHP/ANP). J. Syst. Sci. Syst. Eng. 2004, 13, 1–35. [Google Scholar] [CrossRef]
  52. Saidi, H. AHP and Fuzzy Comprehensive Method in Railway Landscape Evaluation. Master’s Thesis, Central South University, Changsha, China, 2011. [Google Scholar]
  53. Chamberlain, B.C.; Meitner, M.J. A route-based visibility analysis for landscape management. Landsc. Urban. Plan. 2013, 111, 13–24. [Google Scholar] [CrossRef]
  54. Leung, L.C.; Cao, D. On consistency and ranking of alternatives in fuzzy AHP. Eur. J. Oper. Res. 2000, 124, 102–113. [Google Scholar] [CrossRef]
  55. Hauke, J.; Kossowski, T. Comparison of Values of Pearson’s and Spearman’s Correlation Coefficient on the Same Sets of Data. Master Thesis, Adam Mickiewicz University, Poznan, Poland, 2011. [Google Scholar]
  56. Hopkins, W.G. Understanding statistics by using spreadsheets to generate and analyze samples. Sportscience 2007, 11, 23–37. [Google Scholar]
  57. Peña, L.; Casado-Arzuaga, I.; Onaindia, M. Mapping recreation supply and demand using an ecological and a social evaluation approach. Ecosyst. Serv. 2015, 13, 108–118. [Google Scholar] [CrossRef]
  58. Huang, X.; Wang, Y.; Li, J.; Chang, X.; Cao, Y.; Xie, J.; Gong, J. High-resolution urban land-cover mapping and landscape analysis of the 42 major cities in China using ZY-3 satellite images. Sci. Bull. 2020, 65, 1039–1048. [Google Scholar] [CrossRef]
  59. Biedenweg, K.; Williams, K.; Cerveny, L.; Styers, D. Is recreation a landscape value? Exploring underlying values in landscape values mapping. Landsc. Urban Plan. 2019, 185, 24–27. [Google Scholar] [CrossRef]
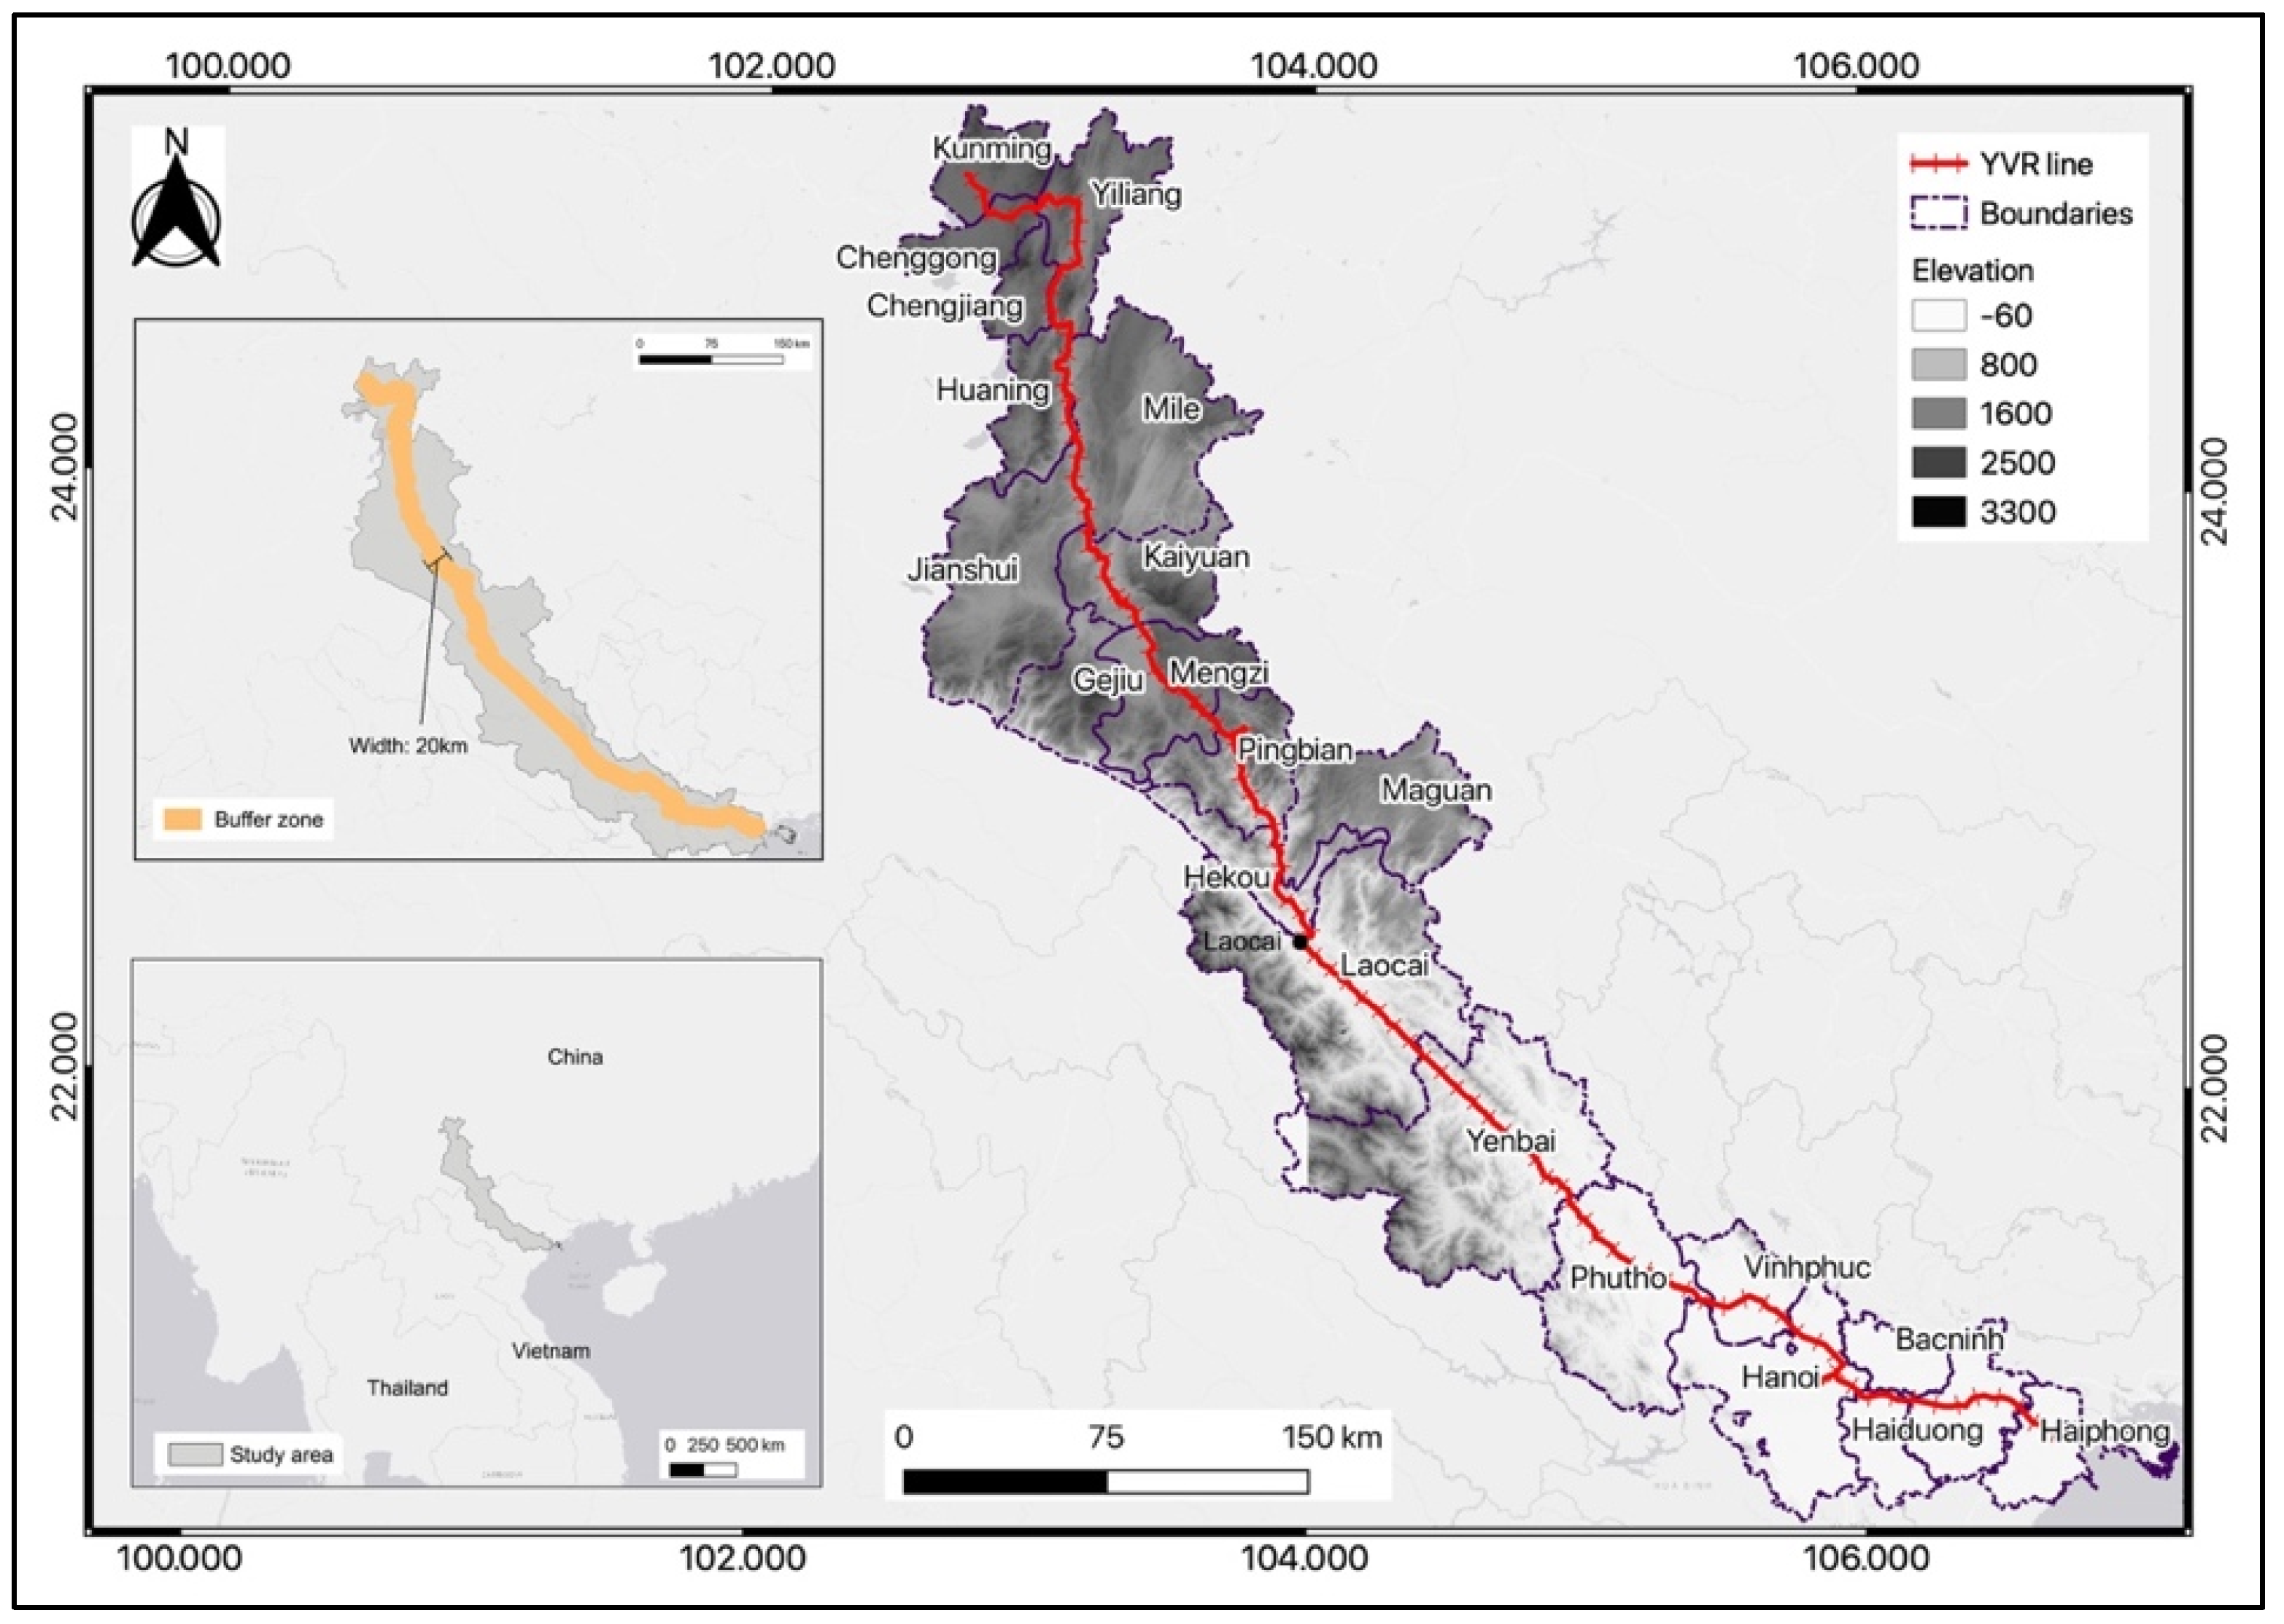
Figure 1. Study area. The created buffer zone inside the study area and the global location of the study area are also included in this figure.
Remotesensing 14 00603 g001
Figure 2. Workflow.
Figure 2. Workflow.
Remotesensing 14 00603 g002
Figure 3. The result the landscape value. Class 1 means area with lower landscape value; class 2 indicates the middle-low value; class 3 means a middle landscape value; class 4—middle-high value; class 5 means a higher landscape value.
Remotesensing 14 00603 g003
Figure 4. Zonal statistic of the landscape value in the study area. The classes are divided according to their relative values in the study area. Class 1 means the county with a low average value; class 2 means a middle average value; class 3 means a high average value of landscape.
Remotesensing 14 00603 g004
Figure 5. Visualization of each topic of indicators. The classification of each class: class 1 means low value, covering 0–1.6; class 2 means middle value of 1.7–3.3; and class 3 means high value of 3.4–5.
Remotesensing 14 00603 g005
Table 1. Data sources.
SourceContentFormatSpatial
Resolution
DIVA-GISAdministrative divisions; rivers; roads; railroads; ethnic groupsVector
World ClimMonthly temperatureRaster1000 m
CIESIN 1Economic and population dataExcel table
Earth ExplorerSentinel-2 satellite images; DEMRaster500 m
Global Forest WatchBiodiversity significanceRaster100 m
Earth dataMODIS Land Cover-MCD12Q1 (2001; 2018)Raster500 m
Online Map (Baidu map and open street map)Scenic spots (parks, mountains, historical monuments, scenic resorts)Vector
Social media (Flickr)Popular photo-shooting sitesVector
Archive of MulhouseHistorical photo sites by YVRVector
1 The Center for International Earth Science Information Network.
Table 2. Railway landscape evaluation system.
IndicatorIndexIDReferencesSources
Visual quality (B1)Scenic spotsC1[46]Baidu and open street map
VisibilityC2Archive of Mulhouse
Stream densityC3DIVA-GIS
Ecology (B2)NDVI 2C4[47]Earth Explorer
NaturalnessC5Earth Explorer
BiodiversityC6Global Forest Watch
Technology (B3)Historical richnessC7[48]Archive
Engineering difficultyC8Earth Explorer
Climate suitabilityC9World Clim
Social culture (B4)Population densityC10[49]CIESIN
Cultural diversityC11DIVA-GIS
Economy growthC12CIESIN
Tourism (B5)Touristic servicesC13[50]Baidu and open street map
AccessibilityC14DIVA-GIS
PopularityC15Flickr
2 Normalized difference vegetation index assesses whether the land being observed contains green vegetation or not.
Table 3. Rule of reclassification of indexes.
IndexClass (Score)
C15, Distance < 50
4, 50 m < Distance < 150
3, 150 m < Distance < 1000
2, 1000 m < Distance < 5000
1, Distance > 5000 (m) [52]
C25, Distance < 50
4, 50 m < Distance < 150
3, 150 m < Distance < 1000
2, 1000 m < Distance < 5000
1, Distance > 5000 (m) [53]
C31, Density < 0.079
2, 0.079 < Density < 0.098
3, 0.098 < Density < 0.117
4, 0.117 < Density < 0.145
5, Density > 0.145 (/km2)
C41, NDVI < 0.155
2, 0.155 < NDVI < 0.244
3, 0.244 < NDVI < 0.338
4, 0.338 < NDVI < 0.481
5, NDVI > 0.481
C51, Urban area; 2, Bare area
3, Grassland; 4, Shrubland; 5, Forest
C61, value: 0–1; 2, value: 1–4
3, value: 4–5; 4, value: 5–7
5, value > 7
C71, Density < 0.307
2, 0.307 < Density < 1.539
3, 1.539 < Density < 5.233
4, 5.233 < Density < 19.395
5, Density > 19.395 (/km2)
C81, slope < 4.696
2, 4.696 < slope < 10.531
3, 10.531 < slope < 17.442
4, 17.442 < slope < 25.855
5, slope > 25.855 (degree)
C91, Temp < 20.091
2, 20.091 < Temp < 21.590
3, 21.590 < Temp < 25.782
4, 25.782 < Temp < 27.984
5, Temp > 27.984 (°C)
C101, Density < 20
2, 20 < Density < 150
3, 150 < Density < 500
4, 500 < Density < 1000
5, Density > 1000 (person/km2)
C111, Density < 0.082
2, 0.082 < Density < 0.306
3, 0.306 < Density < 0.621
4, 0.621 < Density < 1.068
5, Density > 1.068 (/km2)
C121, Rate < 12.96%
2, 12.96% < Rate < 13.11%
3, 13.11% < Rate < 13.46%
4, 13.46% < Rate < 13.89%
5, Rate > 13.89%
C131, Density < 0.290
2, 0.290 < Density < 0.871
3, 0.871 < Density < 3.192
4, 3.192 < Density < 16.831
5, Density > 0.621 (/km2)
C141, Density < 0.048
2, 0.048 < Density < 0.071
3, 0.071 < Density < 0.092
4, 0.092 < Density < 0.118
5, Density > 0.118 (/km2)
C151, Density < 2.361
2, 2.361 < Density < 2.721
3, 2.721 < Density < 5.443
4, 5.443 < Density < 21.775
5, Density > 21.775 (/km2)
Table 4. Result of the Delphi method.
IndicatorComparison of Two IndexesResult
(Experts)
Weight
(The First Index)
Consistency 3
B1Scenic spots VS Visibility1/142.86%0.0000
Visibility: VS Stream density3/142.86%
Stream density VS Scenic spots1/314.29%
B2NDVI VS Naturalness1/310.0%0.0000
Naturalness VS Biodiversity1/230.0%
Biodiversity VS NDVI6/160.0%
B3Historical richness VS Engineering difficulty1/326.50%0.0372
Engineering difficulty VS Climate suitability5/163.33%
Climate suitability VS Historical richness1/310.62%
B4Population density VS Cultural diversity1/412.26%0.0176
Cultural diversity VS Economy growth2/155.71%
Economy growth VS Population density3/132.02%
B5Touristic services VS Accessibility1/327.21%0.0713
Accessibility VS Popularity4/111.99%
Popularity VS Touristic services1/360.80%
3 The consistency is used to check the result of importance comparison and whether the weights in each group of indicators are inconsistent. If the consistency is smaller than 0.1, the inconsistency is acceptable [54].
Table 5. Calculated Pearson Correlation (r) for each pair of indexes.
C1C2C3C4C5C6C7C8C9C10C11C12C13C14
C2−0.19
C3−0.03−0.14
C4−0.040.070.04
C50.020.190.100.12
C6−0.13−0.100.310.220.15
C70.120.07−0.24−0.260.130.20
C8−0.020.16−0.130.180.150.420.52
C9−0.05−0.120.520.22−0.12−0.05−0.73−0.38
C100.22−0.160.24−0.32−0.17−0.44−0.37−0.680.37
C110.17−0.150.46−0.19−0.06−0.22−0.18−0.440.400.72
C120.060.08−0.51−0.360.05−0.290.650.21−0.83−0.12−0.14
C130.34−0.140.01−0.040.050.31−0.04−0.320.020.480.500.18
C140.17−0.100.31−0.03−0.120.03−0.25−0.380.360.550.48−0.350.31
C150.42−0.020.21−0.250.020.010.10−0.180.050.470.610.080.62−0.11
Publisher’s Note: MDPI stays neutral with regard to jurisdictional claims in published maps and institutional affiliations.