Abstract
The Historic Urban Landscape provides a basis to comprehensively study the city, considering the numerous agents and stakeholders involved in the urban phenomenon. However, the characterisation of the city is challenging, due to the numerous ways of reading and using the city. Although several theoretical approaches address the process of documenting the city, there is still a gap related to the design of a generalised, holistic, and comprehensive framework. This article aims to contribute to this purpose by discussing the concept of the Historic Urban Landscape (HUL) and its implications for the characterisation of the urban phenomena. The Aristotelian theory of the causes is proposed here as a suitable approach for the description, characterisation, and analysis of virtually any entity by first discussing its theoretical basis and then testing it in a real building located in the historical city, Guimarães, Portugal. A set of tools related to Geographic Information System databases are comprehensively explored during the implementation process of the approach, allowing to identify and discuss a set of limitations, challenges, and opportunities.
1. Introduction
The documentation of any entity begins by recognising its representative attributes, the convenient code to be used, and how the codification will be conveniently organised and stored. Some codes are commonly given as a matter of fact, due to existing conventions in some fields. For example, to characterise a construction by using plans and photographs. However, it is convenient to recognise that the whole documentation process is meaningful for determining the representativeness of the objects when decoded from the documental source. As an early-stage step in the process, the survey design and planning have a relevant role in obtaining representative models. These preparatory activities are sometimes underestimated when, for example, a determined set of attributes to be surveyed is given as a standardised model for a determined purpose. It is important to keep in mind that there exist numerous approaches for codifying our physical reality, regardless of the nature of the surveyed object. For instance, a sentence gives a formal characterisation of determined information conveyed by the sentence. If there is a consistent truth condition in the real world, then the sentence can be a reliable sign of reality [1]. In other words, the consistency between the real-word truth condition and the properties claimed by its sign is the key to a proper encoding.
Encode something, then, is closely related to the purpose that the coded representation will have. If the only complete representation of a thing is the thing by itself (law of identity), then any representation necessarily involves a certain loss of information. We can accept that such a loss is neglectable, depending on the purpose or function. Therefore, the convenience and utility of using a determined code represent a problem by itself; if a sign “takes the place” of something, it is critical to recognise during the process of documentation which properties cannot be neglected or lost [2]. This issue is referred to the selection of the characteristics to be documented and the existence of logic and systematic structures for organising data.
This article discusses the concept of the Historic Urban Landscape (HUL) and its implications for the characterisation of the urban phenomena. A series of experiences and proposals for documenting the HUL will be presented and used to discuss some challenges and opportunities to comprehensively model the city in the context of its variety and the multiplicity of the actors that converge on it. Then, the Aristotelian theory of the causes will be introduced as a feasible approach for the characterisation and analysis of virtually any entity. The suitability of this approach in the context of the HUL will be discussed and put into practice through an example in the historical city of Guimarães, Portugal. For implementing this approach, a set of tools related to Geographic Information System databases will be explored, permitting us to identify a set of limitations, challenges and opportunities associated with the implementation of this approach.
2. The Historic Urban Landscape
The transit on a predominantly globalising and urban world is an opportunity for questioning the role that urban heritage conservation has in the present-day and future urban dynamics. Cities are subjected to numeral pressure sources, such as touristic, demographic, economic, cultural, and infrastructure requirements [3]. The growth of the cities is implicitly related to the cultural and economic variety. Most of the changes have been especially fast in the last century, creating a series of generalised and systematic problems that threaten the identity and culture of the communities.
Even if globalisation imposes similarities in terms of financial dynamics, information technology, or urban development among the cities, their culture and heritage are still distinguishable and have unique resources in each one of them. These concerns lead to the design of an interdisciplinary and holistic approach: the Historic Urban Landscape (HUL). This approach pretends to guide the changes of the cities based on the recognition and identification of the natural and cultural, tangible and intangible, international and local values present in any city [4].
2.1. The Historic Urban Landscape
The Historic Urban Landscape is both an approach and a definition: an approach for integrating the urban conservation in a generalised framework for sustainability; and a definition of the historic environment regarding its distinctive elements, identity, and richness [5]. The Recommendation on the Historic Urban Landscape [6] defines the HUL based on cultural and material traits. It recognises the city as the result of a historical layering of cultural and natural values and attributes, including its surrounding context. If analysed, the definition numbers a series of specific agents to be considered:
“…
8. The historic urban landscape is the urban area understood as the result of a historic layering of cultural and natural values and attributes, extending beyond the notion of “historic centre” or “ensemble” to include the broader urban context and its geographic setting.
9. This wider context includes notably the site’s topography, geomorphology, hydrology and natural features, its built environment, both historic and contemporary, its infrastructures above and below ground, its open spaces and gardens, its land use patterns and spatial organisation, perceptions and visual relationships, as well as all other elements of the urban structure. It also includes social and cultural practices and values, economic processes and the intangible dimensions of heritage as related to diversity and identity.”
This definition is especially meaningful for contextualising the first of the so-called “Six Critical Steps”, which are considered as the minimum steps for implementing the HUL approach: “to undertake comprehensive surveys and mapping of the city’s natural, cultural and human resources” [4]. The examples of HUL implementation found in the literature demonstrate that these works of surveying and mapping are difficult to standardise due to the complexity of the HUL-associated phenomena [7]. The challenge of having comprehensive surveys and maps implies dealing with multiple criteria for selecting significative attributes, having suitable structures and means for data coding and organisation, and designing adequate survey strategies. Besides, it is essential to assess the integration of the HUL in the context of transversal politics, such as the Sustainable Development Goals [8,9], national or local developing plans, etc.
A comprehensive survey may include a wide variety of data, metrics, and indicators. For instance, the categorisation of the promoters and consumers. Landscape and cultural heritage indicators. Or even indicators associated with the performance of the different uses found in the HUL [10]. This condition of the HUL implies the involvement of numerous stakeholders, experts, and professionals with specific interests and scopes towards the historic city. Many of these actors implicitly have specific approaches, namely associated with different ways for modelling and surveying the city. This divergence on the characterisations of the Historic Urban Landscape brings the pertinency of discussing the potential conciliation and integration of multiple interests for a comprehensive characterisation of the HUL.
2.2. Experiences Facing the Challenge of Encoding the HUL
The singularities of the historic city make it challenging to propose universal and standardised approaches. Santander et al. (2018) [11] explore how the development of indicators is still an open debate, referring to some valuable antecedents, such as the ones of the conventions of Vienna and St. Petersburg (Table 1). Even if there is a categorisation of the city agents, each agent would demand a proper approach for being described. Thus, it becomes important to distinguish if a determined agent is reasonably characterised by its simple categorisation or if it is necessary to provide further descriptions. For instance, depending on the purpose of the description, if it is enough to declare the species of a determined tree for having a series of generic properties, or more detailed information is required to do so.

Table 1.
Key indicators discussed in the 2007 convention of St. Petersburg (2007) as referred by [11].
Another interesting approach for categorising the historic city is provided by Guzmán et al. (2020) [12]. This proposal summarises a series of indicators and their corresponding units of measure, based on a SWOT (Strengths, Weaknesses, Opportunities, and Threats) analysis designed in the context of the sustainable development of the historic city (Table 2). This approach intends to provide a generalised framework for organising a series of indicators that reasonably describe the city. However, since this system is based on the idea of urban performance, it may have some limitations for representing certain types of information, such as geographical parameters. Nevertheless, it represents an interesting approach for pursuing a holistic and comprehensive framework for characterising the city.
Table 2.
SWOT analysis for the historical city of Queretaro. Adapted from [12].
The proposal of Kokla et al. (2019) [13] pursues the semantic formalisation of historical centres by interpreting the definition of the HUL, conceiving that the HUL has a complex network of relations with tangible and intangible elements enclosed in an anthropic and natural environment (Figure 1). Furthermore, the HUL description opens a series of categories that can have individual descriptions and hierarchies depending on the multiple meanings and uses that the historic city has (Figure 2).
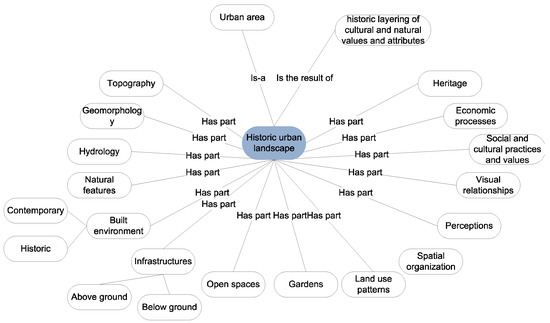
Figure 1.
Semantic formalisation of the concept of “historic towns and urban areas.” Adapted from [13].
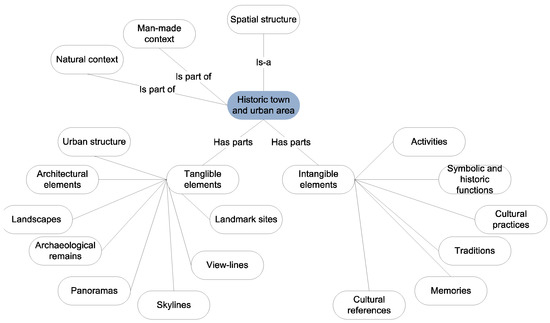
Figure 2.
Semantic formalisation of the concept of “historic urban landscape.” Adapted from (Kokla et al. 2019).
This approach is significant for illustrating a wide sample of fields of interest that converge in the HUL. Furthermore, it is important to recognise that the elements identified in this approach can be further expanded in numerous fields and specialised areas. For instance, the unfolding of the many activities related to cultural heritage. Once again, this schematic representation of the HUL is an approach that suggests the complex challenge of offering a comprehensive description of the city.
The works of Vehbi et al. (2009) [14] suggest that the identification of representative indicators may result from enquiring a series of causal events and their measurable consequences. For instance, the assessment of the health of a community by measuring the percentage of mothers with adequate prenatal care or the total chronic disease-related deaths per 100,000 habitants. This approach permitted to match the outputs of numerous indicators and the corresponding causing factors for generating a set of sustainable urban revitalisation indicators, divided into economic, environmental, and social indicators. These sets (Table 3) are the product of a workflow that includes the parameters’ validation.
Table 3.
Sustainable urban revitalisation indicators. Adapted from [14].
Many of the attributes considered by these authors share a certain attachment to the building-scale information. In fact, a significant number of urban-scale phenomena can be tracked from information gathered from a building and its permanent or temporary inhabitants. Hence, framing the data acquisition at the scale of a single building would permit the development of numerous surveys with complementary and variated purposes, including the quality of life associated with the cultural heritage [15].
The review of these precedents reveals that the characterisation of the HUL is still an open and complex discussion that comprises a series of challenges related to the complexity of the city and the actors interested in its study. The design and implementation of generalised frameworks for the comprehensive characterisation of the city are still gaps, whose solution would be a key for the successful implementation of the HUL approach.
3. Towards a Suitable Logic for Encoding the HUL
The characterisation of the current state of the historical city is a critical step towards implementing the HUL approach, which is complementary and interdependent to sustainable urban development. Such characterisation includes a vast number of indicators for modelling the dynamics of a city from the economic, social, cultural, and environmental points of view. Numerous indicators are strongly related to the dynamics between the people and the built environment, such as public services and house facilities. However, the task of reuniting apparently divergent attributes may be problematic when designing a unified scheme for encoding information. Hence, it is pertinent to analyse the step before the selection of the indicators and attributes to be surveyed and discuss how a particular set of characteristics of a physical entity can be organised and enriched regardless of the nature of data and the specific purpose of the model. In other words, it becomes pertinent to discuss purely ontological approaches for generally describe and analyse entities, departing from an unbiased interest.
3.1. The Aristotelian Causes as an Approach for Categorising the Surveys
The accuracy of the description of an entity is necessarily dependent on the formulated questions. In this sense, the singularities of the cities (and their components) make it challenging to establish a standardised framework. Nevertheless, as discussed in Section 2.2, several authors agree on studying the impact that singular agents have in the historic city’s context from the economic, social, cultural, and environmental points of view. To systematise the data acquisition for understanding each one of these dimensions is not necessarily a single work but the sum of numerous sets of suitable and specific surveys. However, the discussion is still open, and there are several intents for proposing robust frameworks for formalising and organising the sets of characteristics that define the HUL and its elements.
A plausible approach for categorising the layers of information to be surveyed from an entity can be understanding it through the Aristotelian principle of the four causes. This approach fundamentally accepts that there are four elemental answers to the question “why?” when analysing an entity: the material, formal, efficient, and final causes. This theory frames any entity in a hypothetical continuum of causes in which each one of the elements that compose a determined entity has its own sets of elemental causes [16].
Generally speaking, the material cause regards the tangible matter that represents the object in the physical world. The formal cause is the arrangement, organisation shape, appearance, or spatial consequence of the entity. The efficient cause is the set of external agents whose intervention permits the existence and performance of the object [17]. The final cause is the purpose and/or function that an object has [18].
It is relatively easy to recognise these elemental components in simple and paradigmatic objects, but a more complex analysis may make it difficult to categorise the causes in a precise manner. A classic example consists of analysing a table. In this case, the material cause may be wood, metal, plastic, or any other material. The formal cause will be the geometrical description of the table. The efficient cause would be the carpenters that fabricated the table. A final cause for the table would be to eat on it, for example. The assessment of a building is not that simplistic, of course. However, the categorisation of some sets of attributes would help organise the information. Furthermore, a nested organisation of the layers of information would permit the design of a unified framework.
The interest of analysing entities by using this approach lies in the possibility of establishing a unified logic for successively exploring the parts of an entity until the level of information detail is considered satisfactory for a determined purpose. For example, we can declare that the material cause of a building is “masonry.” This answer may be satisfactory enough for a specific purpose, such as cataloguing, but insufficient for obtaining relevant information about the structure. Hence, it would become relevant to explore the causes of the “masonry”, i.e., the exact attributes that specifically belong to “that” masonry.
This nested and enlargeable structure permits categorising the fundamental causes of an entity regarding the four different types of causes, being that a cause can be related to an unlimited number of instances able to be further analysed. It is possible to individually describe these instances or categories by categorising their own causes. The process of categorisation and description has a certain fractal development, in which it is possible to explore diverse elements of an entity with different levels of deepness without losing consistency. An example of this procedure is depicted in (Figure 3), where a plausible structure for finding a causal link between the HUL and the mortar of a determined building.
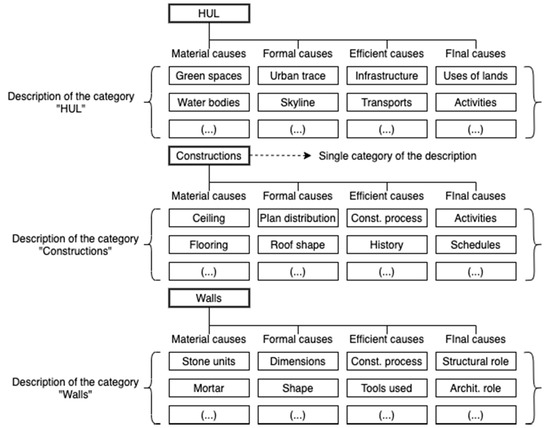
Figure 3.
Example of a nested analysis of causes.
When analysed from its fundamental causes, the HUL may have a series of instances. For example, the material causes of the HUL (i.e., the tangible components of the HUL) may be itemised as a series of generic instances, such as green areas, water bodies, and buildings. Naturally, each instance can be further analysed and categorised.
In this example, there is interest in unfolding the causes for the constructions, and consequently, a series of instances is proposed according to each fundamental cause of them. It is worth noting that this categorisation can be as exhaustive as necessary, framing more specific instances, such as “houses” instead of “buildings”.
The analysis of the material causes of a building proposes a series of instances that determine the materiality of the construction. The process of determining these instances has been extensively explored in the past, namely in the context of the Building Information Modelling approaches. In fact, the standardisation of components and libraries (namely based on the IFC standards) offers a robust point of departure [19]. Finally, when exploring the material causes of a wall, it is relevant to find a suitable position for establishing the instance of “mortar” and its further analysis.
The causal analysis, however, can be supported by some generalising ideas. For a building, the material causes would be all the substances that give tangibility to the construction. The formal cause would be the spatial consequences of the building: its geometry, shapes, volumetrics. The efficient cause is the set of agents that possibilities the existence of the building. However, in a broad sense, it is not only who built it and how, but what does permit to keep the building’s ontological efficiency and/or performance. For instance, a house without a water supply is not properly working according to the “house concept”. It is important to recognise that the efficient cause is closely related to the expected performance of the entity. In other words, it is closely associated with the final cause, which represents the use of the building, its users, and its dynamics of use.
To feasibly generate a flexible approach based on the Aristotelian principles, it is necessary to design and manage databases able to be enlarged as much as necessary, permitting to store and manage qualitative and quantitative data without losing the structured organisation. The control of the granulometry of the information for representing the built environment has already been explored for representation purposes in digital models. Approaches, such as the Level-Of-Detail for three-dimensional modelling, propose generalised frameworks for defining thresholds for the information contained in a model [20]. However, this approach does not observe the flexibility for selectively having different levels of detail in multiple instances of the same model [21]. This customised compartmentalisation of the information is expected to satisfy the need of the various stakeholders of the HUL for an accumulative, multidisciplinary, and coherent framework.
While most of the examples found in literature build on a tree-structured organisation of the information, the Aristotelian approach is closer to a fractal development. Since the steps between instances are self-similar (i.e., based on the same set of four causes), the structure of successive steps (regarding the detail or granulometry of information) may be understood as a progressive unfolding of causes in different scales.
A very representative schematization of this recursive process may be found in the so-called “Cantor dust”. This fractal progression departs from a square that is subsequently divided into four subsets. Suppose we admit that each step corresponds to the fragmentation of an instance in its four fundamental causes. In that case, it is possible to see that the structure represents the progressive nature of this analysis.
Furthermore, from this geometrical schematization, one can observe that the process of fitting the descriptors needed by multiple stakeholders in this structure allows assembling a coherent and comprehensive description in upper levels. As shown in Figure 4, different stakeholders would need to analyse diverse aspects of the entity with varying levels of granulometry of data. For example, a determined stakeholder may be interested in knowing if a specific construction is made of masonry, whereas another stakeholder would need to specifically know which kind of stone is that masonry made of (Figure 5). Thus, if clearly structured and organised, the information generated by a stakeholder can be potentially valuable as a full integrative description.
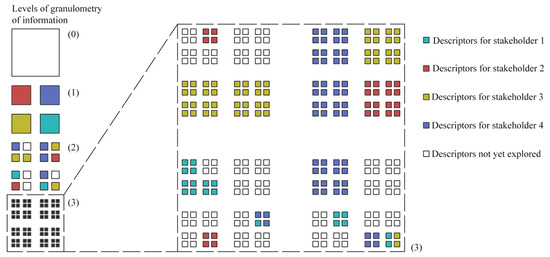
Figure 4.
The “Cantor Dust” fractal as a schematic representation of the proposed approach. The level of specificity or granulometry of information is here schematized by departing from the more general level of information (0) and subsequent stages of more detailed analysis (1), (2) and (3).
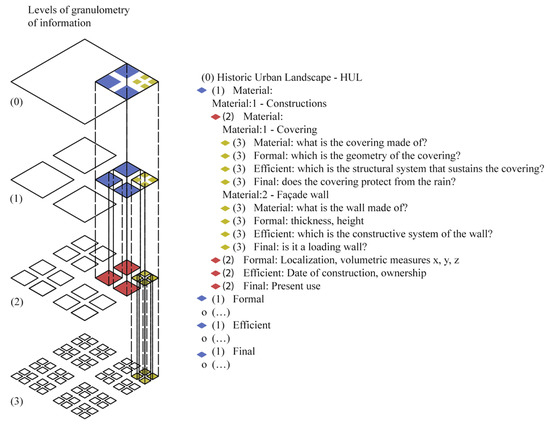
Figure 5.
Schematization of a series of attributes fitted in an HUL structure.
It is worth highlighting that, even when different stakeholders develop independent surveys with specific queries, provided that similar criteria are used for organising the levels of information and the relations among the elements of the HUL, a collaborative database can be eventually obtained, as shown in Figure 6. This figure also illustrates how a single stakeholder would be interested in information with different levels of granulometry without compromising the uniformity and order of the structure.
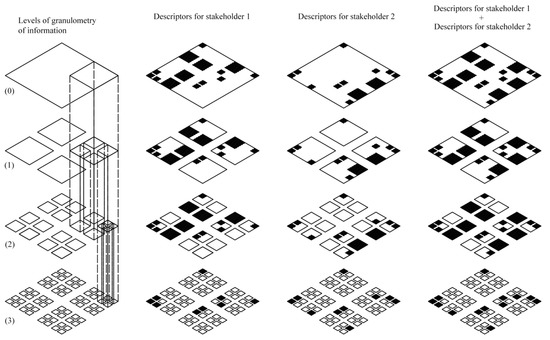
Figure 6.
Schematization of the convergence of different surveys in a unified model. The level of specificity or granulometry of information is here schematized by departing from the more general level of information (0) and subsequent stages of more detailed analysis (1), (2) and (3).
This approach is particularly meaningful when used for structuring databases—ideally integrated with existing tools and survey methods, for ease’s sake—to be fed, consulted, and managed by multiple stakeholders. Just as different stakeholders converge in the HUL, there is a wide set of databases and platforms for managing HUL-related data. One of the most versatile, well-known, and diffused ones are the Geographic Information Systems (GIS).
3.2. The Use of a Geographic Information System-Based Workflow for Facilitating On-Site Surveying
Since its emergence, Geographic Information System platforms have been valuable tools for organising and managing information related to the physical world. Nowadays, due to the accessibility to free and open-source software, GIS tools are available for a vast number of stakeholders with interests in the territory and the environment. GIS databases offer information from various sources, including a vast number of thematic maps developed by governments, research institutions, and specialised agencies [22].
An interesting possibility of the use of GIS is to facilitate collaborative work for assembling databases. In fact, there are numerous tools and software that permit sharing a GIS database between multiple actors [23]. This implicit advantage is compatible with an approach based on the selective enlargement of the database. For instance, it is possible to design a public semantic structure for categorising the levels of information. Each category would be associated with its proper set of descriptors according to the four causes. At the same time, each descriptor can become a category for further descriptions, if needed. Then, the structure would be systematically enlarged based on a primary and controlled structure.
The strategies for data acquisition must be compatible and coherent with the nature of the surveyed information. As analysed in Section 2.2, a significant part of the meaningful attributes of the HUL depends on the information of different scales. Therefore, it becomes relevant to suggest an adaptative, economic, and suitable survey strategy to be used by different users and stakeholders.
A feasible approach for the collaborative work on GIS databases is to store the database file in a cloud service that numerous (preferably portable) devices can simultaneously access. If those devices permit the edition and real-time synchronisation of the file, it is possible to sustain a dynamic database in constant change and enrichment. This goal, however, is much more feasible when using open-source and/or free distribution software. The integration of the QGIS + Mergin + Input software is an extraordinary example of the possibilities offered by a GIS cloud-based distribution interacting with open-source software.
QGIS is an open-code and multi-platform Geographic Information System, supported mainly by the voluntary contributions of code, corrections, and collective support. This interdisciplinary enrichment favoured the design of a comprehensive set of plugins and extensions for multiple purposes, even integrating third-party tools and software. Mergin, one of these extensions, allows store files developed in QGIS in an ad-hoc cloud. One of the products associated with Mergin is Input App, an application developed for smartphones and other portable devices. Input App allows to access, manage, and synchronise the files stored in the cloud. Therefore, these three tools constitute a closed and bidirectional workflow, see Figure 7. The files stored on Mergin can be either public or private, permitting to decide between generalised access (to anyone with the app) or a limited one, i.e., through invitation.
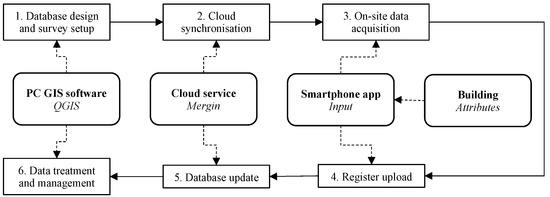
Figure 7.
Flow schematization for the integration QGIS-Mergin-Input App. Adapted from [24].
In fact, there is a wide set of public projects that reveal the collaborative potential of this tool. Some specific experiences have explored the potential of programming a customised survey for a specific purpose—for example, Ramírez Eudave et al. (2021) [24] have implemented a seismic vulnerability assessment-oriented survey to be used in field survey campaigns.
Since Input App takes advantage of the mobile devices’ GPS service, the information can be stored with an inherent georeferentiation. This characteristic is significant when mapping or surveying the elements of the HUL. The field survey accessed through Input App depends on the queries programmed in the QGIS platform and the constraints imposed in the database. QGIS and Input accept multiple types of variables, including attached files such as photographs.
4. Worked Example of Application
A short workflow has been put into practice in the following to illustrate the ideas explored in the previous sections. As discussed in Section 2 and Section 3, the success and representativeness of the models depend on the use that the model will have. In this context, the exercise is framed in the context of the characterisation of a historic building for seismic vulnerability assessment purposes.
The entire workflow will be applied to the ancient church of São Miguel do Castelo (Figure 8). This historic building is part of the set of monuments of the city of Guimarães, Portugal, recognised as World Heritage by UNESCO (2001).
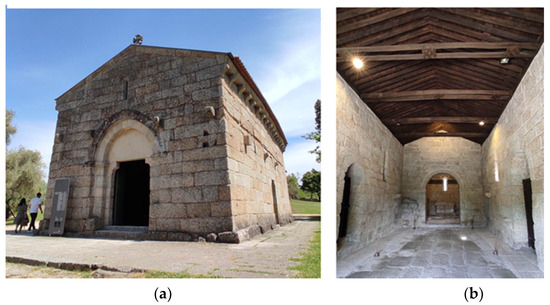
Figure 8.
Church of São Miguel, Guimarães, Portugal: main façade (a) and nave view (b).
4.1. Workflow Design and Considerations
This process will begin with the description of the attributes (instances) considered relevant in what the characterisation of the seismic behaviour of the building is regarded. Those attributes will be framed in a potential structure for the HUL of the city of Guimarães, considering the causal structures in which the instances will be located. This part of the example will present the suitability of a determined set of descriptors in the context of an Aristotelian causes-based description. The following considerations were taken to make this example as illustrative and realistic as possible:
- The constructions are here framed as one of the material causes of the HUL, understanding a primary division on natural and anthropic elements. Since this example is focused on describing a building, no further analysis will be proposed on the rest of the fundamental causes of the HUL. These causes, however, can always be explored whenever necessary. In fact, the unfolding of causes is, as discussed before, a virtually endless activity.
- The Aristotelian causes are a guide for coherently orient a series of questions regarding the materiality, geometry, performance, and function of something. Then, it is possible to have a set of queries for satisfying the explanation of a cause more than a single attribute or field. For instance, one of the many purposes that a masonry wall may have is to be seen with no plaster. This has an architectonic purpose as many different purposes that a determined masonry may have. The interests of different stakeholders may enrich the final cause of the masonry if needed.
- The material cause of a building is primarily considered in basic elements: covering, flooring systems, and façade. Each one of them can be further expanded if needed. This example considers that only special attention is paid if the construction has masonry walls as external vertical structures.
- The formal cause is addressed to the localisation and the building’s volumetric measures—since both are spatial constraints.
- The efficient cause may include who built the construction and the means used for its erection. This information is not considered for this example but can be meaningful for other specific purposes. Besides, the users are considered as an efficient cause since their action sustains the activity that the building is supposed to have. The information about the users is also able to be further expanded if needed.
- It helps think in terms of categories instead of descriptions when the fundamental causes do not seem to make sense in a determined context. For instance, it may be illogical to question the matter of a user, but it would make sense if a determined construction is a greenhouse, and its efficient cause is closely related to vegetal individuals.
- The efficient causes represent the circumstances related to the creation of the building and the sustenance of its performance conditions. Hence, a part of the system’s performance is its conservation state. Even if it is not explored in this example, the availability of electricity, water, and sewage may be explored if needed.
- The final use may involve agents, such as the explanation of the economic activities, the assets that the building houses (proper when addressing museums, collections, or stocks), the specific conditions for operability, etc.
- The tree is not exhaustive but exemplifies how a determined specific interest can be introduced in a structure that can be further expanded for storing information valuable for numerous actors.
4.2. Parameters and Queries
The seismic vulnerability assessment approach adopted herein is based on the evaluation of fourteen parameters related to the seismic performance of the building’s façade wall [25]. Each parameter receives one of four potential grades (A, B, C, and D) based on specific qualitative or quantitative conditions. Given the set of 13 characteristics to be evaluated, a set of 43 queries was defined (Table 4).
Table 4.
Summary of the Vulnerability Index Method parameters and specific queries associated with their categorisation.
The grading for each parameter depends on a series of qualitative or qualitative attributes. Hence, a parameter is, in fact, the result of a series of basic conditions. Thus, it is necessary to establish a list of individual attributes that comprise all the information needed for categorising the parameters. The queries will be then set in the corresponding attributes table of the GIS database so that they can be individually obtained during a field campaign.
As discussed in Section 3, each individual query can be framed in a specific section of the causal HUL schematization, which translates into the relationship between the attribute, indicator, or metric and the other elements of the building and the HUL. Then, it is necessary to consider the specificity of each query in the context of the deconstruction of the HUL in successive causal instances.
The queries present a variety of types and potential answers. For example, there is a series of queries where the answer is meant to confirm or deny a specific aspect (e.g., if all the openings have a regular size). Some others need the introduction of quantitative information, such as the height and length of the façade, or imply the selection of a condition from a closed set of options. All these non-numerical queries can be determined in the QGIS software under the scheme of a map of values, which permits further data treatment.
5. Results
5.1. Fitting of the Instances in the Causal Structure of the HUL
It is worth recognising that the organisation of the parameters and queries of the Vulnerability Index Method are not comparable because the queries correspond to different instances and levels of granulometry. This independent development is expected to occur for almost any set of attributes and/or customised survey. On the other hand, the organisation based in the HUL causal structure is expected to permit the localisation of virtually any potential attribute, metric, or query used to describe the elements of the HUL.
The organisation of the queries in the HUL scheme (Figure 9) unfolds from the HUL itself, at the top of the structure. It is possible to identify a series of intermediate steps that may have been considered between the HUL and the buildings. For this exercise, buildings are considered as one of the material causes of the HUL. It is possible to find that the material causes of the HUL are even more general, such as an initial categorisation between natural and artificial objects. Since the structure is expandable without losing the order and hierarchies of the granulometry, this is not considered an issue nor a limitation but a potential part of an enlarging process.
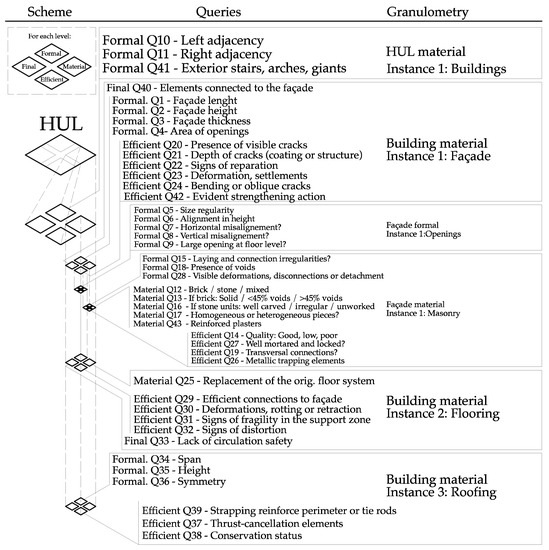
Figure 9.
Schematization of the HUL structure by using the Cantor Dust fractal representation, the correspondence with the queries, and the descriptive stages of granulometry of the information.
The analysis of the building allows for a first approach to the most general queries, those related to the exterior geometry and spatial description of the building and its adjacencies. It is interesting to note that this organisation and the level of granulometry has a logic development that is similar to the Level-of-Detail approach, suggesting a potential convergence in future analysis.
As a material instance of the HUL, buildings are subsequently analysed in their four fundamental causes for finding the next level of information. Most of the queries for the parameters are related to the structure of the building. The material causes of the building were unfolded in three instances (that would be more for a different analysis): façade, flooring, and roofing system. These instances are primarily considered as material causes since they represent general parts of the tangible substance of the construction. The analysis of the first instance—the façade—, permits us to answer some more specific queries. A very illustrative query is Q40, which relates to the existence of elements connected to the façade. From the point of view of those elements, the façade is the support, and, in consequence, it is analysed from the final cause. The formal causes of the façade permit the extraction of metrics related to its dimensions, whereas the efficient causes permit to inquiry about the damages and pathologies that condition the structural performance of the façade.
It is important to note that the analysis of the attributes of the masonry is conveniently divided into a subsequent level. The formal cause of the façade is unfolded in the first instance: the openings. Even if this unfolded instance is only analysed from its formal causes (namely the size, organisation, and alignment of the openings), it can be used in the future to include additional information with a different purpose.
Just as for the formal cause of the façade, the material cause has been unfolded in a first instance, that of masonry. It is important to note that this approach is for masonry façades only, but the causal analysis does not exclude the possibility of unfolding several material-related instances. The causal analysis of the masonry permit to summarise its geometrical configuration and potential deformations (formal causes), the type of units used (material causes) and its constructive system, quality, and status (efficient causes).
The second instance of the building’s material cause—the flooring system—is analysed from its material, final cause, and efficient cause. The analysis of the efficient cause of the flooring illustrates how a series of conditions related to pathologies and decays of an element is an integral part of its efficiency. Finally, the third instance for the building’s material cause—the roofing system—is described in terms of geometry (formal causes) and constructive elements that permit its performance as covering (efficient causes).
When articulated together, the scheme and the queries illustrate a process of selection and organisation for attributes that can be replicated for different and variate purposes, though permitting the assembling of a comprehensive and complementary database. The instances and levels analysed for this example are only a first approach that would be enlarged as needed according to the requirements of other analysis and agents.
5.2. GIS Database Setup
The church of São Miguel was selected and tagged based on an existing GIS database of the historical city of Guimarães. It was possible to draw a preliminary polygon resorting to the Open Street Maps public database as a primary source. The base map was created in QGIS (Version 3.12 București). The representative polygons of the buildings were isolated in an independent layer, in which the queries were encoded in the corresponding attribute table (Figure 10). When programming the queries, it is essential to distinguish the type of variables to be encoded: those that correspond to real numbers (such as measurable properties), the logic true/false fields, and the multiple value ones.
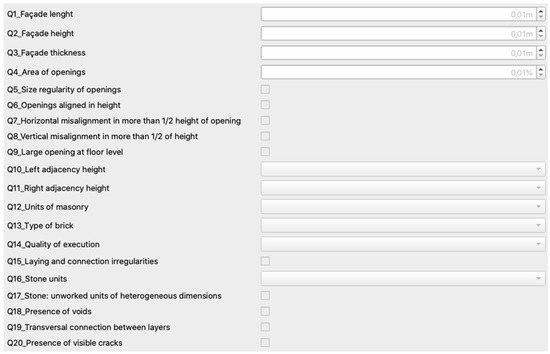
Figure 10.
Screenshot of the attribute table and the empty fields to be obtained.
Once the 43 queries were adequately encoded, the project was synchronised in the Mergin cloud storage service. It is important to remark that the present-day free hosting service is limited to 100 MB, which can limit the inclusion of attached files (namely photographs) as part of the survey. This issue, however, is not relevant in the context of this example. It is also worth noting that this workflow uses only one of the potential open-source-based software sets and does not exclude similar strategies with other tools.
5.3. Data Acquisition
When in the server, the project can be then downloaded and consulted locally using the app Input (version 0.9.2) on any mobile equipment running an Android or iOS system. This app allows to access the QGIS project and to capture the data gathered on-site by fulfilling the queries proposed for the attribute table. Since the app permits a real-time position in the georeferenced map, the constructions can be identified easily (Figure 11).
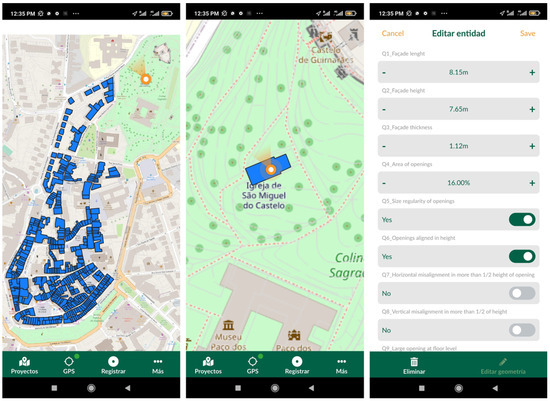
Figure 11.
Screenshots of the app Input during the on-site survey work.
The information gathered through the Input interface was synchronised with the cloud service, allowing its storage, consult, and managing within the QGIS interface (Figure 12). Besides, the QGIS software possibilities to export the data in various formats, facilitating further analysis and use for different stakeholders, namely for carrying external processes. The GIS database offers, in fact, the possibility of executing relatively simple operations fed by the data in the attribute table, but it may be limited for certain purposes.
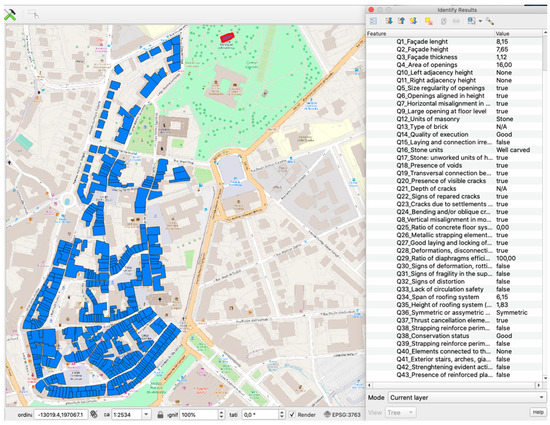
Figure 12.
Screenshot of the QGIS interface displaying the survey of the Church of São Miguel.
Even if the data treatment for carrying the vulnerability assessment method exceeds the scope of this exercise, it is pertinent to note that the grading of the building can be carried out by feeding a simple conditional-based algorithm (even in a datasheet). This process can be repeated for covering sets of buildings, such as in an HUL. The information gathered during this process is shown in Table 5.
Table 5.
Data obtained during the survey.
6. Discussion
The above-proposed exercise illustrates a sequential workflow for contextualising an approach for the Historic Urban Landscape in the Aristotelian theory of the causes by departing from a specific and realistic set of attributes to be surveyed for reaching a specific purpose. This process is expected to occur with different sets of attributes and multiple purposes, according to the variety of actors, stakeholders, and agents that converge in the Historic Urban Landscape.
This exercise accepts that the agents interested in the HUL depart from their own surveys and models. However, this example illustrates how the enlargement and enrichment of the database would open a wider horizon for exploring attributes that are not usually considered.
A worth noting issue identified during the process was the need to deconstruct some general attributes in smaller parts, namely those that consist of simple queries. This process is relevant in the context of data that different agents can further use. For example, we can accept that numerous agents would be interested in knowing the length of the façade while, in the example provided, this is a component used to evaluate some of the vulnerability assessment parameters, not a final product.
A certain dose of subjectivity was found when classifying the queries in the HUL causal structure. This is one of the challenges for the first steps of defining a causal structure. However, it is important to note that the addition of more queries and the identification of their interdependence permits clarifying the logical development of the structure. Even if there would be some difficulties for a priori classification, the immediate upper and lower-level analysis may help identify the suitability of the classification. A more extensive set of indicators and instances would certainly help the design of a robust structure. Furthermore, already existing criteria and classifications, such as those of the Industrial Foundation Class (IFC) for BIM models and Level of Detail (LoD) for urban 3D models, would help provide standardised frameworks during the causal structure design.
One of the implicit advantages of dividing the parameters into relatively simple queries is the compatibility of this approach with the proposed data acquisition procedure. Although, as demonstrated by the example provided, a relatively small survey may imply a wide set of queries, the proposed workflow permitted to easily acquire, store, and synchronise the information during an on-site campaign.
The use of the default types of data that a QGIS file accepts for characterising entities in a layer was found enough for programming the queries. Furthermore, no incompatibilities were found while carrying the complete process of the database setup, the cloud storage, the on-site data acquisition in a mobile device, and the online synchronisation. This kind of surveys can be developed on existing GIS databases. Plus, it is not even necessary to have polygons or geometrical entities for acquiring information since any surveyor can store single points associated with a determined survey. This approach would be helpful in census and surveys non-related to buildings, such as urban furniture, vegetation, or events. Then, it is consistent with the flexibility and robustness needed for surveying the multiple layers of the HUL.
Some limitations found during the exercise were related to the impossibility of editing the attribute table from the app Input. This may be an issue if there is a problem while programming the survey. Another potential issue is that the information stored by a determined surveyor would overwrite existing data, namely when the file was not synchronised and a determined entity appears as empty. In fact, the workflow depends on a manual frequent refreshing of the file for visualising the latest changes in the file.
The complete experience would be enriched by the repetition of this process in the context of a very different survey related to the HUL for testing the enrichment and enlargement of the HUL causal structure when several and interdisciplinary approaches have occurred.
7. Conclusions
The interest in understanding and analysing the historical city as a complex phenomenon has supported the development of the Historic Urban Landscape approach. This methodology is intended to unify the multiple ways of understanding and living the city, including the point of view and needs of multiple stakeholders, helping decision-making. The HUL approach’s success primarily depends on the surveying and mapping of the natural, cultural, and human resources of the city.
There is no unique approach for documenting the HUL since the stakeholders need specific sets of information for their processes. However, some generalising approaches have been proposed. A feasible approach for reading and describing the HUL involves recognising it as a series of entities linked by causal relations. The analysis of these relations through the scope of the Aristotelian theory of the causes permits the establishment of logical structures for exploring specific dimensions of the urban phenomenon in a generalised framework, respecting the relations between the components. This categorisation and description process is valuable for organising the information generated from multiple actors, articulating a comprehensive description of the urban entity.
The Aristotelian causes approach, based on identifying the material, formal, efficient, and final causes of the constituent entities, permits to reach levels of detail of the descriptions as deep as necessary, nesting a series of surveys. The implementation of the Aristotelian causal structure for organising the information requires conceiving the HUL system as a series of nested instances. This exercise would be unusual in the context of specific and specialised approaches to the historical city but is especially meaningful while designing a common framework for understanding the HUL as a holistic, complex, and comprehensive set of phenomena. One of the interesting purposes of this approach is the potential conciliation and integration of already existing works and views on the historic city.
Resorting to a standardised framework to survey the city also allows that the parameters (deconstructed in basic instances and causal-related queries) can be investigated utilizing relatively simple means, such as attribute tables within QGIS databases.
Furthermore, the availability of open-source software and its integration with cloud-based storage permits sharing and managing GIS files from portable devices. This approach facilitates the on-site surveying of the city, which may support wide collaborative networks for documenting the HUL, reaching the goal of having a holistic, interdisciplinary, and complementary view of the historical city.
Author Contributions
Conceptualisation, R.R.E.; investigation, R.R.E.; writing—original draft preparation, R.R.E.; writing—review and editing, T.M.F. and R.R.E.; supervision, T.M.F. All authors have read and agreed to the published version of the manuscript.
Funding
This research was funded by the European Union through the European Social Found and the Portuguese Foundation for Science and Technology (FCT) through the grant number PD/BD/150385/2019.
Institutional Review Board Statement
Not applicable.
Informed Consent Statement
Not applicable.
Data Availability Statement
The data presented in this study are available on request from the corresponding author.
Conflicts of Interest
The authors declare no conflict of interest.
References
- Jackendoff, R. Toward an Explanatory Semantic Representation. Linguist. Inq. 1976, 7, 89–150. [Google Scholar]
- McLaughlin, T.; Mitchell, W.J.T.; Carlos Rowe, J.; Johnson, B.; Paul, A.; Miller, J.; Sayre, H.; Pease, D.; Mailloux, S.; Patterson, A.; et al. Critical Terms for Literary Study, 2nd ed.; Lentricchia, F., McLaughlin, T., Eds.; The University of Chicago Press: Chicago, IN, USA, 1995. [Google Scholar]
- García-Hernández, M.; de la Calle-Vaquero, M.; Yubero, C. Cultural heritage and urban tourism: Historic city centres under pressure. Sustainability 2017, 9, 1346. [Google Scholar] [CrossRef]
- UNESCO. The HUL Guidebook: Managing Heritage in Dynamic and Constantly Changing Urban Environments: A Practical Guide to UNESCO’s Recommendation on the Historic Urban Landscape. 2016, p. 59. Available online: http://www.historicurbanlandscape.com/themes/196/userfiles/download/2016/6/7/wirey5prpznidqx.pdf (accessed on 11 May 2021).
- Van Oers, R. Towards new international guidelines for the conservation of historic urban landscapes. City Time 2007, 3, 43–51. [Google Scholar]
- UNESCO. Recommendation on the Historic Urban Landscape. Paris, 10 November 2011. Available online: https://whc.unesco.org/uploads/activities/documents/activity-638-98.pdf (accessed on 11 May 2021).
- Rey-Pérez, J.; Pereira Roders, A. Historic urban landscape: A systematic review, eight years after the adoption of the HUL approach. J. Cult. Herit. Manag. Sustain. Dev. 2020, 10, 233–258. [Google Scholar] [CrossRef]
- Fusco Girard, L.; Gravagnuolo, A.; Nocca, F.; Angrisano, M.; Bosone, M. Towards an economic impact assessment framework for Historic Urban Landscape conservation and regeneration projects. BDC-Bollettino Centro Calza Bini 2015, 15, 1–29. [Google Scholar]
- Angrisano, M.; Biancamano, P.F.; Bosone, M.; Carone, P.; Daldanise, G.; De Rosa, F.; Franciosa, A.; Gravagnuolo, A.; Iodice, S.; Nocca, F.; et al. Towards operationalizing UNESCO Recommendations on “Historic Urban Landscape”: A position paper. Aestimum 2016, 69, 165–210. [Google Scholar] [CrossRef]
- Gravagnuolo, A.; Girard, L.F. Multicriteria tools for the implementation of historic urban landscape. Qual. Innov. Prosper. 2017, 21, 186–201. [Google Scholar] [CrossRef]
- Santander, A.A.; Garai-Olaun, A.A.; De la Fuente, A. Historic urban landscapes: A review on trends and methodologies in the urban context of the 21st century. Sustainability 2018, 10, 2603. [Google Scholar] [CrossRef]
- Guzman, P. Assessing the sustainable development of the historic urban landscape through local indicators. Lessons from a Mexican World Heritage City. J. Cult. Herit. 2020, 46, 320–327. [Google Scholar] [CrossRef]
- Kokla, M.; Mostafavi, M.A.; Noardo, F.; Spanò, A. Towards building a semantic formalization of (small) historical centres. ISPRS Ann. Photogramm. Remote Sens. Spat. Inf. Sci. 2019, 42, 675–683. [Google Scholar] [CrossRef]
- Vehbi, B.O.; Hoskara, Ş.Ö. A model for measuring the sustainability level of historic urban quarters. Eur. Plan. Stud. 2009, 17, 715–739. [Google Scholar] [CrossRef]
- Battis-Schinker, E.; Al-Alawi, S.; Knippschild, R.; Gmur, K.; Książek, S.; Kukuła, M.; Belof, M. Towards quality of life indicators for historic urban landscapes–Insight into a German-Polish research project. Environ. Sustain. Indic. 2021, 10, 100094. [Google Scholar] [CrossRef]
- Gómez-lobo, A. Exposición breve de la metafísica aristotélica. Estud. Públicos 1996, 62, 309. [Google Scholar]
- Heidegger, M. The Question Concerning Technology; GARLAND publishing, INC.: New York, NY, USA, 1977; ISBN 0824024273. [Google Scholar]
- Hocutt, M. Aristotle’ s Four Becauses. Philosophy 2015, 49, 385–399. [Google Scholar] [CrossRef]
- Poljanšek, M. Building Information Modelling (BIM) Standardization; European Commission: Varese, Italy, 2017. [Google Scholar]
- Ramírez Eudave, R.; Ferreira, T.M. On the suitability of a unified GIS-BIM-HBIM framework for cataloguing and assessing vulnerability in Historic Urban Landscapes: A critical review. Int. J. Geogr. Inf. Sci. 2020, 1–31. [Google Scholar] [CrossRef]
- Biljecki, F. Level of Detail in 3D City Models. Ph.D. Thesis, University of Delft, Delft, The Netherlands, 2017. [Google Scholar]
- Eastman, J.R. Chapter 35: Multi-criteria evaluation and GIS. In Geographical Information Systems: Principles, Techniques, Applications and Management; Longley, P., Ed.; Wiley: Chichester, UK, 2005; pp. 493–502. ISBN 0471735450. [Google Scholar]
- Skilodimou, H.D.; Bathrellos, G.D.; Chousianitis, K.; Youssef, A.M.; Pradhan, B. Multi-hazard assessment modeling via multi-criteria analysis and GIS: A case study. Environ. Earth Sci. 2019, 78, 47. [Google Scholar] [CrossRef]
- Ramírez Eudave, R.; Ferreira, T.M. Proposal for a suitable workflow for assessing the seismic vulnerability of historical buildings, Atlixco (Puebla, México) as a case study. In Proceedings of the 1st Croatian Conference on Earthquake Engineering—1CroCEE, Zagreb, Croatia, 22–24 March 2021; pp. 23–33. [Google Scholar] [CrossRef]
- Aguado, J.L.P. Vulnerability Assessment as a Tool to Mitigate and Manage Seismic Risk in Old Urban Areas. Master’s Thesis, University of Minho, Braga, Portugal, 2017. [Google Scholar]


Publisher’s Note: MDPI stays neutral with regard to jurisdictional claims in published maps and institutional affiliations. |
© 2021 by the authors. Licensee MDPI, Basel, Switzerland. This article is an open access article distributed under the terms and conditions of the Creative Commons Attribution (CC BY) license (https://creativecommons.org/licenses/by/4.0/).