1. Introduction
The Arctic consists of the ice-covered Arctic Ocean, surrounded by a ring of frozen land. The Arctic coastline is highly convoluted with many types of coastlines, including steep cliffs, fjords, abrasions, lowlands, and delta coasts. Arctic coasts differ from low-latitude coasts in that they are covered by snow and ice from rivers and oceans. Arctic surface temperatures have risen more than twice as fast as the global average over the past two decades. As a result, Arctic sea ice is retreating rapidly, raising prospects of a future ice-free Arctic Ocean during summer [
1,
2]. Arctic coasts have been undergoing continuous erosion, which is caused by the combined action of global warming–induced factors including the increase of ice melting, thermal erosion, and subsidence thawing permafrost and sea-level rise (IPCC, 2021). At the same time, sediment from increased snow melt is attributed to river discharge in continually changing estuarine coastlines [
3,
4]. On Canada’s northern coastline, rising temperatures and increased precipitation have been documented, with the rate of sea ice decline ranging from 2.9% to 10.4% per decade. Storm intensity and frequency is increasing, and permafrost is thawing across the region [
5,
6].
Arctic coastline erosion is caused by large-scale local and regional changes. The average rate of coastal erosion in the Arctic is 0.2 m/yr, but it has accelerated during the past decade [
7,
8,
9,
10,
11,
12]. Over the period 1950 to 2000, the mean Arctic coastal erosion rate was 0.5 m/yr, with substantial variability among different regions. According to the subdivisions of the Arctic Ocean, coastal erosion rates have historically been highest along the Beaufort Sea (1.1 m/yr), the East Siberian Sea (0.9 m/yr), the Laptev Sea (0.7 m/yr), and the Kara Sea (0.7 m/yr). Sites that were historically at or below the mean Arctic-wide coastal permafrost change rate were the Russian (0.3 m/yr) and US (0.5 m/yr) Chukchi Seas, Barents Sea (0.4 m/yr), and Svalbard (0.02 m/yr) [
10]. Many studies have used aerial photography, remote sensing images, and topographic maps to monitor long-term changes of the Russian and Canadian Arctic coastlines [
11,
13,
14,
15], by combining ice, wind, wave, storm, and sediment data to analyze coastal erosion. Previous studies have focused on the Arctic coast of Svalbard [
15,
16,
17], the Canadian Arctic Archipelago [
18,
19], the coast of Greenland [
20,
21,
22], and the Arctic coast of Alaska [
8], but fewer studies have examined the changes along the Siberian Arctic coastlines.
Since 1972, the U.S. Landsat series satellites, the European Space Agency’s (ESA) Earth remote-sensing satellites (ERS), and the Chinese Gaofen series satellites have continuously acquired space-based images of Earth’s surface. These long-time satellite images and laser scanning data have been used to detect, analyze, and assess spatiotemporal coastal changes at the regional [
23,
24,
25,
26,
27,
28,
29], national [
30,
31,
32,
33,
34], and global [
35] levels. However, comparative studies of different coastal regions of the Arctic are still lacking, especially the analysis of the impact of different latitudes on coastal erosion. The relationship between coastal erosion and temperature, waves, and sea ice at similar latitudes in the Arctic requires further research. The coastline retreatment is used to indicate coastal erosion, when satellites monitor the coast. In this study, multiple remote sensing images from 1974 to 2017 were used to monitor the coastal erosion (shoreline retreatment) in three typical regions of Alaska and Siberia on both sides of the Bering Strait. The driving factors of coastal erosion are analyzed with sea surface temperature, significant wave height, and ice cover data to gain a deeper understanding of the temporal and spatial characteristics and influencing factors of Arctic coastal erosion.
2. Data and Methodology
2.1. Study Area
In this study, the remote sensing analysis of coastal erosion is carried out in three typical areas of the Arctic located on both sides of the Bering Strait, namely the coast of Drew Point in Alaska, the coast of Nutepel’men on the Chukchi Peninsula in Eastern Siberia, and the coast of Ozero Mogotoyevo in the Kolyma Lowland in Eastern Siberia (shown in
Figure 1).
Drew Point (70.8° N, 153.0° W) is located along the Beaufort Sea coast. This study area is covered by a large number of lakes of different sizes that freeze in winter and thaw in the summer. The coastal slope of the Drew Point reaches an elevation of three to four m and consists of ice-wedge bounded blocks of fine-grained sediments cemented by ice-rich permafrost and capped with a thin organic layer.
Nutepel’men (67.2° N, 174.5° W) is located on the Northern shore of the Chukchi Peninsula in the Chukchi Sea. The study area includes the Kolyuchin Bay and its coasts on both sides. The coastal area of Kolyuchin bay is extended for about 100 km. The river mouth is extended for about 2.8 km and islands and spit separate it from the Arctic Ocean. Kolyuchin Bay is seven to 14 m in depth and is covered with ice most of the year. The Ioniveyem and the Ulyuveyem Riversflow into the bay from the south.
Ozero Mogotoyevo (72.0° N, 148.0° W) is located in the northern end part of the Yana-Indigirka Lowland, and is named after the famous Lake Mogotoyevo. This area borders the Khroma Bay in the west and the Indigirka River in the east, which drains into the East Siberian Sea. The lowland seashores are covered with moss and shrub tundra.
2.2. Data Resources
The information used in the study is obtained from (a) Landsat, (b) the ESA’s ERS, (c) Gaofen-1 remote sensing data, (d) the European Centre for Medium-Range Weather Forecasts (ECMWF) reanalysis data, and (e) the National Snow and Ice Data Center (NSIDC) sea ice cover data.
The dataset used in this study consists of data from the Landsat satellite series (16 scenes collected since 1974), ESA’s ERS-1 (two scenes), and China’s Gaofen-1 (one scene) remote sensing imagery, as listed in
Table 1. As the Arctic region is covered with snow and ice all year round, the satellite optical images without snow cover from June to September were selected to extract the coastline.
Landsat satellites are a series of satellites used by the United States since 1972 to continuously observe land resources. Landsat-1 operated from 1972 to 1978, and Landsat-2 operated from 1975 to 1983. Their images had a resolution of 60 m. Landsat-5 operated from 1984 to 2013 and had an image resolution of 30 m. Landsat-8 was launched in 2013 and had an image resolution of 15 m [
36].
The ERS-1, with a payload that included a synthetic-aperture radar (SAR), was launched in 1991. The on-board SAR when operated in image mode obtained strips of 12.5-m pixel spacing imagery 100 km in width to one side of the satellite.
Gaofen-1 is the first satellite of China’s high-resolution earth observation system. It was launched in 2013. The wide multispectral camera has a width of 800 km with 16-m resolution.
The historical Sea Surface Temperature (SST) and Significant Wave Height (SWH) data used in this study are from the ECMWF’s ERA-Interim reanalysis datasets. Its resolution is 0.75° and 6 h.
The historical ice cover data is from the NSIDC. The data contains average monthly sea ice extent and area, and lowest to highest monthly extent rankings for 1978 to the present, in square kilometers, by region of the Arctic Ocean. The ice-free period in the study areas is usually from mid-June to mid-September. Therefore, the average SST, SWH and ice cover in August of the past year are selected for coastal erosion analysis.
2.3. Methodology
The Landsat images have been orthorectified. The ERS-1 SAR and Gaofen-1 images were geometrically corrected based on the Landsat images. The accuracy of geometric correction is less than two pixels.
Due to lack of tide data, the coastline cannot be obtained through tide correction. So in this study, the waterline is used instead of the coastline for coast erosion analysis. First, RGB color images were composed using band 6 (R), band 5(G), band 4(B) of Landsat-1/2/4, band 3(R), band 2(G), band 1(B) of Landsat-5/7, band 4(R), band 3(G), band 2(B) of Landsat-8, and band 3(R), band 2(G), and band 1(B) of Gaofen-1. The waterline was then extracted by visual interpretation based on spectral feature segmentation from the RGB color images in the geographic information system (GIS) software. The spectrum of water and land is significantly different. The waterline was digitized manually on screen at a consistent zoom level equivalent to a scale of 1:5000, with error of less than 0.5 pixels.
First, the waterlines of each period were extracted from the remote sensing images. Then the waterline in 2017 (the red line in
Figure 2) was set as the baseline. And the normal line (the black line in
Figure 2) was drawn in the vertical direction along the baseline. So the intersection points (P1-P5 in
Figure 2) of the normal line and the waterlines of each period were determined. Finally, the coastal changes were obtained by measuring the length between the intersection points.
The SST data of the study area are taken from the nearest points to the shoreline. In terms of time, the average SST comes from the mean of temperature every 6 h in August between 1979 and 2017. The SWH data is also processed in the same way.
The ice cover data are taken from the nearest marginal sea between 1979 and 2017. The ice cover data of the Beaufort Sea are used in the change studies of Alaska. The ice cover data of the Chukchi Sea are used in the change studies of Nutepel’men in Eastern Siberia. The ice cover data of the East Siberian Sea are used in the change studies of Ozero Mogotoyevo in Eastern Siberia.
3. Results
3.1. Drew Point Coast
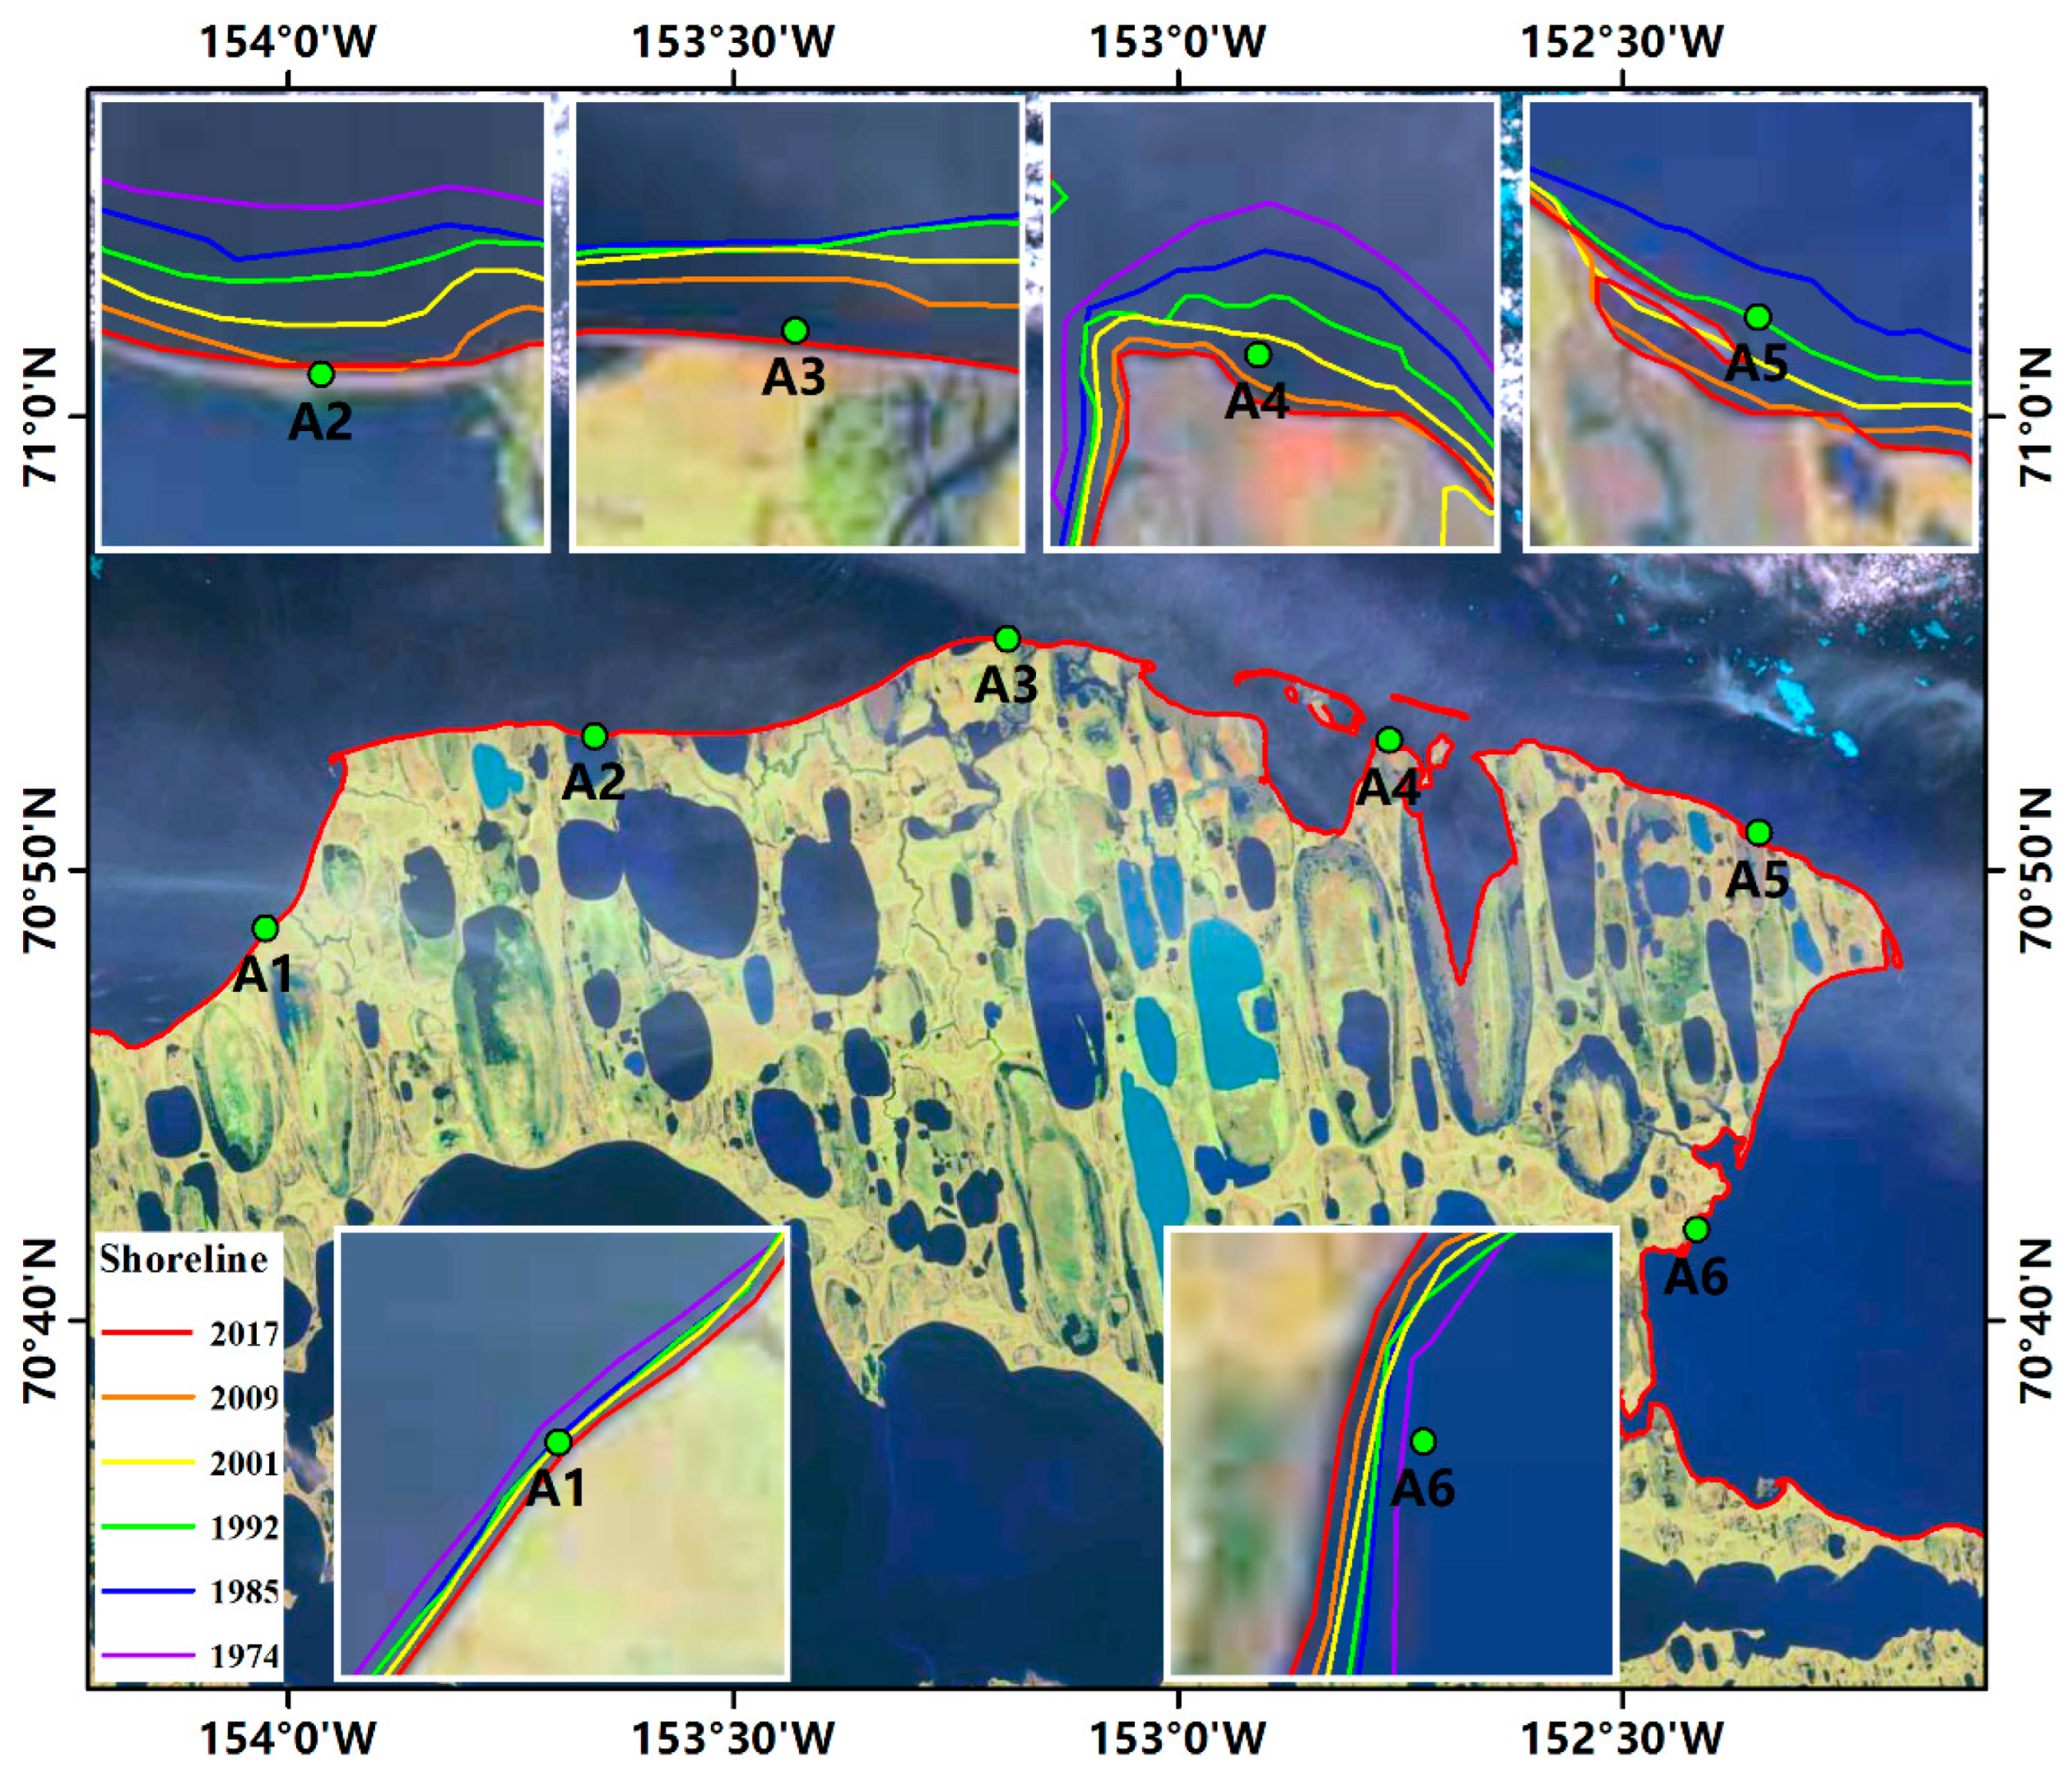
The coastal data for Drew Point in Alaska (shown in
Figure 3) were extracted from eight satellite images collected in 1974, 1985, 1992, 2001, 2009, and 2017, respectively. Six locations, shown as green dots in
Figure 3, were selected to analyze the coastal changes during a period of 43 years. The results are displayed in
Table 2 and
Table 3.
It is evident from
Table 2 and
Table 3 that from 1974 to 2017, the coastal erosion at the Drew Point sites was extensive, ranging from 497.7 m to 2909.1 m, with a mean of 1648.5 m. During the same 43-year period, the coastal erosion rate at Drew Point ranged from 11.6 m to 67.7 m, with a mean erosion rate in excess of 50 m/yr during the periods of 1985–1992 and 2001–2009.
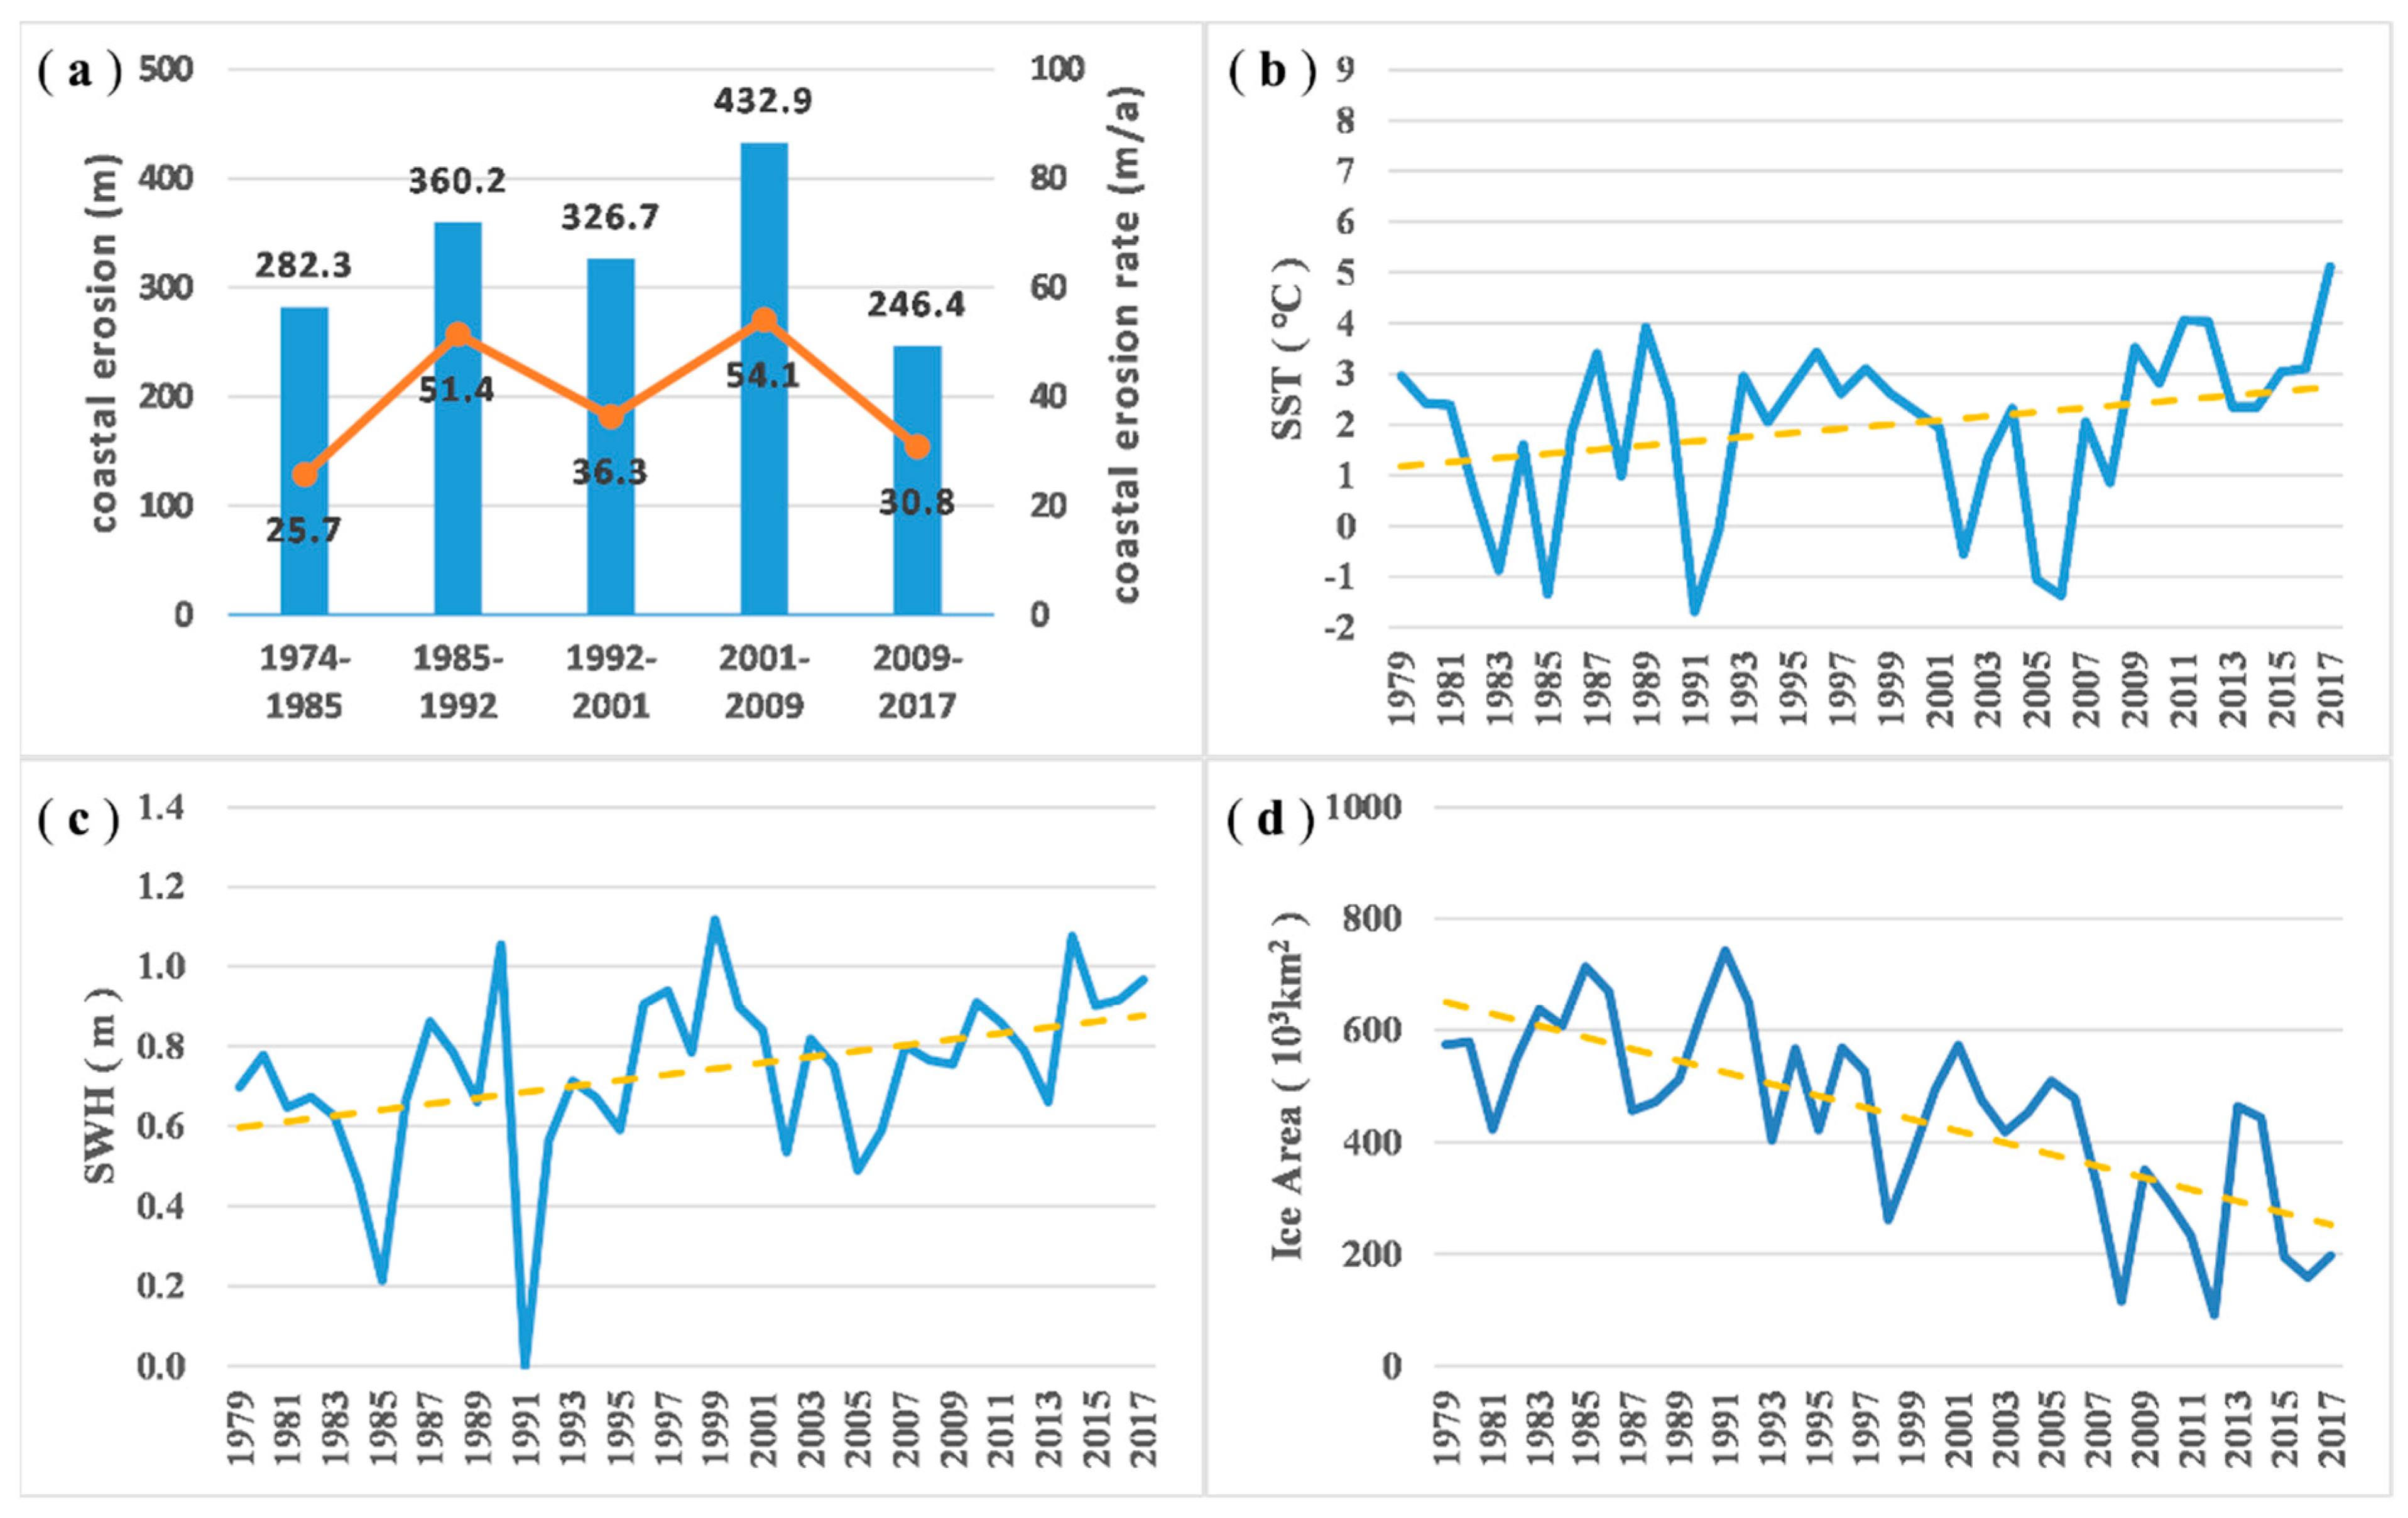
The coastline at Drew Point (for August) shows an alternating pattern of slow and fast erosion patterns (
Figure 4a). Historical data of the mean SST (
Figure 4b), the significant wave height (
Figure 4c), and sea ice coverage (
Figure 4d) of the Beaufort Sea along the Drew Point coastline show that the mean SST of the Beaufort Sea has progressively increased at a slow rate since 1979. Similar patterns are shown for the SWH. In contrast, the sea ice cover has decreased. The decrease in the sea ice cover means that the ice-free area along the coastline has expanded, has promoted wave propagation, and has increased the SWH that has intensified the rate of coastal erosion.
Historical data (for August) show that the SST and the SWH of the Beaufort Sea are correlated (correlation coefficient of 0.68). Therefore, the SST was selected to assess coastal changes. The mean SST of the Beaufort Sea yielded large fluctuations (−2 °C to 5 °C). The mean SST and the rate of change of the SST were analyzed in combination with the coastal erosion rate (
Table 4). It was found that: (1) during the periods from 1992 to 2001, and 2009 to 2017, the mean SSTs were relatively high (reaching 2.37 °C and 3.38 °C, respectively), but the fluctuations were small (standard deviation of 0.92 and 0.89, respectively), and the coastal erosion rate was relatively low; and (2) during the periods from 1985 to 1992, and 2001 to 2009, the mean SSTs for the respective periods were relatively low (1.20 °C and 1.01 °C), but the respective fluctuations were extremely high (standard deviations of 2.08 and 1.63), while the coastal erosion rate was also high (exceeding 50 m/yr). These results indicate that because the SSTs along the Alaskan Sea coast were relatively high (historically, the mean temperature in August was 1.96), rather than being related to the mean SST, the coastal erosion rate in this area is closely related to the fluctuations of SST, that is, the temperature fluctuations significantly intensified coastal erosion.
The correlation coefficient between erosion rate and SST mean is −0.48. The correlation coefficient between erosion rate and SST change rate is 0.55. The correlation coefficient between erosion rate and SST standard deviation is 0.87. These also show that coastal erosion in the Drew Point is most correlated with the fluctuations of SST. However, the reliability of the correlation analysis is less credible due to lack of data.
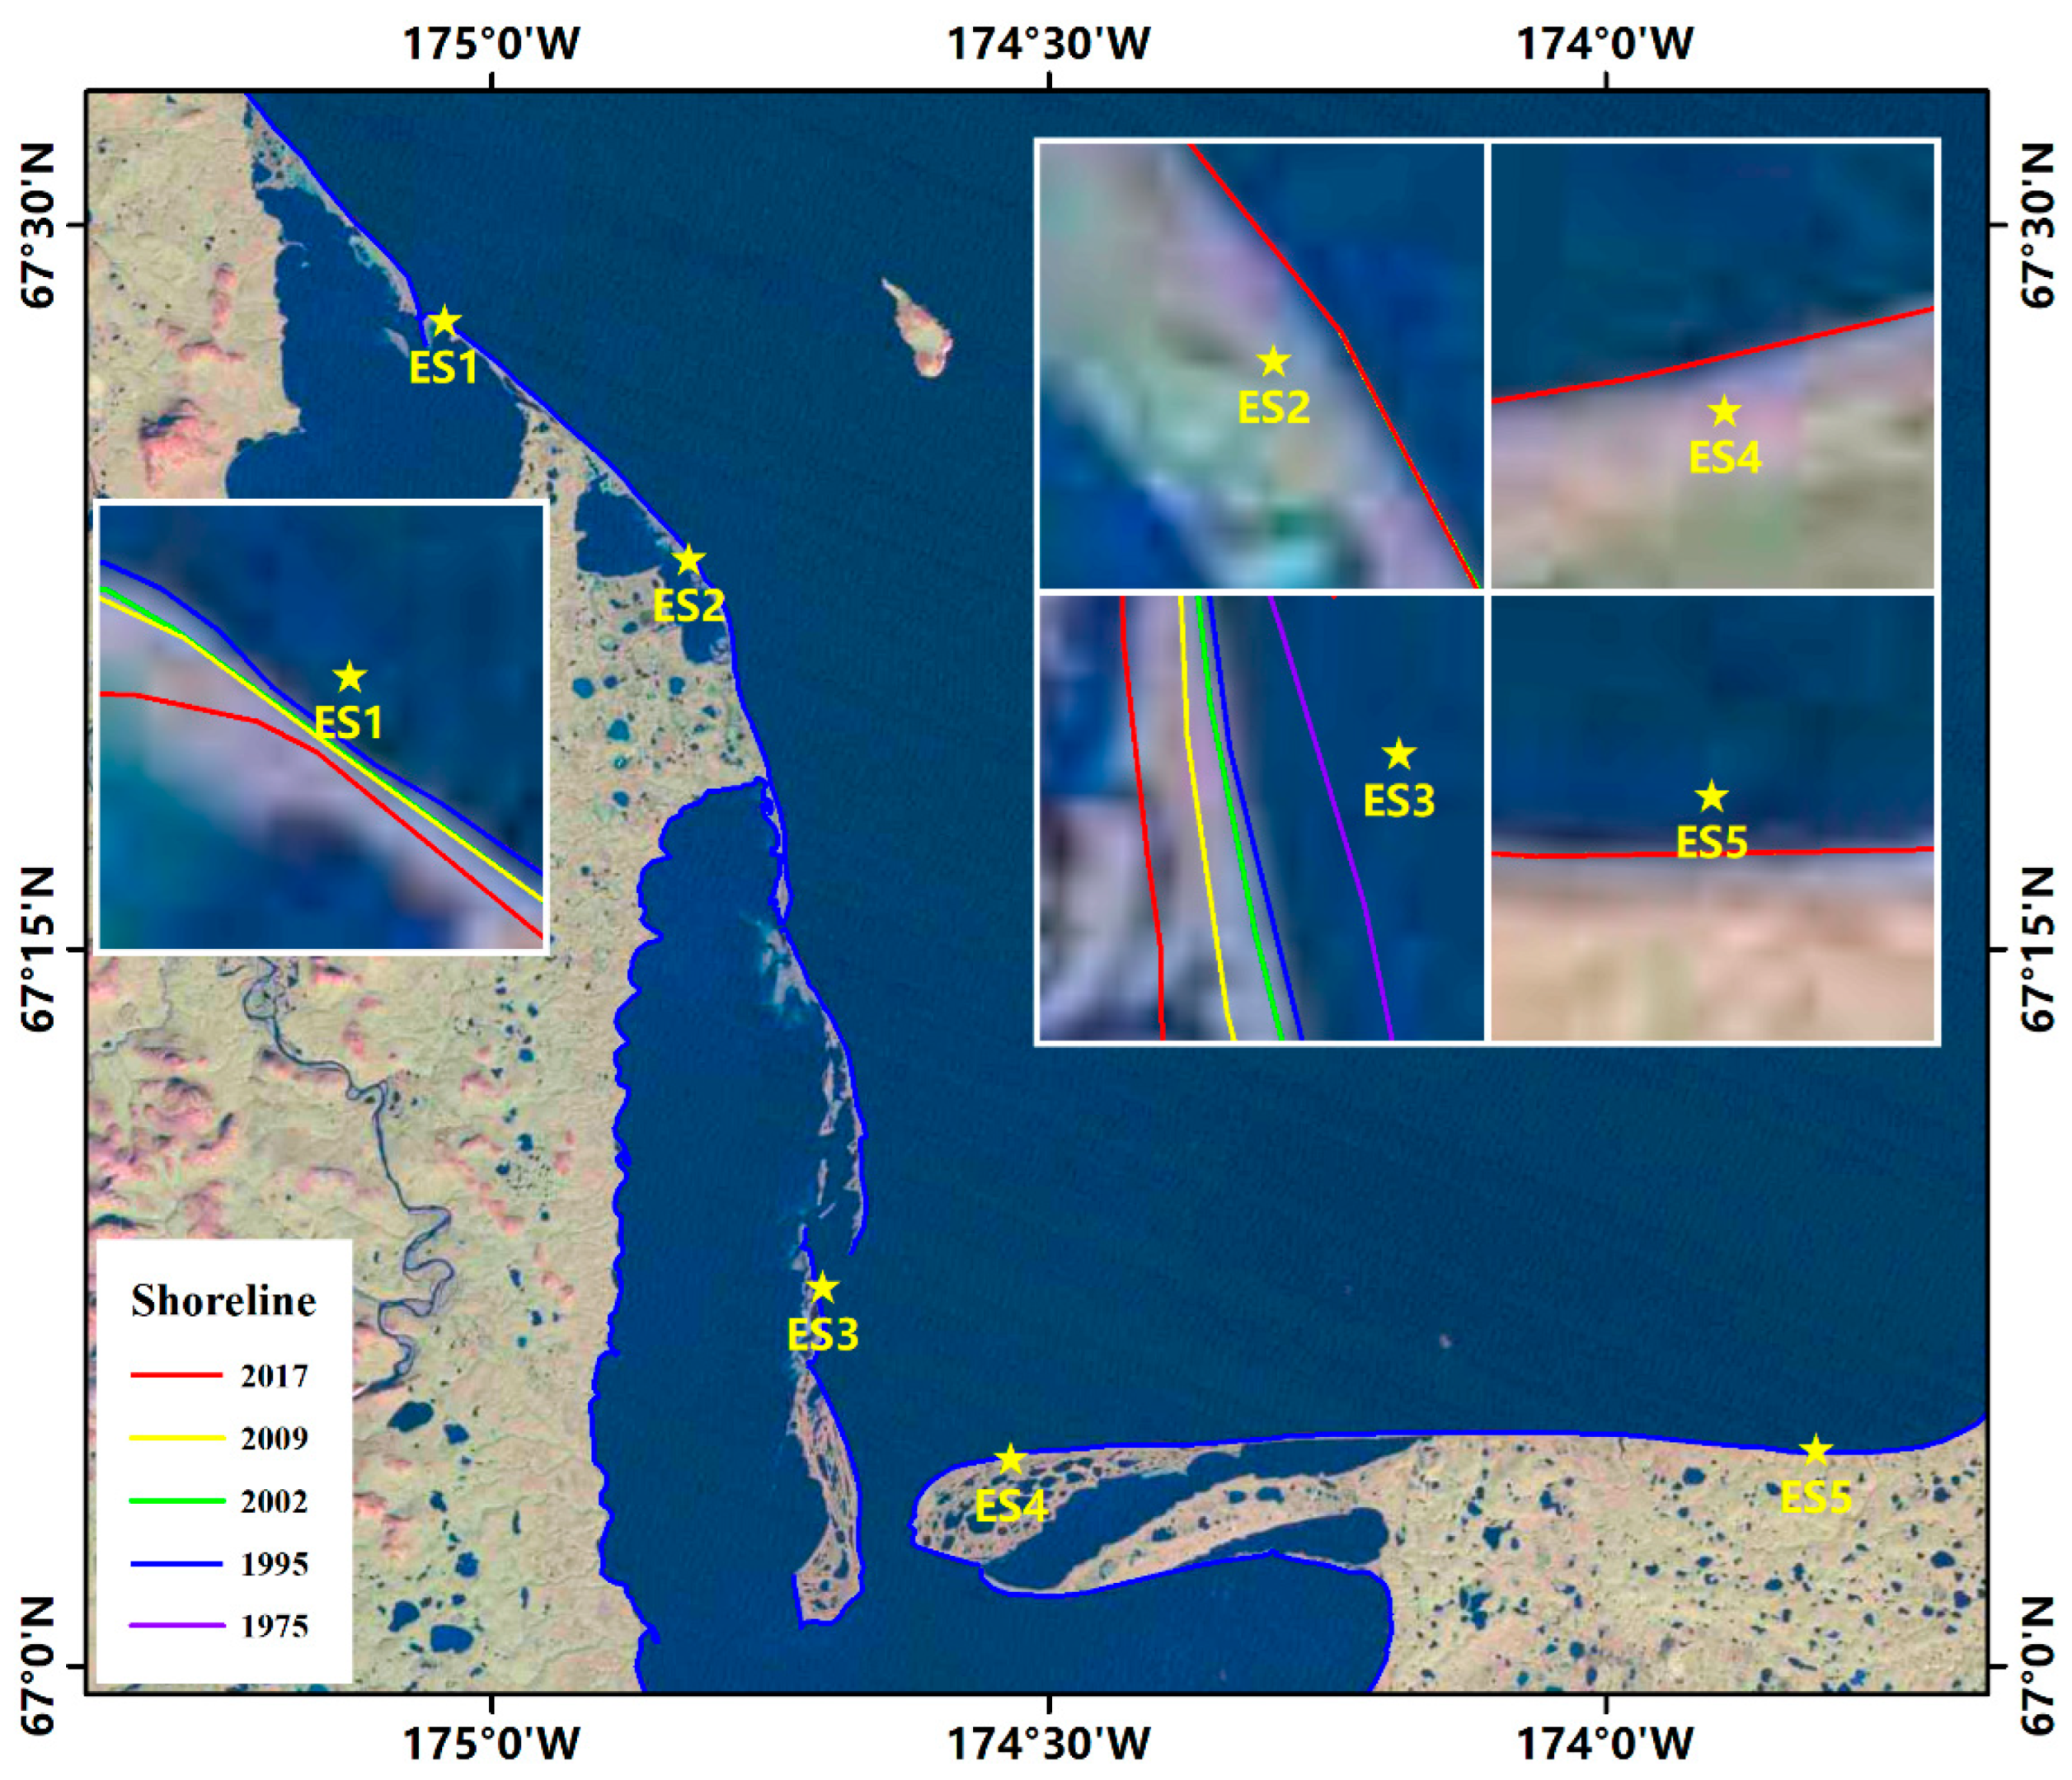
3.2. Nutepel’men Coast
Nutepel’men is located on the Northern shore of the Chukchi Peninsula in Eastern Siberia (as shown in
Figure 5). The data for this study area were extracted from five satellite images collected in 1975, 1995, 2002, 2009, and 2017, respectively. Five sites, represented in
Figure 5 as yellow stars, were selected to assess coastal changes that occurred during a period of 42 years. The results are shown in
Table 5 and
Table 6.
It is evident from
Table 5 and
Table 6 that the coastal erosion at sites ES1 and ES3, which are located along an estuarine shoreline, was relatively high in the period of 1975–2017, and reached the values of 437.8 m and 1184.2 m, respectively. The corresponding mean annual rates were 10.4 m/yr and 28.2 m/yr. These two sites exhibited trends of accelerated coastal erosion.
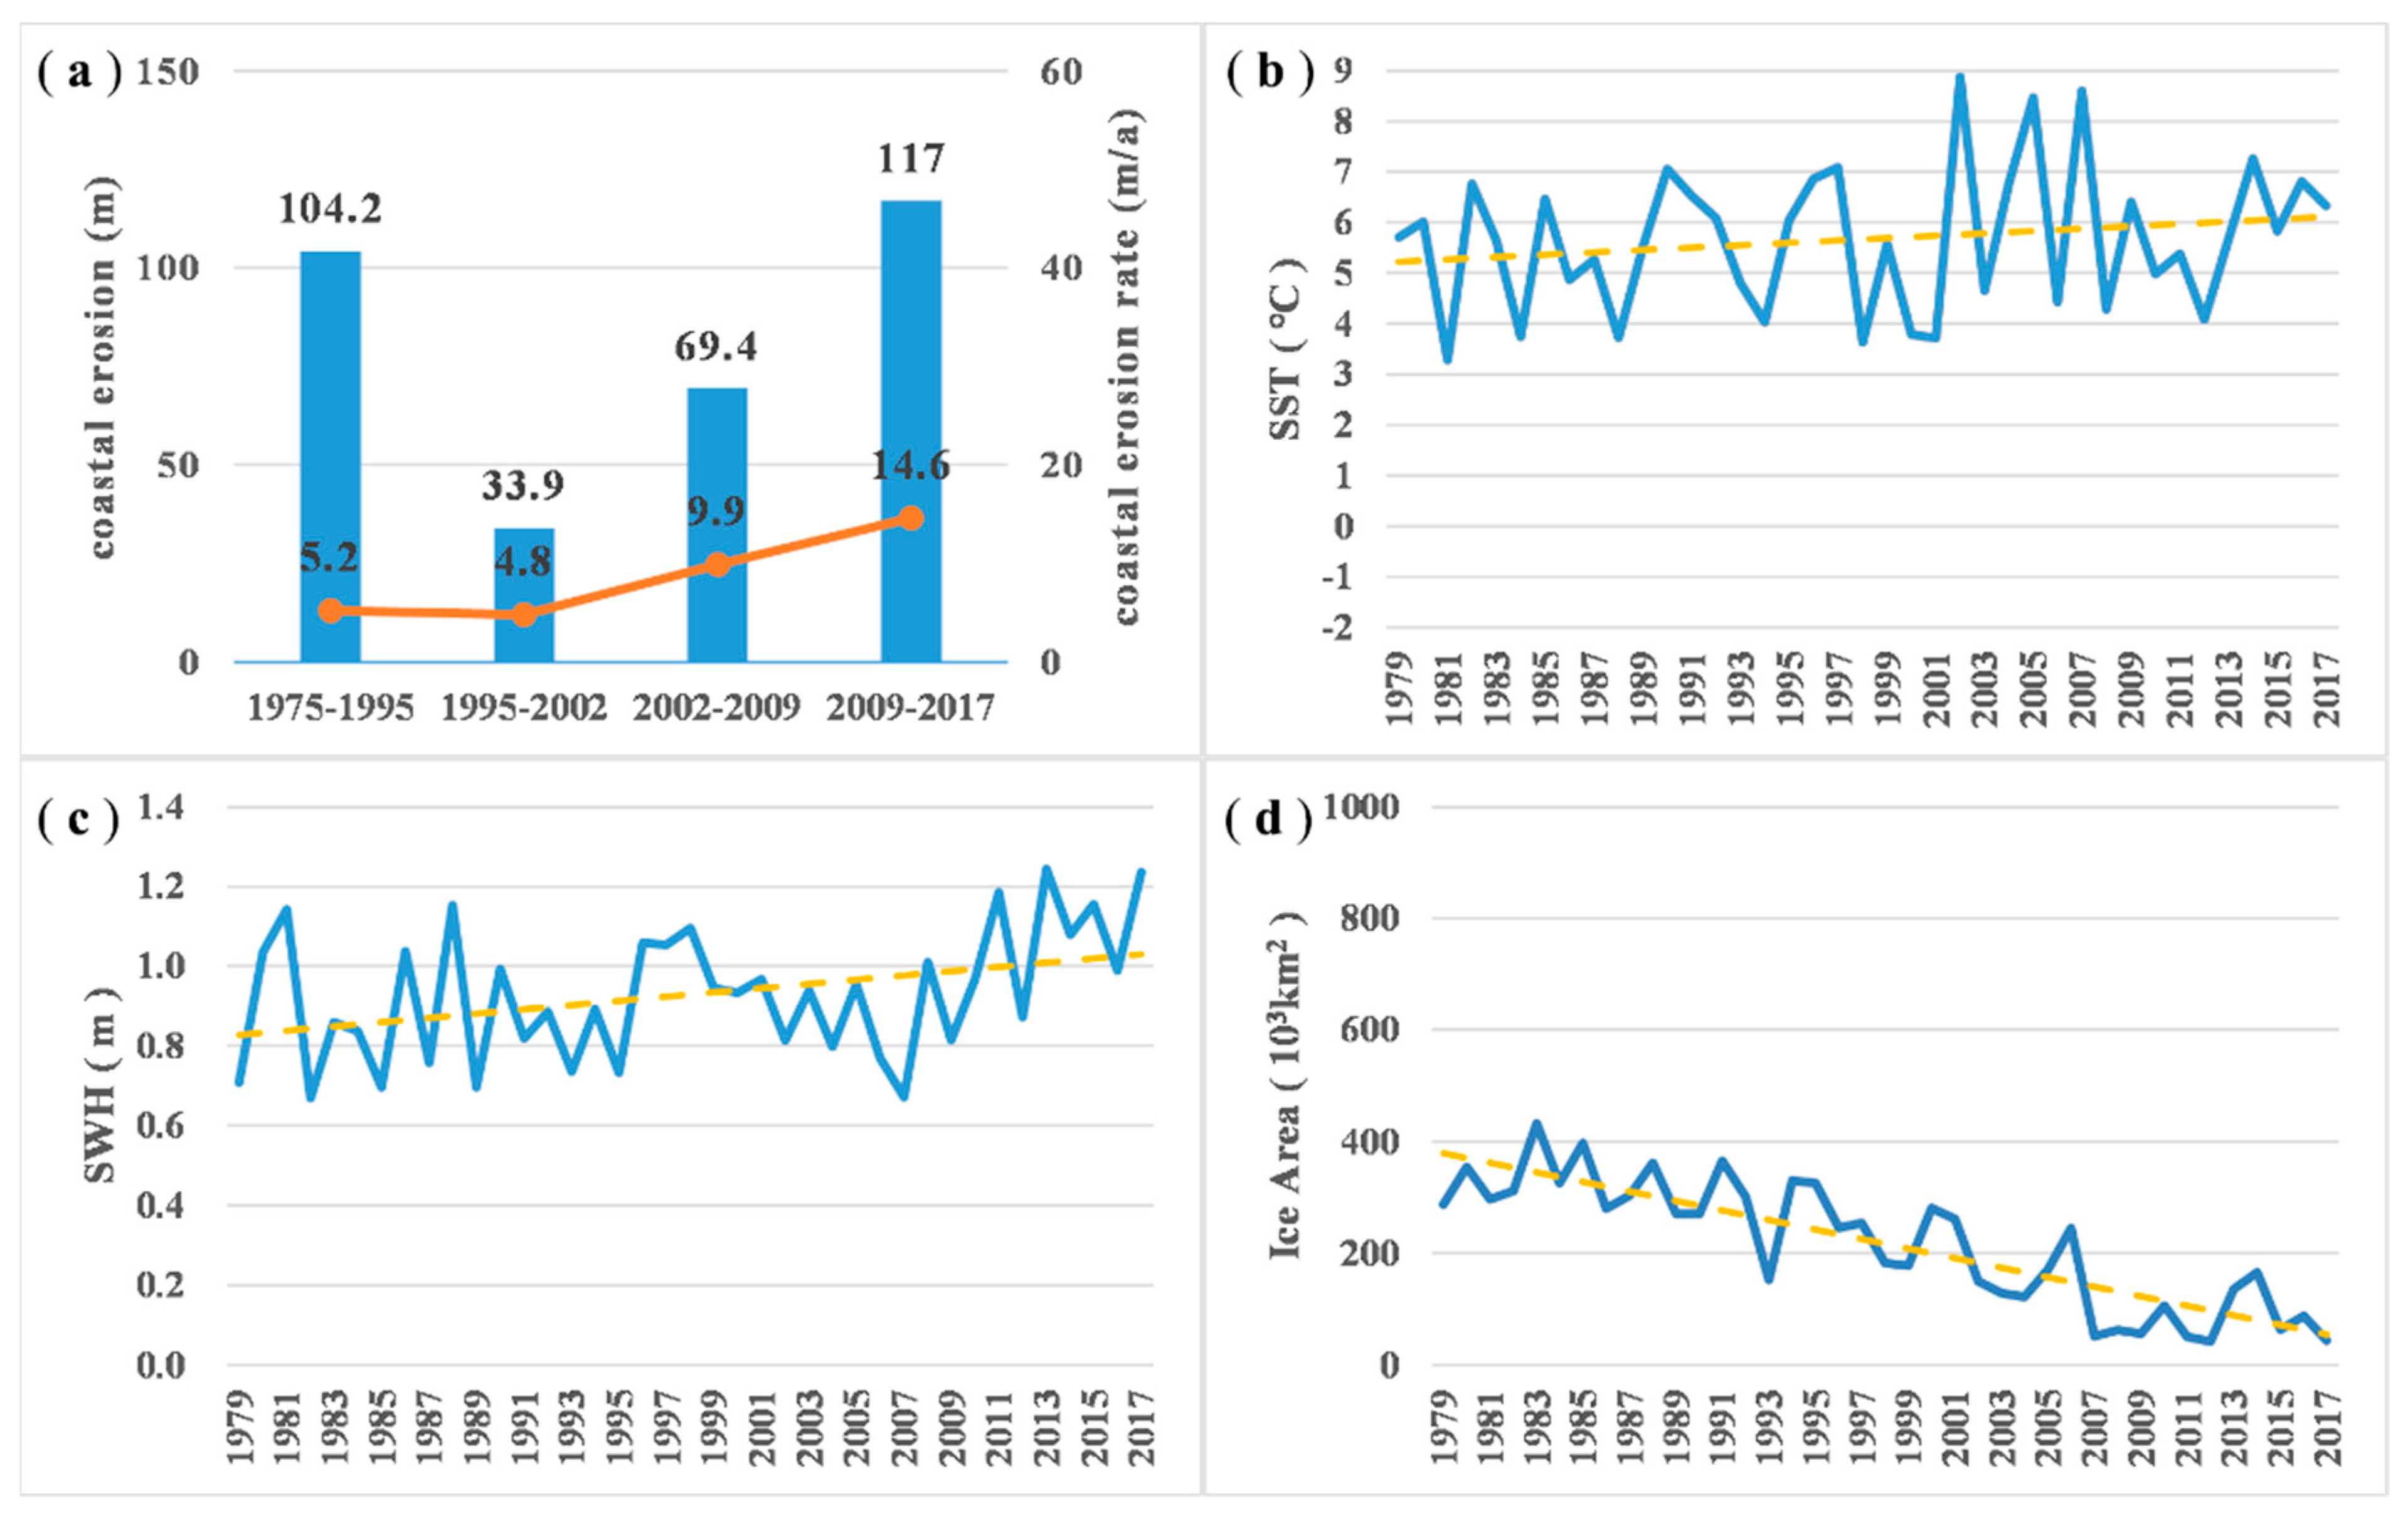
No erosion has been observed at most of the Nutepel’men coastline sites, with the exception of the sites located along the estuarine coastlines, where slow erosion occurred from 1975 to 2002. Starting in 2002, the erosion rate accelerated, increasing from 4.8 m/yr to 14.6 m/yr (
Figure 6a). Historical data show that in August, the SST of the adjacent Chukchi Sea fluctuated between 5 °C and 8 °C and slowly increased (
Figure 6b); similarly, the SWH slowly increased (
Figure 6c), whereas the sea ice cover (
Figure 6d) rapidly decreased. From 1975 to 1995, the mean sea ice cover of the Chukchi Sea was 316,000 km
2, and from 2009 to 2017, it dropped to 84,000 km
2, a decrease of nearly 75%. Because the SSTs were relatively high in this area in August, essentially no freezing occurred, and there were no strong inter-annual fluctuations (
Table 7). Therefore, in this study area, the dynamic marine environment did not change significantly, so the coastal erosion was small, and significant changes occurred only along estuarine coastlines, which is consistent with the findings of [
20], where the coastal deltas of western Greenland were studied.
The correlation coefficient between erosion rate and SST mean is 0.46. The correlation coefficient between erosion rate and SST change rate is 0.38. The correlation co-efficient between erosion rate and SST standard deviation is −0.49. These show that coastal erosion is not significantly related with SST. However, the reliability of the correlation analysis is less credible due to the lack of data.
3.3. Ozero Mogotoyevo Coast
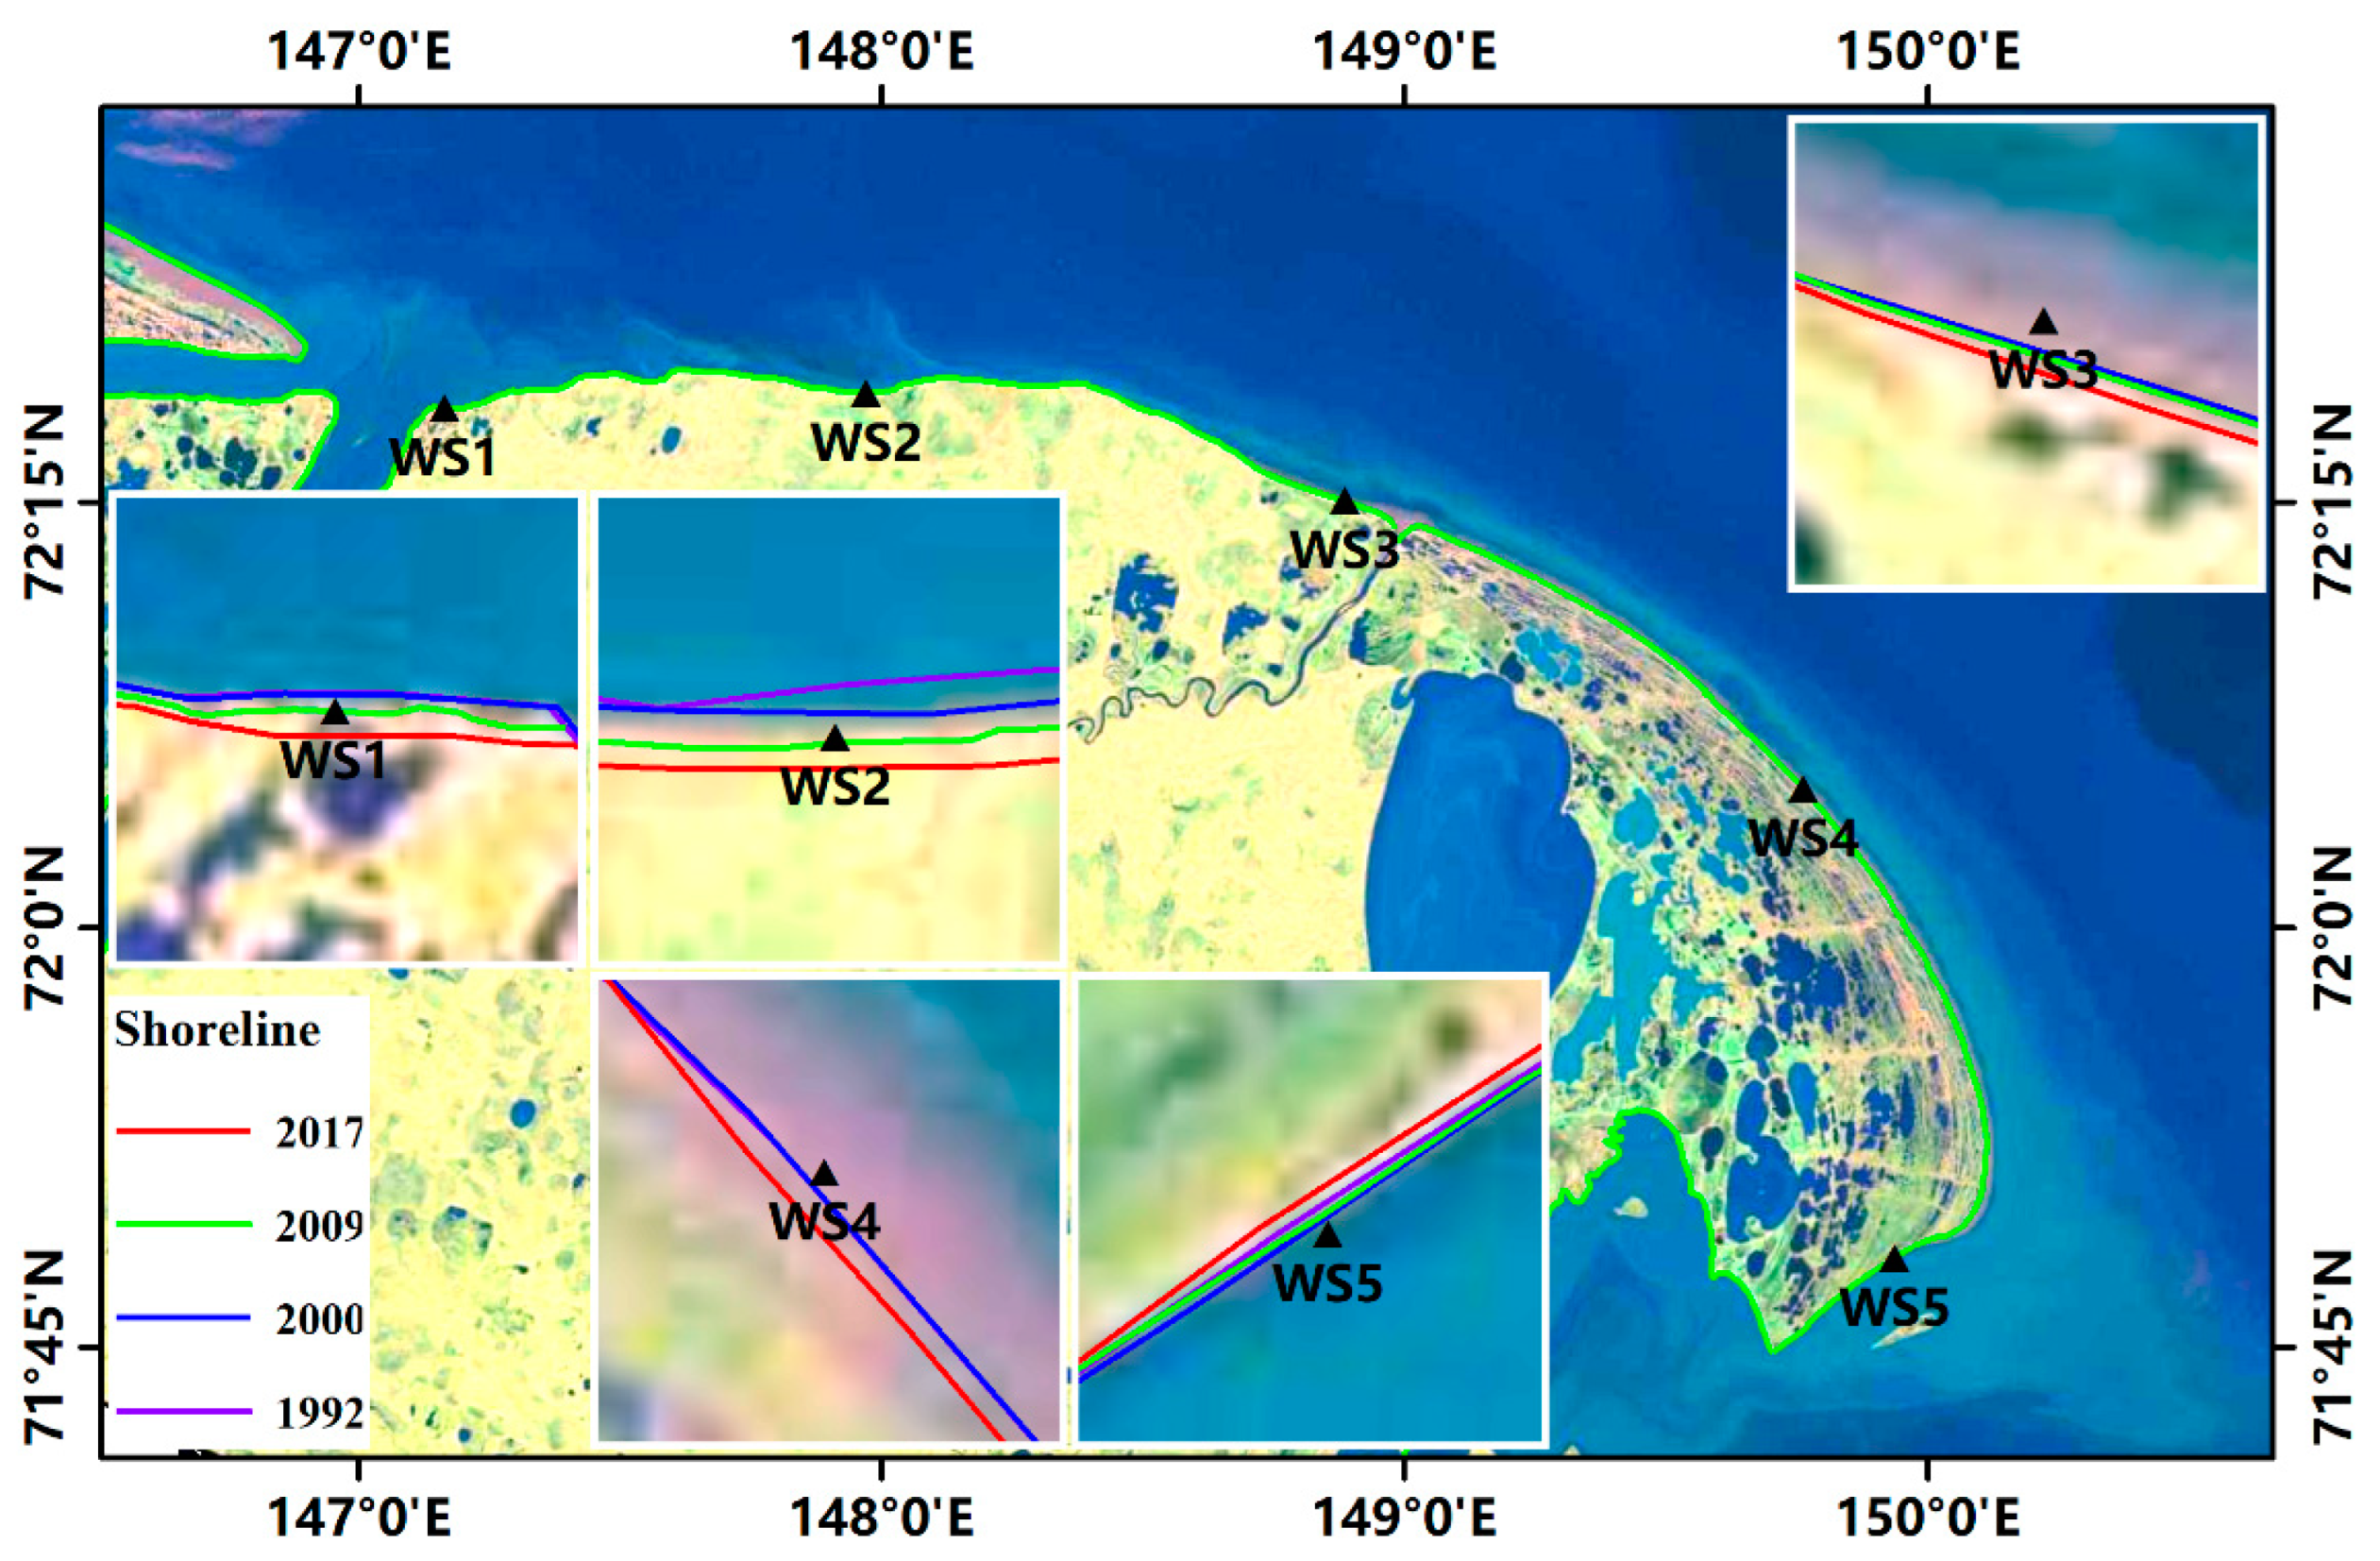
Ozero Mogotoyevo is located in the Northern part of the Kolyma Lowland in Eastern Siberia, as shown in
Figure 7. Coastal data for this site were extracted from five satellite images collected in 1992/1993, 2000, 2009, and 2017, respectively. Five sites, represented by the black triangles in
Figure 7, were selected to analyze coastal changes that occurred during a period of 25 years. The results are shown in
Table 8 and
Table 9.
It is evident from
Table 8 and
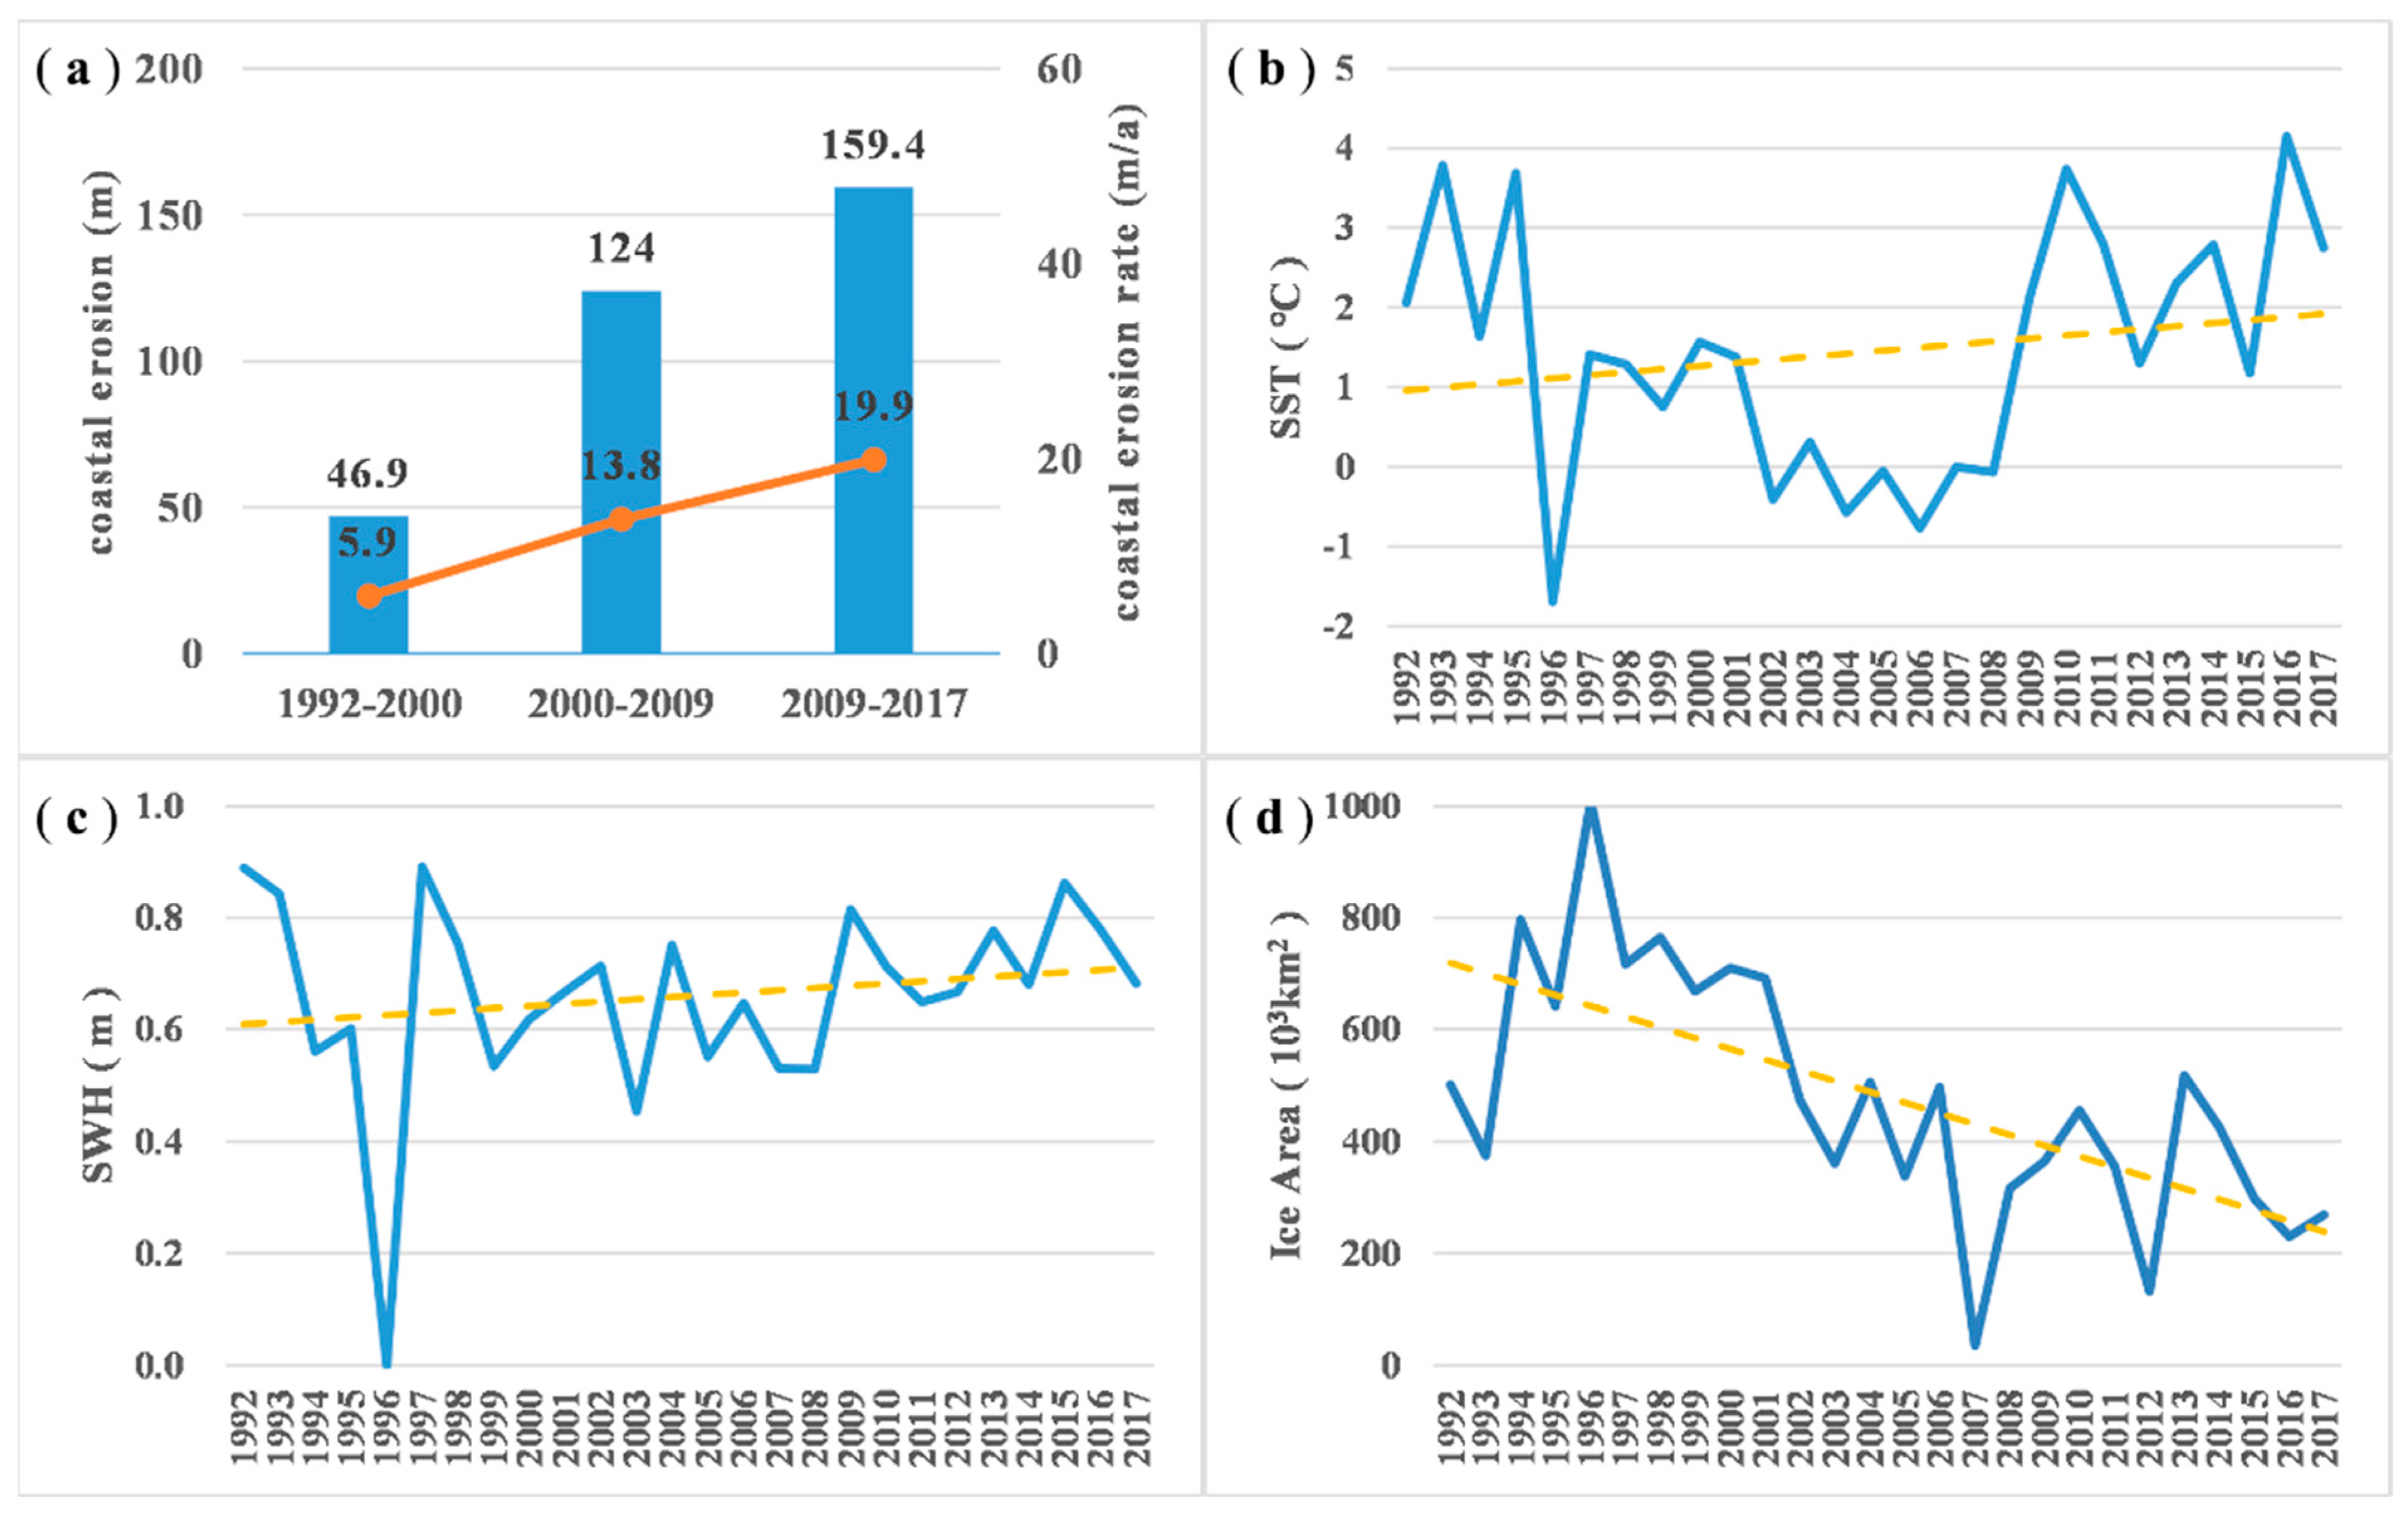
Table 9 that during the period of 1992–2017, the amount of coastal erosion at the Ozero Mogotoyevo sites ranged from 133.3 m to 709.4 m, with a mean of 309.8 m. The erosion rate ranged from 5.3 m to 28.4 m, with a mean rate of 12.4 m/yr. The amount of coastal erosion on the west side of this study area (sites WS1 and WS2) was significantly greater than that on the east side (sites WS3, WS4, and WS5); the west side also yielded higher erosion rates. At the WS2 site, the amounts and rates of coastal erosion were similar in the three study periods. A trend of accelerating coastal erosion is evident at the WS1, WS3, and WS5 sites.
Historical data for August for the period of 1979–2017 (
Figure 8b) show that the mean SST for the Ozero Mogotoyevo coastline exhibits a downward trend in 1991–2002, is relatively stable in 2002–2009, and has an upward trend in 2009–2017. During the same period, the SWH (
Figure 8c) yields an upward trend, whereas the sea ice cover yields a downward trend (
Figure 8d); both are characterized by relatively large fluctuations.
Because the SST and SWH of the East Siberian Sea are correlated (correlation coefficient: 0.60), the SST was selected to further analyze the causes of coastal changes in this area. Based on historical data, the mean August SST of the East Siberian Sea exhibited large fluctuations (−2 °C to 6 °C). The coastal erosion rate was analyzed in combination with the mean SST and the slope of the SST (
Table 10). It was found that: (1) during the period of 1992–2000, the mean August SST was relatively high (maximum of 1.61 °C), but it was characterized by rapid drops (slope: −0.23) and large fluctuations (standard deviation: 1.49), while the coastal erosion rate was relatively slow (5.9 m/yr); (2) during the period of 2000–2009, the mean SST in August was considerably low (0.35 °C), and the fluctuations were also very small (slope and standard deviation of 0.03 and 0.98, respectively). However, the coastal erosion rate was relatively high (13.8 m/yr); and (3) during the period of 2009–2017, the mean SST in August was relatively high (2.57 °C), and the fluctuations were small (slope and standard deviations of 0.03 and 0.98, respectively), but the coastal erosion rate was relatively high (19.9 m/yr). These results indicate that the low rate of coastal erosion along the Eastern Siberian coastline during the period of 1992–2000 was caused by the rapid drop of the SST, while the accelerated coastal erosion rate after 2000 was caused by the rise in the SST.
The correlation coefficient between erosion rate and SST mean is 0.36. The correlation coefficient between erosion rate and SST change rate is 0.98. The correlation co-efficient between erosion rate and SST standard deviation is −0.90. These also show that coastal erosion in the Ozero Mogotoyevo is most correlated with the change rate of SST. However, the reliability of the correlation analysis is less credible due to lack of data.
4. Discussion
In this study, a comparative analysis of the coastal changes at Drew Point in Alaska, Nutepel’men in Eastern Siberia, and Ozero Mogotoyevo in Eastern Siberia was conducted based on remote sensing monitoring data.
At Drew Point, Alaska, the coastal erosion rate was relatively highest (11.6–67.7 m/yr) during the period of 1974–2017, with a mean erosion rate of 38.3 m/yr. In [
8], remote sensing analysis is used to determine the changes along the Beaufort Sea coast and it is found that the Drew Point coast was eroded by 900 m during the period of 1955–2005, and that the erosion rate documented during the period of 1985–2005 was more than double the rate documented during the period of 1955–1985. In [
37,
38], high spatial resolution satellite imagery was used to observe coastal erosion for a nine km segment of coastline at Drew Point between 2008 and 2017. It was found that mean annual erosion for the 2007–2016 ten-year period was 17.2 m/yr. Its study area is the area represented by sites A1 and A2 (shown in
Figure 3) in this study. It can be seen that the erosion rate is similar from
Table 3.
At Nutepel’men, Eastern Siberia, extensive coastal erosion was only observed along the estuarine coastlines during the period of 1975–2017, and no significant erosion occurred at its other sites. The Arctic Coastal Dynamics database by Lantuit et al. show that the coastal change in this region is almost zero [
10]. The study by Farquharson et al. also show that the coastal erosion rate was less than 0.7 m/yr in the US Chukchi Sea.
At Ozero Mogotoyevo, Eastern Siberia, the coastal erosion rate ranged from 5.3 m/yr to 28.4 m/yr during the period of 1992–2017, with a mean erosion rate of 12.4 m/yr. The research and Arctic Coastal Dynamics database by Lantuit et al. show that the coastal erosion rate in this region was 1.5 m/yr–3.5 m/yr [
10]. The data they used are from the 1950s to the 2000s. With warming, the erosion rate of the Arctic coast after 2000 can reach 2.5 times that before 2000.
Based on the preceding analysis of coastal changes in three different areas of the Arctic, it was found that owing to its low latitude (67.2° N), the Eastern Siberian coast (Nutepel’men) was not eroded, with the exception of its estuarine coastlines. Therefore, Drew Point in Alaska and Ozero Mogotoyevo in Eastern Siberia, which are close in latitude (both located at 71–72° N), were selected for a comparative analysis of coastal erosion (
Table 11). It was found that: (1) since 1992, the coastal erosion rate at Drew Point was significantly higher than that at Ozero Mogotoyevo; and (2) the coastal erosion rate of Alaska’s (Drew Point) coast was closely related to the range of the SST fluctuations, whereas the erosion of the Eastern Siberian (Ozero Mogotoyevo) coast was related to the increasing or decreasing trends of the SST. Therefore, it can be concluded that the erosion of coasts of the Arctic Ocean having a similar latitude was closely related to the trends and fluctuation range of the SST.
5. Conclusions
In this study, coastal erosion trends and their driving factors were analyzed in three areas of the Arctic, namely, Drew Point in Alaska, Nutepel’men and Ozero Mogotoyevo in Eastern Siberia, based on remote sensing data obtained from Landsat, ERS-1, and Gaofen-1 satellite imagery, collected between 1974 and 2017. The results of this study provide preliminary insight into the characteristics of coastal erosion and the driving factors of typical Arctic coasts. The primary results of the study are as follows.
(1) At Drew Point, Alaska, the coastal erosion was relatively large (497.7–2909.1 m) during the period of 1974–2017, with a mean erosion of 1648.5 m and with an erosion rate of 11.6–67.7 m/yr. At Nutepel’men, Eastern Siberia, extensive coastal erosion was only observed along the estuarine coastlines during the period of 1975–2017, and no significant erosion occurred at its other sites. At Ozero Mogotoyevo, Eastern Siberia, the coastal erosion ranged from 133.3 m to 709.4 m during the period of 1992–2017, with a mean erosion of 309.8 m, and with an erosion rate in the range of 5.3–28.4 m/yr.
(2) A comparative analysis has shown that the highest erosion occurred along Alaska’s coast, followed by those of the Eastern Siberian coasts. It was found that in Alaska, coastal erosion was closely related to the Sea Surface Temperature (SST). It was also shown that the intensification of the fluctuations of the SST could significantly accelerate coastal erosion. With the exception of estuarine areas, the coastal waters of Nutepel’men, Eastern Siberia were stable between 1975 and 2017. This conclusion is based on historical data that show small inter-annual variations in the mean SST in this area during the month of August. Thus, coastal erosion in this area was very weak, and changes occurred only along estuarine coastlines as a result of the combined actions of riverine and marine processes. The coastal erosion in Ozero Mogotoyevo, Eastern Siberia was related to the increasing or decreasing of the temperature of the SST. A decreasing trend was shown to be related to low erosion rates, whereas an increasing trend was related to increased coastal erosion rates. Therefore, it can be concluded that coastal erosion at similar latitudes in the Arctic is closely related to the trend or fluctuation range of the surface temperature of the sea. In the entire Arctic region, strong fluctuations in the SST, a continuous increase of the Significant Wave Height (SWH), and a decrease in sea ice cover caused drastic changes in coastal permafrost and promoted coastal erosion.
Author Contributions
Methodology, J.W. and H.Z.; Project administration, H.Z.; Resources, H.Z.; Software, J.W.; Validation, X.L., D.L., W.C. and A.S.; Writing-original draft, J.W. and H.Z.; Writing-review and editing, W.C., X.L. and D.L. All authors have read and agreed to the published version of the manuscript.
Funding
This research was funded by the National Key Research and Development Program, grant number 2018YFC1407200; and the National Natural Science Foundation of China, grant numbers 41876208, 41830540, and 41576174).
Institutional Review Board Statement
Not applicable.
Informed Consent Statement
Not applicable.
Data Availability Statement
Data available in a publicly accessible repository.
Acknowledgments
The authors would like to thank Yan Li of Xiamen University for his comments of this paper.
Conflicts of Interest
The authors declare that they have no conflict of interest.
References
- Notz, D.; Stroeve, J. Observed Arctic sea-ice loss directly follows anthropogenic CO2 emission. Science 2016, 354, 747–750. [Google Scholar] [CrossRef] [PubMed] [Green Version]
- Meredith, M.; Sommerkorn, M.; Cassotta, S.; Derksen, C.; Ekaykin, A.; Hollowed, A.; Kofinas, G.; Mackintosh, A.; Melbourne-Thomas, J.; Muelbert, M.M.C.; et al. Polar Regions. In IPCC Special Report on the Ocean and Cryosphere in a Changing Climate; IPCC: Geneva, Switzerland, 2019; Available online: https://www.ipcc.ch/srocc/chapter/chapter-3-2/ (accessed on 1 December 2021).
- Belchansky, G.I.; Douglas, D.C.; Platonov, N.G. Duration of the Arctic Sea ice melt season: Regional and interannual variability, 1979–2001. J. Clim. 2004, 17, 67–80. [Google Scholar] [CrossRef]
- Van Oldenborgh, G.J.; Drijfhout, S.; van Ulden, A.; Haarsma, R.; Sterl, A.; Severijns, C.; Hazeleger, W.; Dijkstra, H. Western Europe is warming much faster than expected. Clim. Past 2009, 5, 1–12. [Google Scholar] [CrossRef] [Green Version]
- Ford, J.D.; Couture, N.; Bell, T.; Clark, D.G. Climate change and Canada’s north coast: Research trends, progress, and future directions. Environ. Rev. 2018, 26, 82–92. [Google Scholar] [CrossRef] [Green Version]
- Irrgang, A.M.; Lantuit, H.; Manson, G.K.; Günther, F.; Grosse, G.; Overduin, P.P. Variability in rates of coastal change along the Yukon coast, 1951 to 2015. JGR Earth Surf. 2018, 123, 779–800. [Google Scholar] [CrossRef] [Green Version]
- Rachold, V.; Grigoriev, M.N.; Are, F.E.; Solomon, S.; Reimnitz, E.; Kassens, H.; Antonow, M. Coastal erosion vs riverine sediment discharge in the Arctic Shelf seas. Int. J. Earth Sci. 2000, 89, 450–460. [Google Scholar] [CrossRef]
- Mars, J.C.; Houseknecht, D.W. Quantitative remote sensing study indicates doubling of coastal erosion rate in past 50yr along a segment of the Arctic coast of Alaska. Geology 2007, 35, 583–586. [Google Scholar] [CrossRef]
- Overeem, I.; Anderson, R.S.; Wobus, C.W.; Clow, G.D.; Urban, F.E.; Matell, N. Sea ice loss enhances wave action at the Arctic coast. Geophys. Res. Lett. 2011, 38, 1–9. [Google Scholar] [CrossRef]
- Lantuit, H.; Overduin, P.P.; Couture, N.; Wetterich, S.; Are, F.; Atkinson, D.; Brown, J.; Cherkashov, G.; Drozdov, D.; Forbes, D.; et al. The Arctic coastal dynamics database: A new classification scheme and statistics on Arctic permafrost coastlines. Estuaries Coasts 2012, 35, 383–400. [Google Scholar] [CrossRef] [Green Version]
- Overduin, P.P.; Strzelecki, M.C.; Grigoriev, M.N.; Coutoure, N.; Lantuit, H.; St-Hilaire-Gravel, D.; Gunther, F.; Wetterich, S. Coastal changes in the Arctic. Geol. Soc. Lond. Spec. Publ. 2014, 388, 103–129. [Google Scholar] [CrossRef]
- Gibbs, A.E.; Richmond, B.M. National Assessment of Shoreline Change-Summary Statistics for Updated Vector Shorelines and Associated Shoreline Change Data for the North Coast of Alaska, U.S.-Canadian Border to Icy Cape; US Geological Survey Open-File Report 2017–1107; US Geological Survey: Reston, VA, USA, 2017.
- Rachold, V.; Lack, M.; Grigoriev, M.N. A Geo Information System (GIS) for Circum-Arctic Coastal Dynamics. In Proceedings of the 8th International Conference on Permafrost, Zurich, Switzerland, 21–25 July 2003; pp. 923–927. [Google Scholar]
- Lantuit, H.; Atkinson, D.; Overduin, P.P.; Grigoriev, M.; Rachold, V.; Guido, G.; Hubberten, H.-W. Coastal erosion dynamics on the permafrost dominated Bykovsky Peninsula, north Siberia, 1951–2006. Polar Res. 2011, 30, 1–21. [Google Scholar] [CrossRef]
- Zagorski, P. Shoreline dynamics of Calypsostranda (NW Wedel Jarlsberg Land, Svalbard) during the last century. Pol. Polar Res. 2011, 32, 67–99. [Google Scholar] [CrossRef]
- Strzelecki, M.C.; Long, A.J.; Lloyd, J.M. Post-little ice age development of a high Arctic paraglacial beach complex. Permafr. Periglac. Processes 2015, 26, 1–15. [Google Scholar] [CrossRef] [Green Version]
- Bourriquen, M.; Baltzer, A.; Mercier, D.; Fournier, J.; Perez, L.; Haquin, S.; Bernard, E.; Jensen, M.A. Coastal evolution and sedimentary mobility of Brøgger Peninsula, northwest Spitsbergen. Polar Biol. 2016, 29, 1689–1698. [Google Scholar] [CrossRef]
- St-Hilaire-Gravel, D.; Bell, T.J.; Forbes, D.L. Raised gravel beaches asproxy indicators of past sea-ice and wave conditions, Lowther Island, Canadian Arctic Archipelago. Arctic 2010, 63, 213–226. [Google Scholar] [CrossRef] [Green Version]
- Radosavljevic, B.; Lantuit, H.; Pollard, W.; Overduin, P.; Coutoure, N.; Saches, T.; Helm, V.; Fritz, M. Erosion and flooding-threats to coastal infrastructure in the Arctic: A case study from Herschel Island, Yukon Territory, Canada. Estuaries Coasts 2016, 39, 900–915. [Google Scholar] [CrossRef] [Green Version]
- Hansen, L. Deltaic infill of a deglaciated Arctic Fjord, east Greenland: Sedimentary facies and sequence stratigraphy. J. Sediment. Res. 2004, 74, 422–437. [Google Scholar] [CrossRef]
- Kroon, A.; Pedersen, J.B.T.; Sigsgaard, C. Morphodynamic Evolution of Two Deltas in Arctic Environments, East Coast of Greenland. In Proceedings of the Coastal Sediments 2011, Singapore, 2–6 May 2011; pp. 2299–2310. [Google Scholar]
- Bendixen, M.; Kroon, A. Conceptualizing delta forms and processes in Arctic coastal environments. Earth Surf. Processes Landf. 2017, 42, 1227–1237. [Google Scholar] [CrossRef]
- Wang, X.Z.; Zhang, H.G.; Fu, B.; Shi, A.Q. Analysis on the coastline change and erosion-accretion evolution of the Pearl River Estuary, China, based on remote-sensing images and nautical charts. J. Appl. Remote Sens. 2013, 7, 073519. [Google Scholar] [CrossRef] [Green Version]
- Wang, X.; Liu, X.L.; Ling, F.; Liu, Y.F.; Fang, F.G. Spatio-Temporal Change Detection of Ningbo Coastline Using Landsat Time-Series Images during 1976–2015. ISPRS Int. J. Geo-Inf. 2017, 6, 68. [Google Scholar] [CrossRef] [Green Version]
- Bruno, M.F.; Molfetta, M.G.; Pratola, L.; Mossa, M.; Nutricato, R.; Morea, A.; Nitti, D.O.; Chiaradia, M.T. A Combined Approach of Field Data and Earth Observation for Coastal Risk Assessment. Sensors 2019, 19, 1399. [Google Scholar] [CrossRef] [PubMed] [Green Version]
- Long, Y.; Yan, S.; Jiang, C.; Wu, C.; Tang, R.; Hu, S. Inversion of Lake Bathymetry through Integrating Multi-Temporal Landsat and ICESat Imagery. Sensors 2019, 19, 2896. [Google Scholar] [CrossRef] [PubMed] [Green Version]
- Xiong, L.; Wang, G.; Bao, Y.; Zhou, X.; Wang, K.; Liu, H.; Sun, X.; Zhao, R. A Rapid Terrestrial Laser Scanning Method for Coastal Erosion Studies: A Case Study at Freeport, Texas, USA. Sensors 2019, 19, 3252. [Google Scholar] [CrossRef] [PubMed] [Green Version]
- Scardino, G.; Sabatier, F.; Scicchitano, G.; Piscitelli, A.; Milella, M.; Vecchio, A.; Anzidei, M.; Mastronuzzi, G. Sea-Level Rise and Shoreline Changes Along an Open Sandy Coast: Case Study of Gulf of Taranto, Italy. Water 2020, 12, 1414. [Google Scholar] [CrossRef]
- Anzidei, M.; Scicchitano, G.; Scardino, G.; Bignami, C.; Tolomei, C.; Vecchio, A.; Serpelloni, E.; De Santis, V.; Monaco, C.; Milella, M.; et al. Relative Sea-Level Rise Scenario for 2100 along the Coast of South Eastern Sicily (Italy) by InSAR Data, Satellite Images and High-Resolution Topography. Remote Sens. 2021, 13, 1108. [Google Scholar] [CrossRef]
- Antonioli, F.; De Falco, G.; Lo Presti, V.; Moretti, L.; Scardino, G.; Anzidei, M.; Bonaldo, D.; Carniel, S.; Leoni, G.; Furlani, S.; et al. Relative Sea-Level Rise and Potential Submersion Risk for 2100 on 16 Coastal Plains of the Mediterranean Sea. Water 2020, 12, 2173. [Google Scholar] [CrossRef]
- Elnabwy, M.T.; Elbeltagi, E.; El Banna, M.M.; Elshikh, M.M.Y.; Motawa, I.; Kaloop, M.R. An Approach Based on Landsat Images for Shoreline Monitoring to Support Integrated Coastal Management—A Case Study, Ezbet Elborg, Nile Delta, Egypt. ISPRS Int. J. Geo-Inf. 2020, 9, 199. [Google Scholar] [CrossRef] [Green Version]
- Petrişor, A.-I.; Hamma, W.; Nguyen, H.D.; Randazzo, G.; Muzirafuti, A.; Stan, M.-I.; Tran, V.T.; Aştefănoaiei, R.; Bui, Q.-T.; Vintilă, D.-F.; et al. Degradation of Coastlines under the Pressure of Urbanization and Tourism: Evidence on the Change of Land Systems from Europe, Asia and Africa. Land 2020, 9, 275. [Google Scholar] [CrossRef]
- Sagar, S.; Roberts, D.; Bala, B.; Lymburner, L. Extracting the intertidal extent and topography of the Australian coastline from a 28 year time series of Landsat observations. Remote Sens. Environ. 2017, 195, 153–169. [Google Scholar] [CrossRef]
- Murray, N.J.; Phinn, S.R.; Clemens, R.S.; Roelfsema, C.M.; Fuller, R.A. Continental scale mapping of tidal flats across East Asia using the Landsat archive. Remote Sens. 2012, 4, 3417–3426. [Google Scholar] [CrossRef] [Green Version]
- Murray, N.J.; Phinn, S.R.; DeWitt, M.; Ferrari, R.; Johnston, R.; Lyons, M.B.; Clinton, N.; Thau, D.; Fuller, R.A. The global distribution and trajectory of tidal flats. Nature 2019, 565, 222–225. [Google Scholar] [CrossRef] [PubMed]
- Emery, W.; Camps, A. The History of Satellite Remote Sensing. In Introduction to Satellite Remote Sensing: Atmosphere, Ocean and Land Applications; Elsevier: Amsterdam, The Netherlands, 2017; pp. 1–42. [Google Scholar]
- Jones, B.M.; Farquharson, L.M.; Baughman, C.A.; Buzard, R.M.; Arp, C.D.; Grosse, G.; Bull, D.L.; Günther, F.; Nitze, I.; Urban, F.; et al. A decade of remotely sensed observations highlight complex processes linked to coastal permafrost bluff erosion in the Arctic. Environ. Res. Lett. 2018, 13, 115001. [Google Scholar] [CrossRef]
- Farquharson, L.M.; Mann, D.H.; Swanson, D.K.; Jones, B.M.; Buzard, R.M.; Jordan, J.W. Temporal and spatial variability in coastline response to declining sea-ice in northwest Alaska. Mar. Geol. 2018, 404, 71–83. [Google Scholar] [CrossRef]
Figure 1.
Map of study area locations. (The red rectangles indicate the study areas).
Figure 1.
Map of study area locations. (The red rectangles indicate the study areas).
Figure 2.
Sketch map of the coastal change extraction. The colored lines represent the waterline of different years. The black line represents the normal line with the waterline in 2017.
Figure 2.
Sketch map of the coastal change extraction. The colored lines represent the waterline of different years. The black line represents the normal line with the waterline in 2017.
Figure 3.
Landsat-8 operational land imager (OLI) imagery of Drew Point in Alaska (the image was acquired on July 14, 2017). The red line is the waterline extracted from satellite data, and the green dots represent the six selected research sites.
Figure 3.
Landsat-8 operational land imager (OLI) imagery of Drew Point in Alaska (the image was acquired on July 14, 2017). The red line is the waterline extracted from satellite data, and the green dots represent the six selected research sites.
Figure 4.
(a) Historical coastal erosion at Drew Point, Alaska; (b) historical sea surface temperatures of Beaufort Sea in August; (c) historically significant wave height of Beaufort Sea in August; (d) historical sea ice cover of Beaufort Sea in August. (The orange line represents the change trend of the average erosion rate. The yellow lines represent the change trend of the SST, SWH, and ice cover.).
Figure 5.
Landsat-5 thematic mapper imagery of Nutepel’men in Eastern Siberia (image acquisition date: 26 September 1995). The red line shows the coastline extracted from satellite data, and the yellow stars represent the selected research sites.
Figure 5.
Landsat-5 thematic mapper imagery of Nutepel’men in Eastern Siberia (image acquisition date: 26 September 1995). The red line shows the coastline extracted from satellite data, and the yellow stars represent the selected research sites.
Figure 6.
(a) Historical records of coastal erosion of the Nutepel’men coastline in Eastern Siberia; (b) historical SST of the Chukchi Sea in August; (c) historical SWH of the Chukchi Sea in August; (d) historical sea ice cover of the Chukchi Sea in August. (The orange line represents the change trend of the average erosion rate. The yellow lines represent the change trend of the SST, SWH, and ice cover.).
Figure 7.
Landsat-7 enhanced thematic mapper imagery of Ozero Mogotoyevo in Eastern Siberia (the image was acquired on 3 August 2000). The red line is the coastline extracted from satellite data, and the black triangles represent the selected research sites.
Figure 7.
Landsat-7 enhanced thematic mapper imagery of Ozero Mogotoyevo in Eastern Siberia (the image was acquired on 3 August 2000). The red line is the coastline extracted from satellite data, and the black triangles represent the selected research sites.
Figure 8.
(a) Historical coastal erosion data for Ozero Mogotoyevo in Eastern Siberia; (b) historical data of the sea surface temperature of East Siberian Sea in August; (c) historical SWH of East Siberian Sea in August; (d) historical sea ice cover of East Siberian Sea in August. (The orange line represents the change trend of the average erosion rate. The yellow lines represent the change trend of the SST, SWH, and ice cover.).
Table 1.
Remote sensing data with coverage of the studied areas.
Table 1.
Remote sensing data with coverage of the studied areas.
| No. | Satellite | Acquisition Date | Resolution (m) | Area |
|---|
| 1 | Landsat-1 | 1974–8–22 | 60 | Alaska |
| 2 | Landsat-2 | 1975–8–19 | 60 | Eastern Siberia (Nutepel’men) |
| 3 | Landsat-5 | 1985–7–22 | 30 | Alaska |
| 4 | ERS-1 | 1992–4–30 | 25 | Eastern Siberia (Ozero Mogotoyevo) |
| 5 | Landsat-4 | 1992–7–26 | 30 | Alaska |
| 6 | ERS-1 | 1993–4–21 | 25 | Eastern Siberia (Ozero Mogotoyevo) |
| 7 | Landsat-5 | 1995–9–26 | 30 | Eastern Siberia (Nutepel’men) |
| 8 | Landsat-7 | 2000–8–3 | 15 (panchromatic band) | Eastern Siberia (Ozero Mogotoyevo) |
| 9 | Landsat-7 | 2001–7–3 | 15 (panchromatic band) | Alaska |
| 10 | Landsat-7 | 2002–6–1 | 15 (panchromatic band) | Eastern Siberia (Nutepel’men) |
| 11 | Landsat-5 | 2009–6–12 | 30 | Eastern Siberia (Nutepel’men) |
| 12 | Landsat-5 | 2009–6–15 | 30 | Eastern Siberia (Ozero Mogotoyevo) |
| 13 | Landsat-5 | 2009–7–15 | 30 | Alaska |
| 14 | Landsat-5 | 2009–8–2 | 30 | Alaska |
| 15 | Landsat-5 | 2009–9–7 | 30 | Eastern Siberia (Ozero Mogotoyevo) |
| 16 | Landsat-8 | 2017–6–18 | 15 (panchromatic band) | Eastern Siberia (Nutepel’men) |
| 17 | Landsat-8 | 2017–7–14 | 15 (panchromatic band) | Alaska |
| 18 | Gaofen-1 | 2017–7–14 | 16 | Alaska |
| 19 | Landsat-8 | 2017–7–25 | 15 (panchromatic band) | Eastern Siberia (Ozero Mogotoyevo) |
Table 2.
Coastal erosion rates of various sites at Drew Point in Alaska (unit: m).
Table 2.
Coastal erosion rates of various sites at Drew Point in Alaska (unit: m).
| | Site | A1 | A2 | A3 | A4 | A5 | A6 | Mean |
|---|
| Period | |
|---|
| 1974–1985 | 276.2 | 635.4 | 0.0 | 621.4 | 0.0 | 160.8 | 282.3 |
| 1985–1992 | 84.2 | 427.4 | 130.0 | 707.0 | 781.3 | 31.1 | 360.2 |
| 1992–2001 | 0.0 | 727.0 | 0.0 | 588.6 | 560.4 | 84.3 | 326.7 |
| 2001–2009 | 138.9 | 614.5 | 435.8 | 761.2 | 552.4 | 94.7 | 432.9 |
| 2009–2017 | 0.0 | 0.0 | 896.4 | 230.9 | 224.2 | 126.8 | 246.4 |
| 1974–2017 | 499.3 | 2404.3 | 1462.2 | 2909.1 | 2118.3 | 497.7 | 1648.5 |
Table 3.
Coastal erosion rates of various sites at Drew Point in Alaska (unit: m/yr).
Table 3.
Coastal erosion rates of various sites at Drew Point in Alaska (unit: m/yr).
| | Site | A1 | A2 | A3 | A4 | A5 | A6 | Mean |
|---|
| Period | |
|---|
| 1974–1985 | 25.1 | 57.8 | 0.0 | 56.5 | 0.0 | 14.6 | 25.7 |
| 1985–1992 | 12.0 | 61.1 | 18.6 | 101.0 | 111.6 | 4.4 | 51.4 |
| 1992–2001 | 0.0 | 80.8 | 0.0 | 65.4 | 62.3 | 9.4 | 36.3 |
| 2001–2009 | 17.4 | 76.8 | 54.5 | 95.2 | 69.1 | 11.8 | 54.1 |
| 2009–2017 | 0.0 | 0.0 | 112.1 | 28.9 | 28.0 | 15.9 | 30.8 |
| 1974–2017 | 11.6 | 55.9 | 34.0 | 67.7 | 49.3 | 11.6 | 38.3 |
Table 4.
Comparison of coastal erosion rates and historical sea surface temperatures of Beaufort Sea along Alaska’s coast in August.
Table 4.
Comparison of coastal erosion rates and historical sea surface temperatures of Beaufort Sea along Alaska’s coast in August.
| Period | Erosion Rate | Mean SST | SST Change Rate | SST Standard Deviation |
|---|
| 1979–1985 | 25.7 | 1.11 | −0.64 | 0.99 |
| 1985–1992 | 51.4 | 1.20 | −0.10 | 2.08 |
| 1992–2001 | 36.3 | 2.37 | 0.10 | 0.92 |
| 2001–2009 | 54.1 | 1.01 | 0.14 | 1.63 |
| 2009–2017 | 30.8 | 3.38 | 0.06 | 0.89 |
| 1979–2017 | 38.3 | 1.96 | 0.04 | 1.60 |
Table 5.
Coastal erosion at different sites on the Nutepel’men coastline in Eastern Siberia (unit: m).
Table 5.
Coastal erosion at different sites on the Nutepel’men coastline in Eastern Siberia (unit: m).
| | Site | ES1 | ES2 | ES3 | ES4 | ES5 | Mean |
|---|
| Period | |
|---|
| 1975–1995 | 86.8 | 0.0 | 434.0 | 0.0 | 0.0 | 104.2 |
| 1995–2002 | 77.8 | 0.0 | 91.5 | 0.0 | 0.0 | 33.9 |
| 2002–2009 | 117.6 | 0.0 | 229.4 | 0.0 | 0.0 | 69.4 |
| 2009–2017 | 155.6 | 0.0 | 429.3 | 0.0 | 0.0 | 117.0 |
| 1975–2017 | 437.8 | 0.0 | 1184.2 | 0.0 | 0.0 | 324.4 |
Table 6.
Coastal erosion rates at various sites along the Nutepel’men coastline in Eastern Siberia (unit: m/yr).
Table 6.
Coastal erosion rates at various sites along the Nutepel’men coastline in Eastern Siberia (unit: m/yr).
| | Site | ES1 | ES2 | ES3 | ES4 | ES5 | Mean |
|---|
| Period | |
|---|
| 1975–1995 | 4.3 | 0.0 | 21.7 | 0.0 | 0.0 | 5.2 |
| 1995–2002 | 11.1 | 0.0 | 13.1 | 0.0 | 0.0 | 4.8 |
| 2002–2009 | 16.8 | 0.0 | 32.8 | 0.0 | 0.0 | 9.9 |
| 2009–2017 | 19.5 | 0.0 | 53.7 | 0.0 | 0.0 | 14.6 |
| 1975–2017 | 10.4 | 0.0 | 28.2 | 0.0 | 0.0 | 7.7 |
Table 7.
Comparison of coastal erosion rates along the Nutepel’men coastline in Eastern Siberia and sea surface temperatures of the Chukchi Sea in August.
Table 7.
Comparison of coastal erosion rates along the Nutepel’men coastline in Eastern Siberia and sea surface temperatures of the Chukchi Sea in August.
| Period | Erosion Rate | Mean SST | SST Change Rate | SST Standard Deviation |
|---|
| 1979–1995 | 5.2 | 5.38 | 0.01 | 1.14 |
| 1995–2002 | 4.8 | 5.70 | −0.05 | 1.90 |
| 2002–2009 | 9.9 | 6.56 | −0.21 | 1.88 |
| 2009–2017 | 14.6 | 5.86 | 0.15 | 0.88 |
| 1979–2017 | 7.7 | 5.67 | 0.02 | 1.40 |
Table 8.
Coastal erosion at different sites along the Ozero Mogotoyevo coastline in Eastern Siberia (unit: m).
Table 8.
Coastal erosion at different sites along the Ozero Mogotoyevo coastline in Eastern Siberia (unit: m).
| | Site | WS1 | WS2 | WS3 | WS4 | WS5 | Mean |
|---|
| Period | |
|---|
| 1992–2000 | 0.0 | 234.3 | 0.0 | 0.0 | 0.0 | 46.9 |
| 2000–2009 | 140.8 | 257.3 | 29.7 | - | 68.1 | 124.0 |
| 2009–2017 | 209.8 | 217.8 | 103.6 | - | 106.3 | 159.4 |
| 1992–2017 | 350.6 | 709.4 | 133.3 | 181.2 | 174.4 | 309.8 |
Table 9.
Coastal erosion rates at different sites along the Ozero Mogotoyevo coastline in Eastern Siberia (unit: m/yr).
Table 9.
Coastal erosion rates at different sites along the Ozero Mogotoyevo coastline in Eastern Siberia (unit: m/yr).
| | Site | WS1 | WS2 | WS3 | WS4 | WS5 | Mean |
|---|
| Period | |
|---|
| 1992–2000 | 0.0 | 29.3 | 0.0 | 0.0 | 0.0 | 5.9 |
| 2000–2009 | 15.6 | 28.6 | 3.3 | - | 7.6 | 13.8 |
| 2009–2017 | 26.2 | 27.2 | 13.0 | - | 13.3 | 19.9 |
| 1992–2017 | 14.0 | 28.4 | 5.3 | 7.2 | 7.0 | 12.4 |
Table 10.
Comparison of coastal erosion rates at Nutepel’men in Eastern Siberia and historical sea surface temperature of the East Siberian Sea in August.
Table 10.
Comparison of coastal erosion rates at Nutepel’men in Eastern Siberia and historical sea surface temperature of the East Siberian Sea in August.
| Period | Erosion Rate | Mean SST | SST Change Rate | SST Standard Deviation |
|---|
| 1992–2000 | 5.9 | 1.61 | −0.23 | 1.49 |
| 2000–2009 | 13.8 | 0.35 | −0.03 | 0.98 |
| 2009–2017 | 19.9 | 2.57 | 0.03 | 0.98 |
| 1992–2017 | 12.4 | 1.44 | 0.04 | 1.53 |
Table 11.
Comparison of coastal erosion in Alaska and Eastern Siberia.
Table 11.
Comparison of coastal erosion in Alaska and Eastern Siberia.
| Area | Period | Erosion Rate
(m/yr) | SST
Mean | SST Change Slope | SST Standard Deviation |
|---|
| Alaska | 1992–2001 | 36.3 | 2.37 | 0.10 | 0.92 |
| Eastern Siberia (Ozero Mogotoyevo) | 1992–2000 | 5.9 | 1.61 | −0.23 | 1.49 |
| Alaska | 2001–2009 | 54.1 | 1.01 | 0.14 | 1.63 |
| Eastern Siberia (Ozero Mogotoyevo) | 2000–2009 | 13.8 | 0.35 | −0.03 | 0.98 |
| Alaska | 2009–2017 | 30.8 | 3.38 | 0.06 | 0.89 |
| Eastern Siberia (Ozero Mogotoyevo) | 2009–2017 | 19.9 | 2.57 | 0.03 | 0.98 |
| Alaska | 1992–2017 | 40.2 | 2.22 | 0.06 | 1.50 |
| Eastern Siberia (Ozero Mogotoyevo) | 1992–2017 | 12.4 | 1.44 | 0.04 | 1.53 |
| Publisher’s Note: MDPI stays neutral with regard to jurisdictional claims in published maps and institutional affiliations. |
© 2022 by the authors. Licensee MDPI, Basel, Switzerland. This article is an open access article distributed under the terms and conditions of the Creative Commons Attribution (CC BY) license (https://creativecommons.org/licenses/by/4.0/).


