Article

The Roles of Sea Ice Export, Atmospheric and Oceanic Factors in the Seasonal and Regional Variability of Arctic Sea Ice during 1979–2020

1
Henan Academy of Big Data, Zhengzhou University, Zhengzhou 450001, China
2
School of Mathematics and Statistics, Zhengzhou University, Zhengzhou 450001, China
3
School of Geography and Ocean Science, Nanjing University, Nanjing 210023, China
4
Finnish Meteorological Institute, FI-00101 Helsinki, Finland
5
National Marine Environmental Forecasting Center, Beijing 100081, China
6
Department of Geography and GeoInformation Science, George Mason University, Fairfax, VA 22030, USA
*
Author to whom correspondence should be addressed.
Remote Sens. 2022, 14(4), 904; https://doi.org/10.3390/rs14040904
Submission received: 8 December 2021 / Revised: 26 January 2022 / Accepted: 9 February 2022 / Published: 14 February 2022
(This article belongs to the Special Issue Remote Sensing Monitoring of Arctic Environments)

Abstract

:
The seasonal and regional variability of Arctic sea ice area (SIA) and thickness (SIT) were investigated between 1979 and 2020 for the Atlantic sector (AS), Pacific sector (PS) and Barents–Kara Seas (BKSs). We applied the SIA data from remote sensing observations and SIT data from numerical model calculations. We found the large summer variability of SIA and SIT in AS and PS compared with those in winter. The opposite feature was seen in the BKSs. The annual declining rates of SIA and SIT were the largest in PS (−1.73 × 10⁴ km2 yr−1) and AS (−3.36 × 10⁻² m yr−1), respectively. The SIA variability was modest for winter PS and the northern Canadian Arctic Archipelago of AS. The annual and winter SIA flux from PS to AS gradually increased in 1979–2020; the summer SIA flux accounted for 11% of the PS summer SIA decline. The annual and seasonal SIA outflow through the Fram Strait during 1979–2020 steadily increased while for annual and winter SIA export, the increase mainly occurred in 1979–2000; the summer SIA outflow was only 1.45% equivalent to the decrease in the entire Arctic summer SIA. We concluded that sea ice export was not a major impact factor on the seasonal and regional decline of SIA and SIT except for the individual years. The near surface air temperature (SAT) and sea surface temperature (SST) were responsible for the retreat and thinning of the sea ice. The dramatic increase in SAT in winter resulted in a strong decrease in winter sea ice in BKS. The outgoing longwave radiation had significant negative correlations with SIA and SIT and positive correlations with SAT and SST. The Atlantic multi-decadal oscillation, related to the North Atlantic Ocean’s SST anomalies, had significant negative correlations with SIA and SIT. The SIT had higher correlations with the atmospheric and oceanic factors compared with SIA, which indicates that SIT is important for predictions of Arctic sea ice and climate change.

Graphical Abstract

1. Introduction

The Arctic sea ice plays a significant role in climate change through regulating the exchanges of moisture, momentum and heat between the polar oceans and the atmosphere. Based on the passive microwave satellite measurements from 1979 to 2019, the sea ice area (SIA) in September declined at a rate of about 13% per decade [1]. However, long-term satellite sea ice thickness (SIT) for the entire Arctic Ocean were not available. The SIT estimated by submarine observations in various parts of the Arctic Ocean spanned from 1958 to 2000 [2]. The field measurements for SIT are highly temporally and spatially limited. The basin scale observed SIT was based on satellite altimeter measurements since 2003 [2]. Based on submarine and ICESat data, the Arctic average SIT in fall declined from 3.02 m to 1.92 m during the 1960s–1990s [3]. The mean SIT in winter showed a nearly 2-fold thinning during the past five decades based on the submarine and satellite observations [4]. The thinning of sea ice promoted SIA minimum more frequently in recent years [5].
The decline in sea ice cover impacts the sea ice’s drift velocity and deformation [5,6,7,8]. The Arctic sea ice’s mass balance is not only impacted by the energy balance changes of the coupled ice–ocean–atmosphere system, but by the increasing dynamic effects. The dynamic factors include sea ice motion and export [9]. The sea ice flux between the Pacific and Atlantic sectors impacts the sea ice mass balance of these two subregions while the sea ice export through the Fram Strait, the major gate of Arctic sea ice outflow, impacts the entire Arctic sea ice cover. The thermodynamic factors change the surface energy fluxes by the advection of moisture and heat [10,11,12], which results in local warming by increased cloud cover, enhanced latent and sensible heat fluxes and downwelling radiation, which impedes sea ice formation during the sea ice freezing season [13]. This influence is strengthened by surface albedo feedback in open water formed as a result of the decrease in the sea ice cover [14]. Under the action of these factors, the decline in Arctic sea ice is seasonally inconsistent. The positive feedback of summer sea ice albedo is active due to maximum solar radiation and heat absorption into the ocean. Therefore, sea ice loss in summer has been generally larger [15]. The feedback of sea ice albedo is inhibited in winter; heat transportation from the ocean is the major mechanism for the decrease in sea ice. This process also promotes atmospheric warming by releasing the heat stored in the ocean [16]. The heat exchange between ocean and atmosphere is the primary process of Arctic amplification, which is more obvious in winter. Moreover, the observed SAT response to anthropogenic forcing is strong in the high latitude, which is related to the seasonal low-pressure systems and subtropical depressions developing [17]. The seasonal discrepancy of sea ice decline will impact the range of the seasonal cycle and vary the seasonal climate in the Arctic Ocean [18].
As sea ice conditions and associated drivers of sea ice change in the Arctic Ocean differ from region to region, sea ice loss is not spatially uniform. The Pacific sector is a sensitive region for climate change. The change of sea ice in this region is due to sea ice melting and advection [19]. The ocean heat transport of the Bering Strait impacts the sea surface temperature (SST) and sea ice cover in the Chukchi Sea [20,21]. In the past decades, sea ice age and thickness transited towards younger, thinner ice in the Pacific sector [1]. Moreover, the average sea ice flux from the Pacific sector to the Atlantic sector influences the changes of sea ice cover in these two regions [1]. Warm Atlantic water flows into the Atlantic sector in two ways: one through the Fram Strait and the other through the Barents–Kara Seas [22]. During the past few decades, there has been an obvious shift in sea ice thickness and age for the Atlantic sector, especially the northern region of Greenland and the Canadian Arctic Archipelago (CAA) [23]; the Barents–Kara Seas also experience a high declining rate in sea ice [24,25]. Despite the great attention paid to the Arctic sea ice, previous studies mainly focused on the summer sea ice decline and not much on the seasonal and regional differences. The regional sea ice characteristics are useful indices for climate predictions in the mid-latitudes of the northern hemisphere [26]. Moreover, spatial–temporal characteristics of Arctic sea ice contribute to the large-scale atmospheric circulation anomalies [27]. Thus, enhanced knowledge of seasonal and regional Arctic sea ice is needed.
The objective of this study is to better understand the spatial–temporal variability of the Arctic sea ice during the past 42 years (1979–2020). We focus on the spatiality of sea ice in three Arctic sectors, namely, the Atlantic sector (AS), the Pacific sector (PS) and Barents–Kara Seas (BKSs). We chose satellite-based SIA and model-based SIT as indicators to identify spatial–temporal variability of the Arctic sea ice, because both products have long-term series in the Arctic Ocean. To understand the physical mechanisms behind the spatial–temporal characteristic of the Arctic sea ice, the dynamic impact of sea ice advection between PS and AS, and further export through the Fram Strait were investigated. We also investigated the large-scale 2-m high air temperature (SAT), SST, the outgoing long-wave radiative flux (OLR) and the Atlantic multi-decadal oscillation (AMO), and their linkages to the SIA and SIT; in particular, their impacts on extreme events of the spatial–temporal sea ice decline processes. We expected to provide a full picture of Arctic sea ice distribution regionally and seasonally, since the era of the Arctic remote sensing observation.

2. Data and Methods

2.1. Data

Sea ice concentration (SIC) is one of the remote sensing products that has a long time series since 1979. SIC products have been validated and widely used [24], and therefore applied to estimate SIA in this study. The SIT remote sensing products have no such comparable long-time series. To tackle this challenge, the SIT model product is often used. One of the most frequently used SIT products comes from the Pan-Arctic Ice-Ocean modelling and assimilation system (PIOMAS) [28], and is therefore used in this study. Additionally, several other critical sea ice parameters from world leading Arctic climate data centers were applied. The temporal and spatial coverages of these data sets are summarized in Table 1.
The definition of Arctic sectors is illustrated in Figure 1. The blue line connecting the eastern tip of Severnaya Zemlya and the southwestern tip of Banks Island [19] is the boundary between the Pacific and Atlantic sectors, and serves as the gateway by which SIA exchanges are estimated. The black line in Figure 1 shows the fluxgate of the Fram Strait through which sea ice is exported from the Arctic Ocean [29]. The boundary for the Barents–Kara Seas is obtained from the National Snow and Ice Data Center (NSIDC, https://nsidc.org/data/masie/browse_regions, accessed on 7 December 2018). The areas of AS, PS and BKS cover 28%, 45% and 27% of the entire Arctic Ocean, respectively.

2.1.1. Sea Ice Concentration

The SIC product was provided by the NSIDC, derived from the Special Sensor Microwave Imager (SSM/I) and Special Sensor Microwave Imager Sounder (SSMI-S) (https://nsidc.org/data/G02135/versions/3, accessed on 9 March 2021). The SIC was estimated by the NASA Team (NT) algorithm [30] and applied to calculate the SIA and sea ice flux. The accuracy of SIC at a grid cell is usually ±5% in winter and ±15% in summer [31].

2.1.2. Sea Ice Thickness

The PIOMAS SIT was estimated by a coupled ocean–ice assimilation system [32], which is forced by NCEP-NCAR reanalysis. PIOMAS couples the Parallel Ocean Program ocean model with a multi-category thickness and enthalpy distribution model [32,33,34]. The data from 1979 to 2020 were obtained from the Polar Science Center (PSC) and used to analyze the spatial–temporal variability of Arctic SIT (http://psc.apl.uw.edu/, accessed on 9 March 2021).
CryoSat-2 (CS2) SIT data was acquired from NSIDC. The sea ice freeboard was estimated by the physical waveform fitting retracker [35], and was converted into the SIT by the hydrostatic balance equation. Detail processes on the original data can be obtained from NSIDC (https://nsidc.org/data/RDEFT4/, accessed on 13 August 2020). The SIT data from October 2010 to April 2019 were applied for comparison with PIOMAS SIT.

2.1.3. Sea Ice Drift

The sea ice drift dataset from 1979 to 2020 was derived from NSIDC (http://nsidc.org/, accessed on 9 March 2021). The sea ice drift was estimated based on satellite-based passive microwave measurements [36]. The drift data was used to calculate the SIA flux between the Pacific and Atlantic sectors and SIA outflux through the Fram Strait. The uncertainties of sea ice drift are 2 cm/s in winter [37], while the uncertainties for summer are two-fold of the winter (4 cm/s).

2.1.4. Sea Ice Albedo

The Arctic sea ice albedo was estimated by the CLARA-A2-SAL data, which was provided by EUMETSATCM SAF. CLARA-A2-SAL was retrieved by AVHRR radiance data and cloud mask. The relative accuracy of the data was 3–15% in sea ice and snow areas [38]. The sea ice albedo from 1982–2018 was used to analyze the change of Arctic sea ice albedo during the past several decades. The data for July, August and September were used to calculate the mean value of the summer sea ice albedo.

2.1.5. Weather Data

SST and 2 m SAT were used to discuss the impact of the atmospheric and oceanic factors on sea ice cover change and were provided by the ERA interim data set in the European Center for Medium-Range Weather Forecasts (ECMWF). The ERA interim data set was produced by the data assimilation system, which included a multivariate record of the global atmospheric circulation [39]. Monthly OLR data was provided by the National Centers for Environmental Prediction (NCEP) and the National Center for Atmospheric Research (NCAR). The OLR data was estimated based on the measurements from the Advanced Very High-Resolution Radiometer (AVHRR).
The AMO index was estimated based on the North Atlantic Ocean’s average SST anomalies, usually above 0°–80°N [40]. The AMO index displayed the long-term SST spatial trend for the North Atlantic Ocean [40]; so, it was applied to analyze the impact of oceanic variability on the Arctic sea ice cover. The monthly AMO dataset from 1979 to 2020 was acquired from the NOAA Earth System Research Laboratory and was calculated by the monthly Kaplan SST dataset.

2.2. Methods

The SIA was obtained by multiplying SIC by the cell area, at least, 15% SIC. The grid cell sizes of PIOMAS SIT, SAT and SST were not consistent with the SIC (Table 1); we used the nearest-neighbor interpolation to re-grid them to 25 km. The spatial resolution of OLR was 2.5° latitude × 2.5° longitude of the global grid; the temporal and spatial interpolation were obtained by averaging the surrounding values and were applied to fill the missing data and re-grid it to 25 km [25,41]. To use the detrended time series to document the variability of sea ice and the relationship between sea ice parameters and atmospheric and oceanic factors, the monthly anomalies for SIA, SIT, SST, SAT, SST, OLR and AMO were estimated by computing the difference between the monthly average during 1979–2020 and the corresponding month. The linear regression was applied to evaluate the SIA and SIT trends and the t-test was used to estimate the statistical significance level. The spatial trends for SIA and SIT were calculated by least-squares regression for each grid cell. The correlation analyses as follows were estimated by the monthly anomalies. The correlation matrix was used to display the linkages between SIA, SIT and atmospheric and oceanic factors.
The SIA flux between the Pacific sector and the Atlantic sector and the sea ice outflux through the Fram Strait were estimated based on SIC, sea ice drift and the size of each grid cell. The SIA flux was calculated according to Equation (1).
F = i = 1 N 1 V i C i Δ x ( i = 1 , 2 , , N )
where V is the sea ice drift, C is the SIC, and Δx is the constant grid cell width of 25 km. N is the number of grid cells of the transects (Figure 1). The annual flux is the accumulative fluxes over the annual cycles (January–December). The seasonal flux is estimated by summing up the summer (winter) month fluxes. Based on the Arctic sea ice melting and freezing cycles, the winter consists of January, February and March, and the summer consists of July, August and September [25,42].

3. Results

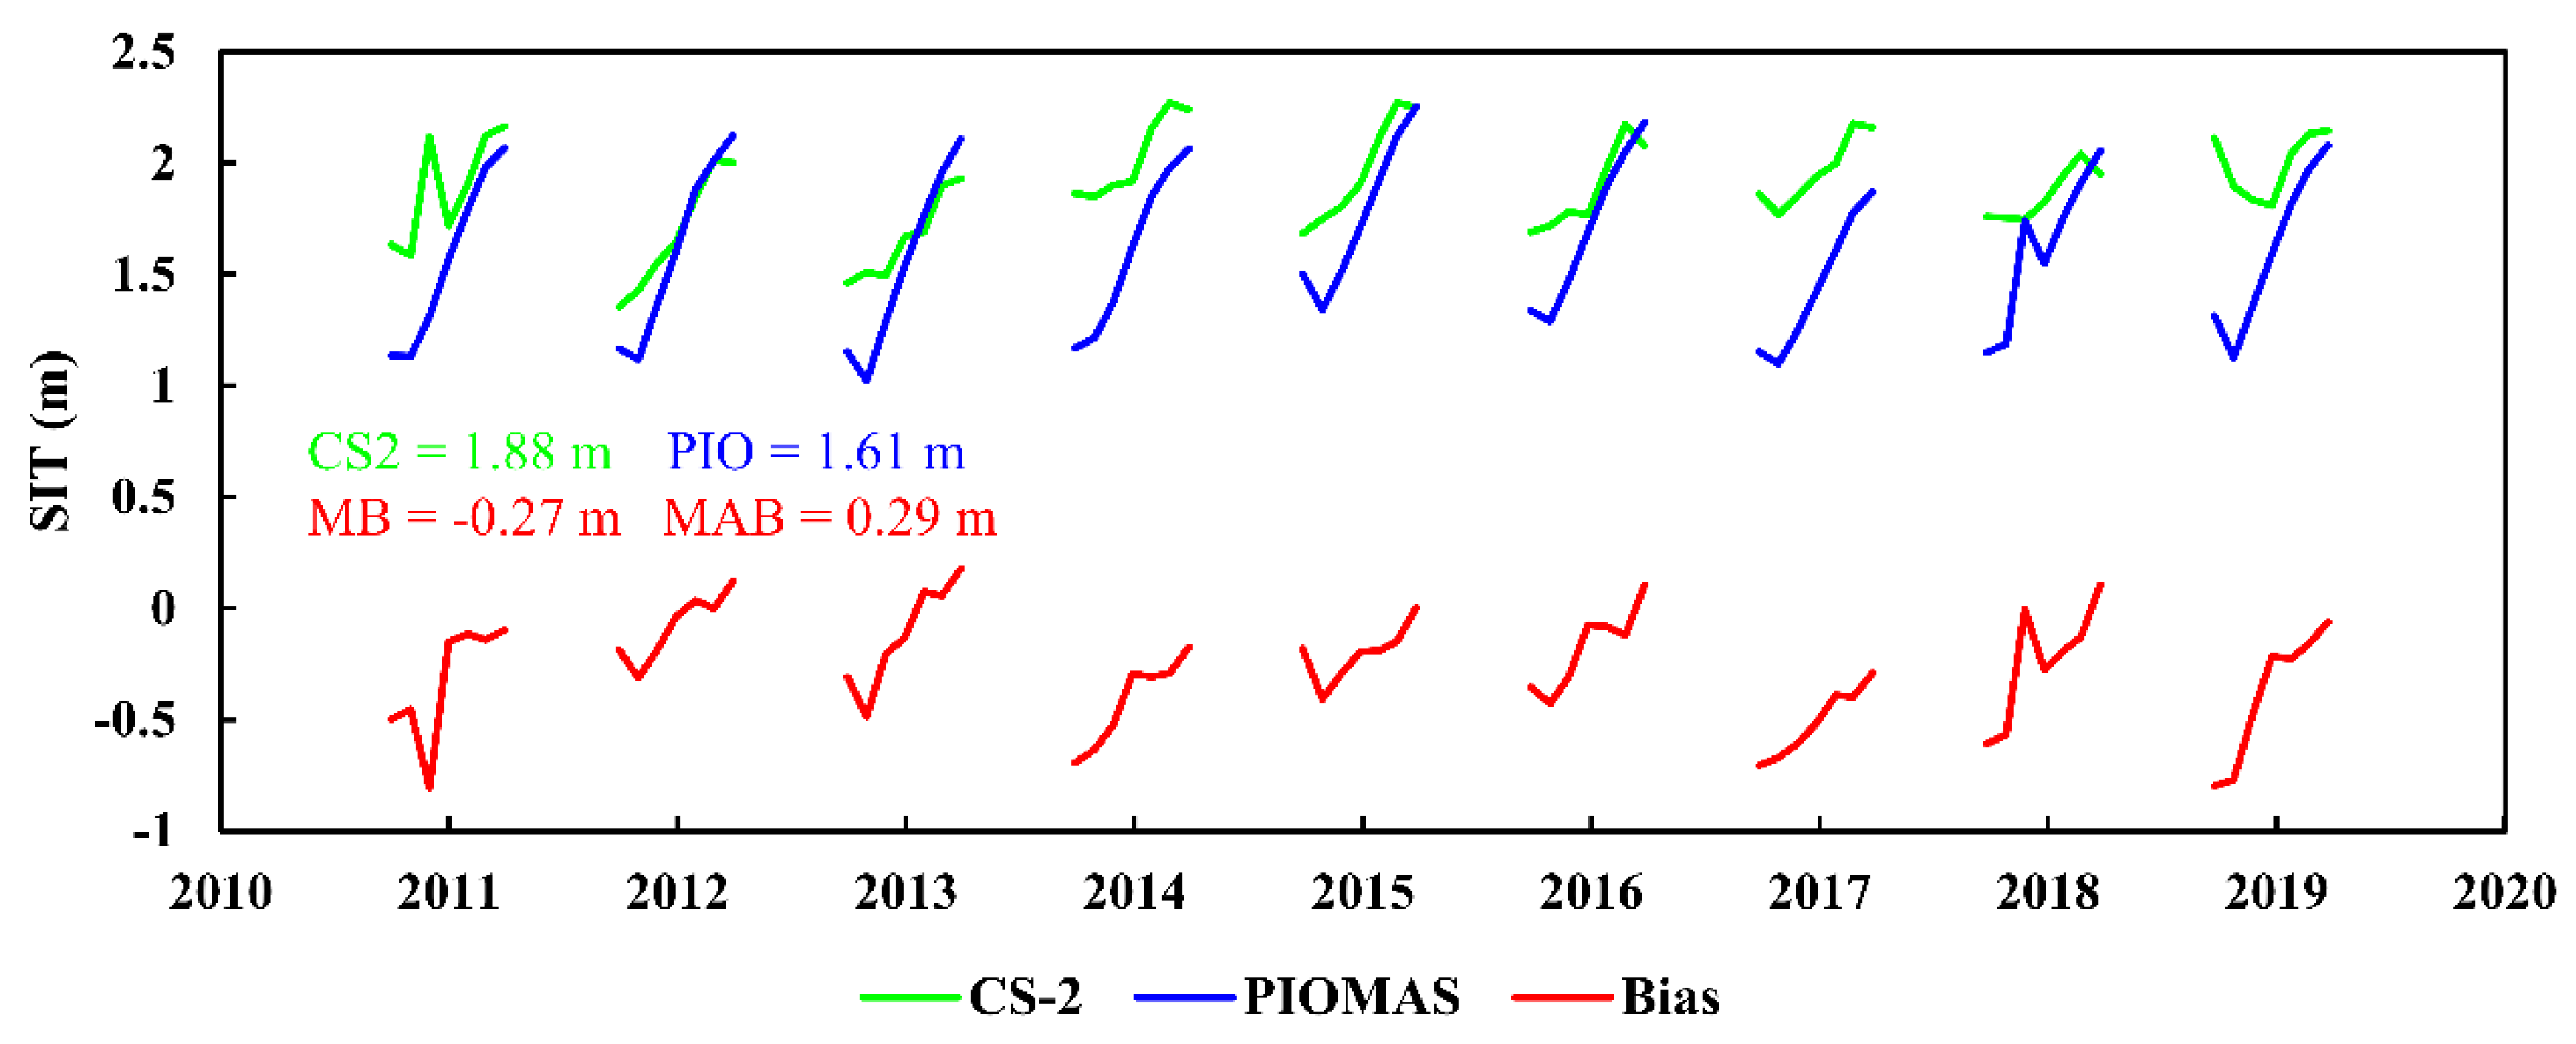
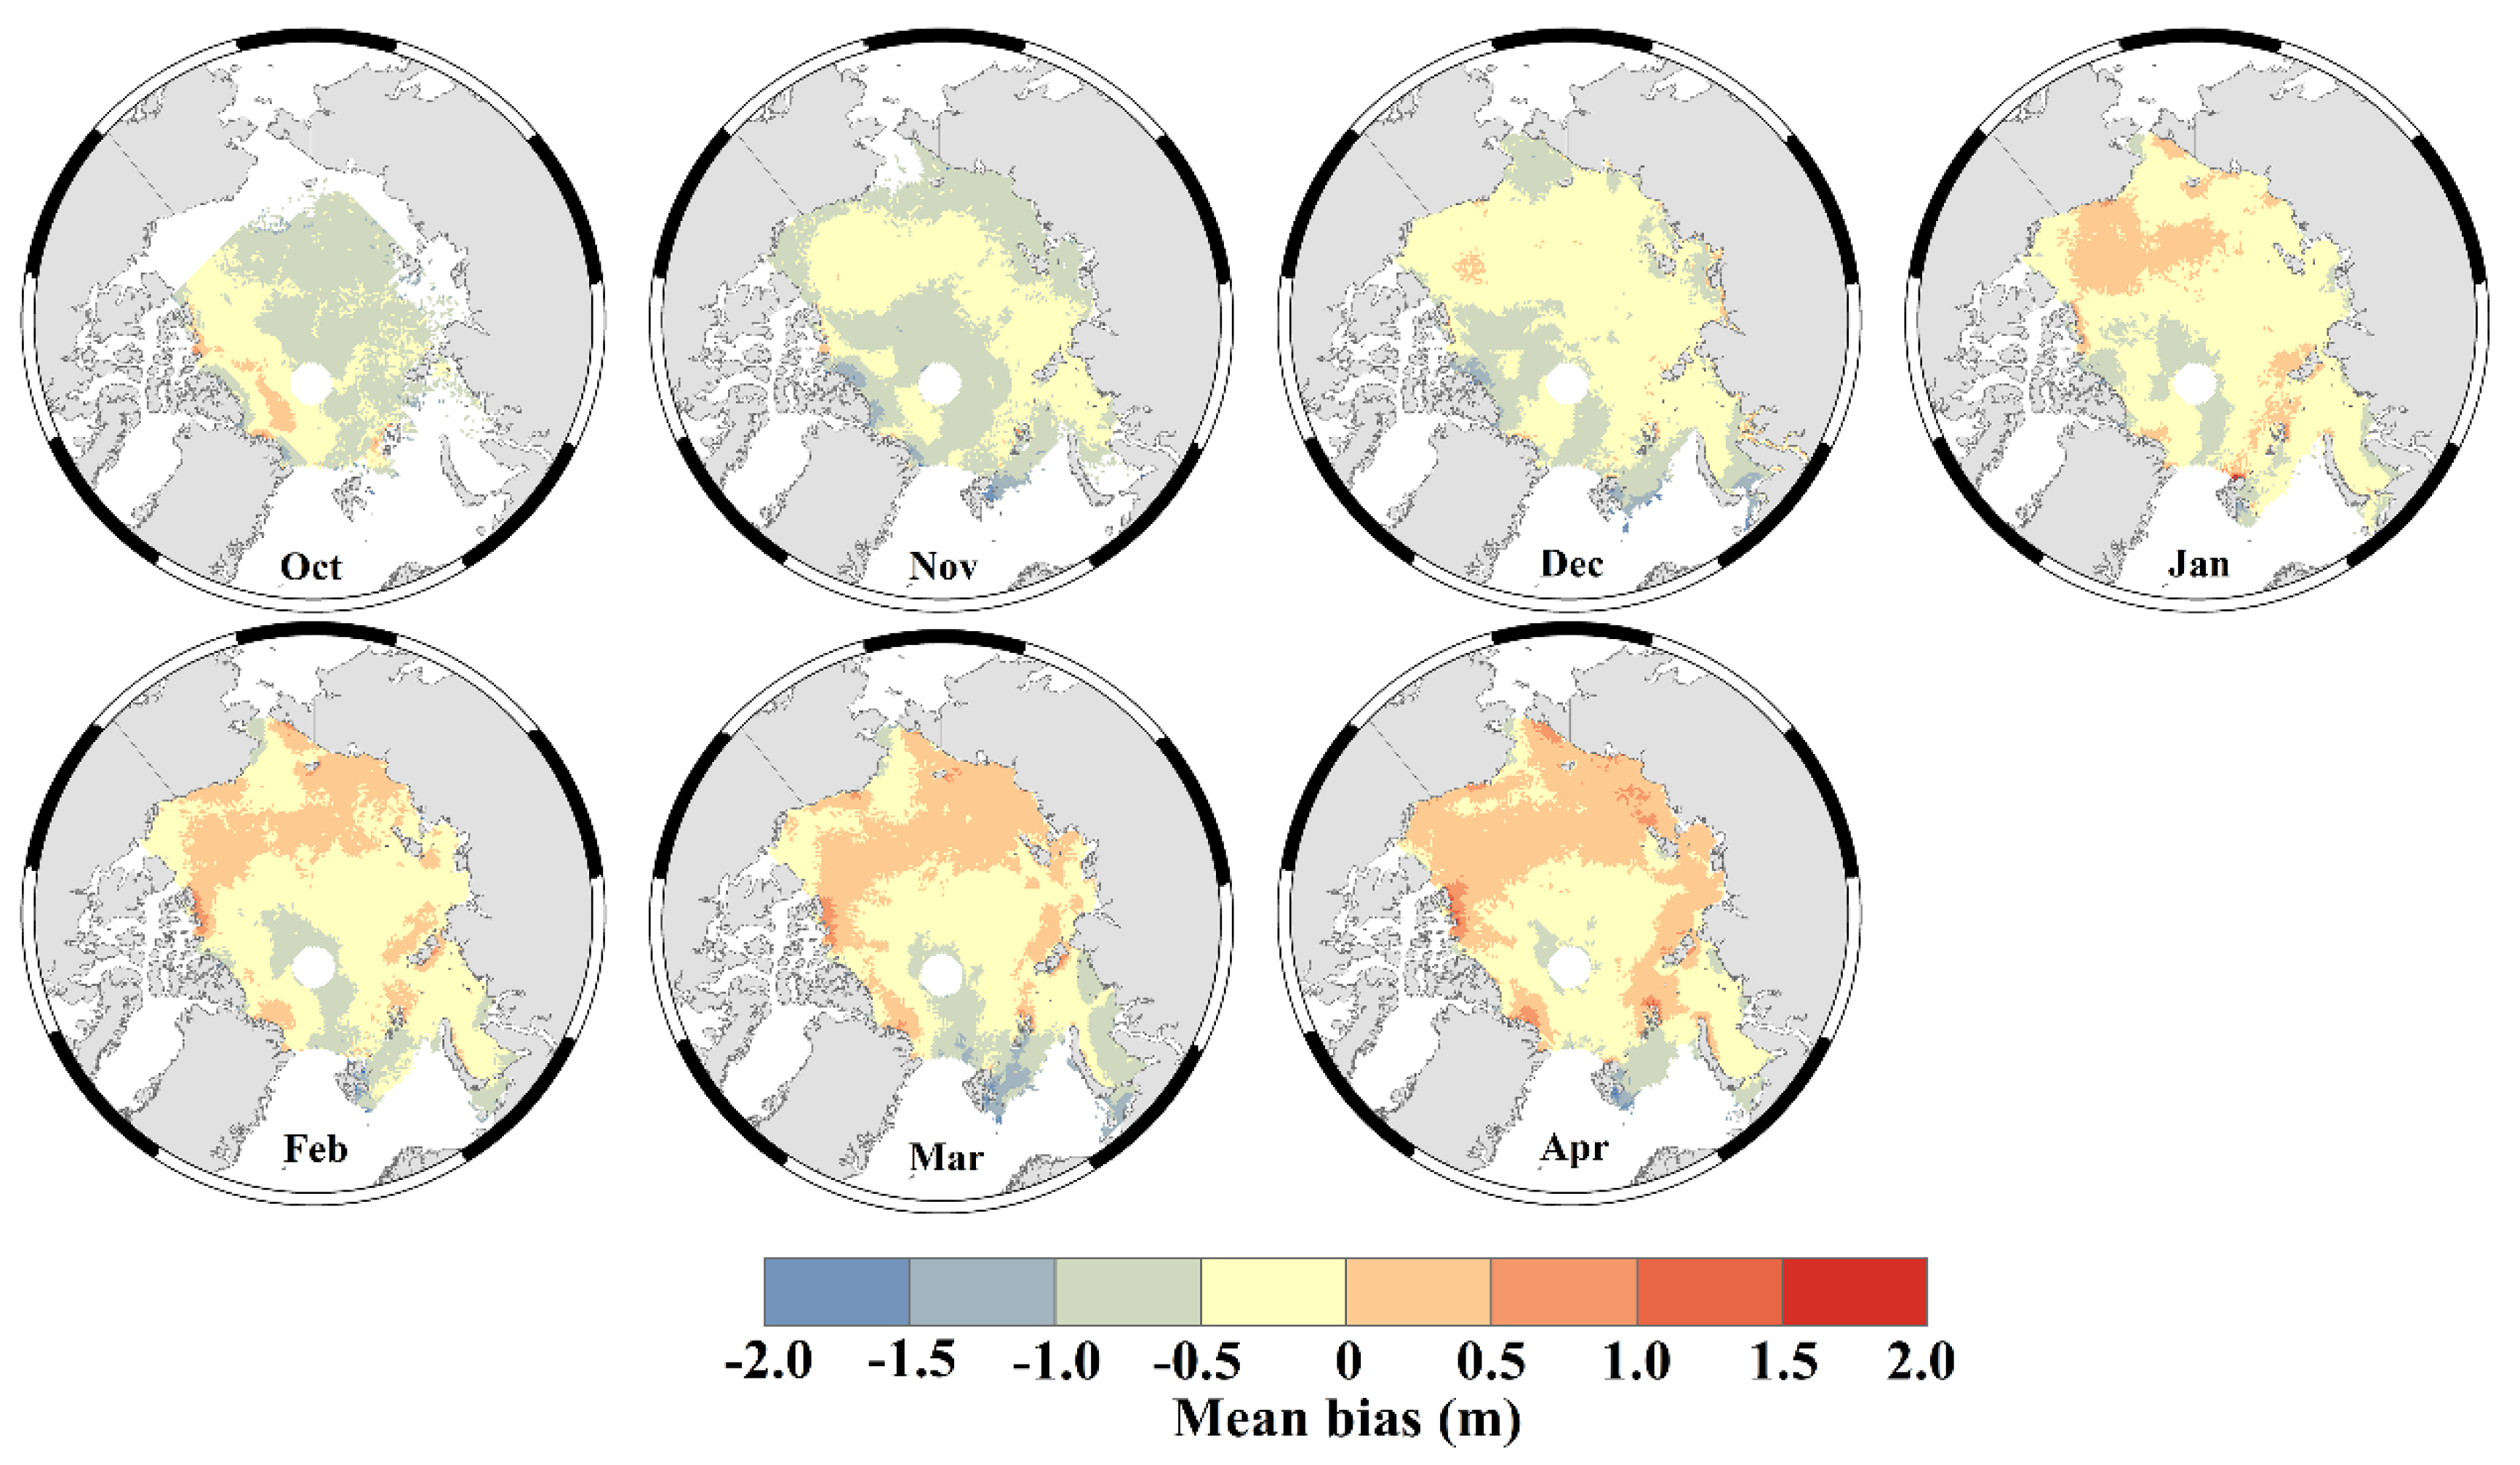
3.1. The Comparisons between PIOMAS and CS2

Compared with satellite and field SIT, the modeled data can date back to 1979 and provide a consistent and continuous SIT change analysis. The CS2 SIT was applied to estimate the modeled SIT due to the advantages of large spatial–temporal coverage and observation accuracy. Based on the CS2 measurements, there were three SIT products available from the European Space Agency (ESA), Alfred Wegener Institute (AWI) and NSIDC. Previous studies demonstrated that CS2 SIT from NSIDC agrees most with coincident IceBridge airborne lidar observations [43,44]. Considering the long time series and the better spatial distributions, we chose the CS2 SIT estimated from NSIDC to compare with PIOMAS SIT from October 2010 to April 2019.
In Figure 2, we show the monthly average SIT variability for PIOMAS and CS2, and the mean bias between them during the sea ice growth season (from October to next April) in 2010–2019. The PIOMAS SIT is lower than CS2 SIT. The mean bias gradually decreases during the sea ice growth season (Figure 2). The earlier studies depicted the differences of SIT distributions between PIOMAS and Submarine (1986–1994), ICESat (2004–2009) and CS2 (2011–2015); the differences in the average SIT between PIOMAS and other SIT products were less than 0.4 m; the standard deviations were similar for PIOMAS (0.70 m) and CS2 (0.71 m) [28]. Similar to the comparative results of [28], the mean bias and absolute bias corresponded to −0.27 ± 0.24 and 0.29 ± 0.22 m, respectively.
We calculated the spatial differences during the sea ice growth season in 2010–2019 (Figure 3). In Figure 3, the difference between PIOMAS and CS2 SIT is regional and seasonal. PIOMAS SIT is lower than CS2 SIT from October to December. In January–April, PIOMAS generally overestimates in thinner ice regions and underestimates in thicker ice regions. This comparative result is consistent with earlier studies [28,33,45]. Due to the lack of summer CS2 SIT, there are no comparative results for PIOMAS and CS2. Nevertheless, the summer PIOMAS SIT captures the major features of SIT [32] and sea ice volume change [28]. All SIT comparisons between PIOMAS and other SIT products show a rational agreement in time and space and indicate the availability of PIOMAS SIT data [28,33,45]. Therefore, we applied PIOMAS SIT for the following analysis.

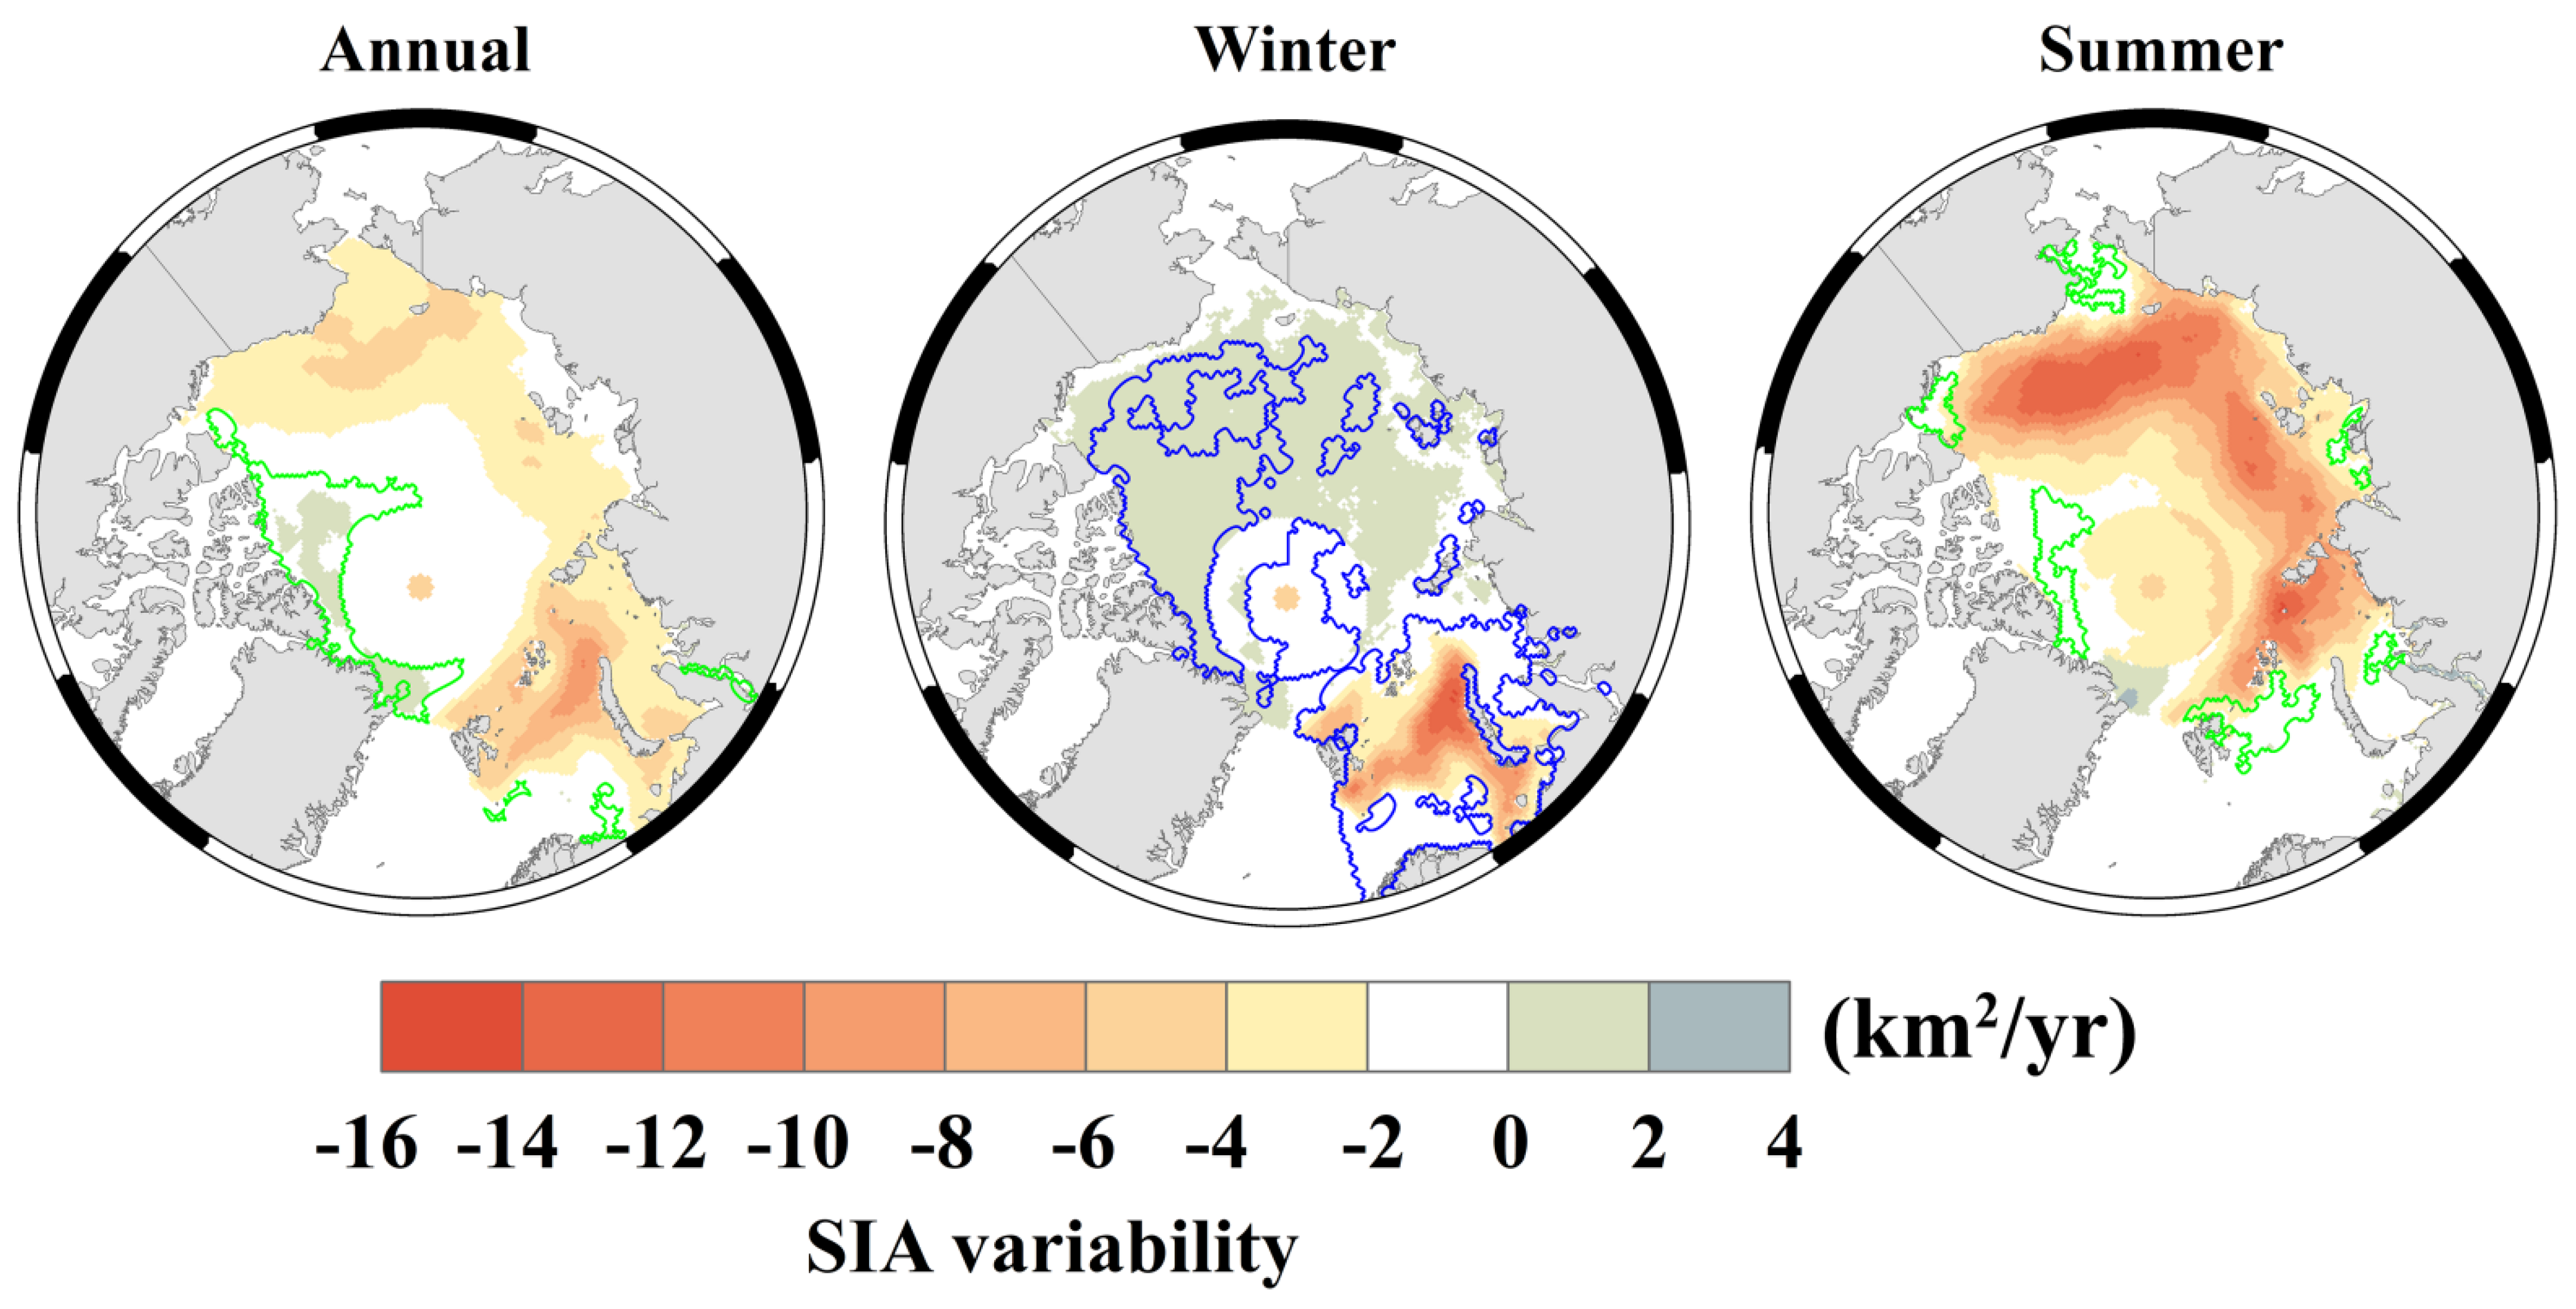
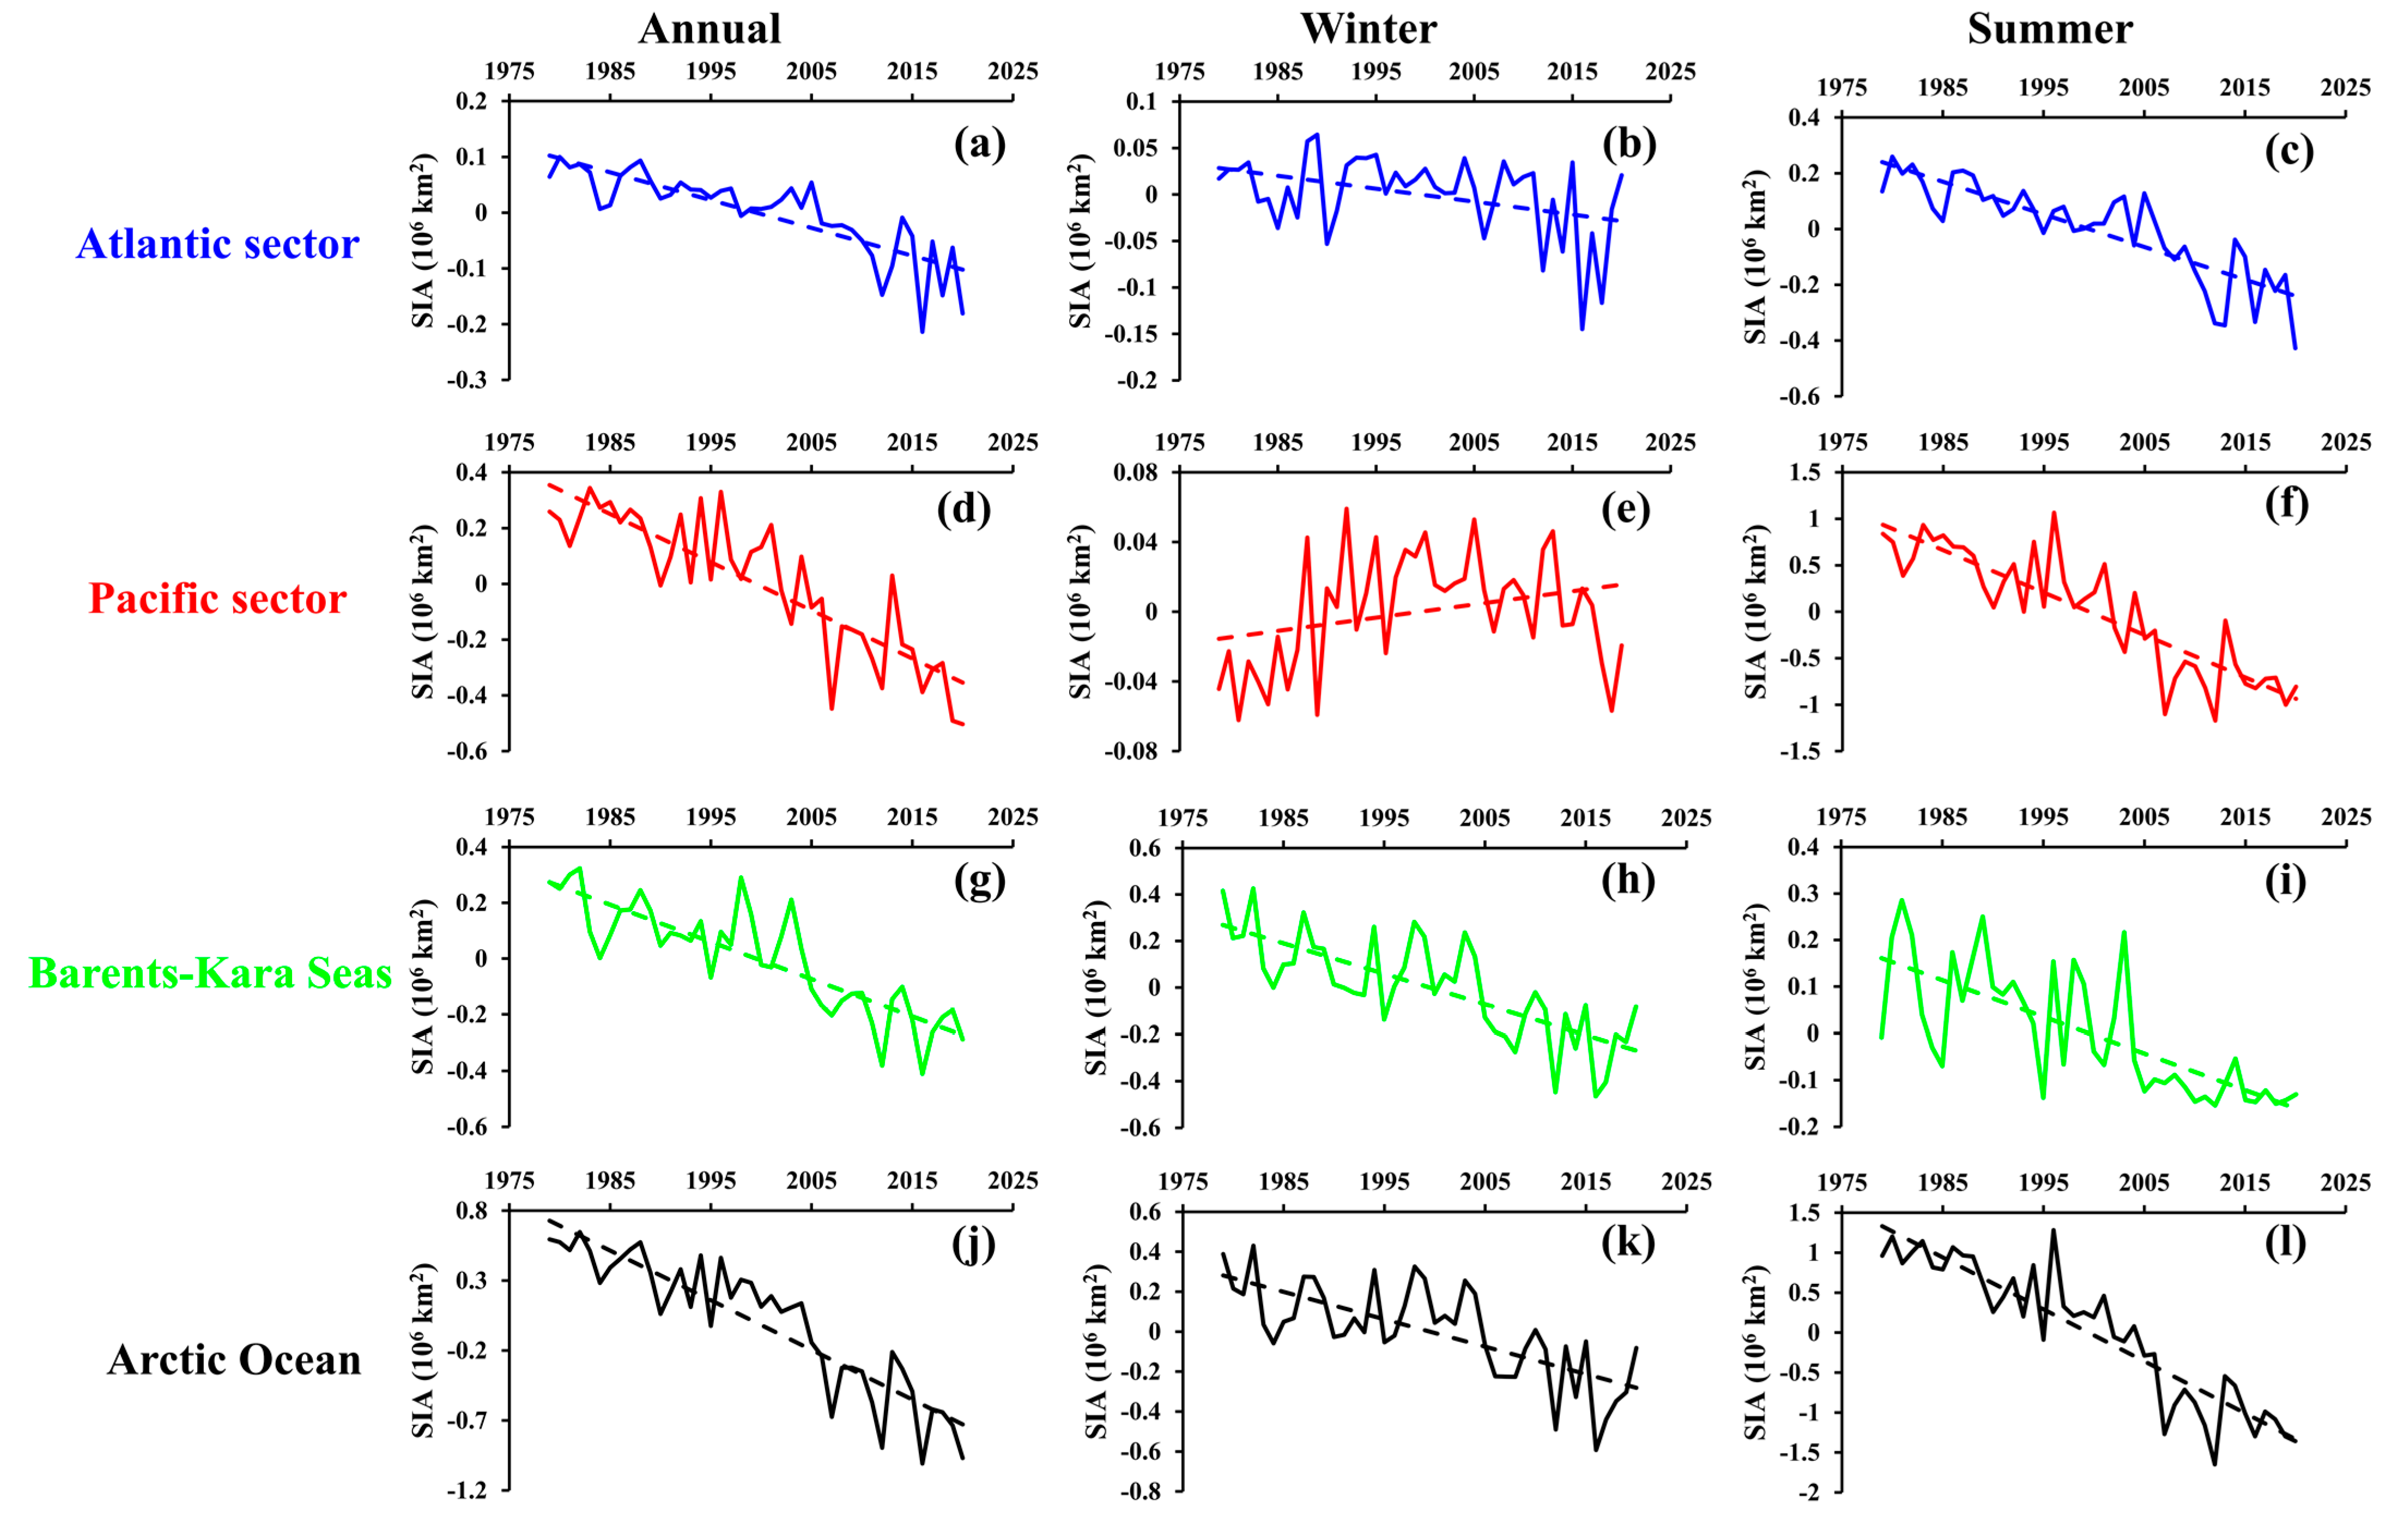
3.2. Seasonal and Regional Variability of Sea Ice Area

Temporal and spatial time series analysis were carried out for the 42-year period (1979–2020) to understand the long-term trends of SIA for the entire Arctic Ocean, Atlantic sector, Pacific sector and Barents–Kara Seas (Figure 1). The results showed an unprecedented decline in SIA for three sectors since 1979, except the Pacific sector in winter (Table 2). During the past forty-two years, there were three minimum SIA records observed for the years 2007, 2012 and 2016 in the Arctic Ocean, while the maximum SIA was recorded for the year 1982 (Figure 4j), which were consistent with the Pacific sector and Barents–Kara Seas. In the Atlantic sector, there was no minimum record for 2007. During 1979–2020, the annual declining rate of SIA was −3.55 × 10⁴ km2 yr−1 for the Arctic Ocean (Table 2). The decreasing trend of SIA in the Atlantic sector was the smallest while the Pacific sector was the largest, and about 3.5-times higher (−1.73 × 10⁴ km2 yr−1) compared with the Atlantic sector; the Barents–Kara Seas was −1.33 × 10⁴ km2 yr−1. Since 2005, the acceleration of SIA decline was evident, for example, the annual decline trends for the Arctic Ocean increased from about −0.19 × 10³ km2 yr−1 in 1979–2004 to −0.37 × 10³ km2 yr−1 throughout 2005–2020.
Seasonal SIA analyses in the past 42 years showed sea ice minimum records of the Arctic Ocean in winter for 2016 and in summer for 2012. The SIA in summer (−6.49 × 10⁴ km2 yr−1) for the Arctic Ocean declined seriously and was six-times higher than that in winter (Table 2). In the Atlantic sector, there was an accelerated decline in SIA during the summer (−1.17 × 10⁴ km2 yr−1), about seven-times higher than that in winter. However, in the Pacific sector, the variability of SIA in winter was not significant while the declining rate of SIA in summer was about four times that of summer SIA in the Atlantic sector. In contrast, different from the Atlantic and Pacific sectors, the declining rate of SIA in winter (−1.31 × 10⁴ km2 yr−1) for the Barents–the Kara Seas was greater than that in summer (−0.79 × 10⁴ km2 yr−1) and the seasonal discrepancy for variability rates was rather small (Table 2). The variability trends of summer sea ice in the Arctic Ocean was similar to that in the Pacific sector, while the annual and winter variability trends in the Arctic Ocean were similar to those in the Barents–Kara Seas (Figure 4); it indicates that the observed decrease in SIA in the Arctic Ocean mainly originates from the two subregions (the Barents–Kara Seas and Pacific sector).
The serious decrease in SIA mainly occurred in the low latitude regions in Figure 5. In the Pacific sector and Barents–Kara Seas, the interannual change of SIA was rather large (Figure 5). Due to the existence of the thickest Arctic sea ice in CAA, the annual variability of SIA was insignificant. There was an obvious seasonal discrepancy in the regional change of SIA (Figure 5). The Barents–Kara Seas had a steady sea ice loss for winter and summer, whereas the sea ice variability in the Atlantic and Pacific sectors was modest in winter (Figure 5). This seasonal asymmetry in sea ice loss for different regions could be related to the strong ice albedo feedback in summer [18] and upper-ocean warming in autumn, due to sea ice cover decrease and wintertime atmospheric warming with sea ice thinning [46].

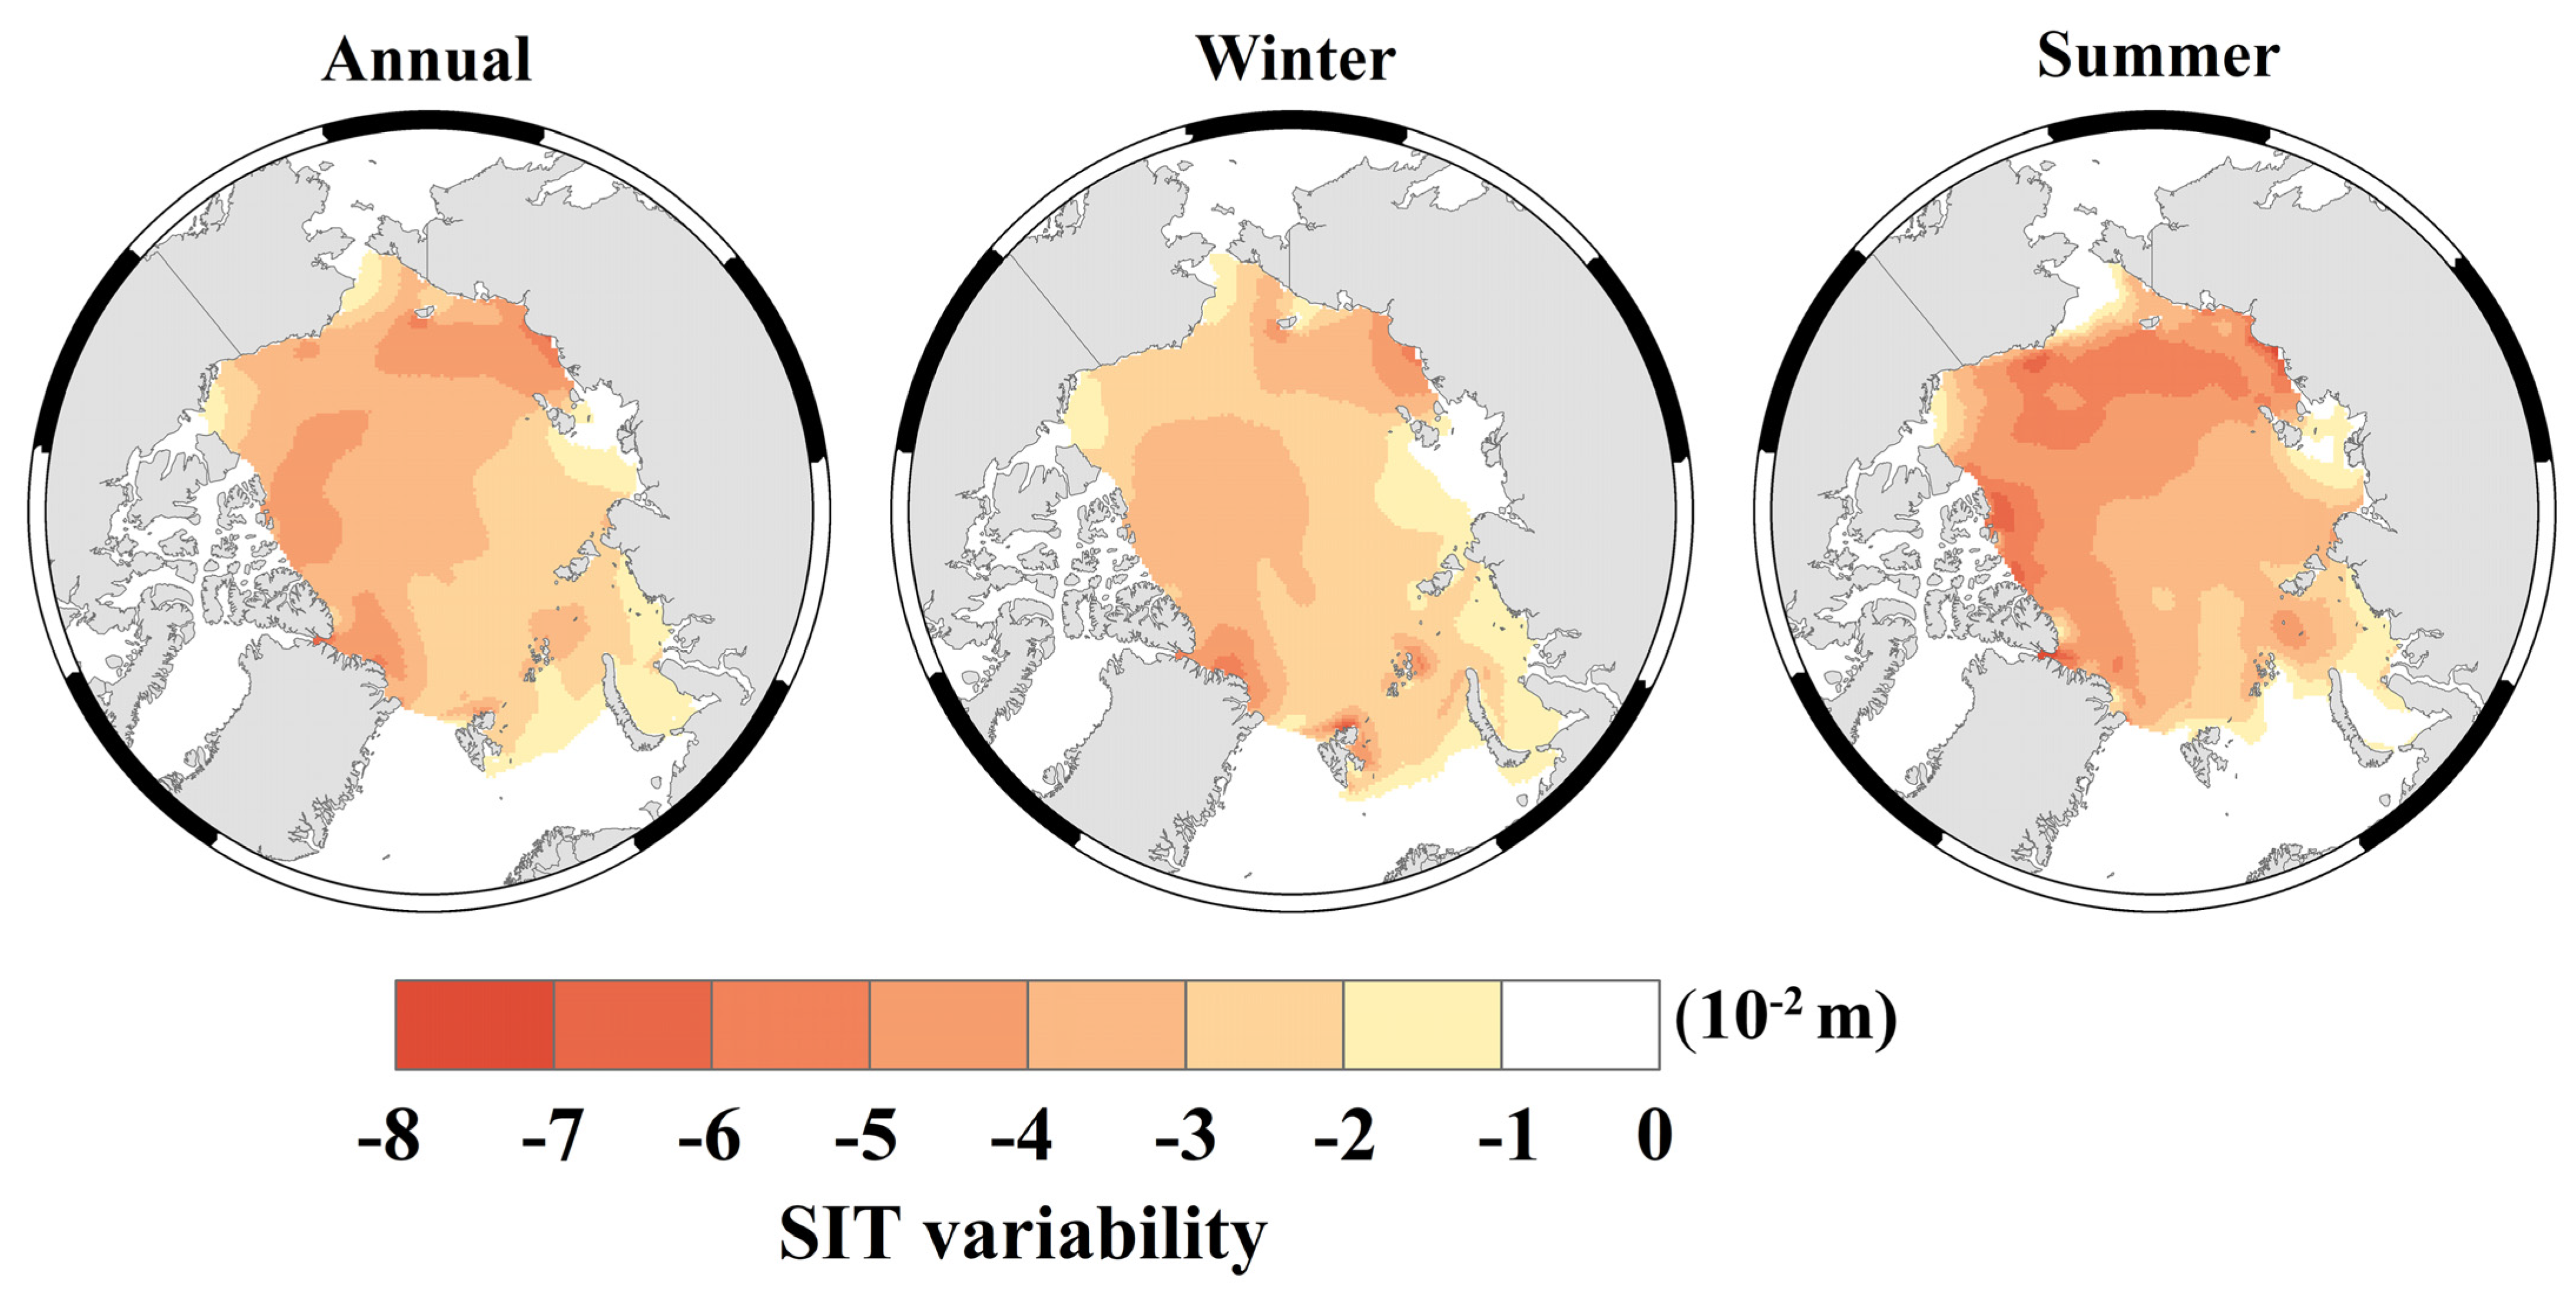
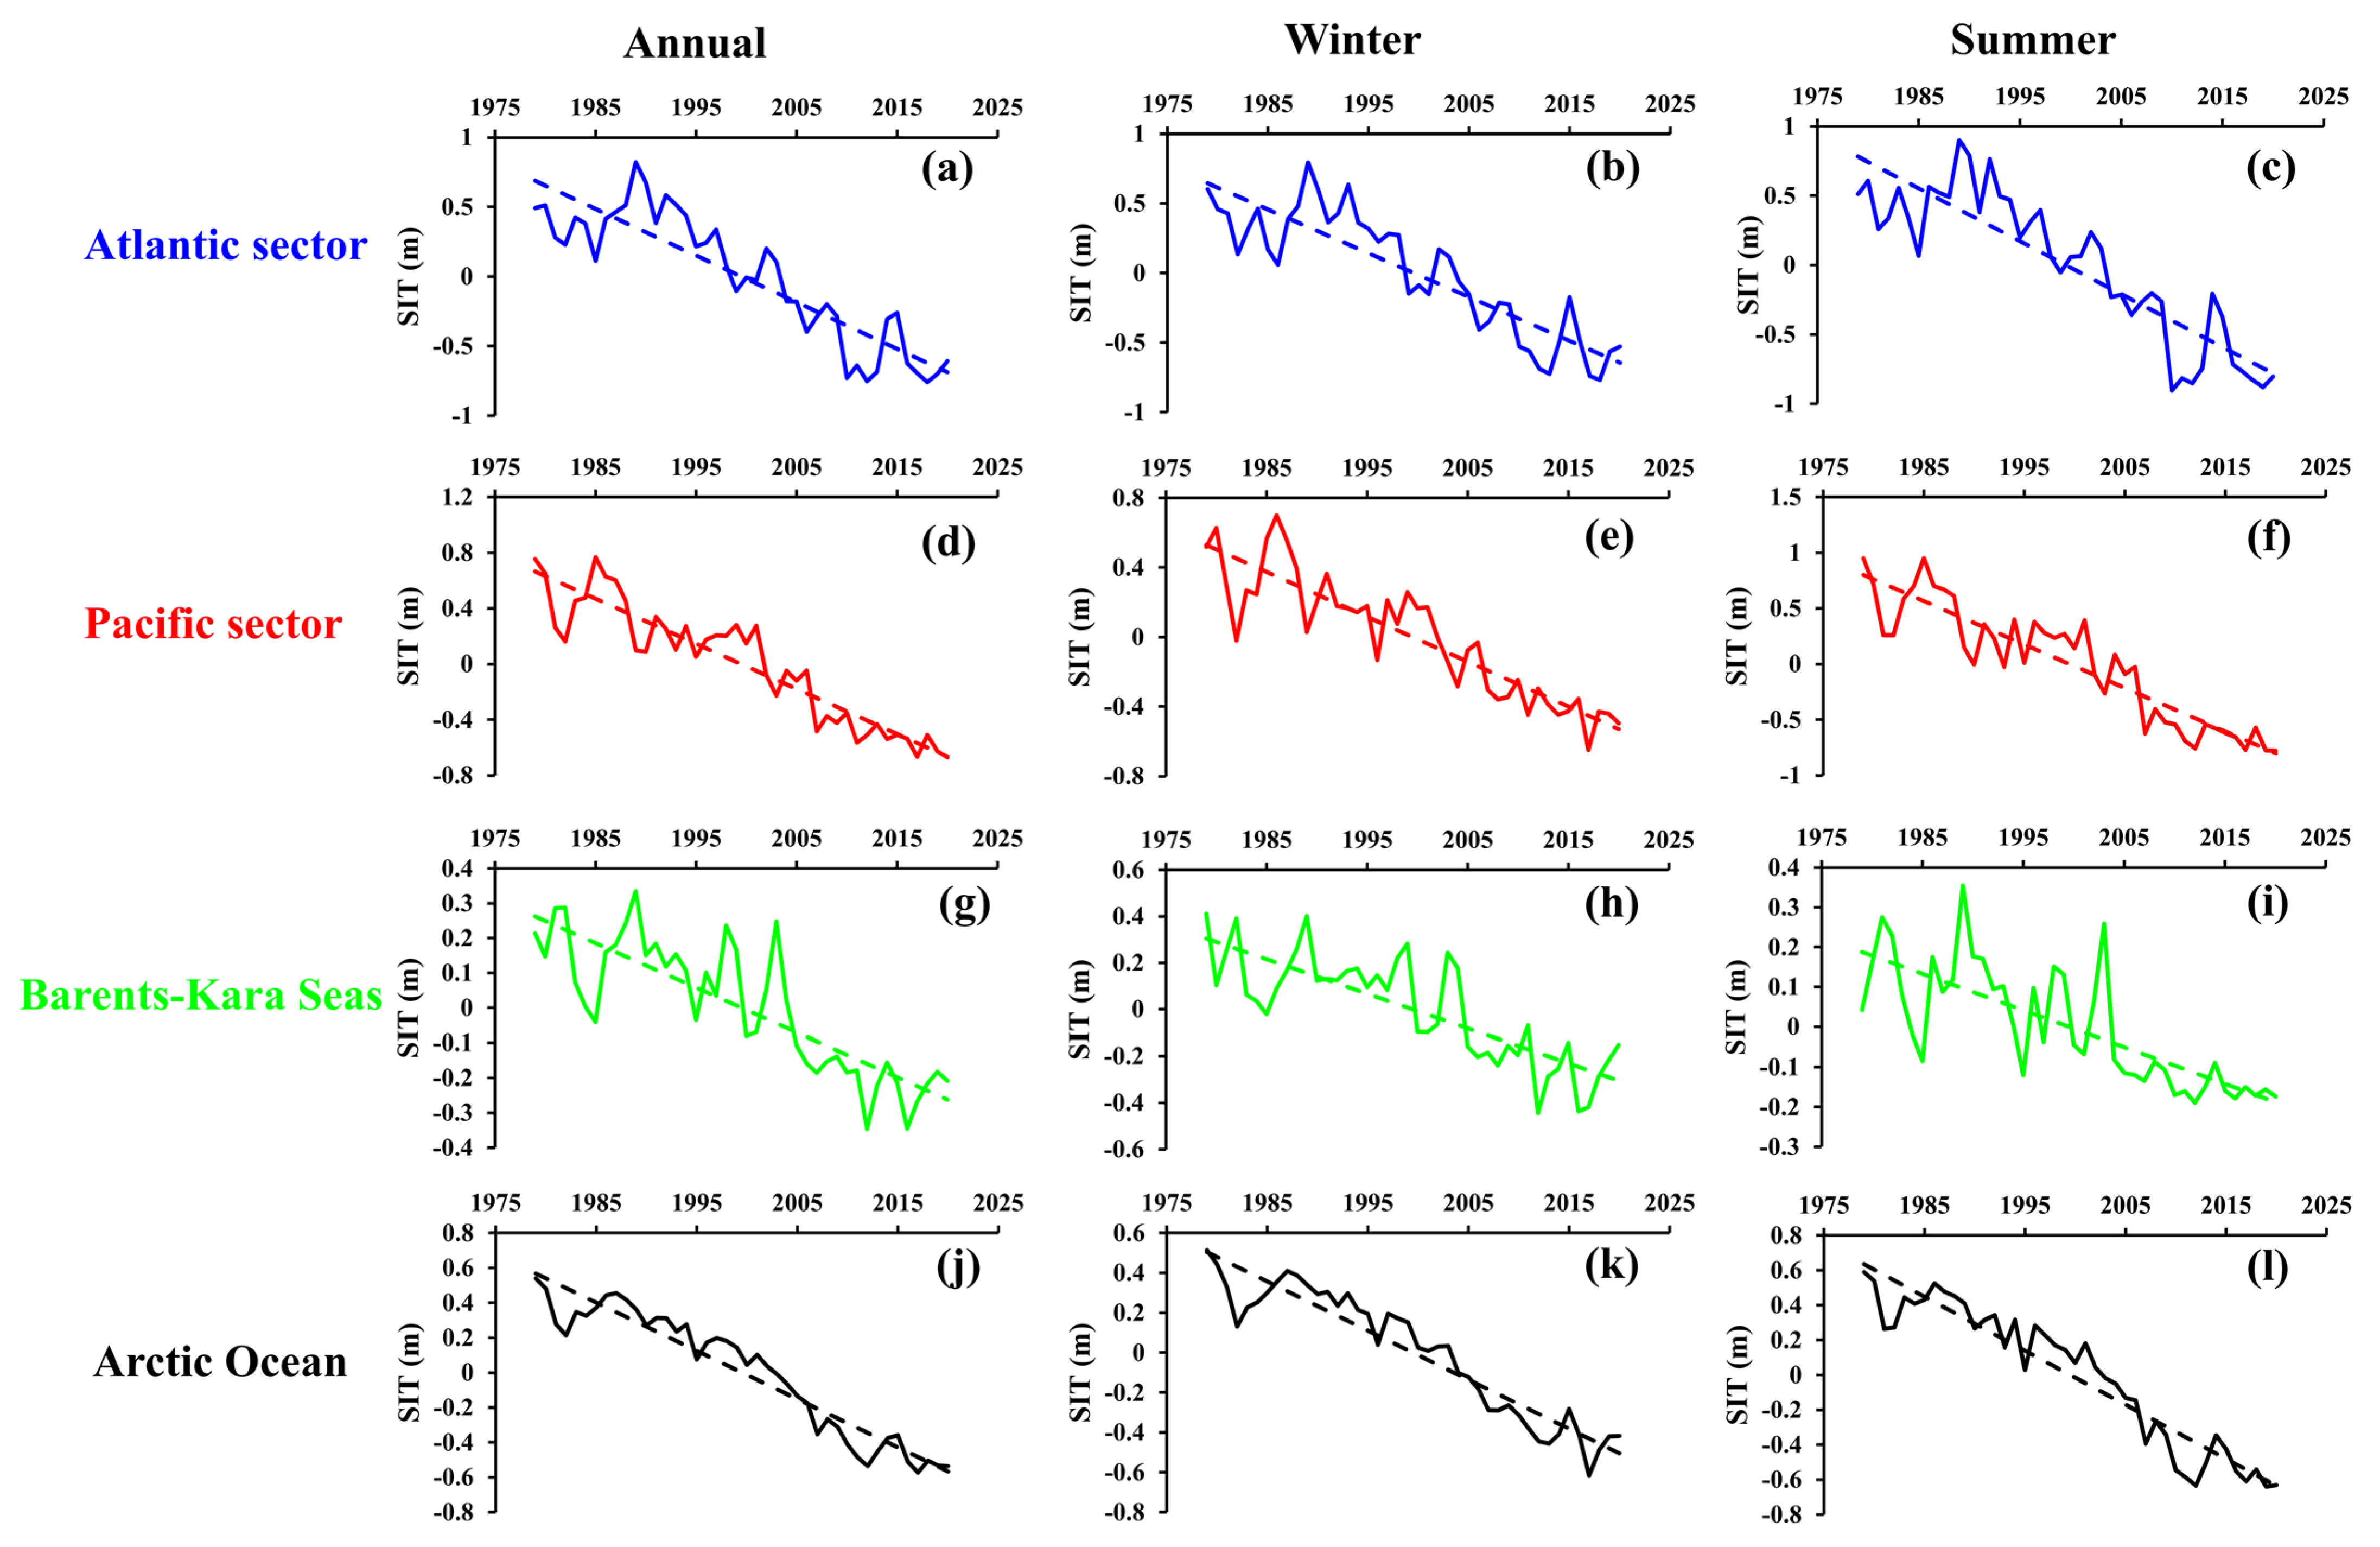
3.3. Seasonal and Regional Variability of Sea Ice Thickness

To estimate seasonal and regional sea ice variability in the third dimension, we examined the SIT trends for the entire Arctic Ocean and three subregions. The mean SIT in the Arctic Ocean (Figure 6j) declined by 32% in 1979–2020. During the past several decades, the SIT gradually declined and the minimum SIT could be observed for the year 2012 in the Arctic Ocean (Figure 6j), which was consistent with the Atlantic sector and Barents–Kara Seas. In the Pacific sector, the annual minimum occurred in 2017. During 1979–2020, the annual declining rate of SIT was −2.77× 10⁻² m yr−1 for the Arctic Ocean (Table 3). The Atlantic sector was the largest and the variability rate was about 2.6-times higher than that of the Barents–Kara Seas (Table 3).
Seasonal SIT analyses during 1979–2020 showed that the SIT minimums for the Arctic Ocean appeared in winter for 2017 and in summer for 2012 (Figure 6); the variability of SIT in summer was higher than that in winter (Table 3). In the Pacific sector, there was an accelerated decline in SIT during summer (−3.90 × 10⁻² m yr−1), which was larger than that for the Atlantic sector. However, in winter, the variability rate of SIT for the Atlantic sector was larger than that in the Pacific sector. For the Atlantic and Pacific sectors, the variability of SIT in summer was larger than that in winter. Consistent with the variability of SIA, the declining rate of SIT in the winter periods for the Barents–Kara Seas was higher than that in the summer periods.
Sea ice was thinning in the entire Arctic Ocean, which was observed in the annual, winter and summer trends per pixel (Figure 7). Generally, there was the largest negative SIT trend in the north of the CAA for winter and summer (Figure 7). Thus, the annual and seasonal variability of SIT in the Atlantic sector was rather large (Table 3). In the Pacific sector, the high SIT declining region corresponded to the high variability of SIA (Figure 5 and Figure 7); the faster SIT thinning was linked to the seasonality of ocean heat transport through the Bering Strait [21]. In the Barents–Kara Seas, the declining of SIT is related to the warm Atlantic water flows. With the sea ice thinning, the Arctic sea ice experienced the transition from multiyear ice (MYI) to first-year ice. The continued MYI retreat further results in the decline in SIA.

4. Discussion

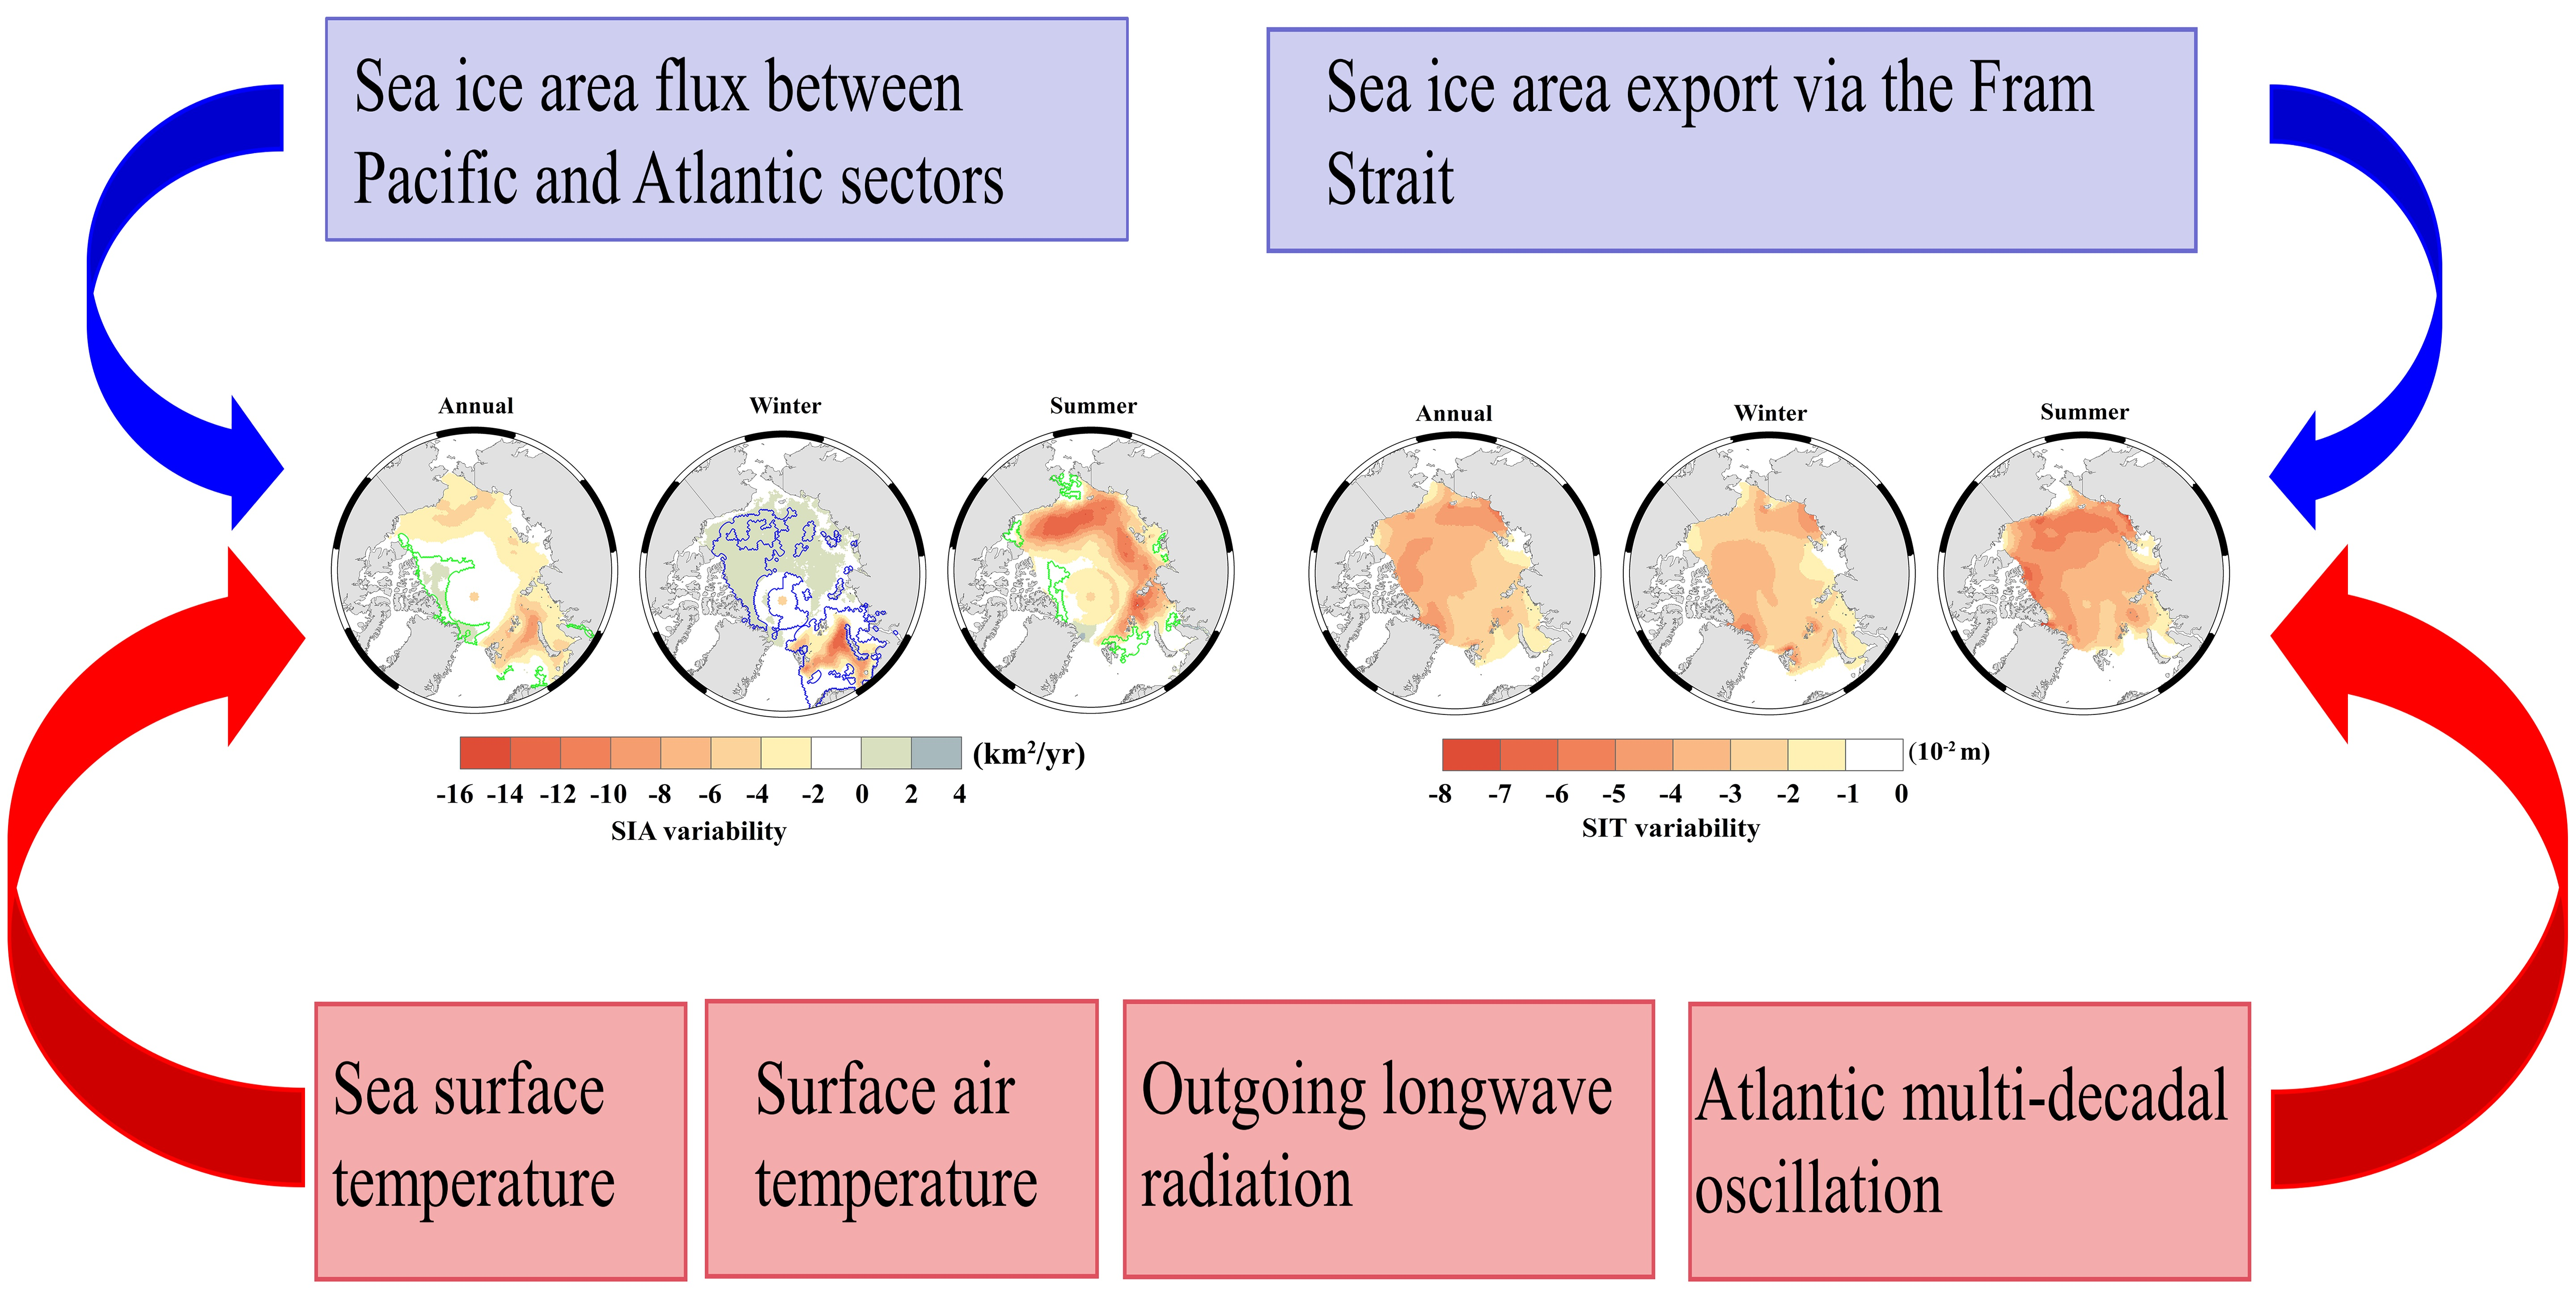
4.1. Role of Sea Ice Export in Sea Ice Loss

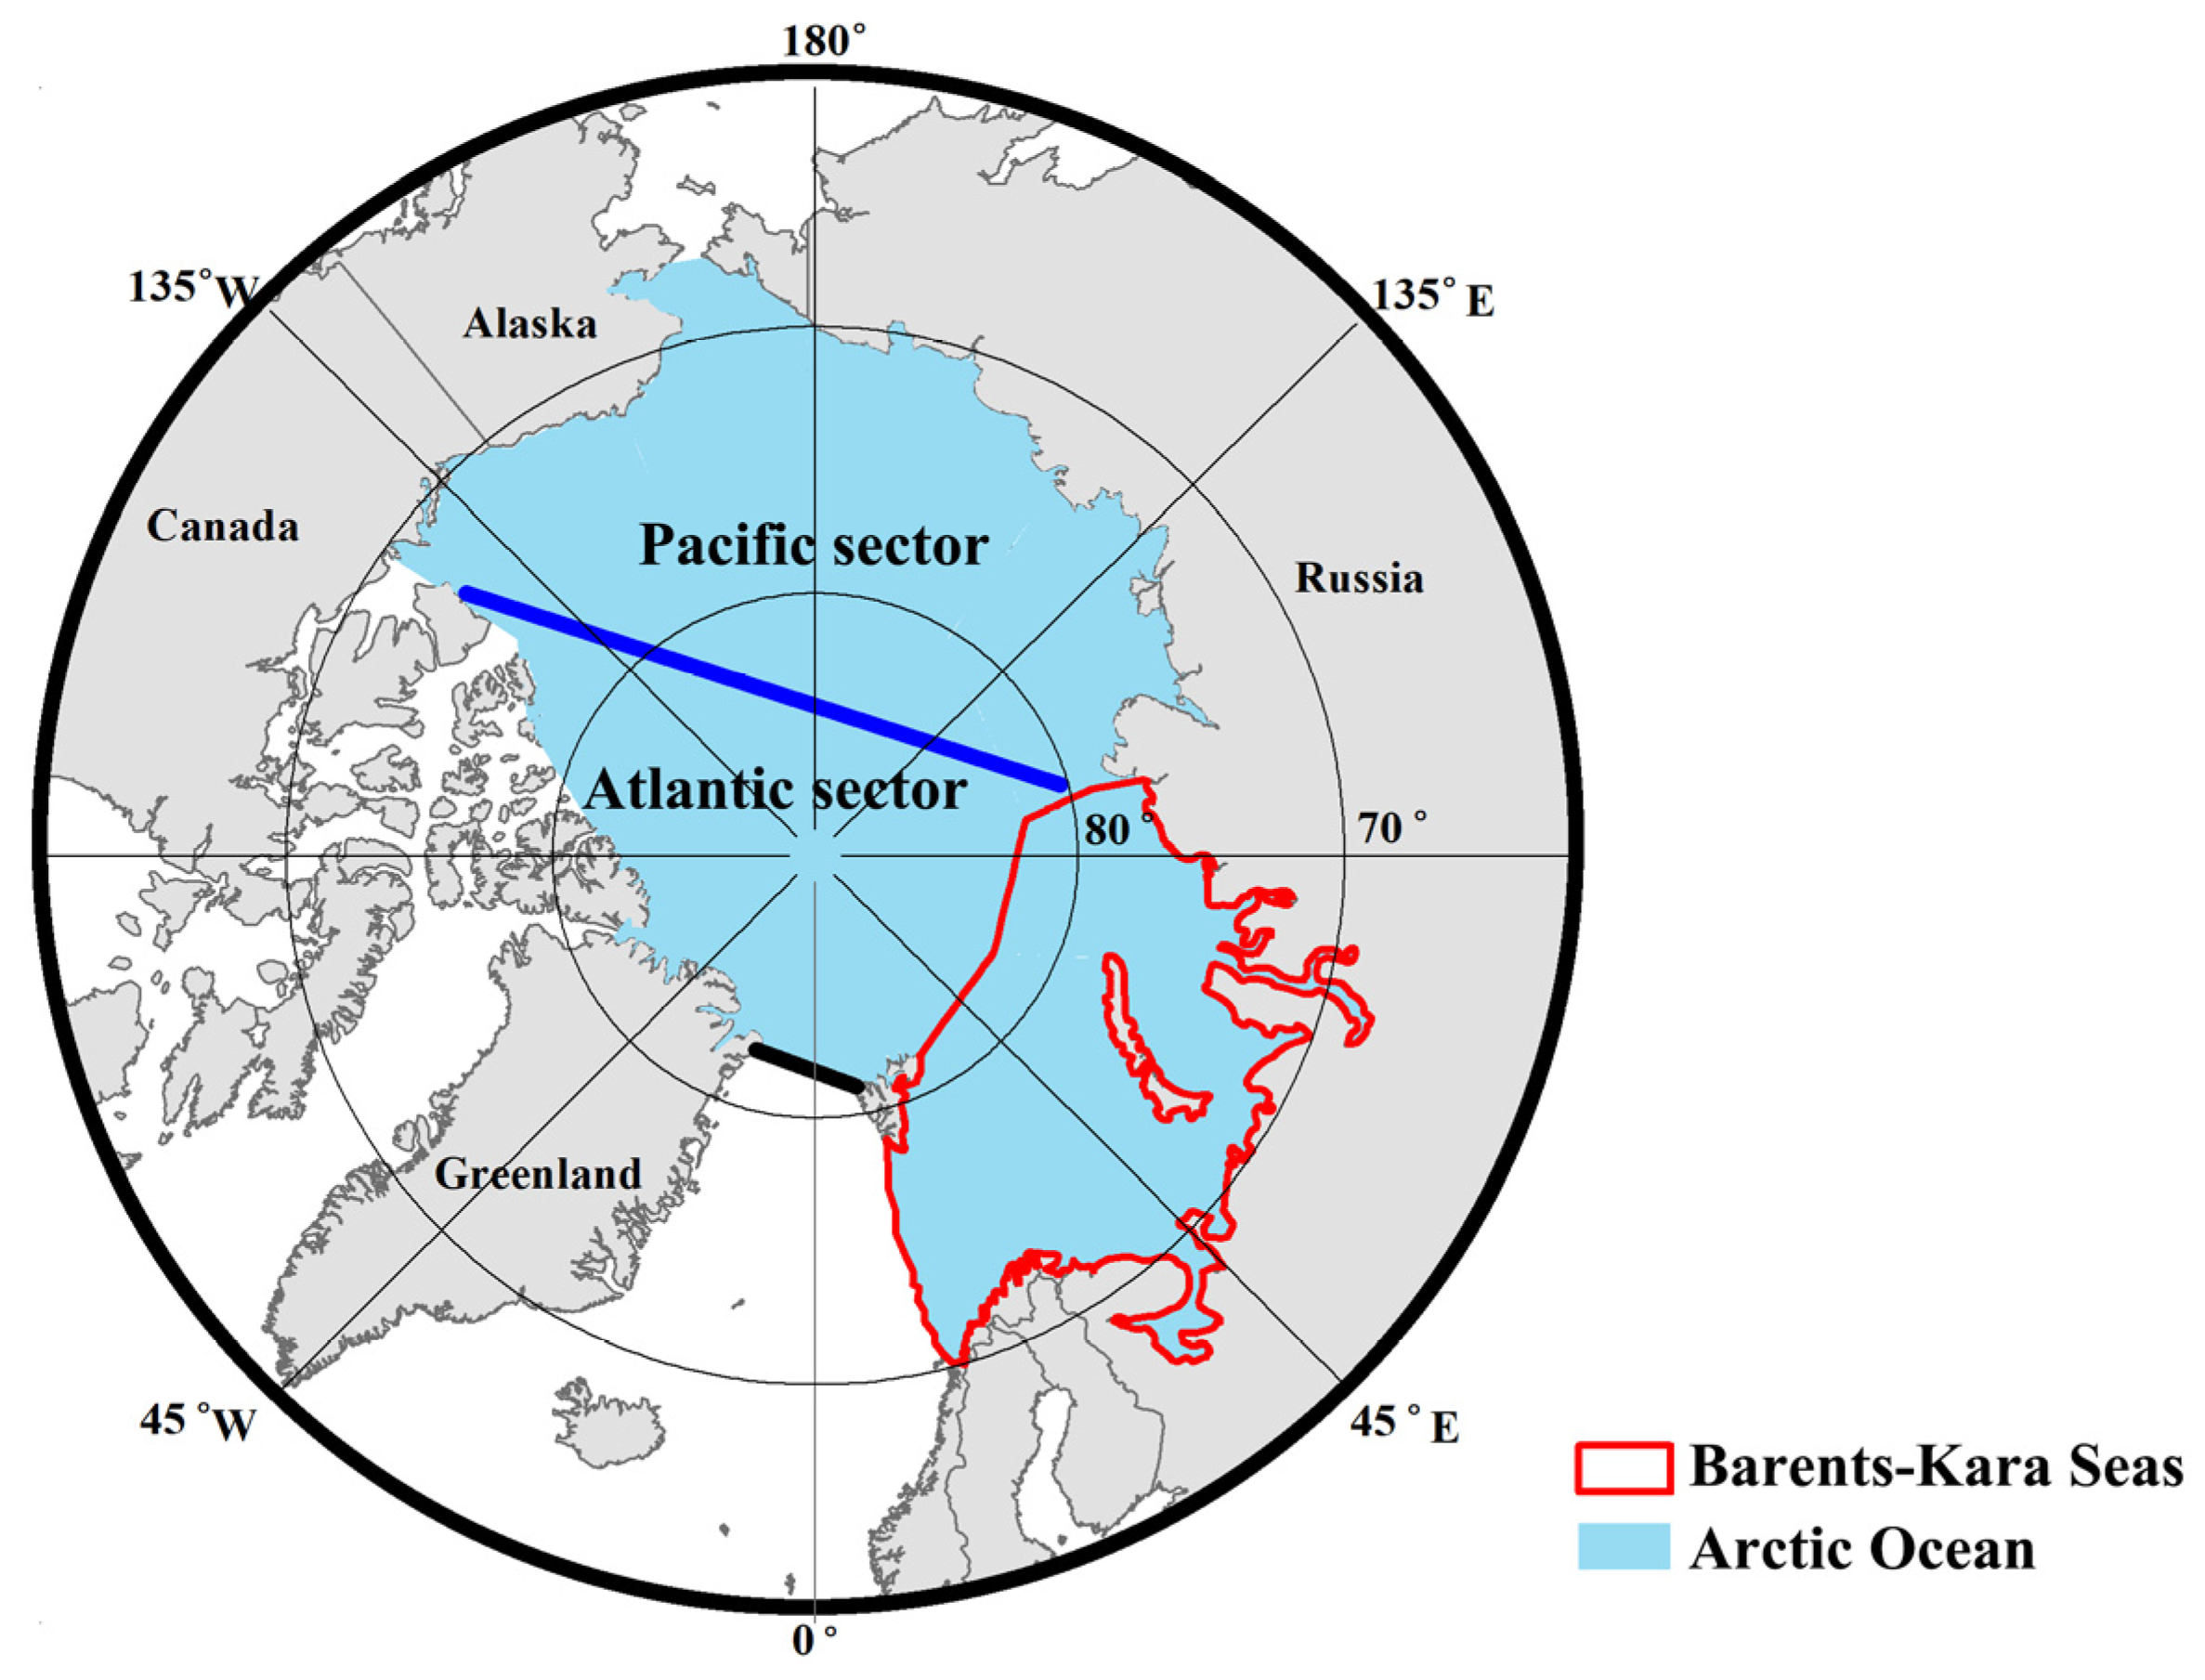
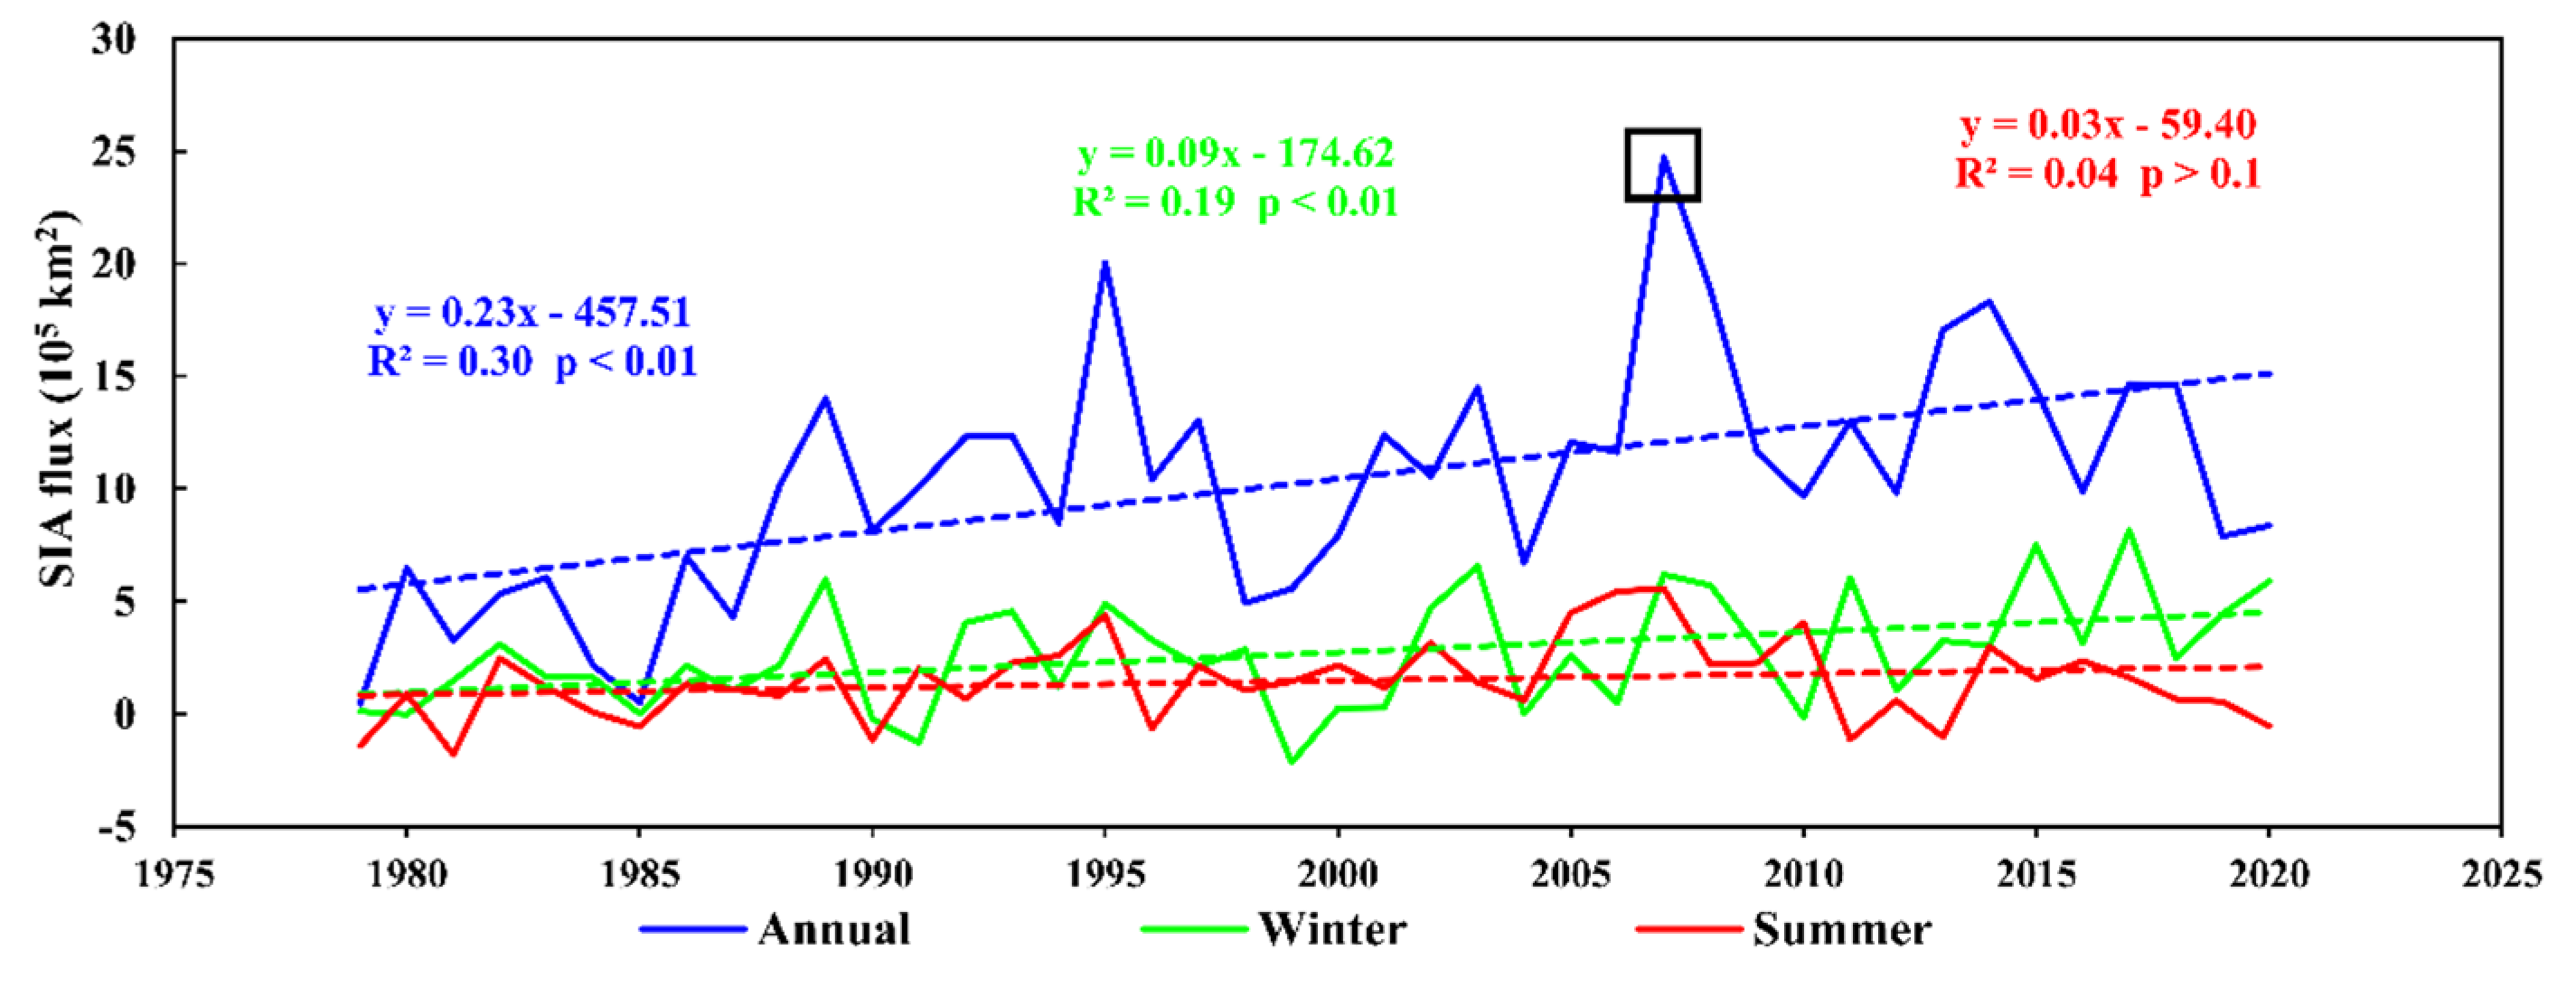
4.1.1. Impact of Sea Ice Area Flux between the Atlantic and Pacific Sectors on Sea Ice Loss

To examine the role of sea ice advection in the retreat of sea ice cover in the Atlantic and Pacific sectors, we calculated the SIA flux between them during the past 42 years (Figure 8). The positive SIA flux indicated the sea ice flow from the Pacific sector into the Atlantic sector. The annual SIA flux reached the maximum in 2007 and the minimum in 1985. There was a significant positive trend for the annual SIA flux at a rate of 0.23 × 10⁵ km2 yr−1 from 1979 to 2020. Seasonally, SIA flux in winter exhibited a significantly positive trend of 9.0 × 10³ km2 yr−1 at a confidence level of 99%, while the summer SIA flux increased at a rate of 3.0 × 10³ km2 yr−1, at a confidence level of 90%. The summer SIA flux (June–September) between the Atlantic sector and Pacific sector during 2003–2007 was compared with the results estimated by [19]. There was a large bias in the magnitude due to the different sources for the sea ice drift dataset. However, the temporal behavior between our results and [19] is in good agreement (Figure 9).
The sea ice flux across the gate (Figure 1) influenced the sea ice melt in the Atlantic and Pacific sectors. The decrease/increase in SIA flux increased/decreased the actual SIA melt in the Pacific sector. During 1979–2020, the mean SIA flux in summer was 1.44 × 10⁵ km2 while the mean decline in SIA in summer (the difference of SIA between June and September) in the Pacific sector was 1.22 × 10⁶ km2; the SIA flux accounted for 11% of the SIA decrease in summer for the Pacific sector. Although the mean SIA flux in summer was only a fraction of the SIA retreat, the magnitude of the outflows during the summers of 2005–2007 was quite large, i.e., nearly 31%, 31% and 27%, respectively. As mentioned above, there was a sharp decline in annual SIA in 2005–2007 in the Arctic Ocean, including the Pacific sector and Barents–Kara Seas, whereas the change of SIA in the Atlantic sector was modest in 2005–2007. The SIA loss of the Atlantic sector in 2007 may have been compensated by the sea ice inflow from the Pacific sector.

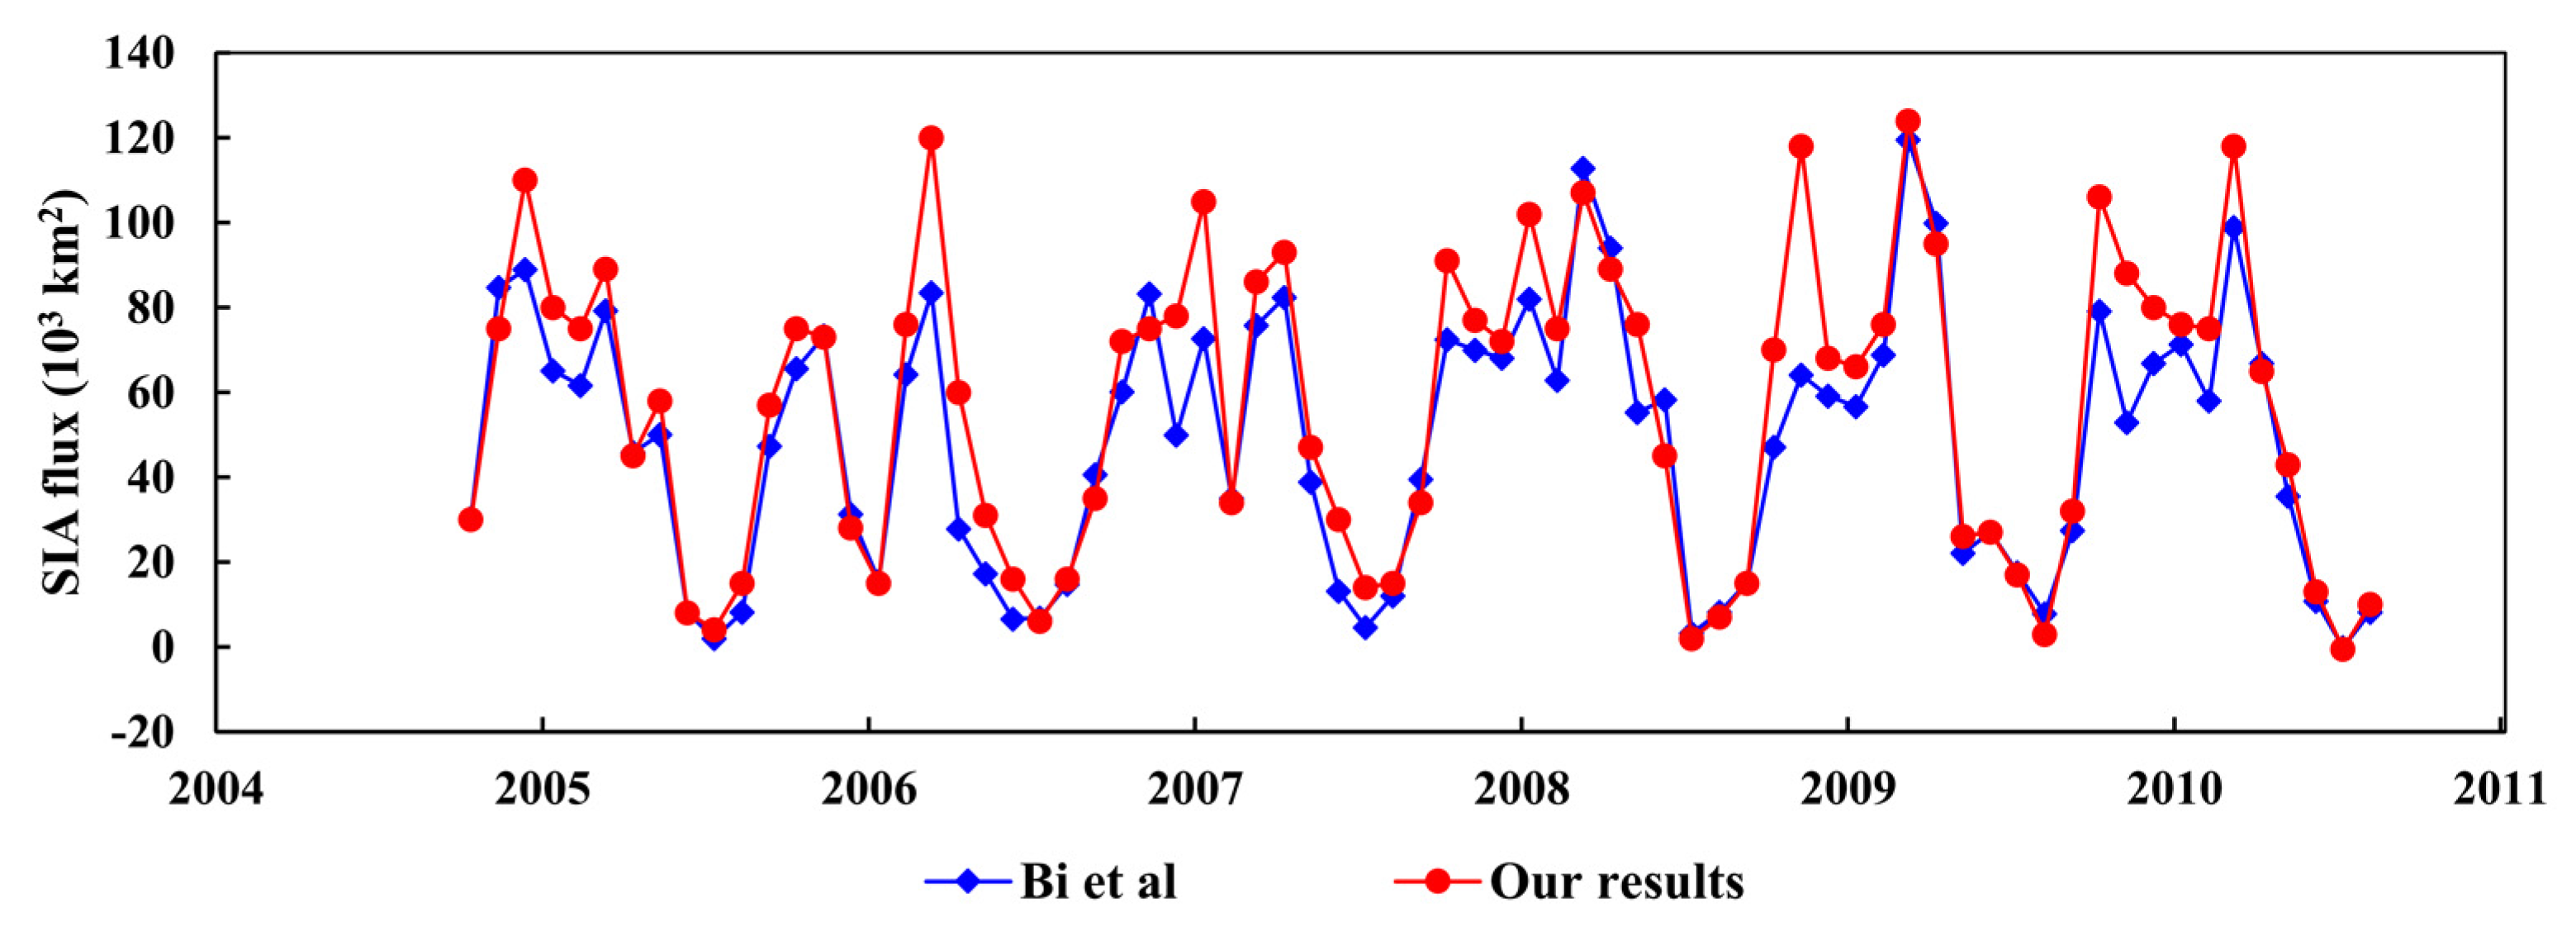
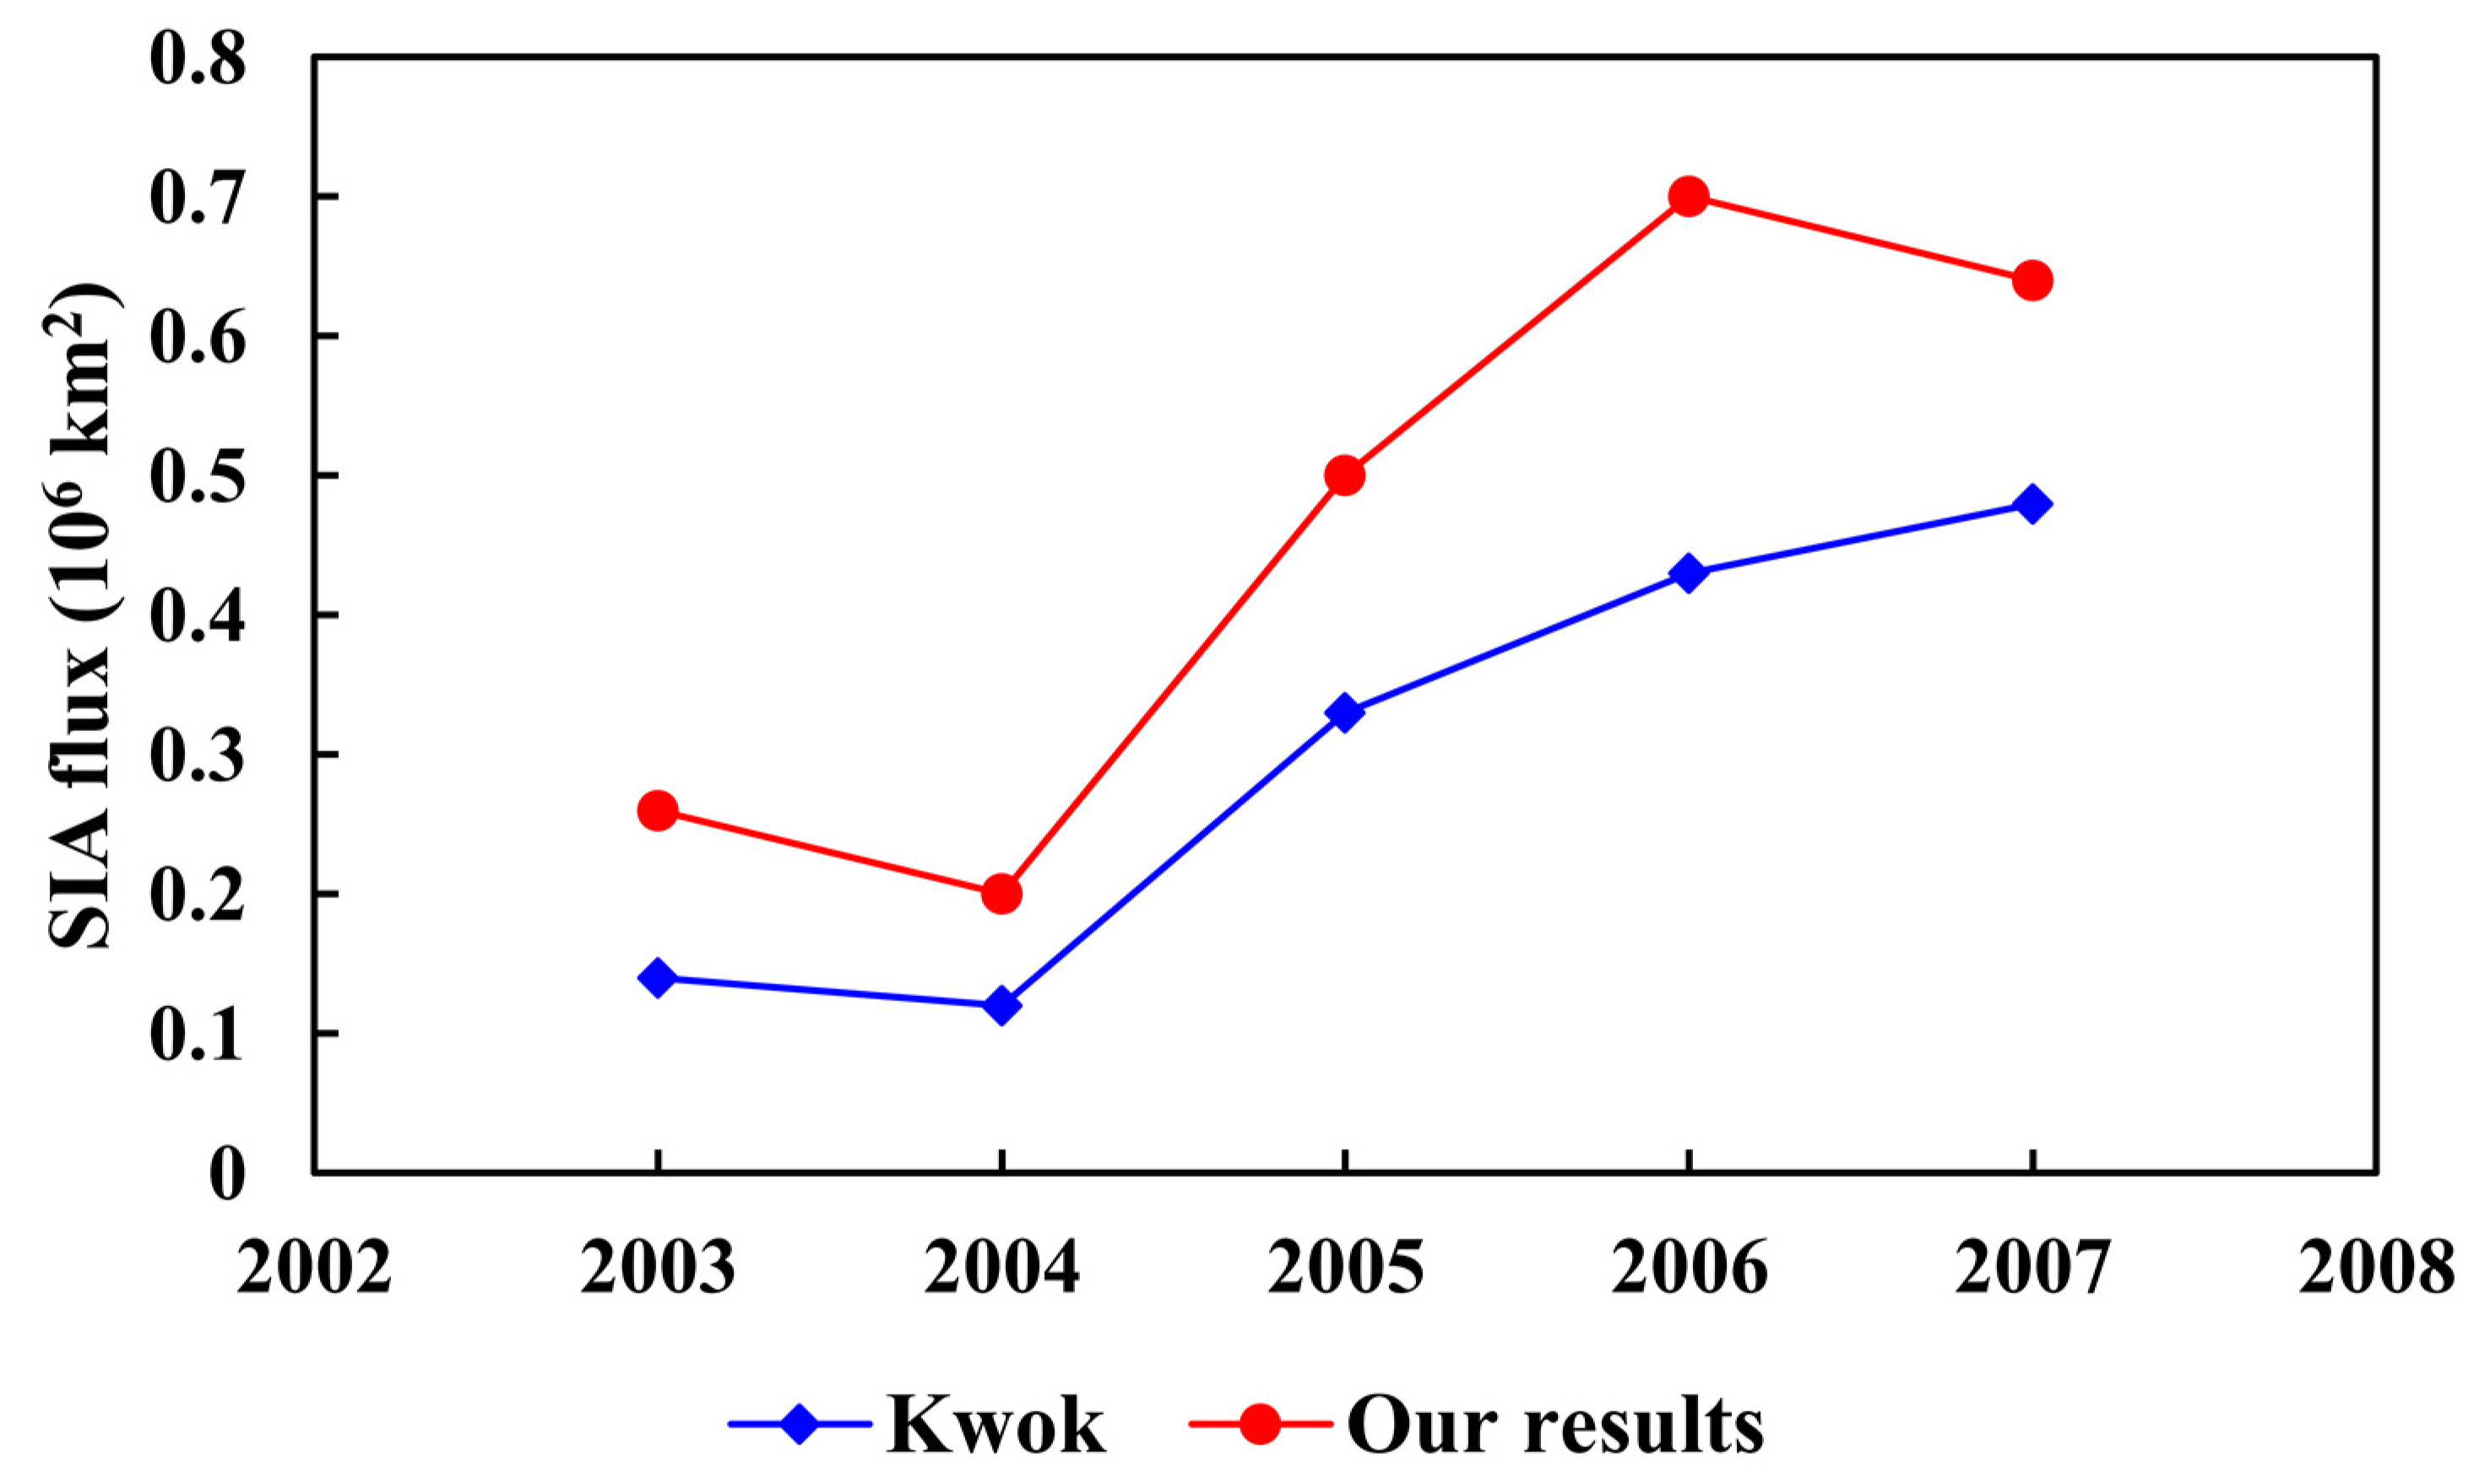
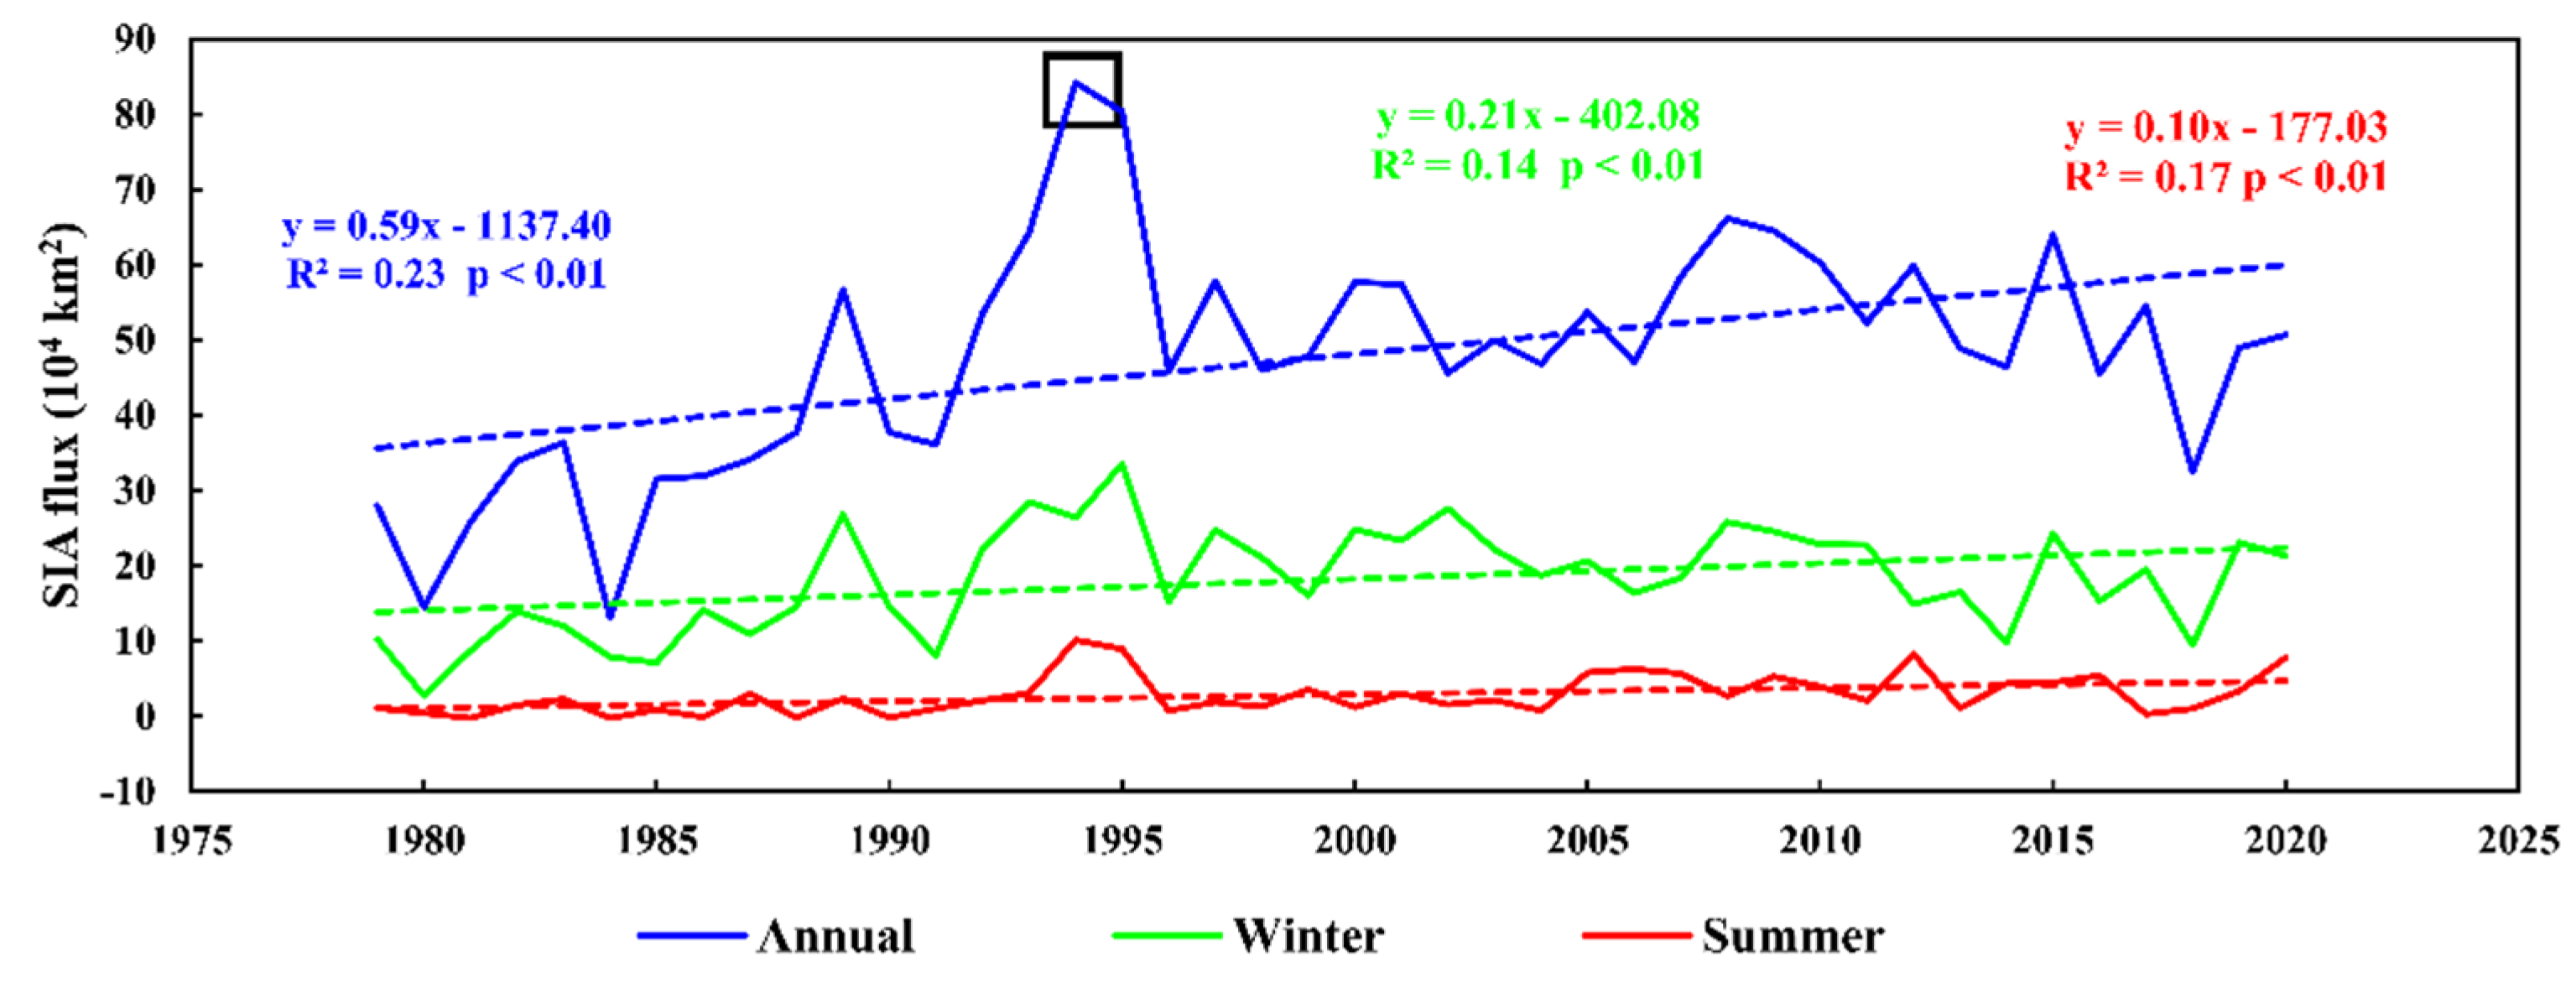
4.1.2. Impact of Sea Ice Area Outflow through the Fram Strait on Sea Ice Loss

Sea ice export from the Arctic Ocean is a dynamic factor influencing Arctic sea ice mass balance [4]. The largest portion (>90%) of the Arctic sea ice export is mainly through the Fram Strait [47,48,49,50]. The contribution of sea ice outflow through the Fram Strait on the entire Arctic SIA decline is discussed in this paper. The SIA flux through the Fram Strait gradually increases in summer and winter during 1979–2020 (Figure 10). The increasing rates for winter and summer were 2.1 × 10³ km2 yr−1 and 1.0 × 10³ km2 yr−1, respectively. We showed the monthly sea ice outflows from October 2004 to August 2010 for our results and [49] in Figure 11. Our results were close to the estimations from [49] during the summer period (June–September). The prominent biases occurred in amplitudes from October to May when the sea ice drift was rather large. The discrepancies for the two estimations came from the different gates chosen for the Fram Strait, which impacted the length of the gate and the values of the SIC and sea ice drift. Generally, the temporal behavior of sea ice outflow in this study was similar to that estimated by [49].
During 1979–2020, the mean SIA flux in summer was 2.80 × 10⁴ km2 while the mean decline in SIA in summer (the difference of SIA between June and September) for the entire Arctic Ocean was 1.94 × 10⁶ km2; the SIA flux accounted for 1.45% of the SIA decrease in the Arctic Ocean in summer. There were large differences for the annual SIA outflow trends before and after 2000 (Figure 10); the declining trend for the annual SIA outflow during 1979–2020 was large (2.03 × 10⁴ km2), while the trend during 2000–2020 wasnegative and insignificant, which was not consistent with the heavily declining Arctic SIA after 2000 (Figure 4j); it indicated that for the study period, SIA outflow made less contribution to the decrease in entire Arctic SIA. Above all, for 1979–2020, Arctic SIA decline was not mainly driven by SIA export via the Fram Strait. However, SIA export was at its largest in 1994–1995, while in Figure 4j, there was an obvious decrease in the SIA of the Arctic Ocean. It indicates that SIA export may have contributed to the SIA loss for the individual years. Moreover, the summer sea ice export resulted in the decline in sea ice albedo, which enhanced the ice albedo positive feedback in winter. Thus, the sea ice export had the potential impact on the decrease in Arctic sea ice through the thermodynamic process.

4.2. Roles of Atmospheric and Oceanic Factors in Sea Ice Loss

The summer sea ice decrease resulted from the feedback process of sea ice albedo [51,52,53], while the sea ice formation in winter was mainly determined by the amount of heat stored in the ocean [54,55]. The interplay of atmospheric and oceanic factors including SST, SAT, OLR and AMO on sea ice loss was discussed. The correlation matrices were developed to identify the links between the SIT (SIA) and other parameters (SST, SAT, OLR and AMO) for the Atlantic sector, Pacific sector and Barents–Kara Seas (Table 4, Table 5 and Table 6). The results indicate a significant positive correlation (p ≤ 0.01) between SIT and SIA, whereas other parameters, such as SST, SAT, OLR and AMO, have significant negative correlations with SIT and SIA (Table 4, Table 5 and Table 6).
In the Pacific sector and Barents–Kara Seas, the decrease in SIA mainly occurs in the marginal seas (Figure 5), where the sea ice is generally thin. When sea ice is thinning, the small heat promotes sea ice melt and results in the decrease in SIA. Among the three regions, the correlation between SIT and SIA for the Atlantic sector was the lowest. There was a rather large MYI extent and the thickest sea ice of the Arctic Ocean in the Atlantic sector; thus, the influence of SIT decline on SIA was rather small. The sea ice was the thinnest in the Barents–Kara Seas and the impact of SIT change on SIA was the largest (r = 0.84).
The correlations between SST and sea ice cover were larger than other factors, which indicated that the influences of SST changes on the sea ice cover were rather important. The SST is dominated by the albedo, which influences the outgoing and incoming radiations, such as the low albedo increasing the incoming radiations and causing a further increase in the SST [56]. The variability of summer sea ice albedo from 1982 to 2018 was shown in Figure 12. Sea ice albedo gradually decreased in the Pacific sector and Barents–Kara Seas. In the Atlantic sector, the variability of sea ice albedo was rather low, because the albedo of seasonal ice was consistently smaller than MYI in summer [57]. The extent of MYI was lower in the Pacific sector and Barents–Kara Seas than that in the Atlantic sector. Accordingly, the SIA in summer experienced great changes in the Pacific sector and Barents–Kara Seas due to the high sea ice albedo’s positive feedback. The SIT and SST showed a higher correlation in the Atlantic sector, whereas the correlation of SIA with SST was larger than SIT in the Pacific sector. In the two regions, both the Atlantic SIT and Pacific SIA experienced large changes compared with Atlantic SIA and Pacific SIT during 1979–2020. Thus, it indicated that Arctic sea ice change had a large influence on SST. Significant negative correlations were also observed between SIT, SIA and SAT for the three regions. In the Atlantic and Pacific sectors, the correlations of SIT with SAT were larger than SIA, while the correlation of SAT with SIT was similar to SIA in the Barents–Kara Seas. The increasing rate in the winter SAT in the Barents–Kara Seas was four times that in summer during 1979–2020. In Table 2 and Table 3, the winter sea ice decrease in the Barents–Kara Seas was greater than it is in the summer. It indicated that the increase in SAT in winter may have contributed to the sharp decrease in winter SIA and SIT for the Barents–Kara Seas during the past several decades.
Sea ice loss and Arctic surface albedo decline resulted in an imbalance of the atmospheric energy budget. Larger incoming insolation (solar radiation) is balanced by increased OLR via warming the atmosphere. OLR is an indicator of heat released from the ocean through longwave radiation. The negative correlation between SIT (SIA) and OLR in the Barents–Kara Seas was the strongest compared to the Atlantic and Pacific sectors, due to the rather large extent of the ice-free open sea, mostly in the Barents–Kara Seas. The heat released from the ocean to the atmosphere warmed the atmosphere and decreased the sea ice cover. There was a significant positive correlation between OLR and SAT (SST); the correlation relationship for SAT was stronger than SST (Table 4, Table 5 and Table 6).
The sea ice change in the Barents–Kara Seas was more pronounced than in the other marginal seas, which was related to the influx of warm water from the Atlantic Ocean and the interactions between the atmosphere and ocean [25]. In Figure 5, half of the Barents Sea in the southern part is almost ice-free, with minimum-to-no year-round sea ice due to the North Atlantic heat input. The influence of the ocean multi-decadal scale on the Arctic sea ice loss was supported by the significant negative correlation between SIT (SIA) and the AMO index. The AMO is an alternation between the cold and warm phase of temperature in the North Atlantic, which is visible based on the long-term SST data [25]. AMO could drive low-frequency sea ice fluctuations of the Arctic by impacting anomalous warm/cold air advection into the Arctic Ocean [58,59]. The AMO moved from a negative phase to a positive phase; the negative phase of AMO was associated with anomalously cold North Atlantic SST, while the positive phase was associated with anomalously warm SST [60]. The SST and SAT were positively related to AMO; the correlation of SST with AMO in the Arctic Ocean was larger than SAT.
The fast decline in Arctic SIA and SIT were observed during the last 42 years (Figure 4 and Figure 6) and occurred mainly in summer. Sea ice changes in the three subregions were influenced by heat exchange processes from the ocean to the atmosphere and vice versa [16,25]. Due to sea ice loss in summer, a large portion of open ocean formed, which impacted the sea ice albedo. The change of summer sea ice albedo was related to solar radiation, but also could amplify the ongoing changes of sea ice in winter. The positive feedback of sea ice albedo directly impacted the sea ice growth through OLR in winter [61]. Arctic sea ice melted quicker than winter freezing because of the heat released from a warmer ocean to cold air in the winter, since 1979 [61]. Thus, the sea ice loss in winter impacted MYI formation [62].
The correlation relationships of SIT with atmospheric and oceanic factors are generally larger than SIA (Table 4, Table 5 and Table 6), especially in the Atlantic sector. This was generally the result of thicker sea ice accompanied by a greater albedo of sea ice [63]. It showed that the influences of atmospheric and oceanic factors on SIT were rather large. Likewise, sea ice thinning had an important influence on climate change in the Arctic and significantly contributed to the Arctic amplification.

5. Conclusions

The seasonal and regional variability of Arctic sea ice during 1979–2020 was analyzed based on the long-term satellite SIA and PIOMAS SIT data. For the entire Arctic Ocean, SIA experienced a rapid decrease during 1979–2020; the declining trend in summer was 4.7 times of the winter declining trend. Regionally, the annual SIA declining rate in the Pacific sector was the largest, followed by the Barents–Kara Seas. The SIA variability in winter was smaller than that in summer, except for the Barents–Kara Seas. The SIA variability for the north CAA and Greenland and the winter variability for the Pacific sector were insignificant. During the past 42 years, Arctic SIT also experienced a significant spatial–temporal decline. The annual and winter decline trends of SIT were the largest in the Atlantic sector, and the largest decline trends in summer occurred in the Pacific sector. The SIT declining rate in winter was smaller than that in summer in the Atlantic and Pacific sectors, except for the Barents–Kara Seas.
The annual and winter SIA fluxes from the Pacific sector to the Atlantic sector significantly increased during 1979–2020. The annual SIA flux maximum occurred in 2007 when SIA in the Pacific sector was the smallest and the SIA minimum for the Atlantic sector did not occur. The SIA decline in the Atlantic sector could be replenished by the sea ice inflow from the Pacific sector. Nevertheless, the summer SIA flux between them accounted for 11% of summer SIA decreasing in the Pacific sector. Therefore, there was less contributions of sea ice outflow on the decline of sea ice cover in the Pacific sector in 1979–2020. There were significant annual and seasonal increases in the sea ice outflux through the Fram Strait. From 1979 to 2000, the increase in SIA outflux was large, while the trend was negative and insignificant for the annual and winter outfluxes in 2000–2020 when Arctic SIA experienced a large decrease; moreover, the summer SIA outflux accounted for 1.45% of Arctic summer SIA decrease. This indicated that the impact of SIA export on Arctic SIA decline was small during 1979–2020, except for the individual years. Nevertheless, summer SIA outflow resulted in sea ice albedo decline and further advanced the melting of sea ice.
Compared to the OLR and AMO, SST and SAT had higher correlations with SIA and SIT for the three regions and were the major drivers of the sea ice cover decline. The winter increase rate in SAT during 1979–2020 was four times the summer increase rate for the Barents–Kara Seas; it caused the SIA and SIT changes in winter to be greater than those in summer. Accompanied with the decline in sea ice cover, the sea ice albedo gradually declined; thus, the positive feedback of the ice-ocean albedo was strong, especially in winter, which restricted the sea ice freezing by the heat released through OLR during the sea ice growth season. OLR had significant negative correlations with SIA and SIT, and positive correlations with SAT and SST. AMO was associated with anomalously warm or cold North Atlantic SST; there were significant negative correlations between SIA (SIT) and AMO for the three regions. The correlations of SIT and atmospheric and oceanic factors were generally larger than SIA, which indicated that SIT was an important parameter on climate change.
During the past forty-two years, there have been obvious seasonal and regional differences for Arctic sea ice change under the influence of sea ice export, atmospheric and oceanic factors. Although the impact of sea ice export on sea ice decline was not significant during the study period, the impact should be considered in the context of the extreme change in sea ice, such as the occurrence in 2007. Since the Arctic is sensitive to climate change and, likewise, climate is closely related to the evolution of sea ice, the driving factors are difficult to pinpoint. Hence, the atmospheric and oceanic factors should be better valued by distinguishing between the periodic influences and trends in the future work. Moreover, we want to emphasize that the climate historical data may exhibit certain characteristics, such as heavy-tailed data distributions; if this is the case, statistical tests should be applied to ensure a realistic distribution of the target data prior to the trend analyses [64,65,66]. The results improve our understanding that the impact of SIT decline on the Arctic climate is vital and is an important parameter for improving the predictions of sea ice and climate change in the Arctic.

Author Contributions

M.L. and C.K. initiated this work. Y.H. and D.S. carried out the data processing. B.C. and X.S. contributed to the writing and editing of the manuscript. All authors have read and agreed to the published version of the manuscript.

Funding

This work is supported financially by the Programs for National Key R&D Program of China (2018YFC1407200, 2018YFC1407203) and the National Natural Science Foundation of China (No. 41976212).

Institutional Review Board Statement

Not applicable.

Informed Consent Statement

Not applicable.

Data Availability Statement

The PIOMAS sea ice thickness data are provided by the Polar Science Center (http://psc.apl.uw.edu/, accessed on 7 December 2018). Sea ice concentration, thickness and drift data are taken from the National Snow and Ice Data Center (NSIDC, http://nsidc.org, accessed on 7 December 2018). The surface atmospheric temperature and sea surface temperature are obtained from the European Centre for Medium-Range Weather Forecasts (https://apps.ecmwf.int/datasets/data/interim-full-daily/levtype=sfc/, accessed on 7 December 2018). The Arctic sea ice albedo is provided by EUMETSATCM SAF. The Monthly Outgoing Longwave Radiation data are obtained from the National Center for Environmental Prediction and the National Center for Atmospheric Research. The Monthly Atlantic multi-decadal oscillation dataset from 1979 to 2020 is acquired from the NOAA Earth System Research Laboratory.

Acknowledgments

The authors thank the anonymous reviewers for their constructive comments and suggestions that greatly improved this paper.

Conflicts of Interest

The authors declare no conflict of interest.

References

  1. Bi, H.; Yang, Q.; Liang, X. Contributions of advection and melting processes to the decline in sea ice in the Pacific sector of the Arctic Ocean. Cryosphere 2019, 13, 1423–1439. [Google Scholar] [CrossRef] [Green Version]
  2. Kwok, R. Arctic sea ice thickness, volume, and multiyear ice coverage: Losses and coupled variability (1958–2018). Environ. Res. Lett. 2018, 13, 105005. [Google Scholar] [CrossRef]
  3. Kwok, R.; Rothrock, D. Decline in Arctic Sea ice thickness from submarine and ICESat records: 1958–2008. Geophys. Res. Lett. 2009, 36, L15501. [Google Scholar] [CrossRef] [Green Version]
  4. Krumpen, T.; Gerdes, R.; Haas, C.; Hendricks, S.; Herber, A.; Selyuzhenok, V.; Smedsrud, L.; Spreen, G. Recent summer sea ice thickness surveys in Fram Strait and associated ice volume fluxes. Cryosphere 2016, 10, 523–534. [Google Scholar] [CrossRef] [Green Version]
  5. Yang, W.C.; Magnusdottir, G. Year-to-year Variability in Arctic Minimum Sea Ice Extent and Its Preconditions in Observations and the CESM Large Ensemble Simulations. Sci. Rep. 2018, 8, 9070. [Google Scholar] [CrossRef] [Green Version]
  6. Rampal, P.; Weiss, J.; Marsan, D. Positive trend in the mean speed and deformation rate of Arctic sea ice, 1979–2007. J. Geophys. Res. Ocean. 2009, 114, C05013. [Google Scholar] [CrossRef]
  7. Spreen, G.; Kwok, R.; Menemenlis, D. Trends in Arctic sea ice drift and tole of wind forcing: 1992–2009. Geophys. Res. Lett. 2011, 38, L19501. [Google Scholar] [CrossRef] [Green Version]
  8. Martin, T.; Steele, M.; Zhang, J. Seasonality and long-term trend of Arctic Ocean surface stress in a model. J. Geophys. Res. Ocean. 2014, 119, 1723–1738. [Google Scholar] [CrossRef] [Green Version]
  9. Cai, L.; Alexeev, V.A.; Walsh, J.E. Arctic Sea Ice Growth in Response to Synoptic- and Large-ScaleAtmospheric Forcing from CMIP5 Models. J. Clim. 2020, 33, 6083–6099. [Google Scholar] [CrossRef]
  10. Olonscheck, D.; Mauritsen, T.; Notz, D. Arctic sea-ice variability is primarily driven by atmospheric temperature fluctuations. Nat. Geosci. 2019, 12, 430–434. [Google Scholar] [CrossRef]
  11. Gimeno, L.; Vázquez, M.; Eiras-Barca, J.; Sorí, R.; Algarra, I.; Nieto, R. Atmospheric moisture transport and the decline in Arctic Sea ice. WIREs Clim. Chang. 2019, 10, e588. [Google Scholar] [CrossRef]
  12. Nygård, T.; Naakka, T.; Vihma, T. Horizontal Moisture Transport Dominates the Regional Moistening Patterns in the Arctic. J. Clim. 2020, 33, 6793–6807. [Google Scholar] [CrossRef]
  13. Hegyi, B.M.; Taylor, P.C. The regional influence of the Arctic Oscillation and Arctic Dipole on the wintertime Arctic surface radiation budget and sea ice growth. Geophys. Res. Lett. 2017, 44, 4341–4350. [Google Scholar] [CrossRef]
  14. Rehder, Z.; Niederdrenk, A.L.; Kaleschke, L.; Kutzbach, L. Analyzing links between simulated Laptev Sea sea ice and atmospheric conditions over adjoining landmasses using causal-effect networks. Cryosphere 2020, 14, 4201–4215. [Google Scholar] [CrossRef]
  15. Kumar, A.; Yadav, J.; Mohan, R. Global warming leading to alarming recession of the Arctic sea-ice cover: Insights from remote sensing observations and model reanalysis. Heliyon 2020, 6, e04355. [Google Scholar] [CrossRef]
  16. Screen, J.A.; Simmonds, I. The central role of diminishing sea ice in recent Arctic temperature amplification. Nature 2010, 464, 1334–1337. [Google Scholar] [CrossRef] [Green Version]
  17. Pinault, J.L. The Moist Adiabat, Key of the Climate Response to Anthropogenic Forcing. Climate 2020, 8, 45. [Google Scholar] [CrossRef] [Green Version]
  18. Steele, M.; Dickinson, S. The phenology of Arctic Ocean surface warming. J. Geophys. Res. Ocean. 2016, 121, 6847–6861. [Google Scholar] [CrossRef]
  19. Kwok, R. Summer sea ice motion from the 18 GHz channel of AMSR-E and the exchange of sea ice between the Pacific and Atlantic sectors. Geophys. Res. Lett. 2008, 35, L03504. [Google Scholar] [CrossRef] [Green Version]
  20. Woodgate, R.A.; Weingartner, T.J.; Lindsay, R. Observed increases in Bering Strait oceanic fluxes from the Pacific to the Arctic from 2001 to 2011 and their impacts on the Arctic Ocean water column. Geophys. Res. Lett. 2012, 39, 2012GL054092. [Google Scholar] [CrossRef] [Green Version]
  21. Serreze, M.C.; Crawford, A.D.; Stroeve, J.C.; Barrett, A.P.; Woodgate, R.A. Variability, trends, and predictability of seasonal sea ice retreat and advance in the Chukchi Sea. J. Geophys. Res. Ocean. 2016, 121, 7308–7325. [Google Scholar] [CrossRef]
  22. Rudels, B. Arctic Ocean circulation, processes and water masses: A description of observations and ideas with focus on the period prior to the International Polar Year 2007–2009. Prog. Oceanogr. 2015, 132, 22–67. [Google Scholar] [CrossRef] [Green Version]
  23. Li, M.; Ke, C.-Q.; Shen, X.; Cheng, B.; Li, H. Investigation of the Arctic Sea ice volume from 2002 to 2018 using multi-source data. Int. J. Climatol. 2021, 41, 2509–2527. [Google Scholar] [CrossRef]
  24. Onarheim, I.H.; Eldevik, T.; Smedsrud, L.H.; Stroeve, J.C. Seasonal and regional manifestation of Arctic sea ice loss. J. Clim. 2018, 31, 4917–4932. [Google Scholar] [CrossRef]
  25. Kumar, A.; Yadav, J.; Mohan, R. Spatio-temporal change and variability of Barents-Kara sea ice, in the Arctic: Ocean and atmospheric implications. Sci. Total Environ. 2020, 753, 142046. [Google Scholar] [CrossRef]
  26. Koenigk, T.; Caian, M.; Nikulin, G.; Schimanke, S. Regional Arctic sea ice variations as predictor for winter climate conditions. Clim. Dyn. 2016, 46, 317–337. [Google Scholar] [CrossRef] [Green Version]
  27. Screen, J.A. Simulated atmospheric response to regional and pan-Arctic sea ice loss. J. Clim. 2017, 30, 3945–3962. [Google Scholar] [CrossRef] [Green Version]
  28. Labe, Z.; Magnusdottir, G.; Stern, H. Variability of Arctic Sea Ice Thickness Using PIOMAS and the CESM Large Ensemble. J. Clim. 2018, 31, 3233–3247. [Google Scholar] [CrossRef]
  29. Kwok, R.; Cunningham, G.F.; Pang, S.S. Fram Strait sea ice outflow. J. Geophys. Res. Ocean. 2004, 109, C01009. [Google Scholar] [CrossRef]
  30. Cavalieri, D.J.; Parkinson, C.L.; Gloersen, P.; Zwally, H.J. Sea Ice Concentrations from Nimbus-7 SMMR and DMSP SSM/I-SSMIS Passive Microwave Data, 1980–1999; Digital Media; National Snow and Ice Data Center: Boulder, CO, USA, 1996. [Google Scholar]
  31. Fetterer, F.; Knowles, K.; Meier, W.N.; Savoie, M.; Windnagel, A.K. Sea Ice Index, Version 3. [Indicate Subset Used]; National Snow and Ice Data Center: Boulder, CO, USA, 2017. [Google Scholar]
  32. Zhang, J.; Rothrock, D.A. Modeling Global Sea Ice with a Thickness and Enthalpy Distribution Model in Generalized Curvilinear Coordinates. Mon. Weather Rev. 2003, 131, 845–861. [Google Scholar] [CrossRef] [Green Version]
  33. Schweiger, A.; Lindsay, R.; Zhang, J.; Steele, M.; Stern, H.; Kwok, R. Uncertainty in Modeled Arctic Sea Ice Volume. J. Geophys. Res. 2011, 116, C00D06. [Google Scholar] [CrossRef] [Green Version]
  34. Wang, X.; Key, J.; Kwok, R.; Zhang, J. Comparison of Arctic Sea ice thickness from satellites, aircraft, and PIOMAS data. Remote Sens. 2016, 8, 713. [Google Scholar] [CrossRef] [Green Version]
  35. Kurtz, N.T.; Galin, N.; Studinger, M. An improved CryoSat-2 sea ice freeboard retrieval algorithm through the use of waveform fitting. Cryosphere 2014, 8, 1217–1237. [Google Scholar] [CrossRef] [Green Version]
  36. Tschudi, M.A.; Meier, W.N.; Stewart, J.S. An enhancement to sea ice motion and age products at the National Snow and Ice Data Center (NSIDC). Cryosphere 2020, 14, 1519–1536. [Google Scholar] [CrossRef]
  37. Sumata, H.; Gerdes, R.; Kauker, F.; Karcher, M. Empirical error functions for monthly mean Arctic sea-ice drift. J. Geophys. Res. Ocean. 2016, 120, 7450–7475. [Google Scholar] [CrossRef]
  38. Peng, H.T.; Ke, C.Q.; Shen, X.; Li, M.; Shao, Z.D. Summer albedo variations in the Arctic sea ice region from 1982 to 2015. Int. J. Climatol. 2020, 40, 3008–3020. [Google Scholar] [CrossRef]
  39. Dee, D.P.; Uppala, S.M.; Simmons, A.J.; Berrisford, P.; Poli, P.; Kobayashi, S.; Andrae, U.; Balmaseda, M.A.; Balsamo, G.; Bauer, P.; et al. The ERA-Interim reanalysis: Configuration and performance of the data assimilation system. Q. J. R. Meteorol. Soc. 2011, 137, 553–597. [Google Scholar] [CrossRef]
  40. Trenberth, K.E.; Shea, D.J. Atlantic hurricanes and natural variability in 2005. Geophys. Res. Lett. 2006, 33, L12704. [Google Scholar] [CrossRef] [Green Version]
  41. Liebmann, B.; Smith, C.A. Description of a Complete (Interpolated) Outgoing Longwave Radiation Datasets. Bull. Am. Meteorol. Soc. 1996, 77, 1275–1277. [Google Scholar]
  42. Parkinson, C.L.; Cavalieri, D.J. Arctic sea ice variability and trends, 1979–2006. J. Geophys. Res. Ocean. 2008, 113, 1979–2006. [Google Scholar] [CrossRef]
  43. Xia, W.; Xie, H. Assessing Three Waveform Retrackers on Sea Ice Freeboard Retrieval from Cryosat-2 Using Operation IceBridge Airborne Altimetry Datasets. Remote Sens. Environ. 2017, 204, 456–471. [Google Scholar] [CrossRef]
  44. Li, M.; Ke, C.-Q.; Xie, H.; Miao, X.; Shen, X.; Xia, W. Arctic Sea ice thickness retrievals from CryoSat-2: Seasonal and interannual comparisons of three different products. Int. J. Remote Sens. 2020, 41, 152–170. [Google Scholar] [CrossRef]
  45. Stroeve, J.; Barrett, A.; Serreze, M.; Schweiger, A. Using records from submarine, aircraft and satellites to evaluate climate model simulations of Arctic sea ice thickness. Cryosphere 2014, 8, 1839–1854. [Google Scholar] [CrossRef] [Green Version]
  46. Lang, A.; Yang, S.; Kaas, E. Sea ice thickness and recent Arctic warming. Geophys. Res. Lett. 2017, 44, 409–418. [Google Scholar] [CrossRef]
  47. Kwok, R.; Spreen, G.; Pang, S. Arctic sea ice circulation and drift speed: Decadal trends and ocean currents. J. Geophys. Res. Ocean. 2013, 118, 2408–2425. [Google Scholar] [CrossRef]
  48. Haine, T.W.N.; Curry, B.; Gerdes, R.; Hansen, E.; Karcher, M.; Lee, C.; Rudels, B.; Spreen, G.; Steur, L.D.; Stewart, K.D.; et al. Arctic freshwater export: Status, mechanisms, and prospects. Glob. Planet. Chang. 2015, 125, 13–35. [Google Scholar] [CrossRef] [Green Version]
  49. Bi, H.; Sun, K.; Zhou, X.; Huang, H.; Xu, X. Arctic Sea Ice Area Export Through the Fram Strait Estimated from Satellite-Based Data:1988–2012. IEEE J. Sel. Top. Appl. Earth Obs. Remote Sens. 2016, 9, 3144–3157. [Google Scholar] [CrossRef]
  50. Smedsrud, L.H.; Halvorsen, M.H.; Stroeve, J.C.; Zhang, R.; Kloster, K. Fram Strait sea ice export variability and September Arctic sea ice extent over the last 80 years. Cryosphere 2017, 11, 65–79. [Google Scholar] [CrossRef] [Green Version]
  51. Vinje, T.; Kvambekk, Å.S. Barents Sea drift ice characteristics. Polar Res. 1991, 10, 59–68. [Google Scholar] [CrossRef]
  52. Kauker, F. Variability of Arctic and North Atlantic sea ice: A combined analysis of model results and observations from 1978 to 2001. J. Geophys. Res. Ocean. 2003, 108, 3182. [Google Scholar] [CrossRef] [Green Version]
  53. Zhang, J.; Lindsay, R.; Steele, M.; Schweiger, A. What drove the dramatic retreat of arctic sea ice during summer 2007? Geophys. Res. Lett. 2008, 35, L11505. [Google Scholar] [CrossRef] [Green Version]
  54. Smedsrud, L.H.; Sorteberg, A.; Kloster, K. Recent and future changes of the Arctic sea-ice cover. Geophys. Res. Lett. 2008, 35, L20503. [Google Scholar] [CrossRef] [Green Version]
  55. Årthun, M.; Eldevik, T.; Smedsrud, L.H.; Skagseth, Q.; Ingvaldsen, R.B. Quantifying the influence of Atlantic heat on Barents Sea ice variability and retreat. J. Clim. 2012, 25, 4736–4743. [Google Scholar] [CrossRef] [Green Version]
  56. Zhang, J.; Stegall, S.T.; Zhang, X. Wind–sea surface temperature–sea ice relationship in the Chukchi–Beaufort Seas during autumn. Environ. Res. Lett. 2018, 13, 034008. [Google Scholar] [CrossRef]
  57. Perovich, D.K.; Polashenski, C. Albedo evolution of seasonal Arctic sea ice. Geophys. Res. Lett. 2012, 39, L08501. [Google Scholar] [CrossRef]
  58. Castruccio, F.S.; Ruprich-Robert, Y.; Yeager, S.G.; Danabasoglu, G.; Msadek, R.; Delworth, T.L. Modulation of Arctic Sea Ice Loss by Atmospheric Teleconnections from Atlantic Multidecadal Variability. J. Clim. 2019, 32, 1419–1441. [Google Scholar] [CrossRef]
  59. Yu, L.; Zhong, S.; Zhou, M.; Lenschow, D.H.; Sun, B. Revisiting the linkages between the variability of atmospheric circulations and arctic melt-season sea ice cover at multiple time scales. J. Clim. 2019, 32, 1461–1482. [Google Scholar] [CrossRef]
  60. Day, J.J.; Hargreaves, J.C.; Annan, J.D.; Abe-Ouchi, A. Sources of multi-decadal variability in Arctic sea ice extent. Environ. Res. Lett. 2012, 7, 034011. [Google Scholar] [CrossRef] [Green Version]
  61. Bathiany, S.; Notz, D.; Mauritsen, T.; Raedel, G.; Brovkin, V.; Bathiany, S.; Notz, D.; Mauritsen, T.; Raedel, G.; Brovkin, V. On the potential for abrupt Arctic winter sea ice loss. J. Clim. 2016, 29, 2703–2719. [Google Scholar] [CrossRef] [Green Version]
  62. Zampieri, L.; Goessling, H.F. Sea ice targeted geoengineering can delay Arctic sea ice decline but not global warming. Earth’s Future 2019, 7, 1296–1306. [Google Scholar] [CrossRef] [Green Version]
  63. Kashiwase, H.; Ohshima, K.I.; Nihashi, S.; Eicken, H. Evidence for ice-ocean albedo feedback in the Arctic Ocean shifting to a seasonal ice zone. Sci. Rep. 2017, 7, 8170. [Google Scholar] [CrossRef]
  64. Ludescher, J.; Bunde, A.; Schellnhuber, H.J. Statistical significance of seasonal warming/cooling trends. Proc. Natl. Acad. Sci. USA 2017, 114, E2998–E3003. [Google Scholar] [CrossRef] [Green Version]
  65. Yuan, N.; Ding, M.; Ludescher, J.; Bunde, A. Increase of the Antarctic Sea Ice Extent is highly significant only in the Ross Sea. Sci. Rep. 2017, 7, 41096. [Google Scholar] [CrossRef] [Green Version]
  66. Bunde, A.; Ludescher, J.; Schellnhuber, H.J. How to determine the statistical significance of trends in seasonal records: Application to Antarctic temperatures. Clim. Dyn. 2021. [Google Scholar] [CrossRef]
Figure 1. The Arctic Ocean. The red lines are the boundaries of the Barents–Kara Seas. The blue line (2826 km) shows the fluxgate by which the sea ice area is exchanged between the Pacific and Atlantic sectors. The black line (491 km) shows the fluxgate of the Fram Strait.
Remotesensing 14 00904 g001
Figure 2. The monthly average Arctic SIT and the mean bias (PIOMAS–CS2) between PIOMAS and CS2 during the sea ice growth season in 2010–2019. The mean SIT for PIOMAS and CS2 and the mean (absolute) bias are listed in Figure 2. The sea ice extent used to calculate the SIT mean value is the entire Arctic Ocean (Figure 1).
Remotesensing 14 00904 g002
Figure 3. The mean bias maps (PIOMAS–CS2) between PIOMAS and CS2 during the sea ice growth season in 2010–2019.
Remotesensing 14 00904 g003
Figure 4. The annual and seasonal time series of sea ice area (SIA) anomalies in 1979–2020 for the Atlantic sector (ac), Pacific sector (df), Barents–Kara Seas (gi) and the Arctic Ocean (jl).
Remotesensing 14 00904 g004
Figure 5. The SIA trend maps from 1979 to 2020. The blue contour lines denote that these trends are significant at the 95% significance level and the green contour lines denote that these trends are insignificant at the 95% significance level.
Remotesensing 14 00904 g005
Figure 6. The annual and seasonal time series of sea ice thickness (SIT) anomaly in 1979–2020 for the Atlantic sector (ac), Pacific sector (df), Barents–Kara Seas (gi) and the Arctic Ocean (jl).
Remotesensing 14 00904 g006
Figure 7. The SIT trend maps from 1979 to 2020. These trends are significant at the 95% significance level.
Remotesensing 14 00904 g007
Figure 8. The annual and seasonal SIA fluxes between the Pacific and Atlantic sectors in 1979–2020. The black polygon indicates the time with the largest SIA export.
Remotesensing 14 00904 g008
Figure 9. Comparison of June–September SIA flux from the Pacific sector to the Atlantic sector during 2003–2007 between our results and [19].
Remotesensing 14 00904 g009
Figure 10. The annual and seasonal SIA outflow through the Fram Strait in 1979–2020. The black polygon indicates the time with the largest SIA export.
Remotesensing 14 00904 g010
Figure 11. Comparisons of monthly SIA outflow through the Fram Strait from October 2004 to August 2010 between our results and [49].
Remotesensing 14 00904 g011
Figure 12. The spatial trends of sea ice albedo in summer from 1982 to 2018.
Remotesensing 14 00904 g012
Table 1. Temporal and spatial coverages of remote sensing data and atmospheric, oceanic parameters that are used in this study.
SICSITSIDSILWeather data
SSTSATOLRAMO
Temporal coverage1979–20201979–20201979–20201982–20181979–20201979–20201979–20201979–2020
Spatial
coverage
Pan-Arctic Ocean-
Spatial resolution25 km25 km25 km25 km0.25°0.25°2.5°-
Temporal resolutionmonthly
SourceNSIDCPSCNSIDCEUMETSATCM SAF ECMWFNCEP-NCARNOAA
Note: SIC, SIT, SID and SIL are abbreviations of sea ice concentration, sea ice thickness, sea ice drift and sea ice albedo, respectively. SST, SAT, OLR and AMO are abbreviations of sea surface temperature, 2-m-high air temperature, the outgoing long-wave radiative flux and the Atlantic multi-decadal oscillation, respectively.
Table 2. The annual and seasonal variability trends of SIA (104 km2) in 1979–2020 for the Atlantic sector, Pacific sector, Barents–Kara Seas and the Arctic Ocean.
SIA AnnualWinterSummer
AS−0.50−0.14−1.17
PS−1.730.08 (p = 0.07)−4.57
BKS−1.33−1.31−0.79
AO−3.55−1.37−6.49
Note: AS, PS, BKS and AO stand for the Atlantic sector, Pacific sector, Barents–Kara Seas and the Arctic Ocean, respectively.
Table 3. The annual and seasonal variability trends of SIT (10−2 m) in 1979–2020 for the Atlantic sector, Pacific sector, Barents–Kara Seas and the Arctic Ocean.
SIT AnnualWinterSummer
AS−3.36−3.15−3.81
PS−3.25−2.58−3.90
BK−1.28−1.49−0.92
AO−2.77−2.46−3.10
Note: AS, PS, BKS and AO stand for the Atlantic sector, Pacific sector, Barents–Kara Seas and the Arctic Ocean, respectively.
Table 4. Correlation matrix of the monthly anomalies (1979–2020) of SIT, SIA and atmospheric, oceanic parameters for the Atlantic sector (the numbers are statistically significant at a confidence level of 99%).
CorrelationSITSIASSTSATOLRAMO
SIT1
SIA0.591
SST−0.80−0.431
SAT−0.58−0.340.431
OLR−0.40−0.310.380.441
AMO−0.63−0.350.700.310.321
Table 5. Correlation matrix of the monthly anomalies (1979–2020) of SIT, SIA and atmospheric, oceanic parameters for the Pacific sector (the numbers are statistically significant at a confidence level of 99%).
CorrelationSITSIASSTSATOLRAMO
SIT1
SIA0.661
SST−0.56−0.771
SAT−0.65−0.340.281
OLR−0.39−0.300.130.441
AMO−0.56−0.440.410.390.361
Table 6. Correlation matrix of the monthly anomalies (1979–2020) of SIT, SIA and atmospheric, oceanic parameters for the Barents–Kara Seas (the numbers are statistically significant at a confidence level of 99%).
CorrelationSITSIASSTSATOLRAMO
SIT1
SIA0.841
SST−0.67−0.621
SAT−0.64−0.640.561
OLR−0.43−0.480.250.421
AMO−0.40−0.390.480.340.181
Publisher’s Note: MDPI stays neutral with regard to jurisdictional claims in published maps and institutional affiliations.

