Article

Performance Testing of Optical Flow Time Series Analyses Based on a Fast, High-Alpine Landslide

1
Landslide Research Group, TU Munich, 80333 Munich, Germany
2
NHAZCA S.r.l., Spin-Off from La SAPIENZA University of Rome, 00185 Rome, Italy
3
Department of Earth Sciences & CERI Research Center, “Sapienza” University of Rome, 00185 Rome, Italy
4
GEORESEARCH Forschungsgesellschaft mbH, 5412 Puch, Austria
*
Author to whom correspondence should be addressed.
Remote Sens. 2022, 14(3), 455; https://doi.org/10.3390/rs14030455
Submission received: 30 November 2021 / Revised: 11 January 2022 / Accepted: 14 January 2022 / Published: 18 January 2022
(This article belongs to the Special Issue Remote Sensing for Natural Hazards Assessment and Control)

Abstract

:
Accurate remote analyses of high-alpine landslides are a key requirement for future alpine safety. In critical stages of alpine landslide evolution, UAS (unmanned aerial system) data can be employed using image registration to derive ground motion with high temporal and spatial resolution. However, classical area-based algorithms suffer from dynamic surface alterations and their limited velocity range restricts detection, resulting in noise from decorrelation and hindering their application to fast landslides. Here, to reduce these limitations we apply for the first time the optical flow-time series to landslides for the analysis of one of the fastest and most critical debris flow source zones in Austria. The benchmark site Sattelkar (2130–2730 m asl), a steep, high-alpine cirque in Austria, is highly sensitive to rainfall and melt-water events, which led to a 70,000 m³ debris slide event after two days of heavy precipitation in summer 2014. We use a UAS data set of five acquisitions (2018–2020) over a temporal range of three years with 0.16 m spatial resolution. Our new methodology is to employ optical flow for landslide monitoring, which, along with phase correlation, is incorporated into the software IRIS. For performance testing, we compared the two algorithms by applying them to the UAS image stacks to calculate time-series displacement curves and ground motion maps. These maps allow the exact identification of compartments of the complex landslide body and reveal different displacement patterns, with displacement curves reflecting an increased acceleration. Visually traceable boulders in the UAS orthophotos provide independent validation of the methodology applied. Here, we demonstrate that UAS optical flow time series analysis generates a better signal extraction, and thus less noise and a wider observable velocity range—highlighting its applicability for the acceleration of a fast, high-alpine landslide.

1. Introduction

Landslides have a causal link to climate change, thus pose an increasing risk in magnitude and frequency for people and their livestock [1]. In particular, investigations of high-alpine landslide areas are often difficult and dangerous; hence, remote sensing techniques have to be employed to generate sufficient spatial and temporal coverage. Here, optical space and airborne remote sensing offers two key advantages: (i) Optical images with their close-to-nadir viewing geometry, with the image plane orthogonal to the sensor’s line-of-sight (LOS), allow scientists to directly monitor and interpret geomorphic processes of steep slopes [2] without using derived products. (ii) Optical remote sensing for the calculation of ground motion by image registration is often the only feasible way to quantify horizontal surface displacements of both shallow and complex slope instabilities [3], where geomorphic processes are moving at rates too high for radar remote sensing techniques [4]. Motion analysis, applied to optical satellite and UAS imagery—including (terrestrial) LiDAR data [5,6,7]—to measure horizontal surface displacement is a well-established method. Image registration, also known as image matching and image correlation, geometrically aligns images and allows tracking for accurate 2D change measurements in optical images. It has been used on a local to regional scale to assess motion fields for glaciological [8,9,10], earthquake [11,12,13], dune migration [14,15], rock glacier [16] and landslide studies [5,17,18,19,20,21,22,23,24,25].
Image registration is among the most widely utilised techniques in computer vision. It is used to overlay two or more images of the same scene acquired at different times, from various viewpoints, by the same or different sensors [26]. Another application is stereo matching, using an image pair from the same scene taken at the same time from multiple opposing view angles [27]. Several approaches exist to estimate the relative translative offset, such as digital image correlation, optical flow and feature matching, which are often applied to measure displacement and strains. Two major approaches exist to estimate displacements to sub-pixel precision. The first is the area-based approach (also known as the correlation-like method), which recognises uniform amplitude patterns in both the reference and secondary image (Figure 1). Various algorithms calculate the correlation of these patterns in order to quantify the final displacement. The second is the feature-based method, less sensitive to illumination changes and image distortions; it depends on the existence of well-spread, salient features—detectable in both images—which are then extracted to estimate displacement vectors. This feature recognition approach is suitable for multisensor analyses and is computationally less expensive. However, its success is conditioned on surface structures, which therefore restrict its general application [28].
Classical area-based algorithms are cross-correlation, normalised cross-correlation (NCC) and minimum distance criteria [29], utilising the intensity without any structural analysis information to match areas or regions [26]. The Fourier shift theorem was proposed as a method for registering translated images [30] and was used to modify the original phase correlation (PC) algorithm (using the phase information) [31]. Thus, by introducing the theorem, the PC works within the frequency domain, utilising rotational and translational properties to calculate the relative transformation parameters based on a translational or similarity model [32,33]. Working with sub-pixel accuracy, PC is highly computationally efficient, and thus can handle large matching templates. Furthermore, it overcomes intensity contrasts, which are frequency-dependent noise, as well as non-uniform, temporal variations such as disturbing illumination influences [26,31]. Nonetheless, the constraints to applying Fast Fourier Transform (FFT) for measurements include both the picket-fence effect and spectral leakage [32]. Computational efficiency can be further enhanced, as can matching if an (inverse) pyramid approach (i.e., hierarchical cross-correlation) is applied [34]. Starting with a coarser image resolution on a high pyramid level, matched patches, i.e., measured displacement, and areas with few matching errors are propagated to a finer resolution and can be used to guide matching on finer levels down to the original resolution [35].
Several area-based applications for motion studies exist in the geoscience community. One of the first tools was IMCORR (NCC), implemented in SAGA GIS, and thus freely available [36,37]; another well-known and often-used tool is COSI-Corr (PC and NCC-based matching) [11,12]. The add-on is free but implemented within the commercial ENVI Classic. Other open source options are the library MicMac, which employs hierarchical image correlation, a combination of NCC-based matching and spatial regularisation [38], and the DIC-FFT (FFT), whose code runs in MATLAB [20]. Two other freely available tools are CIAS, performing an NCC procedure [9,39], and EMT [40], combining cross correlation and least square matching.
Several limitations nevertheless still exist for the abovementioned area-based methods. Geometrical inaccuracies arise from co-registration, with additional problems resulting from vegetation changes and dynamically significant surface processes, leading to mismatches [11,18]. While less sensitive to illumination differences, which are particularly important and challenging for high-alpine environments (arising from low contrast, moving cast shadows and cloud shadows), these factors can still result in erroneous displacement results [11,18,25]. The most important problems for their application to fast landslides are velocities exceeding the search window-related matching limit, which causes decorrelation and ambiguous signals [5,41,42]. Finally, external problems influence the calculation results from orthorectification and sensor model errors [11].
In contrast, the intensity-based approach analyses motions using the differential matching technique of optical flow, i.e., the determination of the dense deformation field of two dynamic images by computing motion vectors at every pixel (Figure S1). For more than 40 years, optical flow, also known as motion analysis, has been one of the classic research problems in computer vision [43]. Following Horn’s taxonomy, a motion field is the 2D representation of a 3D surface based on the brightness patterns of an apparent motion. Thus, it is the dense information of a dynamic motion field between two consecutive images. Based on the assumption of a globally smooth motion field [44], or if the dynamic motion field is constant within a certain interrogation window [34], the brightness constancy term is valid, so changes in illumination are resolved in motion [43,45]. As a function of space (x, y) and time (t), the first image I1 (x, y, t) moved by ∆x, ∆y will correspond to the intensity of the second image, with an offset I2 (x + ∆x, y + ∆y, t + ∆t), which can be expressed as the optical flow problem: ( u ,   v ) = ( Δ x Δ t ,   Δ y Δ t ) .
Fundamental works by Horn and Schunck [44], as well as Lucas and Kanade, [34] accelerated computation times, e.g., with the coarse-to-fine search strategy for an inverse image pyramid approach, which decreases computational costs. Today, due to this computational effectiveness while handling large displacements at sub-pixel resolutions, this strategy is widely employed in medical image registration, automotive driver assistance, human motion analysis, and has been applied in geosciences to determine glacier flow [46,47].
Nevertheless, based on the brightness consistency assumption, limitations arise due to considerable changes in illumination induced by shadows, seasonal effects such as non-uniform glacial crevasse patterns, surface feature changes of tumbling rocks, and large textureless regions due to snow cover and shade [43,46]. Accordingly, optical flow was suggested for images of low noise and brightness variance to estimate small displacements only [42]. A recent work by Kroeger et al. [45,48] utilises the fast and noise-robust inverse compositional image alignment approach [49,50] and proposes a fast dense inverse search method to capture matches quickly in order to deal with large displacements, deformations, appearance alterations such as illumination, chromaticity and blur, as well as motion discontinuities or outliers [45,51].
In general, the application of optical image registration methods can encompass a large velocity range as these methods are less sensitive to large displacements and long measurement intervals, leading to decorrelation when using Differential Interferometric Synthetic Aperture Radar (DInSAR). Its application is restricted to relatively slow motions (≤1 m/yr), i.e., remaining below a quarter of the SAR sensors’ wavelength λ (≥λ/4), with some exceptions of λ/2 [4]. Although active radar sensors are relatively independent of atmospheric constraints and of shadows, further limiting high-alpine factors include snow cover, slope exposition, layover effects and foreshadowing [52,53]. Nevertheless, using optical remote sensing for research on high-alpine sites is often difficult due to meteorological constraints such as snow cover, clouds or cloud shadows and mountain ridge topographic shadowing effects for certain seasons and times of day. Even though satellite revisit rates have significantly increased (e.g., Sentinel-2, five days, PlanetScope, daily), their actual net revisit rate for high-alpine sites is restricted to a few images per month [25,54]. Therefore, UAS campaigns offer the highest temporal flexibility to overcome these obstacles [17], but good quality data depends on GCPs (ground control points) with reproducible flight plans [55], which requires significantly more time, and hence, higher costs.
While experience for landslide displacement calculations on area-based image matching exists [14,56], no previous research has applied intensity-based optical flow to derive ground motion for landslide behaviour assessment. In this study, we test the performance of the intensity-based fast optical flow method using dense inverse search and compare the results with the widely known area-based phase correlation algorithm, both of which are implemented into the commercial software IRIS. We employed these algorithms to compute the deformation fields for the Sattelkar, a complex landslide in a steep high-alpine cirque (2130–2739 m asl) exhibiting varying displacement rates from slow (few meters) to moderate velocities (<30 m/yr) [57]. We conduct a single interval analysis, together with a time-series approach, on five UAS orthophotos acquired during a three-year period (2018–2020) of both high spatial accuracy and resolution (0.08 m) [58]. We evaluate the results based on trajectories of large boulder blocks (<10 m) which are traceable in the UAS orthophotos and stable bedrock. Accordingly, we seek to answer the following research questions:
  • Is the dense inverse search (DIS) method applicable to the large displacements of landslides with complex behaviours?
  • Can the method investigate both slow and moderate velocities between repeated observation intervals?
  • Is the DIS method robust enough to cope with the changing and unfavourable illumination of a high-alpine steep study site?
  • How does the DIS method perform in comparison to the well-established phase correlation algorithm?

2. A Complex Landslide

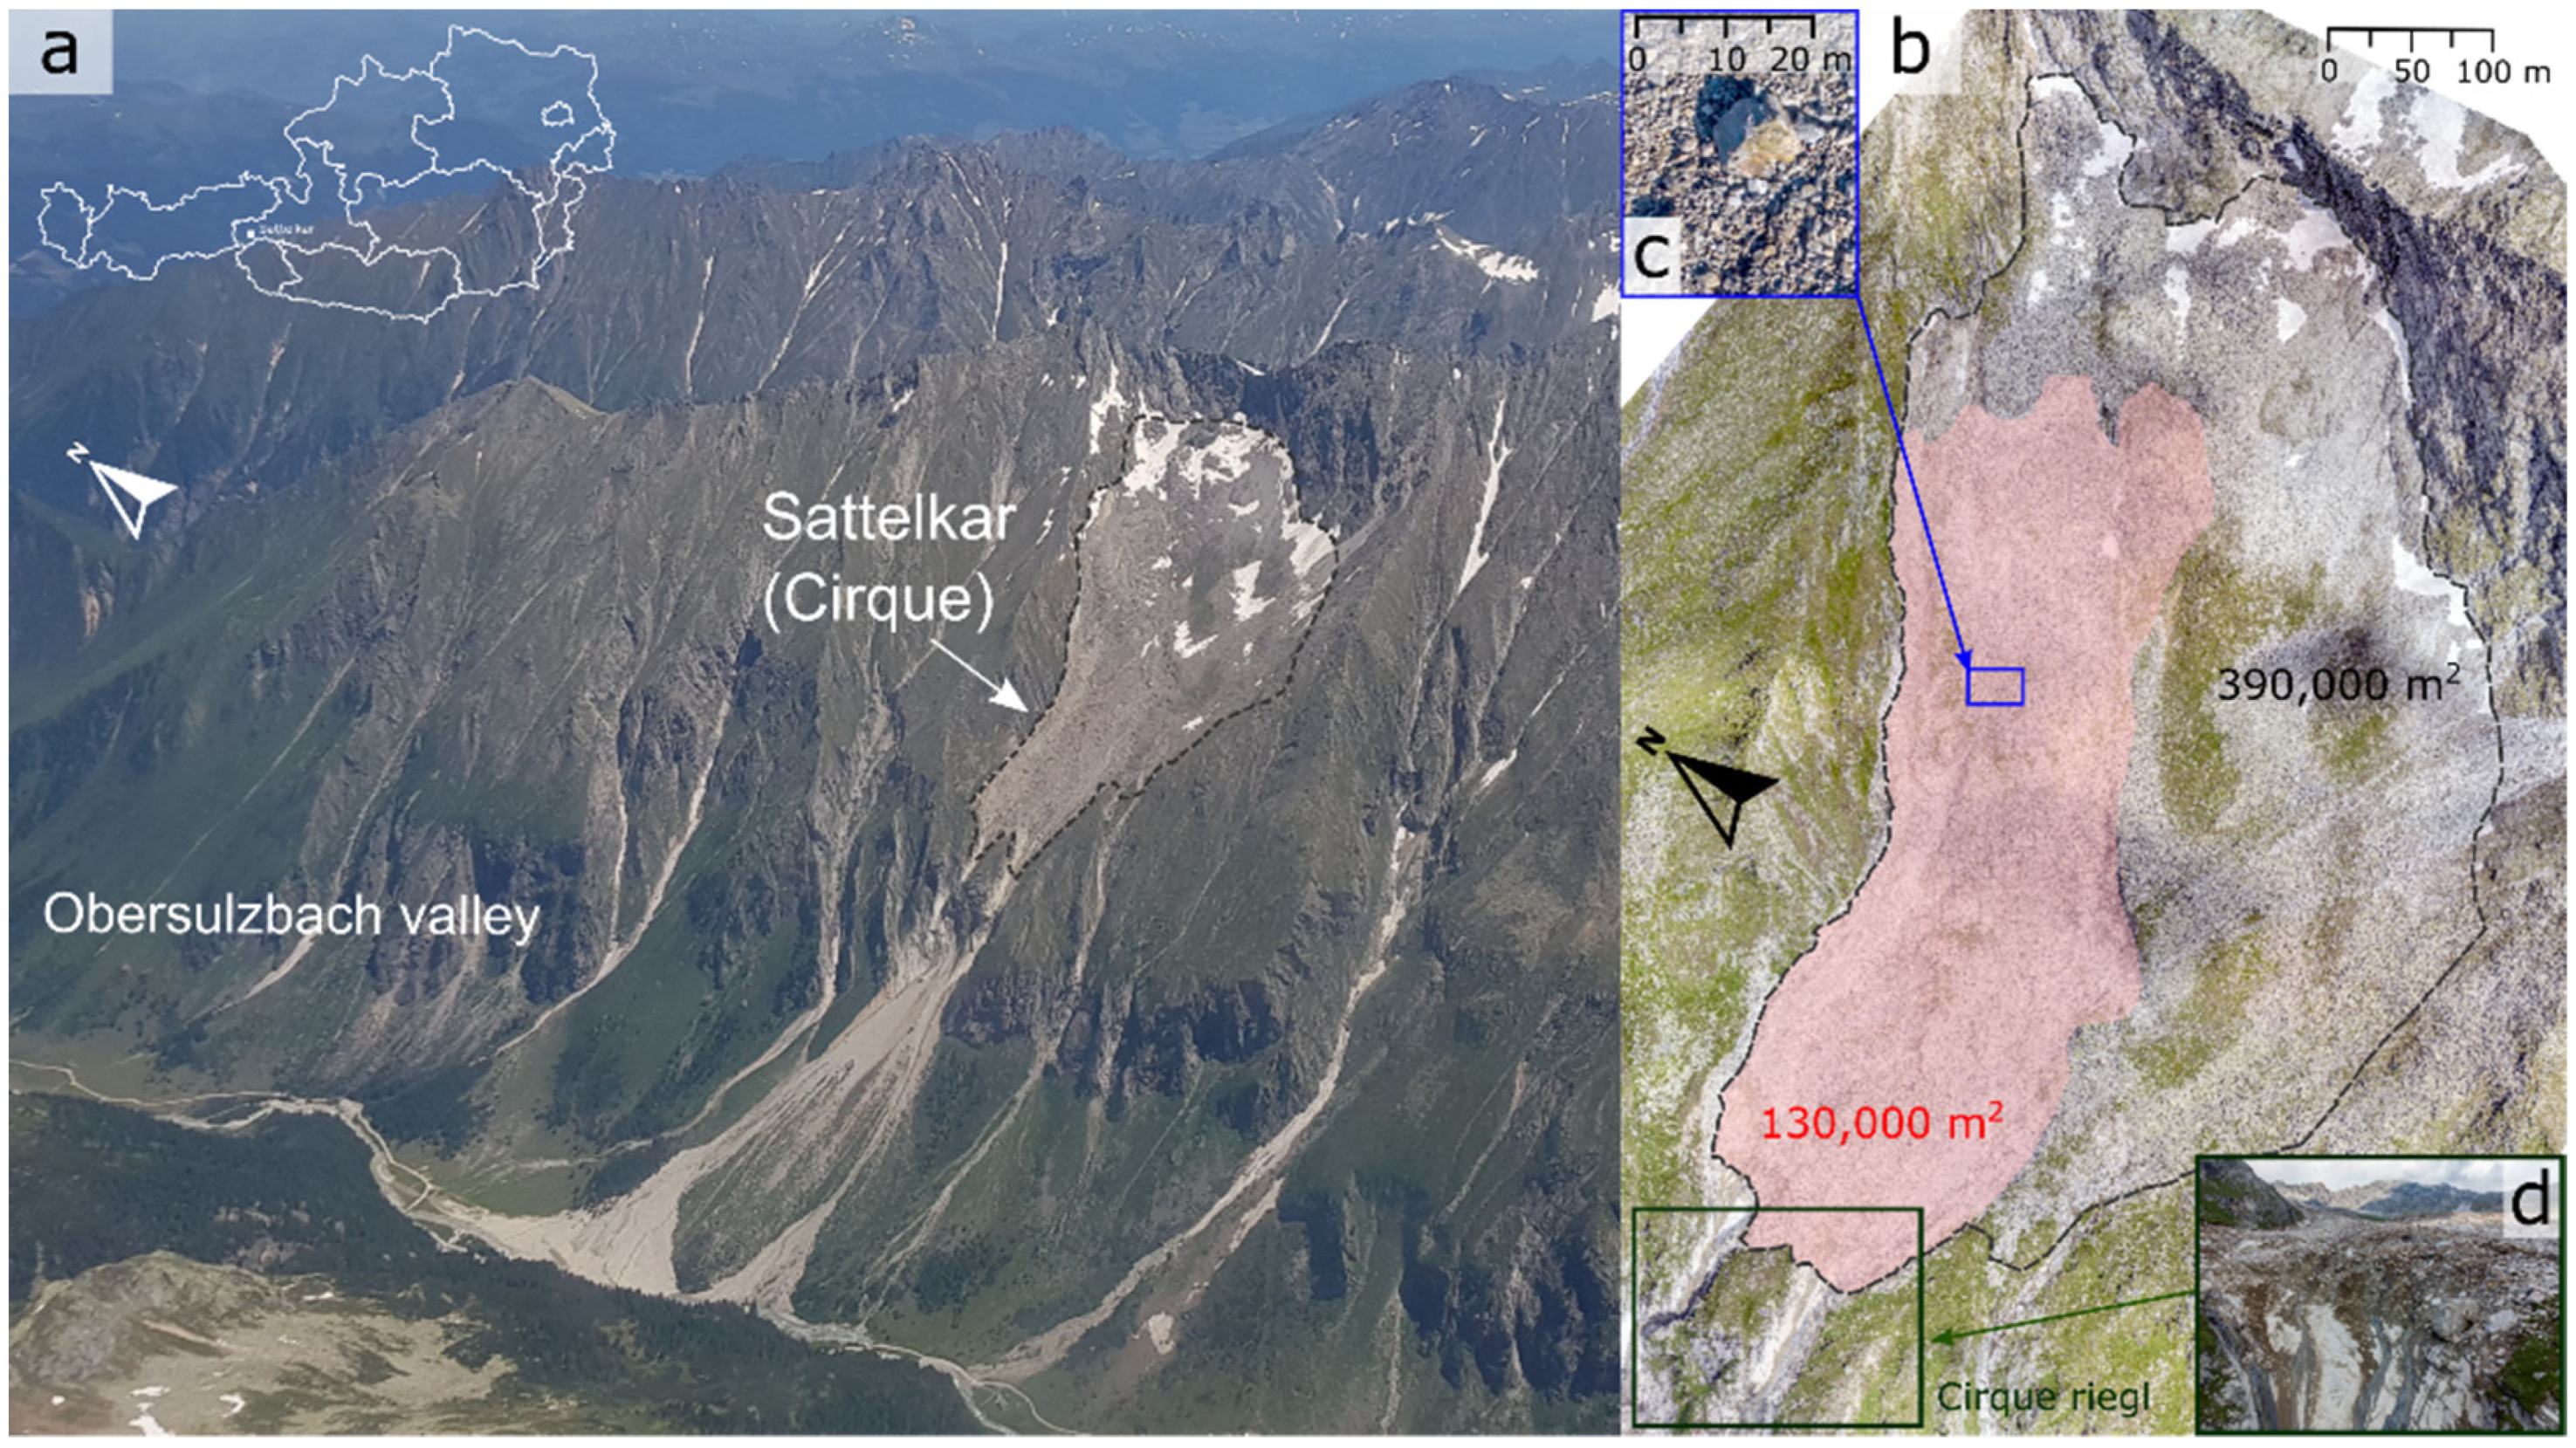
The Sattelkar is a ~30° steep high-alpine deglaciated cirque in the Obersulzbach valley, Großvenedigergruppe, Austria (Figure 2). It is located at an altitude between 2130–2730 m asl and is west-oriented. The cirque is surrounded by a headwall of central granitic gneiss and is filled with an abundant volume of deposits from past and current rockfalls, glacial and periglacial debris, moraine walls and relicts of a dissolving rock glacier [59,60]. The cirque infill is characterised by a wide grain size distribution, with boulders up to 10 m.
Since 2003, surface alterations have taken place: the vegetation cover has degraded, and been replaced with loose mobile rock material [59]. The deep-seated, retrogressive movement is sensitive to rainfall and meltwater, causing high water (over)saturation and leading to a spreading and sliding behaviour on the glacially smoothed bedrock, developing into a flow-like behaviour while huge blocks tumble and turn—all of which can be classified as a complex landslide [57]. These characteristics make this a challenging benchmark object and suitable site for landslide displacement analyses using optical remote sensing.
Based on aerial orthophotos, damage documentation, and witness reports, during the last decade a continuous intensification of mass wasting and debris flow activities has taken place. Heavy precipitation on 30 and 31 July 2014 led to a debris flow of about 70,000 m3 from the catchment area above the cirque threshold (at ~2000 m asl), and a further 100,000 m3 of mobilized material was entrained from within the channel [59].
Initial investigations estimated an unstable area of 130,000 m² where 1 mio. m3 of debris showed high activity; displacement rates up to 10 m a−1 between 2003–2015 were obtained from aerial orthophotos and repeated field measurements [59,60]. As the debris consisted of boulders up to 10 m, continuous visual block tracking could be employed to estimate the displacement within the active area based on aerial orthophotos. Recent studies conducted with COSI–Corr confirmed this ongoing increase of mass wasting processes, with variable displacement rates ranging from 1–14 m in only 42 days [25].
Today long-term monitoring is conducted with high-accuracy UAS; nine differential GPS-measured GCPs provide continuous stable and precise conditions. Additional monitoring instruments provide geomorphologic insights into rockfall behaviour via one autarkic seismograph. Thirteen near-surface temperature loggers at a 0.1 m depth also record mean annual ground surface temperatures, indicating potential, sporadic permafrost conditions [61]. Recent empirical statistical permafrost modelling in the Hohe Tauern Range supports permafrost occurrence at our study site [62].

3. Materials and Methods

There are several reasons to utilise UAS orthoimages for our study. We have a stable set-up for the study site which guarantees a high quality, reliable data set. Due to their time flexibility, UAS flights are conducted under best illumination conditions, with similar time periods. Additionally, we have full control of the image acquisition format (same UAS and flight plan, management over spatial resolution, extent, acquisition altitude and snow coverage) [55] and the subsequent manual post-processing (georeferencing and spatial accuracy, orthorectification) [58].
We applied two image matching algorithms to optical multi-temporal UAS orthophotos to identify and quantify horizontal displacements. The first is phase correlation [33], and the second is optical flow, where we make use of a dense inverse search method (DIS) [48] which applies the inverse search approach [49,50] based on the fundamental work of the coarse-to-fine Lucas–Kanade algorithm [34]. The DIS code is freely available online (OpenCV, https://docs.opencv.org/3.4/d4/dee/tutorial_optical_flow.html, last access 11 October 2021; the script is based on Kroeger et al. [48]). Both algorithms are incorporated into the commercial software IRIS, developed by NHAZCA S.r.l., in which the displacements were calculated (https://www.photomonitoring.com/iris, last access 12 January 2022). Furthermore, we used ArcGIS (calculations, statistics and map creation), ArcGIS Pro (multihillshade calculations), open source QGIS (data handling and management) and SAGA (displacement vector calculations).

3.1. UAS Image Acquisition and Processing

Five UAS (unmanned aerial system) acquisition campaigns took place between 2018 and 2020 (Table 1). All UAS flights were conducted at approximately the same time of day in order to have best similarity of illumination conditions regarding shadows. Additionally, the flight campaigns were set up around the same dates to have generally equal time intervals. Thus, for our study approach, the four time intervals of our data set allowed us—with a sufficient number and an adequate approach—to interpret the processes of both two one-year-long as well as two summer season intervals, with flights in mid-July and the beginning of September (Table 1). The flights were planned with UgCS (identical flight plans with four flights at different elevations of high overlap for front: 80% and side: 70%) and carried out with a DJI Phantom 4. The ground sampling distance was 7 cm for the area of ~3.4 km² and with a flight speed of ~8 m/s, with a total flight time of ~3.5 h (Table 2). Images were taken in RAW format, improved for contrast, highlights, shadows and clarity using Adobe Exposer, then exported as JPGs (95% compression), and finally processed with Pix4Dmapper to 0.08 m resolution. Based on nine permanent ground control points on bare rock (GCPs, 30 × 30 cm), the pictures were georeferenced and orthorectified. GCPs were repeatedly registered (1000 measurements/position) with the TRIMBLE R5 dGPS (differential GPS). We post-processed the data using the baseline data of the Austrian Positioning Service (APOS) provided by the Bundesamt für Eich und Vermessungswesen (BEV). The horizontal RMSE was ~0.05 m and the vertical RMSE was ~0.10 m, and they were used to rectify all UAS campaigns. Lastly, the data (orthophotos and DEMs) was clipped to a consistent area of interest (AOI), projected to UTM 33N (EPSG 32633) and downsampled to 0.16 m (bilinear interpolation) with GDAL to enhance processing time. In addition, to better understand surface processes, hillshades (ArcGIS) and multi-hillshades (ArcGIS Pro) were calculated and visualised as GIFs and combined with total displacement results from PC and DIS (see online supplementary material, OSM).

3.2. Displacement Calculation and Derivation of Displacement Curves

We systematically tested parameter sensitivities in order to determine the best settings for both algorithms, PC and DIS. To do so, we conducted horizontal displacement analyses for all possible time interval combinations on both single analyses (i.e., t n t n + 1 ) as well as multimaster analyses (Table 1). Multispectral (rgb) UAS orthophotos were used as the input, which were transformed into grayscale images.
The parameter settings of the phase correlation in IRIS are (i) step size, which is the pixel size in x, y between the two sliding windows. This defines the final output resolution, and thus, the final information density (the smaller the step, the denser the coverage), and significantly affects computation time. Similarly, the size of the moving window is a critical parameter, as it defines the physical resolution of the result and represents a compromise between noisy or homogeneous data, hence producing stable output results. Enlarging the window size, the correlation can be increased and homogeneity enhanced; however, computation time will increase. For our input data, we achieved the best results (ii) using a matching window size of 256 pixels. We set (iii) the subpixel resolution to 0.25, which resulted in an upsampled cross-correlation by a factor of 4 and a final subpixel resolution of 0.04 m. Although we had (iv) the option to use the coarse-to-fine pyramid approach, working with one pyramid level was sufficient, and thus the original resolution was kept. In the post-processing the results were (v) resampled using nearest neighbour. In order to identify the matching limitations, i.e., decorrelations, we did (vi) not apply a correlation coefficient threshold, thus keeping the results raw. For final total displacement visualisation, a minimum threshold for values below 0.5 m was applied to eliminate noise.
Thereafter, a multitemporal analysis was performed and the same image matching parameter settings (i–vi) were applied as used for the single analysis. For each reference image we calculated every secondary image, i.e., retaining all possible image combinations (Figure 3). Prior to each single displacement analysis, image pairs were co-registered using the stable area around the landslide. Then, a weighted average using the correlation coefficient was applied to all single analysis results in order to calculate the final multimaster outcome. Each single analysis resultant map was saved to facilitate the final analysis.
Using the OpenCV [63] algorithm, which implemented a dense inverse search optical flow [48], we analysed the UAS data set and tested different parameter combinations for each single time interval in order to find the most suitable one (Table A1). The matching patch sizes employed 8 × 8 or 16 × 16 pixels. A mean normalisation for the patches was applied, which improves the robustness of illumination changes as it calculates every band’s mean.
Once we determined the best single-interval combinations, we used these results for the final multimaster analysis of DIS. We used the same multimaster settings as those applied for the PC multimaster calculation.
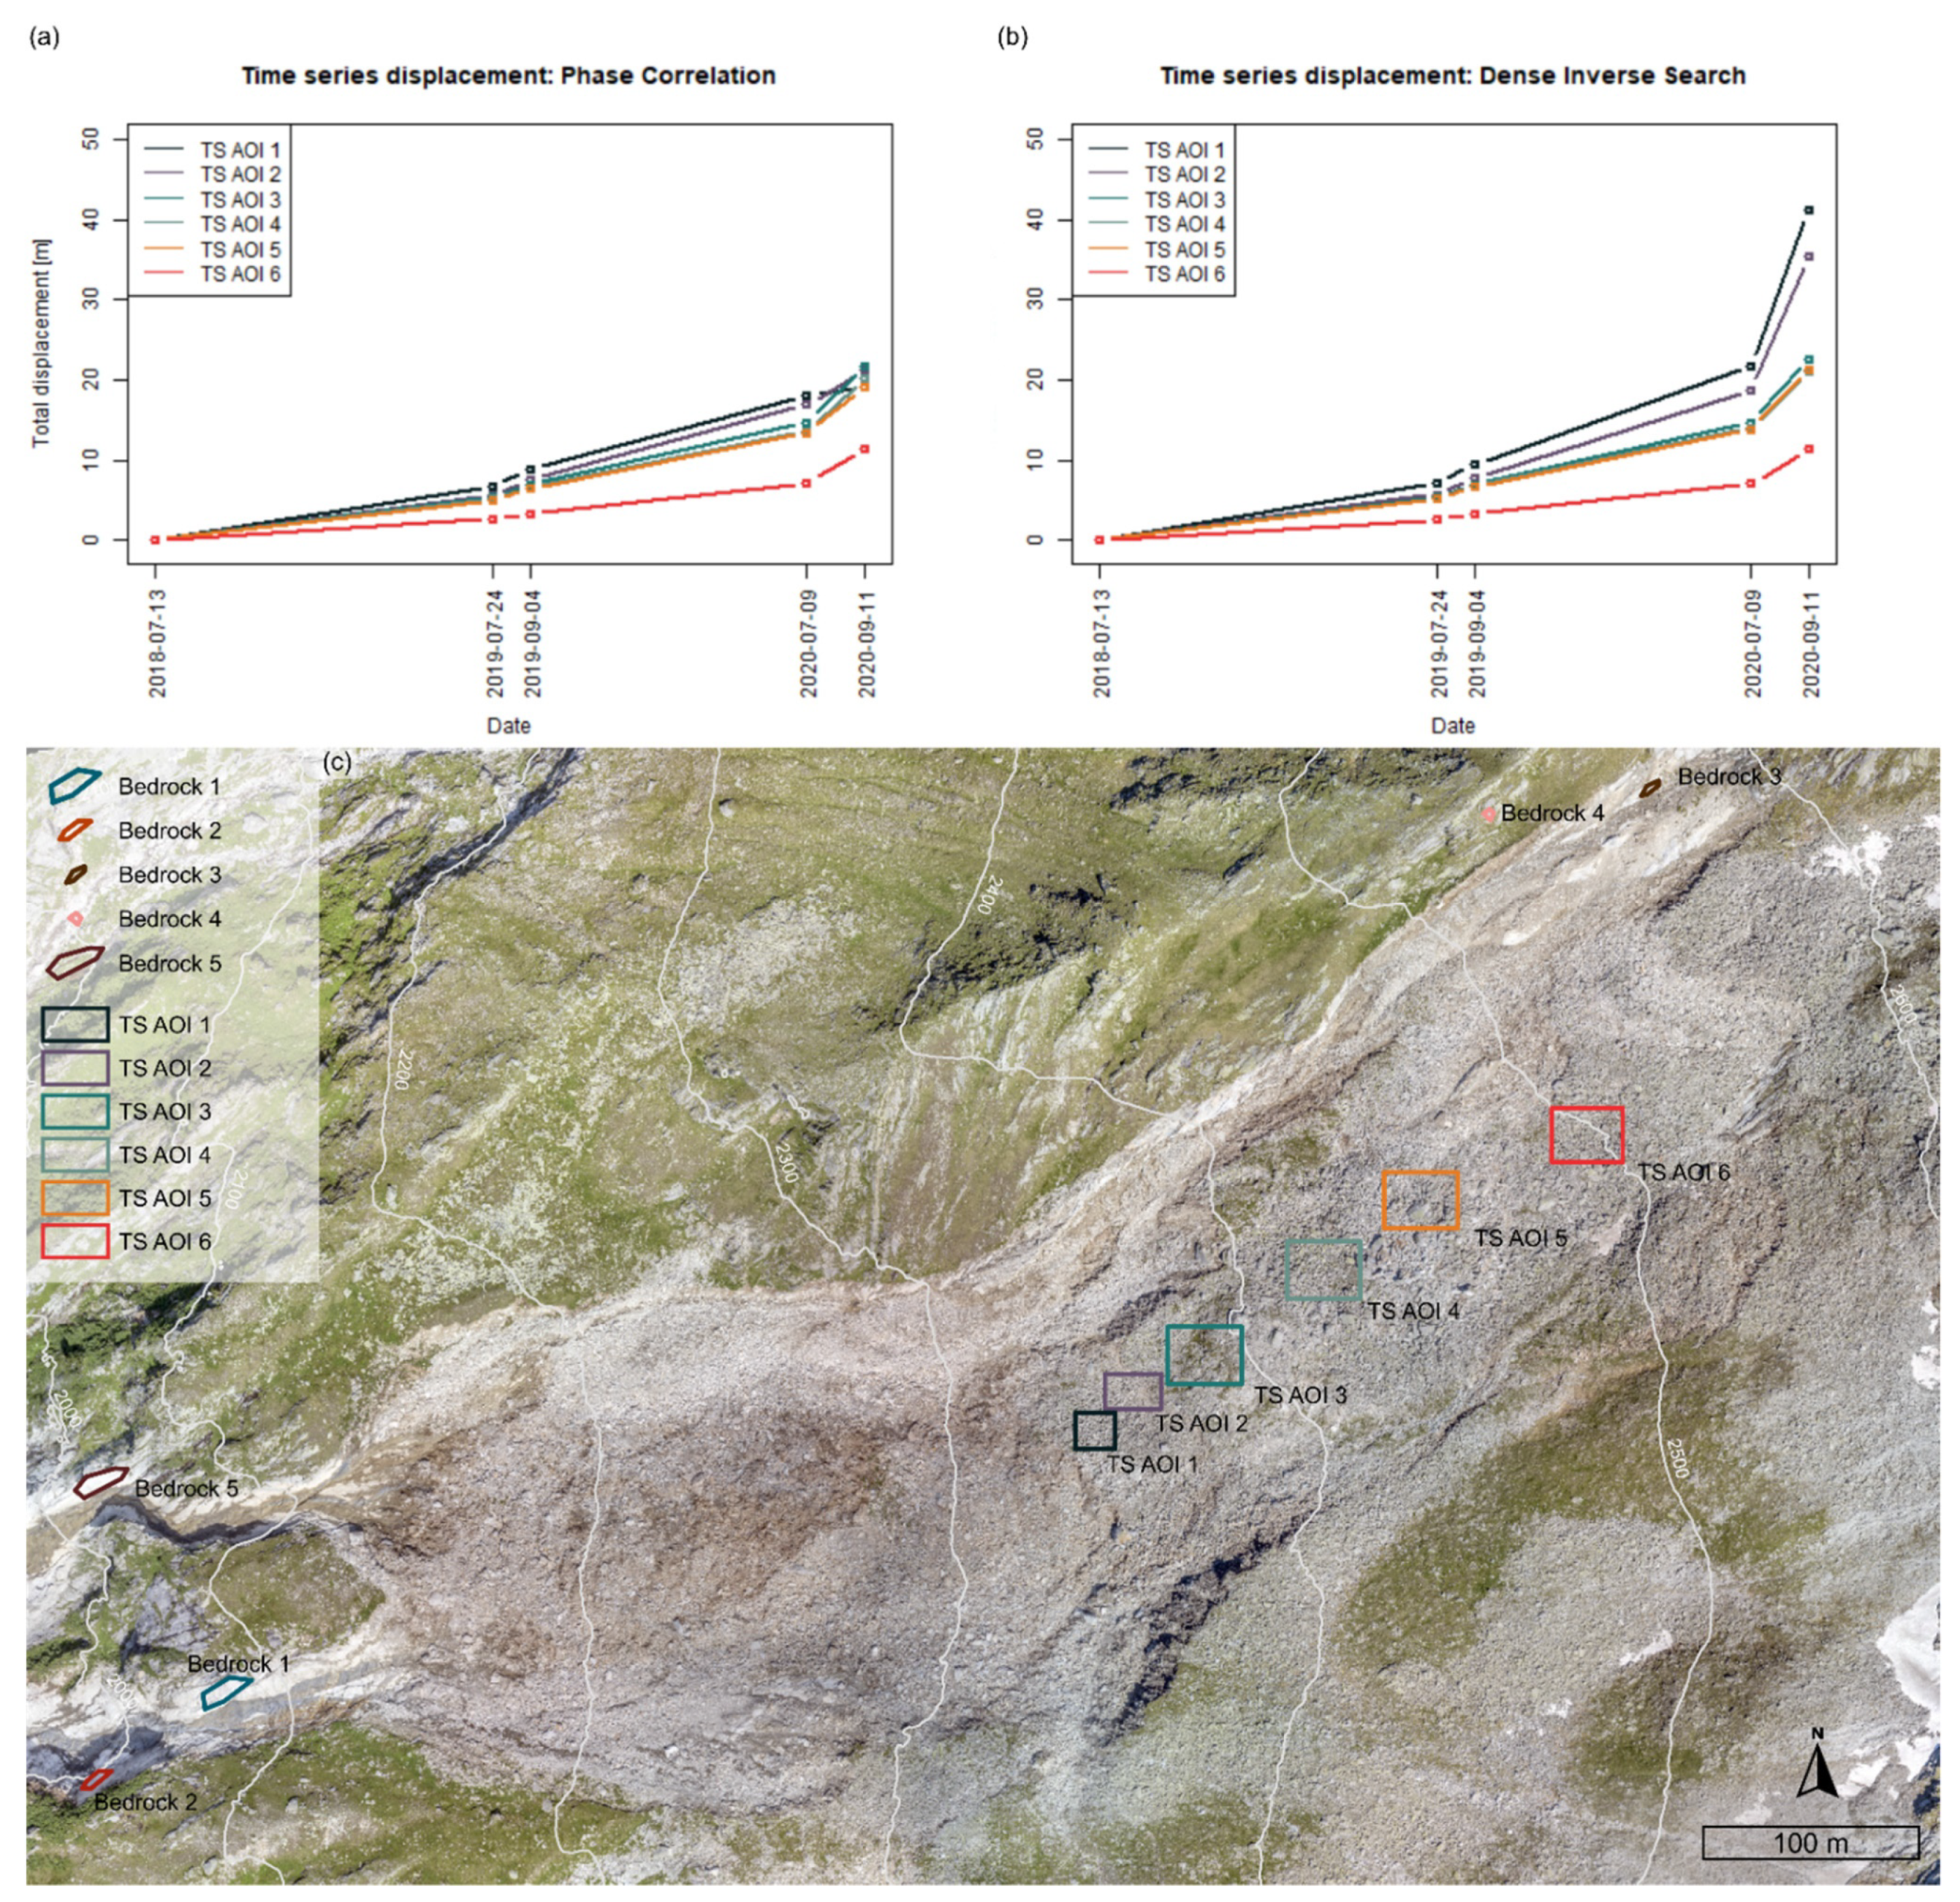
In order to calculate the time series (TS) displacement curves based on the multimaster analysis, in QGIS we created six large rectangles (TS AOI 1–6; see Figure 8). On the basis of preliminary results during sensitivity tests for both PC and DIS, the AOIs were placed beginning in the centre of the landslide process and moving uphill towards the rear (Table 3) to prevent the AOIs from being disturbed by any noise. Afterwards, they were imported into IRIS as *.kml. For both TS results (PC and DIS), we then derived for each TS AOI (1–6) a displacement curve (Figure 8).

3.3. Accuracy Assessment and Result Validation

We demonstrated the validity of our algorithms in two ways: by (a) checking the displacement for stable bedrock areas and (b) using the trajectories of manually measured boulders detectable in the orthophotos. In QGIS we selected five different stable bedrock areas of sufficient spatial extent outside the landslide process area (Table 3). These areas were unaffected by cast shadow and remnants of debris from past rainfall events. The exported *.kml were used in IRIS to derive displacement curves for north–south (NS) and east–west (EW) displacements.
As image registration is based on the matching of pixel patches, we assumed that adjacent pixels represented a similar displacement magnitude. To estimate the accuracy of fit resulting from the total displacement calculations (PC and DIS), we calculated a spatial mean total displacement of the boulder trajectories with a buffer of 0.1 m to plot against the manually measured travel distances of the boulder trajectories (Figure 4). We ran a regression model to see if boulder motion significantly predicted data distance with and without outliers. In order to detect outliers, we used Mahalanobis distance, a reliable outlier detection measure, as it focuses on multivariate distributions of more than one variable, and hence is suitable for our data [64]. Accordingly, we show regression lines without outliers.
After exporting the *.raw results of the total, NS and EW displacement into ArcGIS, we used the former to visualise the ground motion above 0.5 m displacement for the known process area, with no further filter applied. This threshold was selected due to the NS and EW components of the bedrock times series calculations indicating the accuracy of our calculations (see Section 4.1). With the SAGA tool “Gradient vectors from Directional Components”, displacement arrows (*.raw NS and EW displacement results, mean value with a step of 100 and range of 50–250) were calculated. As some arrows were slightly outside the total displacement results, we filtered and cleaned up the vectors (extent of total displacement) to avoid ambiguity (see left column, Figure 5).

3.4. Atmospheric and Hydrological Conditions

In order to interpret the calculated displacement results of this hydrologically sensitive complex landslide, we considered precipitation data. An automatic weather station at the Kürsinger cabin in close vicinity to the Sattelkar measures rainfall during the opening season of the cabin (spring to autumn; Table 4 and Table 5).

4. Results

This section outlines the results of the studies of the total displacement for the single and the multimaster analysis; for the latter only we present displacement curves. We further evaluate the findings based on manually measured boulder tracks and stable bedrock areas.

4.1. Accuracy Assessment: Stable Areas and Ground Truth Comparison

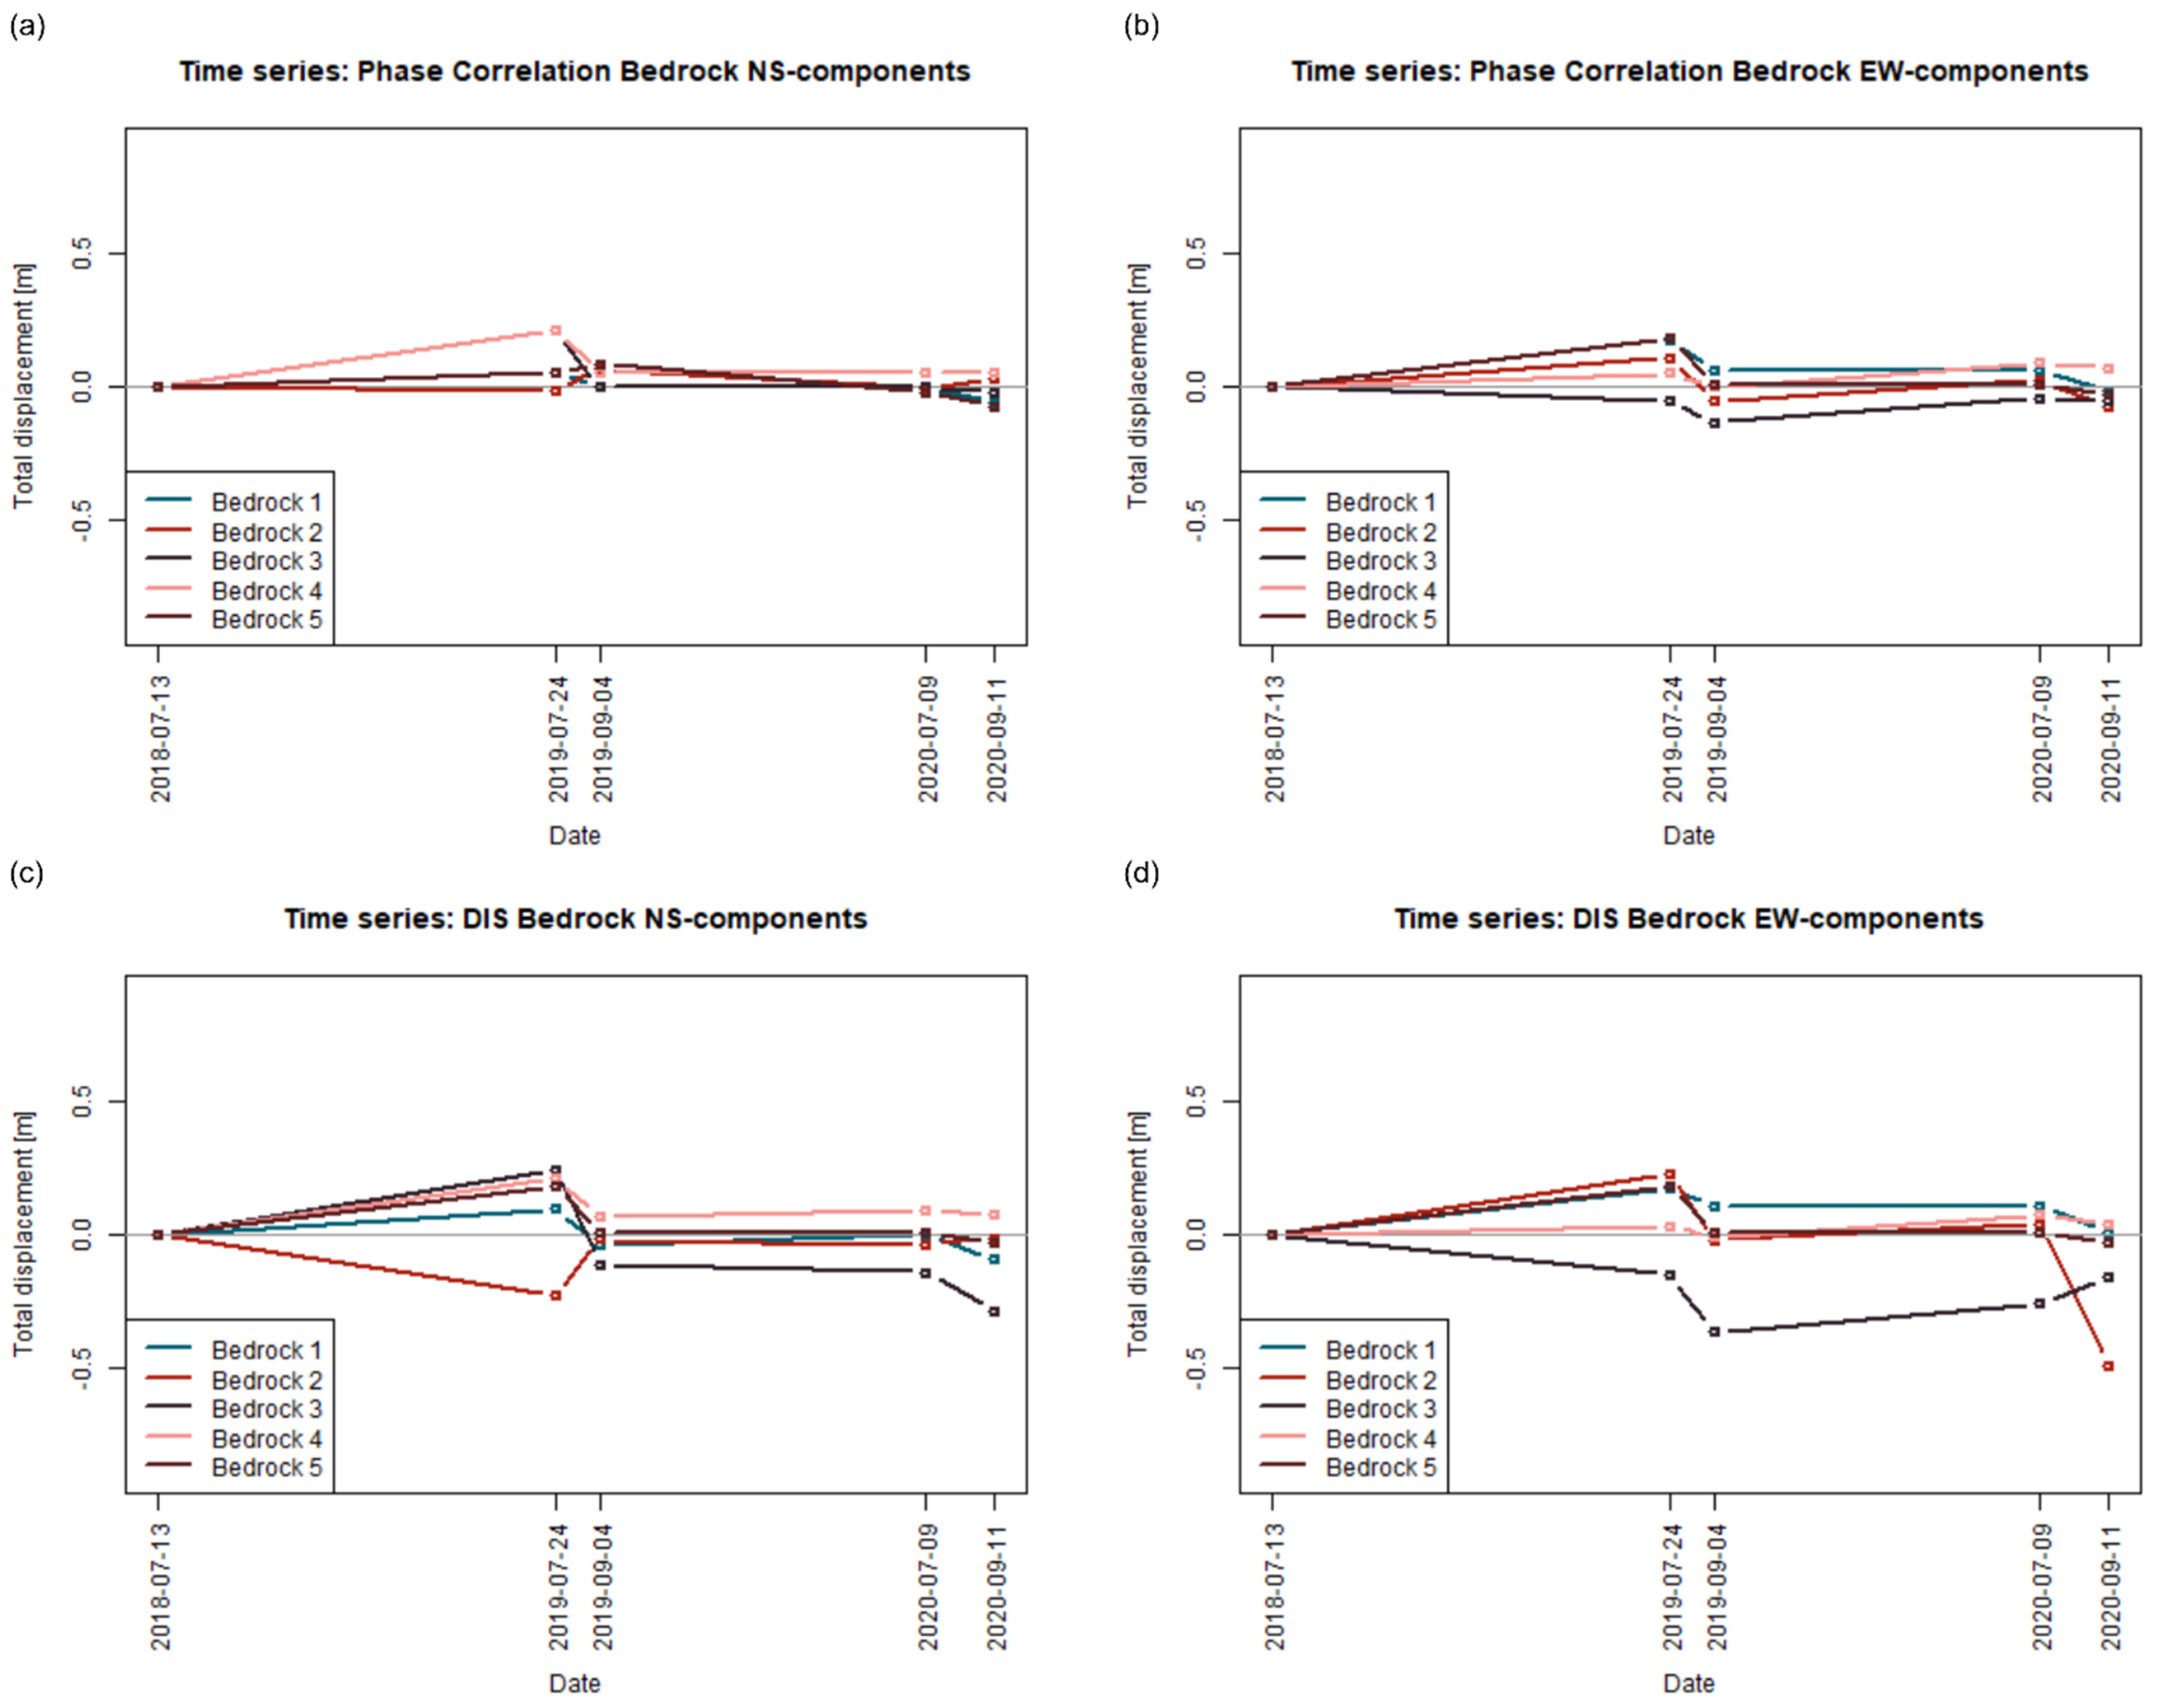
In order to estimate the quality of the algorithms, displacement curves of the stable bedrock areas 1–5 (Table 3) for all intervals are presented in Figure 4. The maximum displacement for DIS NS (c) and EW components (d) was the only outlier of −0.5 m for the last interval IV, Bedrock 2 (Figure 8b). Apart from that, the displacements for the stable bedrock ranged by ±0.3 m. By contrast, PC returned a smaller distribution around zero, with lower values of ±0.2 m for NS components (a) and ±0.3 m for EW components (b).
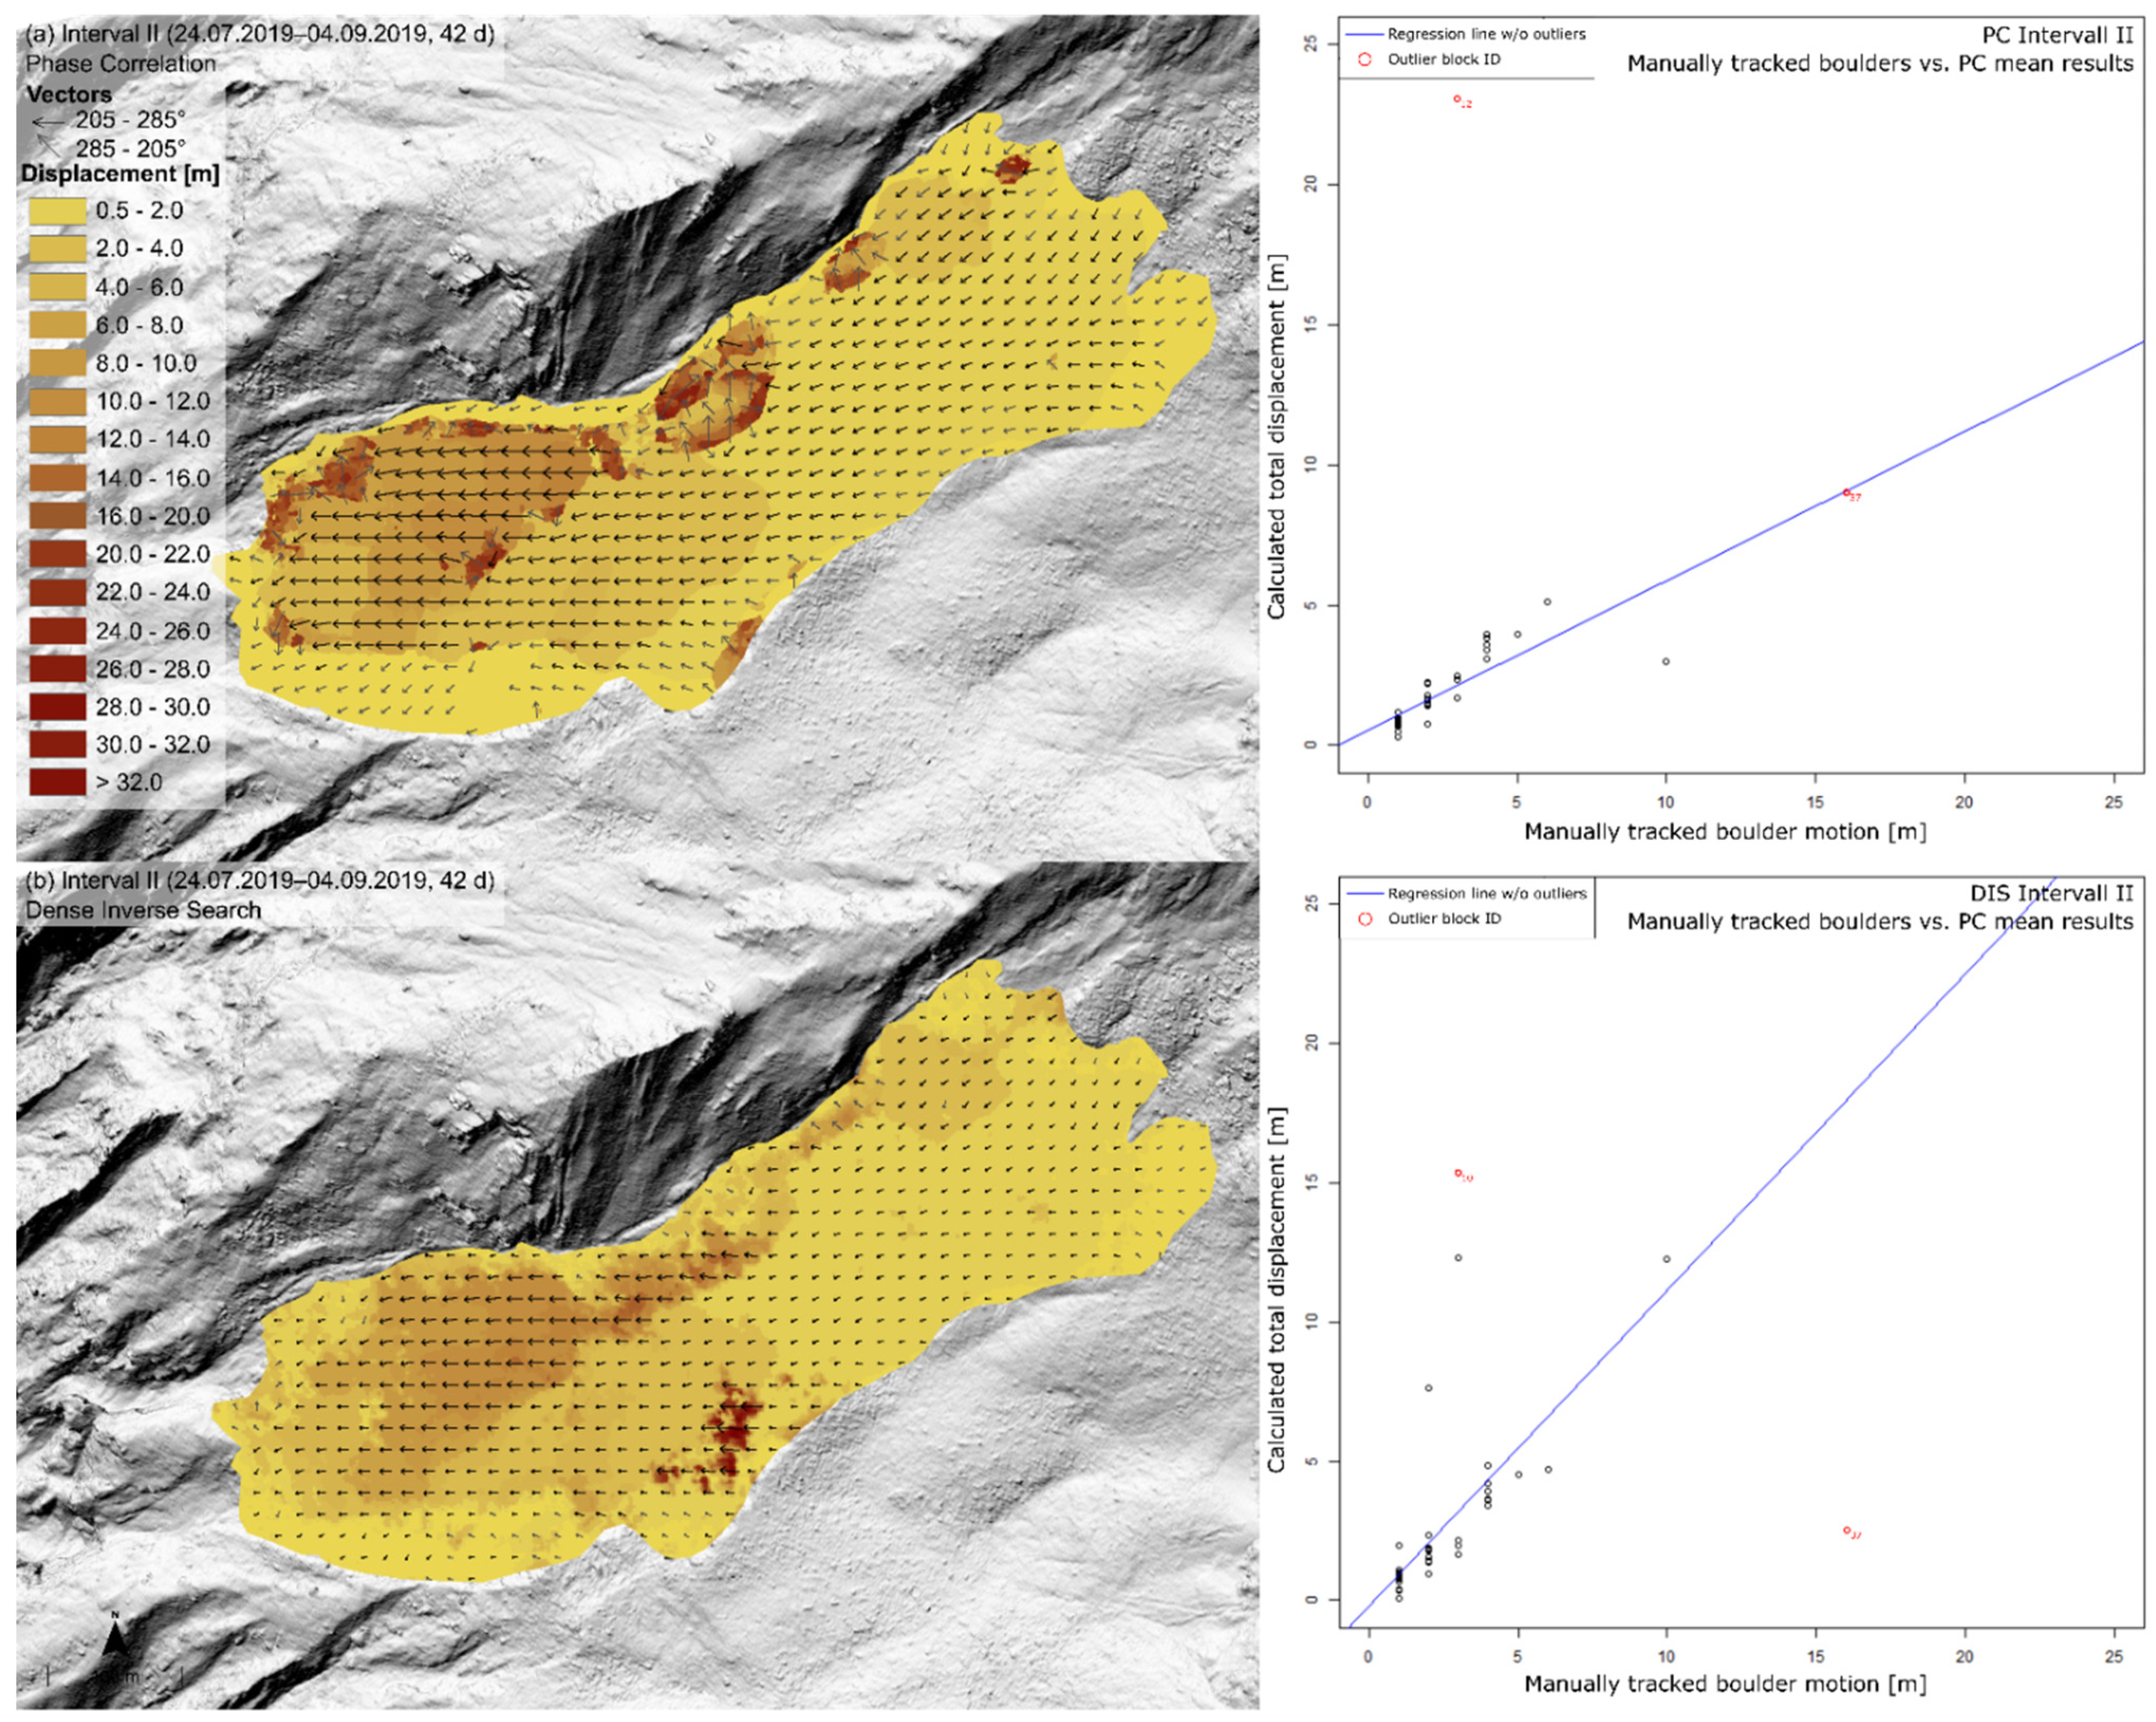
We assessed the accuracy of the total displacement calculations for both algorithms by comparing them to a mean buffer around the manually measured boulder paths for the corresponding time interval. The Mahalanobis outlier detection [64] yielded two outliers for both DIS and PC (marked in red Figure 5). We found a significant positional relationship between boulder motion and the modelled DIS mean (b = 0.49, t = 2.72, p < 0.01) and PC mean (b = 0.55, t = 2.89, p < 0.01), and determined that boulder motion accounts for 16% and 17% of variance in the data distance, respectively. After outlier removal, the variance in the data distance yielded 56% for DIS (R² = 0.5564) and 65% for PC (R² = 0.6471). The plots present results for time interval II for PC (a) and DIS (b) with the regression line after outlier removal (Figure 5). Figure 6 shows boulder trajectories for PC and DIS.
Displacement vectors indicate a smooth downslope flow direction. There are minor patches of chaotic directions for a heterogeneous displacement patch in the PC results (central north and towards the northern end) and for displacements between 0 and 0.5 m at the landslide head flowing downslope. For the same area, DIS vectors point in different directions as well as towards the northern rim of the landslide.

4.2. Total Displacement for Single Analysis

This section outlines the results based on single intervals, i.e., t n t n + 1 , twice covering an approximately one-year period (I, III) and a summer season (II, IV; see Table 1).
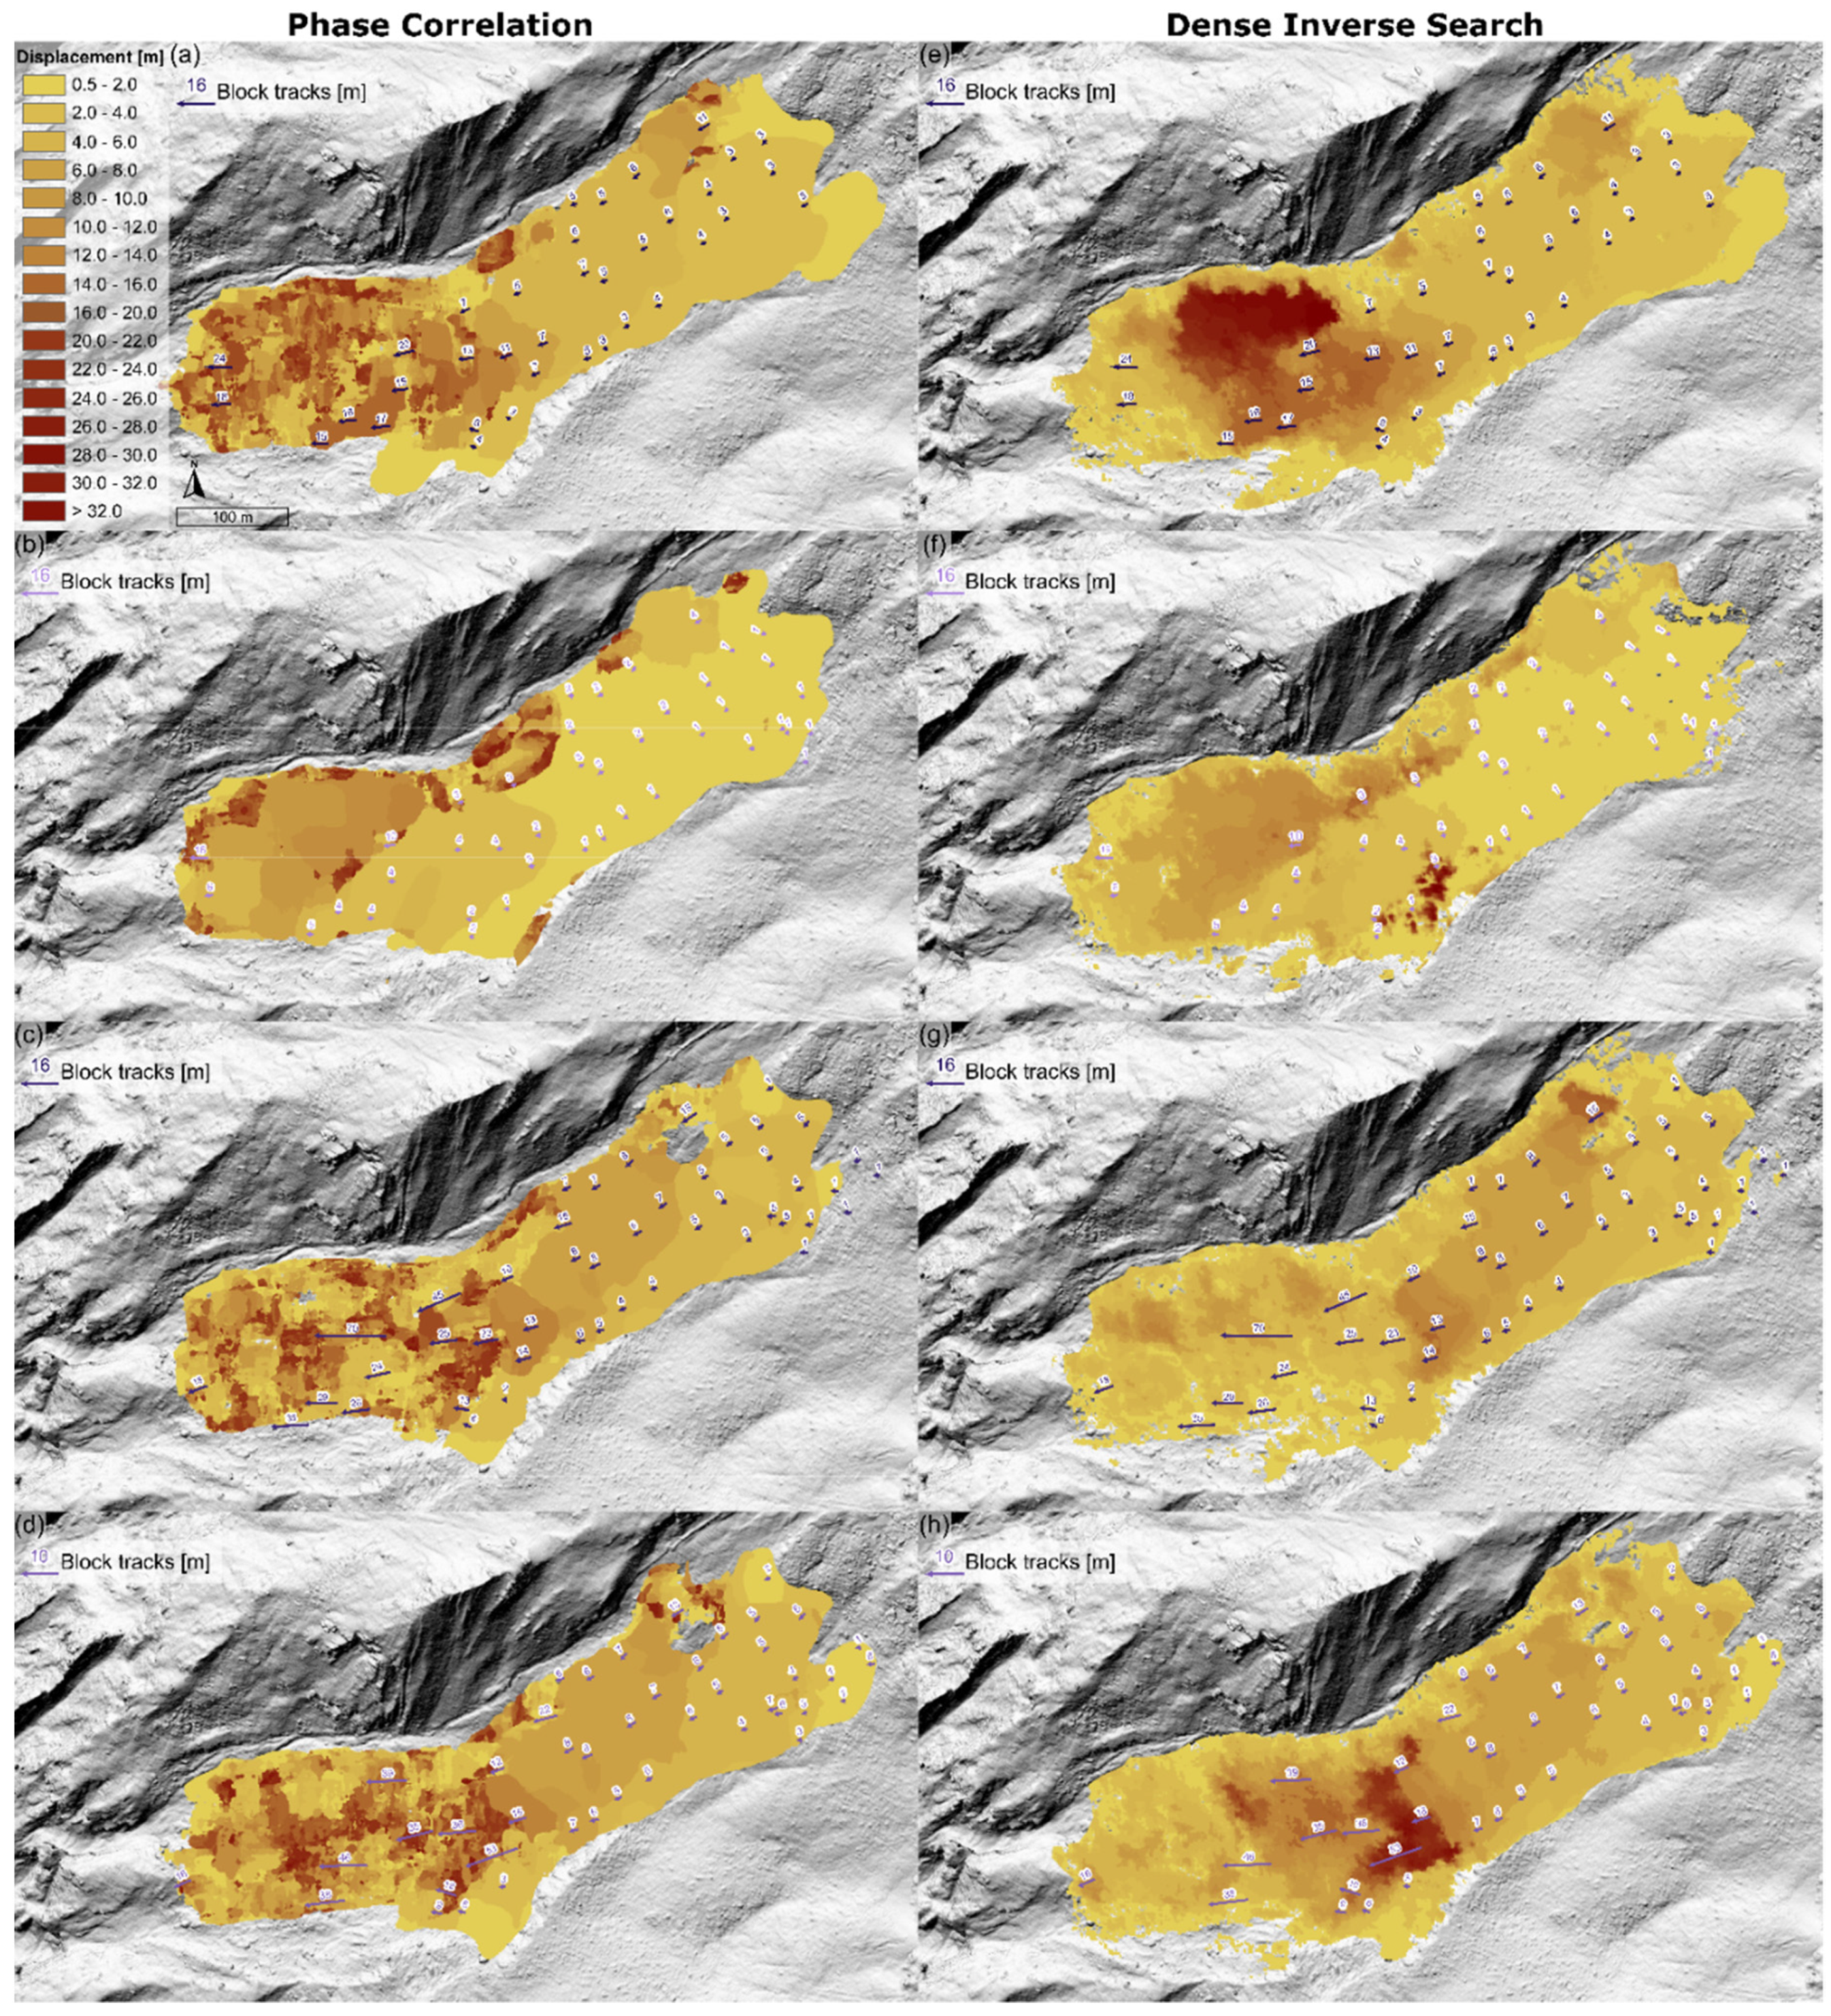
The total displacement from PC results, for all intervals I–IV (Figure 6a–d), yielded a clearly demarcated landslide body for values above 0.5 m, limited to values of about 20 m. Homogeneous areas (landslide’s rear body in the east to the centre) are replaced by a patchy, inhomogeneous area for I, III and IV. The homogeneous displacement is lowest (0.5–2 m) in II (42 d), slightly higher for I (376 d), and returns highest values (12–14 m) for both the longer and shorter intervals III (308 d) and IV (62 d). By contrast, for I, III and IV, the landslide head is less noise-affected for II, with more homogeneous patches. Comparing displacements to boulder trajectories, the values are consistent apart from the landslide’s head, with ambiguous signals as well as some 1 m trajectories not reflected in the landslide’s rear area (Figure 6b,c).
Total displacements (I–IV) derived from DIS (Figure 6e–g) lie within the process area, with patches of particularly high motion (>32 m and 22–25 m) in the northern frontal half (I) and centre (IV), respectively. Interval II reveals the lowest overall displacement, increasing towards the front. Displacements in the rear are higher for III and IV (1–8 m) than I and II. Boulder trajectories match well from the centre to the rear (I–IV), except for the foremost front of the landslide’s head (I–IV).
Comparing the two algorithms on the basis of boulder trajectories, ambiguous areas for PC return significantly lower displacements for DIS, as indicated by trajectories (23–54 m) in the centre for I, III and IV (a, c, d and e, f, h) and at the front, where DIS returns particularly low motion (3–4 m)—although boulder trajectories appeared to indicate higher displacements (6–70 m). For I, in the south of the frontal half, some minor heterogeneous patches exist for PC (a), with similar values for DIS (b), which are confirmed by boulder trajectories (15, 16 and 17 m). Except for the landslide’s head, both algorithms indicate consistent displacement values for II, with larger homogeneous areas by PC (b).

4.3. Total Displacement for Multimaster Analysis and Displacement Curves

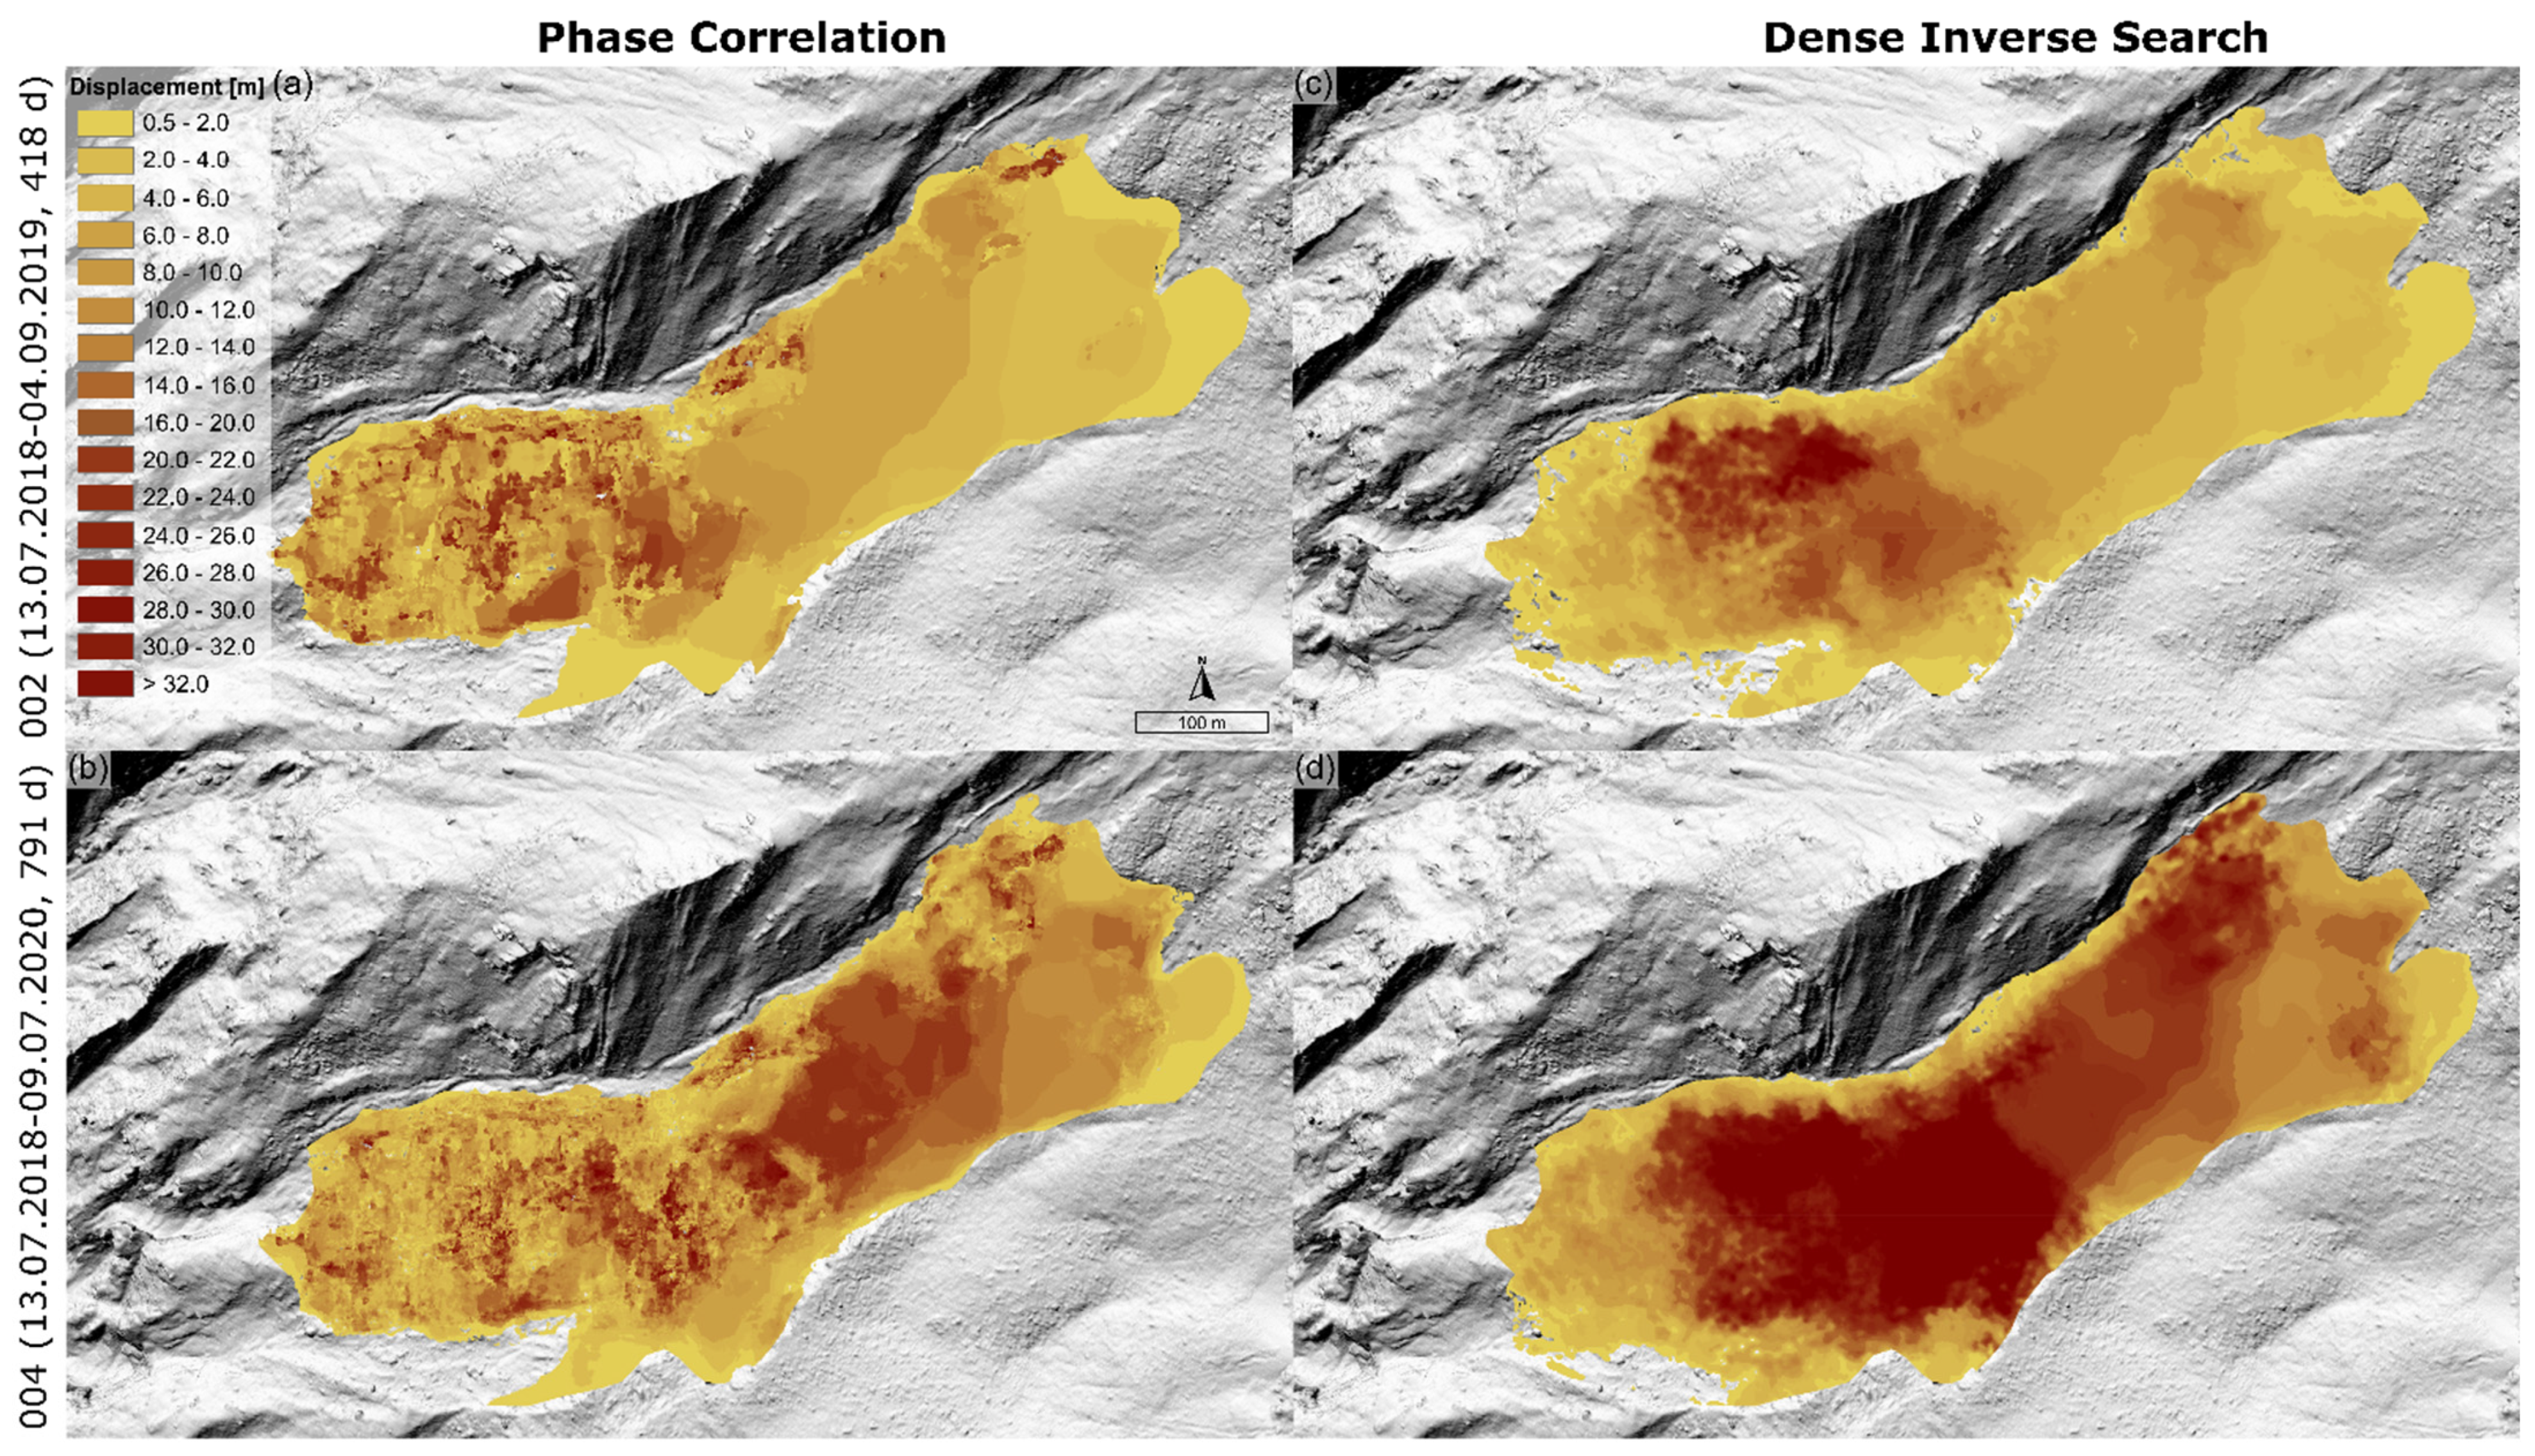
Here, the results of the multimaster approach focus on interval 002 as well as the longest final time interval 004 for algorithms PC and DIS (Figure 7). In the previous section, the first master interval 001 was described, as it is identical to the single analysis interval I. An overview of the individual image combinations for the multimaster analysis is provided in Table 1 and Table A1.
The PC multimaster displacement for 002 (a) is characterised by a large ambiguous and heterogeneous area at the landslide’s head, transitioning into a homogeneous area for the last two-thirds. Here, values increase from 0.5 in the rear to 10 m. The accumulated displacement for 004 returns values up to 23 m from the centre decreasing towards the rear. The results derived for DIS 002 reveal values up to 7 m at the landslide’s head and increase to the highest values (15–32 m) in the centre. There, for 004, both algorithms show a similar boundary, with displacements decreasing rearwards (PC, 9–2 m, DIS 12–22 m), with the highest values towards the front (>32 m) for DIS; similar to DIS single analysis results, values at the foremost landslide’s head do not exceed 10 m.
Our calculations of TS displacement curves (Figure 8) for PC (a) and DIS (b) indicate a continuous increase in displacement. PC exhibited a smooth, linear increase with similar rates for all five AOIs, apart from AOI 6, and a clear limit at approximately 20 m. For DIS, by contrast, the maximum accumulated displacement exceeds 42 m for the foremost AOI 1, followed by AOI 2 with ~40 m—both of which show the strongest increase for an additional 17–20 m (IV), with higher accumulated displacement values than PC. Generally, all AOIs increase steadily, similar to PC for I and II, with the rear AOIs (AOI 3–6) more or less identical for both algorithms (8–20 m).

4.4. Meteorological Data

Precipitation measurements during the UAS observation period 2018–2020 indicate that 2020 had the highest number of days with a daily amount of precipitation greater than 20, 30, 40 and 50 mm (Table 4). The comparison for the highest days of total precipitation shows the highest and 10th-highest amount in 2020 at 82.0 and 50.0 mm, respectively, although the number of days at 50.0 mm are lower than the highest records (Table 5). The year 2020, with highest amount of total precipitation, is followed by the second-highest, which was the 2014 debris flow event-year of 76.1 mm.

5. Discussion

We have calculated time series displacements for complementary image-matching algorithms PC and DIS for a three-year long set of UAS orthophotos. We derived displacements for single time intervals (Figure 6) as well as a combined reference-secondary image approach (Figure 7), aka multimaster analysis, in order to investigate the complex behaviour of the Sattelkar, with its heterogeneous motion fields with low to medium velocities [57,59,60]. In so doing, we were able to derive displacement curves (Figure 8), interpret our observations in relation to meteorological data (Table 4 and Table 5) and confirm the results in our accuracy assessment on the basis of traceable boulder trajectories (Figure 5 and Figure 6), as well as stable bedrock displacement curves (Table 4 and Table 5).
In answer to research question (1) we determined that, for the most part, the displacement results show that DIS is an applicable method to capture large displacements—even for a landslide with complex behaviour.
For research question (2), given a very heterogeneous landslide behaviour, the method allows us to investigate both slow and moderate velocities, which we can in large part support by manually measuring boulder trajectories and statistical observations (Figure 6). For a single interval II, apart from two outliers, DIS returns valid ground motion values (Figure 5). Though derived displacements for the process area from the centre to the rear are well represented and confirmed by the boulder trajectories, the foremost area of the landslide’s head is significantly underestimated by a factor of four (I, 18–24 m boulder trajectories) and a factor of five to ten (III, IV). This area leads directly over the cirque threshold into the steep channel, and from field observations we know that surface processes are particularly dynamic and complex, including tumbling boulders changing their surface appearance by turning. Nevertheless, DIS shows its capability to reveal the ongoing process of the dissolving rock glacier, visible in IV (Figure 6h), and less pronounced in III (g) due to the sharp difference in ground motion. For optical flow to work reliably, the brightness consistency has to be valid, with illumination changes resulting in motion. Until now, the use of optical flow has been restricted to ground motion observations of small displacements, little noise and difference in illumination [47].
However, our results confirm research question (3) that optical flow, using the improved approach of DIS [48] is robust enough for the orthophoto dataset of our high-alpine steep study site to cope with changing and unfavourable illumination conditions. This is supported by displacement vectors calculated from NS and EW displacements, which to a large degree reveal a correct flow direction.
With regards to research question (4), comparing the results of DIS to those of PC, DIS has been shown to overcome the correlation limits of the PC algorithm. Ambiguous signals of PC results come from noise resulting from decorrelation as the detection limit; hence, the maximum possible correlation for the amount of displacement and/or number of surface changes is reached. The results show that for our high resolution in the UAS dataset of 0.16 m with temporal baselines the limitation is reached (I, III, IV) [14,16]. In essence, matching failed due to massive changes in pixel values. Our field observations provide evidence of the deformation of rock masses with strong surface alterations due to rotational block behaviour and the high mobility of rock material, which are thus likely to be responsible for this decorrelation. Similar observations on the matching limitations and other reasons leading to decorrelation have been confirmed by others [14,42,52]. We decided to keep these noise-affected areas to be able to differentiate the results. Consequently, while towards the front PC decorrelates and DIS seems to be underrepresented, from the distinctive boundary in the landslide’s centre towards the rear, both algorithms return similar displacement values, as confirmed by the boulder paths (I, III and IV).
These boulder trajectories are reliable and support the correctly derived high displacement values for interval III (308 d), and in particular, the higher ones for interval IV—although shorter in duration covering the summer period (62 d). This displacement increase can be explained as a sensitive reaction of the debris due to the heavy precipitation events in 2020. The year 2020 had by far the highest number of days with daily precipitation, followed by the 2014 debris flow event-year. In the summer interval IV (8 July 2020–8 September 2020), the two highest days of total precipitation were measured (see Table 4 and Table 5: highest, 82.9 mm, 29 August 2020; 10th, 50.0 mm, 3 August 2020). We assume that this heavy rainfall event at the end of August indicates how the debris reacts to hydrological influences with a massive acceleration [65,66]. It seems unlikely that the 50.0 mm event significantly contributed to this acceleration, as in the previous year the ninth-highest measure was recorded and showed no signs of acceleration.
Apart from single interval calculations, we further performed a multimaster approach and compared the results of both PC and DIS algorithms for intervals 002 and 004 (Figure 7). The previously discussed total displacement distribution for the single intervals is more pronounced due to the summing up of all possible image interval combinations. While 002 reveals a very similar pattern for the rear of the landslide mass, the front is again partitioned beginning at the centre, leading to decorrelation for PC (Figure 7a) and high displacements between 20 and 32 m for DIS. However, these values becomes unrealistically low towards the landslide’s head (Figure 7). Displacement values reach their maximum for PC of 20 m (c), whereas DIS exceeds 32 m (d), in these areas. Single analysis interval I (Figure 6b) and multimaster interval 002 (Figure 7b) reveal an area of particularly high motion at the northern rim towards the landslide’s head. This high motion can be confirmed by field observations of severe, high dynamic surface changes—a behaviour visible in the GIFs (Figures S2–S4).
The limitations of ground motion are confirmed by calculated displacement curves for PC and DIS (Figure 8). Where PC has a definite limit of 20 m for total displacement detection (a), there is no upper limit for DIS. Generally, displacement curves for both PC and DIS indicate a clear acceleration behaviour—in particular for the heavy rainfall season 2020. The explanatory power of DIS to derive ground motion and displacement curves is high.
We applied the approach of displacement curve calculations to areas outside of the landslide process in order to estimate the quality of the algorithm, as there should be zero to limited displacement. The NS and EW components for PC show values very close to zero (±0.2 and ±0.3 m), and DIS never exceeds ± 0.5 m, indicating the high accuracy and reliability of our results.
Our results demonstrated the possibilities and limitations of the optical flow dense inverse search algorithm. Backed by the comparison to the well-known and robust phase correlation algorithm, we find that DIS is a more sensitive, less rigid and more flexible algorithm. While computationally very efficient, both small and large displacements can be detected without upper limitations. We can confirm the results from the DIS algorithm and for the first time, image registration methods reflect motions we know through our field observations (area of high motion at the northern rim towards the front, see Figure 6e, Figure 7c and Figure S3; and at the front of the dissolving rock glacier, see Figure 6g,h).
However, the results must be interpreted with caution as there is a clear underrepresentation for the landslide’s head. Areas of too-high surface dynamics and/or displacements lead to a drastic change in pixel values. Therefore, PC with an upper detection limit of 20 m fails, returning areas of decorrelated noise, whereas DIS still returns some displacement values, but they are too low. These returned values imply a correct signal, but based on the comparison to PC we know that DIS could lead to underrepresented displacements, which is why the results have to be carefully interpreted. Thus, areas of decorrelation can be interpreted as a valid limit of PC with no over- or underestimation, as with DIS, and a higher robustness towards illumination changes.

6. Conclusions

This study evaluated the potential of the dense inverse search (DIS) algorithm to derive ground motions to assess a high-alpine, complex landslide. Our research has made a substantial contribution, as for the first-time, optical flow was applied to study landslide behaviour. We tested the algorithm on time interval combinations of single intervals as well as multimaster pairs of reference-secondary images based on five high accuracy UAS orthophotos of 0.16 m acquired between 2018 and 2020.
We compared total displacement results of DIS to those of the well-known phase correlation algorithm (PC), both of which are implemented in the software IRIS, with regard to trajectories of traceable boulders. These results were contrasted to trajectories and confirm a high goodness of fit. In an accuracy assessment we evaluated our results by deriving NS and EW displacements for five stable bedrock areas, ranging between ±0.2 and ±0.3 m. Our findings show that DIS is applicable to determine ground motions of both slow and moderate velocities, as it detected displacements from 0.5 to 42 m for our observation intervals. This was supported by boulder trajectories and correlated, heterogeneous displacements derived from PC. DIS further overcame the correlation limits of PC, which occurred at about 20 m, and we obtained decorrelation even with a larger template. It is likely that for both severe surface changes and very high displacements, DIS underestimated values at the landslide’s head, while PC decorrelated due to excessive surface changes. The findings are based on our experiments and are confirmed by our own field observations, as well as published descriptions of geomorphological processes [59,60,61]. In addition, we calculated displacement curves, which indicated acceleration and high ground motions—thus confirming the displacement increase in summer 2020, which can be explained by a high rainfall event.
Apart from the complex, high-alpine study site investigated here, DIS could be profitably employed for landslide types from pre-alpine to alpine sites. DIS could also be of high value for earthquake and glacier studies, as it is able capture displacement rates exceeding the detection capability of DInSAR. Nevertheless, future studies should focus on the applicability of complementary optical data from other sensors, improving the accuracy as well as the robustness for real world illumination conditions to confirm the detection capability of DIS for landslide displacement. Further research is also needed to exploit the potential of image-matching techniques for an improved understanding of landslide kinematics ranging from single block sliding to complex flow-like behaviour, as well as early warnings for landslides.

Supplementary Materials

The following supporting information can be downloaded at: https://www.mdpi.com/article/10.3390/rs14030455/s1, Figure S1: An example of optical flow for estimating mouth motion. Two consecutive images show regions of a mouth in motion (a,b) and the estimated flow field using dense optical flow method (c) adapted from reference [67]. Figure S2: GIF showing UAS multi-hillshades [0.16 m] of 13 July 2018; 24 July 2019; 4 September 2019; 8 July 2020; 8 September 2020. Figure S3: GIF showing DIS derived total displacement (transparent) superimposed on UAS multi-hillshades [0.16 m] for the corresponding time interval (I: 13 July 2018–24 July 2019, 376 d; II: 24 July 2019–4 September 2019, 42 d; III: 4 September 2019–8 July 2020, 308 d; IV: 8 July 2020–8 September 2020, 62 d). Figure S4: GIF showing PC derived total displacement (transparent) superimposed on UAS multi-hillshades [0.16 m] for the corresponding time interval (I: 13 July 2018–24 July 2019, 376 d; II: 24 July 2019–4 September 2019, 42 d; III: 4 September 2019–8 July 2020, 308 d; IV: 8 July 2020–8 September 2020, 62 d).

Author Contributions

This study was conceptualised by D.H. together with M.K. (Markus Keuschnig), M.G. and P.M., who supervised this work. The two algorithms were implemented within the software IRIS by M.G.; D.H. analysed the data, explored the possibilities and limitations of the method and the software, and discussed first stages with M.G.; M.G. and M.K. (Markus Keuschnig) discussed the outcomes of final results and their validation with D.H.; D.H. drafted the manuscript, which was revised by all authors, M.K. (Michael Krautblatter), M.G. and P.M. The software was provided by NHAZCA S.r.l., Rome. All authors have read and agreed to the published version of the manuscript.

Funding

This research was funded by a scholarship of the Hanns–Seidel Foundation and the AlpSenseRely project, which is funded by the Bavarian State Ministry of the Environment and Consumer Protection (StMUV).

Informed Consent Statement

Not applicable.

Acknowledgments

The authors are grateful for the software support from NHAZCA S.r.l., a spin-off company of La Sapienza, University of Rome and GeoResearch, Puch, Austria. We thank Robert Delleske for contacting UAS flight campaigns and deriving the data, as well as Riccardo Scandroglio and Stephen Starck for proof-reading.

Conflicts of Interest

The authors declare no conflict of interest.

Appendix A

In order to test IRIS, please visit https://www.photomonitoring.com/iris/ to request a free trial of the software via the contact form. Last access 12 January 2022.
Table A1. Settings for DIS single analysis.
Finest ScalePatch SizePatch StrideGradient Descending IterationsUse Mean NormalisationUse Spatial PropagationVar. Refinement AlphaVar. Refinement DeltaVar. Refinement GammaVar. Refinement Iterations
Interval I08325xx205105
Interval II08325xx205105
Interval III016230xx1551010
Interval IV08325xx1551010
Interval 1–308325xx1551010
Interval 1–408325xx205105
Interval 2–408325xx205105
Interval 2–508325xx205105

References

  1. Huggel, C.; Clague, J.; Korup, O. Is climate change responsible for changing landslide activity in high mountains? Earth Surf. Processes Landf. 2012, 37, 77–91. [Google Scholar] [CrossRef]
  2. Lacroix, P.; Araujo, G.; Hollingsworth, J.; Taipe, E. Self-Entrainment Motion of a Slow-Moving Landslide Inferred from Landsat-8 Time Series. J. Geophys. Res. Earth Surf. 2019, 124, 1201–1216. [Google Scholar] [CrossRef]
  3. Scaioni, M.; Longoni, L.; Melillo, V.; Papini, M. Remote Sensing for Landslide Investigations: An Overview of Recent Achievements and Perspectives. Remote Sens. 2014, 6, 9600–9652. [Google Scholar] [CrossRef] [Green Version]
  4. Moretto, S.; Bozzano, F.; Esposito, C.; Mazzanti, P.; Rocca, A. Assessment of Landslide Pre-Failure Monitoring and Forecasting Using Satellite SAR Interferometry. Geosciences 2017, 7, 36. [Google Scholar] [CrossRef] [Green Version]
  5. Travelletti, J.; Delacourt, C.; Allemand, P.; Malet, J.-P.; Schmittbuhl, J.; Toussaint, R.; Bastard, M. Correlation of multi-temporal ground-based optical images for landslide monitoring: Application, potential and limitations. J. Photogramm. Remote Sens. 2012, 70, 39–55. [Google Scholar] [CrossRef] [Green Version]
  6. Romeo, S.; Cosentino, A.; Giani, F.; Mastrantoni, G.; Mazzanti, P. Combining Ground Based Remote Sensing Tools for Rockfalls Assessment and Monitoring: The Poggio Baldi Landslide Natural Laboratory. Sensors 2021, 21, 2632. [Google Scholar] [CrossRef] [PubMed]
  7. Voordendag, A.; Goger, B.; Klug, C.; Prinz, R.; Rutzinger, M.; Kaser, G. Automated and permanent long-range terrestrial laser scanning in a high mountain environment: Setup and first results. ISPRS Ann. Photogramm. Remote Sens. Spat. Inf. Sci. 2021, 2, 153–160. [Google Scholar] [CrossRef]
  8. Scherler, D.; Leprince, S.; Strecker, M. Glacier-surface velocities in alpine terrain from optical satellite imagery—Accuracy improvement and quality assessment. Remote Sens. Environ. 2008, 112, 3806–3819. [Google Scholar] [CrossRef]
  9. Heid, T.; Kääb, A. Evaluation of existing image matching methods for deriving glacier surface displacements globally from optical satellite imagery. Remote Sens. Environ. 2012, 118, 339–355. [Google Scholar] [CrossRef]
  10. Nagy, T.; Andreassen, L.M.; Duller, R.A.; Gonzalez, P.J. SenDiT: The Sentinel-2 Displacement Toolbox with Application to Glacier Surface Velocities. Remote Sens. 2019, 11, 1151. [Google Scholar] [CrossRef] [Green Version]
  11. Leprince, S.; Barbot, S.; Ayoub, F.; Avouac, J.-P. Automatic and Precise Orthorectification, Coregistration, and Subpixel Correlation of Satellite Images, Application to Ground Deformation Measurements. IEEE Trans. Geosci. Remote Sens. 2007, 45, 1529–1558. [Google Scholar] [CrossRef] [Green Version]
  12. Ayoub, F.; Leprince, S.; Avouac, J.-P. Co-registration and correlation of aerial photographs for ground deformation measurements. ISPRS J. Photogramm. Remote Sens. 2009, 64, 551–560. [Google Scholar] [CrossRef]
  13. Kääb, A.; Altena, B.; Mascaro, J. Coseismic displacements of the 14 November 2016 Mw 7.8 Kaikoura, New Zealand, earthquake using the Planet optical cubesat constellation. Nat. Hazards Earth Syst. Sci. 2017, 17, 627–639. [Google Scholar] [CrossRef] [Green Version]
  14. Leprince, S.; Berthier, E.; Ayoub, F.; Delacourt, C.; Avouac, J.-P. Monitoring Earth Surface Dynamics with Optical Imagery. Eos 2008, 89, 1–12. [Google Scholar] [CrossRef] [Green Version]
  15. Michel, S.; Avouac, J.-P.; Ayoub, F.; Ewing, R.C.; Vriend, N.; Heggy, E. Comparing dune migration measured from remote sensing with sand flux prediction based on weather data and model, a test case in Qatar. Earth Planet. Sci. Lett. 2018, 497, 12–21. [Google Scholar] [CrossRef] [Green Version]
  16. Debella-Gilo, M.; Kääb, A. Sub-pixel precision image matching for measuring surface displacements on mass movements using normalized cross-correlation. Remote Sens. Environ. 2011, 115, 130–142. [Google Scholar] [CrossRef] [Green Version]
  17. Lucieer, A.; de Jong, S.; Turner, D. Mapping landslide displacements using Structure from Motion (SfM) and image correlation of multi-temporal UAV photography. Prog. Phys. Geogr. 2014, 38, 97–116. [Google Scholar] [CrossRef]
  18. Stumpf, A.; Malet, J.-P.; Allemand, P.; Ulrich, P. Surface reconstruction and landslide displacement measurements with Pléiades satellite images. ISPRS J. Photogramm. Remote Sens. 2014, 95, 1–12. [Google Scholar] [CrossRef]
  19. Turner, D.; Lucieer, A.; de Jong, S. Time Series Analysis of Landslide Dynamics Using an Unmanned Aerial Vehicle (UAV). Remote Sens. 2015, 7, 1736–1757. [Google Scholar] [CrossRef] [Green Version]
  20. Bickel, V.; Manconi, A.; Amann, F. Quantitative Assessment of Digital Image Correlation Methods to Detect and Monitor Surface Displacements of Large Slope Instabilities. Remote Sens. 2018, 10, 865. [Google Scholar] [CrossRef] [Green Version]
  21. Caporossi, P.; Mazzanti, P.; Bozzano, F. Digital Image Correlation (DIC) Analysis of the 3 December 2013 Montescaglioso Landslide (Basilicata, Southern Italy): Results from a Multi-Dataset Investigation. ISPRS Int. J. Geo-Inf. 2018, 7, 372. [Google Scholar] [CrossRef] [Green Version]
  22. Lacroix, P.; Bièvre, G.; Pathier, E.; Kniess, U.; Jongmans, D. Use of Sentinel-2 images for the detection of precursory motions before landslide failures. Remote Sens. Environ. 2018, 215, 507–516. [Google Scholar] [CrossRef]
  23. Mazzanti, P.; Caporossi, P.; Muzi, R. Sliding Time Master Digital Image Correlation Analyses of CubeSat Images for landslide Monitoring: The Rattlesnake Hills Landslide (USA). Remote Sens. 2020, 12, 592. [Google Scholar] [CrossRef] [Green Version]
  24. Mulas, M.; Ciccarese, G.; Truffelli, G.; Corsini, A. Integration of Digital Image Correlation of Sentinel-2 Data and Continuous GNSS for Long-Term Slope Movements Monitoring in Moderately Rapid Landslides. Remote Sens. 2020, 12, 2605. [Google Scholar] [CrossRef]
  25. Hermle, D.; Keuschnig, M.; Hartmeyer, I.; Delleske, R.; Krautblatter, M. Timely prediction potential of landslide early warning systems with multispectral remote sensing: A conceptual approach tested in the Sattelkar, Austria. Nat. Hazards Earth Syst. Sci. 2021, 21, 2753–2772. [Google Scholar] [CrossRef]
  26. Zitová, B.; Flusser, J. Image registration methods: A survey. Image Vis. Comput. 2003, 21, 977–1000. [Google Scholar] [CrossRef] [Green Version]
  27. Smith, M.W.; Carrivick, J.L.; Quincey, D.J. Structure from motion photogrammetry in physical geography. Prog. Phys. Geogr. Earth Environ. 2016, 40, 247–275. [Google Scholar] [CrossRef] [Green Version]
  28. Scheffler, D.; Hollstein, A.; Diedrich, H.; Segl, K.; Hostert, P. AROSICS: An Automated and Robust Open-Source Image Co-Registration Software for Multi-Sensor Satellite Data. Remote Sens. 2017, 9, 676. [Google Scholar] [CrossRef] [Green Version]
  29. Dawn, S.; Vikas, S.; Sharma, B. Remote Sensing Image Registration Techniques: A Survey. In Image and Signal Processing, Proceedings of the 4th International Conference, ICISP 2010, Trois-Rivières, QC, Canada, 30 June—2 July 2010; Elmoataz, A., Lezoray, O., Nouboud, F., Mammass, D., Meunier, J., Eds.; Springer: Berlin, Germany, 2010; pp. 103–112. ISBN 3-642-13680-X. [Google Scholar]
  30. Bracewell, R.N. The Fourier Transform and Its Applications; McGraw-Hill: New York, NY, USA, 1965. [Google Scholar]
  31. Foroosh, H.; Zerubia, J.B.; Berthod, M. Extension of phase correlation to subpixel registration. IEEE Trans. Image Process. 2002, 11, 188–200. [Google Scholar] [CrossRef] [PubMed] [Green Version]
  32. Mohammed, A.S.; Helmi, A.K.; Fkirin, M.A.; Badwai, S.M. Subpixel Accuracy Analysis of Phase Correlation Shift Measurement Methods Applied to Satellite Imagery. Int. J. Adv. Comput. Sci. Appl. 2012, 3, 202–206. [Google Scholar] [CrossRef] [Green Version]
  33. Tong, X.; Ye, Z.; Xu, Y.; Gao, S.; Xie, H.; Du, Q.; Liu, S.; Xu, X.; Liu, S.; Luan, K.; et al. Image Registration with Fourier-Based Image Correlation: A Comprehensive Review of Developments and Applications. IEEE J. Sel. Top. Appl. Earth Obs. Remote Sens. 2019, 12, 4062–4081. [Google Scholar] [CrossRef]
  34. Lucas, B.; Kanade, T. An iterative image registration technique with an application to stereo vision. In Proceedings of the Seventh International Joint Conference on Artificial Intelligence, Vancouver, BC, Canada, 24–28 August 1981; pp. 674–679. [Google Scholar]
  35. Rosenfeld, A.; Vanderbrug, G.J. Coarse-fine template matching. IEEE Trans. Syst. Man Cybern. 1977, 7, 104–107. [Google Scholar]
  36. Scambos, T.A.; Dutkiewicz, M.J.; Wilson, J.C.; Bindschadler, R.A. Application of image cross-correlation to the measurement of glacier velocity using satellite image data. Remote Sens. Environ. 1992, 42, 177–186. [Google Scholar] [CrossRef]
  37. Fahnestock, M.; Scambos, T.; Moon, T.; Gardner, A.; Haran, T.M.; Klinger, M. Rapid large-area mapping of ice flow using Landsat 8. Remote Sens. Environ. 2016, 185, 84–94. [Google Scholar] [CrossRef] [Green Version]
  38. Rosu, A.-M.; Pierrot-Deseilligny, M.; Delorme, A.; Binet, R.; Klinger, Y. Measurement of ground displacement from optical satellite image correlation using the free open-source software MicMac. ISPRS J. Photogramm. Remote Sens. 2015, 100, 48–59. [Google Scholar] [CrossRef]
  39. Kääb, A.; Vollmer, M. Surface Geometry, Thickness Changes and Flow Fields on Creeping Mountain Permafrost: Automatic Extraction by Digital Image Analysis. Permafr. Periglac. Processes 2000, 11, 315–326. [Google Scholar] [CrossRef] [Green Version]
  40. Schwalbe, E.; Maas, H.-G. The determination of high-resolution spatio-temporal glacier motion fields from time-lapse sequences. Earth Surf. Dynam. 2017, 5, 861–879. [Google Scholar] [CrossRef] [Green Version]
  41. Delacourt, C.; Allemand, P.; Berthier, E.; Raucoules, D.; Casson, B.; Grandjean, P.; Pambrun, C.; Varel, E. Remote-sensing techniques for analysing landslide kinematics: A review. Bull. Soc. Geol. Fr. 2007, 178, 89–100. [Google Scholar] [CrossRef]
  42. Stumpf, A.; Malet, J.-P.; Puissant, A.; Travelletti, J. Monitoring of Earth Surface Motion and Geomorphologic Processes by Optical Image Correlation: Chapter 5. In Land Surface Remote Sensing: Environment and Risks; Baghdadi, N., Zribi, F.M., Eds.; ISTE Press—Elsevier: Amsterdam, The Netherlands, 2016; pp. 147–190. ISBN 9781785481055. [Google Scholar]
  43. Fortun, D.; Bouthemy, P.; Kervrann, C. Optical flow modeling and computation: A survey. Comput. Vis. Image Underst. 2015, 134, 1–26. [Google Scholar] [CrossRef] [Green Version]
  44. Horn, B.K.; Schunck, B.G. Determining optical flow. Artif. Intell. 1981, 17, 185–203. [Google Scholar] [CrossRef] [Green Version]
  45. Baker, S.; Scharstein, D.; Lewis, J.P.; Roth, S.; Black, M.J.; Szeliski, R. A Database and Evaluation Methodology for Optical Flow. Int. J. Comput. Vis. 2011, 92, 1–31. [Google Scholar] [CrossRef] [Green Version]
  46. Vogel, C.; Bauder, A.; Schindler, K. Optical flow for glacier motion estimation. ISPRS Ann. Photogramm. Remote Sens. Spat. Inf. Sci. 2012, I-3, 359–365. [Google Scholar] [CrossRef] [Green Version]
  47. Altena, B.; Kääb, A. Weekly Glacier Flow Estimation from Dense Satellite Time Series Using Adapted Optical Flow Technology. Front. Earth Sci. 2017, 5, 53. [Google Scholar] [CrossRef] [Green Version]
  48. Kroeger, T.; Timofte, R.; Dai, D.; van Gool, L. Fast Optical Flow Using Dense Inverse Search. In Computer Vision—ECCV 2016, Lecture Notes in Computer Science, Proceedings of the European Conference on Computer Vision, Amsterdam, The Netherlands, 11–14 October 2016; Leibe, B., Matas, J., Sebe, N., Welling, M., Eds.; Springer: Cham, Switzerland, 2016; pp. 471–488. ISBN 978-3-319-46492-3. [Google Scholar]
  49. Baker, S.; Matthews, I. Equivalence and efficiency of image alignment algorithms. In Proceedings of the 2001 IEEE Computer Society Conference on Computer Vision and Pattern Recognition, CVPR, Kauai, HI, USA, 8–14 December 2001; pp. 1–8. [Google Scholar]
  50. Baker, S.; Matthews, I. Lucas-Kanade 20 Years On: A Unifying Framework. Int. J. Comput. Vis. 2004, 56, 221–255. [Google Scholar] [CrossRef]
  51. Brox, T.; Bregler, C.; Malik, J. Large displacement optical flow. In Proceedings of the IEEE Conference on Computer Vision, Miami, FL, USA, 20–25 June 2009; pp. 41–48, ISBN 1063-6919. [Google Scholar]
  52. Plank, S.; Krautblatter, M.; Thuro, K. Feasibility Assessment of Landslide Monitoring by Means of SAR Interferometry: A Case Study in the Ötztal Alps, Austria. In Engineering Geology for Society and Territory; Lollino, G., Giordan, D., Crosta, G.B., Corominas, J., Azzam, R., Wasowski, J., Sciarra, N., Eds.; Springer International Publishing: Cham, Switzerland, 2015; Volume 2, pp. 375–378. ISBN 978-3-319-09056-6. [Google Scholar]
  53. Moretto, S.; Bozzano, F.; Esposito, C.; Mazzanti, P. Lesson learned from the pre-collapse time series of displacement of the Preonzo landslide (Switzerland). Rend. Online Soc. Geol. Ital. 2016, 41, 247–250. [Google Scholar] [CrossRef]
  54. Sudmanns, M.; Tiede, D.; Augustin, H.; Lang, S. Assessing global Sentinel-2 coverage dynamics and data availability for operational Earth observation (EO) applications using the EO-Compass. Int. J. Digit. Earth 2019, 768–784. [Google Scholar] [CrossRef] [Green Version]
  55. Clapuyt, F.; Vanacker, V.; van Oost, K. Reproducibility of UAV-based earth topography reconstructions based on Structure-from-Motion algorithms. Geomorphology 2016, 260, 4–15. [Google Scholar] [CrossRef]
  56. Peppa, M.V.; Mills, J.P.; Moore, P.; Miller, P.E.; Chambers, J.E. Brief communication: Landslide motion from cross correlation of UAV-derived morphological attributes. Nat. Hazards Earth Syst. Sci. 2017, 17, 2143–2150. [Google Scholar] [CrossRef] [Green Version]
  57. Hungr, O.; Leroueil, S.; Picarelli, L. The Varnes classification of landslide types, an update. Landslides 2014, 11, 167–194. [Google Scholar] [CrossRef]
  58. Barsi, Á.; Kugler, Z.; László, I.; Szabó, G.; Abdulmutalib, H.M. Accuracy dimensions in remote sensing. Int. Arch. Photogramm. Remote Sens. Spat. Inf. Sci. 2018, XLII-3, 61–67. [Google Scholar] [CrossRef] [Green Version]
  59. Anker, F.; Fegerl, L.; Hübl, J.; Kaitna, R.; Neumayer, F.; Keuschnig, M. Geschiebetransport in Gletscherbächen der Hohen Tauern: Beispiel Obersulzbach. Wildbach Lawinenverbauung 2016, 80, 86–96. [Google Scholar]
  60. GeoResearch. Projekt Sattelkar: Zwischenbericht 1: 2018. Klimasensitive, Hochalpine Kare. 2018. Available online: http://www.parcs.at/nphts/mmd_fullentry.php?docu_id=37640 (accessed on 29 November 2021).
  61. GeoResearch. Projekt Sattelkar: Zwischenbericht 3: 2020. Klimasensitive, Hochalpine Kare. 2020. Available online: http://www.parcs.at/nphts/mmd_fullentry.php?docu_id=41348 (accessed on 29 November 2021).
  62. Schrott, L.; Otto, J.-C.; Keller, F. Modelling alpine permafrost distribution in the Hohe Tauern region, Austria. Austrian J. Earth Sci. 2012, 105, 169–183. [Google Scholar]
  63. OpenCV: Dense Optical Flow. Available online: https://docs.opencv.org/3.4/d4/dee/tutorial_optical_flow.html (accessed on 6 November 2021).
  64. Leys, C.; Delacre, M.; Mora, Y.L.; Lakens, D.; Ley, C. How to Classify, Detect, and Manage Univariate and Multivariate Outliers, With Emphasis on Pre-Registration. Int. Rev. Soc. Psychol. 2019, 32, 5. [Google Scholar] [CrossRef]
  65. Segoni, S.; Battistini, A.; Rossi, G.; Rosi, A.; Lagomarsino, D.; Catani, F.; Moretti, S.; Casagli, N. Preface: An operational landslide early warning system at regional scale based on space–time-variable rainfall thresholds. Nat. Hazards Earth Syst. Sci. 2015, 15, 853–861. [Google Scholar] [CrossRef] [Green Version]
  66. Corominas, J.; Remondo, J.; Farias, P.; Zézere, J.; Estevao, M.; Díaz de Teràn, J.; Schrott, L.; Dikau, R.; Moya, J.; González, A. Debris flow. In Landslide Recognition: Identification, Moevement and Courses; Dikau, R., Brundsen, D., Schrott, L., Ibsen, M.-L., Eds.; John Wiley & Sons: New York, NY, USA, 1996; p. 161. ISBN 0471964778. [Google Scholar]
  67. Fleet, D.J.; Black, M.J.; Yacoob, Y.; Jepson, A.D. Design and Use of Linear Models for Image Motion Analysis. Int. J. Comput. Vis. 2000, 36, 171–193. [Google Scholar] [CrossRef]
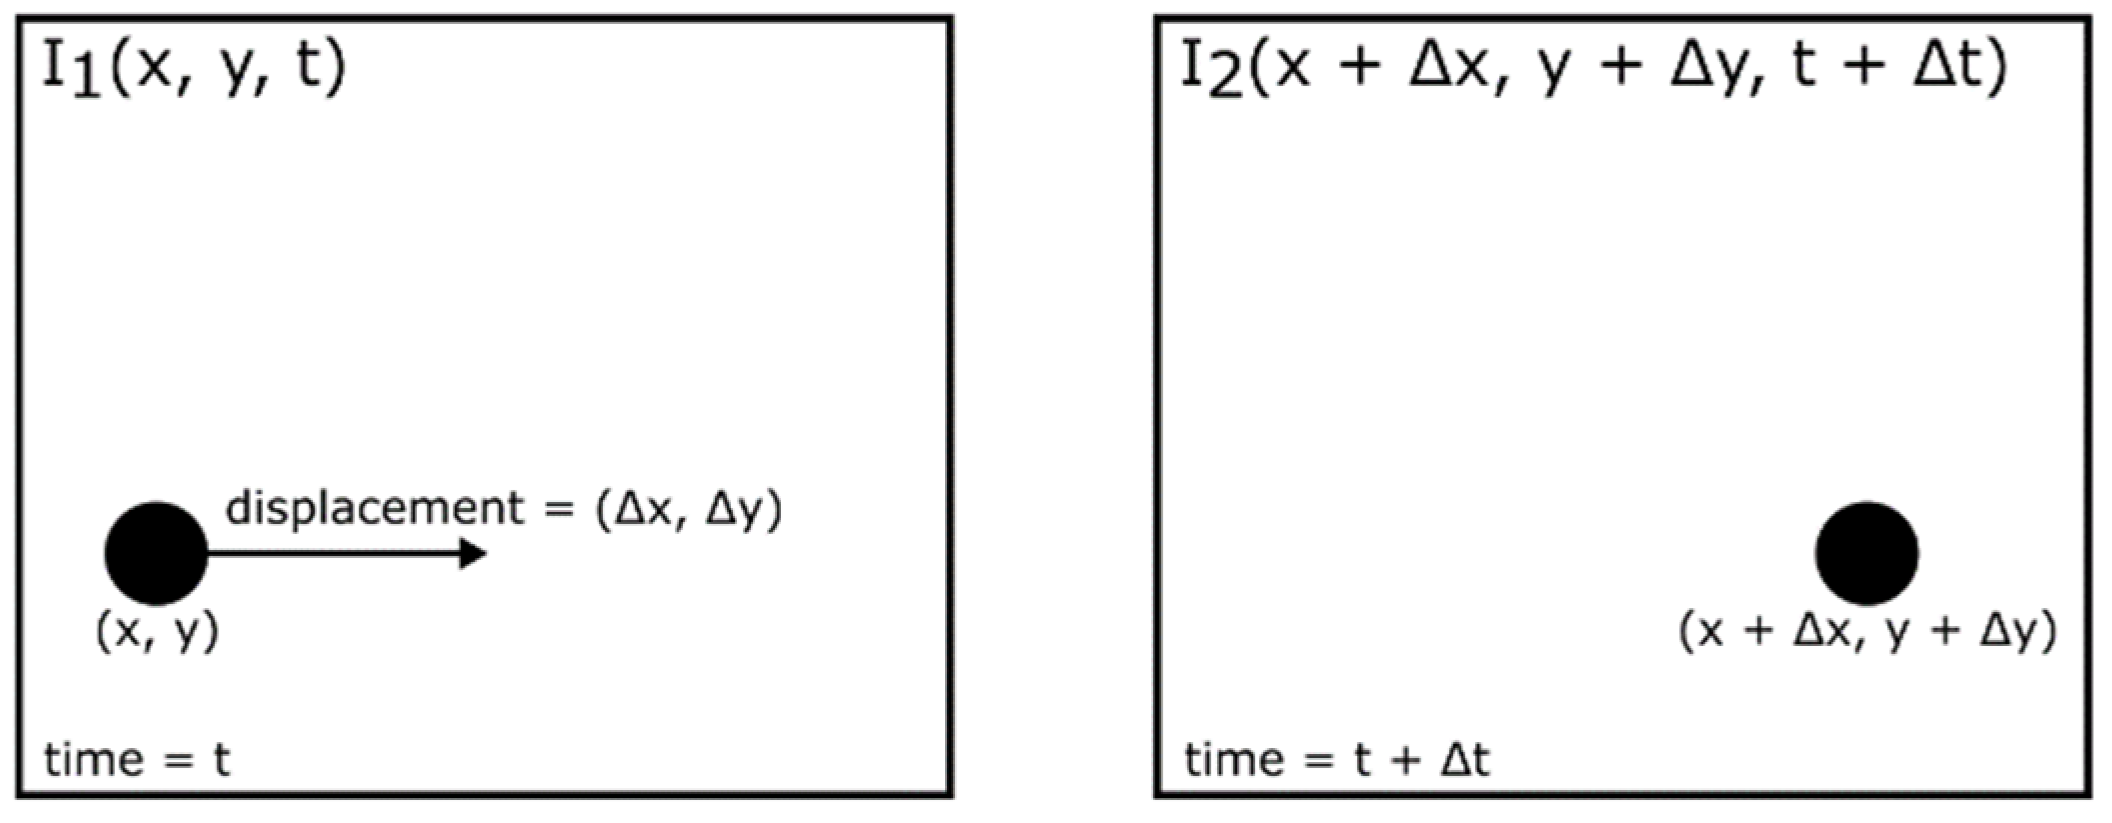
Figure 1. Displacement detection of an object in the reference (I1) and secondary (I2) image for t and t + Δt.
Remotesensing 14 00455 g001
Figure 2. (a) Sattelkar, 30 June 2019, with the debris cone of the 2014 debris flow event; overview map of Austria in the top right corner (white) (Österreichischer Bundesverlag Schulbuch GmbH & Co. KG and Freytag–Berndt & Artaria KG, Wien, Austria), (b) UAS orthophoto (4 September 2019) with the landslide in transparent red and the entire cirque indicated with a dashed grey outline, (c) boulder size of 5–10 m used for manual motion tracking and (d) view on the front of the cirque threshold.
Remotesensing 14 00455 g002
Figure 3. Multimaster approach. For each co-registered image of the single analysis (green arrow), and thus each secondary image pair, the average was weighted with the correlation coefficient of the first to the last image result (blue arrow).
Remotesensing 14 00455 g003
Figure 4. TS calculated for stable bedrock areas ‘Bedrock 1 to 5′ for NS and EW components for DIS (a,b) and Phase Correlation (c,d). Locations of bedrock areas are displayed in the orthophoto map of Figure 8.
Remotesensing 14 00455 g004
Figure 5. The left top row represents the results from the PC (a), the left bottom row the results from DIS (b)—both for time interval II: 24 July 2019–4 September 2019, 42 d. Arrows in black represent a realistic downslope range between 205–285°, while putting unrealistic directions (285–205°) in grey. Background: hillshade of UAS DEM, 0.16 m resolution. On the right column, displacements of manually traced boulder trajectories (x-axis) are plotted against the mean total displacement for the corresponding trajectory with a buffer of 0.1 m (y-axis) for PC (top right) and DIS (bottom right). Outliers are marked in red (with block ID), and the regression line in blue after outlier detection (Mahalanobis distance) and removal. Boulder trajectories are displayed in Figure 6.
Remotesensing 14 00455 g005
Figure 6. Results of single total displacement calculations of UAS orthoimages at 0.16 m resolution for (ad) using PC for the left column and (eh) using DIS for the right column. The time intervals I–IV (I: 13 July 2018–24 July 2019, 376 d; II: 24 July 2019–4 September 2019, 42 d; III: 4 September 2019–8 July 2020, 308 d; IV: 8 July 2020–8 September 2020, 62 d) follow from top to bottom and are to be read in rows to compare the two algorithms. The arrows represent manually measured boulder trajectories for the corresponding time interval, with displacements in meters indicated on top (ref. Section Material and Methods). Background: hillshade of UAS DEM, 0.16 m resolution.
Remotesensing 14 00455 g006
Figure 7. Results of multimaster TS analysis for total accumulated displacement calculations of UAS orthoimages at 0.16 m resolution for top row 002 (13 July 2018–4 September 2019, 418 d) and bottom row 004 (13 July 2018–11 September 2020, 791 d). Left column with PC algorithm (a,b) and right column DIS (c,d). Background: hillshade of UAS DEM, 0.16 m resolution.
Remotesensing 14 00455 g007
Figure 8. Top row represents the accumulated total displacement resulting from the multimaster analysis for the TS AOI 1–6 from 13 July 2018–8 September 2020 for PC (a) and DIS (b). The orthophoto map (8 September 2020, UAS 0.16 m resolution) in the middle (c) represents the locations of the TS AOI 1–6 within the landslide and the stable bedrock areas ‘Bedrock 1 to 5′.
Remotesensing 14 00455 g008
Table 1. UAS acquisition dates and time interval overview for single (I–IV) and multimaster analysis (1.-3.-2.-5., 001–004) (see Section 3.2).
Acquisition DatesIntervals Single AnalysisIntervals Multimaster Analysis
13 July 2018(I): 376 (I): 376(1.-3.): 418(1.-4.): 727(1.-5.): 791 (0001): 376(0002): 418(0003): 727(0004): 791
24 July 2019(II): 42(2.-4.): 351(2.-5.): 415
4 September 2019(III): 309
9 July 2020(IV): 64
11 September 2020
Table 2. UAS flight plans.
Flight Plan PartsLength of Flightpath [km]Flight Time [min]PassesNo. of ImagesGSDAltitude Startpoint [m]Highest Flight Position [m]Lowest Terrain Point [m]
Top6.81761217263031202365
Middle7.51961357220026821820
Low 17.31761307176821151620
Low 25.6146817176821101620
Total27.267244677 31201620
Table 3. Areas of rectangles for TS calculation of displacement curves (TS AOI 1–6) and bedrock identification number (1–5) for the assessment of modelled bedrock displacement.
TS AOI No./Bedrock No.123456
Time Series AOI [m²]337.94457.09988.15974.03969.85893.25
Bedrock [m²]162.09550.3123.9513.79167.50-
Table 4. Number of days with daily amount of precipitation greater than 20, 30, 40 and 50 mm (meteorological station Kürsinger cabin).
>20 [mm]>30 [mm]>40 [mm]>50 [mm]
200912532
20108421
201110310
201216521
20136100
20149532
201518610
201610500
201710400
201810521
201911111
202016862
Table 5. Ten highest days of total precipitation for the observation period 2009–2020 (meteorological station Kürsinger cabin, descending order).
DatePrecipitation [mm]
29 August 202082.9
30 July 201476.1
27 April 200970.1
3 October 202062.8
11 June 201460.4
19 August 201757.2
6 June 200952.5
17 July 201052.3
28 July 201951.2
3 August 202050.0
Publisher’s Note: MDPI stays neutral with regard to jurisdictional claims in published maps and institutional affiliations.