Abstract
Impact basins are the dominant landforms on the lunar surface, and their geological evolution varies. This research studied the diversity in the geological evolution of three impact basins: the Dirichlet–Jackson Basin, the Nectaris Basin, and the Orientale Basin. First, the regional topography and geomorphology of the three basins were studied using the SLDEM2015 digital elevation model (DEM). Clementine ultraviolet–visible (UVVIS) data and Moon Mineralogy Mapper (M3) data were used to study the chemical composition and mineralogical composition of the three basins. Additionally, the lunar crust thickness data have been used to study the subsurface structure of the three basins. The topographical analogies of the three basins indicate that the shapes of the basins are cavity-like. However, the shape of the Dirichlet–Jackson basin is not an obvious cavity compared with the other basins. The positions with minimum and maximum crustal thickness of the three basins are located at the center and the rim. The uplift of the crust-mantle interface of the Nectaris Basin and Orientale Basin is relatively larger than in the Dirichlet–Jackson Basin. Below the center of the maria of the Nectaris Basin and Orientale Basin, collapses occurred at the crust–mantle interface. The concentrations of FeO and TiO2 in the non-mare formation of the basin and maria show expected bimodal distributions. Moreover, we found exposures of olivine-rich materials in the Nectaris Basin and Orientale Basin which are located in the Rosse and Maunder craters, respectively. These exposures of olivine may be explained by the fact that the formation of the large impact basin, which might penetrate and blast away the upper lunar crust, excavating deep-seated material.
1. Introduction
Basin-forming impact events are one of the major geologic processes that occurred during the evolution of the Moon, and they record the history of meteorite bombardment in the early Solar System. Impact basins are the dominating topographic and morphological features [1,2,3] that were formed by large-scale impact events, which represent major exogenous resurfacing episodes on the Moon. During the late stage of lunar history, many impact basins were filled with volcanic materials (mostly basalts) to form the maria, which reflects the evolution representing the major endogenic geological processes of moon resurfacing. The formation of impact basins was a key process during the initial periods of geological evolution on the Moon, which affects both the lunar mantle and crust and is responsible for the formation of megaregolith [4,5]. Recently, NASA, JAXA, and ISRO missions, Lunar Reconnaissance Orbiter (LRO), Kaguya, Chandrayaan-1, and the Gravity Recovery and Interior Laboratory (GRAIL) have provided high-resolution images and topographic, hyperspectral, and gravity data, considerably enhancing our ability to understand the geological evolution of the Moon.
Lunar impact basins have been identified, catalogued, and studied for a long time [2,6,7,8,9]. For example, Spudis [6] studied the geology and composition of important basin deposits, including the Orientale and Nectaris basins, and systematically summarized the geological characteristics of another 45 lunar impact basins. Thus far, studies of the lunar basins have mostly focused on the structure of individual basins or considered the compositional characteristics of the basins [10,11,12]. In our research, we conducted a comparative analysis of three lunar basins, Dirichlet–Jackson, Nectaris, and Orientale, which were formed at different moments of early lunar history. The Dirichlet–Jackson Basin was formed earlier in the pre-Nectarian period, and its rim has been considerably degraded since its formation. The formation of the Nectaris Basin marked the beginning of the Nectarian period [1], and the Orientale Basin is the youngest multi-ring impact basin on the Moon [6].
Our first goal was to study the topographical and morphological characteristics of these basins. Our second goal was to analyze the chemical composition and mineralogy of a variety of associated materials. The mineralogy of the lunar surface is relatively simple, and the absorbance properties of lunar minerals and associated glasses are dominated by only a few elements. Thus, in our study, we focused on the contents of FeO and TiO2 in the basin regions. Our third goal was to highlight analogies and differences among the basins of different ages and locations. Based on our results, we analyzed the diversity among the three basins and propose a possible explanation for the diversity.
2. Geological Overview of the Studied Basins
The lunar stratigraphy consists of five major time units, periods, from oldest to youngest: pre-Nectarian, Nectarian, Imbrian, which includes the Early Imbrian and Upper Imbrian epochs, Eratosthenian, and Copernican [1]. Stöffler et al. [13] derived a revised and time-calibrated lunar stratigraphy. In this study, we adhered to this terminology (Figure 1a). The basins which we studied (Figure 1b) characterize the pre-Nectarian period (Dirichlet–Jackson Basin) period and mark the beginnings of the Nectarian (Nectaris Basin) and Imbrian (Orientale Basin) periods.
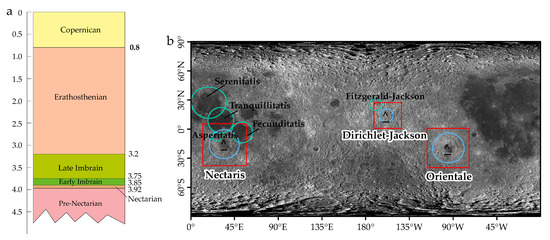
Figure 1.
(a) Geologic time scale of the Moon revised by Stöffler et al. [13]. (b) LRO WAC Global Mosaic (resolution 100 m/pixel) showing the locations of three study areas surrounding the selected basins. The map is displayed in simple cylindrical projection.
The Dirichlet–Jackson Basin (Figure 2a) is located on the far side of the Moon. Using the Bouguer anomaly data of the GRAIL mission, Neumann et al. [9] validated the existence of the Dirichlet–Jackson Basin. More recently, Satya Kumar et al. [14] analyzed the gravity anomalies generated by the GRAIL mission in detail and studied the sub-surface structure of the Dirichlet–Jackson Basin. The basin has no mare filling, and its surface is covered by ejecta from the Fitzgerald–Jackson basin and subsequent impact craters.
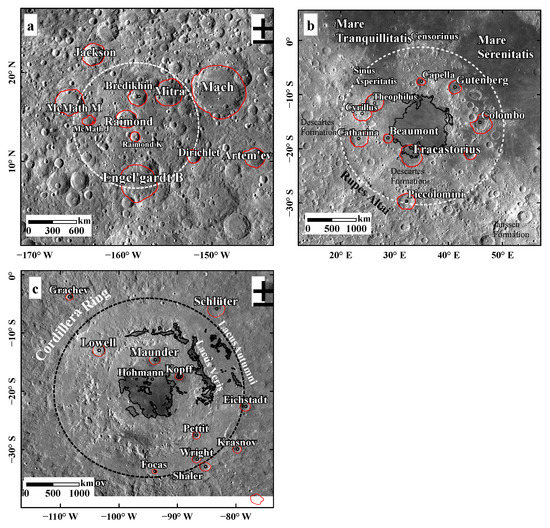
Figure 2.
WAC images of the three basins in Mercator projection. (a) Map of Dirichlet–Jackson Basin centered at 158.2°W, 13.4°N. (b) Map of Nectaris Basin centered at 35.1°E, 15.6°S. (c) Map of Orientale Basin centered at 94.8°W, 20.1°S. The red lines show the craters labeled in the maps.
The Nectaris Basin (Figure 2b) is on the nearside of the Moon and is located at 35.1°E, 15.6°S, south of Mare Tranquillitatis, and west of Mare Fecunditatis. Pike and Spudis [15] classified the Nectaris Basin as a multi-ring basin. The western portion of the rim of the basin is marked by a scarp of Rupes Altai, and Janssen Formation [6,16] and Descartes Formation characterize the southeastern and western regions adjacent to the basin, respectively. The Janssen Formation is exposed southeast of the basin, which extends outward from the basin rim (Figure 2b). The Janssen Formation is similar to the Fra Mauro Formation of the Imbrium Basin and the Hevelius Formation of the Orientale Basin, all of which consist of continuous deposits [17]. The Descartes Formation is exposed to the west of the basin, the knobby deposits of which resemble materials of the Apenninus Formation of the Imbrium Basin.
The Orientale Basin (Figure 2c) is centered at 94.8°W, 20.1°S, southwest of Oceanus Procellarum, and represents the lunar youngest and best-preserved multiring basin [10,18,19]. The basin is located in the transitional region between the highlands and the Maria, which is known as the boundary between thin crust and thick crust [20]. There are three ejecta units associated with the basin: the Maunder Formation, the Montes Rook Formation, and the Hevelius Formation. The Maunder Formation consists of light smooth plains and represents the melt sheet produced by the basin-forming impact [18]. The Montes Rook formation is a knobby unit mainly located between the Outer Rook Mountains and the Cordillera Mountains [21]. The Hevelius Formation is the main ejecta blanket of Orientale, which represents the materials ejected outside the basin. Recently, Yue et al. [22] redefined the absolute model age of the Orientale Basin and showed that the Orientale Basin was likely formed approximately 3.80 Ga ago.
3. Datasets and Methodology
We conducted a study of the three basins on the new datasets provided by the following instruments: the Clementine UVVIS spectrometer, Lunar Reconnaissance Orbiter Wide Angle Camera (LROC-WAC) (http://pds.lroc.asu.edu/data/LRO-L-LROC-5-RDR-V1.0/LROLRC_2001/DATA/BDR/WAC_GLOBAL/, accessed on 30 August 2020), Lunar Orbiter Laser Altimeter (LOLA), SELenological and Engineering Explorer Terrain Camera (SELENE TC), and Moon Mineralogy Mapper (M3). In this study, we used LROC-WAC (resolution 100 m/pixel) [23] to study the geomorphology of the three basins. The maps of topography obtained by LOLA and SELENE TC merged Digital Elevation Model (SLDEM2015) were used to analyze the morphology of the three basins. The spatial resolution of SLDEM data is about 60 m/pixel and the vertical accuracy of SLDEM data is ~3–4 m [24]. The SLDEM can be downloaded from http://darts.isas.jaxa.jp/planet/pdap/selene/, accessed on 18 February 2021. Spectral data taken by the Clementine mission [25] and hyperspectral data of M3 onboard Chandrayaan-1 spacecraft were used to study the FeO and TiO2 distributions and mineralogy of the three basins. The UVVIS Clementine data can be found at NASA PDS and Derived Products (https://astrogeology.usgs.gov/search/map/Moon/Clementine/UVVIS/Lunar_Clementine_UVVIS_WarpMosaic_5Bands_200m, accessed on 30 August 2020). The M3 data are available at PDS Geosciences Node (https://pdsimage2.wr.usgs.gov/Missions/Chandrayaan_1/M3/CH1M3_0004/, accessed on 4 February 2021). The Clementine UVVIS camera has five spectral channels with a resolution of 115 m/pixel. The wavelength ranges from 415 to 1000 nm [25]. The M3 data have 86 spectral bands, from visible to near-infrared, with wavelengths ranging from 0.42 to 3.0 μm, and its spectral resolution is 20 or 40 nm [26,27]. The global modes of M3 data exhibit two optical periods (OP) and provide data with five different sets of observations, as discussed by Boardman et al. [26] and Besse et al. [28]. The Level 2 data from the instrument’s Optical Period 2c were used to analyze the mineralogy of the three basins, and the reflectance data were thermally, geometrically, and photometrically corrected [27,29]. The resolution of the Level 2 data from the instrument’s Optical Period 2c is approximately 280 m/pixel [30]. In addition, to estimate the major features of the lunar interiors in regions surrounding the study basins, we used data from the updated version of the crust thickness map, which is based on the GRAIL extended mission gravity model JGGRAIL_900C11A [31].
3.1. Topographic Analyses
We constructed the DEMs for the Dirichlet–Jackson, Nectaris, and Orientale basins using the SLDEM digital elevation data and conducted quantitative topographic analyses for the basins. We extracted the elevation profile of the three basins from A to A’ and determined the diameters of the rings of the basins using the CraterTools extension of ArcGIS [32]. As complementary information to the topographic characteristics of the basins, we calculated the surface slopes in regions surrounding the basins at a 118 m baseline based on the SLDEM data. The slope variations may help to emphasize processes acting over geologic time [33].
3.2. Composition Analysis
Several algorithms have been proposed to derive the content of FeO and TiO2 [34,35,36,37]. The FeO and TiO2 abundances in the regions of the studied basins were calculated according to the algorithms proposed by Lucey et al. [36]. The algorithms are defined as:
where Rλ is the reflectance value for a given wavelength λ.
To analyze the compositions of the different landforms of the Dirichlet–Jackson, Nectaris, and Orientale basins, sets of randomly distributed points (pixels) were sampled according to the area of three basins. In order to determine representative samples, the number of points was proportional to the areas of each landform. In total, 200,000 sample points (pixels) were randomly extracted from the Nectaris Basin and Orientale Basin, and 60,000 sample points (pixels) were randomly extracted from Dirichlet–Jackson Basin. This method was successfully applied to the study of the northeast part of the South Pole-Aitken (SPA) basin [38], and the number of measurement points was sufficiently large to provide a representative sample of either FeO or TiO2 content. Using the results of a previous study, we mapped the sub-formations of the three basins and analyzed the FeO and TiO2 contents in the different sub-formation units.
3.3. Mineralogy Analysis
Different minerals have various spectral absorption characteristics (Figure 3). Here, we used the hyperspectral data from M3 to study variations in the mineralogical composition of the surface in the Dirichlet–Jackson, Nectaris, and Orientale basin regions. There is no spatial information of the OP2C data of M3. Therefore, in the data processing, the spatial information of M3 1B level data was coupled with level 2 data so that level 2 data had spatial information. Twelve OP2C data strips covering the Dirichlet–Jackson Basin were mosaiced into a single image. We repeated the same data processing for the Nectaris and Orientale basins.
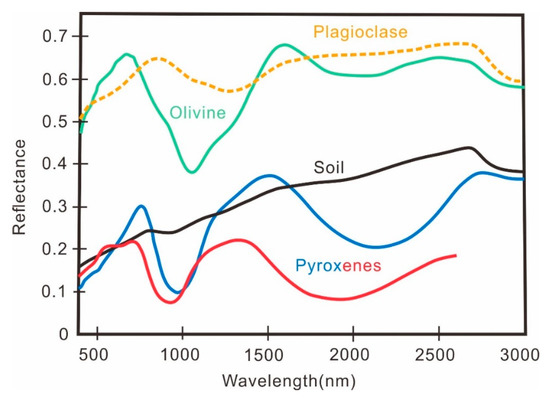
Figure 3.
Laboratory reflectance spectra of representative lunar minerals and regolith of M3 data (modified from Pieters et al. [30]).
To reduce the signal-to-noise ratio of spectral data and comprehensively describe the basic mineralogical characteristics (e.g., the abundance of mafic silicates and soil maturity of lunar regolith, members of the M3 science team have developed several mineral indicator parameters. Here, we used the integrated band depth (IBD) to analyze and capture the fundamental mineralogical properties of the surfaces in the basin regions because the IBD is very sensitive to the chemical characteristics of minerals, which can more intuitively highlight the absorption characteristics of minerals [39]. The IBD is defined as the integral of the band depth within the spectral range of the absorption spectrum [40,41]. Here, we used the crystal field absorptions at 1000 nm, and 2000 nm, and a reflectance of 1580 nm, to synthesize RGB false-color images, where RGB is the integrated band depth around 2000 nm (red), 1000 nm (green), and reflectance at 1580 nm (blue), respectively. Using this method, the mineral absorption characteristic parameter images of three basins were obtained to characterize the mineralogical diversity in the basin regions [19]. The definitions of the integrated band depths for 1000 nm and 2000 nm are as follows [41]:
where R is the reflectance value for a given wavelength and Rc is the reflectance value after removing the continuum [19,41]. The wavelengths at which the calculation starts are 789, and 1658, and 20 and 40 are the calculation intervals.
4. Results
4.1. Photogeological Analysis
In this study, the SLDEM topography maps were drawn in the Mercator projection, which causes little distortion in low-latitude zones where all three studied basins are situated. We constructed topographic profiles based on the SLDEM to study the configuration of the Dirichlet–Jackson, Nectaris, and Orientale basins (Figure 4). The SLDEM topography map (Figure 4) indicates distinct differences in morphological characteristics among the three basins.
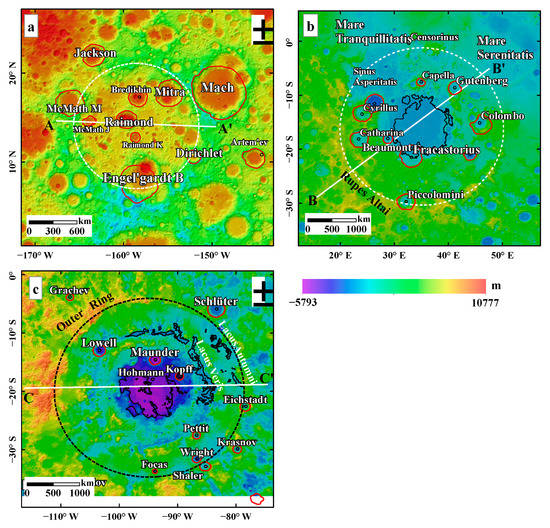
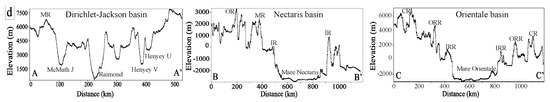
Figure 4.
Topography map of Dirichlet–Jackson Basin, Nectaris Basin, and Orientale Basin and their surrounding areas (based on SLDEM data). Major rings of the basins are labeled by dashed lines. The red lines show the craters labeled in the maps. (a) Dirichlet–Jackson Basin. (b) Nectaris Basin. (c) Orientale Basin. (d) Topographic profiles across the three basins derived from SLDEM elevation data.
The Dirichlet–Jackson Basin (Figure 4a) is located in the lunar farside highlands. The topographic profile (AA’, Figure 4d) shows that the basin floor is not flat because it is distorted by numerous large craters. The diameter of the Dirichlet–Jackson Basin is about 430 km (Table 1), roughly half the diameter of the Nectaris Basin. The average elevations for the floor and rim crests are approximately 4.1 km and 6.3 km from the 12 radical profiles 30° apart, respectively. Thus, the mean depth of the basin is approximately 3.8 km. The most prominent topographic features within the Dirichlet–Jackson Basin are impact craters, some of which are 2–4.5 km deep. The depth of the Raimond crater is larger than the Dirichlet–Jackson Basin, possibly because the Raimond crater formed after the Dirichlet–Jackson Basin, and the basin underwent later modification and degradation after its formation.

Table 1.
Mean FeO contents in the sub-formations of the three basins.
The Nectaris Basin (Figure 4b) was partly flooded with mare basalts from the north. Both the SLDEM topography map and the BB’ topographic profile (Figure 4d) shows that the surface of the Mare Nectaris is at a relatively low elevation and exhibits a flatter topography. The B–B′ profile clearly shows the positions of the inner and outer rings of the basin. The average elevation of the floor and the outer rim crest are approximately 2.8 km and 0.3 km from the 12 radical profiles 30° apart, respectively, and the depth of the Nectaris basin is about 3.1 km. The topographic map and the profile across the Nectaris Basin (B–B′) show that the northwestern portion of the basin, which is near the Serenitatis basin, is significantly lower, and the bottom of the basin is relatively flat. The outer ring of Nectaris Basin is relatively well preserved but appears breached to the northwest of the Sinus Asperitatis (Figure 4b). The northwest part of the inner ring is missing probably due to the filling of basalt from the North. In places where the inner ring is prominent, the height reaches ~3–3.5 km above the mare surface and the diameter of the inner ring is approximately 440 km. The outer ring forms Rupes Altai in its southwestern segment, with a diameter of ~880 km (Table 1).
The Orientale Basin (Figure 4c) is the youngest multi-ring basin. The CC′ profile in Figure 4d shows the position of the Inner Rook Ring, the Outer Montes Rook, and the Cordillera Ring. The topography of the Orientale Basin is asymmetrical, as shown by the elevation profile in Figure 4d. The topography in the west of the Orientale Basin is significantly higher than that in the east, which is likely because the Orientale Basin is located in the transitional region between the highlands and the mare. The average elevations for the floor and the rim crest in the Cordillera Ring are approximately −2.8 km and 2.3 km, respectively; the depth of the northeastern portion of the basin and its surroundings is significantly higher than the terrains at the eastern section of the basin. The diameters of the Inner Rook Ring (IRR) and Outer Rook ring are approximately ~490 km and ~690 km, respectively. The Cordillera Ring (CR), the outermost topographical rim of the Orientale basin, is approximately 920 km in diameter.
4.2. Local Crustal Characteristics
Wieczorek et al. [31] used the LOLA topographic and the GRAIL gravity data to construct models of crust thickness and relief of the crust–mantle boundary (“Moho”) on the Moon. These models provide important data for study of the subsurface structure of impact basins.
Figure 5 shows that the crustal thickness in the region of the Dirichlet–Jackson Basin varies from 28 km to 69 km, with an average of 56 km. The crust–mantle interface profile shows that the minimum and maximum thickness of the crust in the Dirichlet–Jackson Basin region is located near the craters Raimond and Henyey U, respectively (Figure 5). According to the crust–mantle interface profile across the center of the basin, the crust–mantle interface in the basin is only slightly uplifted, approximately 20 km.
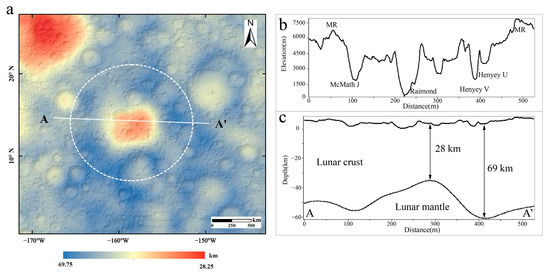
Figure 5.
(a) Crustal thickness map of Dirichlet–Jackson Basin with shaded relief topography; (b) topographic profile from A to A’ based on SLDEM, where MR means the Main Rim of the basin; (c) subsurface characteristics of the Dirichlet–Jackson Basin along the AA’ profile.
Figure 6 shows that the crustal thickness in the region surrounding the Nectaris Basin varies from 5 km to 56 km, with an average of 32 km. The area of minimum thickness occurs below the mare fill in the basin, and the areas of maximum thickness correspond to the basin middle ring (Figure 6). The crust–mantle interface profile across the center of the basin shows that the mantle uplift is relatively large, approximately 35 km. Below the center of the mare (red arrow), the crust–mantle interface exhibits large-scale collapse, and the subsidence depth is approximately 3 km.
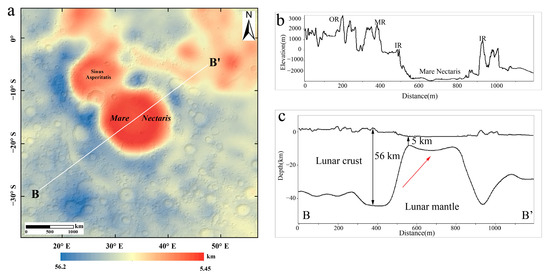
Figure 6.
(a) Crustal thickness map of the Nectaris Basin with shaded relief topography; (b) topographic profile from B to B’ based on SLDEM, IR means Inner Ring, MR means Middle Ring, OR means Outer Ring; (c) subsurface characteristics of the Nectaris Basin along the AA’ profile.
The crustal thickness in the Orientale Basin region ranges from 6 km to 61 km, with an average of 42 km. As shown in Figure 7, the minimum thickness is located at the center of the basin floor. The thickest crust in the Orientale Basin region is in the western section of the Outer Montes Rook, consistent with the results of Ishihara et al., 2009. The crustal thickness is marked by a black double arrow in Figure 7, and notably decreases from the east to the west. The crust–mantle interface in the Orientale Basin is columnar, similar to that in the Nectaris basin. However, the scale of the mantle uplift is approximately 45 km, larger than in the Nectaris basin.
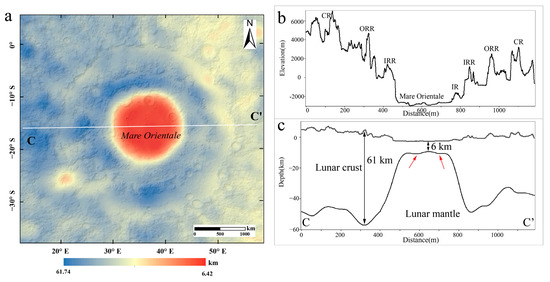
Figure 7.
(a) Crustal thickness map of Orientale Basin with shaded relief topography; (b) topographic profile from C to C’ based on LOLA, IR means Inner Ring, IRR means Inner Rook Ring, ORR means Outer Rook Ring, and CR means Cordillera Ring; (c) subsurface characteristics of Orientale Basin along with the AA’ profile. Red arrows indicate subsidence of the crust and mantle interface.
4.3. Geochemical Results
4.3.1. FeO and TiO2 Contents of the Basins
FeO and TiO2 contents are commonly used in lunar geology. The FeO content in the region of the Dirichlet–Jackson Basin varies from 0 to 17.8 wt.% (Figure 8a), with a mean content of 8.4 wt.%. The TiO2 content for the same region varies from 0 to 1.6 wt.%, with a mean of 0.5 wt.% (Figure 9a). The iron–poor ejecta from the Jackson crater overlays a significant portion of the Dirichlet–Jackson Basin. However, there are regions with higher concentrations of FeO inside and outside of the basin, e.g., at Mitra and Mach craters in the northeastern part of the basin (Figure 8a). The TiO2 content within the basin floor is higher than the regions outside the basin. Figure 9a shows that the floor of the Jackson and Raimond craters is low content in Titanium. The ejecta from the Jackson crater have higher concentrations of TiO2 and overlay the floor of the Dirichlet–Jackson Basin.
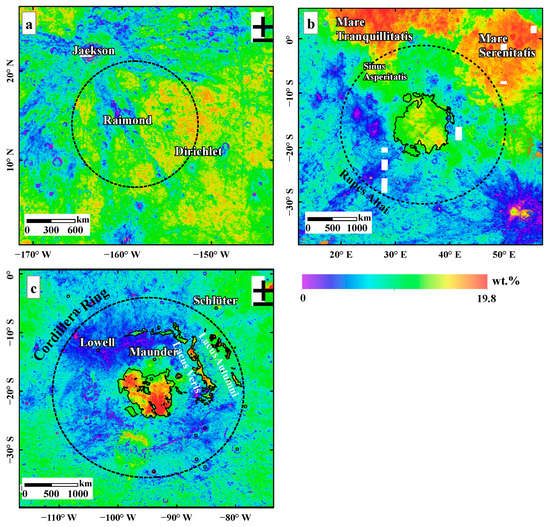
Figure 8.
FeO contents of Dirichlet–Jackson Basin (a), Nectaris Basin (b), and Orientale Basin (c). The black lines outline Maria in the Nectaris and Orientale basins. The maps are in Mercator projection.
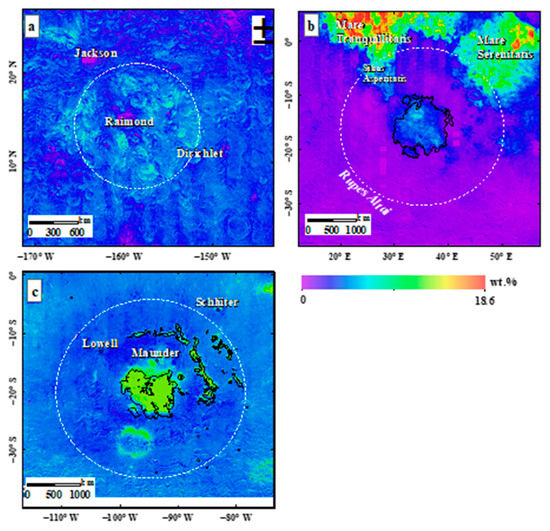
Figure 9.
TiO2 contents of Dirichlet–Jackson Basin (a), the Nectaris Basin (b), and the Orientale Basin (c). The black lines outline Maria in the Nectaris and Orientale basins. The map is in Mercator projection.
Figure 8b shows that the FeO content of the Nectaris Basin and the surrounding area varies from 0 to ~19.8 wt.%, with a mean value of 14.9 wt.%. The abundance of TiO2 in the basin region varies from 0 to ~18.6 wt.% (Figure 9b), with a mean value of 1.4 wt.%. The FeO and TiO2 concentrations in Mare Tranquillitatis and Mare Fecunditatis are much higher than in Mare Nectaris, with mean contents of 1.8 wt.% of TiO2 and 14.9 wt.% of FeO. The highest titanium content in the Mare Nectaris area is around 6 wt.%. The values of FeO and TiO2 contents in Mare Nectaris indicate that the mare materials belong to the low-titanium basalts.
As shown in Figure 8c, the FeO content in Orientale Basin region varies from 0 wt.% to 19.6 wt.% with the mean of ~9.2 wt.%. The TiO2 content in the same region varies from 0 wt.% to 9.6 wt.% (Figure 9c) with the mean of 2.7 wt.% (Table 2). Similar to the Nectaris Basin, the areas with the higher iron and titanium content correspond to the mare material within the Orientale Basin.
Table 2.
Mean TiO2 content in the sub-formations of the three basins.
4.3.2. Geochemical Characteristics of the Key Basins
In the completed Chinese 1:2,500,000 global Lunar geological Mapping project [42,43], basin landforms are classified as peak-ring sub-formation, basin floor sub-formation, basin wall sub-formation, and basin rim sub-formation. They are identified within Dirichlet–Jackson, Nectaris and Orientale basins based on the WAC image (Figure 10). Here, we calculated and compared the FeO and TiO2 contents of different sub-formations in the Dirichlet–Jackson, Nectaris, and Orientale basins. To analyze the chemical compositions of the basins, Table 1 and Table 2 show the results of the mean contents of FeO and TiO2 in the different basin sub-formations.
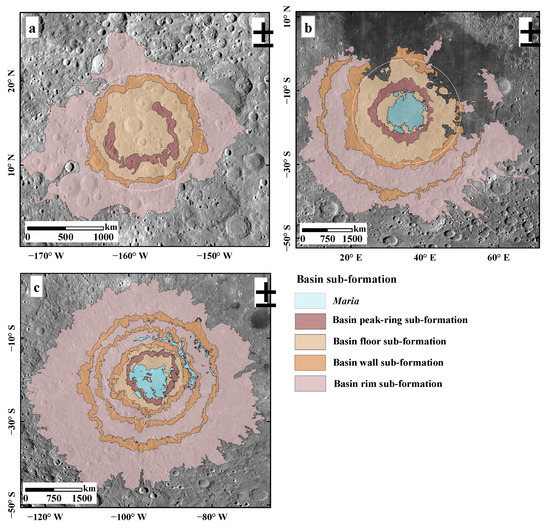
Figure 10.
The landforms of the Dirichlet–Jackson Basin (a), the Nectaris Basin (b) and the Orientale Basin (c) (modified from Liu et al. [44]).
Figure 11 shows the model concentrations of FeO and TiO2 of different landforms. The concentrations of FeO mainly range between ~6 and ~12 wt.%, whereas the TiO2 abundance varies from 0 to ~1 wt.%. The concentrations of FeO and TiO2 in the Nectaris Basin and the Orientale Basin are similar, concentrated between ~3 and ~9 wt.% and 0 and ~5 wt.%, respectively. The concentrations of FeO and TiO2 in the Dirichlet–Jackson Basin peak-ring, floor, and wall sub-formation are mainly concentrated at ~9.5 wt.% and ~0.5 wt.%, respectively, whereas the concentrations of FeO and TiO2 in the rim sub-formation are mainly concentrated at ~7.5 wt.% and 0.4 wt.%, respectively (Figure 11a,b). The concentrations of FeO in Mare Nectaris and Orientale vary from ~12 to ~15 wt.%, whereas in the Nectaris Basin and the Orientale Basin, the concentrations in the peak-ring, floor, wall, and rim sub-formations range ~3 to ~9 wt.% (Figure 11c,e). The trend in the concentrations of TiO2 is similar to FeO (Figure 11d). The concentrations of TiO2 in Mare Nectaris vary from ~2 to ~4 wt.%, whereas in the Nectaris Basin peak-ring, floor, wall, and rim sub-formations from ~0 to ~2 wt% (Figure 11d). The concentrations of TiO2 in Mare Nectaris vary from ~1 to ~3 wt.%, while in the Nectaris Basin, peak-ring, floor, wall, and rim sub-formation is from ~0 to ~1 wt.% (Figure 11f). The concentrations of FeO and TiO2 in the non-mare sub-formation of the basin are similar, showing expected bimodal distributions together with the concentrations of FeO and TiO2 in the Mare area.
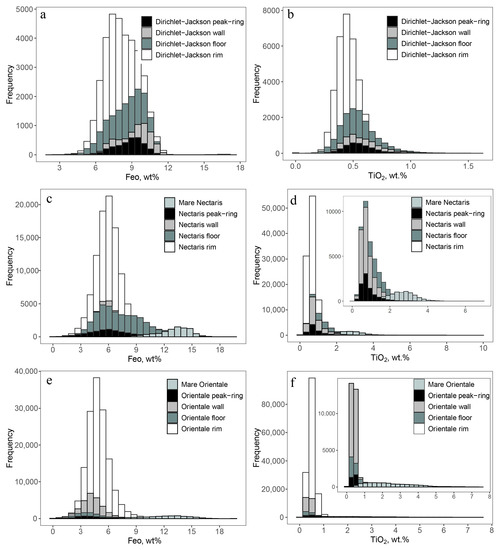
Figure 11.
The frequency distribution of FeO and TiO2 contents in the landforms of Dirichlet–Jackson Basin (a,b), Nectaris Basin (c,d) and Orientale Basin (e,f).
4.4. Mineralogical Results
The lunar regolith is dominated by phases such as plagioclase, pyroxene, olivine, ilmenite, and impact-generated glasses. Pyroxene spectra exhibit two major absorption bands near 1000 nm and 2000 nm both due to Fe2+ crystal field transitions. Reflectance spectra of olivine exhibited a major absorption peak near 1000 nm. In our paper, the M3 data were used to superimpose a certain range near the main mineral absorption peaks based on the IBD method, and IBD maps for the three basins were derived (Figure 12).
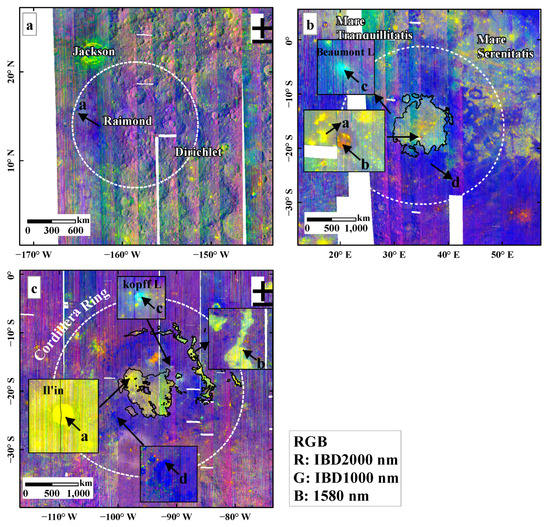
Figure 12.
Composite map of the spectral parameters of the Dirichlet–Jackson Basin (a), Nectaris Basin (b), and Orientale Basin (c) calculated from the M3 data. The white dotted lines show the main rings of the basins.
The blue color of the Dirichlet–Jackson Basin region in the composite spectral parameter map (e.g., point a in Figure 12a) indicates that the region is dominated by plagioclase, which likely corresponds to the lunar crust composition before the formation of the basin.
The Nectaris mare regions and the surrounding highlands exhibit clear differences on the IBD map. The materials in Mare Nectaris near the Rosse crater (e.g., point a in Figure 12b) display strong absorptions at both 1000 nm and 2250 nm (Figure 13a), indicating that the regolith in this area contains fresh pyroxene materials. At the wall of the Rosse crater (e.g., point b in Figure 12b), the materials show relatively weak absorption characteristics at 1000 nm and 2250 nm (Figure 13b). The Mare Nectaris appears yellow-orange, displaying absorption characteristics at 1000 nm and 2000 nm indicating a mainly pyroxene composition. The materials in the southern wall of the Beaumont L crater (e.g., point c in Figure 12b) display an absorption band at 1000 nm but no absorption band at 2250 nm (Figure 13c), indicating that the minerals are olivine-rich. Additionally, the materials in the surrounding highlands at the composite map (point d in Figure 12b) are blue, indicating feldspathic materials (Figure 13d).
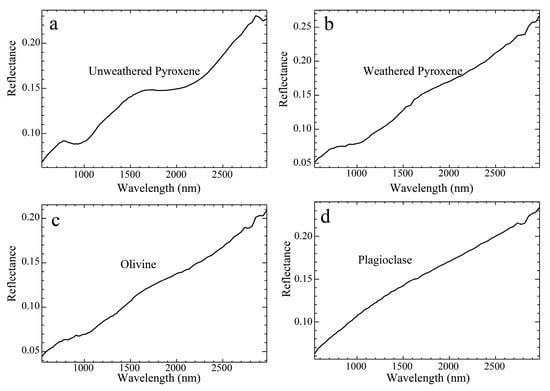
Figure 13.
The spectral reflectance curve of the materials in Nectaris Basin: (a) unweathered pyroxene-rich basalt, (b) weathered pyroxene-rich materials at the Rosse crater wall, (c) olivine-rich materials in the Beaumont L crater wall, and (d) feldspathic materials on the non-mare region.
Similar to Nectaris Basin, Mare Orientale and the surrounding highlands area is clearly distinguishable on the IBD map of the Orientale Basin region. At the wall of the Il’in crater (e.g., point a in Figure 12c), the M3 spectral reflectance curve shows strong absorption at both 1000 nm and 2250 nm (Figure 14a), which indicates that there are some fresh pyroxene-rich materials in the crater. The basalts in Mare Orientale and Lacus Veris are yellow in color (e.g., point b in Figure 12c), displaying relatively weak absorption features at both 1000 nm and 2250 nm (Figure 14b). The features indicate that the basalts contain weathered pyroxene. In the northwestern rim of the Kopff E crater, there is a small and fresh crater (point c in Figure 12c). The M3 spectrum of point c displays an absorption band at 1 μm but no absorption band at 2000 nm (Figure 14c), which indicates that there possibly are olivine-rich materials here. The surrounding highlands in the composite spectral parameter map are blue-purple in color (e.g., point d in Figure 12c), which suggests that the composition of the highland plagioclase dominates (Figure 14d).
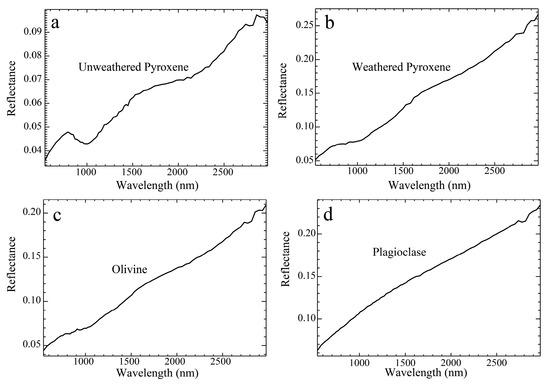
Figure 14.
Spectral reflectance curves of the materials in the Orientale Basin: (a) unweathered pyroxene-rich materials at Il’in crater wall; (b) weathered pyroxene-rich basalt; (c) possible olivine rocks in the small and fresh crater wall; (d) feldspathic materials on the surrounding highlands.
5. Discussion
The initial goal of this study was to compare the topographical and morphological characteristics of these basins. Topographic profiles traversing their interiors can provide a qualitative assessment of their present topography. Analysis of the topographic profiles of the three basins (Figure 15) show that the average elevation of the Dirichlet–Jackson Basin is higher than the other two basins. In addition, the cavity-like shape in the profiles is consistent with those demonstrated by Byrne [45], who proposed the radial elevation profiles. The topographical analogies of the three basins show the cavity-like shapes of the basins. However, the shape of the Dirichlet–Jackson Basin is not an obvious cavity. This is because there are many craters with large diameters on the surface of Dirichlet–Jackson Basin, which may be because this basin was formed in the pre-Nectarian period. After the formation of the Dirichlet–Jackson Basin, it was subjected to a large number of impacts, severely degrading the surface, and the rings were not easily identified. In addition, the topographies of the Nectaris Basin and the Orientale Basin are extremely similar, in that they are filled with mare basalts. The rings of the Nectaris Basin and Orientale Basin are easily distinguishable because the two basins are well preserved. The floors of the two basins are relatively flat, with only a small number of young impact craters.
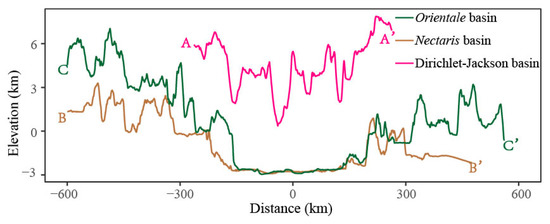
Figure 15.
Topographic profile comparison map of the three basins, wherein 0 on the x-axis corresponds to the center of the three basins, negative values on the x-axis represent the direction from the center of the basin to the start of the topographic profile, and positive values on the x-axis represent the direction from the center of the basin to the end of the topographic profile.
We compared the crustal thickness of the three basins based on the GRAIL Crust Thickness Model. The crustal thickness comparison map shows the crustal thickness variations in the three basins (Figure 16). The minimum and maximum crustal thickness positions are located at the centers and the rims of the basins, respectively, which is due to the basin formation process. During the formation of basins, a large amount of material is excavated and redistributed. Thus, the centers of the basins are thinner than the rim. The formation of basins is the main process that leads to variations in lunar crust thickness, which is in line with the results of Johnson et al. [46] from the perspective of simulating the formation of basins. However, the crustal thickness of Dirichlet–Jackson Basin is thicker than the other two basins; the thicker crust corresponds to the higher topography (Figure 15 and Figure 16). Nectaris Basin and Orientale Basin have thinner crusts, which is probably due to an abnormally large mantle plug [20].
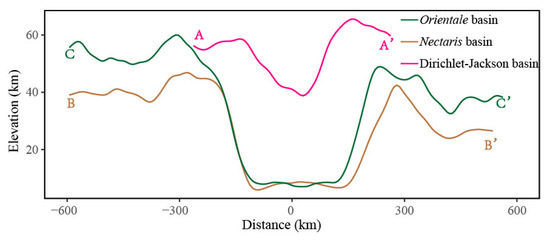
Figure 16.
Crustal thickness comparison map of the three basins, wherein 0 on the x-axis corresponds to the center of the three basins, negative values on the x-axis represent the direction from the center of the basin to the start of the topographic profile, and positive values on the x-axis represent the direction from the center of the basin to the end of the topographic profile.
Analysis of the lunar samples showed that the TiO2 concentrations of lunar mare basalts have large variations, which may be due to the magmatic source and subsequent differentiation processes. According to the TiO2 contents, mare basalts can be classified as very high titanium (VHT) basalts (>10 wt.% of TiO2), high-titanium basalts (7.5–10 wt.% of TiO2), medium-titanium basalts (4.5–7.5 wt.% of TiO2), low-titanium basalts(1–4.5 wt.% of TiO2), and very-low-titanium (VLT) (<1 wt.% of TiO2) [47]. Basalts in Mare Nectaris and Orientale are in the groups of very-low-titanium basalts and low-titanium basalts (Figure 17). Very-low-titanium and low-titanium basalts (<5 wt.%) are the most widely distributed basalts on the surface of the Moon and may be formed by the partial melting of olivine and orthopyroxene materials [47].
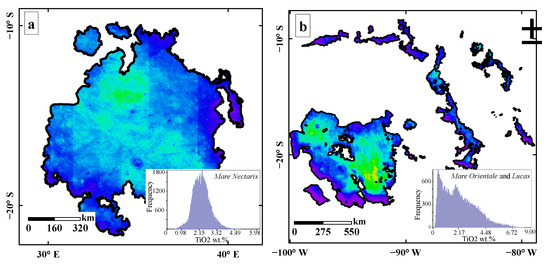
Figure 17.
TiO2 contents of Mare Nectaris (a), and Mare Orientale and Lucas within the Orientale Basin (b).
Large impact events disturb the lunar crust of the target region and excavate materials from the deep parts of the Moon. Maunder (Figure 18a,b) is a complex crater of the Eratosthenian period, with a central peak [1]. The diameter of Maunder crater is approximately 55 km, and this impact event excavated materials to a depth of ~5 km. Topographic analysis of the Orientale impact structure suggests that the thickness of the melt sheet in the Orientale is approximately 15 km [48]. These materials likely compose the entire wall of Maunder and were brought to the surface from beneath. Thus, Maunder would have both excavated and brought up through structural uplift the deeper stratigraphy of the melt sheet of Orientale basin. The Rosse crater in the south of the Nectaris basin floor appears to be relatively fresh. The depth and the excavation depth of the Rosse crater are approximately 2.5 km and 1.0 km, respectively (Figure 18c,d). In addition, the maximum thickness of Mare Nectaris is over 1.5 km [49]. Thus, the formation of the Rosse crater only excavated the mare basalts. In the M3 composite spectral parameter image of the Maunder and Rosse craters, the yellow/orange colors indicate that the craters are a mixture of pyroxene and olivine-rich materials.
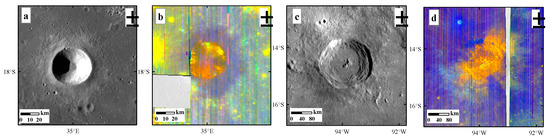
Figure 18.
(a) Maunder crater in Orientale Basin; the base map is an LROC WAC image. (b) The M3 composite image displays the mineralogy of Maunder. (c) Rosse crater in Nectaris basin; the base map is an LROC WAC image. (d) The M3 composite image displays the mineralogy of Rosse.
The lunar magma ocean (LMO) hypothesis suggests that as magma oceans begin to solidify, they first crystallize to form olivine, which, due to its higher density, sinks toward the bottom of the magma ocean as it crystallizes and differentiates [50,51]. The impact basin formation is responsible for the exposure of olivine. Large impact events could have penetrated and blasted away the lunar upper crust, excavating deep-seated olivine-rich material [52]. The Orientale Basin and the Nectaris Basin have thinner crusts [31]. Therefore, it is possible that the olivine-rich materials may have come from the excavation of lunar mantle material during large impact events to form these basins.
6. Conclusions
We systematically studied and compared the characteristics of topography, composition and mineralogy, geological features, and crustal characteristics of Dirichlet–Jackson Basin, Nectaris Basin, and Orientale Basin using different imaging data sets. The main findings of this paper are presented subsequently.
In terms of the topographical and morphological characteristics of these basins, the topographical analogies are that the basins exhibit cavity-like shapes. However, the shape of the Dirichlet–Jackson Basin is not an obvious cavity. In addition, the surface of Dirichlet–Jackson Basin is severely degraded, and the rings were not easily identified due to the earlier formation of the basin (pre-Nectarian period). The topography of Nectaris Basin and Orientale Basin are extremely similar, in that they are filled with mare basalts and are well preserved.
The minimum and maximum crustal thickness positions of the three basins are located at the centers and the rims of the basins. The crust–mantle interface in the Dirichlet–Jackson Basin is slightly uplifted, approximately 20 km, which is smaller than in the Nectaris Basin and the Orientale Basin. The amplitudes of the uplifts in the Nectaris Basin and Orientale Basin are 35 km and 45 km, respectively.
Analyses of the composition and modeled concentrations of FeO and TiO2 of lunar basin landforms enable us to investigate the distribution of the concentrations of FeO and TiO2 in different basin landforms. The concentrations of FeO in the Dirichlet–Jackson Basin are mainly concentrated from ~6 to ~12 wt.%, whereas the TiO2 abundance is mainly concentrated in the range of 0 to ~1 wt.%. The concentrations of FeO and TiO2 in the Nectaris Basin and the Orientale Basin are similar, concentrated between ~3 and ~9 wt.% and 0 and ~5 wt.%, respectively. The concentrations of FeO and TiO2 in the non-mare formation of the basin and mare area show an expected a bimodal distribution.
The materials within the Dirichlet–Jackson Basin, Nectaris Basin, and Orientale Basin are different. The Dirichlet–Jackson Basin is mainly composed of plagioclase minerals, whereas Mare Nectaris and Mare Orientale are mainly mixtures of pyroxene and olivine. The surrounding highland areas of the Nectaris Basin and the Orientale Basin exhibit a feldspar-dominated composition, which is the original component of the lunar crust. There are some relatively fresh impact craters in the mare region of the Nectaris Basin and the Orientale Basin, and the walls of the craters contain pyroxene-rich basalt material excavated from the near-surface.
Author Contributions
Conceptualization, J.D. and W.C.; methodology, J.D. and W.C.; software, J.D. and Y.J.; formal analysis, J.D.; writing—original draft preparation, J.D.; writing—review and editing, J.D., W.C. and Y.J.; visualization, J.D. and Y.J.; supervision, J.D. and W.C. All authors have read and agreed to the published version of the manuscript.
Funding
This research was funded by the B–type Strategic Priority Program of the Chinese Academy of Sciences, grant No. XDB41000000, the National Natural Science Foundation of China, No. 42130110, National Natural Science Foundation of China, grant No. 41571388, and the Key projects of national basic work of science and technology, grant No. 2015FY210500.
Acknowledgments
We greatly acknowledge the teams of SELENE Data Archive and the Planetary Data System archive for provide the data used in the study. We are deeply grateful to Mikhail A. Ivanov from V.I. Vernadsky Institute of Geochemistry and Analytical Chemistry, Russian Academy of Sciences for his useful and constructive comments.
Conflicts of Interest
The authors declare no conflict of interest.
References
- Wilhelms, D.E.; McCauley, J.F.; Trask, N.J. Geologic History of the Moon; U.S. Geological Survey Professional Paper: Washington, DC, USA, 1987. [Google Scholar]
- Melosh, H.J. Impact Cratering: A Geologic Process; Oxford University Press: New York, NY, USA, 1989; pp. 60–184. [Google Scholar]
- Wieczorek, M.A.; Phillips, R.J. Lunar Multiring Basins and the Cratering Process. Icarus 1999, 139, 246–259. [Google Scholar] [CrossRef]
- Spudis, P.D.; Gillis, J.J.; Reisse, R.A. Ancient multiring basins on the Moon revealed by Clementine laser altimetry. Science 1994, 266, 1848–1851. [Google Scholar] [CrossRef] [PubMed]
- Miljkovicc, K.; Wieczorek, M.A.; Collins, G.S.; Laneuville, M.; Neumann, G.A.; Melosh, H.J.; Solomon, S.C.; Phillips, R.J.; Smith, D.E.; Zuber, M.T. Asymmetric distribution of lunar impact basins caused by variations in target properties. Science 2013, 342, 724–726. [Google Scholar] [CrossRef] [PubMed]
- Spudis, P.D. The Geology of Multi-Ring Impact Basins; Cambridge University Press: Cambridge, UK, 1993. [Google Scholar]
- Baker, D.M.; Head, J.W. New morphometric measurements of craters and basins on Mercury and the Moon from MESSENGER and LRO altimetry and image data: An observational framework for evaluating models of peak-ring basin formation. Planet. Space Sci. 2013, 86, 91–116. [Google Scholar] [CrossRef]
- Fassett, C.I.; Head, J.W.; Kadish, S.J.; Mazarico, E.; Neumann, G.A.; Smith, D.E.; Zuber, M.T. Lunar impact basins: Stratigraphy, sequence and ages from superposed impact crater populations measured from Lunar Orbiter Laser Altimeter (LOLA) data. J. Geophys. Res. Planets 2012, 117, E00H06. [Google Scholar] [CrossRef]
- Neumann, G.A.; Zuber, M.T.; Wieczorek, M.A.; Head, J.W.; Baker, D.M.H.; Solomon, S.C.; Smith, D.E.; Lemoine, F.G.; Mazarico, E.; Sabaka, T.J.; et al. Lunar impact basins revealed by Gravity Recovery and Interior Laboratory measurements. Sci. Adv. 2015, 1, e1500852. [Google Scholar] [CrossRef]
- Bussey, D.B.J.; Spudis, P.D. Compositional studies of the Orientale, Humorum, Nectaris, and Crisium lunar basins. J. Geophys. Res. Planets 2000, 105, 4235–4243. [Google Scholar] [CrossRef]
- Bretzfelder, J.M.; Klima, R.L.; Greenhagen, B.T.; Buczkowski, D.L.; Cartwright, S.F.A.; Moriarty, D.P.; Ernst, C.M.; Petro, N.E. Comparative Spectral Analysis of Three Distinct Lunar Basins. In Proceedings of the 50th Lunar and Planetary Science Conference, The Woodlands, TX, USA, 18–22 March 2019. [Google Scholar]
- Singh, T.; Srivastava, N. Geology of Grimaldi Basin on the Moon: Evidence for volcanism and tectonism during the Copernican period. Icarus 2020, 351, 113921. [Google Scholar] [CrossRef]
- Stöffler, D.; Ryder, G.; Ivanov, B.A.; Artemieva, N.A.; Cintala, M.J.; Grieve, R.A.F. Cratering History and Lunar Chronology. Rev. Mineral. Geochem. 2006, 60, 519–596. [Google Scholar] [CrossRef]
- Satya Kumar, A.V.; Rajasekhar, R.P.; Tiwari, V.M. Gravity anomalies and crustal structure of the Lunar far side highlands. Planet. Space Sci. 2018, 163, 106–113. [Google Scholar] [CrossRef]
- Pike, R.J.; Spudis, P.D. Basin-ring spacing on the Moon, Mercury, and Mars. Earth Moon Planets 1987, 39, 129–194. [Google Scholar] [CrossRef]
- Howard, K.A.; Wilhelms, D.E.; Scott, D.H. Lunar basin formation and highland stratigraphy. Rev. Geophys. 1974, 12, 309–327. [Google Scholar] [CrossRef]
- Spudis, P.D.; Hawke, B.R.; Lucey, P.G. Geology and deposits of the lunar Nectaris basin. In Proceedings of the 19th Lunar and Planetary Science Conference, Houston, TX, USA, 1 January 1989; pp. 51–59. [Google Scholar]
- Head, J.W. Orientale multi-ringed basin interior and implications for the petrogenesis of lunar highland samples. Earth Moon Planets 1974, 11, 327–356. [Google Scholar] [CrossRef]
- Cheek, L.C.; Donaldson Hanna, K.L.; Pieters, C.M.; Head, J.W.; Whitten, J.L. The distribution and purity of anorthosite across the Orientale basin: New perspectives from Moon Mineralogy Mapper data. J. Geophys. Res. Planets 2013, 118, 1805–1820. [Google Scholar] [CrossRef]
- Ishihara, Y.; Goossens, S.; Matsumoto, K.; Noda, H.; Araki, H.; Namiki, N.; Hanada, H.; Iwata, T.; Tazawa, S.; Sasaki, S. Crustal thickness of the Moon: Implications for farside basin structures. Geophys. Res. Lett. 2009, 36, L19202. [Google Scholar] [CrossRef]
- Spudis, P.D.; Hawke, B.R.; Lucey, P. Composition of orientale basin deposits and implications for the lunar basin-forming process. J. Geophys. Res. 1984, 89, C197. [Google Scholar] [CrossRef]
- Yue, Z.; Yang, M.; Jia, M.; Michael, G.; Di, K.; Gou, S.; Liu, J. Refined model age for Orientale Basin derived from zonal crater dating of its ejecta. Icarus 2020, 346, 113804. [Google Scholar] [CrossRef]
- Robinson, M.S.; Brylow, S.M.; Tschimmel, M.; Humm, D.; Lawrence, S.J.; Thomas, P.C.; Denevi, B.W.; Bowman-Cisneros, E.; Zerr, J.; Ravine, M.A.; et al. Lunar Reconnaissance Orbiter Camera (LROC) Instrument Overview. Space Sci. Rev. 2010, 150, 81–124. [Google Scholar] [CrossRef]
- Barker, M.K.; Mazarico, E.; Neumann, G.A.; Zuber, M.T.; Haruyama, J.; Smith, D.E. A new lunar digital elevation model from the Lunar Orbiter Laser Altimeter and SELENE Terrain Camera. Icarus 2016, 273, 346–355. [Google Scholar] [CrossRef]
- Nozette, S.; Rustan, P.; Pleasance, L.; Kordas, J.; Lewis, I.; Park, H.; Priest, R.; Horan, D.; Regeon, P.; Lichtenberg, C.J.S. The Clementine mission to the Moon: Scientific overview. Science 1994, 266, 1835–1839. [Google Scholar] [CrossRef]
- Boardman, J.W.; Pieters, C.M.; Green, R.O.; Lundeen, S.R.; Varanasi, P.; Nettles, J.; Petro, N.; Isaacson, P.; Besse, S.; Taylor, L.A. Measuring moonlight: An overview of the spatial properties, lunar coverage, selenolocation, and related Level 1B products of the Moon Mineralogy Mapper. J. Geophys. Res. Planets 2011, 116, E00G14. [Google Scholar] [CrossRef]
- Green, R.; Pieters, C.; Mouroulis, P.; Eastwood, M.; Boardman, J.; Glavich, T.; Isaacson, P.; Annadurai, M.; Besse, S.; Barr, D. The Moon Mineralogy Mapper (M3) imaging spectrometer for lunar science: Instrument description, calibration, on-orbit measurements, science data calibration and on-orbit validation. J. Geophys. Res. Planets 2011, 116, E00G19. [Google Scholar] [CrossRef]
- Besse, S.; Sunshine, J.M.; Staid, M.I.; Petro, N.E.; Boardman, J.W.; Green, R.O.; Head, J.W.; Isaacson, P.J.; Mustard, J.F.; Pieters, C.M. Compositional variability of the Marius Hills volcanic complex from the Moon Mineralogy Mapper (M3). J. Geophys. Res. Planets 2011, 116, E00G13. [Google Scholar] [CrossRef]
- Besse, S.; Sunshine, J.; Staid, M.; Boardman, J.; Pieters, C.; Guasqui, P.; Malaret, E.; McLaughlin, S.; Yokota, Y.; Li, J.Y. A visible and near-infrared photometric correction for Moon Mineralogy Mapper (M-3). Icarus 2013, 222, 229–242. [Google Scholar] [CrossRef]
- Pieters, C.M.; Boardman, J.; Buratti, B.; Chatterjee, A.; Clark, R.; Glavich, T.; Green, R.; Head, J., III; Isaacson, P.; Malaret, E.J.C.S. The Moon mineralogy mapper (M³) on chandrayaan-1. Curr. Sci. 2009, 96, 500–505. [Google Scholar]
- Wieczorek, M.A.; Neumann, G.A.; Nimmo, F.; Kiefer, W.S.; Taylor, G.J.; Melosh, H.J.; Phillips, R.J.; Solomon, S.C.; Andrews-Hanna, J.C.; Asmar, S.W.; et al. The Crust of the Moon as Seen by GRAIL. Science 2013, 339, 671–675. [Google Scholar] [CrossRef]
- Kneissl, T.; van Gasselt, S.; Neukum, G. Map-projection-independent crater size-frequency determination in GIS environments-New software tool for ArcGIS. Planet. Space Sci. 2011, 59, 1243–1254. [Google Scholar] [CrossRef]
- Rosenburg, M.A.; Aharonson, O.; Head, J.W.; Kreslavsky, M.A.; Mazarico, E.; Neumann, G.A.; Smith, D.E.; Torrence, M.H.; Zuber, M.T. Global surface slopes and roughness of the Moon from the Lunar Orbiter Laser Altimeter. J. Geophys. Res. 2011, 116, E02001. [Google Scholar] [CrossRef]
- Gillis, J.J.; Jolliff, B.L.; Elphic, R.C. A revised algorithm for calculating TiO2 from Clementine UVVIS data: A synthesis of rock, soil, and remotely sensed TiO2 concentrations. J. Geophys. Res. Planets 2003, 108, 5009. [Google Scholar] [CrossRef]
- Lucey, P.G.; Blewett, D.T.; Hawke, B.R. Mapping the FeO and TiO2 content of the lunar surface with multispectral imagery. J. Geophys. Res. Planets 1998, 103, 3679–3699. [Google Scholar] [CrossRef]
- Lucey, P.G.; Blewett, D.T.; Jolliff, B.L. Lunar iron and titanium abundance algorithms based on final processing of Clementine ultraviolet-visible images. J. Geophys. Res. Planets 2000, 105, 20297–20305. [Google Scholar] [CrossRef]
- Lucey, P.G.; Taylor, G.J.; Malaret, E. Abundance and Distribution of Iron on the Moon. Science 1995, 268, 1150–1153. [Google Scholar] [CrossRef] [PubMed]
- Ivanov, M.A.; Hiesinger, H.; Van Der Bogert, C.H.; Orgel, C.; Pasckert, J.H.; Head, J.W. Geologic History of the Northern Portion of the South Pole-Aitken Basin on the Moon. J. Geophys. Res. Planets 2018, 123, 2585–2612. [Google Scholar] [CrossRef]
- Kusuma, K.N.; Sebastian, N.; Murty, S.V.S. Geochemical and mineralogical analysis of Gruithuisen region on Moon using M3 and DIVINER images. Planet. Space Sci. 2012, 67, 46–56. [Google Scholar] [CrossRef]
- Staid, M.I.; Pieters, C.M.; Besse, S.; Boardman, J.; Dhingra, D.; Green, R.; Head, J.W.; Isaacson, P.; Klima, R.; Kramer, G.; et al. The mineralogy of late stage lunar volcanism as observed by the Moon Mineralogy Mapper on Chandrayaan-1. J. Geophys. Res. 2011, 116, E00G10. [Google Scholar] [CrossRef]
- Mustard, J.F.; Pieters, C.M.; Isaacson, P.J.; Head, J.W.; Besse, S.; Clark, R.N.; Klima, R.L.; Petro, N.E.; Staid, M.I.; Sunshine, J.M.; et al. Compositional diversity and geologic insights of the Aristarchus crater from Moon Mineralogy Mapper data. J. Geophys. Res. 2011, 116, E00G12. [Google Scholar] [CrossRef]
- Liu, J.; Guo, D.; Chen, S.; Sun, Y.; Chen, J.; Wang, X.; Ling, Z.; Zhang, J.; Ding, X. Chinese 1: 2.5 M geologic mapping of the global Moon. In Proceedings of the 47th Lunar and Planetary Science Conference, The Woodlands, TX, USA, 21–25 March 2016; p. 2039. [Google Scholar]
- Liu, J.-W.; Liu, J.-Z.; Zhang, L.; Ling, Z.-C.; Chen, J.; Ding, X.-Z.; Han, K.-Y.; Xu, K.-J. New Global Lunar Impact Basins’ Map Based on Remote Sensing Interpretation. In Proceedings of the 51st Lunar and Planetary Science Conference, The Woodlands, TX, USA, 16–20 March 2020; p. 1940. [Google Scholar]
- Liu, J.; Liu, J.; Yue, Z.; Zhang, L.; Wang, J.; Zhu, K. Characterization and interpretation of the global lunar impact basins based on remote sensing. Icarus 2022, 378, 114952. [Google Scholar] [CrossRef]
- Byrne, C.J. The Moon’s Largest Craters and Basins: Images and Topographic Maps from LRO, GRAIL, and Kaguya; Springer: Berlin/Heidelberg, Germany, 2016. [Google Scholar]
- Johnson, B.C.; Andrews-Hanna, J.C.; Collins, G.S.; Freed, A.M.; Melosh, H.J.; Zuber, M.T. Controls on the Formation of Lunar Multiring Basins. J. Geophys. Res. Planets 2018, 123, 3035–3050. [Google Scholar] [CrossRef]
- Giguere, T.A.; Taylor, G.J.; Hawke, B.R.; Lucey, P.G. The titanium contents of lunar mare basalts. Meteorit. Planet. Sci. 2000, 35, 193–200. [Google Scholar] [CrossRef]
- Vaughan, W.M.; Head, J.W.; Wilson, L.; Hess, P.C. Geology and petrology of enormous volumes of impact melt on the Moon: A case study of the Orientale basin impact melt sea. Icarus 2013, 223, 749–765. [Google Scholar] [CrossRef]
- De Hon, R. Thickness of mare material in the Tranquillitatis and Nectaris basins. In Proceedings of the 5th Lunar and Planetary Science Conference, Houston, TX, USA, 1 January 1974; pp. 53–59. [Google Scholar]
- Snyder, G.A.; Taylor, L.A.; Neal, C.R. A chemical-model for generating the sources of mare basalts-Combined equilibrium and fractional crystallization of the lunar magmasphere. Geochim. Cosmochim. Acta 1992, 56, 3809–3823. [Google Scholar] [CrossRef]
- Elkins Tanton, L.T.; Van Orman, J.A.; Hager, B.H.; Grove, T.L. Re-examination of the lunar magma ocean cumulate overturn hypothesis: Melting or mixing is required. Earth Planet. Sci. Lett. 2002, 196, 239–249. [Google Scholar] [CrossRef]
- Yamamoto, S.; Nakamura, R.; Matsunaga, T.; Ogawa, Y.; Ishihara, Y.; Morota, T.; Hirata, N.; Ohtake, M.; Hiroi, T.; Yokota, Y.; et al. Possible mantle origin of olivine around lunar impact basins detected by SELENE. Nat. Geosci. 2010, 3, 533–536. [Google Scholar] [CrossRef]
Publisher’s Note: MDPI stays neutral with regard to jurisdictional claims in published maps and institutional affiliations. |
© 2022 by the authors. Licensee MDPI, Basel, Switzerland. This article is an open access article distributed under the terms and conditions of the Creative Commons Attribution (CC BY) license (https://creativecommons.org/licenses/by/4.0/).