Article

Assessment of Carbon Productivity Trends and Their Resilience to Drought Disturbances in the Middle East Based on Multi-Decadal Space-Based Datasets

1
School of Geographical Sciences, Nanjing University of Information Science and Technology, Nanjing 210044, China
2
Department of Civil Engineering, College of Engineering, King Saud University, P.O. Box 800, Riyadh 11421, Saudi Arabia
3
Institute of Land Use, Technical and Precision Technology, Faculty of Agricultural and Food Sciences and Environmental Management, University of Debrecen, Böszörményi 138, 4032 Debrecen, Hungary
4
Institutes for Agricultural Research and Educational Farm, University of Debrecen, Böszörményi 138, 4032 Debrecen, Hungary
5
Department of Civil Engineering, College of Engineering, University of Diyala, Baqubah 32001, Iraq
6
Institute of Crop Science and Resource Conservation, University of Bonn, 53111 Bonn, Germany
7
Department of Geography, Mansoura University, Mansoura 35516, Egypt
*
Author to whom correspondence should be addressed.
Remote Sens. 2022, 14(24), 6237; https://doi.org/10.3390/rs14246237
Submission received: 2 November 2022 / Revised: 26 November 2022 / Accepted: 6 December 2022 / Published: 9 December 2022

Abstract

:
Gross primary production (GPP) is a key component in assessing the global change in carbon uptake and in evaluating the impacts of climate change on terrestrial ecosystems. A decrease in the photosynthetic rate due to stomata closing by vegetation could have an impact on GPP. Nonetheless, the uncertainty in long-term GPP patterns and their resilience to drought disturbances has not yet been examined thoroughly. In this study, four state-of-the-art GPP datasets, including the revised EC-LUE algorithm-driven GPP (GLASS-GPP), the EC flux tower upscaling-based GPP (FluxCom-GPP), the MODIS algorithm-driven GPP model (GIMMS-GPP), and the vegetation photosynthesis model-GPP (VPM-GPP), were used to assess GPP characteristics in the Middle East region for 36 years spanning the period of 1982 to 2016. All investigated datasets revealed an increasing trend over the study period, albeit with a more pronounced upward trend for the VPM-GPP dataset in the most recent decades (2000–2016). On the other hand, FluxCom-GPP exhibited less variability than the other datasets. In addition, while GLASS-GPP presented a significant increasing trend in some parts of the region, significant negative trends dominated the other parts. This study defined six significant drought episodes that occurred in the Middle East region between 1982 and 2017. The most severe drought events were recorded in 1985, 1989–1990, 1994, 1999–2001, 2008, and 2015, spreading over more than 15% of the total area of the region. The extreme droughts accounted for a high decline in GPP in the north of Iraq, the northeast of Syria, and the southwest of Iran, where 20.2 and 40.8% of the ecosystem’s GPP were severely non-resilient to drought according to the GLASS and VPM-based GPP responses, respectively. The spatial distribution patterns of the correlations between the SEDI and GPP products were somewhat similar and coherent. The highest positive correlations were detected in the central and western parts of Turkey, the western and northeastern parts of Iran, and north Iraq, which showed anomalous r values (r = 0.7), especially for the SEDI-VPM and SEDI-FluxCom GPP associations. The findings of this study can provide a solid base for identifying at-risk regions in the Middle East in terms of climate change impacts, which will allow for better management of ecosystems and proper implementation of climate policies.

Graphical Abstract

1. Introduction

During the last few decades, the Earth’s ecosystems have absorbed one-third of human CO2 emissions [1]; much of this absorbance occurs via carbon accumulation in forest biomass and soils [2]. The terrestrial gross primary productivity (GPP) and ecosystem respiration (ER) are the two largest fluxes in the global carbon cycle. GPP, which represents the total ecosystem carbon uptake via photosynthesis [3], tends to increase, mostly due to increased photosynthetic CO2 absorption [4]. Overall, this terrestrial uptake relieves the human increase in atmospheric CO2 levels by inducing negative feedback in the climate and carbon cycle systems [5]. It is critical to examine in what range, how long, and in which ecosystem this negative feedback and net CO2 absorption will continue.
GPP is considered one of the primary mechanisms that drives climate regulation, carbon sequestration, and carbon storage. In addition, it is seen as a key proxy for a variety of ecosystem services such as food, fiber, and fuel production, as well as the management of Earth’s habitability [1,3]. However, future predictions of ecosystem reactions and consequently the feedback strength are exceedingly unknown and uncertain. Nonetheless, recent evidence suggested that significant tropical CO2 absorption has been identified that is roughly offsetting net deforestation and demonstrating significant negative global feedback to atmospheric CO2 and climate [6]. On the contrary, the occurrence of extreme events such as droughts, heatwaves, or rainstorms, as well as the related disruptions, can partially balance carbon sinks or even cause net losses in carbon stocks, thereby releasing CO2 into the atmosphere [7,8,9]. For example, droughts can impact the global carbon balance by limiting vegetation development at different stages or within a wide range of tree mortalities and ecosystem fires [7]. Since climate extremes can produce rapid and delayed reactions in ecosystems, it is expected that even minor changes in the frequency or severity of climate extremes might significantly diminish carbon sinks and result in significant positive feedbacks to climate change [10,11,12].
Net ecosystem exchange (NEE) is commonly measured at the ecosystem scale using data from eddy covariance (EC) flux towers. NEE is defined as the sum of GPP (representing net photosynthesis) and ER (total energy return), both of which are positive in nature. Although nighttime ER can be quantified via the EC approach, daytime GPP or ER cannot be directly observed by the EC. Rather, it can be separated at the ecosystem scale by using flux-partitioning methods based on night- and daytime NEE data [13,14]. Since EC flux towers have a comparatively tiny footprint and are distributed randomly across the terrestrial ecosystems, it is crucial to create global gridded data for the GPP. In recent years, several types of models have been developed (see Table 1) that are widely used to assess the spatio-temporal trends of GPP [15,16]. Overall, these methods can be classified into three major categories. The first category is the EC flux data-driven models based on random measurements at flux tower sites. These models account for the relationships between the inferred GPP and other explanatory factors at the site level in order to estimate GPP. These covariates can then be upscaled into gridded data using machine learning algorithms [17,18]. The second category is the satellite-based models, of which the light-use-efficiency (LUE) model is a representative example [19,20,21,22,23,24]. The third category is the process-based models, which simulate the interactions between various ecosystem synthesizers [5,25] such as biochemical and physiological processes that characterize vegetation’s response to climatic and environmental conditions [15,26,27,28]. In recent decades, there have been increasing efforts to quantify GPP using satellite measurements, such as solar-induced chlorophyll fluorescence (SIF) [29], the updated two-leaf LUE model (GPP derived from sunlit and shaded leaves) [30], the P-model [31], and the BEPS model [32,33]. As a whole, these models combine process- and data-driven approaches to sidestep some of the more unsettling limitations of both complex process-based models and observed data-driven models.
However, uncertainty in GPP predictions makes their spatio-temporal patterns and trends incomprehensible. As such, it is difficult to define the potential consistency or inconsistency of the same cluster of GPP models when assessing the spatio-temporal trends and inter-annual variability of terrestrial GPP based on a single or even numerous models [16,30,34]. In this context, when recalling that droughts can affect the global carbon balance by retarding vegetation growth at various stages or within a wide range of tree mortality and ecosystem fires [35,36,37], it is difficult to accurately evaluate the response of terrestrial ecosystems to drought at different timescales, especially with the varying physiological and biochemical activities of plant growth and cultivated crops [38,39,40]. Due to its significant impact on terrestrial ecosystems and political, social, and economic systems, including hydrological processes [41], vegetation growth [42], and food security [43], drought and its spatial repercussions have frequently been the focus of several studies in the Middle East, which is prone to drought due to persistent water scarcity caused by a climate that is nearly transitional between hot–dry and cold–humid. As a result, the Middle East is a critical region for the understanding of global drought [44]. To better understand the ecosystem response to current and future climate change scenarios and to forecast possible changes in carbon cycle dynamics in the Middle East, it is crucial to evaluate the response of ecosystem productivity to drought and its long-term patterns and trends.
Based on four state-of-the-art GPP datasets, including the revised EC-LUE algorithm-driven GPP (GLASS-GPP), the EC flux tower upscaling-based GPP (FluxCom-GPP), the MODIS algorithm-driven GPP model (GIMMS-GPP), and the vegetation photosynthesis model-GPP (VPM-GPP), this study aimed to: (a) detect the spatio-temporal annual trends of GPP in the Middle East and explore whether these trends varied as a function of model parameterizations; and (b) detect GPP sensitivity to dry and wet climatic conditions and assess ecosystem resilience to anomalous drought events on the regional scale and how this resilience could vary in response to dominant land-cover types. The findings of this work, as based on these four global long-term GPP datasets, can be relevant to ecosystem management in the Middle East because they can provide insights into how different ecosystems in the region can respond to drought perturbations.

2. Materials and Methodology
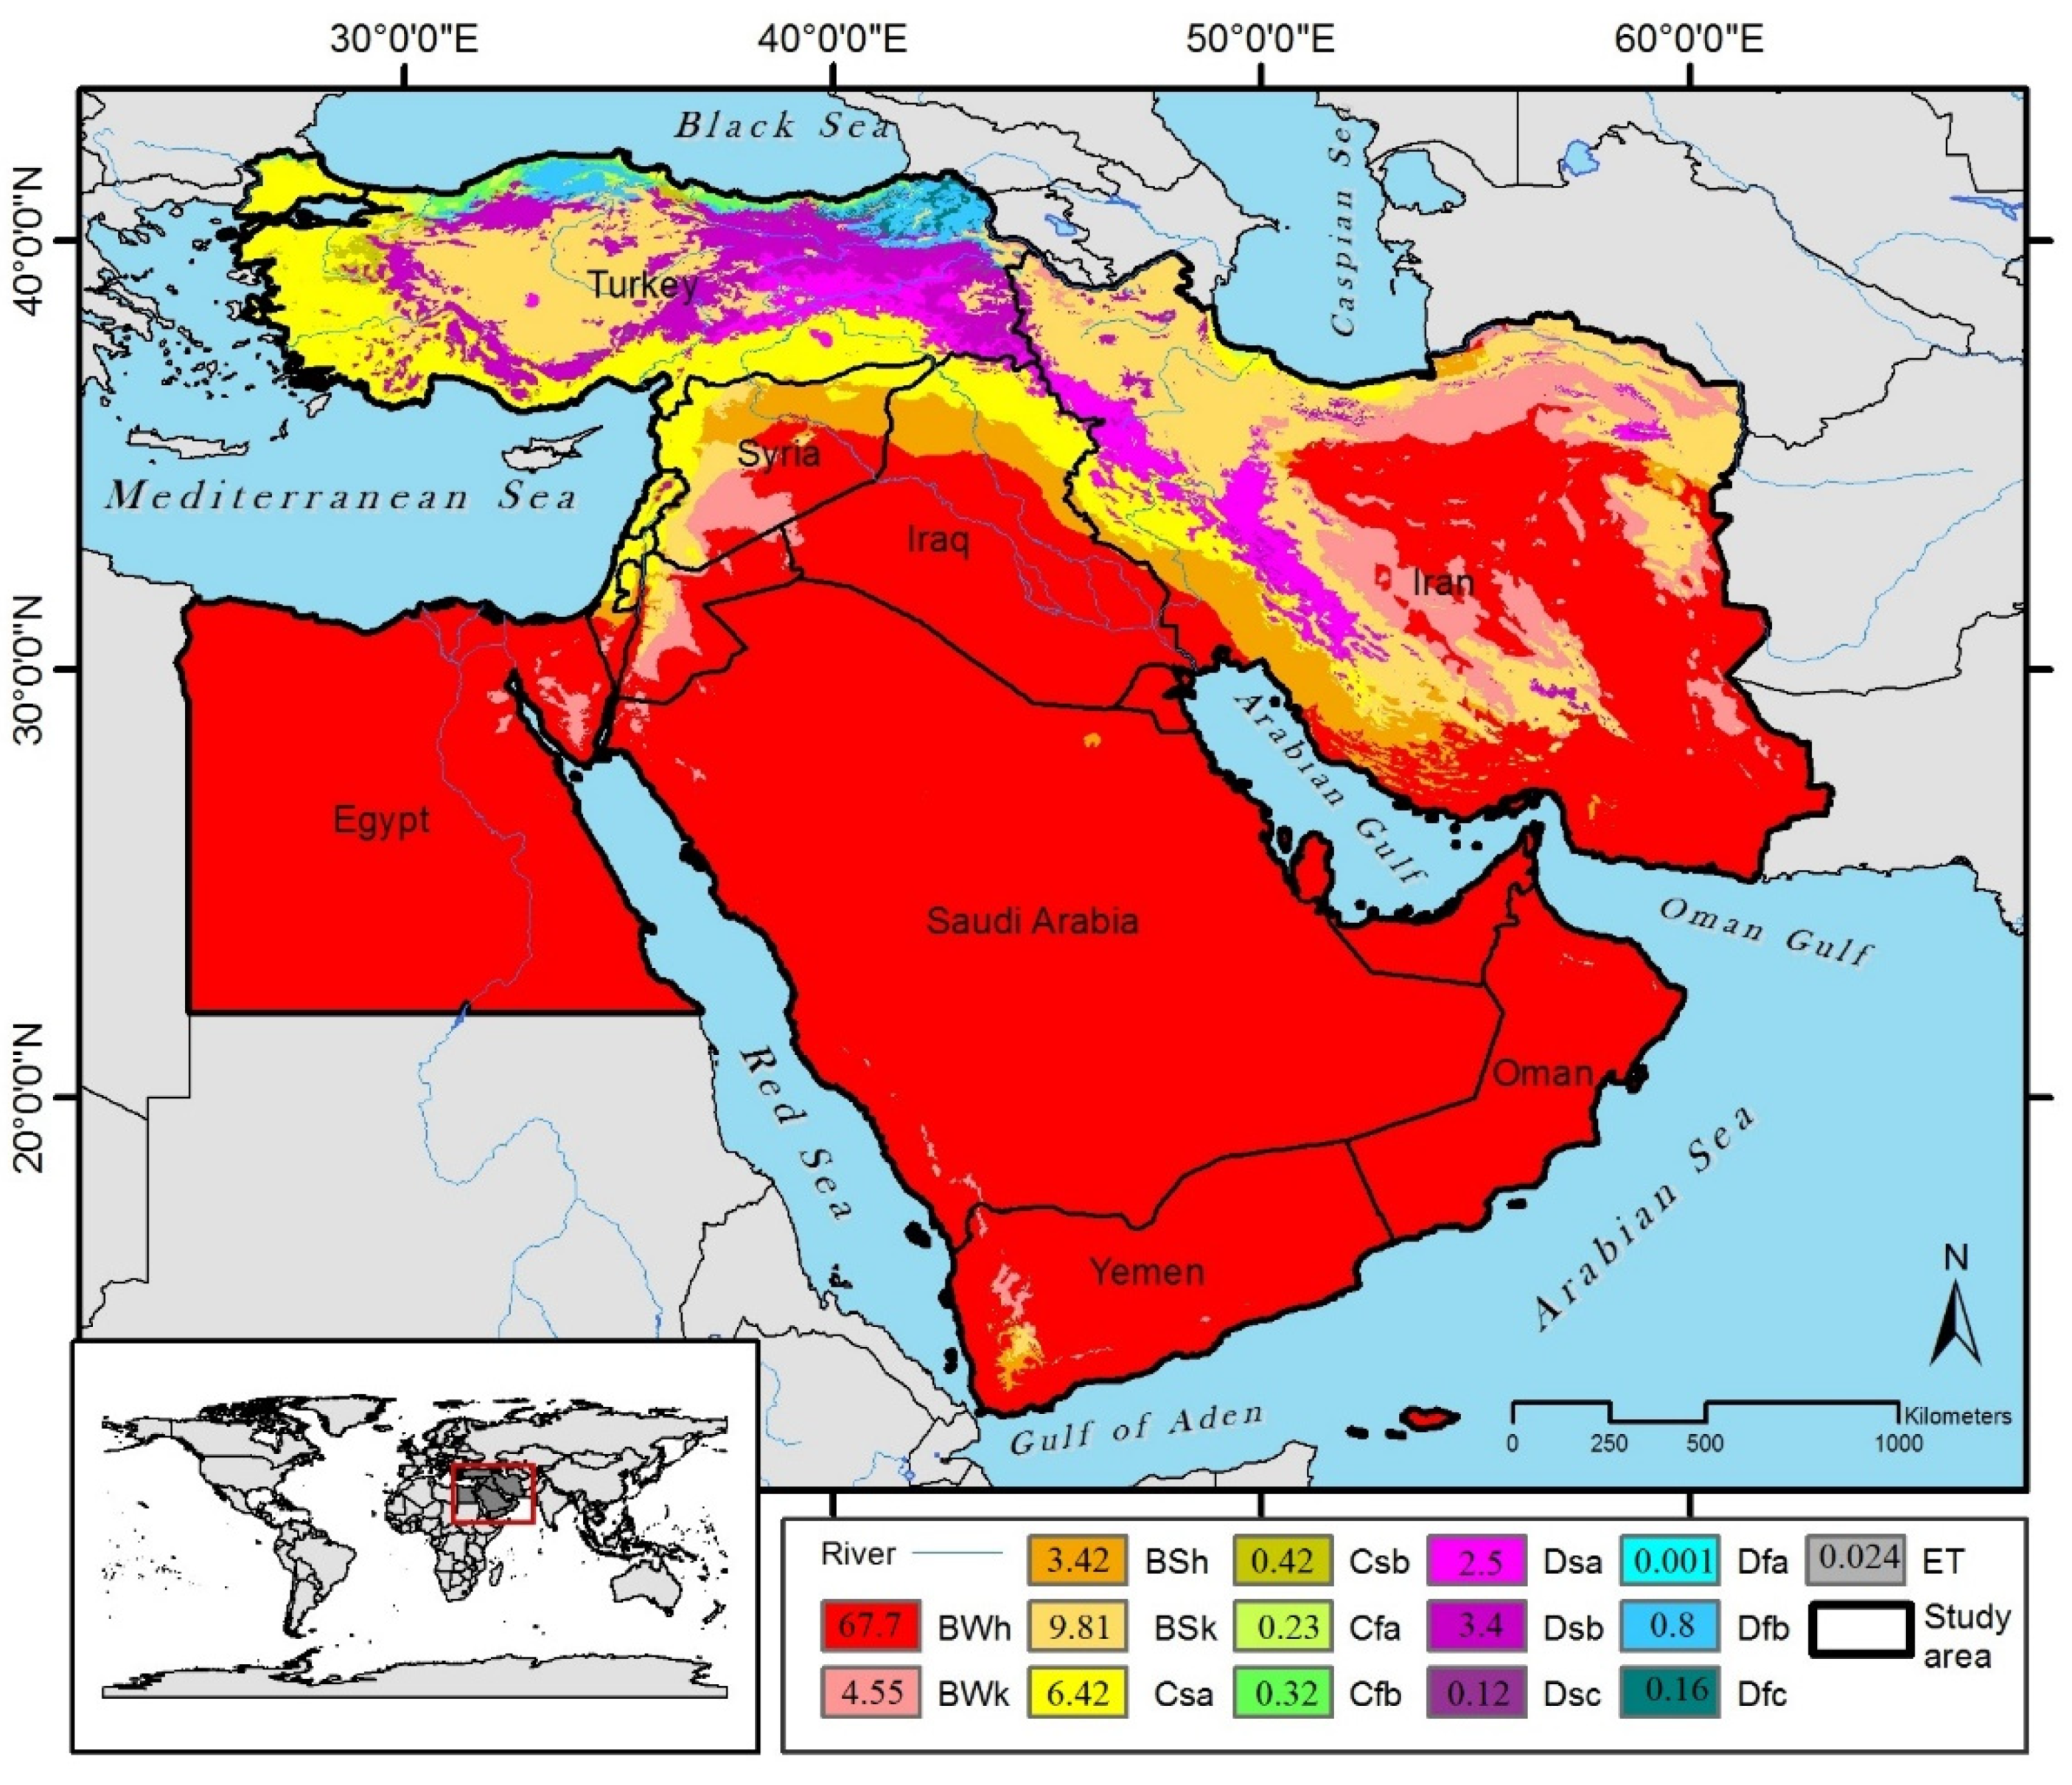
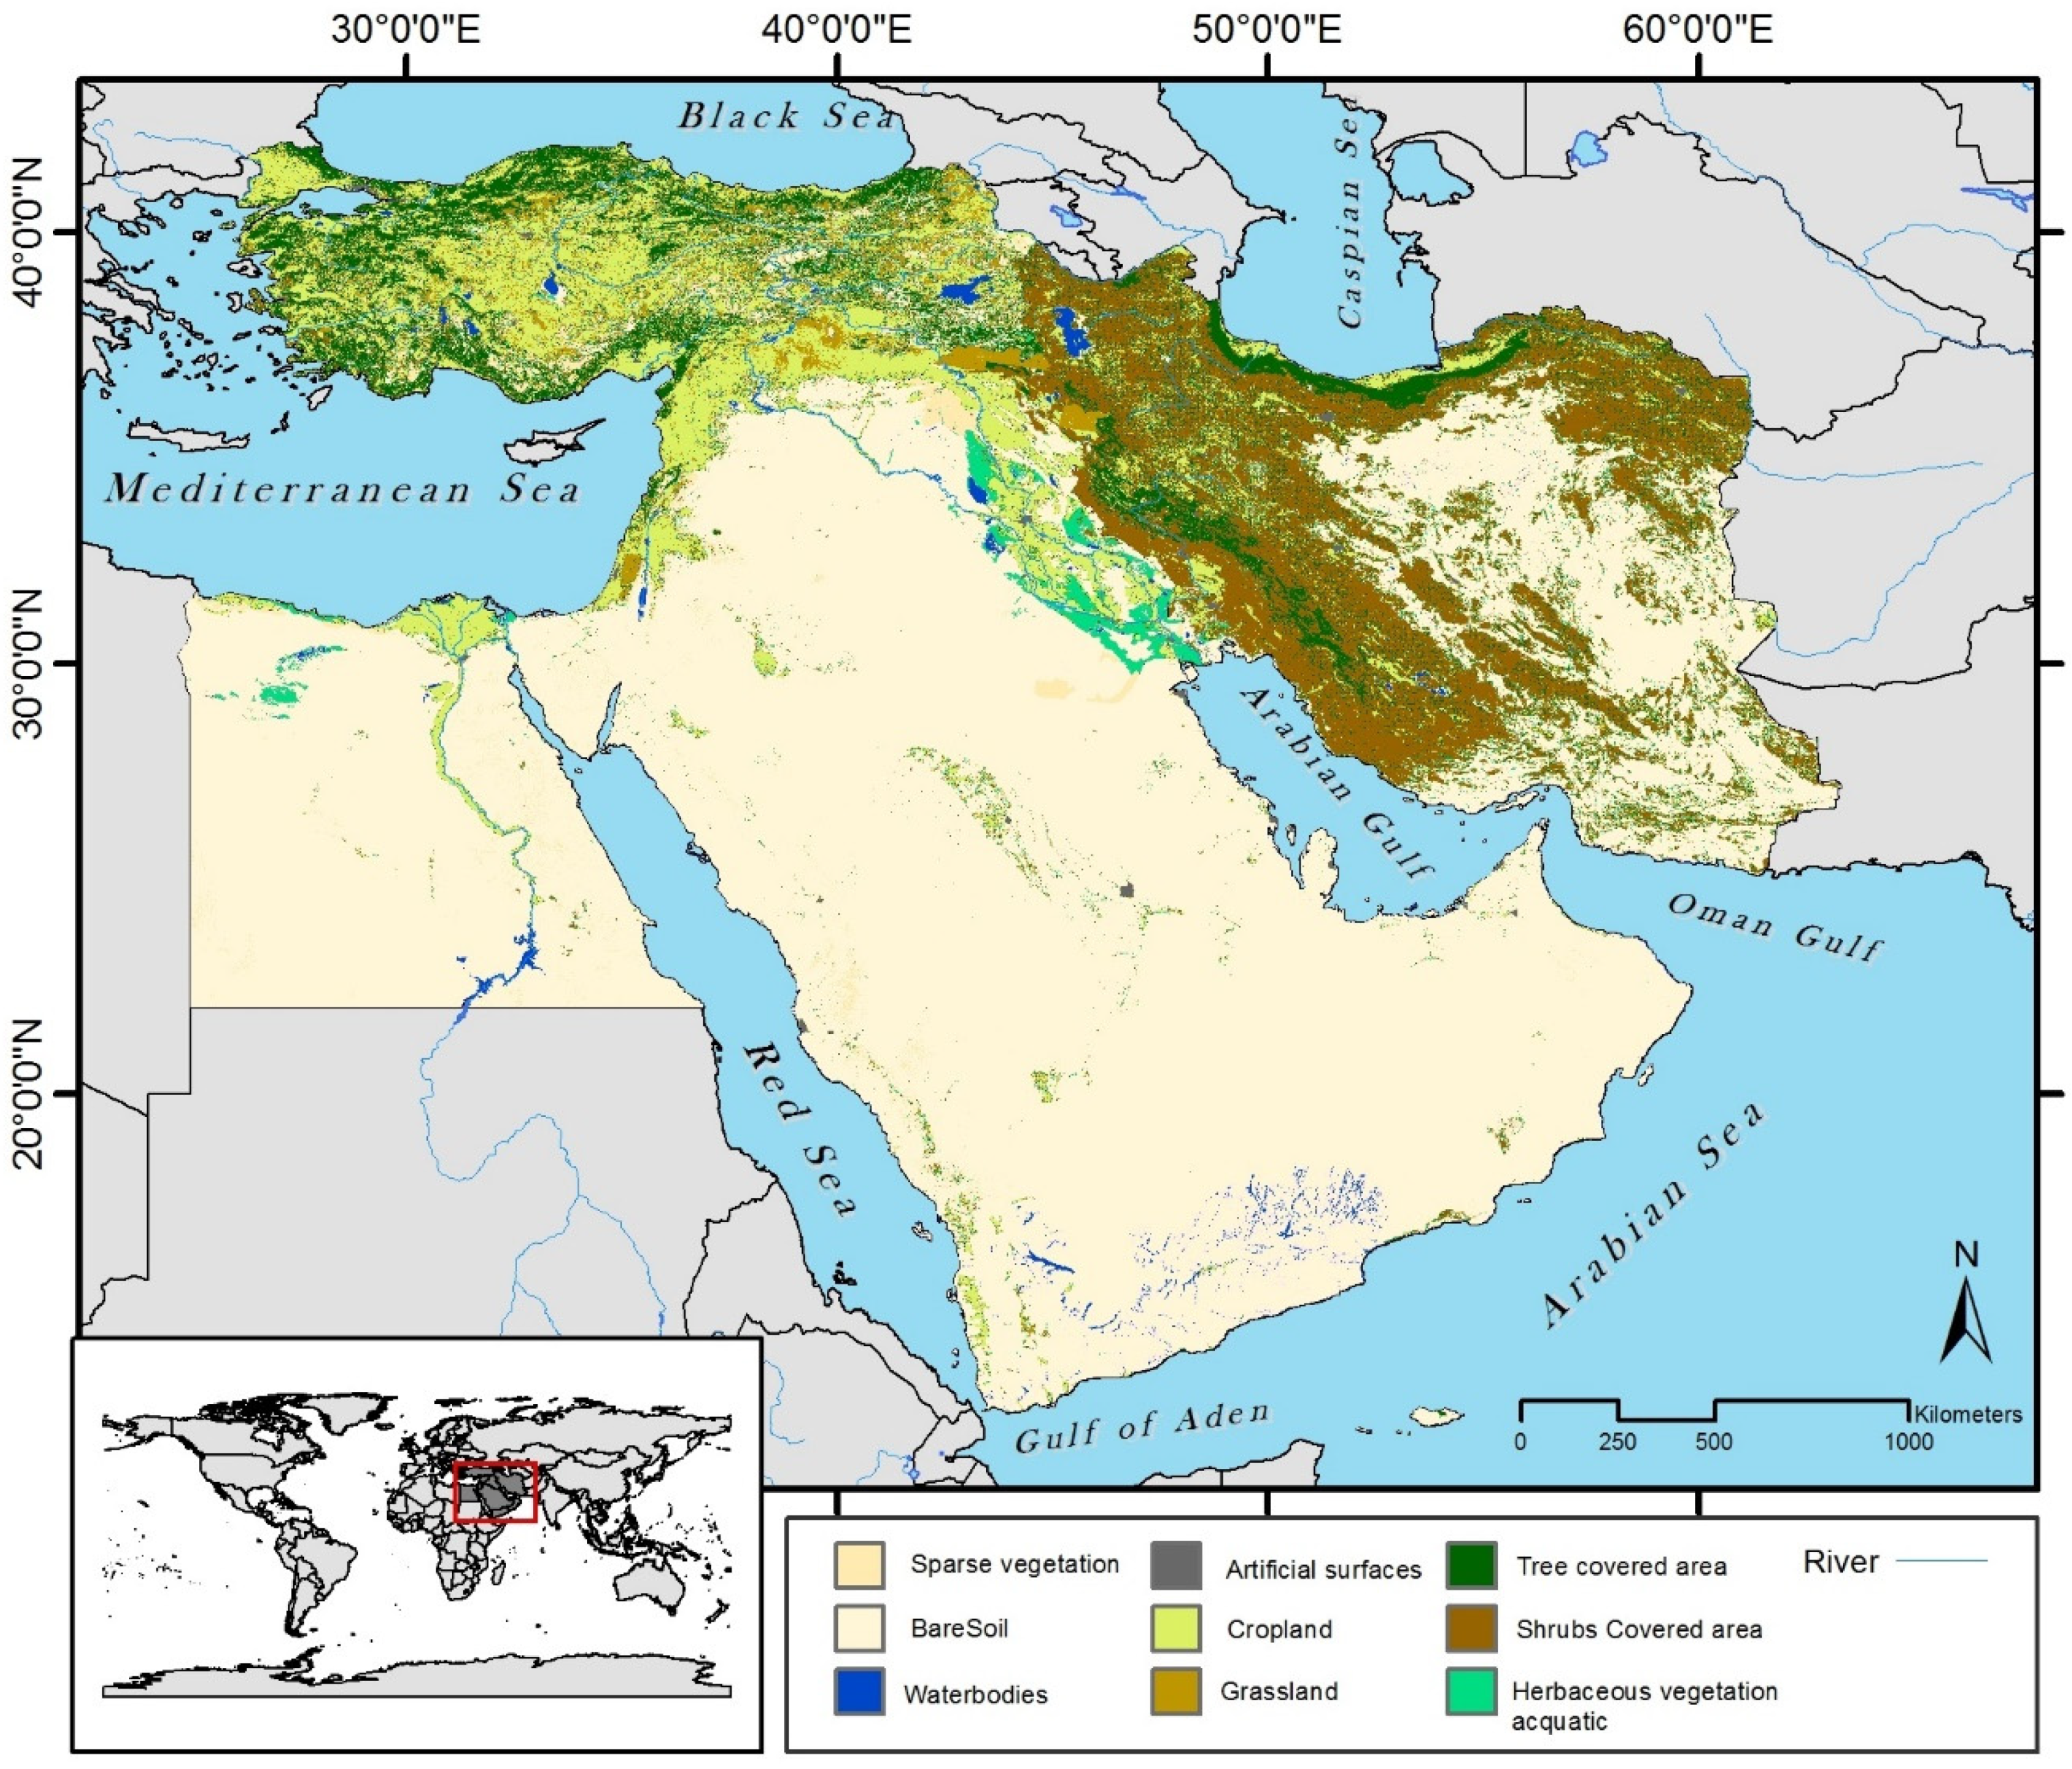
2.1. Study Area

With a land area of 6.928 × 10⁶ km2 and a total population of 357.23 million people, the Middle East region spans southwestern Asia and northeastern Africa between the latitudes of 12°06′N and 42°07′N and the longitudes of 25°E and 63°17′E (Figure 1) [49]. It comprises the Arabian Peninsula and the Levant region in addition to Egypt, Iraq, Iran, and Turkey. The dominant land-cover pattern in the region is bare land, which represents almost 65.6% of the total area, while vegetation areas (mainly shrub- and tree-covered areas, grassland, and cropland) cover roughly 31.75% of the total area [50] (See Figure A1). The region’s climate pattern is distinguished by a transitional climate that ranges from dry–hot to humid–cold. According to the Köppen–Geiger climate classification, the dominant climate pattern in the region is the hot–dry climate (BWh), which represents almost 67.7% of the total area, followed by the cold–semiarid climate (BWh) and temperate–wet climate (Csa), which represent roughly 9.8% and 6.40% of the total area, respectively [51]. Overall, the rainiest regions are situated in the northern mountain ranges due to orographic effects (e.g., the Zagros and Taurus Mountains), along the coasts of the Mediterranean and the Aegean Sea, and along the southern coasts of the Black and Caspian Seas. Due to topographical and latitudinal gradients, air temperatures are distinguished by high intra-annual variability; the annual mean temperature (1991–2020) ranged from 12 °C in the Turkish areas to 26 °C in Saudi Arabia [52]. Rainfall is highly variable over both space and time; the rainy season extends mostly between November and April. Rainfall is controlled largely by the location and frequency of the Mediterranean cyclones. However, a short, rainy summer season dominates the southern part of the region (Yemen, SW Saudi Arabia), which is influenced by the Indian and African monsoons [53].

2.2. Data Description

2.2.1. State-of-the-Art Carbon Productivity Datasets

GPP data were collected from four global datasets that included:
  • The revised EC-LUE-based GLASS-GPP: we employed the yearly GPP data at a spatial resolution of 0.05° in the period between 1982 and 2016 (https://doi.org/10.6084/m9.figshare.8942336.v3 (accessed on 18 March 2020)). This dataset was generated based on the revised EC-LUE algorithm [23] while considering the principle of LUE [19,54,55]. The main version of the EC-LUE was forced by four variables: the photosynthetically active radiation (PAR), the normalized difference vegetation index (NDVI), the Bowen ratio of sensible to latent heat flux, and the air temperature [24]. To precisely detect the long-term change in GPP, GLASS-GPP employed the revised EC-LUE algorithm, in which other variables were added to the revised version to account for the impact of several factors; e.g., the CO2 concentrations, radiation, and vapor pressure deficit (VPD) [23]. The model was superior in the sense that it detected the inter-annual variability in GPP both globally and at the site level. The revised EC-LUE incorporated key environmental factors into the estimation process, which resulted in long-term confident estimates of GPP worldwide.
  • FluxCom-GPP: this dataset was generated through upscaling of EC flux tower stations. The monthly FluxCom-GPP, which is available at a spatial resolution of 0.5°, is an ensemble of daily remotely sensed and observed data that spans the period between 1982 and 2016 [18,56,57]. Three machine learning algorithms (i.e., multivariate regression splines, artificial neural networks, and random forests) were forced by the meteorological data of the CRU JRA version 1.1 [58] to generate the gridded dataset of the FluxCom-GPP. Details of the machine learning algorithms and the training and validation framework are outlined in Tramontana et al. [18]. The dataset is available for the globe via the FluxCom platform (http://www.fluxcom.org (accessed on 6 July 2021)).
  • The Global Inventory Modeling and Mapping Studies (GIMMS-GPP): this dataset is available on a yearly basis at a grid interval of 0.05° and covers the period of 1982–2016 [48]. In this dataset, the GIMMS-FPAR (fraction of photosynthetically active radiation) data, leaf area index (LAI) data, and daily CRU-NCEP weather data were used to generate the gridded dataset of the GIMMS-GPP following O’Sullivan et al. [59]. Due to CRUNCEP’s reliability and widespread use in many models, the “CRUNCEP P1 Standard” model parameterizations were run.
  • The vegetation photosynthesis model (VPM-GPP): over 17 years (2000–2016), the VPM-GPP dataset has been made available at a 0.05° spatial resolution (https://doi.org/10.6084/m9.figshare.c.3789814 (accessed on 6 July 2021)). Using the LUE scheme, the VPM-GPP dataset was generated and GPP was estimated as the amount of light absorbed by chlorophyll in vegetation (i.e., the PAR absorbed by chlorophyll). The VPM algorithm was used to generate the VPM-GPP gridded dataset using different MODIS datasets (e.g., EVI, LSWI, nighttime LST, and land-cover types) as well as daily NCEP reanalysis II temperature and radiation data, [21].
GPP data based on the eddy covariance (EC) tower: the EC method is the most popular and straightforward way to compute the carbon flux at the ecosystem level [60]. Since 2000, EC measurement has been performed continuously in the Yatir Forest in Israel [61,62] based on the European approach; since then, it has been part of the EuroFlux and FLUXNET communities. The EC tower was installed in the central part of the Yatir Forest (longitude of 35°03′07.01″E, latitude of 31°20′42.25″N, and 658 m a.s.l.) in 2000 and has been in operation since then [63]. Since this is the only EC tower in the Middle East, the GPP data from the Yatir Forest was employed in this study. This dataset spans the period of 2000–2016 and is available via the EuroFlux database (http://www.europe-fluxdata.eu/home (accessed on 24 September 2022)).

2.2.2. Actual and Potential Evaporation

To quantify the evapotranspiration deficit index (SEDI) as well as the ecosystem’s GPP resilience and ability to tolerate droughts, the yearly evaporation estimates of the Global Land Evaporation Amsterdam Model (GLEAM, version 3.3a) were used [64,65]. In this product, the potential evaporation (PET) is estimated based on the Priestley–Taylor method, which considers the near-surface air temperature and surface net radiation as inputs. In this study, the PET and AET datasets were used on an annual basis at a spatial resolution of 0.25° for the period of 1982–2018 (www.gleam.eu (accessed on 7 May 2019)). It is well established that the actual evaporation (AET) is generally lower than the estimated PET. As such, GLEAM converted PET estimates into AET, or evaporation of bare soil (based on the land cover), by considering a multiplicative stress factor S (-) with values that ranged between 0 and 1. The AET data were calculated based on the GLEAM algorithm and validated against FLUXNET stations (eddy covariance towers) worldwide, which demonstrated a high agreement between these two independent datasets [64,65,66,67,68]. In this context, Martens et al. [65] reported an average Pearson’s correlation of 0.81–0.86 based on data from 91 FLUXNET stations. More recently, Martens et al. [66] used five FLUXNET stations and noted an average correlation that ranged from 0.68 to 0.94 with a mean absolute error (MAE) of 0.4–0.8 mm d−1. In addition, according to [67,68], the GLEAM AET dataset outperformed other evaporation datasets and had better agreement with the Budyko, LSA-SAF, and Makkink estimates.

2.3. Data Analysis

2.3.1. Assessing GPP Based on EC Tower

To assess the state-of-the-art GPP estimates, the outputs of the four models had to be plotted against the FLUXNET stations. Due to the scarcity of measured GPPs in the study area, we only used the output of the Yatir GPP data in Israel. In this study, the EC tower product from Yatir was evaluated against all of the GPP models. To evaluate the performance of the GPP, four indicators were used: (1) the Nash–Sutcliffe efficiency (NSE), (2) Wilmott’s index of agreement (d), (3) the root-mean-squared error (RMSE), and (4) the correlation coefficient (r) (Table A1). In addition, a Taylor diagram was used to evaluate the GPP performance against the GPP values of the EC tower.

2.3.2. Trends and Variability in GPP

Long-term changes in GPP were assessed for the period of 1982–2016. The magnitude of change was determined using Theil–Sen’s slope estimator, while the statistical significance of these changes was assessed using the non-parametric Mann–Kendall (M-K) statistics. The M-K test does not assume a priori distribution of the data and is less sensitive to the presence of outliers and anomalous values in the data [69]. For this reason, it has been widely applied in different environmental applications [21,70,71,72,73]. The M-K test’s S statistic [74,75] was computed as:
M K   ( S ) = k = 1 n 1 j = k + 1 n s g n ( x j x k ) : ( j > k ) ,
where x j   and x k are the GPP values in years j and k   ( j > k ) , n is the time series length, and s g n ( θ )   is the sign function expressed as:
g n ( x j x k ) = { + 1 ( i f ( x j x k ) > 0 ) 0 ( i f ( x j x k ) = 0 ) 1 ( i f ( x j x k ) < 0 ) ,                            
When n ≥ 8, the S statistic has a normal distribution, and its average and variance can be computed as:
E ( S ) = 0 ,  
Var ( S ) = n   ( n 1 ) ( 2 n + 5 ) i = 1 m t i ( t i 1 ) ( 2 t i + 5 ) 18   ,                                
Equation (4), which was used to calculate the variance in M-K (S), was based on the idea that there are tied values in the series (i.e., the same consecutive data) for modifying the variance, where m denotes the number of tied groups and is the number of data values in the i-th group. The Z statistic of the M-K test can be computed as:
Z = { s 1 var ( s ) ( s > 0 ) 0 ( s = 0 ) s + 1 var ( s ) ( s < 0 )         ,    
where the Z statistic was applied to examine the existence or non-existence of statistically significant trends at α significance level (a positive Z suggested a rising trend in the time series and a negative Z denoted a declining trend in the time series). Herein, the null and alternative hypotheses were tested at a significance level of 95% (p < 0.05).
To quantify the change ratio of the GPP trend (i.e., the change per unit time), the non-parametric Theil–Sen’s slope estimator was applied [76,77]. The merit of using this method is that it is not sensitive to the presence of extreme values; it can be computed as:
m e d i a n ( b i ) = x j x k j k , w h e r e   j > k ,  
where x j and x k are the GPP data values for years j and k (j > k). The Sen’s slope b i is the median of n values of b. The n -values of b are ranked from the smallest value to the largest, and the Sen’s slope is defined as:
Q = { b ( N + 1 ) / 2                                                           n   i s   o d d 1 2 ( b N / 2 + ( N + 2 ) / 2 )                   n   i s   e v e n     ,
Overall, the Sen’s slope ratio of trends was calculated for all gridded data points for the GPP time series spanning the period of 1982–2016.

2.3.3. Drought Characterization

To characterize the drought severity in the region, we applied the SEDI at the annual time scale, which accounted for the standardized difference between the actual and potential evapotranspiration (AET-PET) [49,78]. The SEDI was computed for each grid point (0.25°) over the period of 1982–2016. The normality of the calculated SEDI was tested for each grid point using the Shapiro–Wilk (S-W) statistic [79]. The aim was to test whether the SEDI followed a normal distribution. The statistical significance of the S-W test was assessed at the 95% level (p < 0.05). The normality test confirmed that almost 79% of the SEDI time series followed a standard normal distribution, which demonstrated the applicability of the SEDI in the characterization of droughts over a large extent across the Middle East region without biasing the index data or increasing or underestimating the drought severity.

2.3.4. Resilience Analysis

The ecosystem’s GPP resilience was assessed based on its ability to tolerate external disorders (such as droughts) while maintaining the same pattern and trend under severe to extreme conditions [80,81]. Our research considered the ecosystem’s GPP resilience (ERI) as a functional index by quantifying GPP resilience to drought as follows:
E R I = G P P i o G P P i ( τ )   ,
where ERI is the ecosystem’s GPP resilience index, G P P i o is the observed GPP in the driest year, and G P P i ( τ ) is the value of the de-trended value of GPP in the same year. The values of the ERI could be classified into four categories, which were predetermined for crop resilience as follows: slightly non-resilient (0.9 < ERI < 1), moderately non-resilient (0.8 < ERI < 0.9), and severely non-resilient (ERI < 0.8) [80,82]. The driest year for each pixel was defined using the lowest annual SEDI over the study period.
Finally, the Pearson correlation (r) was used to examine the relationships between the SEDI and GPP as well as to detect the consistency among the GPP models (i.e., the spatial cross-correlation analysis) in terms of trends and their resilience to severe drought.

3. Results

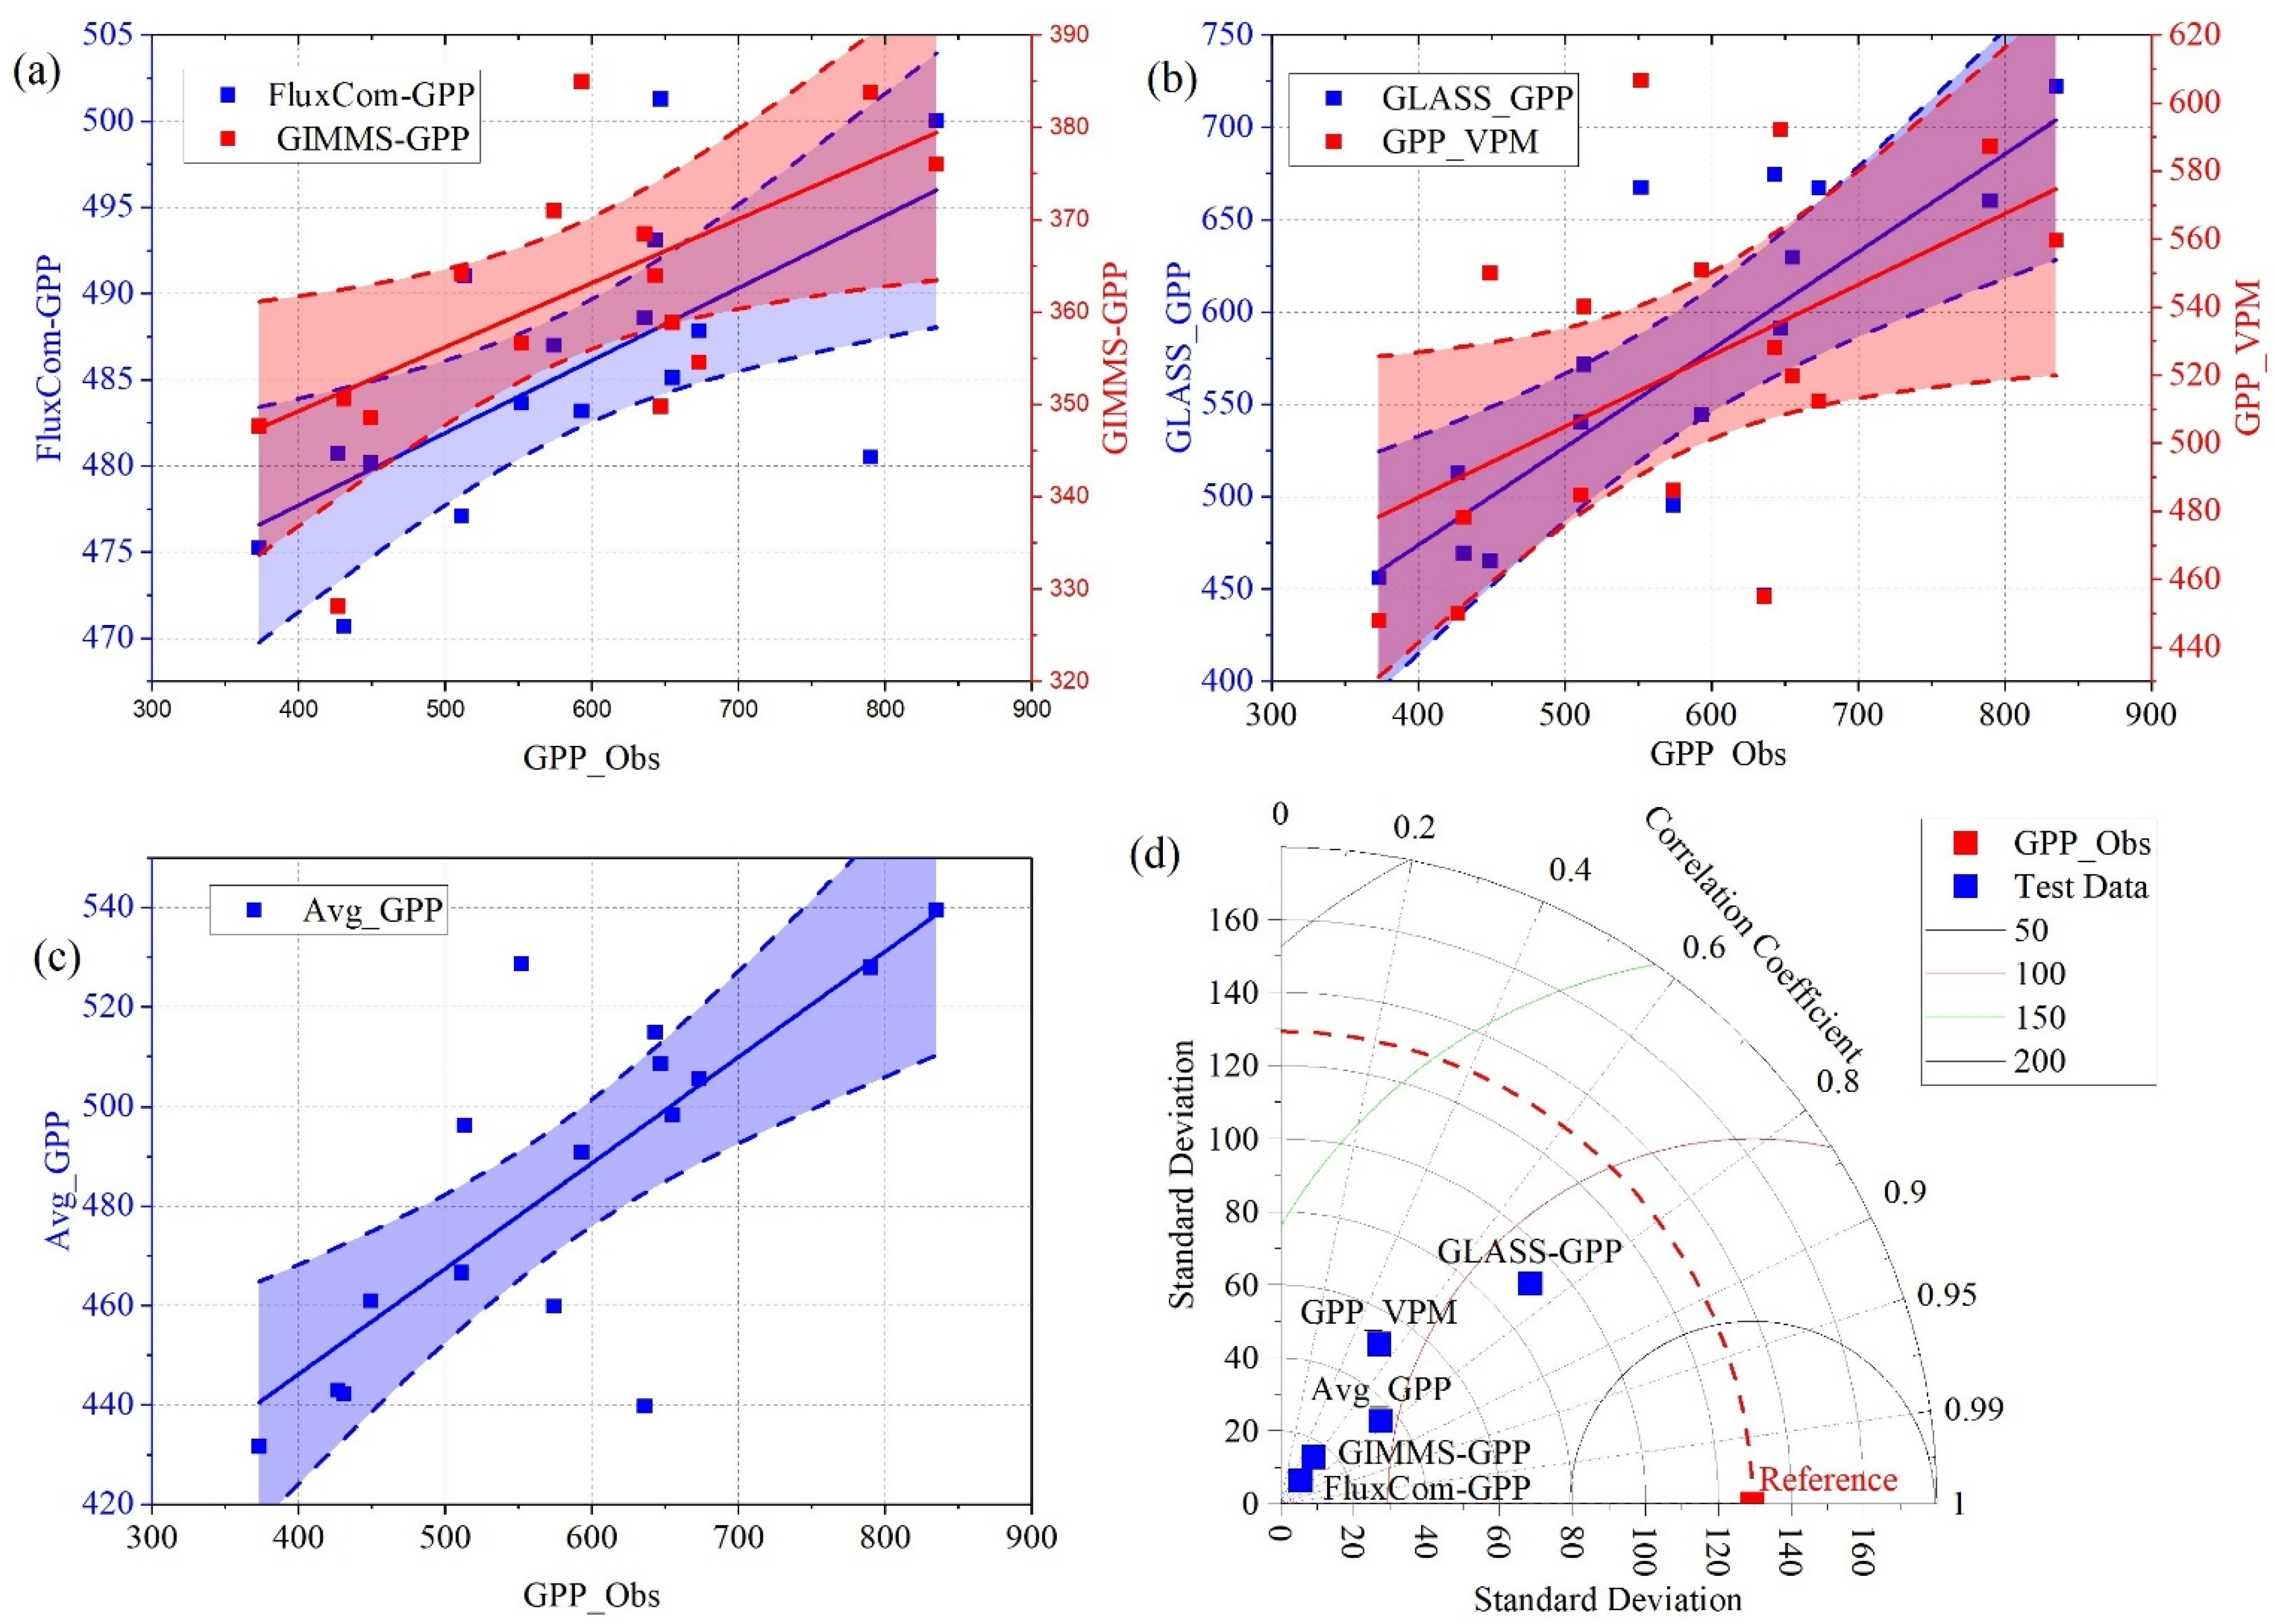
3.1. Performance of GPP Products against EC Tower

The GPP was extracted from all datasets and validated against the EC tower in Yatir Forest (Israel) for the common period of 2001–2016. Overall, the accuracy metrics suggested a good agreement between the GLASS-GPP and EC-GPP datasets with a Pearson’s correlation coefficient of 0.76 and an RMSE of 84 gCm−2 yr−1. This finding was confirmed by the Taylor diagram given that the averaged-GPP correlation value was 0.77 but with a higher RMSE value (139 gCm−2 yr−1). In comparison to GLASS-GPP, the other products showed lower correlations (0.52 to 0.61) with EC-GPP (Figure 2 and Table 2).

3.2. Dynamic Change in Ecosystem GPPs

Recalling that the GLASS-GPP showed the best performance for observed GPP, we present the magnitude of changes in the GLASS-GPP time series and their statistical significance using the Z-statistic. As shown in Figure 3, the Z-statistic for the majority of the GPP time series was 1.95 or more (p < 0.05). GLASS-GPP showed a significant increasing trend in Turkey, west Iran, and Syria, while the western portions of Egypt and south Saudi Arabia witnessed significant negative trends (Figure 3). As illustrated in Figure 3, the annual GLASS-GPP exhibited significant trends over the whole domain and had slope values ranging from −1 to 60 gCm−2 yr−1. The greatest changes were observed in the Nile Delta and along the Nile River, which had values ranging from 7.5 to 60 gCm−2 yr−1. Conversely, changes in Egypt’s eastern and western deserts were less pronounced and had values ranging from 0 to 3.5 gCm−2 yr−1. In Turkey, the changes were in the range of 3.5–15 gCm−2 yr−1 but were much weaker (<3.5 gCm−2 yr−1) in central Turkey. In Saudi Arabia, changes in GLASS-GPP varied from −1 to 3.5 gCm−2 yr−1 compared to a range of −1 to 3.5 gCm−2 yr−1 in Oman, Yemen, and the eastern part of Iran.
However, for more insights into the regional trends of GPP across the region, we also looked at changes in GPP using the different GPP datasets. This comparison was restricted to the common period (1982–2016) for all products. Moreover, we looked at the short-term changes in GPP by dividing the entire study period into two identical short sub-periods: 1982–1999 and 2000–2016.
For almost all products, the regional GPP in the Middle East showed an increasing trend between 1982 and 2016 except for FluxCom-GPP, which suggested a decreasing trend (Figure 4). Notably, the GLASS-GPP dataset showed a significant upward trend from 1982 to 1999 and then a decreasing trend from 2000 to 2016. The highest GLASS-GPP value was noted in 2013 (1.53 PgC), while the lowest was observed in 1989 (1.09 PgC) followed by 2008 (1.23 PgC). In contrast, the GIMMS-GPP’s series slope was +0.0026 PgC yr−1 (p < 0.05) for the period of 1982 to 1999; it then showed a significant increasing trend after 2000 to +0.0052 PgC yr−1. The highest GPP value was observed in 2016 (0.709 PgC), while the lowest was seen in 2008 (0.613 PgC).
In comparison to other products, the VPM-GPP showed the highest increasing magnitude over the study period of +0.019 PgC yr−1 (p < 0.05); the highest value was recorded in 2016 (1.57 PgC) and the lowest in 1982 (1.116 PgC) (Figure 4). Interestingly, the datasets based on machine learning models (e.g., FluxCom-GPP) showed the least inter-annual variability amongst all of the products.
Based on several GPP products, our findings showed a significant variation in the spatio-temporal trends of the GPP in the Middle East (Figure 5). Even though there was some consistency in the trend patterns across several GPP datasets for some products, we found significant variations in the trend values across these GPP datasets. As presented in Figure 5, a significantly increasing trend in GPP was recorded in the northern parts of the study area between 1982 and 2016 as shown by the GLASS, GIMMS, and VPN models. In contrast, a significantly decreasing trend was detected in the central and southern parts of the study area.

3.3. SEDI-Based Drought in the Middle East

An assessment of the drought characteristics in the Middle East using the SEDI revealed that a total of six significant drought events occurred in 1985, 1989–1990, 1994, 1999–2001, 2008, and 2015 (Figure 6). The very extreme and extreme droughts of 1989–1990 and 1999–2001 covered approximately 8–12% and 12–15.1% of the total area, respectively. Severe droughts dominated more than 15% of the area in 1985, 1990, 1994, 1999–2001, and 2008. The 2000 severe, extreme, and very extreme droughts, which covered roughly 42% of the total area, were the worst observed droughts in terms of intensity, duration, and area, especially over the eastern and southern parts of the region. On the other hand, the 2008 drought event, which was the second-worst recorded event ever recorded in the region, covered about 33.5% of the total area and mainly dominated in the northern parts of the region.

3.4. Relationships between GPP and Dry–Wet Conditions of the SEDI

This part of the study aimed to detect whether the GPP was sensitive to the SEDI variability and exceedingly related to its dry–wet climatic condition. Herein, the efficiency of the SEDI in detecting drought influences on carbon production was evaluated. Figure 7 depicts the spatial distribution of correlation values between the four GPP datasets and the SEDI from 1982 to 2016. The results indicated that the regional average correlations between GPP and the SEDI were 0.20, 0.33, 0.41, and 0.50 for the GLASS, GIMMS, VPM, and FluxCom models, respectively. The spatial distribution patterns of the correlations between the SEDI and GPP products were somewhat similar and coherent. Based on the pairwise comparisons, the cross-correlations value between the GLASS-GPP and FluxCom-GPP responses to dry–wet conditions of the SEDI was 0.61, but the response patterns in the other GPP models were less coherent and had a cross-correlations value ranging from 0.35 to 0.59 (e.g., the FluxCom and VPM models’ response pattern was the lowest); however, it was still statistically significant. The highest positive correlations were detected in the central and western parts of Turkey, the western and northeastern parts of Iran, and north Iraq, which had anomalous r values (r = 0.7), especially for the SEDI-VPM and SEDI-FluxCom GPP associations.

3.5. Resilience of the Ecosystem’s GPP to Drought Disturbances

The spatial distribution of ERI values was based on GLASS-GPP because it is a high-resolution product (0.05 arc degree) that is able to evaluate the ERI for each land-cover type separately at a national level. As illustrated in Figure 8, most of the ecosystems in the study area were resilient to drought: there was a resilience of 36.1% for the total area. The severely non-resilient area encompassed 28.1% of the total area. Spatially, the highest ecosystem resilience was mainly concentrated in the southern part of the region including Saudi Arabia, Oman, and Yemen. On the contrary, severe non-resilience was mainly located in the northern parts in Turkey, Syria, and Iraq. Slightly non-resilient areas covered 21.6% of the total area and were more concentrated in the eastern part of Egypt and the southern part of Saudi Arabia.
Saudi Arabia had the highest ERI values compared with the other countries followed by Oman and Egypt. In contrast, the ecosystems of Syria, Iraq, and some parts of Yemen exhibited lower ERI values. The shrub-covered area (SCA), tree-covered area (TCA), and grassland (Gr) ecosystems in Iraq had the lowest ER values and were classified as severely non-resilient ecosystems. The grassland (Gr), cropland (Cr), and bare soil (BS) ecosystems in Syria; the herbaceous vegetation aquatic (HV) ecosystem in Turkey; and the sparse vegetation (SV) ecosystem in Oman all had lower ERI values and were also classified as severely non-resilient (Figure 8).
The extreme droughts accounted for a high decline in GPP in the north of Iraq, the northeast of Syria, and the southwest of Iran (Figure 9), where 0.2 and 3.1% of the ecosystem GPP were severely non-resilient to drought according to the FluxCom and GIMMS model-based GPP, respectively; while 20.2 and 40.8% of the ecosystem GPP for both the GLASS and VPM products, respectively, were severely non-resilient. As such, GLASS and VPM showed similar results regardless of the ERI values presented that were different from those of FluxCom and GIMMS. As illustrated in Figure 9c, based on the pairwise comparisons, the cross-correlation values between the ERIs of GPP models in response to extreme droughts were less than 0.48 for all models and the ERI patterns in all GPP models were moderately coherent.

4. Discussion

4.1. Inconsistency in Distinguished GPP Trends and Their Responses to Drought

The climate over the Middle East was characterized by hot to warm temperatures, short (winter) rainy seasons, and a favorable radiation amount and duration for vegetation growth, which combined together to induce a high annual variability in GPP in the study area. However, variability in vegetation productivity is not always linked to climatic factors alone but is also related to human activity [83,84,85]. The GPP for several ecosystems showed an increasing trend in the Middle East. Regardless of the ecosystem type, the annual averages of GPP showed an increasing trend between 1982 and 2016. Spatially, these increasing trends were more prominent in the northwest part of the region. In addition, the results indicated a slight decrease in GPP with a slower rate in the central portion of eastern Iran. There were various prospective catalysts for long-term increments in the terrestrial carbon pool (GPP); the most significant ones were climate change, land-use and land-cover changes, and increasing concentrations of atmospheric CO2 [86]. The distinguished long-term trend in GPP across the region supported the hypothesis of increased CO2 concentrations in the atmosphere leading to increased CO2 uptake [87], and the revised EC-LUE model supported a positive effect of CO2 fertilization on vegetation productivity [23]. Because FluxCom did not account for the CO2 fertilization effects, the lack of trends did not contradict but rather confirmed this hypothesis [57]. According to Wild et al. [88], there was a somewhat strong agreement between the predicted GPP and in situ FLUXNET-GPP trends. It was nevertheless difficult to reach conclusive judgments on the occurrence, extent, and causes of long-term trends in GPP. As a result, the worldwide impact of atmospheric CO2 on vegetation GPP remains ambiguous, but the analyzed GPP models provided insights into the long-term GPP trends and may aid in identifying and quantifying the driving variables to increase the long-term GPP.
Based on several GPP products falling into the same cluster, our findings suggested a significant degree of uncertainty in the GPP spatial trends in the Middle East, although the explained trends in various GPP datasets were somewhat similar for some models regardless of the magnitude of the trend. One key explanation for the models’ low performance and inconsistency in presenting the inter-annual trends is that the influence of environmental controls on vegetation productivity was not fully included in some models [89]. However, there is little agreement on the relevance of various drivers of spatio-temporal changes in GPP. Ecosystem models continue to diverge in their representation of the relative influences of various environmental controls; a better understanding of these controls is essential if future carbon cycle dynamics are to be reliably anticipated [90,91]. As such, ecosystem models are heavily influenced by a number of variables such as nitrogen deposition, CO2 concentration, climatic variables, and land-use/land-cover types [92]. Some earth-system models suggested that soil moisture would also have a significant impact on long-term CO2 absorption [93]. The availability of nutrients, especially phosphorus (P) and nitrogen (N), which play key roles in controlling vegetation photosynthesis and development, is assumed to be a constraint on GPP [94,95]. Thus, long-term GPP changes reflect a complex balance of numerous interacting biophysical (e.g., temperature and water) and biogeochemical (e.g., carbon dioxide and nutrients) feedbacks. According to O’Sullivan et al. [96], long-term increases in nitrogen deposition resulted in a considerable rise in CO2 fertilization, and carbon-nitrogen synergy was a key contribution to the present terrestrial carbon sink.
On the other hand, although the correlation patterns between the annual SEDI and GPP datasets were similar for some models (e.g., the FluxCom response to the SEDI against the GIMMS and GLASS responses), they were different in others. Notably, the values of cross-correlations significantly varied among GPP datasets. However, the results confirmed that there was a significant positive relationship between the ecosystem’s carbon absorption and soil-water deficit as revealed in the SEDI. The SEDI may detect terrestrial carbon fluxes and their long-term variation by reflecting the influence of water stress on plant growth under extreme events such as drought and documenting the significant relationship between vegetation and the evapotranspiration deficit [78]. As a result, the SEDI is based on evaporative stress, which is more directly related to vegetation moisture stress than other drought indices [49]. The PET measures the potential of the atmosphere to accept water or evaporative demand and controls soil-water stress, whereas the AET measures the quantity of water lost from an ecosystem due to evaporation and transpiration. The evaporation deficit (ED) is the difference between the AET and the PET from an ecological and agricultural standpoint. A high ED under climatic stress causes stomatal closure, which reduces accumulated carbohydrates, photosynthetic processes, and ecosystem respiration, thereby resulting in a high reduction in carbon absorption and thus positive feedback to climate change [5,7,11].
Based on the correlations between the GPP products and the SEDI, it can be noted that there were significant differences between the four GPP products in terms of ERI-driven GPP (Figure 7 and Figure 9), and choosing one that significantly outperformed the others was difficult [38]. This showed that we should be careful when using GPP estimates from remote sensing, process-based models, or machine learning or when evaluating GPP responses to drought using these products.

4.2. Uncertainty and Limitations

Due to the varying drought sensitivities of different types of terrestrial ecosystems as well as the interactions between drought and other environmental variables, judgments on regional and global GPP responses to drought are highly uncertain [97]. For instance, satellite-based GPP models do not take into account the interconnected physiological and ecological processes and therefore tend to neglect the increased consequences of ecosystem responses during extreme climatic events [98]. The flux-tower-based FluxCom GPP model, which is forced by machine learning algorithms, may be considered as in situ GPP estimates and thus is widely used to estimate GPPs from multi-decadal space-based datasets and process-based models. However, it provides a poor representation of certain fundamental processes including nitrogen deposition and CO2 fertilization, making it difficult to detect GPP annual changes adequately [56,99]. While the LUE-based model often provides inconsistent long-term trends in GPP due to the absence of key critical processes such as the direct effects of soil moisture and CO2 fertilization on LUE [100,101] it recently was improved by including CO2 effects on LUE photosynthesis (the revised EC-LUE) [23]. However, the revised EC-LUE model did not account for the effect of the soil nitrogen content on photosynthesis in the model. This aspect is critical given that atmospheric nitrogen deposition has increased dramatically in recent decades as a result of immoderate fossil fuel combustion in the transportation and industrial sectors as well as the misuse of nitrogenous fertilizer in agricultural practices [102].
In this context, Stocker et al. [100] revealed that GPP estimates based on remote sensing underestimate the impacts of drought on GPP due to insufficient parameterization in the model such as accounting for the possible impact of soil moisture on the LUE. Some studies have shown that the VPM [49,103] and modified VPM [104] outperformed other GPP estimates in detecting the effect of droughts on GPP due to the inclusion of the impact of soil moisture on photosynthesis in the models, which was presented in our study and several other studies [105,106]. As a result, water-deficit variables (e.g., LSWI in the VPM) that reflect plant ecological and physiological characteristics rather than atmospheric moisture (e.g., the VPD parameter included in the revised EC-LUE) should be considered further in GPP estimates, particularly when used during drought events [106]. Furthermore, fPAR, EVI, NDVI, and LAI remote sensing data may have limitations that contribute to the excess variance in trained variables and result in a poor output in model-parameter adjustment, thus resulting in significant uncertainty in the simulated GPP [107,108]. In general, we selected the SDEI as an influencing factor that reflected the climatic impacts on GPP; however, human interventions also can have an impact on the GPP. As such, a method to quantify the contribution of each influencing factor and extract information that can fully reflect the effects of human interventions will be another focal point of our future work. Furthermore, in terms of discrepancies in the results reported by different GPP products, more attention could be paid to investigating the causes of these discrepancies and determining their sources to reduce uncertainty. However, these findings provided a significant incentive to better comprehend the spatio-temporal changes in terrestrial GPP to meet the increasing requests of global climatic, environmental, and ecological research.

5. Conclusions

-
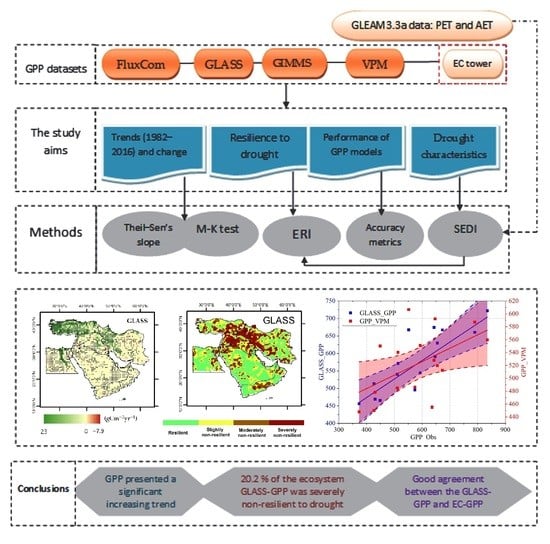
Based on four state-of-the-art GPP datasets, we evaluated the performances of the GPP products against the EC data to detect the long-term trends in the GPP and their resilience to drought disturbance in the Middle East for the period of 1982 to 2016. Overall, the main results of this research can be summarized as given below.
-
The GPP dataset validation demonstrated a good agreement between the GLASS-GPP and EC-GPP datasets, while a low performance was noticed for the other products.
-
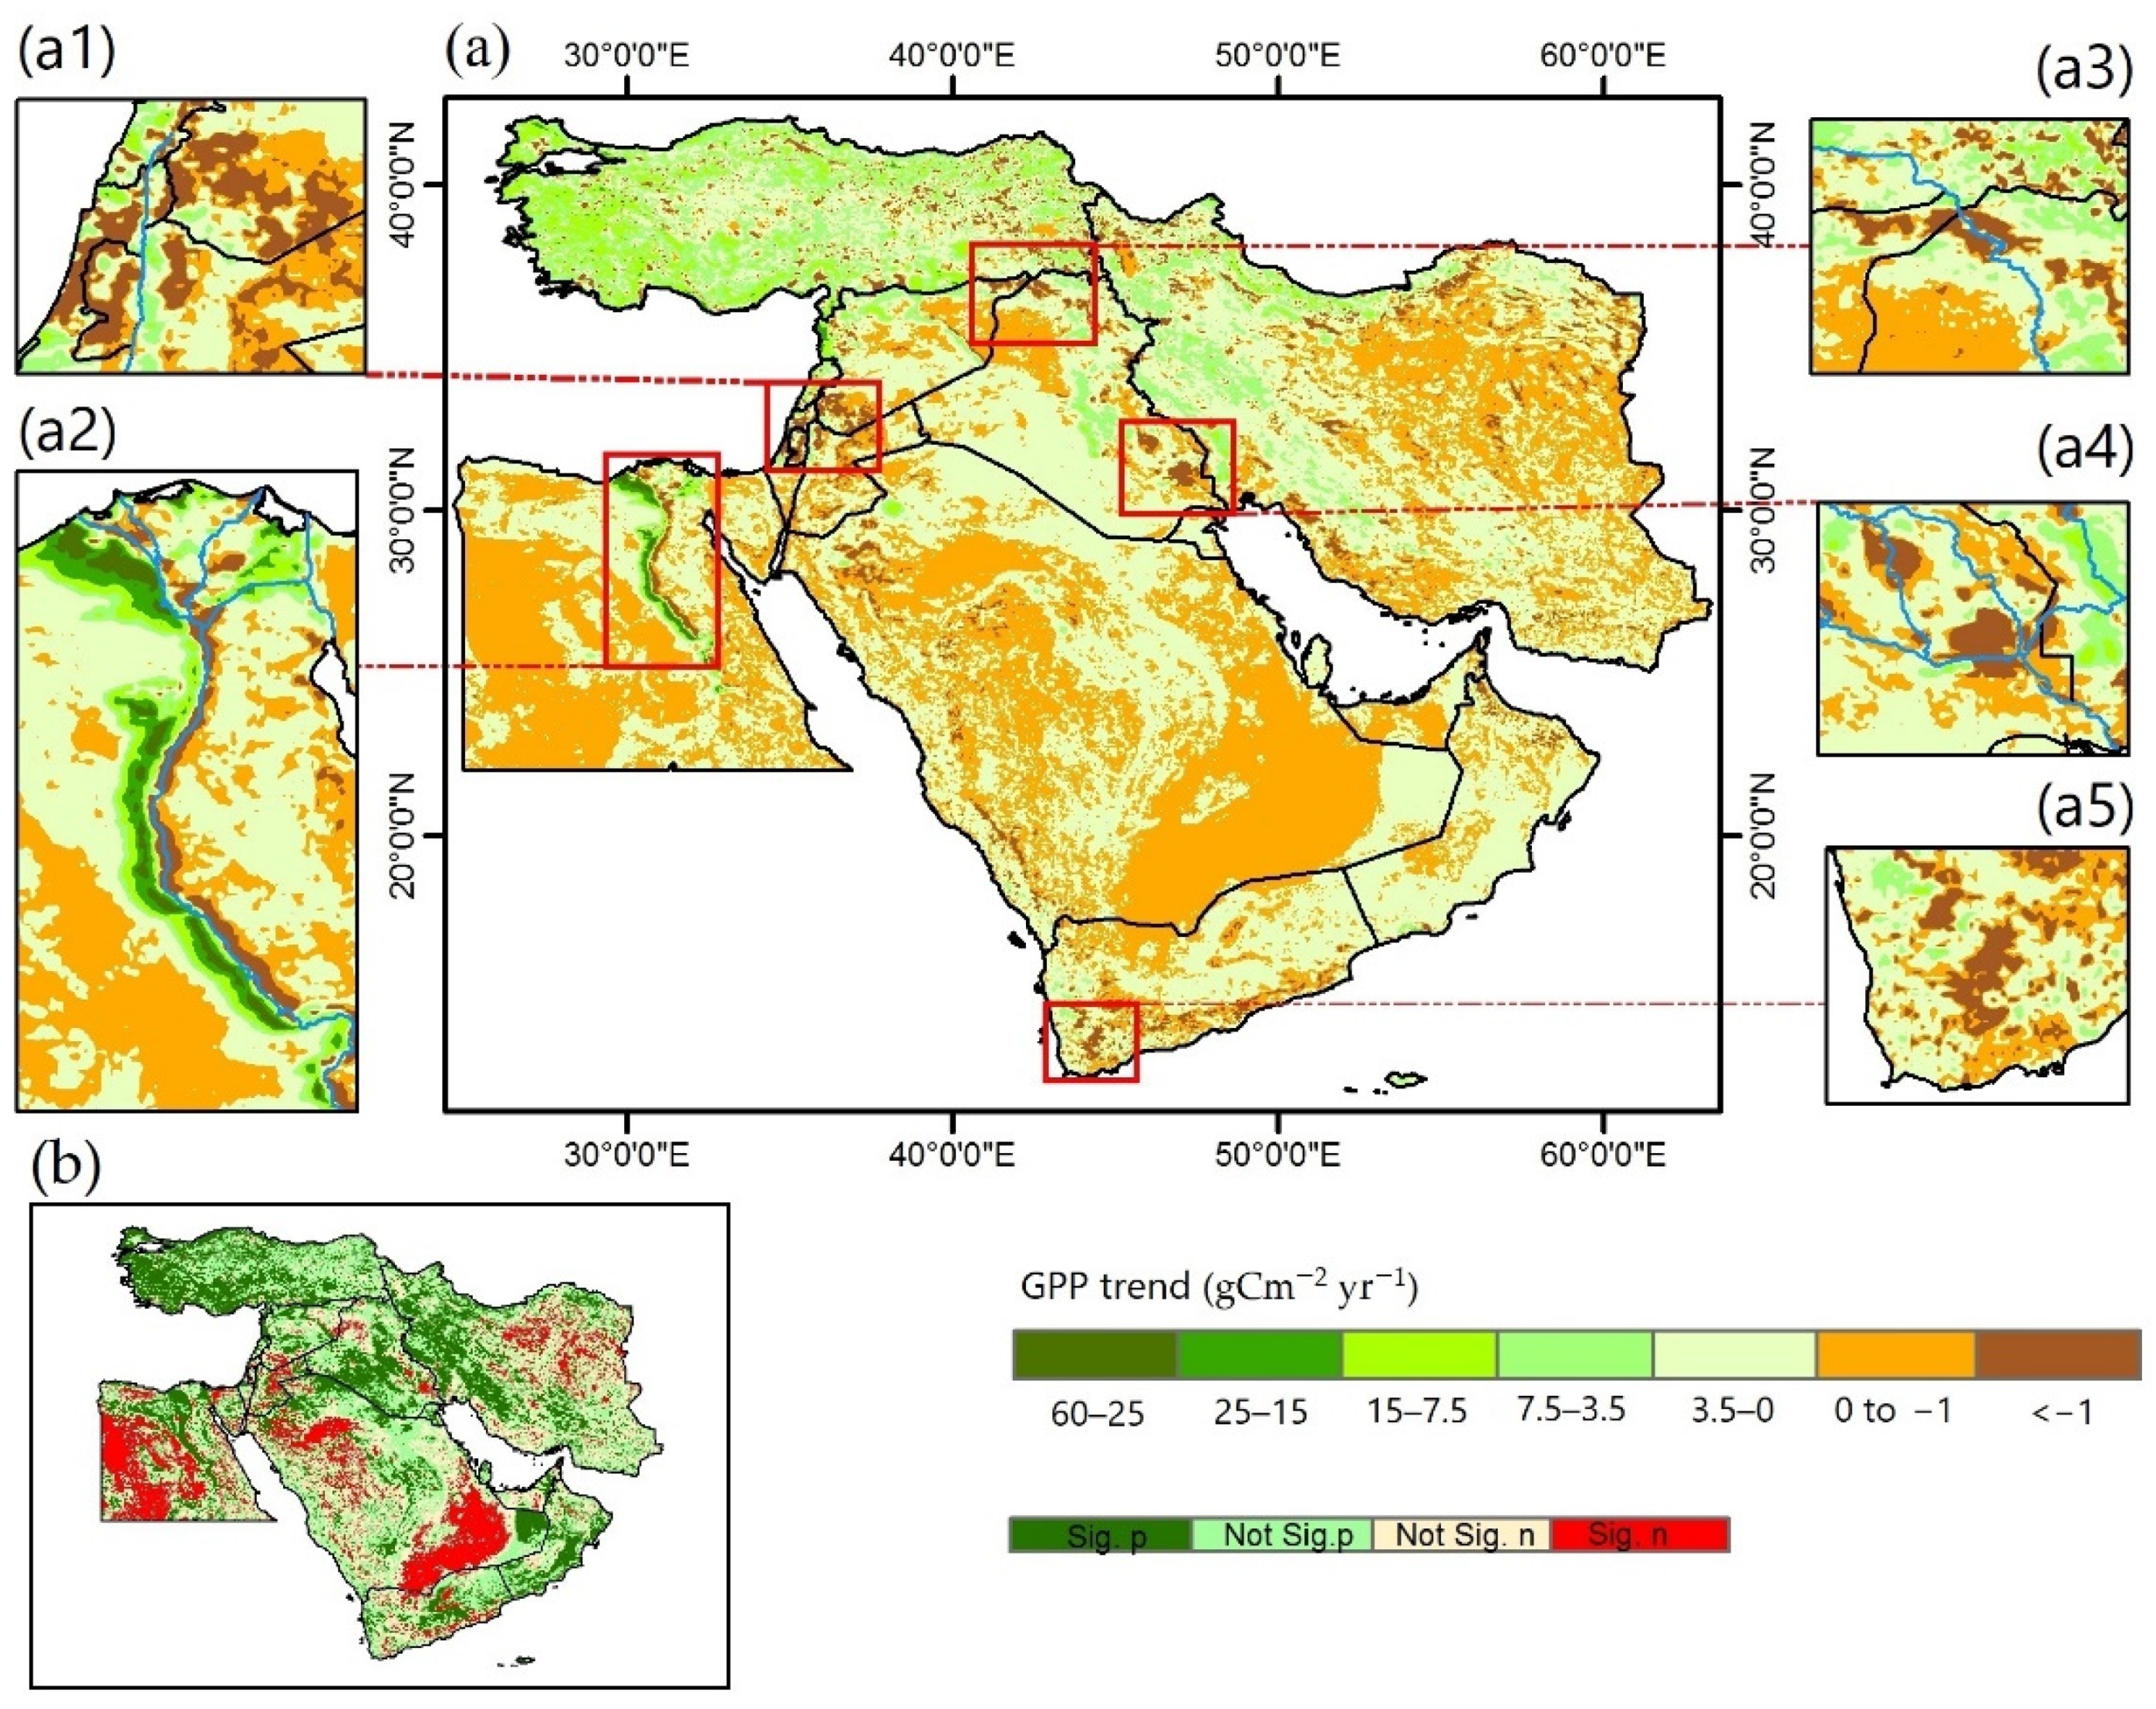
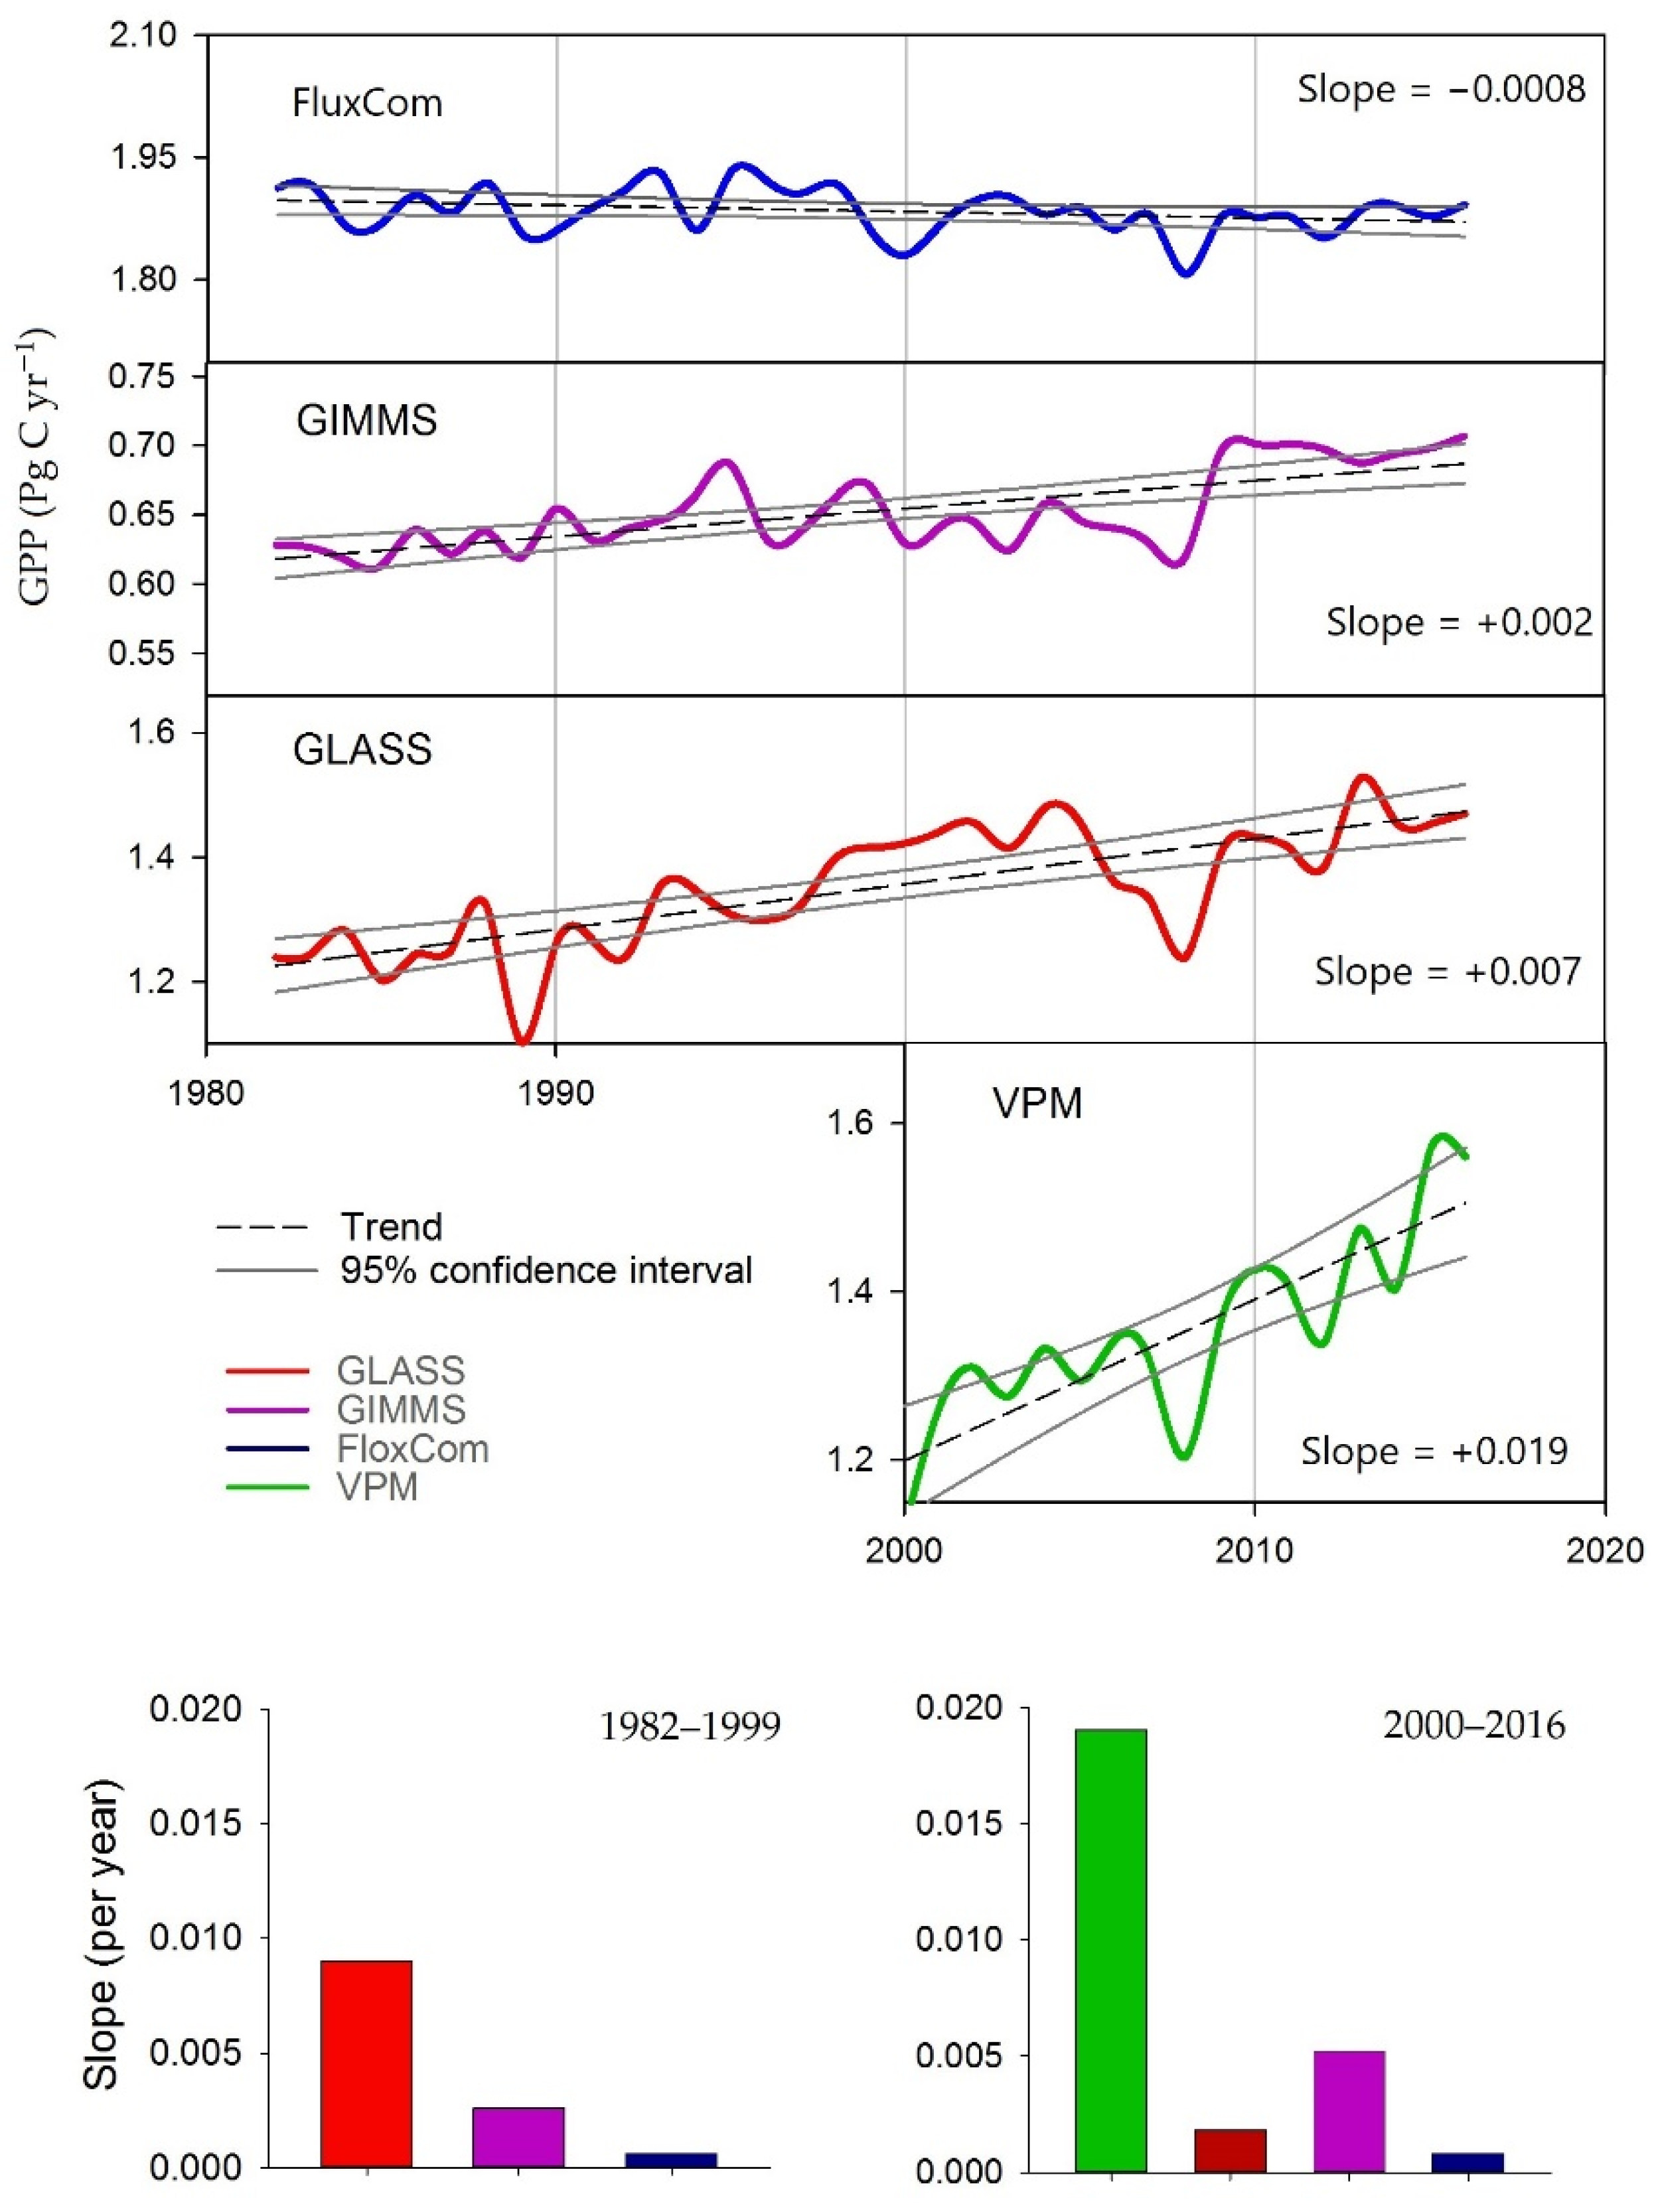
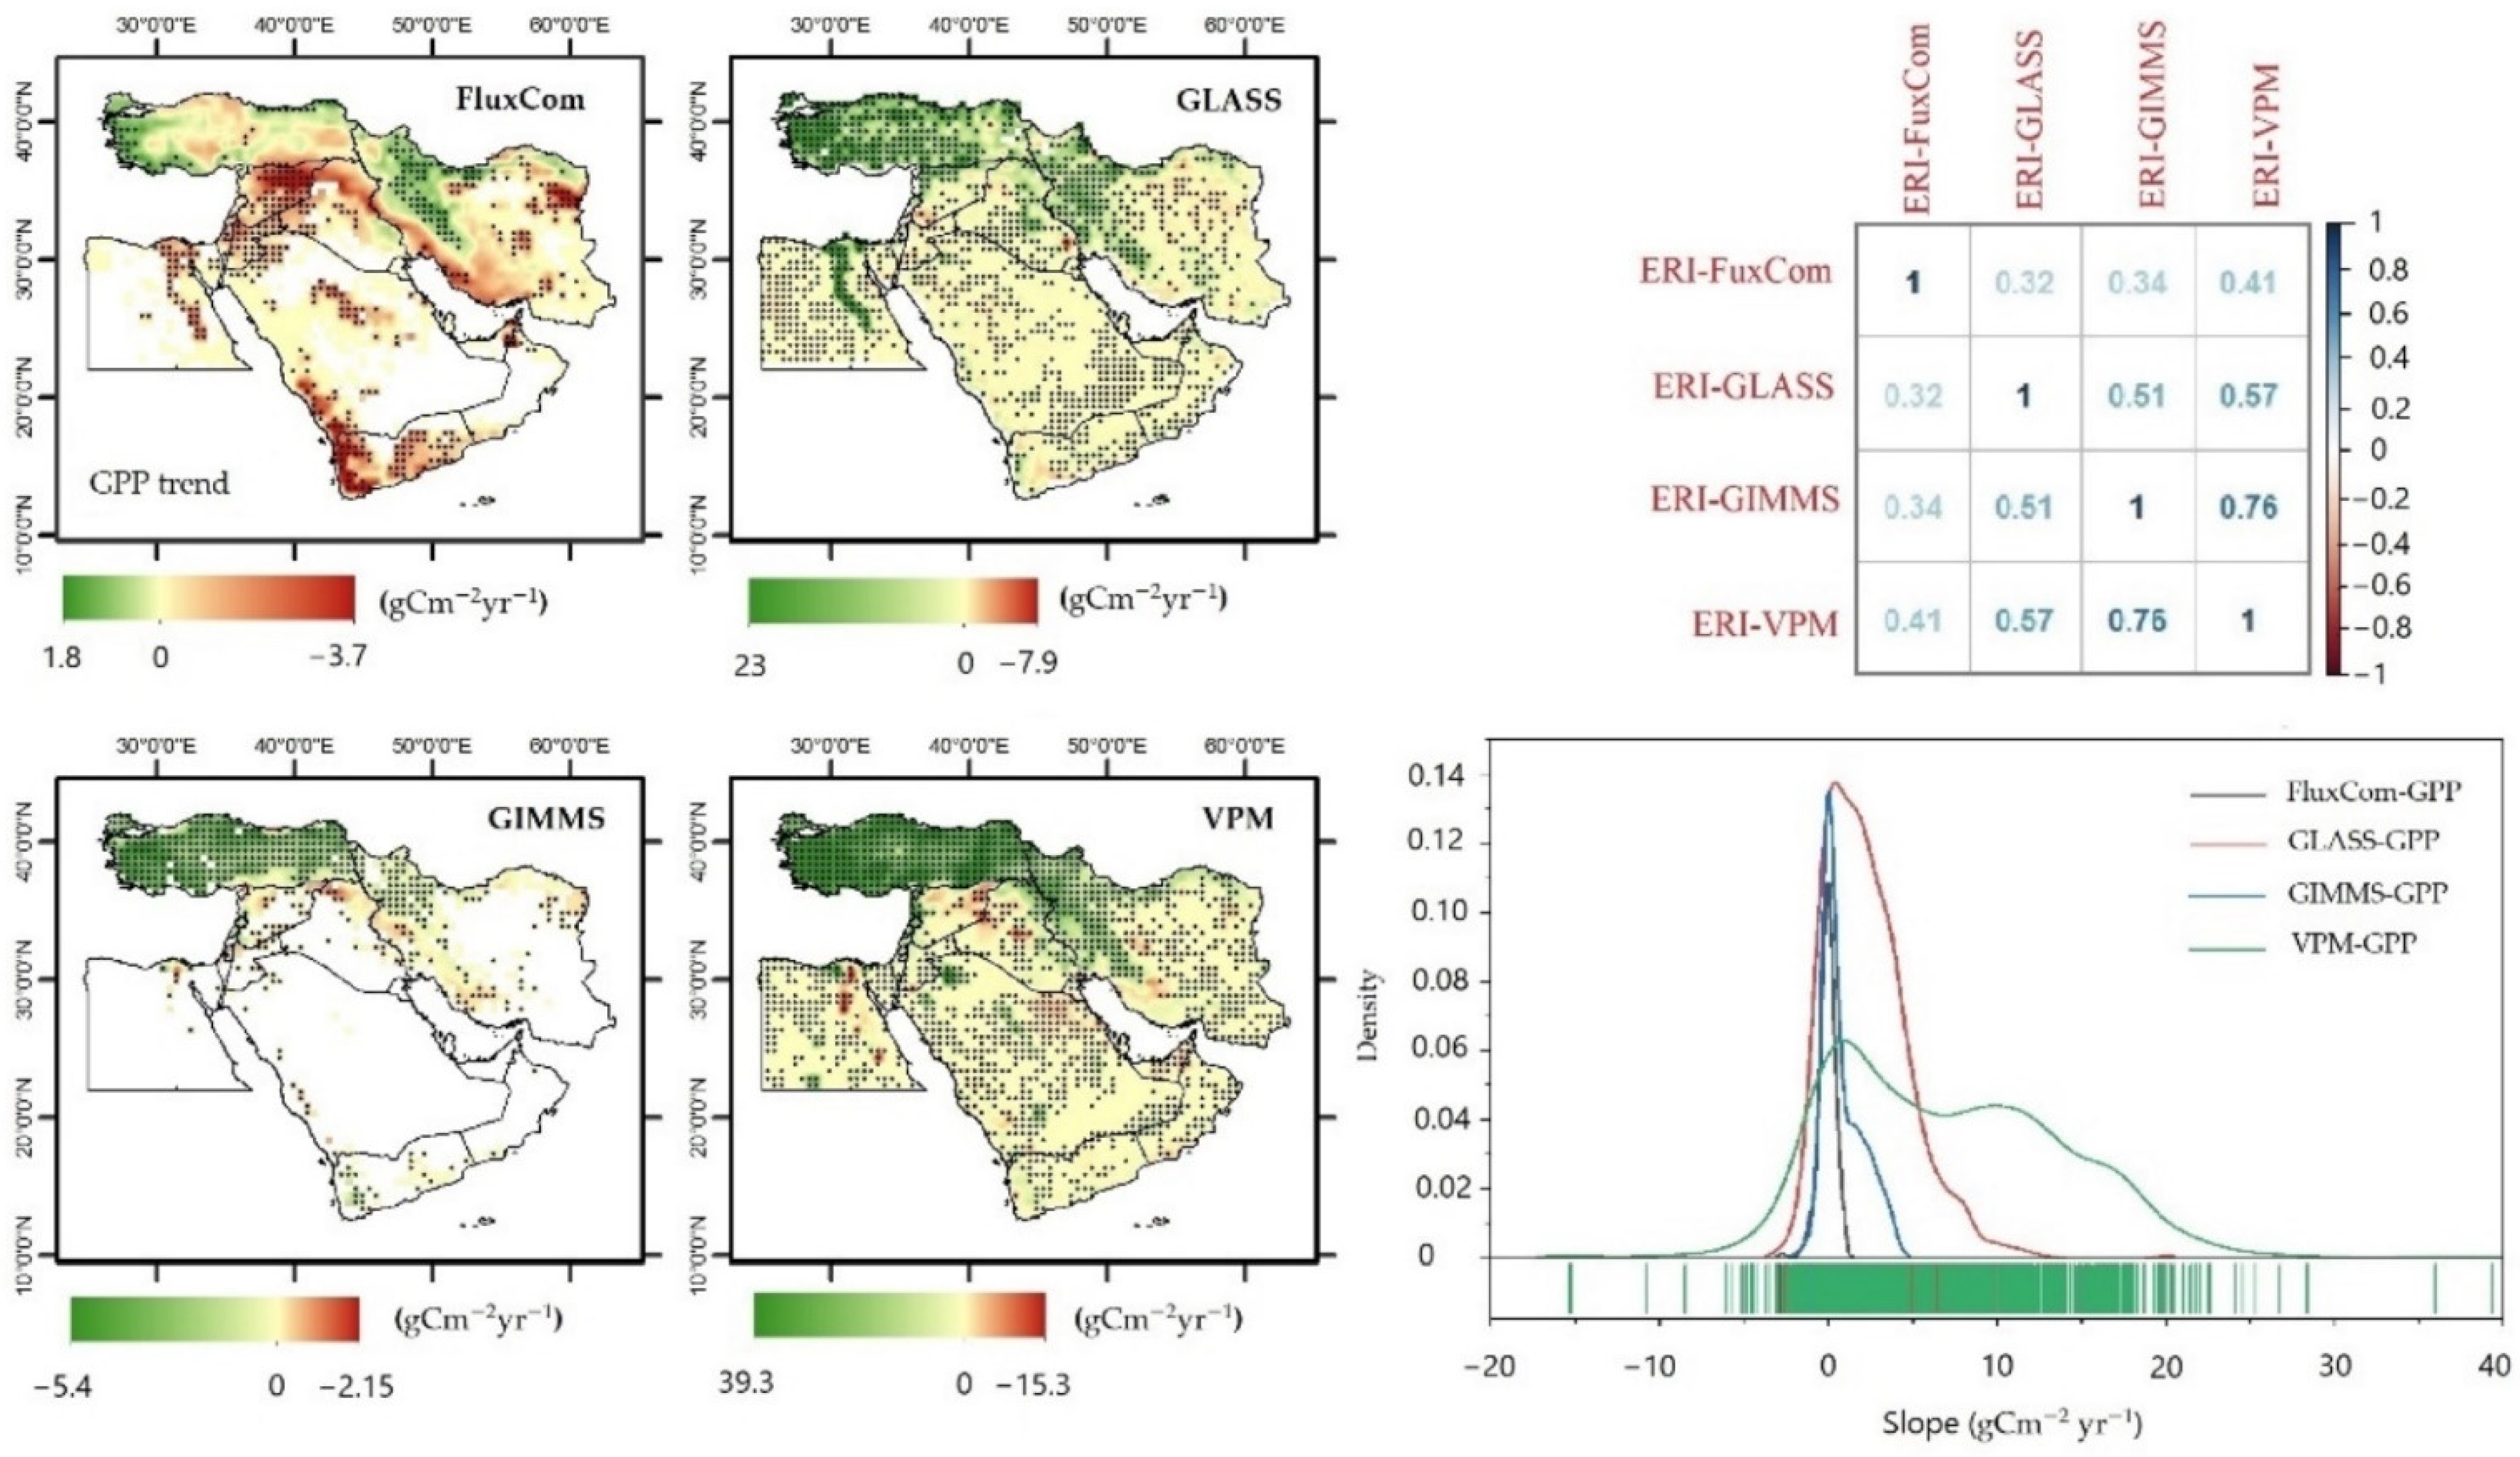
The M-K test of the annual variability in GPP presented a significant increasing trend at the pixel scale, specifically in the northern parts. Generally, the temporal trend of the regional carbon stocks (in PgC yr−1) in the Middle East showed an increase during the studied period for all the products except the FluxCom model. The highest increasing trends in the GPP value were obtained from the VPM model during the 2000–2016 period, while the lowest increasing trends in the GPP were detected by the GIMMS model. In contrast, a slightly decreasing trend was obtained by the FluxCom model.
-
The trend patterns in several GPP datasets were somewhat homogeneous for some models regardless of the magnitude of the trend and where the r correlation value between the VPM-GPP slopes and the GIMMS-GPP slopes was high. Other models such as the FluxCom-GPP and the GLASS-GPP had slope patterns that were very different.
-
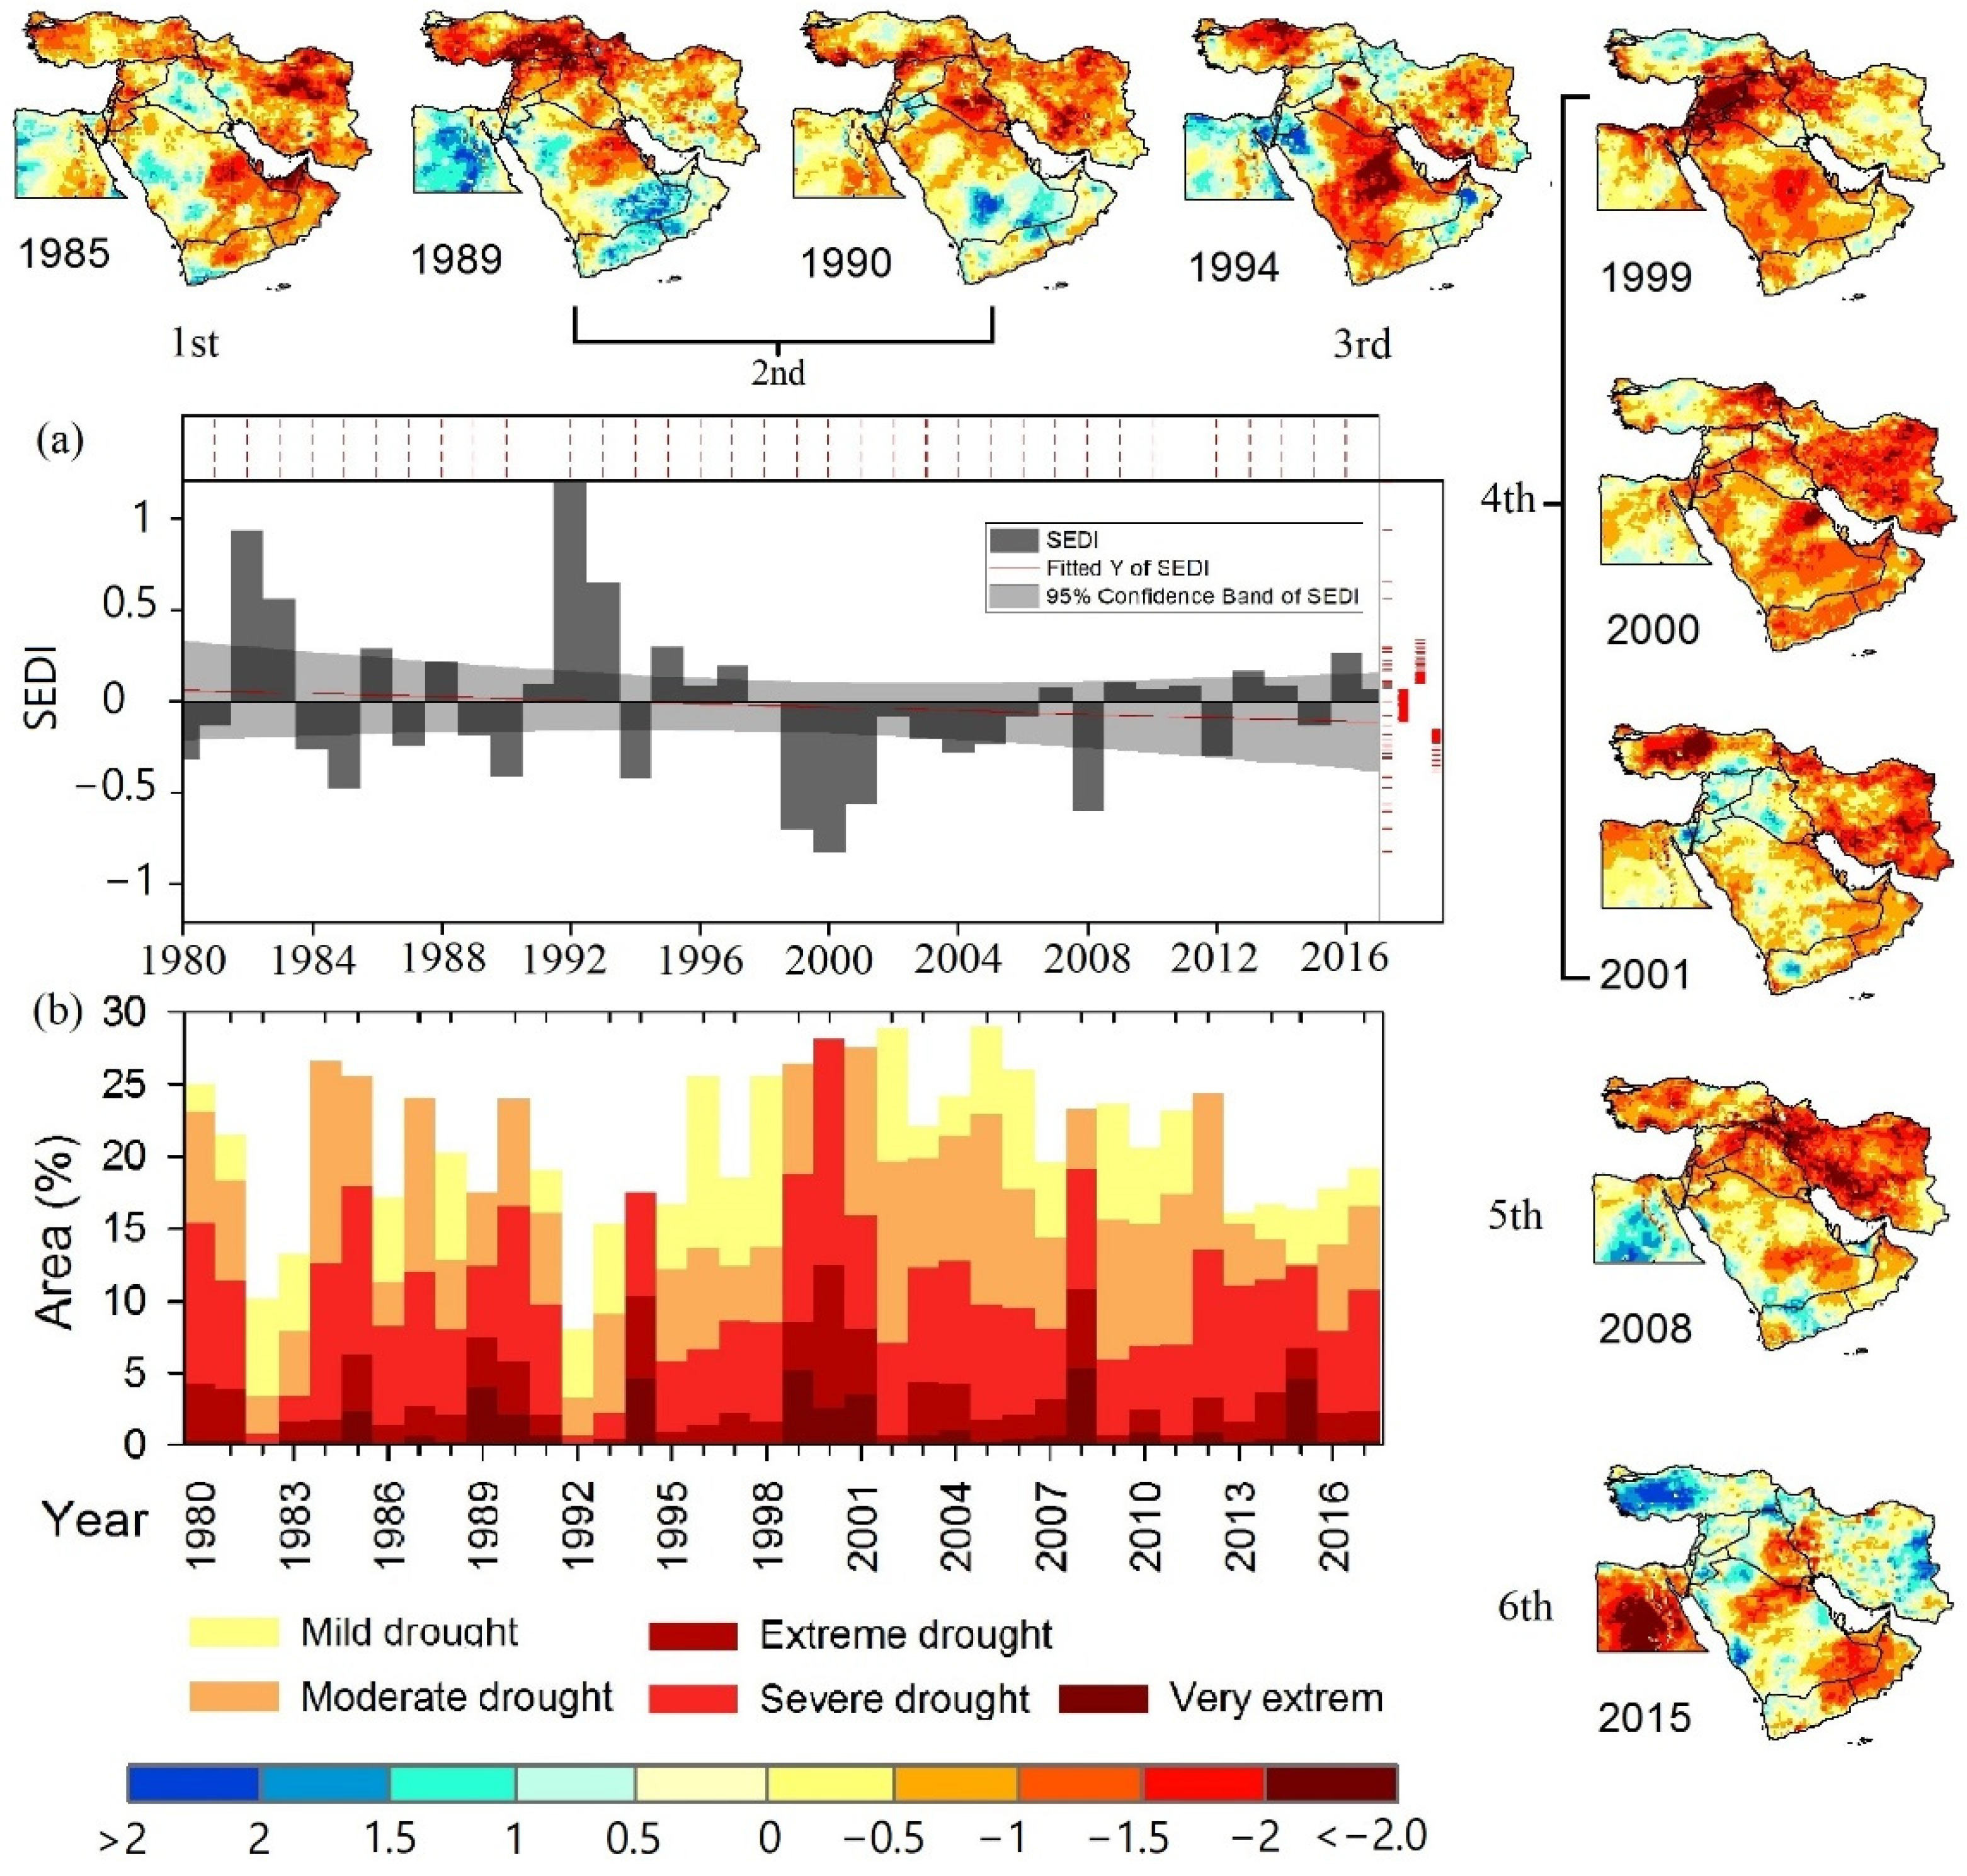
Based on the annual values of the SEDI, a total of six significant drought events occurred in 1985, 1989–1990, 1994, 1999–2001, 2008, and 2015. The 2000 severe, extreme, and very extreme drought classes covered roughly 42% of the total area.
-
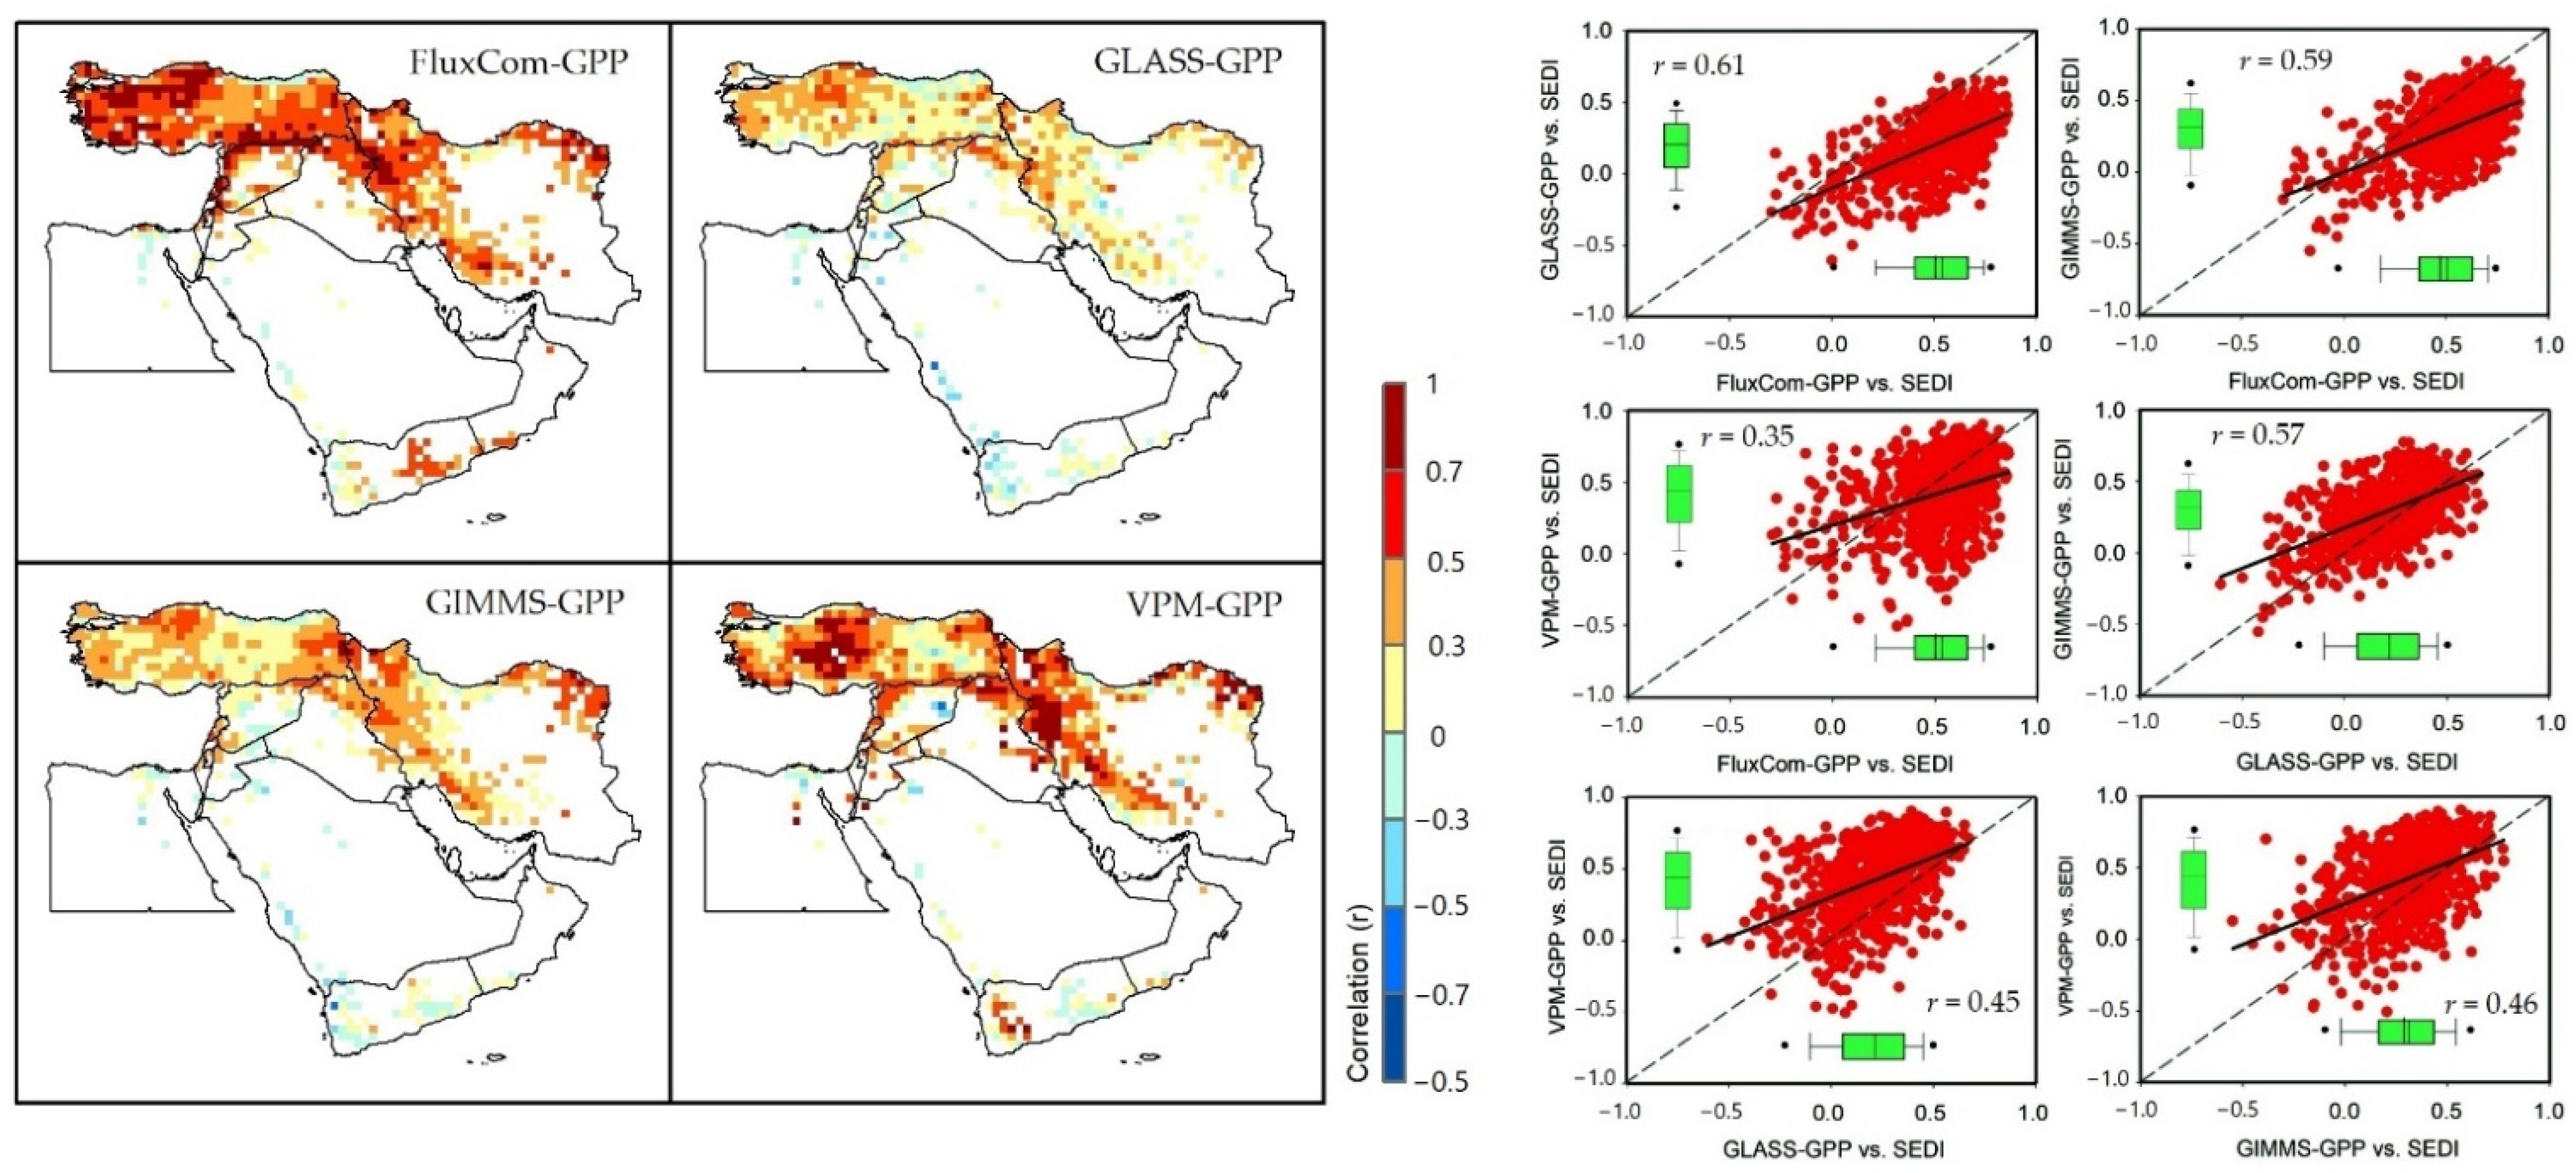
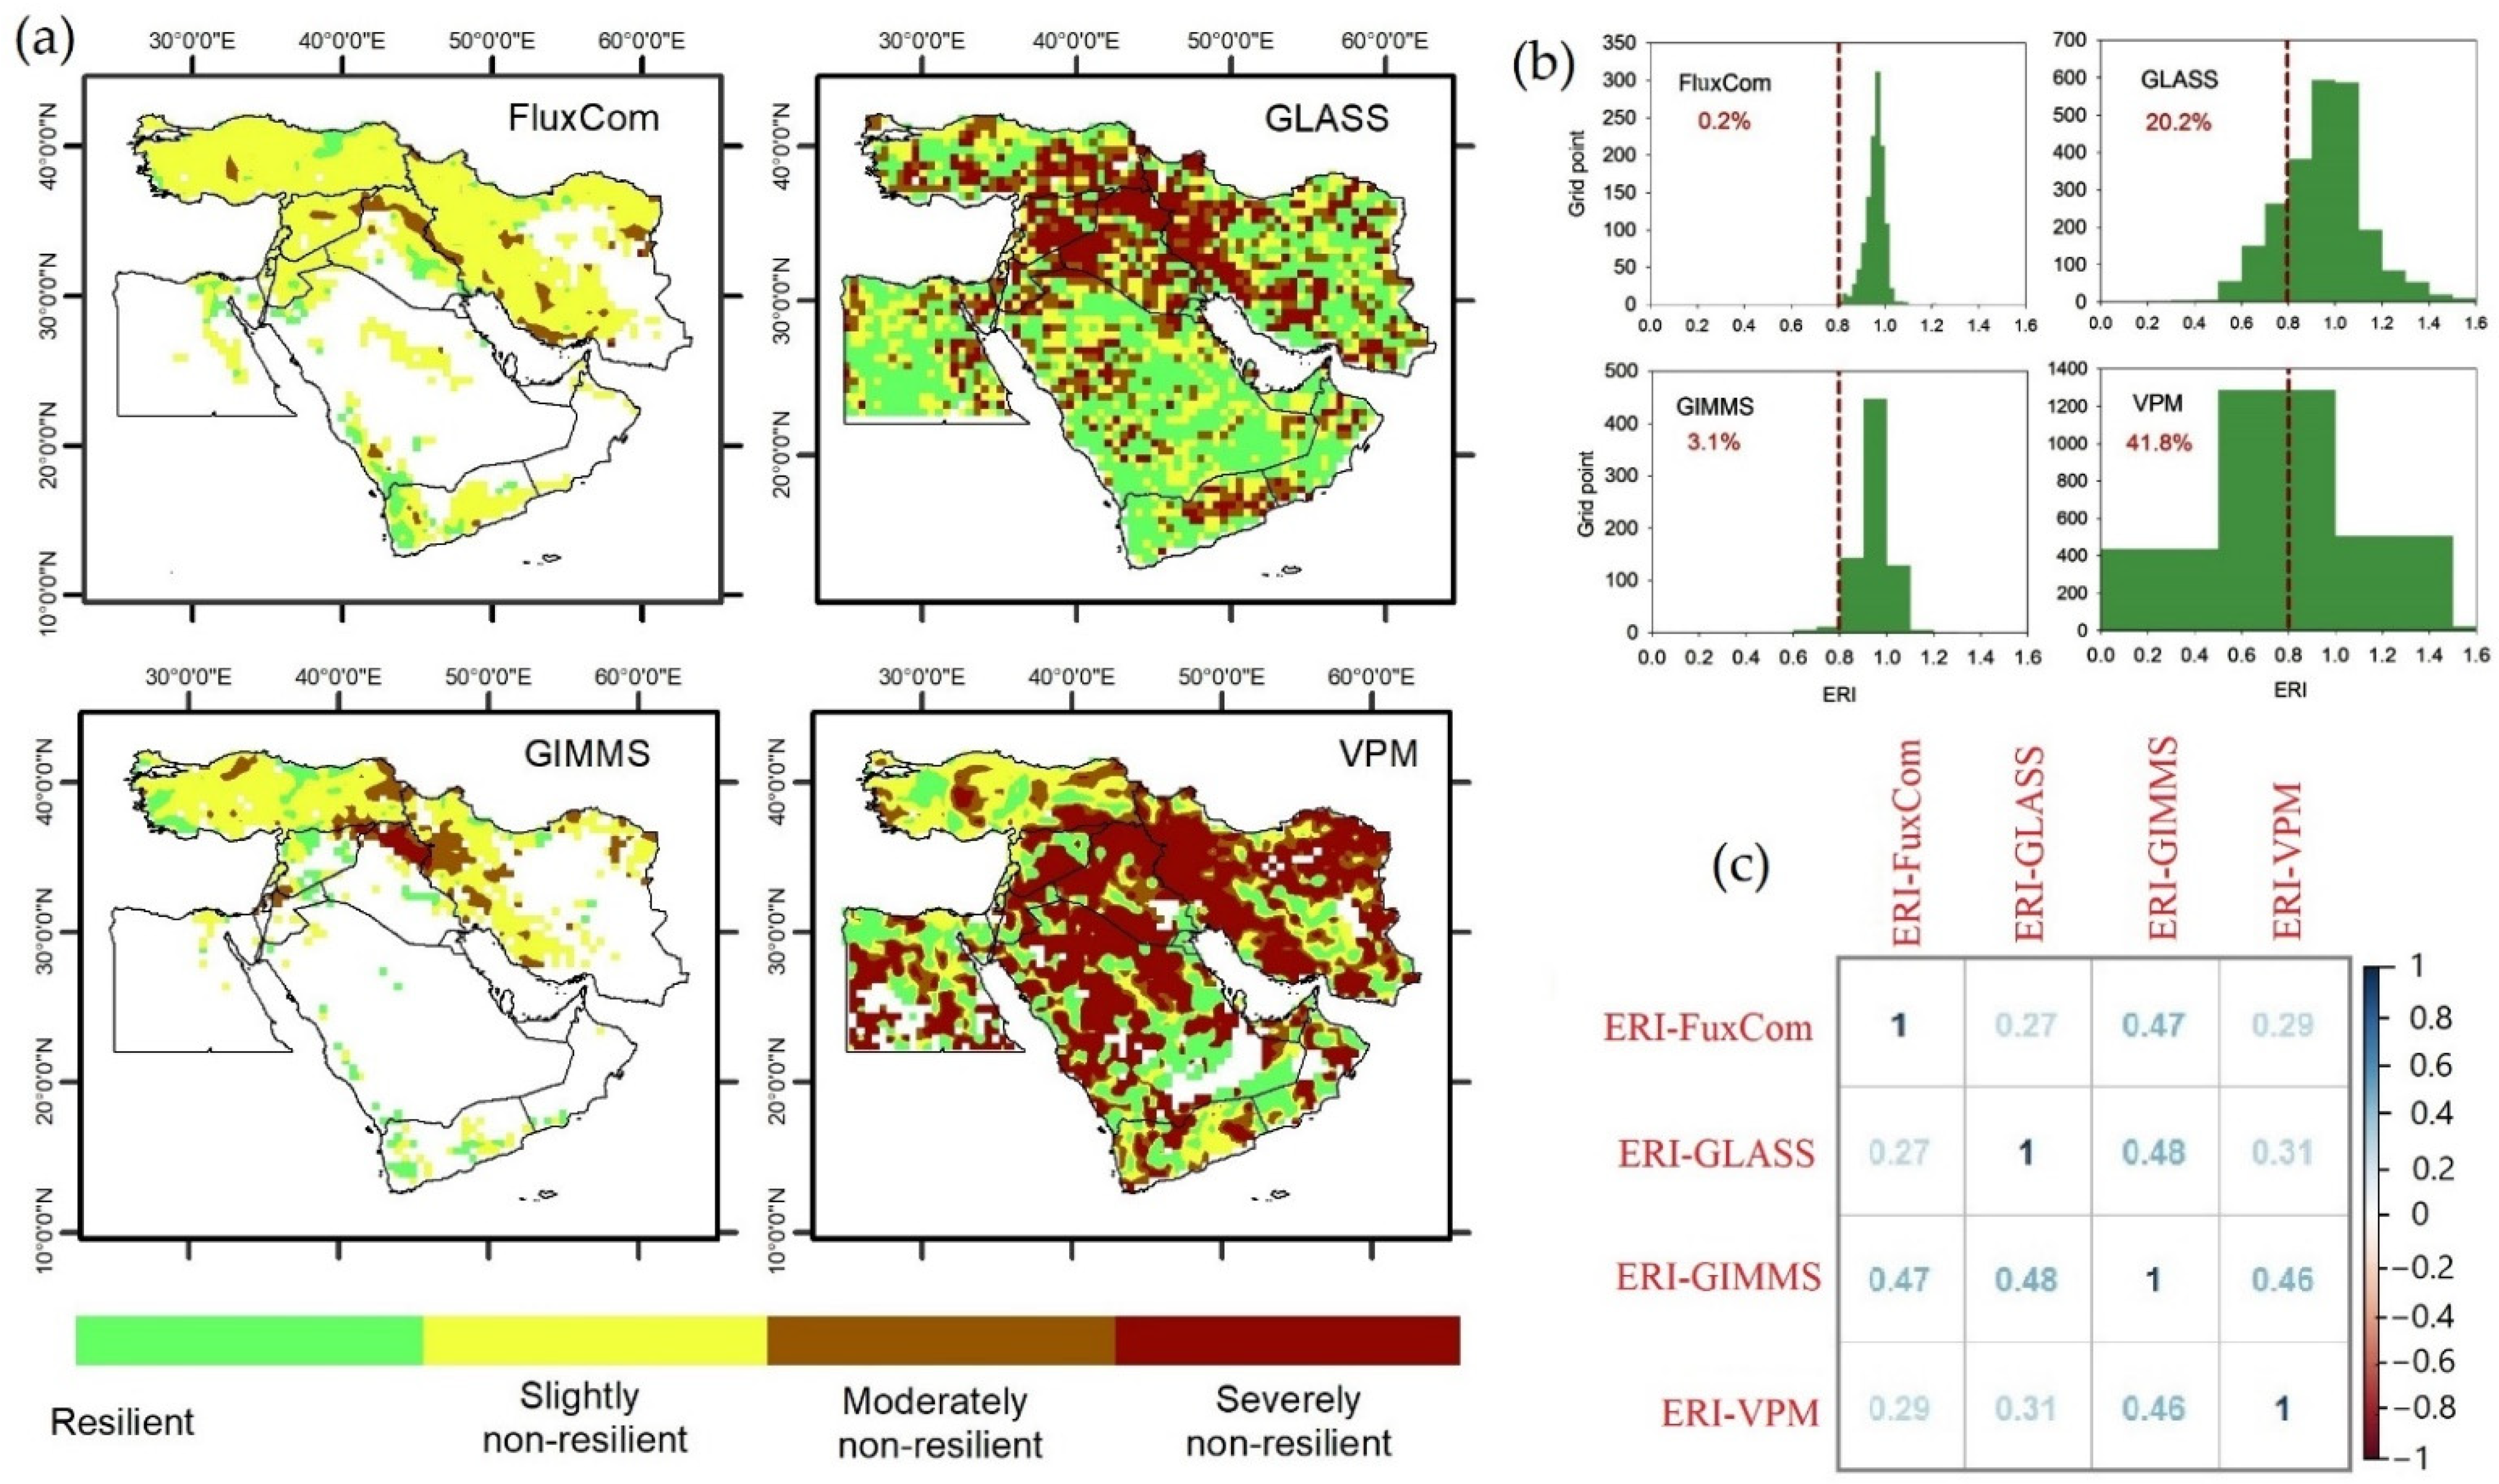
The results indicated that the FluxCom-GPP and VPM-GPP models were more sensitive to SEDI variability. Although the spatial distribution of the GPP response patterns to dry–wet conditions of the SEDI was somewhat similar and coherent among some models such as GLASS-GPP and FluxCom-GPP, the pairwise comparison among the other GPP models was less coherent (e.g., the FluxCom and VPM models).
-
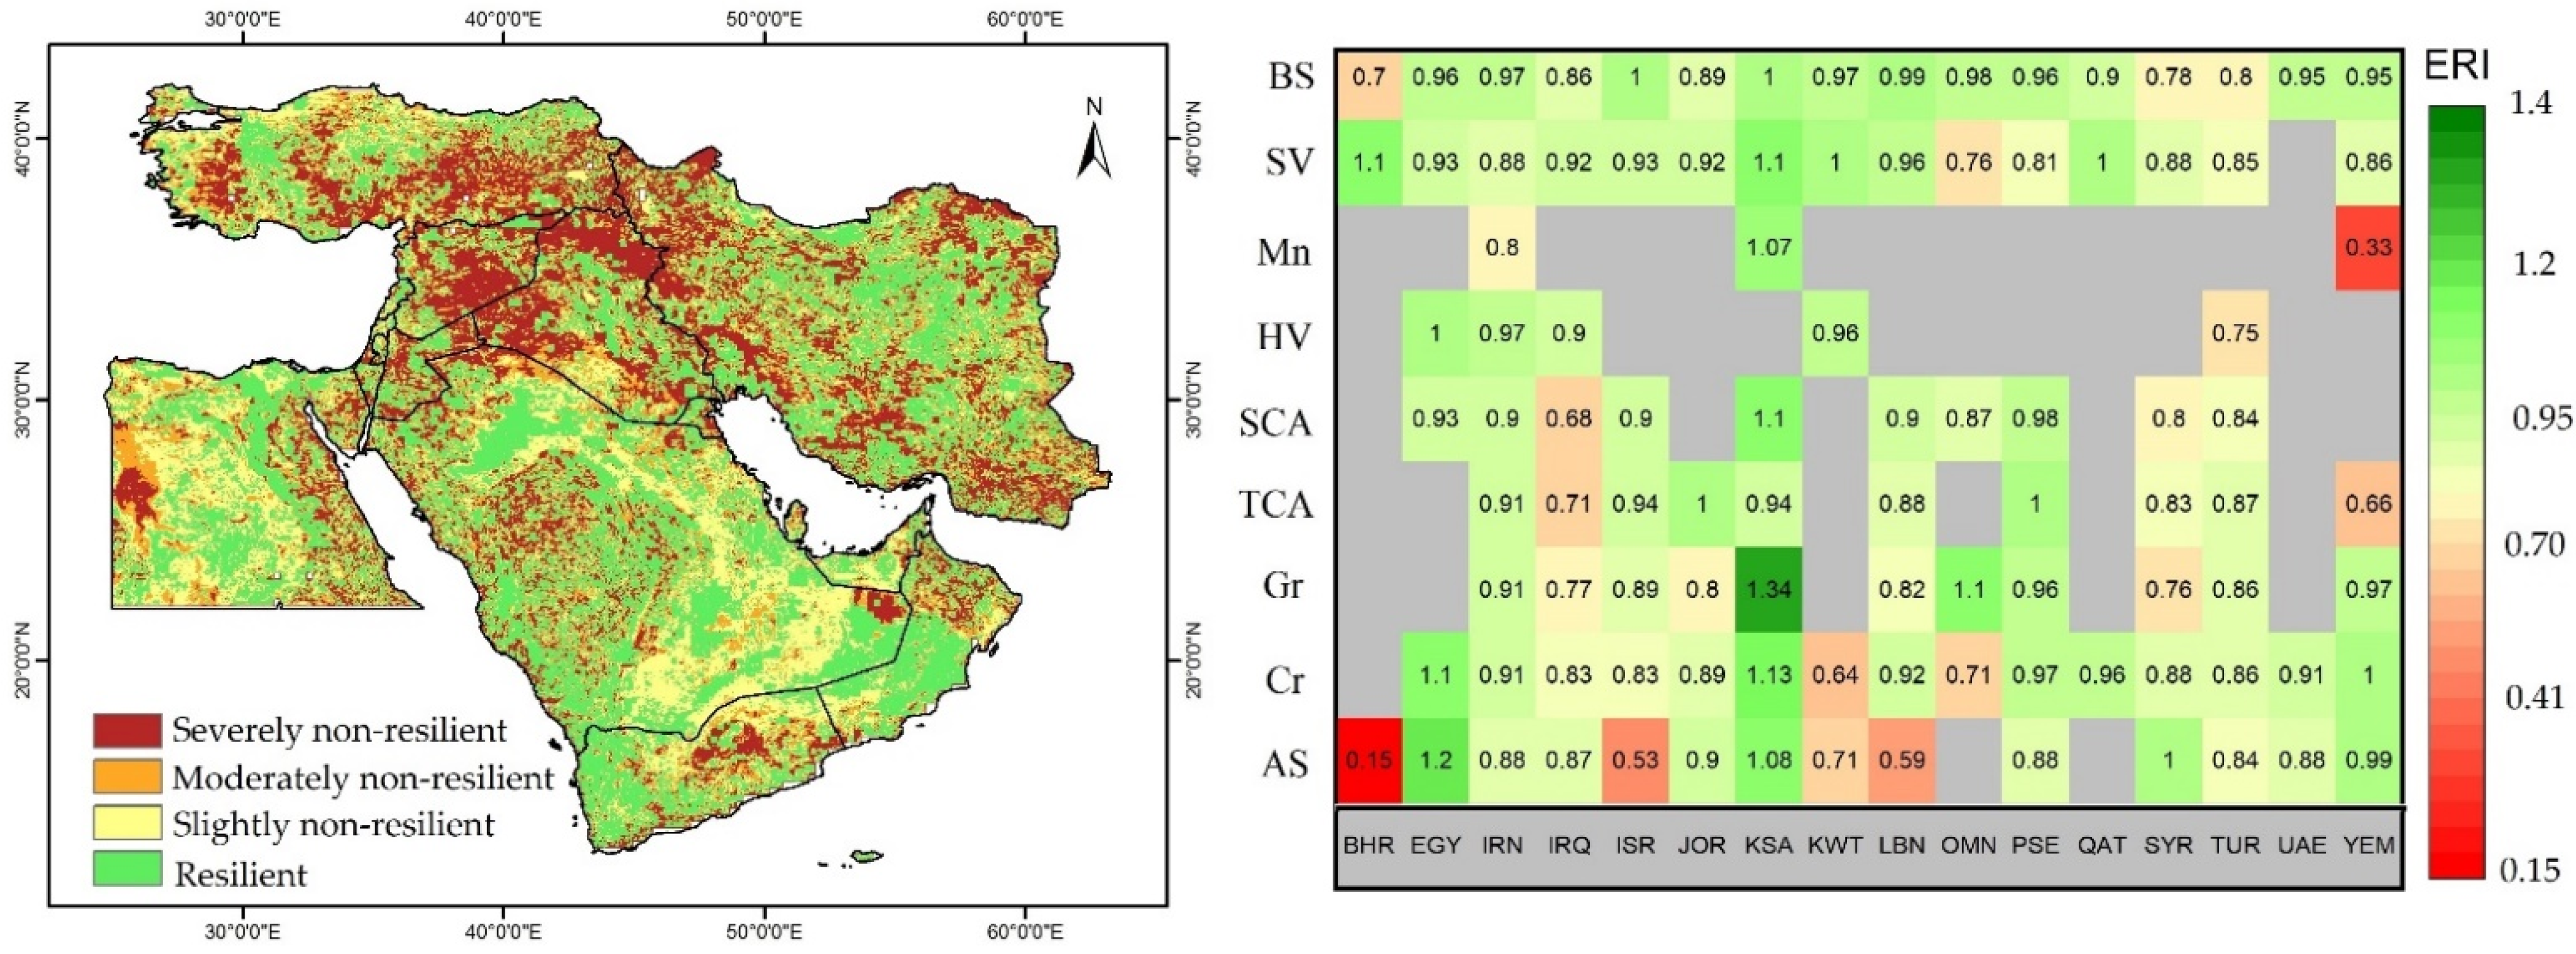
Based on the high-resolution output of GLASS-GPP, the resilience of the ecosystem to drought disturbance was studied. Most of the ecosystems in the study area showed a high ability to tolerate extreme drought while maintaining the normal pattern and trend in GPP under severe to extreme conditions. The area that was not resilient to drought was mostly in the northern part of study area, which made up 49.7% of the total area.
In general, the climate dynamic under global warming will cause high-risk drought occurrences in the Middle East’s ecosystems. Drought management at the regional level necessitates the use of indices that improve drought monitoring both temporally and geographically, thereby resulting in suitable decisions that help mitigate the drought in the region. For several reasons, the formulation and implementation of environmental policies on the regional and national levels, including declaring an urgent plan to reduce humans’ CO2 emissions, has become a critical issue. A plan to transition to the “post-carbon economy” and pursue “carbon neutrality” is also required to balance those emissions; this can be done by reducing forest degradation, establishing afforestation and reforestation projects, and preserving the ecosystem in the long-term.

Author Contributions

Conceptualization, K.A.; methodology, K.A.; software, K.A.; formal analysis, K.A.; investigation, K.A.; data curation, K.A.; writing—original draft preparation, K.A. and A.E.K.; writing—review and editing, S.M., S.S.S., A.K.S., A.A., B.B. and A.E.K.; visualization, K.A.; supervision, S.B. All authors have read and agreed to the published version of the manuscript.

Funding

This work was supported by the National Natural Science Foundation of China (grant numbers 41971340 and 41271410) and the RESEARCHERS SUPPORTING PROJECT, grant number RSP-2021/296, King Saud University, Riyadh, Saudi Arabia.

Data Availability Statement

The main data of the SEDI that support the findings of this study are openly available in Zenodo at http://doi.org/10.5281/zenodo.4540832 (accessed on 24 September 2022) under reference number 4540832.

Acknowledgments

The authors would like to express their gratitude to Nanjing University of Information Science and Technology and King Saud University for their support. The authors also would like to thank the FluxCom, GIMMS, GLEAM, GLASS, and VPM teams for sharing the datasets.

Conflicts of Interest

The authors declare no conflict of interest.

Appendix A

Figure A1. Land-cover data from the SHARE dataset [50].
Remotesensing 14 06237 g0a1
Table A1. Details of indicators with the statistical equations to assess the performance of the modeled GPP against the observed GPP in Yatir Forest station.
IndexIndexEquation References
Nash–Sutcliffe efficiencyNSE NSE = 1 i = 1 n ( GPP Prd GPP obs ) 2 t = 1 n ( GPP obs GPP obs ¯ ) 2 Nash and Sutcliffe [109]
Index of agreementd d = 1 i = 1 n ( GPP obs   GPP Prd ) 2 i = 1 n ( | GPP Prd GPP obs ¯ | + | GPP obs GPP obs ¯ | ) 2 Willmott et al. [110]
Root-mean-squared errorRMSE RMSE = 1 N i = 1 N ( GPP obs GPP Prd ) 2 Hauduc et al. [111]
Pearson’s correlationr r = [ i = 1 n { ( GPP obs GPP ¯ obs ) ( GPP Prd GPP ¯ Prd ) } i = 1 n ( GPP obs GPP ¯ obs ) 2 i = 1 n ( GPP Prd GPP ¯ Prd ) 2 ] Pearson et al. [112]

References

  1. Le Que’re’, C.; Raupach, M.R.; Canadell, J.G.; Marland, G. Trends in the sources and sinks of carbon dioxide. Nature Geosci. 2009, 2, 831–836. [Google Scholar] [CrossRef] [Green Version]
  2. Pan, Y.; Birdsey, R.A.; Fang, J.; Houghton, R.; Kauppi, P.E.; Kurz, W.A.; Phillips, O.L.; Shvidenko, A.; Lewis, S.L.; Canadell, J.G.; et al. A Large and Persistent Carbon Sink in the World’s Forests. Science 2011, 333, 988–993. [Google Scholar] [CrossRef] [Green Version]
  3. Friedlingstein, P.; Jones, M.W.; O’Sullivan, M.; Andrew, R.M.; Hauck, J.; Peters, G.P.; Peters, W.; Pongratz, J.; Sitch, S.; Le Quéré, C.; et al. Global Carbon Budget 2019. Earth Syst. Sci. Data 2019, 11, 1783–1838. [Google Scholar] [CrossRef] [Green Version]
  4. Keenan, T.F.; Gray, J.; Friedl, M.A.; Toomey, M.; Bohrer, G.; Hollinger, D.Y.; Munger, J.W.; O’Keefe, J.; Schmid, H.P.; Wing, I.S.; et al. Net carbon uptake has increased through warming-induced changes in temperate forest phenology. Nat. Clim. Chang. 2014, 4, 598–604. [Google Scholar] [CrossRef]
  5. Friedlingstein, P.; Cox, P.; Betts, R.A.; Bopp, L.; Von Bloh, W.; Brovkin, V.; Cadule, P.; Doney, S.C.; Eby, M.; Fung, I.; et al. Climate–Carbon Cycle Feedback Analysis: Results from the C4MIP Model Intercomparison. J. Clim. 2006, 19, 3337–3353. [Google Scholar] [CrossRef] [Green Version]
  6. Schimel, D.; Stephens, B.B.; Fisher, J.B. Effect of increasing CO2 on the terrestrial carbon cycle. Proc. Natl. Acad. Sci. USA 2015, 112, 436–441. [Google Scholar] [CrossRef] [PubMed] [Green Version]
  7. Reichstein, M.; Bahn, M.; Ciais, P.; Frank, D.; Mahecha, M.D.; Seneviratne, S.I.; Zscheischler, J.; Beer, C.; Buchmann, N.; Frank, D.C.; et al. Climate extremes and the carbon cycle. Nature 2013, 500, 287–295. [Google Scholar] [CrossRef]
  8. Zeng, H.; Chambers, J.Q.; Negrón-Juárez, R.I.; Hurtt, G.C.; Baker, D.B.; Powell, M.D. Impacts of tropical cyclones on U.S. forest tree mortality and carbon flux from 1851 to 2000. Proc. Natl. Acad. Sci. USA 2009, 106, 7888–7892. [Google Scholar] [CrossRef] [Green Version]
  9. Ciais, P.; Reichstein, M.; Viovy, N.; Granier, A.; Ogée, J.; Allard, V.; Aubinet, M.; Buchmann, N.; Bernhofer, C.; Carrara, A.; et al. Europe-wide reduction in primary productivity caused by the heat and drought in 2003. Nature 2005, 437, 529–533. [Google Scholar] [CrossRef]
  10. Van Oost, K.; Quine, T.A.; Govers, G.; De Gryze, S.; Six, J.; Harden, J.W.; Ritchie, J.C.; McCarty, G.W.; Heckrath, G.; Kosmas, C.; et al. The Impact of Agricultural Soil Erosion on the Global Carbon Cycle. Science 2007, 318, 626–629. [Google Scholar] [CrossRef]
  11. Anderegg, W.R.L.; Berry, J.A.; Smith, D.D.; Sperry, J.S.; Anderegg, L.D.L.; Field, C.B. The roles of hydraulic and carbon stress in a widespread climate-induced forest die-off. Proc. Natl. Acad. Sci. USA 2012, 109, 233–237. [Google Scholar] [CrossRef] [PubMed] [Green Version]
  12. Frank, D.; Reichstein, M.; Bahn, M.; Thonicke, K.; Frank, D.; Mahecha, M.D.; Smith, P.; Velde, M.; Vicca, S.; Babst, F.; et al. Effects of climate extremes on the terrestrial carbon cycle: Concepts, processes and potential future impacts. Glob. Chang. Biol. 2015, 21, 2861–2880. [Google Scholar] [CrossRef] [Green Version]
  13. Reichstein, M.; Falge, E.; Baldocchi, D.; Papale, D.; Aubinet, M.; Berbigier, P.; Bernhofer, C.; Buchmann, N.; Gilmanov, T.; Granier, A.; et al. On the separation of net ecosystem exchange into assimilation and ecosystem respiration: Review and improved algorithm. Glob. Chang. Biol. 2005, 11, 1424–1439. [Google Scholar] [CrossRef]
  14. Lasslop, G.; Reichstein, M.; Papale, D.; Richardson, A.D.; Arneth, A.; Barr, A.; Stoy, P.; Wohlfahrt, G. Separation of net ecosystem exchange into assimilation and respiration using a light response curve approach: Critical issues and global evaluation. Glob. Chang. Biol. 2010, 16, 187–208. [Google Scholar] [CrossRef] [Green Version]
  15. Sitch, S.; Friedlingstein, P.; Gruber, N.; Jones, S.D.; Murray-Tortarolo, G.; Ahlström, A.; Doney, S.C.; Graven, H.; Heinze, C.; Huntingford, C.; et al. Recent trends and drivers of regional sources and sinks of carbon dioxide. Biogeosciences 2015, 12, 653–679. [Google Scholar] [CrossRef] [Green Version]
  16. Cai, W.; Prentice, I.C. Recent trends in gross primary production and their drivers: Analysis and modelling at flux-site and global scales. Environ. Res. Lett. 2020, 15, 124050. [Google Scholar] [CrossRef]
  17. Jung, M.; Reichstein, M.; Bondeau, A. Towards global empirical upscaling of FLUXNET eddy covariance observations: Validation of a model tree ensemble approach using a biosphere model. Biogeosciences 2009, 6, 2001–2013. [Google Scholar] [CrossRef] [Green Version]
  18. Tramontana, G.; Jung, M.; Schwalm, C.R.; Ichii, K.; Camps-Valls, G.; Ráduly, B.; Reichstein, M.; Arain, M.A.; Cescatti, A.; Kiely, G.; et al. Predicting carbon dioxide and energy fluxes across global FLUXNET sites with regression algorithms. Biogeosciences 2016, 13, 4291–4313. [Google Scholar] [CrossRef] [Green Version]
  19. Running, S.W.; Nemani, R.R.; Heinsch, F.A.; Zhao, M.S.; Reeves, M.; Hashimoto, H. A Continuous Satellite-Derived Measure of Global Terrestrial Primary Production. Bioscience 2004, 54, 547–560. [Google Scholar] [CrossRef]
  20. Keenan, T.F.; Prentice, I.C.; Canadell, J.; Williams, C.A.; Wang, H.; Raupach, M.; Collatz, G.J. Recent pause in the growth rate of atmospheric CO2 due to enhanced terrestrial carbon uptake. Nat. Commun. 2016, 7, 13428. [Google Scholar] [CrossRef]
  21. Zhang, Y.; Xiao, X.; Wu, X.; Zhou, S.; Zhang, G.; Qin, Y.; Dong, J. A global moderate resolution dataset of gross primary production of vegetation for 2000–2016. Sci. Data 2017, 4, 170165. [Google Scholar] [CrossRef] [PubMed] [Green Version]
  22. Joiner, J.; Yoshida, Y.; Zhang, Y.; Duveiller, G.; Jung, M.; Lyapustin, A.; Wang, Y.; Tucker, C.J. Estimation of Terrestrial Global Gross Primary Production (GPP) with Satellite Data-Driven Models and Eddy Covariance Flux Data. Remote Sens. 2018, 10, 1346. [Google Scholar] [CrossRef] [Green Version]
  23. Zheng, Y.; Shen, R.; Wang, Y.; Li, X.; Liu, S.; Liang, S.; Chen, J.M.; Ju, W.; Zhang, L.; Yuan, W. Improved estimate of global gross primary production for reproducing its long-term variation, 1982–2017. Earth Syst. Sci. Data 2020, 12, 2725–2746. [Google Scholar] [CrossRef]
  24. Yuan, W.P.; Liu, S.G.; Zhou, G.S.; Zhou, G.Y.; Tieszen, L.L.; Baldocchi, D.; Bernhofer, C.; Gholz, H.; Goldstein, A.H.; Goulden, M.L.; et al. Deriving a light use efficiency model from eddy covariance flux data for predicting daily gross primary production across biomes. Agric. Forest Meteorol. 2007, 143, 189207. [Google Scholar] [CrossRef] [Green Version]
  25. Sitch, S.; Huntingford, C.; Gedney, N.; Levy, P.E.; Lomas, M.; Piao, S.L.; Betts, R.; Ciais, P.; Cox, P.; Friedlingstein, P.; et al. Evaluation of the terrestrial carbon cycle, future plant geography and climate-carbon cycle feedbacks using five Dynamic Global Vegetation Models (DGVMs). Glob. Chang. Biol. 2008, 14, 2015–2039. [Google Scholar] [CrossRef]
  26. Ju, W.; Chen, J.M.; Black, T.A.; Barr, A.G.; Liu, J.; Chen, B. Modelling multi-year coupled carbon and water fluxes in a boreal aspen forest. Agric. For. Meteorol. 2006, 140, 136–151. [Google Scholar] [CrossRef]
  27. Zhang, Y.; Ye, A. Improving Global Gross Primary Productivity Estimation by Fusing Multi-Source Data Products. Heliyon 2022, 8, e09153. [Google Scholar] [CrossRef]
  28. Chen, J.M.; Ju, W.; Ciais, P.; Viovy, N.; Liu, R.; Liu, Y.; Lu, X. Vegetation structural change since 1981 significantly enhanced the terrestrial carbon sink. Nat. Commun. 2019, 10, 4259. [Google Scholar] [CrossRef] [Green Version]
  29. Sun, Y.; Frankenberg, C.; Jung, M.; Joiner, J.; Guanter, L.; Köhler, P.; Magney, T. Overview of Solar-Induced chlorophyll Fluorescence (SIF) from the Orbiting Carbon Observatory-2: Retrieval, cross-mission comparison, and global monitoring for GPP. Remote Sens. Environ. 2018, 209, 808–823. [Google Scholar] [CrossRef]
  30. Bi, W.; He, W.; Zhou, Y.; Ju, W.; Liu, Y.; Liu, Y.; Zhang, X.; Wei, X.; Cheng, N. A global 0.05° dataset for gross primary production of sunlit and shaded vegetation canopies from 1992 to 2020. Sci. Data 2022, 9, 213. [Google Scholar] [CrossRef]
  31. Stocker, B.D.; Wang, H.; Smith, N.G.; Harrison, S.P.; Keenan, T.F.; Sandoval, D.; Davis, T.; Prentice, I.C. P-model v1.0: An optimality-based light use efficiency model for simulating ecosystem gross primary production. Geosci. Model Dev. 2020, 13, 1545–1581. [Google Scholar] [CrossRef] [Green Version]
  32. Jiang, C.; Ryu, Y. Multi-scale evaluation of global gross primary productivity and evapotranspiration products derived from Breathing Earth System Simulator (BESS). Remote Sens. Environ. 2016, 186, 528–547. [Google Scholar] [CrossRef]
  33. He, Q.; Ju, W.; Dai, S.; He, W.; Song, L.; Wang, S.; Li, X.; Mao, G. Drought Risk of Global Terrestrial Gross Primary Productivity Over the Last 40 Years Detected by a Remote Sensing-Driven Process Model. J. Geophys. Res. Biogeosci. 2021, 126, e2020JG005944. [Google Scholar] [CrossRef]
  34. Cai, W.; Yuan, W.; Liang, S.; Liu, S.; Dong, W.; Chen, Y.; Liu, D.; Zhang, H. Large Differences in Terrestrial Vegetation Production Derived from Satellite-Based Light Use Efficiency Models. Remote Sens. 2014, 6, 8945–8965. [Google Scholar] [CrossRef] [Green Version]
  35. Chen, G.; Tian, H.; Zhang, C.; Liu, M.; Ren, W.; Zhu, W.; Chappelka, A.H.; Prior, S.A.; Lockaby, G.B. Drought in the Southern United States over the 20th century: Variability and its impacts on terrestrial ecosystem productivity and carbon storage. Clim. Chang. 2012, 114, 379–397. [Google Scholar] [CrossRef]
  36. Yu, Z.; Wang, J.; Liu, S.; Rentch, J.S.; Sun, P.; Lu, C. Global gross primary productivity and water use efficiency changes under drought stress. Environ. Res. Lett. 2017, 12, 014016. [Google Scholar] [CrossRef] [Green Version]
  37. Mokhtar, A.; He, H.; Alsafadi, K.; Mohammed, S.; He, W.; Li, Y.; Zhao, H.; Abdullahi, N.M.; Gyasi-Agyei, Y. Ecosystem water use efficiency response to drought over southwest China. Ecohydrology 2021, 15, e2317. [Google Scholar] [CrossRef]
  38. Sun, S.; Du, W.; Song, Z.; Zhang, D.; Wu, X.; Chen, B.; Wu, Y. Response of Gross Primary Productivity to Drought Time-Scales Across China. J. Geophys. Res. Biogeosci. 2021, 126, e2020JG005953. [Google Scholar] [CrossRef]
  39. Mokhtar, A.; Jalali, M.; He, H.; Al-Ansari, N.; Elbeltagi, A.; Alsafadi, K.; Abdo, H.G.; Sammen, S.S.; Gyasi-Agyei, Y.; Rodrigo-Comino, J. Estimation of SPEI Meteorological Drought Using Machine Learning Algorithms. IEEE Access 2021, 9, 65503–65523. [Google Scholar] [CrossRef]
  40. El Kenawy, A.M.; Al Buloshi, A.; Al-Awadhi, T.; Al Nasiri, N.; Navarro-Serrano, F.; Alhatrushi, S.; Robaa, S.M.; Domínguez-Castro, F.; McCabe, M.F.; Schuwerack, P.-M.; et al. Evidence for intensification of meteorological droughts in Oman over the past four decades. Atmos. Res. 2020, 246, 105126. [Google Scholar] [CrossRef]
  41. Bozkurt, D.; Sen, O.L. Climate change impacts in the Euphrates–Tigris Basin based on different model and scenario simulations. J. Hydrol. 2013, 480, 149–161. [Google Scholar] [CrossRef]
  42. Karakani, E.G.; Malekian, A.; Gholami, S.; Liu, J. Spatiotemporal monitoring and change detection of vegetation cover for drought management in the Middle East. Theor. Appl. Clim. 2021, 144, 299–315. [Google Scholar] [CrossRef]
  43. Hameed, M.; Ahmadalipour, A.; Moradkhani, H. Drought and food security in the middle east: An analytical framework. Agric. For. Meteorol. 2020, 281, 107816. [Google Scholar] [CrossRef]
  44. Barlow, M.; Zaitchik, B.; Paz, S.; Black, E.; Evans, J.; Hoell, A. A Review of Drought in the Middle East and Southwest Asia. J. Clim. 2016, 29, 8547–8574. [Google Scholar] [CrossRef]
  45. Friedlingstein, P.; Jones, M.W.; O’Sullivan, M.; Andrew, R.M.; Bakker, D.C.E.; Hauck, J.; Le Quéré, C.; Peters, G.P.; Peters, W.; Pongratz, J.; et al. Global Carbon Budget 2021. Earth Syst. Sci. Data 2022, 14, 1917–2005. [Google Scholar] [CrossRef]
  46. Jung, M.; Reichstein, M.; Margolis, H.A.; Cescatti, A.; Richardson, A.D.; Arain, M.A.; Arneth, A.; Bernhofer, C.; Bonal, D.; Chen, J.; et al. Global patterns of land-atmosphere fluxes of carbon dioxide, latent heat, and sensible heat derived from eddy covariance, satellite, and meteorological observations. J. Geophys. Res. Biogeosci. 2011, 116, 2010JG001566. [Google Scholar] [CrossRef] [Green Version]
  47. Zhang, F.; Chen, J.M.; Chen, J.; Gough, C.M.; Martin, T.A.; Dragoni, D. Evaluating spatial and temporal patterns of MODIS GPP over the conterminous U.S. against flux measurements and a process model. Remote Sens. Environ. 2012, 124, 717–729. [Google Scholar] [CrossRef]
  48. Smith, W.K.; Reed, S.C.; Cleveland, C.C.; Ballantyne, A.P.; Anderegg, W.R.L.; Wieder, W.R.; Liu, Y.Y.; Running, S.W. Large divergence of satellite and Earth system model estimates of global terrestrial CO2 fertilization. Nat. Clim. Chang. 2016, 6, 306–310. [Google Scholar] [CrossRef]
  49. Alsafadi, K.; Al-Ansari, N.; Mokhtar, A.; Mohammed, S.; Elbeltagi, A.; Sammen, S.S.; Bi, S. An evapotranspiration deficit-based drought index to detect variability of terrestrial carbon productivity in the Middle East. Environ. Res. Lett. 2022, 17, 014051. [Google Scholar] [CrossRef]
  50. Latham, J.; Cumani, R.; Rosati, I.; Bloise, M. FAO Global Land Cover (GLC-SHARE) Beta-Release 1.0 Database; Land and Water Division; FAO: Rome, Italy, 2014. [Google Scholar]
  51. Beck, H.E.; Zimmermann, N.E.; McVicar, T.R.; Vergopolan, N.; Berg, A.; Wood, E.F. Present and future Köppen-Geiger climate classification maps at 1-km resolution. Sci. Data 2018, 5, 180214. [Google Scholar] [CrossRef]
  52. Harris, I.; Osborn, T.J.; Jones, P.; Lister, D. Version 4 of the CRU TS monthly high-resolution gridded multivariate climate dataset. Sci. Data 2020, 7, 109. [Google Scholar] [CrossRef] [PubMed] [Green Version]
  53. Kenawy, A.M.E.; McCabe, M.F.; Vicente-Serrano, S.M.; Robaa, S.M.; Lopez-Moreno, J.I. Recent changes in continentality and aridity conditions over the Middle East and North Africa (MENA) region, and their association with circulation patterns. Clim. Res. 2016, 69, 25–43. [Google Scholar] [CrossRef] [Green Version]
  54. Monteith, J.L. Solar Radiation and Productivity in Tropical Ecosystems. J. Appl. Ecol. 1972, 9, 747–766. [Google Scholar] [CrossRef] [Green Version]
  55. Potter, C.S.; Randerson, J.T.; Field, C.B.; Matson, P.A.; Vitousek, P.M.; Mooney, H.A.; Klooster, S.A. Terrestrial ecosystem production: A process model based on global satellite and surface data. Glob. Biogeochem. Cycles 1993, 7, 811–841. [Google Scholar] [CrossRef]
  56. Jung, M.; Koirala, S.; Weber, U.; Ichii, K.; Gans, F.; Camps-Valls, G.; Papale, D.; Schwalm, C.; Tramontana, G.; Reichstein, M. The FLUXCOM ensemble of global land-atmosphere energy fluxes. Sci. Data 2019, 6, 74. [Google Scholar] [CrossRef] [Green Version]
  57. Jung, M.; Schwalm, C.; Migliavacca, M.; Walther, S.; Camps-Valls, G.; Koirala, S.; Anthoni, P.; Besnard, S.; Bodesheim, P.; Carvalhais, N.; et al. Scaling carbon fluxes from eddy covariance sites to globe: Synthesis and evaluation of the FLUXCOM approach. Biogeosciences 2020, 17, 1343–1365. [Google Scholar] [CrossRef] [Green Version]
  58. Harris, I.C. CRU JRA v2.0: A Forcings Dataset of Gridded Land Surface Blend of Climatic Research Unit (CRU) and Japanese Reanalysis (JRA) Data. Cent. Environ. Data Anal. 2019, 2905. Available online: https://catalogue.ceda.ac.uk/uuid/7f785c0e80aa4df2b39d068ce7351bbb (accessed on 6 July 2021).
  59. O’Sullivan, M.; Smith, W.K.; Sitch, S.; Friedlingstein, P.; Arora, V.K.; Haverd, V.; Jain, A.K.; Kato, E.; Kautz, M.; Lombardozzi, D.; et al. Climate-Driven Variability and Trends in Plant Productivity over Recent Decades Based on Three Global Products. Glob. Biogeochem. Cycles 2020, 34, e2020GB006613. [Google Scholar] [CrossRef]
  60. Baldocchi, D. Measuring fluxes of trace gases and energy between ecosystems and the atmosphere—The state and future of the eddy covariance method. Glob. Chang. Biol. 2014, 20, 3600–3609. [Google Scholar] [CrossRef]
  61. Grünzweig, J.M.; Gelfand, I.; Fried, Y.; Yakir, D. Biogeochemical factors contributing to enhanced carbon storage following afforestation of a semi-arid shrubland. Biogeosciences 2007, 4, 891–904. [Google Scholar] [CrossRef] [Green Version]
  62. Rotenberg, E.; Yakir, D. Distinct patterns of changes in surface energy budget associated with forestation in the semiarid region. Glob. Chang. Biol. 2011, 17, 1536–1548. [Google Scholar] [CrossRef]
  63. Rotenberg, E.; Qubaja, R.; Preisler, Y.; Yakir, D.; Tatarinov, F. Carbon and Energy Balance of Dry Mediterranean Pine Forests: A Case Study. In Pines and Their Mixed Forest Ecosystems in the Mediterranean Basin; Ne’eman, G., Osem, Y., Eds.; Managing Forest Ecosystems; Springer: Cham, Switzerland, 2021; Volume 38. [Google Scholar] [CrossRef]
  64. Miralles, D.G.; Holmes, T.R.H.; De Jeu, R.A.M.; Gash, J.H.; Meesters, A.G.C.A.; Dolman, A.J. Global land-surface evaporation estimated from satellite-based observations. Hydrol. Earth Syst. Sci. 2011, 15, 453–469. [Google Scholar] [CrossRef] [Green Version]
  65. Martens, B.; Miralles, D.G.; Lievens, H.; Van Der Schalie, R.; De Jeu, R.A.M.; Fernández-Prieto, D.; Beck, H.E.; Dorigo, W.A.; Verhoest, N.E.C. GLEAM v3: Satellite-based land evaporation and root-zone soil moisture. Geosci. Model Dev. 2017, 10, 1903–1925. [Google Scholar] [CrossRef] [Green Version]
  66. Martens, B.; De Jeu, R.A.M.; Verhoest, N.E.C.; Schuurmans, H.; Kleijer, J.; Miralles, D.G. Towards Estimating Land Evaporation at Field Scales Using GLEAM. Remote Sens. 2018, 10, 1720. [Google Scholar] [CrossRef] [Green Version]
  67. Michel, D.; Jiménez, C.; Miralles, D.G.; Jung, M.; Hirschi, M.; Ershadi, A.; Martens, B.; McCabe, M.F.; Fisher, J.B.; Mu, Q.; et al. The WACMOS-ET project—Part 1: Tower-scale evaluation of four remote-sensing-based evapotranspiration algorithms. Hydrol. Earth Syst. Sci. 2016, 20, 803–822. [Google Scholar] [CrossRef] [Green Version]
  68. Miralles, D.G.; Jiménez, C.; Jung, M.; Michel, D.; Ershadi, A.; McCabe, M.F.; Hirschi, M.; Martens, B.; Dolman, A.J.; Fisher, J.B.; et al. The WACMOS-ET project—Part 2: Evaluation of global terrestrial evaporation data sets. Hydrol. Earth Syst. Sci. 2016, 20, 823–842. [Google Scholar] [CrossRef] [Green Version]
  69. Hamed, K.H.; Rao, A.R. A modified Mann-Kendall trend test for autocorrelated data. J. Hydrol. 1998, 204, 182–196. [Google Scholar] [CrossRef]
  70. Alashan, S. Combination of Modified Mann-Kendall Method and Şen Innovative Trend Analysis. Eng. Rep. 2020, 2, e12131. [Google Scholar] [CrossRef]
  71. Wang, S.; Zhang, Y.; Ju, W.; Qiu, B.; Zhang, Z. Tracking the seasonal and inter-annual variations of global gross primary production during last four decades using satellite near-infrared reflectance data. Sci. Total Environ. 2021, 755, 142569. [Google Scholar] [CrossRef]
  72. Mokhtar, A.; He, H.; Alsafadi, K.; Li, Y.; Zhao, H.; Keo, S.; Bai, C.; Abuarab, M.; Zhang, C.; Elbagoury, K.; et al. Evapotranspiration as a response to climate variability and ecosystem changes in southwest, China. Environ. Earth Sci. 2020, 79, 312. [Google Scholar] [CrossRef]
  73. Alsafadi, K.; Mohammed, S.A.; Ayugi, B.; Sharaf, M.; Harsányi, E. Spatial–Temporal Evolution of Drought Characteristics Over Hungary Between 1961 and 2010. Pure Appl. Geophys. 2020, 177, 3961–3978. [Google Scholar] [CrossRef] [Green Version]
  74. Mann, H.B. Mann Nonparametric Test against Trend. Econometrica 1945, 13, 245–259. [Google Scholar] [CrossRef]
  75. Kendall, M.G. Rank Correlation Methods, 4th ed.; Charles Griffin: London, UK, 1975. [Google Scholar]
  76. Sen, P.K. Estimates of the regression coefficient based on Kendall’s Tau. J. Am. Stat. Assoc. 1968, 63, 1379–1389. [Google Scholar] [CrossRef]
  77. Theil, H. A rank-invariant method of linear and polynomial regression analysis. In Henri Theil’s Contributions to Economics and Econometrics. Advanced Studies in Theoretical and Applied Econometrics; Raj, B., Koerts, J., Eds.; Springer: Dordrecht, The Netherlands, 1992; Volume 23, pp. 345–381. [Google Scholar] [CrossRef]
  78. Zhang, X.; Li, M.; Ma, Z.; Yang, Q.; Lv, M.; Clark, R. Assessment of an Evapotranspiration Deficit Drought Index in Relation to Impacts on Ecosystems. Adv. Atmos. Sci. 2019, 36, 1273–1287. [Google Scholar] [CrossRef]
  79. Shapiro, S.S.; Wilk, M.B. An Analysis of Variance Test for Normality (Complete Samples). Biometrika 1965, 52, 591. [Google Scholar] [CrossRef]
  80. Sharma, A.; Goyal, M.K. Assessment of ecosystem resilience to hydroclimatic disturbances in India. Glob. Chang. Biol. 2018, 24, e432–e441. [Google Scholar] [CrossRef]
  81. Mohammed, S.; Alsafadi, K.; Enaruvbe, G.O.; Bashir, B.; Elbeltagi, A.; Széles, A.; Alsalman, A.; Harsanyi, E. Assessing the impacts of agricultural drought (SPI/SPEI) on maize and wheat yields across Hungary. Sci. Rep. 2022, 12, 8838. [Google Scholar] [CrossRef]
  82. Guo, L.; Sun, F.; Liu, W.; Zhang, Y.; Wang, H.; Cui, H.; Wang, H.; Zhang, J.; Du, B. Response of Ecosystem Water Use Efficiency to Drought over China during 1982–2015: Spatiotemporal Variability and Resilience. Forests 2019, 10, 598. [Google Scholar] [CrossRef] [Green Version]
  83. Ge, W.; Deng, L.; Wang, F.; Han, J. Quantifying the contributions of human activities and climate change to vegetation net primary productivity dynamics in China from 2001 to 2016. Sci. Total Environ. 2021, 773, 145648. [Google Scholar] [CrossRef]
  84. Zhou, X.; Peng, B.; Zhou, Y.; Yu, F.; Wang, X.-C. Quantifying the Influence of Climate Change and Anthropogenic Activities on the Net Primary Productivity of China’s Grasslands. Remote Sens. 2022, 14, 4844. [Google Scholar] [CrossRef]
  85. Wu, Y.; Luo, Z.; Wu, Z. The Different Impacts of Climate Variability and Human Activities on NPP in the Guangdong–Hong Kong–Macao Greater Bay Area. Remote Sens. 2022, 14, 2929. [Google Scholar] [CrossRef]
  86. Piao, S.; Wang, X.; Park, T.; Chen, C.; Lian, X.; He, Y.; Bjerke, J.W.; Chen, A.; Ciais, P.; Tømmervik, H.; et al. Characteristics, drivers and feedbacks of global greening. Nat. Rev. Earth Environ. 2019, 1, 14–27. [Google Scholar] [CrossRef] [Green Version]
  87. Haverd, V.; Smith, B.; Canadell, J.G.; Cuntz, M.; Mikaloff-Fletcher, S.; Farquhar, G.; Woodgate, W.; Briggs, P.R.; Trudinger, C.M. Higher than expected CO2 fertilization inferred from leaf to global observations. Glob. Chang. Biol. 2020, 26, 2390–2402. [Google Scholar] [CrossRef] [PubMed] [Green Version]
  88. Wild, B.; Teubner, I.; Moesinger, L.; Zotta, R.-M.; Forkel, M.; van der Schalie, R.; Sitch, S.; Dorigo, W. VODCA2GPP—A new, global, long-term (1988–2020) gross primary production dataset from microwave remote sensing. Earth Syst. Sci. Data 2022, 14, 1063–1085. [Google Scholar] [CrossRef]
  89. Anav, A.; Friedlingstein, P.; Beer, C.; Ciais, P.; Harper, A.; Jones, C.; Murray-Tortarolo, G.; Papale, D.; Parazoo, N.C.; Peylin, P.; et al. Spatiotemporal patterns of terrestrial gross primary production: A review. Rev. Geophys. 2015, 53, 785–818. [Google Scholar] [CrossRef] [Green Version]
  90. Bo, Y.; Li, X.; Liu, K.; Wang, S.; Zhang, H.; Gao, X.; Zhang, X. Three Decades of Gross Primary Production (GPP) in China: Variations, Trends, Attributions, and Prediction Inferred from Multiple Datasets and Time Series Modeling. Remote Sens. 2022, 14, 2564. [Google Scholar] [CrossRef]
  91. Ciais, P.; Sabine, C.; Bala, G.; Bopp, L.; Brovkin, V.; Canadell, J.; Chhabra, A.; DeFries, R.; Galloway, J.; Heimann, M.; et al. Carbon and Other Biogeochemical Cycles. In Climate Change 2013: The Physical Science Basis; IPCC: Geneva, Switzerland, 2013. [Google Scholar]
  92. Beer, C.; Reichstein, M.; Tomelleri, E.; Ciais, P.; Jung, M.; Carvalhais, N.; Rödenbeck, C.; Arain, M.A.; Baldocchi, D.; Bonan, G.B.; et al. Terrestrial gross carbon dioxide uptake: Global distribution and covariation with climate. Science 2010, 329, 834–838. [Google Scholar] [CrossRef] [PubMed] [Green Version]
  93. Green, J.K.; Seneviratne, S.I.; Berg, A.M.; Findell, K.L.; Hagemann, S.; Lawrence, D.M.; Gentine, P. Large influence of soil moisture on long-term terrestrial carbon uptake. Nature 2019, 565, 476–479. [Google Scholar] [CrossRef]
  94. Norby, R.J.; Warren, J.M.; Iversen, C.M.; Medlyn, B.E.; McMurtrie, R.E. CO2 enhancement of forest productivity constrained by limited nitrogen availability. Proc. Natl. Acad. Sci. USA 2010, 107, 19368–19373. [Google Scholar] [CrossRef]
  95. Oren, R.; Ellsworth, D.S.; Johnsen, K.H.; Phillips, N.; Ewers, B.E.; Maier, C.; Schäfer, K.V.R.; McCarthy, H.; Hendrey, G.; McNulty, S.G.; et al. Soil fertility limits carbon sequestration by forest ecosystems in a CO2-enriched atmosphere. Nature 2001, 411, 469–472. [Google Scholar] [CrossRef] [Green Version]
  96. O’Sullivan, M.; Spracklen, D.V.; Batterman, S.A.; Arnold, S.R.; Gloor, M.; Buermann, W. Have synergies between nitrogen deposition and atmospheric CO2 driven the recent enhancement of the terrestrial carbon sink? Glob. Biogeochem. Cycles 2019, 33, 163–180. [Google Scholar] [CrossRef] [Green Version]
  97. Wu, X.; Liu, H.; Li, X.; Ciais, P.; Babst, F.; Guo, W.; Zhang, C.; Magliulo, V.; Pavelka, M.; Liu, S.; et al. Differentiating drought legacy effects on vegetation growth over the temperate Northern Hemisphere. Glob. Chang. Biol. 2018, 24, 504–516. [Google Scholar] [CrossRef]
  98. Gunderson, C.A.; O’Hara, K.H.; Campion, C.M.; Walker, A.V.; Edwards, N.T. Thermal plasticity of photosynthesis: The role of acclimation in forest responses to a warming climate. Glob. Chang. Biol. 2010, 16, 2272–2286. [Google Scholar] [CrossRef]
  99. Yang, R.; Wang, J.; Zeng, N.; Sitch, S.; Tang, W.; McGrath, M.J.; Cai, Q.; Liu, D.; Lombardozzi, D.; Tian, H.; et al. Divergent historical GPP trends among state-of-the-art multi-model simulations and satellite-based products. Earth Syst. Dyn. 2022, 13, 833–849. [Google Scholar] [CrossRef]
  100. Stocker, B.D.; Zscheischler, J.; Keenan, T.F.; Prentice, I.C.; Seneviratne, S.I.; Peñuelas, J. Drought impacts on terrestrial primary production underestimated by satellite monitoring. Nat. Geosci. 2019, 12, 264–270. [Google Scholar] [CrossRef] [Green Version]
  101. De Kauwe, M.G.; Keenan, T.F.; Medlyn, B.E.; Prentice, I.C.; Terrer, C. Satellite based estimates underestimate the effect of CO2 fertilization on net primary productivity. Nat. Clim. Chang. 2016, 6, 892–893. [Google Scholar] [CrossRef] [Green Version]
  102. Galloway, J.N.; Dentener, F.J.; Capone, D.G.; Boyer, E.W.; Howarth, R.W.; Seitzinger, S.P.; Asner, G.P.; Cleveland, C.C.; Green, P.A.; Holland, E.A.; et al. Nitrogen Cycles: Past, Present, and Future. Biogeochemistry 2004, 70, 153–226. [Google Scholar] [CrossRef]
  103. Xiao, X.; Hollinger, D.; Aber, J.; Goltz, M.; Davidson, E.A.; Zhang, Q.; Moore, B. Satellite-based modeling of gross primary production in an evergreen needleleaf forest. Remote Sens. Environ. 2004, 89, 519–534. [Google Scholar] [CrossRef]
  104. Zhang, L.-X.; Zhou, D.-C.; Fan, J.-W.; Hu, Z.-M. Comparison of four light use efficiency models for estimating terrestrial gross primary production. Ecol. Model. 2015, 300, 30–39. [Google Scholar] [CrossRef]
  105. Zhang, L.; Zhou, D.; Fan, J.; Guo, Q.; Chen, S.; Wang, R.; Li, Y. Contrasting the Performance of Eight Satellite-Based GPP Models in Water-Limited and Temperature-Limited Grassland Ecosystems. Remote Sens. 2019, 11, 1333. [Google Scholar] [CrossRef] [Green Version]
  106. Pei, Y.; Dong, J.; Zhang, Y.; Yang, J.; Zhang, Y.; Jiang, C.; Xiao, X. Performance of four state-of-the-art GPP products (VPM, MOD17, BESS and PML) for grasslands in drought years. Ecol. Inform. 2020, 56, 101052. [Google Scholar] [CrossRef]
  107. Yuan, W.; Cai, W.; Nguy-Robertson, A.L.; Fang, H.; Suyker, A.E.; Chen, Y.; Dong, W.; Liu, S.; Zhang, H. Uncertainty in simulating gross primary production of cropland ecosystem from satellite-based models. Agric. For. Meteorol. 2015, 207, 48–57. [Google Scholar] [CrossRef] [Green Version]
  108. Liu, Y.; Xiao, J.; Ju, W.; Zhu, G.; Wu, X.; Fan, W.; Li, D.; Zhou, Y. Satellite-derived LAI products exhibit large discrepancies and can lead to substantial uncertainty in simulated carbon and water fluxes. Remote Sens. Environ. 2018, 206, 174–188. [Google Scholar] [CrossRef]
  109. Nash, J.E.; and Sutcliffe, J.V. River flow forecasting through conceptual models part I—A discussion of principles. J. Hydrol. 1970, 10, 282–290. [Google Scholar] [CrossRef]
  110. Willmott, C.J.; Ackleson, S.G.; Davis, R.E.; Feddema, J.J.; Klink, K.M.; LeGates, D.R.; O’Donnell, J.; Rowe, C.M. Statistics for the evaluation and comparison of models. J. Geophys. Res. Atmos. 1985, 90, 8995–9005. [Google Scholar] [CrossRef] [Green Version]
  111. Hauduc, H.; Neumann, M.B.; Muschalla, D.; Gamerith, V.; Gillot, S.; Vanrolleghem, P.A. Efficiency criteria for environmental model quality assessment: A review and its application to wastewater treatment. Environ. Model. Softw. 2015, 68, 196–204. [Google Scholar] [CrossRef]
  112. Pearson, K. VII. Mathematical contributions to the theory of evolution.—III. Regression, heredity, and panmixia. Philos. Trans. R. Soc. London. Ser. A Contain. Pap. A Math. Phys. Character 1896, 187, 253–318. [Google Scholar]
Figure 1. Location of the study area and Köppen–Geiger classification-based climate patterns [51].
Remotesensing 14 06237 g001
Figure 2. Scatter plots of observed GPP (gCm−2 yr−1) data against GPP from the four data sets for the period of 2001–2016 and the Taylor diagram evaluation (ad).
Remotesensing 14 06237 g002
Figure 3. Trends of long-term intra-annual GLASS-GPP series for the period of 1982–2016: (a) the magnitude of annual change given in gCm−2yr−1; (b) the Z-statistic values of trends at a 95% confidence interval. In addition, the results are plotted for specific regions over the Middle East.
Remotesensing 14 06237 g003
Figure 4. Temporal trends of the regional carbon stocks (in PgC yr−1) for the Middle East between 1982 and 2016. 1 PgC = 1015 gC. Grouped bars on the bottom row indicate the magnitude of change for the two short sub-periods (1982–1999 and 2000–2016). The black lines are the statistical confidence interval (95%) of the regression lines.
Remotesensing 14 06237 g004
Figure 5. The left panel shows the spatio-temporal trends of the GPP products (in gC m−2 yr−1) for the Middle East between 1982 and 2016. The small dots denote statistically significant trends at a confidence level of 95% (i.e., p < 0.05) using the Z-statistic of the M-K test. The upper right panel summarizes the cross-correlation matrix calculated among the models’ trend magnitudes (Sen’s slopes), while the lower right panel shows the distribution density curve of the trend slope for all GPP products.
Remotesensing 14 06237 g005
Figure 6. (a,b) The regional temporal trend of the SEDI and the percentage of areas affected by drought categories based on the SEDI series at an annual timescale over the Middle East between 1980 and 2017.
Remotesensing 14 06237 g006
Figure 7. The spatial distribution of correlation values between the four GPP datasets and the SEDI from 1982 to 2016. Right panels indicate the pairwise comparisons, i.e., the cross-correlation value among the GPP models’ responses to the dry-wet condition of the SEDI.
Remotesensing 14 06237 g007
Figure 8. Spatial distribution of GLASS-GPP-based ERI values in the ME region from 1982 to 2016 based on land-cover data obtained from the SHARE dataset [50].
Remotesensing 14 06237 g008
Figure 9. (a,b) Spatial distribution of ERIs in the Middle East during 1982–2016 as suggested when using the different GPP products. (c) Cross-correlation values among the calculated ERIs of several GPP products.
Remotesensing 14 06237 g009
Table 1. The widely used models for the prediction GPP dataset; their structure, forcing data, data period, and spatial resolution.
Models Type Model(s) Forcing Data Method Used Spatial
Resolution
Data
Period
References
Process-based modelsTRENDY DGVM
-
CO2 concentration
-
Climate data (CRU, CRU-JRA55)
-
Land-use change.
Land modelling
(Trendy-v8’s experimental protocols) with S0, S1, S2, and S3 simulations and
additional trendy
simulations
2.8125° × 2.8125°
1.875° × 1.875°
1.25° × 1.875°
1° × 1°
0.9375° × 1.25°
0.5° × 0.5°
1959–2020Friedlingstein et al. [45]
Sitch et al. [25]
Eddy covariance (EC) flux data-driven modelsFluxCom
-
FLUXNET eddy covariance dataset
-
Meteorological dataset (CRUJRA-v1, ERA5, GSWP3
-
CERES-GPCP, WFDEI)
-
Remote sensing data: MODIS-based flux data
Upscaling the EC data
using machine learning methods (e.g., RF and ANN)Two setups (METEO + RS, and RS) and two flux
partitioning methods
0.5° × 0.5°1981–2016Jung et al. [17]
Tramontana et al. [18]
Model Tree
Ensembles (MTE)
-
FLUXNET eddy covariance dataset.
-
Meteorological dataset (CRU-PIK, GPCC products, and ECMWF ERA-interim reanalysis data)
-
Remote sensing data (fAPAR products of GIMMS, SeaWiFS, and MERIS)
Machine learning
technique (model tree
ensembles) to upscale the EC sites into the gridded dataset
0.5° × 0.5°1982–2008Jung et al. [46]
Satellite-based modelsMODIS (MOD17)
-
Meteorological dataset (NCEP Reanalysis)
-
Land-cover data
-
Satellite data (MODIS fPAR)
LUE scheme,
process-based Farquhar von Caemmerer, and Berry (FvCB) model
500 m2000–2015Zhang et al. [47]
VPM
-
Meteorological dataset (NCEP II)
-
Remote sensing data (EVI, PAR, Ta, LSWI)
-
Land-cover data (MCD12Q1 C51)
-
C4 crop percentage, major crop types (Earth Stat)
-
C4 vegetation percentage map (ISLSCP II)
LUE scheme0.05° × 0.05°
0.5° × 0.5°
2000–2016Zhang et al. [21]
GIMMS
-
Meteorological dataset (NCEP-DOE Reanalysis II, CRU-NCEP)
-
Remote sensing data: GIMMS’s FPAR and LAI data
MODIS algorithm0.05° × 0.05°1982–2016Smith et al. [48]
GLASS and Revised EC-LUE
-
Meteorological dataset (MERRA-2)
-
Remote sensing data: GLASS LAI data
-
Land-cover data (MCD12Q1 product)
-
C4 crop percentage (SLSCP II)
-
CO2 concentration (NOAA-ESRL)
LUE principle0.05° × 0.05°1982–2018Zheng et al. [23]
Both data-driven and process-based modelsBoreal Ecosystem Productivity
Simulator (BEPS) model
-
Remotely sensed data (MODIS and GIMMS’s LAI data and GIMMS AVHRR NDVI)
-
Meteorological dataset (CRUNCEP V8.0)
-
Nitrogen deposition data (GOME, and SCIAMACHY)
-
Soil data (the Harmonized World Soil Database (HWSD) v1.2, FAO)
Process-based formulation of LUE (FvCB model)0.072727° × 0.072727°1981–2016He et al. [33]
P-model
-
Remotely sensed data (MODIS FPAR, MODIS EVI, GIMMS fAPAR3g)
-
Meteorological dataset (WATCH-WFDEI, CRU-TS 4.01, and FLUXNET 2015 Tier 1)
FvCB and LUE models0.5° × 0.5°
At the site-scale of the FLUXNET2015 dataset
2000–2016Stocker et al. [31]
Table 2. Accuracy metrics summarizing the performance of the four GPP datasets against the observed GPP at the EC tower in Yatir forest.
Index FluxCom-GPP GIMMS-GPP GLASS-GPP VPM-GPP Averaged GPP
NSE−0.51−2.950.550.033−0.24
d0.10.060.850.460.45
RMSE, gCm−2 yr−1153.7248.883.7123.1139.8
r0.610.570.760.520.77
Publisher’s Note: MDPI stays neutral with regard to jurisdictional claims in published maps and institutional affiliations.

