Article

Mapping Soil Organic Carbon Content in Patagonian Forests Based on Climate, Topography and Vegetation Metrics from Satellite Imagery

by
Guillermo Martínez Pastur
1,*,
Marie-Claire Aravena Acuña
1,
Eduarda M. O. Silveira
2,
Axel Von Müller
3,
Ludmila La Manna
4,
Marina González-Polo
5,
Jimena E. Chaves
1,
Juan M. Cellini
6,
María V. Lencinas
1,
Volker C. Radeloff
2,
Anna M. Pidgeon
2 and
Pablo L. Peri
7
1
Laboratorio de Recursos Agroforestales, Centro Austral de Investigaciones Científicas (CADIC), Consejo Nacional de Investigaciones Científicas y Técnicas (CONICET), Ushuaia 9410, Tierra del Fuego, Argentina
2
SILVIS Lab, Department of Forest and Wildlife Ecology, University of Wisconsin, Madison, WI 53706, USA
3
Estación Experimental Agroforestal Esquel, Instituto Nacional de Tecnología Agropecuaria (INTA), Chacabuco 9200, Chubut, Argentina
4
Centro de Estudios Ambientales Integrados (CEAI), Universidad Nacional de la Patagonia San Juan Bosco, Consejo Nacional de Investigaciones Científicas y Técnicas (CONICET), Chacabuco 9200, Chubut, Argentina
5
Instituto de Investigaciones en Biodiversidad y Medioambiente (INIBIOMA), Consejo Nacional de Investigaciones Científicas y Técnicas (CONICET), Universidad Nacional del Comahue, San Carlos de Bariloche 8400, Río Negro, Argentina
6
Laboratorio de Investigaciones en Maderas (LIMAD), Universidad Nacional de la Plata, La Plata 1900, Buenos Aires, Argentina
7
Instituto Nacional de Tecnología Agropecuaria (INTA), Universidad Nacional de la Patagonia Austral, Consejo Nacional de Investigaciones Científicas y Técnicas (CONICET), Río Gallegos 9400, Santa Cruz, Argentina
*
Author to whom correspondence should be addressed.
Remote Sens. 2022, 14(22), 5702; https://doi.org/10.3390/rs14225702
Submission received: 14 October 2022 / Revised: 4 November 2022 / Accepted: 6 November 2022 / Published: 11 November 2022

Abstract

:
Soil organic carbon (SOC) content supports several ecosystem services. Quantifying SOC requires: (i) accurate C estimates of forest components, and (ii) soil estimates. However, SOC is difficult to measure, so predictive models are needed. Our objective was to model SOC stocks within 30 cm depth in Patagonian forests based on climatic, topographic and vegetation productivity measures from satellite images, including Dynamic Habitat Indices and Land Surface Temperature derived from Landsat-8. We used data from 1320 stands of different forest types in Patagonia, and random forest regression to map SOC. The model captured SOC variability well (R² = 0.60, RMSE = 22.1%), considering the huge latitudinal extension (36.4° to 55.1° SL) and the great diversity of forest types. Mean SOC was 134.4 ton C ha−1 ± 25.2, totaling 404.2 million ton C across Patagonia. Overall, SOC values were highest in valleys of the Andes mountains and in southern Tierra del Fuego, ranging from 53.5 to 277.8 ton C ha−1 for the whole Patagonia region. Soil organic carbon is a metric relevant to many applications, connecting major issues such as forest management, conservation, and livestock production, and having spatially explicit estimates of SOC enables managers to fulfil the international agreements that Argentina has joined.

1. Introduction

Argentina is among the countries that signed the Kyoto Protocol and the Paris Agreement, recognizing climate change as a shared problem. Argentina has committed to reducing carbon (C) emissions significantly by 2030 and reaching zero C emissions by 2050. To meet these goals, the Argentinian government implemented the “National Plan for Adaptation and Mitigation to Climate Change” [1]. One of the key targets of this plan is to protect native forests, which cover approximately 46.8 million hectares [2]. Maintaining native forests is also a key strategy under the REDD+ initiative (Reducing Emissions from Deforestation and forest Degradation) of the United Nations. According to REDD+, protection of forests alone can contribute 30% of the actions needed to keep global average temperature rise at or below 2 °C, but requires rapid reduction of deforestation and degradation, and promotion of sustainable management [3]. Argentina has a strong protected area network that covers nearly 12% of the land area, and which does not equally protect all native forest ecosystem types [4]. However, most native forests are privately owned, and regulations are needed to ensure their persistence [5]. Zoning is one of the instruments used by the Argentinian government to regulate human activities in native forests, and the provinces are obligated to define land use zones, which must be updated every five years, e.g., Ordenamiento Territorial de los Bosques Nativos/Land Use Planning of Native Forests (OTBN) defined by National Law 26,331/07 [1,6]. Accurate, broad-extent yet fine-resolution information on forest resources is needed for sustainable management and conservation planning [7,8,9,10,11], and for scientific investigations [12]. In Argentina, national and provincial governments are lacking accurate information to quantify emissions and C stocks, which is required for both policy formulation and meeting reporting requirements by international agencies [13,14]. Without detailed information on forest C dynamics, it is impossible to gauge the effectiveness of both proposed and implemented policies [15,16,17].
Quantifying C stocks in the forested landscapes requires two steps: the first is to obtain accurate C estimates in the stands (e.g., trees, deadwood, understory plants, soils) [16,18]. The second step is to model and map these C across large areas [19,20], representing a challenge in those areas with low data availability. There are estimates of C storage in native forests at stand level in Patagonia [19,21,22,23], and they include both estimates of above- and below-ground components for wide ranges of site quality of the stands and tree crown classes [15,18,24]. While these data provide accurate estimates of the different tree components at stand level, modeling and mapping forest C in the landscape remains a challenge in Argentina. Fortunately, recent advances in mapping forest structure and functionality for large areas combine field-based measurements with data from passive and active satellite sensors including radar (e.g., [25,26,27]) provide measurements of forest attributes, plus the uncertainty in those measurements, over large areas at much lower cost than traditional field inventories [28,29,30]. In contrast to the advances in biomass and C stock estimations in the above-ground components of forests, soil components have largely been ignored. The question that we want to answer in this study is how well those remote sensing metrics can predict forest C, and especially SOC, for which large-area estimates are rare.
Soil organic carbon (SOC) is the main component of forest C stock [31], and can be greatly affected by management [32,33]. The amount of carbon in soil is the result of a combination of forest cover, past disturbances, climatic conditions, and management practices [34,35]. SOC is also important for ecosystem service provision in native forests [15,36,37], and for supporting biodiversity [16,23]. SOC influence over the capacity of forests to produce timber and forage availability for both wild and domestic animals [23,38]. Accordingly, SOC is a useful indicator for assessing the sustainability of silvopastoral systems [15,32]. While SOC content has been characterized in local studies of Patagonian native forests [15,24,39,40,41], large-area modeling of SOC at regional scale has rarely attempted, e.g., in Santa Cruz province, climate variables (e.g., isothermality and precipitation seasonality) plus the normalized difference vegetation index (NDVI) explain broad-scale SOC variation [19]. NDVI was one of the first remote sensing analytical products used to simplify the complexities of multi-spectral imagery, and is one of the most popular indices used for vegetation assessment [42]. The capabilities of NDVI have greatly improved in recent decades [43], and its potential has greatly increased with analysis complexity and available technology. More recently, other related indexes have also been used to improve vegetation assessment, e.g., Landsat Enhanced Vegetation Index (EVI) [44,45]. SOC is positively associated with vegetation cover [34], and it is possible that measures such as vegetation phenology and Dynamic Habitat Indices (DHIs) [26,46,47] may offer higher predictive power for estimating SOC. We expect that these vegetation indices can improve the SOC modeling at landscape level, due to these variables combine multiple functional proxies of ecological processes [15,26,47].
Our goal was to model SOC stocks on soils within 30 cm depth in Patagonian forests (Argentina), based on climatic, topographic and remotely sensed vegetation productivity measures. Our specific objectives were to: (i) model SOC based on the DHIs and climate variables (e.g., Land Surface Temperature, LST) derived from Landsat-8 data plus climate and topography information and predict SOC across Patagonia at 30 m resolution; (ii) map the uncertainty of our SOC predictions, and quantify the relative contribution of the predictors to the model; (iii) compare model accuracy for different provinces and forest types across Patagonia; and (iv) quantify the SOC stocks by province, forest type, national or regional protection status (National Law 26,331/07), and national and provincial reserve networks.

2. Materials and Methods

2.1. Study Area and Sampling Design

We analyzed the native forests of Argentinian Patagonia (30,071.7 km2), which are located between 36.4° and 55.1° SL, and 63.8° and 73.5° WL (Figure 1). The forest area was defined by crossing the area defined in Argentina’s National Forest Inventory [48] and the Global Forest Change (GFC) data set [49]. Patagonia includes five different provinces along 2100 km: Tierra del Fuego (TDF), Santa Cruz (SC), Chubut (CHU), Río Negro (RN), and Neuquén (NQN). The region is dominated by temperate forests with low diversity of tree species, and included different assemblages of deciduous, evergreen and coniferous [50]. We considered seven categories of forests for this study (different grouping of forest types with similar characteristics) (Table 1), where Nothofagus are the dominant tree genus, growing in pure or mixed stands [51].
We selected stands (>2 ha) from the different forest types for soil sampling (Figure 1) based on their accessibility, conservation status, and lack of strong transformation or degradation (e.g., basal area <15 m2 ha−1). In total, we sampled 1320 stands, reaching one sampled stand for every 22.8 km2 of forest cover (Table 2). The sampling effort is presented in Table 2 considering the different forest cover types and the forest cover of each province. The sampled stands covering the native forest distribution in Patagonia along the main climate and topographic gradients, e.g., the Andes mountains, run in the N–S direction in the mainland but turn to the W–E direction in the Tierra del Fuego archipelago, defining precipitation and temperature greatly [1].

2.2. Soil Sampling and Calculation of Soil Organic Carbon

For each stand, we extracted soil samples (n = 4–9 in randomly selected areas covering >200 cm2 of cover at each stand) using a hand soil sampler including the first 30 cm depth below litter layer. The soil sampler has a known volume (200–300 cm3), making it possible to calculate soil bulk density (SBD). The calculations were conducted with air-dried samples, with any particles >2 mm removed previously by sieving (roots, stones, coarse woody debris).
To conduct chemical analyses, we pooled the individual soil samples of each stand, while maintaining the identity of the soil depth layers. The fine-earth fractions were used for laboratory analyses using two different methods: (i) C-concentration derived from dry combustion (induction furnace) using a LECO auto-analyzer (St. Joseph, MI, USA), and (ii) determination of organic matter by gravimetric technique after mass loss on ignition using dry combustion, which was used to model the C concentration in a sub-sample of plots. The dependent variable in models, SOC, was estimated using two different techniques: 500 °C for 24 h [31], and 500 °C for 2–3 h, following the methods of IRAM-SAGPyA 29571-1-2008 (Argentina). SOC was calculated with the C concentration (one of the two previously described methods) and the SBD for the first 30 cm soil layer (ton C ha−1).

2.3. Remotely Sensed Predictor Variables and Auxiliary Information

We used a combination of climate, topography, and vegetation productivity measures as predictors in our SOC model. We obtained mean annual precipitation (1 km resolution) from WorldClim [52], elevation (30 m resolution) from The Shuttle Radar Topographic Mission (SRTM), and four variables derived from Landsat-8 (30 m spatial resolution) available in Google Earth Engine [53] from 2018 to 2021. Specifically, we analyzed Landsat-8 surface reflectance, which was atmospherically corrected using LaSRC [54] and included a cloud, shadow, water, and snow mask produced using CFMASK [55]. From this, we calculated the EVI and generated a monthly time series that represented average conditions in each month from 2018 to 2021. To do so, first we selected the highest EVI value in each month of each year. Second, we selected the median monthly values across all years to reduce the effects of extreme years. Then, we calculated multi-layer composite of Landsat-8 Dynamic Habitat Indices (DHIs). We calculated the cumulative DHI as the sum of the monthly values, the minimum DHI, and the variation DHI as the coefficient of variation. We also calculated 90th percentile of EVI (EVI_p90) to capture peak-growing season greenness [26,56,57]. Additionally, EVI_p90 excludes extreme outliers that could strongly influence the cumulative productivity estimate. The DHIs summarize the productivity of vegetation in three ways: (i) annual cumulative productivity of DHI (CumDHI), as a measure of available energy, which integrates the productive capacity over a year; (ii) minimum productivity of DHI (MinDHI), as a measure of resource limitation; and (iii) annual variation of DHI (VarDHI), that captures potential seasonality effects [46,47]. From Landsat-8, in addition to DHIs, we also obtained the land surface temperature (LST) from Band 10 of the thermal infrared sensor (TIRS), and calculated median LST values for available observations from 2018 to 2021.

2.4. Modeling and Mapping the Soil Organic Carbon

We used random forest regression [58] to model the SOC. This algorithm parameterizes a large number of decision trees (the ‘forest’), and the final prediction value corresponds to the averaged output of all individual decision trees. We used the randomForest package [59] available in R [60]. For calibration and training, we randomly selected 70% of the field plots balanced across the Patagonia forest region according to the data histogram of SOC (10 classes), including all class intervals in the training dataset. The remaining 30% were used for validation data. We selected optimal values of the hyperparameters (ntree and mtry) for the random forest model employing the random search method to tune the hyperparameters [61]. For validation, we computed the coefficient of determination (R², %) and the root mean square error (RMSE). We also generated uncertainty maps of the relative RMSE (%) and absolute RMSE (ton C ha−1) as follows: (i) we binned the predicted SOC values into 10 bins (based on natural breaks) and computed the RMSE (both percentage and absolute) for each bin; and (ii) we fitted a regression model to the 10 RMSE bin values and the predicted mean values of each variable across the entire range of a given forest attribute [62,63]. Based on this regression model, we then mapped the two RMSEs. To quantify the relative contribution of predictors in the SOC model, we ranked the variables based on the increase in the mean square error (IncMSE). IncMSE (%) reflects the average increase in the variable’s contribution to the mean square error (MSE), divided by its measure of variability. An auto-validation analysis was also conducted to obtain the global estimation errors. Finally, to map the SOC, we applied the random forest regression models to each pixel to predict SOC based on our predictor variables’ values. The predictions were mapped at 30 m spatial resolution using geographic coordinate system and datum World Geodetic System (WGS) 1984, integrated into a geographical information system (GIS) using ArcMap 10.0 software (ESRI, Redlands, CA, USA) [64].

2.5. Data Extraction and Output Analyses

Based on our SOC map, we characterized Patagonian forests according to the defined categories, which was used as a mask. We calculated C stocks (million ton C) and related them to those variables used during the modeling: (i) total C stocks for Patagonian forests; (ii) SOC versus latitude and longitude of each plot; (iii) SOC versus average mean annual temperature (°C) and mean annual rainfall (mm yr−1) of each plot; (iv) SOC versus elevation (m a.s.l.) of each plot; (v) SOC by forest type (Table 1); (vi) SOC for each province using the limits informed by Instituto Geográfico Nacional (IGN) of Argentina (www.ign.gob.ar, accessed on 12 June 2021) (TDF = Tierra del Fuego, SC = Santa Cruz, CHU = Chubut, RN = Río Negro, NQN = Neuquén); (vii) SOC classified by status protection according OTBN [6]: red (high conservation value forests for ancestral uses, gathering of non-timber forest products, scientific research, conservation plans, ecological restoration), yellow (medium conservation value forests for sustainable productive activities and tourism under the guidelines of management and conservation plans), and green (low conservation value forest where land-use change is allowed) [1]; and (viii) SOC in the existing reserve network according to the Administración de Parques Nacionales (APN) of Argentina (www.argentina.gob.ar/parquesnacionales, accessed on 12 June 2021) (NAT = National Parks, PRO = provincial reserves, UNP = unprotected). For each category and combinations, we calculated mean SOC values and the standard deviation (SD).

3. Results

3.1. Performance of the Soil Organic Carbon Model

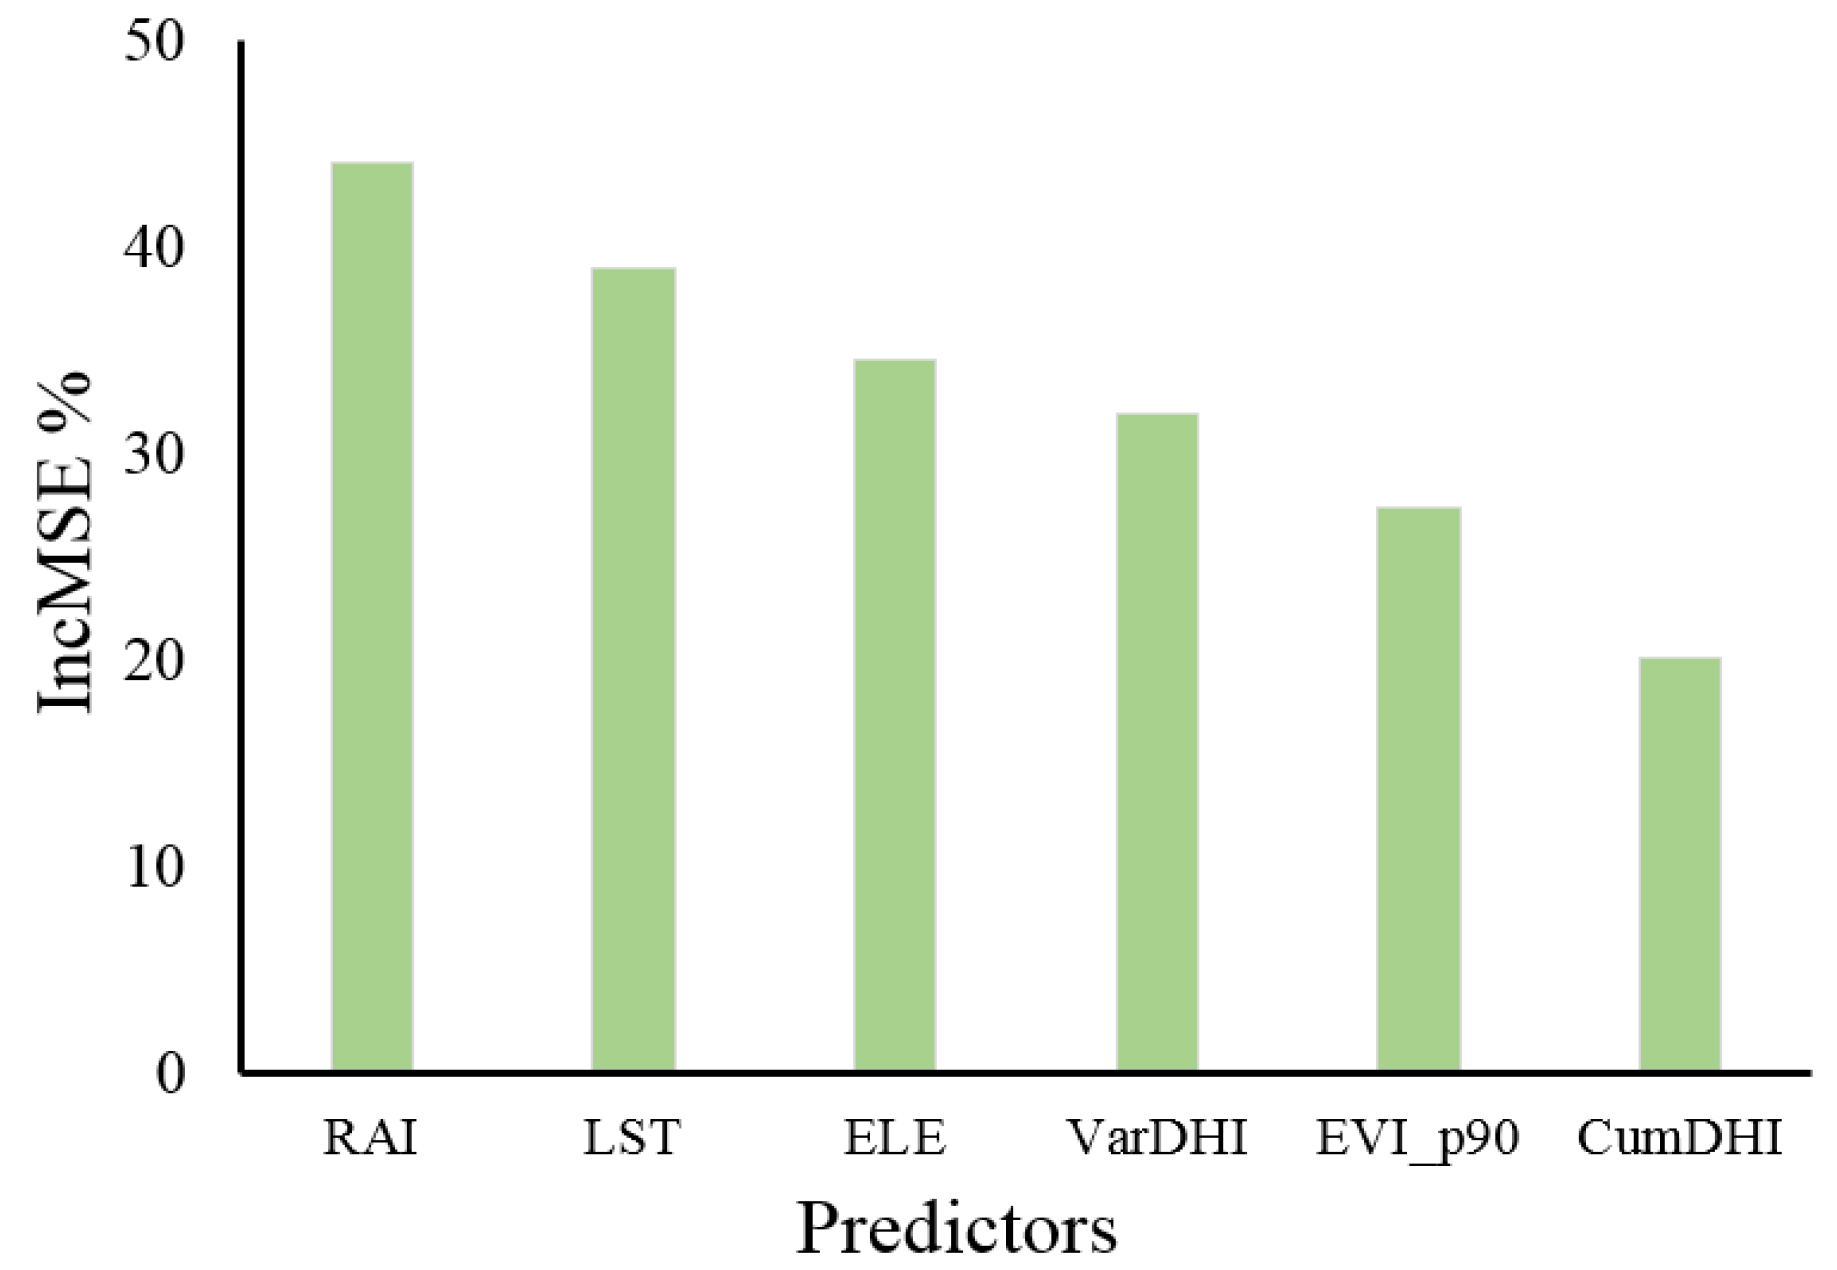
Our random forest model captured SOC variability across a broad latitudinal extent and the seven categories of forest types well (R2 = 0.60, RMSE = 22.1%) (Figure 2). Scatterplots showed a good distribution of the plots, with some over-estimation of the lower SOC values and under-estimation in the higher SOC values. Among our predictors, the most important ones were climatic variables (mean annual rainfall and temperature; IncMSE = 44.08 and 39.00, respectively), followed by topography (elevation; IncMSE = 34.55), and remotely sensed vegetation productivity measures (VarDHI_90 percentile EVI, and CumDHI) (Figure 3).
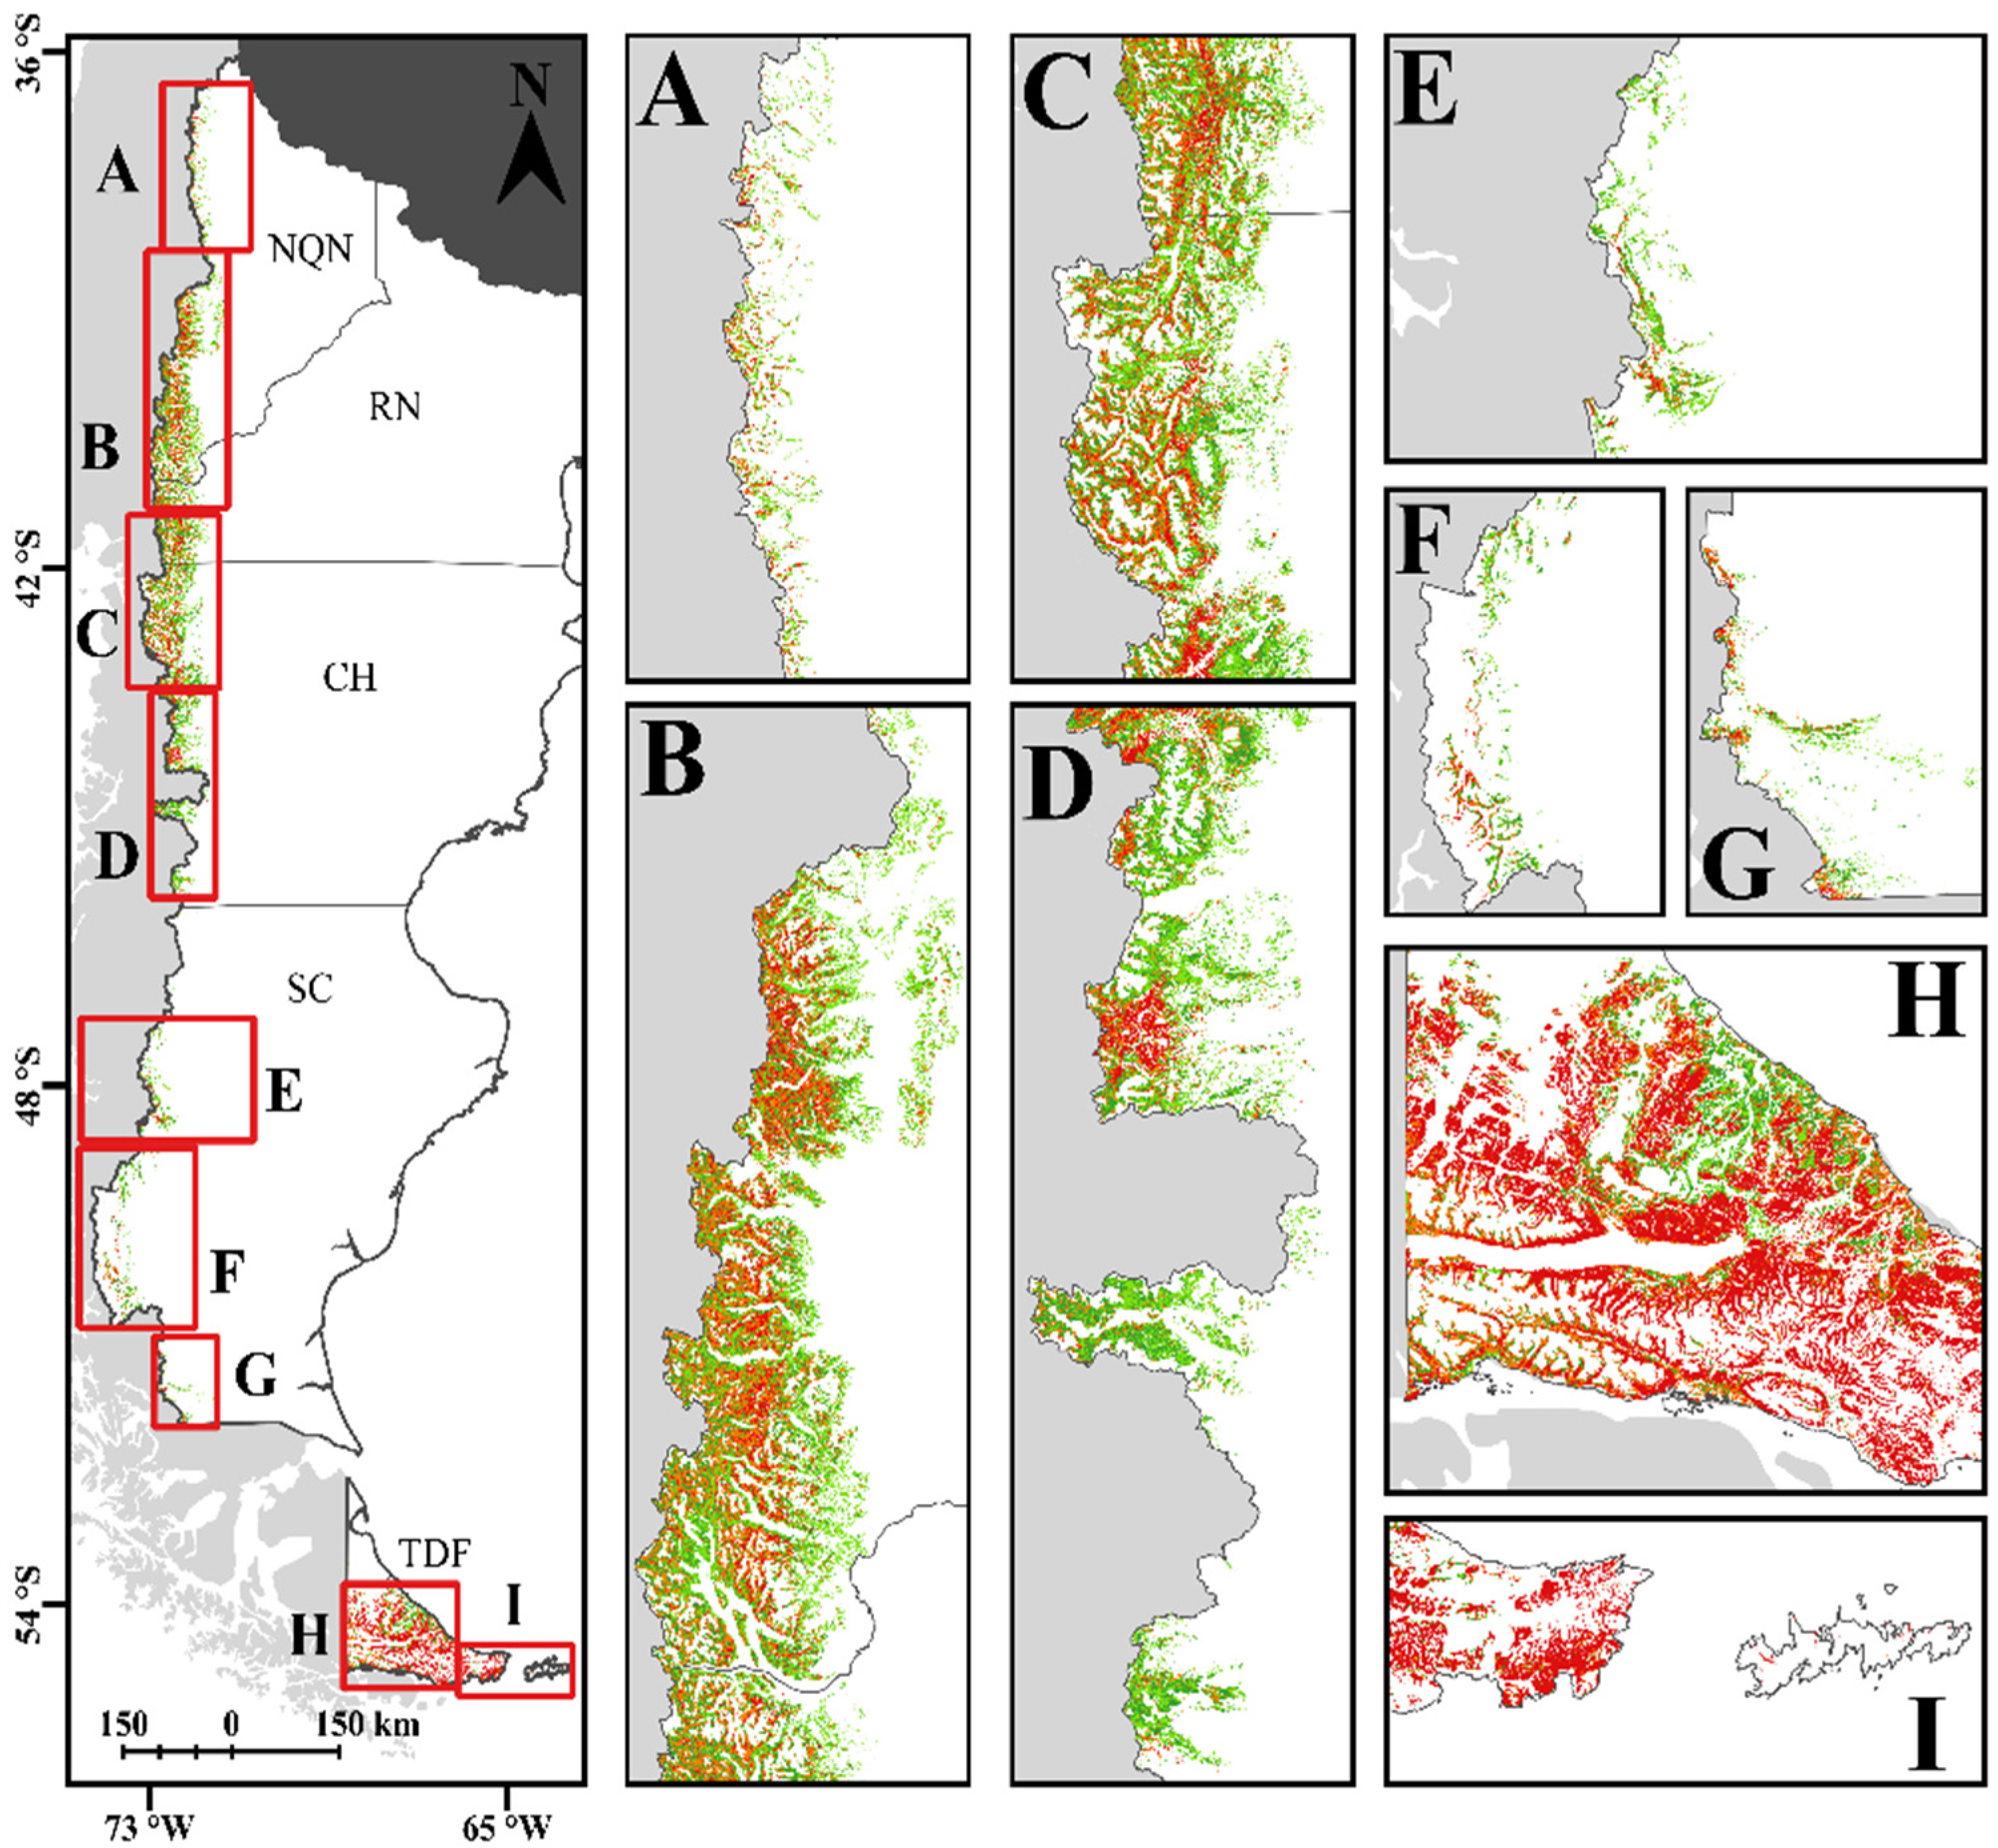
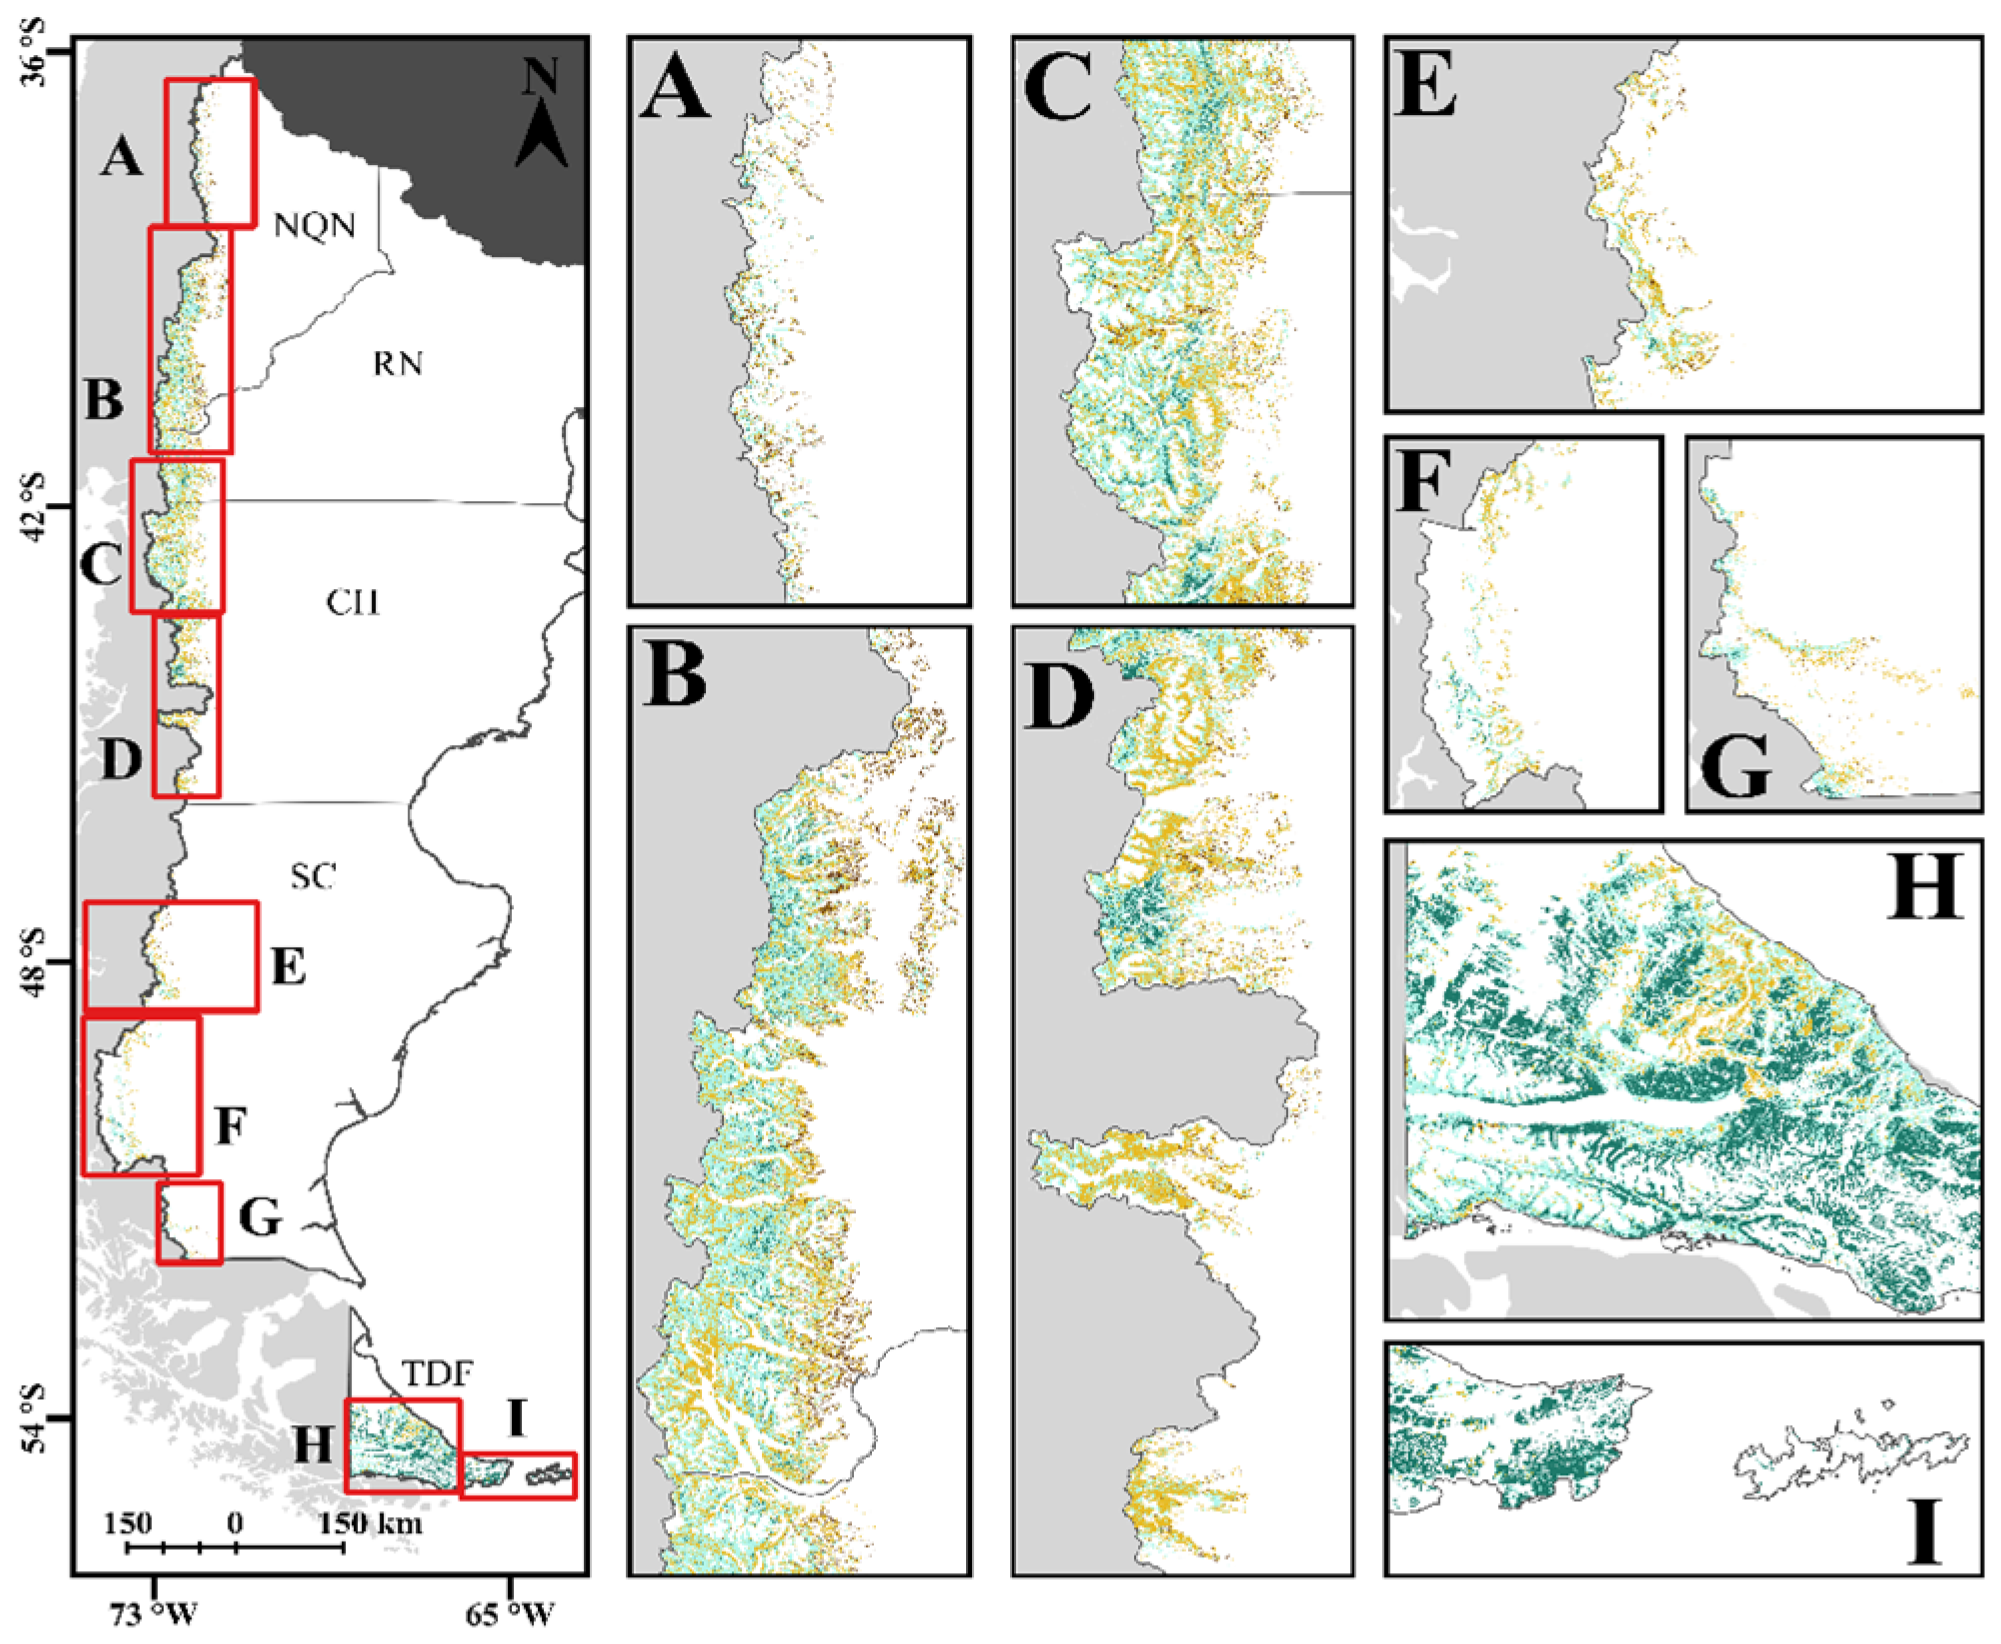
The SOC map across Patagonian forests highlighted the power of combining vegetation productivity measures and LST from Landsat-8 together with climate and topography variables (e.g., rainfall, and elevation) to capture the broad-scale patterns at high spatial resolution (Figure 4). Our map of SOC shows strong spatial patterns, with highest SOC values in the valleys of the Andes and in southern Tierra del Fuego, ranging from 53.5 to 277.8 ton C ha−1. An auto-validation analysis showed an average error of 1.2 ton C ha−1, which represents 0.8% of the mean value estimation for all regions. The accuracy varied among provinces (TDF > CHU > RN > NQN > SC) and forest types (NP > NA > EVE > N-MIX > CON > N-EVE > MIX).
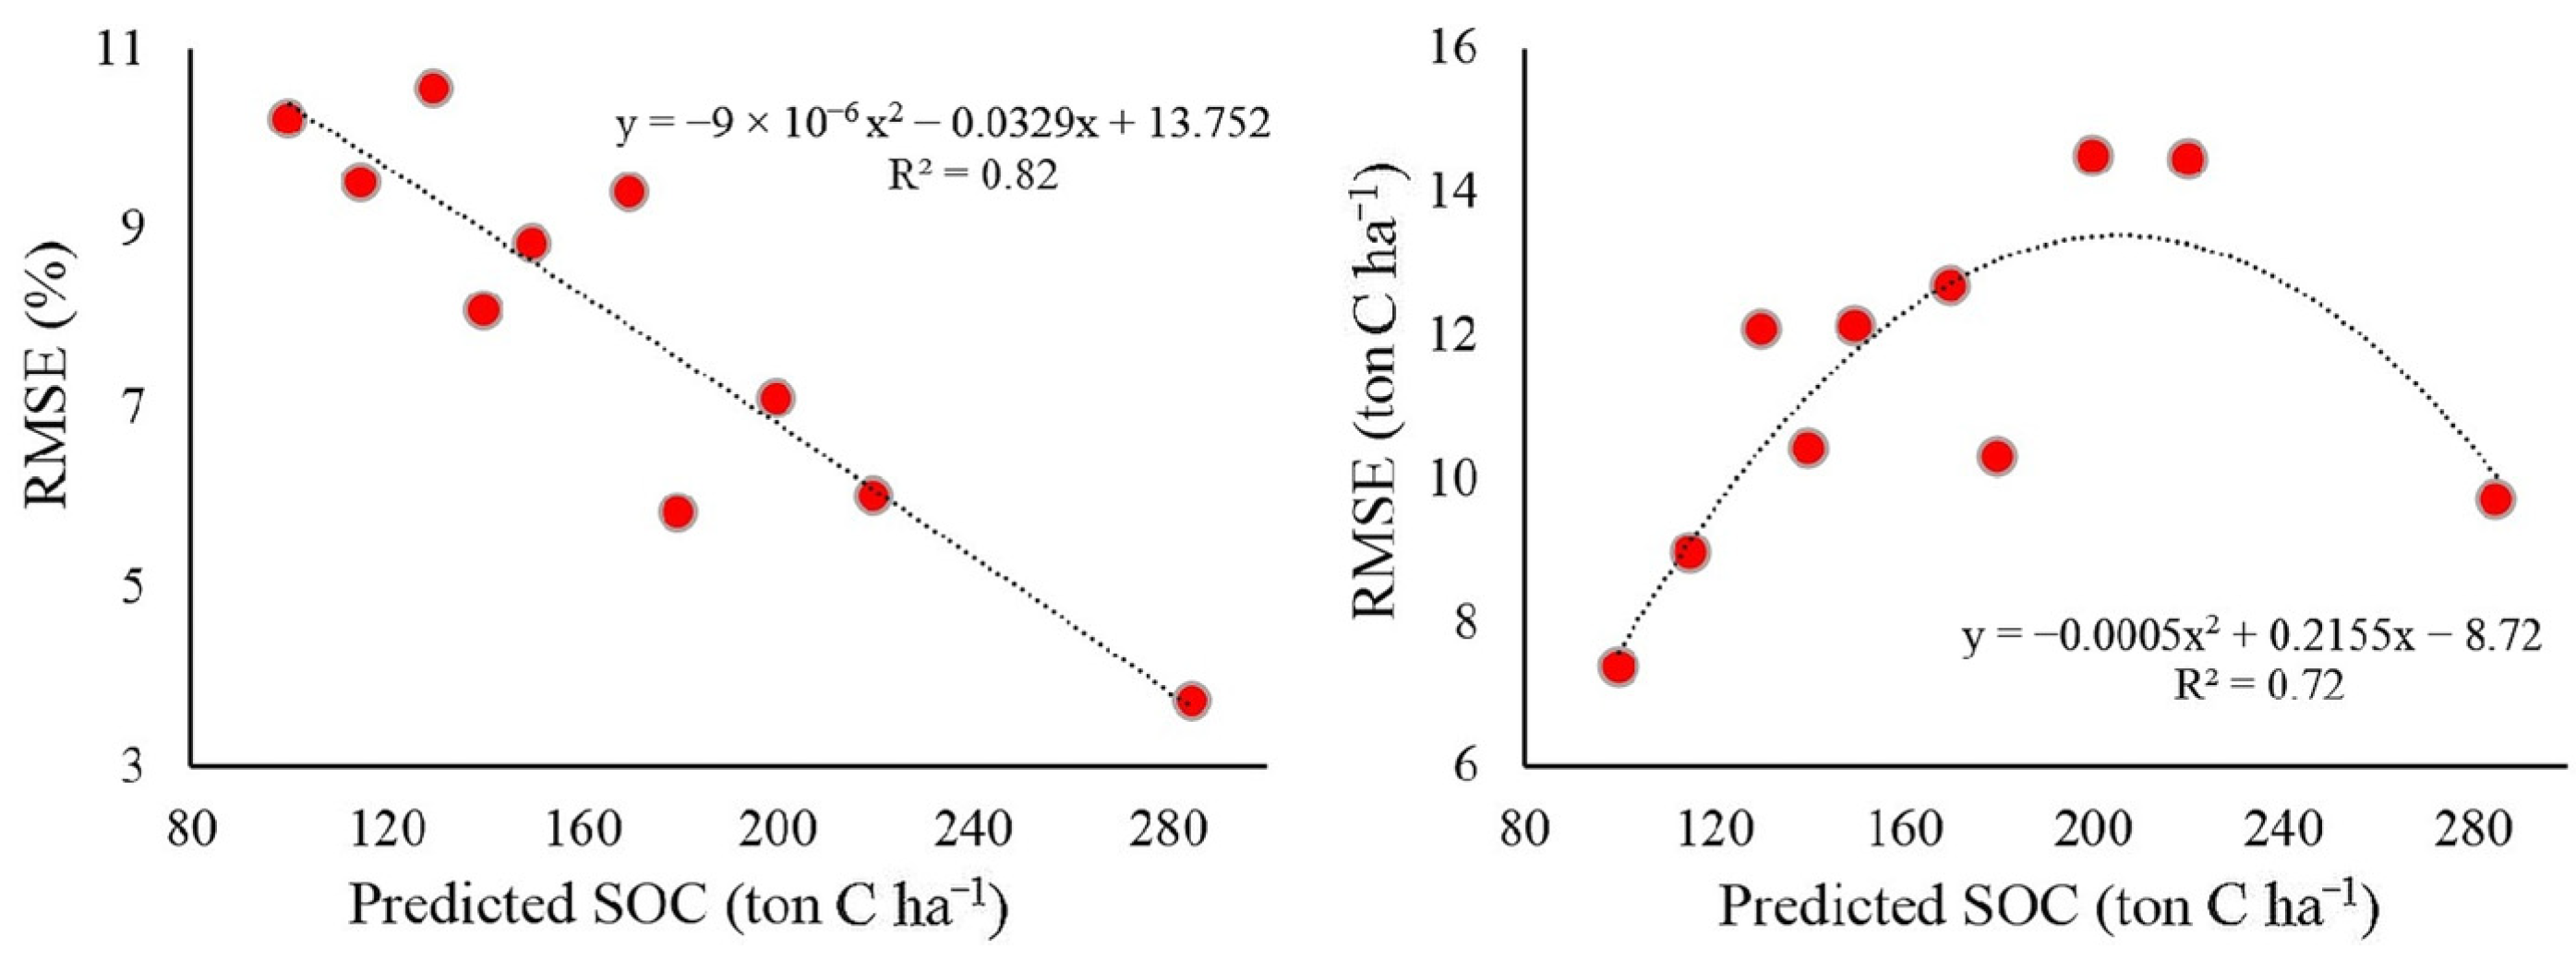
Uncertainty, indicated by both relative RMSE (%) and absolute RMSE (ton C ha−1), was well captured by our regression models (R2 = 0.82 and 0.71, respectively) (Figure 5). In general, RMSE (%) decreased as SOC increased (reaching a maximum of 12%), while absolute RMSE (ton C ha−1) increased as SOC increased (reaching a maximum of 15 ton C ha−1) (Figure 6 and Figure 7).

3.2. Soil Organic Carbon Stocks in Patagonian Forests

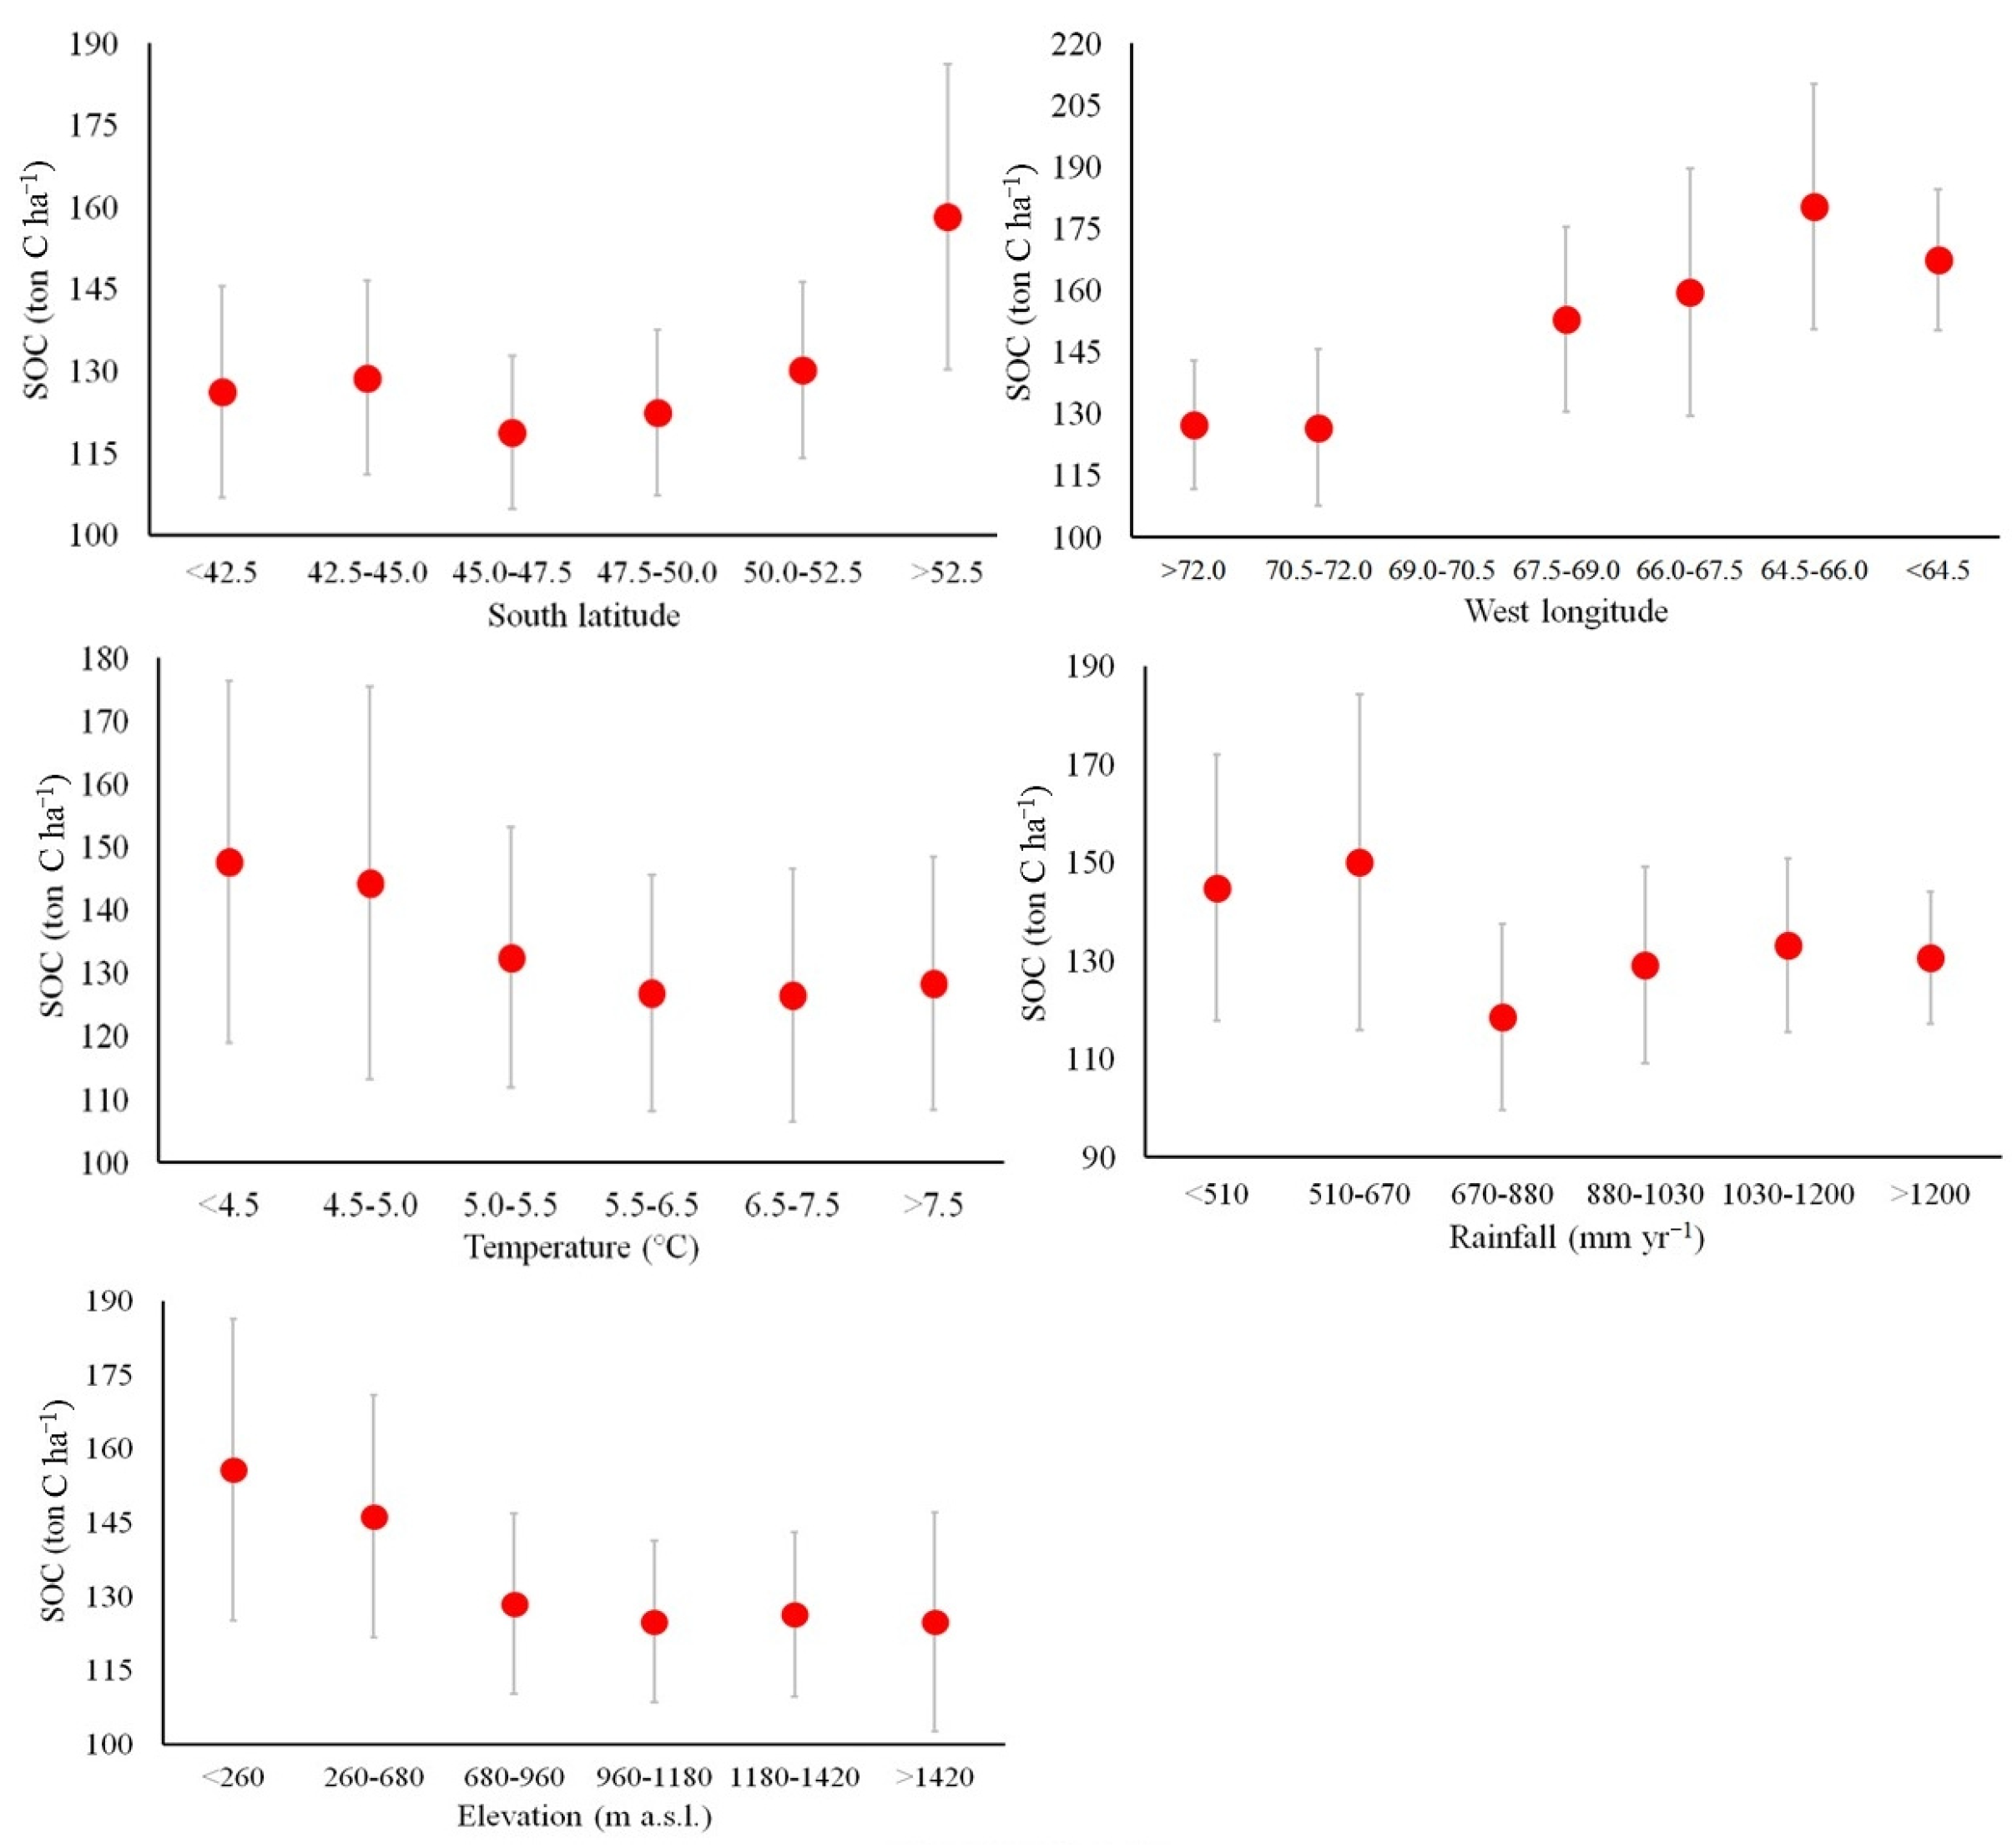
The total SOC in the top 30 cm of soil across the native forests of Patagonia was 404.2 million ton C for the first 30 cm of soil (Table 3). The mean value of SOC across all Patagonian forests was 134.4 ± 25.2 (SD) ton C ha−1, and ranged from 125.4 ± 16.1 ton C ha−1 in SC province to 158.1 ± 27.9 ton C ha−1 in TDF. SOC content varied considerably among forest types, ranging from 116.4 ± 22.9 to 145.5 ± 32.0 ton C ha−1 in coniferous forest and pure evergreen Nothofagus forest, respectively (Figure A3). Mean annual temperature and mean annual precipitation, two of the most important variables in models, were also strongly affected by latitude and longitude, respectively, generating different SOC across the landscape, e.g., SOC increases from N to S, and from E to W (Figure A4). The forest types that contributed the most to the SOC stocks of Patagonia were NP (54%) followed by NA (20%) and N-EVE (14%) (Table 3). Regional climate also affected SOC in the different provinces, where southern provinces with more rainfall had higher contents (e.g., TDF with 158.1 ton C ha−1). Accordingly, across Patagonia, TDF contributed 29% of SOC followed by CHU > NQN > RN > SC. With regard to protection status, 30% of the SOC stocks were in the highest protection class of the OTBN (National Law 26,331/07), and 35% of the SOC stocks were within protected areas (National Parks or Provincial Reserves). Detailed classification of the different categorizations is presented in Table A1, Table A2 and Table A3.
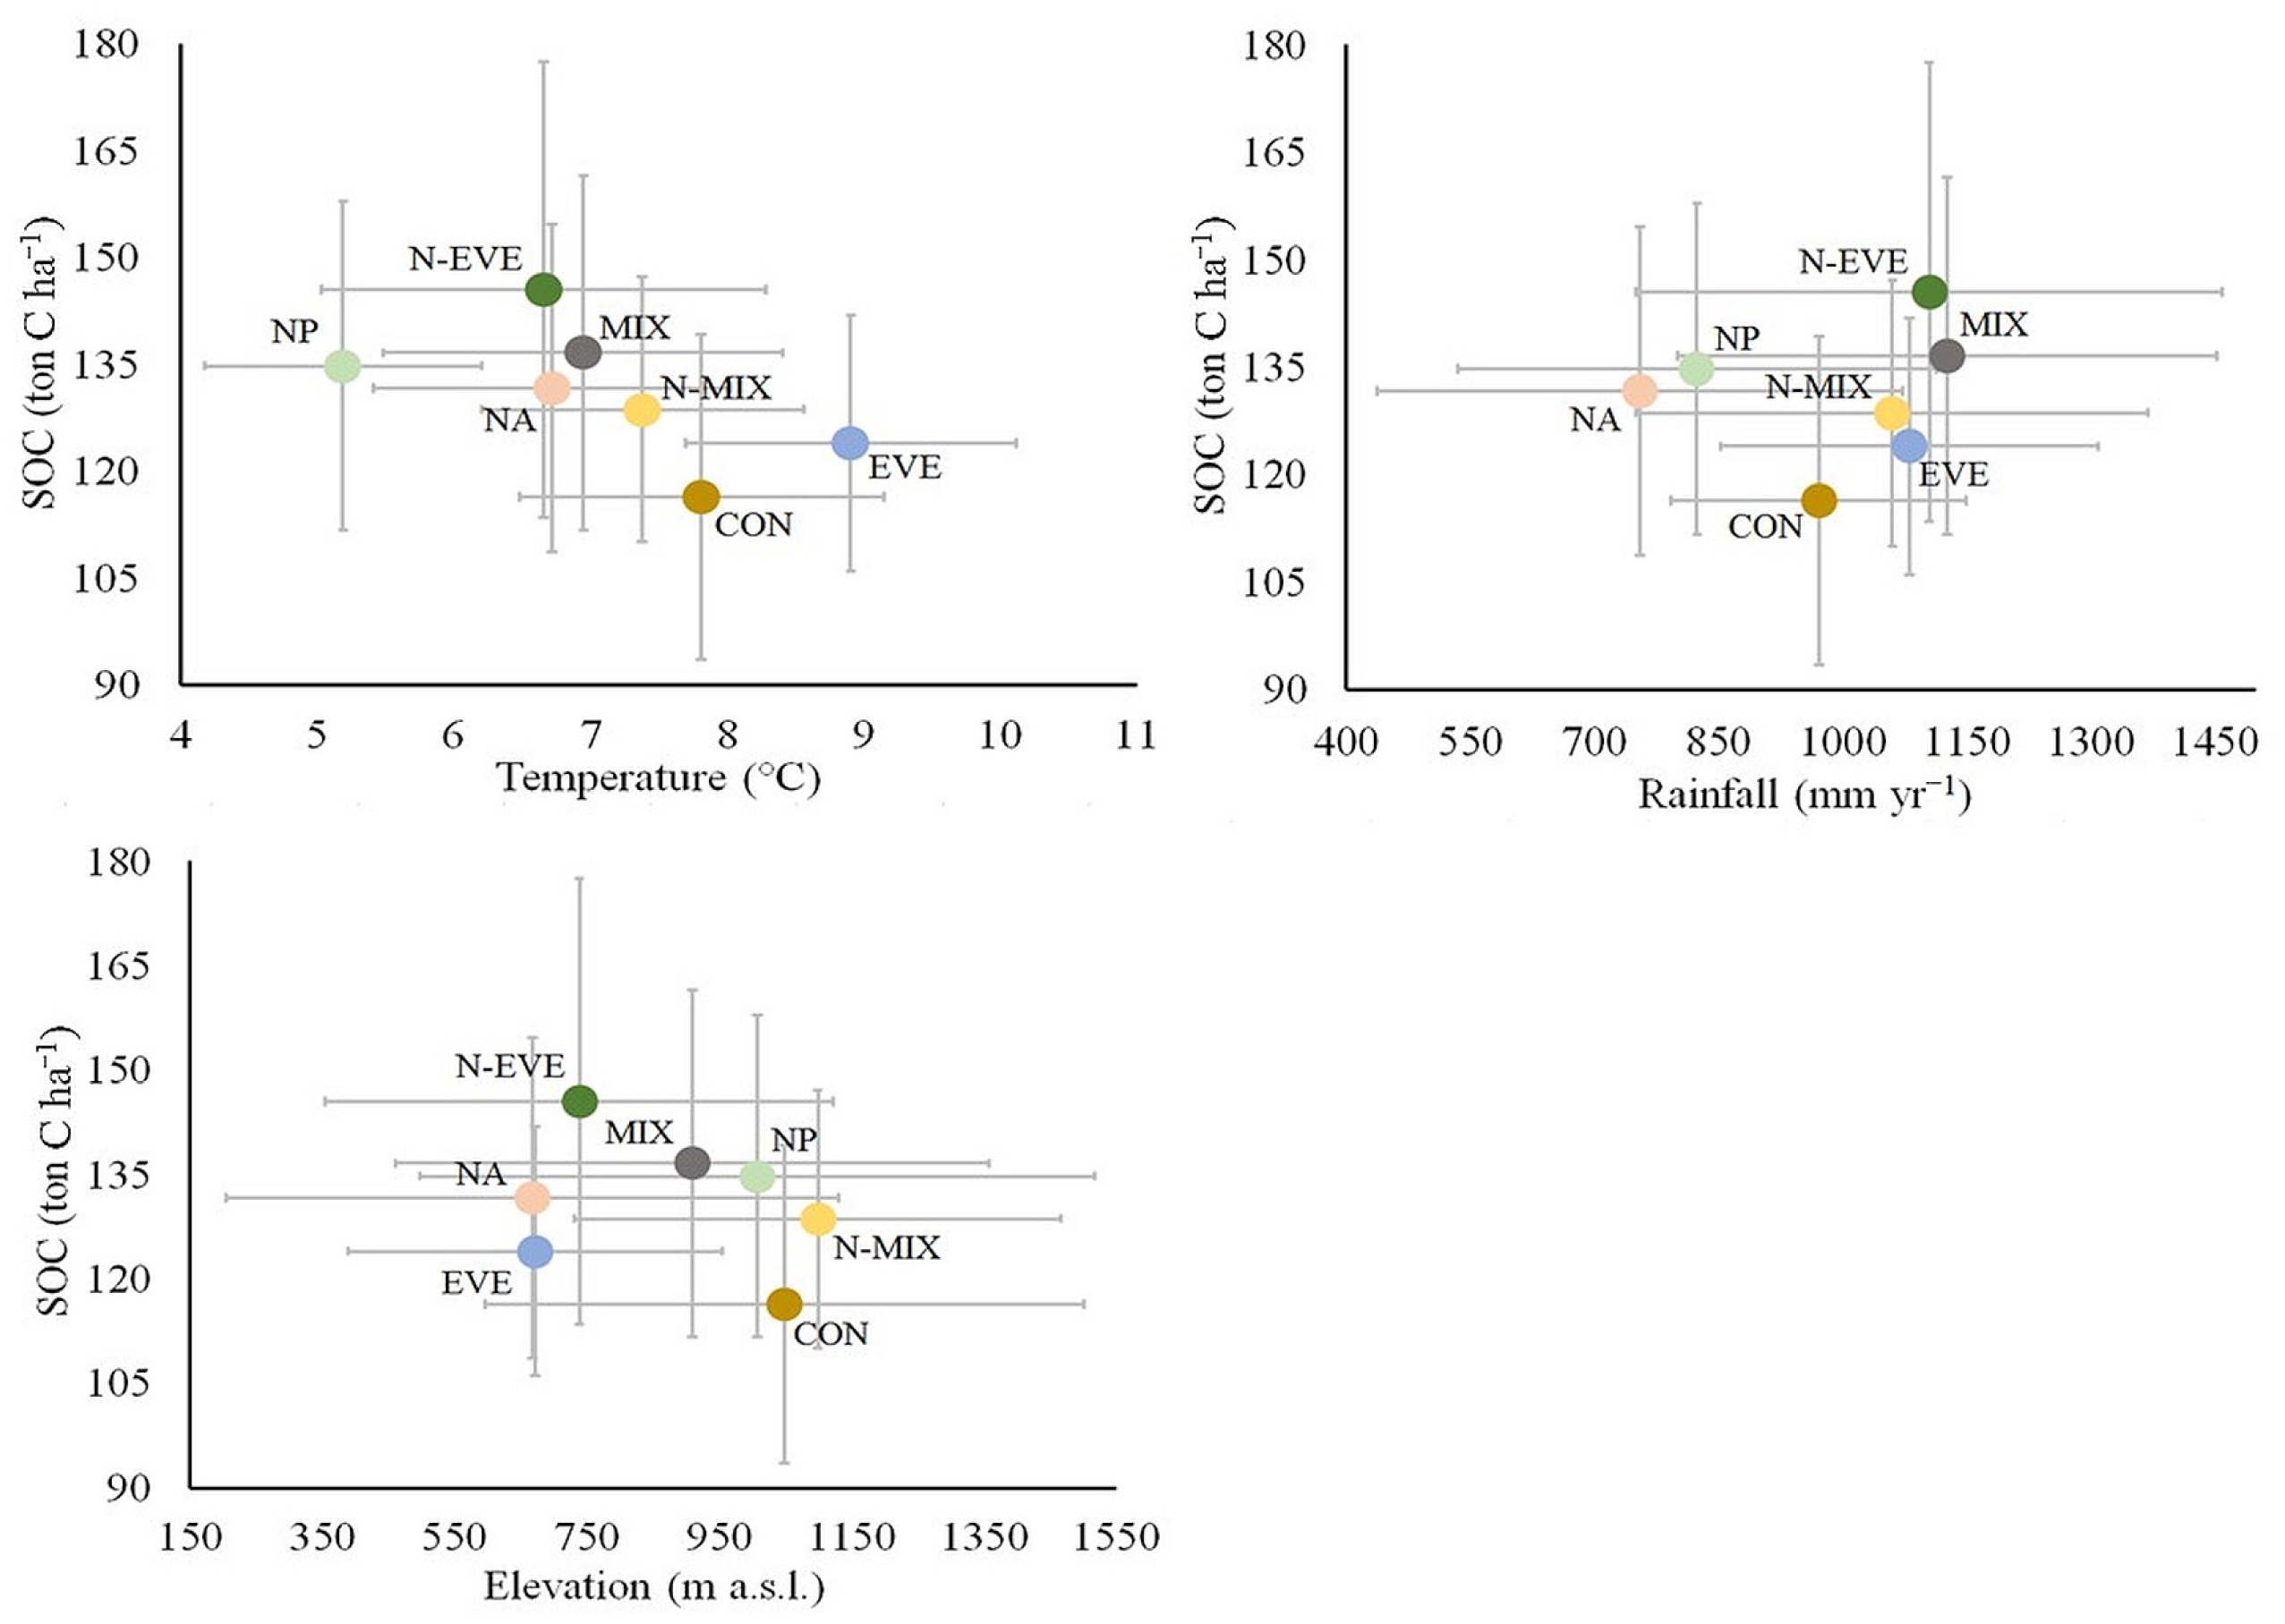
SOC content of the different forest types (Figure A1) was more strongly related to mean annual temperature and elevation than to rainfall. Forest types growing at lower temperatures (e.g., NP, N-EVE, MIX, NA) had higher SOC contents than those growing in warmer areas. Forest types growing at higher rainfall (e.g., N-EVE, MIX) had higher SOC content than those growing in drier areas, as well as those forest types that occurred at higher elevation. For example, pure Nothofagus stands (e.g., N-EVE) are at higher elevation and their soils have higher carbon content than conifers (e.g., CON), which grow at lower elevation. These trends were related to the habitat areas of the different forest types (Figure A2), which greatly varied across the landscape (latitude, longitude, rainfall, temperature and elevation).

4. Discussion

4.1. Advantages and Limitations of the Modeling

The combination of climate, topography, and vegetation productivity predicted SOC well in multiple forest types in our model. The optimal subset of predictor variables included two climate variables (e.g., temperature and rainfall) which are influenced by regional relief (e.g., elevation), plus vegetation indices based on DHIs. The climate predictors are not direct observation data, and were extracted from WorldClim [52]. These data can lead to possible errors in the SOC mapping, due to their being generated by the modeling of Worldwide databases. Additionally, WorldClim variables have been successfully used in many models in Patagonia [16,19,20,26,27,57]. Patagonian forests occur along a narrow strip from the base and to high slopes of Andean mountains (north to south), and across the Tierra del Fuego archipelago [50]. Temperatures are greatly influenced by latitude and elevation, generating strong gradients that limit forest type ranging, e.g., from dry forests bordering steppe grasslands up to high-elevation forests at the tree line, where the altitude strongly varied with latitude [19,51]. Topography also controls precipitation across Patagonia, with most rain falling on the Chilean side, due to predominant westerly winds [65]. Topography also has strong effects in Tierra del Fuego, where it determines climate gradients, and consequently vegetation patterns [66]. Furthermore, climate is the main factor influencing forest development and decomposition processes in Patagonia, both of which are directly linked to carbon stocks in these ecosystems [19,67]. SOC is also directly related to above-ground vegetation biomass [35,68,69,70], making it an important predictive variable in SOC models [19,71]. We found that the influence of the different forest types on SOC is due to metrics describing annual vegetative cycles [26,47], which is why vegetation productivity was an important variable in our model. SOC model presented accurate broad-scale estimates, but had some limitations (e.g., greater errors of estimation) in some areas because sampling was not fully representative for all forest types and provinces. These unbalanced samplings can generate over- and under-estimations in the outputs [72]. These limitations must be considered when interpreting our model results. For this reason, we have recommended that managers should also use the maps of uncertainty (Figure 6 and Figure 7) when making decisions [73].

4.2. Soil Organic Carbon Stocks in Patagonian Forests

The geospatial datasets that we developed are useful for general and specific applications for each forest type and province. For example, regional estimations of SOC stocks complement the stand level estimates based on forest inventory data. The maps of SOC can be used to identify areas that can benefit from management, and that are less resilient to climate change [35,74,75], and are therefore in need for protection. SOC maps complement forest inventory data, which have historically been used to assess the productivity of forests prior to harvesting, and are now also used to monitor biodiversity and ecosystem services [4,51,76]. National-scale maps of both forest structure attributes and SOC can be useful in supporting policy decisions [12,27].
By analyzing the relationships among climatic, topographic and vegetation variables according to the SOC stocks in Patagonia, we were able to do both, the SOC map and the identification of the most important variables affecting its patterns. Some authors who have modeled SOC have suggested that high-latitude forests may become a carbon source due to increased decomposition of soil organic matter resulting from rising temperature [23,77]. Rainfall also influences SOC greatly, as has been demonstrated by other authors [78], often being more important than temperature [79,80], which matches our findings. The strong relationship between rainfall and SOC stocks is likely due to higher vegetation productivity when water availability is higher in soils. We also found that the DHIs were positively related to SOC in the different forest types, and can influence other ecological processes (e.g., decomposition rates) that can contribute to C soils [67,81].
The mean value of SOC in Patagonian forests was 134.4 ton C ha−1 (0–30 cm) which is comparable to other forest ecosystems. For example, Domke et al. [82] provide SOC estimates (ton C ha−1 0–20 cm) for different forest ecosystems across the US and compare them with NRCS Rapid Assessment of Soil Carbon [83]: (i) north-western forests with 80.4 vs. 188.7; (ii) Rocky Mountain forests with 72.2 vs. 90.6; (iii) northern Lake States forests with 72.0 vs. 233.1; (iv) East and Central forests with 62.4 vs. 93.3; (v) South Atlantic and Gulf forests with 40.9 vs. 78.2; (vi) north-eastern forests with 100.0 vs. 256.7; and (vii) Atlantic and Gulf Coast Lowland forests with 68.3 vs. 213.3. Cao et al. [71] reported similar values as those informed by Domke et al. [82], and Hoover et al. [84] informed for the northern temperate forests in the US.
In our results, evergreen forests had higher values than deciduous (e.g., evergreen Nothofagus had 145.5 ton C ha−1 compared to 131.7 ton C ha−1 for deciduous N. antarctica and 134.8 ton C ha−1 for deciduous N. pumilio). Similarly, Toro-Manríquez et al. [85] reported for Tierra del Fuego an increased range of SOC from deciduous pure N. pumilio (101.3 ton C ha−1) to mixed (101.5 ton C ha−1) to pure evergreen N. betuloides forests (103.8 ton C ha−1). The same pattern was found by Peri et al. [18,19] in southern Patagonia (pure N. pumilio with 93.7 ton C ha−1 vs. pure N. antarctica with 120.9 ton C ha−1 vs. pure evergreen Nothofagus with 125.2 ton C ha−1), and by Laclau et al. [24] in northern Patagonia (Nothofagus forests with 88.5 ton C ha−1 vs. mixed conifer forests with 102.9 ton C ha−1). Cao et al. [71] also reported that the highest predicted SOC occurred in three areas, all of which are mostly dominated by conifers. Similarly, we found that forests in areas with abundant precipitation presented higher SOC (124.0 to 145.5 ton C ha−1) than dry forests close to the grassland steppes (116.4 ton C ha−1 in Austrocedrus chilensis forests). Matching our findings, Satti et al. [86] reported differences in SOC for different forest types across landscape gradients, e.g., pure and mixed conifer forests had 101.1 ton C ha−1, evergreen broadleaved forests had 109.1 ton C ha−1, evergreen Nothofagus forests had 134.5 ton C ha−1, and deciduous Nothofagus forests had 137.2 ton C ha−1. Finally, there are other SOC estimates that match those that we obtained from our model, e.g., pure and mixed conifer forests in northern Patagonia with 85.9 ton C ha−1 [87], pure and mixed Nothofagus forests with 98.38 ton C ha−1 [88], and pure N. pumilio forests with 102.5 ton C ha−1 [89].

4.3. Recommendations for Monitoring and Policy Makers

SOC content has not been addressed in current discussions about the monitoring and assessment of global carbon stocks (as in REDD+) [77,90]. The main reason for this is not that SOC is not important, but rather the lack of effective and affordable methods for large-scale C assessment and monitoring. There are several initiatives that have proposed standardized measurement protocols for SOC estimation across different biomes [77,83,91]. Modeling SOC based on geo-referenced sample data has been used to accurately estimate above-ground biomass in many types of forests and woodlands [70,71,82,92], including in Patagonia [19]. Our contribution here demonstrates that it is possible to obtain reliable SOC predictions for large areas using relatively few freely available predictors, highlighting the strength of our method. To date, few studies have measured SOC over time in forests and woodlands, as well as changes in soil properties [75]. Thus, we propose that in the future, assessment of SOC stocks and properties should be included in national forest inventory surveys, so that changes over time can be detected. We recognize that the effort required for detailed sampling is substantial, and may pose practical limitations. However, the availability of these databases allows modeling SOC stocks and there is a growing understanding of how human actions may affect them. Only with these tools, will it be feasible to make recommendations to improve land use plans at different administrative levels (provinces to region to country), and thereby contribute to achieving the international agreements that has Argentina signed. Furthermore, the SOC map can contribute to land use planning in Patagonia, e.g., by estimating the amount of C that can be lost due to the lack of protection (green category in the OTBN, or forest in private lands under management) (see Table 3). Last but not least, empirically estimated C stocks can be linked to payment for achievements in C emission and sequestration under the United Nations Framework Convention on Climate Change (UNFCCC).

5. Conclusions

We successfully modeled and mapped soil organic carbon stocks (SOC) in the top 30 cm in native forests of Patagonia (Argentina) at 30 m resolution. The most important variables predicting SOC were annual temperature and rainfall, elevation, and vegetation productivity measures derived from Landsat-8 satellite data. Our map of SOC stock in native forest types in Patagonia greatly improves the information on carbon stocks, and can support many applications, including: (i) use of SOC stocks as predictors for assessment design and modeling in different research areas; (ii) evaluation of the habitat quality for species associated with soils, and identification of priority areas for conservation; (iii) monitoring SOC over time to achieve sustainable forest management; and (iv) zoning of native forests in multiple uses according to different management and conservation criteria. These applications can strengthen the national forest monitoring system, support compliance with national and provincial regulation, and provide information to achieve the international agreements signed by Argentina. Understanding the causes of variation in SOC stock across Patagonia is a first step in assessing the sustainability of land management and conservation at a regional scale. We developed an approach for obtaining accurate SOC maps at 30 m spatial resolution across large areas with highly heterogeneous and diverse forest types, allowing us to characterize SOC in the different zones of current forest land use plans (e.g., OTBN, National Law 26,331/07) and protected area network.

Author Contributions

Conceptualization, G.M.P. and P.L.P.; methodology, G.M.P., E.M.O.S., M.V.L. and P.L.P.; software, E.M.O.S., V.C.R. and A.M.P.; validation, E.M.O.S. and J.M.C.; formal analysis, M.-C.A.A., E.M.O.S., V.C.R. and A.M.P.; investigation, M.V.L. and J.M.C.; resources, G.M.P., A.V.M., L.L.M., M.G.-P. and J.E.C.; data curation, M.-C.A.A. and J.M.C.; writing—original draft preparation, G.M.P. and P.L.P.; writing-review and editing, E.M.O.S., A.V.M., L.L.M., M.G.-P., J.E.C., J.M.C., V.C.R. and A.M.P.; visualization, E.M.O.S., V.C.R. and A.M.P.; supervision and project administration, G.M.P. and M.V.L.; funding acquisition, P.L.P. All authors have read and agreed to the published version of the manuscript.

Funding

This research was conducted with the financial support of the following projects: (i) Proyecto de apoyo para la Preparación de REDD+ en el marco del Fondo Cooperativo de Preparación para el Carbono de los Bosques (FCPF TF019086) Ministerio de Ambiente y Desarrollo Sostenible de la Nación Argentina (2021–2022), (ii) Proyectos de Desarrollo Tecnológico y Social (PDTS-0398) MINCyT (Argentina) (2020–2023), (iii) Proyectos de Investigación Plurianual (PIP 2021-2023 GI) CONICET (Argentina) (2022–2025), and (iv) Proyectos Interinstitucionales en Temas Estratégicos (PITES-03) MINCyT (Argentina) (2022–2024).

Institutional Review Board Statement

Not applicable.

Informed Consent Statement

Not applicable.

Data Availability Statement

For the data employed in the modeling, the authors thank: Dirección Nacional de Bosques of Argentina, the Global Forest Change (glad.earthengine.app/view/global-forest-change), Google Earth Engine, Landsat-8 OLI/TIRS products. Availability of data and material: At CADIC-CONICET (Argentina) repository. This supporting information can be requested from the authors: raster-data of the outputs and raw-data used for modeling.

Acknowledgments

We want to give thanks for the support of Pablo Laclau, Carlos Buduba and many other researchers who contributed to the database. We also want to thank Santiago Favoretti, Carina Argañaraz and Yamina Micaela Rosas for the support during sampling and laboratory analyses.

Conflicts of Interest

The authors declare no conflict of interest. The funders had no role in the design of the study; in the collection, analyses, or interpretation of data; in the writing of the manuscript, or in the decision to publish the results.

Appendix A

Table A1. Forest cover (FC, km2), mean soil organic carbon content (SOC, ton C ha−1) and standard deviation (SD, ton C ha−1) to calculate total C stock (million ton C) classified by provinces (TDF = Tierra del Fuego, SC = Santa Cruz, CHU = Chubut, RN = Río Negro, NQN = Neuquén) and forest types (see Table 1).
TypeFC
(km2)
SOC
(ton C ha−1)
SD
(ton C ha−1)
Total SOC
(million ton C)
TDFNP4054.0158.522.764.2
NA2007.3141.122.328.3
N-MIX0.0----0.0
N-EVE1013.7186.329.918.9
CON0.0----0.0
EVE0.0----0.0
MIX217.4175.431.73.8
SCNP2104.4125.215.726.3
NA260.2122.816.43.2
N-MIX30.2123.715.30.4
N-EVE0.0----0.0
CON0.1139.820.20.0
EVE0.0----0.0
MIX75.0142.017.51.1
CHUNP4232.4124.513.752.7
NA2239.1130.221.629.1
N-MIX14.4118.718.70.2
N-EVE1013.4134.616.813.6
CON521.7125.217.86.5
EVE26.3127.218.50.3
MIX344.0134.016.14.6
RNNP1835.2128.615.423.6
NA747.7129.419.69.7
N-MIX7.2127.520.70.1
N-EVE546.4128.813.67.0
CON318.4126.717.44.0
EVE9.6124.018.20.1
MIX275.9127.413.93.5
NQNNP4001.2129.619.751.9
NA1023.8121.222.712.4
N-MIX253.6129.918.23.3
N-EVE1198.2126.913.315.2
CON956.2108.723.510.4
EVE15.3118.714.50.2
MIX729.1128.717.79.4
Table A2. Forest cover (FC, km2), mean soil organic carbon content (SOC, ton C ha−1) and standard deviation (SD, ton C ha−1) to calculate total C stock (million ton C) classified by status protection according national law 26.331/07 (OTBN) and forest types (see Table 1).
TypeFC
(km2)
SOC
(ton C ha−1)
SD
(ton C ha−1)
Total SOC
(million ton C)
RedNP6070.4135.322.082.1
NA665.0129.020.68.6
N-MIX28.2124.523.30.4
N-EVE1259.5163.637.020.6
CON260.0120.821.13.1
EVE1.2123.116.20.0
MIX507.0145.528.87.4
YellowNP4843.5138.926.467.3
NA3687.0134.823.249.7
N-MIX47.0124.118.70.6
N-EVE593.2146.333.68.7
CON717.8117.522.58.4
EVE8.0122.115.60.1
MIX304.1136.627.44.2
GreenNP99.2134.621.51.3
NA219.1132.618.32.9
N-MIX0.6134.316.80.0
N-EVE36.4126.415.50.5
CON102.3128.717.81.3
EVE8.9128.017.10.1
MIX23.3130.220.50.3
UnclassifiedNP5214.2130.420.168.0
NA1707.0125.822.721.5
N-MIX229.6130.117.63.0
N-EVE1882.7133.520.225.1
CON716.4112.023.48.0
EVE33.1123.418.60.4
MIX806.9131.319.210.6
Table A3. Forest cover (FC, km2), mean soil organic carbon content (SOC, ton C ha−1) and standard deviation (SD, ton C ha−1) to calculate total C stock (million ton C) classified by reserve networks (NAT = National Parks, PRO = provincial reserves, UNP = unprotected) and forest types (see Table 1).
TypeFC
(km2)
SOC
(ton C ha−1)
SD
(ton C ha−1)
Total SOC
(million ton C)
NATNP5466.7132.215.672.3
NA991.1132.517.713.1
N-MIX192.8133.613.72.6
N-EVE2020.7131.115.426.5
CON421.0118.420.45.0
EVE22.3125.618.20.3
MIX871.9132.516.111.5
PRONP381.3133.717.35.1
NA118.2129.018.51.5
N-MIX27.3121.327.90.3
N-EVE172.8129.014.42.2
CON123.3117.924.11.5
EVE0.2125.19.50.0
MIX66.1129.516.10.9
UNPNP10,379.3136.226.2141.4
NA5168.8131.624.068.0
N-MIX85.4120.020.21.0
N-EVE1578.3165.837.626.2
CON1252.2115.623.514.5
EVE28.7122.717.70.4
MIX703.5142.532.310.0
Figure A1. Soil organic carbon content (SOC) of different Patagonian forest types in Argentina (see Table 1), classified by mean annual temperature (°C), mean rainfall (mm yr−1) and elevation (m a.s.l.). Bars indicate the standard deviation of each axis.
Remotesensing 14 05702 g0a1
Figure A2. Characterization of Patagonian forest types in Argentina (see Table 1) classified by degrees of latitude vs. longitude, mean annual temperature (°C) vs. mean rainfall (mm yr−1), and elevation occurrence (m a.s.l.). Bars indicate the standard deviation of each axis.
Remotesensing 14 05702 g0a2
Figure A3. Soil organic carbon content (SOC) of the different Patagonian forest types in Argentina (see Table 1). The bars indicate the standard deviation.
Remotesensing 14 05702 g0a3
Figure A4. Soil organic carbon content (SOC) of the Patagonian forests in Argentina, classified by degrees of latitude and longitude, mean annual temperature (°C), mean rainfall (mm yr−1) and elevation (m a.s.l.). Bars indicate standard deviation.
Remotesensing 14 05702 g0a4

References

  1. Martínez Pastur, G.; Schlichter, T.; Matteucci, S.D.; Gowda, J.; Huertas Herrera, A.; Toro Manríquez, M.; Lencinas, M.V.; Cellini, J.M.; Peri, P.L. Synergies and trade-offs of national conservation policy and agro-forestry management over forest loss in Argentina during the last decade. In Latin America in Times of Global Environmental Change; Lorenzo, C., Ed.; The Latin American Studies Book Series; Springer: Cham, Switzerland, 2020; pp. 135–155. [Google Scholar]
  2. Ministerio de Ambiente y Desarrollo Sostenible de la Nación. Segundo Inventario Nacional de Bosques Nativos; Ministerio de Ambiente y Desarrollo Sostenible de la Nación: Buenos Aires, Argentina, 2020; 724p.
  3. Angelsen, A.; Martius, C.; De Sy, V.; Duchelle, A.E.; Larson, A.M.; Pham, T.T. Transforming REDD+: Lessons and New Directions; CIFOR: Bogor, Indonesia, 2018; 303p. [Google Scholar]
  4. Luque, S.; Martínez Pastur, G.; Echeverría, C.; Pacha, M.J. Overview of biodiversity loss in South America: A landscape perspective for sustainable forest management and conservation in temperate forests. In Landscape Ecology and Forest Management: Challenges and Solutions in a Changing Globe; Li, C., Lafortezza, R., Chen, J., Eds.; HEP-Springer: Amsterdam, The Netherlands, 2010; pp. 352–379. [Google Scholar]
  5. Angelstam, P.; Albulescu, C.; Andrianambinina, O.; Aszalós, R.; Borovichev, E.; Cano Cardona, W.; Dobrynin, D.; Fedoriak, M.; Firm, D.; Hunter, M.; et al. Frontiers of protected areas versus forest exploitation: Assessing habitat network functionality in 16 case study regions globally. AMBIO 2021, 50, 2286–2310. [Google Scholar] [CrossRef] [PubMed]
  6. Ministerio de Ambiente y Desarrollo Sustentable (MAyDS). Informe de Estado de Implementación 2010–2016 de la Ley N°26.331 de Presupuestos Mínimos de Protección Ambiental de los Bosques Nativos; Ministerio de Ambiente y Desarrollo Sostenible de la Nación: Buenos Aires, Argentina, 2017; 80p.
  7. Moreno, A.; Neumann, M.; Hasenauer, H. Optimal resolution for linking remotely sensed and forest inventory data in Europe. Rem. Sen. Environ. 2016, 183, 109–119. [Google Scholar] [CrossRef]
  8. Zald, H.; Wulder, M.A.; White, J.C.; Hilker, T.; Hermosilla, T.; Hobart, G.W.; Coops, N.C. Integrating Landsat pixel composites and change metrics with lidar plots to predictively map forest structure and aboveground biomass in Saskatchewan, Canada. Rem. Sen. Environ. 2016, 176, 188–201. [Google Scholar] [CrossRef] [Green Version]
  9. Silveira, E.M.O.; Terra, M.; ter Steege, H.; Maeda, E.; Acerbi Júnior, F.; Scolforo, J. Carbon-diversity hotspots and their owners in Brazilian southeastern savanna, Atlantic forest and semi-arid woodland domains. For. Ecol. Manag. 2019, 452, e117575. [Google Scholar] [CrossRef]
  10. Silveira, E.M.O.; Espírito Santo, F.; Wulder, M.A.; Acerbi Júnior, F.; Carvalho, M.C.; Mello, C.R.; Mello, J.M.; Shimabukuro, Y.E.; Terra, M.; Carvalho, L.; et al. Pre-stratified modelling plus residuals kriging reduces the uncertainty of aboveground biomass estimation and spatial distribution in heterogeneous savannas and forest environments. For. Ecol. Manag. 2019, 445, 96–109. [Google Scholar] [CrossRef]
  11. Coops, N.C.; Tompalski, P.; Goodbody, T.; Queinnec, M.; Luther, J.E.; Bolton, D.K.; White, J.C.; Wulder, M.A.; van Lier, O.R.; Hermosilla, T. Modelling LIDAR-derived estimates of forest attributes over space and time: A review of approaches and future trends. Rem. Sen. Environ. 2021, 260, e112477. [Google Scholar] [CrossRef]
  12. White, J.C.; Wulder, M.A.; Hobart, G.W.; Luther, J.E.; Hermosilla, T.; Griffiths, P.; Coops, N.C.; Hall, R.J.; Hostert, P.; Dyk, A.; et al. Pixel-based image compositing for large area dense time series applications and science. Can. J. Rem. Sen. 2014, 40, 192–212. [Google Scholar] [CrossRef] [Green Version]
  13. Li, Y.; Ramzan, M.; Li, X.; Murshed, M.; Awosusi, A.; Ibrahim, B.A.H.S.; Adebayo, T. Determinants of carbon emissions in Argentina: The roles of renewable energy consumption and globalization. Energy Rep. 2021, 7, 4747–4760. [Google Scholar] [CrossRef]
  14. Murshed, M.; Rashid, S.; Ulucak, R.; Dagar, V.; Rehman, A.; Alvarado, R.; Nathaniel, S.P. Mitigating energy production-based carbon dioxide emissions in Argentina: The roles of renewable energy and economic globalization. Environ. Sci. Poll. Res. 2022, 29, 16939–16958. [Google Scholar] [CrossRef]
  15. Peri, P.L.; Banegas, N.; Gasparri, I.; Carranza, C.; Rossner, B.; Martínez Pastur, G.; Caballero, L.; López, D.; Loto, D.; Fernández, P.; et al. Carbon sequestration in temperate silvopastoral systems, Argentina. In Integrating Landscapes: Agroforestry for Biodiversity Conservation and Food Sovereignty; Montagnini, F., Ed.; Springer Series: Advances in Agroforestry; Springer: Bern, Switzerland, 2017; pp. 453–478. [Google Scholar]
  16. Peri, P.L.; Lasagno, R.G.; Martínez Pastur, G.; Atkinson, R.; Thomas, E.; Ladd, B. Soil carbon is a useful surrogate for conservation planning in developing nations. Sci. Rep. 2019, 9, e3905. [Google Scholar] [CrossRef]
  17. Baldassini, P.; Bagnato, C.; Paruelo, J.M. How may deforestation rates and political instruments affect land use patterns and carbon emissions in the semi-arid Chaco, Argentina? Land Use Pol. 2020, 99, e104985. [Google Scholar] [CrossRef]
  18. Peri, P.L.; Gargaglione, V.; Martínez Pastur, G.; Lencinas, M.V. Carbon accumulation along a stand development sequence of Nothofagus antarctica forests across a gradient in site quality in Southern Patagonia. For. Ecol. Manag. 2010, 260, 229–237. [Google Scholar] [CrossRef]
  19. Peri, P.L.; Rosas, Y.M.; Ladd, B.; Toledo, S.; Lasagno, R.G.; Martínez Pastur, G. Modelling soil carbon content in South Patagonia and evaluating changes according to climate, vegetation, desertification and grazing. Sustainability 2018, 10, 438. [Google Scholar] [CrossRef] [Green Version]
  20. Peri, P.L.; Rosas, Y.M.; Ladd, B.; Díaz Delgado, R.; Martínez Pastur, G. Carbon footprint of lamb and wool production at farm and regional scales in Southern Patagonia. Sustainability 2020, 12, 3077. [Google Scholar] [CrossRef] [Green Version]
  21. de Koning, F.; Olschewski, R.; Veldkamp, E.; Benítez, P.; López-Ulloa, M.; Schlichter, T.; de Urquiza, M. The ecological and economic potential of carbon sequestration in forests: Examples from South America. AMBIO 2005, 34, 224–229. [Google Scholar] [CrossRef] [PubMed]
  22. Defossé, G.E.; Loguercio, G.; Oddi, F.J.; Kraus, P.D. Potential CO2 emissions mitigation through forest prescribed burning: A case study in Patagonia, Argentina. For. Ecol. Manag. 2011, 261, 2243–2254. [Google Scholar] [CrossRef]
  23. Peri, P.L.; Ladd, B.; Lasagno, R.G.; Martínez Pastur, G. The effects of land management (grazing intensity) vs. the effects of topography, soil properties, vegetation type, and climate on soil carbon concentration in Southern Patagonia. J. Arid Environ. 2016, 134, 73–78. [Google Scholar] [CrossRef]
  24. Laclau, P. Biomass and carbon sequestration of ponderosa pine plantations and native cypress forests in northwest Patagonia. For. Ecol. Manag. 2003, 180, 317–333. [Google Scholar] [CrossRef]
  25. Gonzalez Musso, R.F.; Oddi, F.; Goldenberg, M.G.; Garibaldi, L.A. Applying unmanned aerial vehicles (UAVs) to map shrubland structural attributes in northern Patagonia, Argentina. Can. J. For. Res. 2020, 50, 615–623. [Google Scholar] [CrossRef]
  26. Silveira, E.M.O.; Radeloff, V.C.; Martínez Pastur, G.; Martinuzzi, S.; Politi, N.; Lizarraga, L.; Rivera, L.; Gavier Pizarro, G.; Yin, H.E.; Rosas, Y.M.; et al. Forest phenoclusters for Argentina based on vegetation phenology and climate. Ecol. Appl. 2022, 32, e2526. [Google Scholar] [CrossRef]
  27. Silveira, E.M.O.; Radeloff, V.C.; Martinuzzi, S.; Martínez Pastur, G.; Bono, J.; Politi, N.; Lizarraga, L.; Rivera, L.; Ciuffoli, L.; Rosas, Y.M.; et al. Nationwide forest structure maps for Argentina based on forest inventory data, SAR Sentinel-1 and vegetation metrics from Sentinel-2 imagery. Rem. Sen. Environ. 2022, in press.
  28. Gasparri, N.I.; Parmuchi, M.G.; Bono, J.; Karszenbaum, H.; Montenegro, C.L. Assessing multi-temporal Landsat 7 ETM + images for estimating above-ground biomass in subtropical dry forests of Argentina. J. Arid Environ. 2010, 74, 1262–1270. [Google Scholar] [CrossRef]
  29. Gasparri, N.I.; Baldi, G. Regional patterns and controls of biomass in semiarid woodlands: Lessons from the Northern Argentina Dry Chaco. Reg. Environ. Change 2013, 13, 1131–1144. [Google Scholar] [CrossRef]
  30. Bouvier, M.; Durrieu, S.; Fournier, R.A.; Renaud, J.P. Generalizing predictive models of forest inventory attributes using an area-based approach with airborne LiDAR data. Rem. Sen. Environ. 2015, 156, 322–334. [Google Scholar] [CrossRef]
  31. Carter, M.R.; Gregorich, E.G. Soil Sampling and Methods of Analysis; Taylor and Francis: Boca Raton, FL, USA, 2006; 1261p. [Google Scholar]
  32. Nunery, J.S.; Keeton, W.S. Forest carbon storage in the north-eastern United States: Net effects of harvesting frequency, post-harvest retention, and wood products. For. Ecol. Manag. 2010, 259, 1363–1375. [Google Scholar] [CrossRef]
  33. Ontl, T.A.; Janowiak, M.; Swanston, C.; Daley, J.; Handler, S.; Cornett, M.; Hagenbuch, S.; Handrick, C.; Mccarthy, L.; Patch, N. Forest management for carbon sequestration and climate adaptation. J. For. 2019, 118, 86–101. [Google Scholar] [CrossRef] [Green Version]
  34. La Manna, L.; Tarabini, M.; Gomez, F.; Rostagno, C.M. Changes in soil organic matter associated with afforestation affect erosion processes: The case of erodible volcanic soils from Patagonia. Geoderma 2021, 403, e115265. [Google Scholar] [CrossRef]
  35. Gómez, F.; von Müller, A.; Tarabini, M.; La Manna, L. Resilient Andisols under silvopastoral systems. Geoderma 2022, 418, e115843. [Google Scholar] [CrossRef]
  36. Gutsch, M.; Lasch-Born, P.; Kollas, C.; Suckow, F.; Reyer, C. Balancing trade-offs between ecosystem services in Germany’s forests under climate change. Environ. Res. Lett. 2018, 13, e045012. [Google Scholar] [CrossRef]
  37. Orsi, F.; Ciolli, M.; Primmer, E.; Varumo, L.; Geneletti, D. Mapping hotspots and bundles of forest ecosystem services across the European Union. Land Use Pol. 2020, 99, e104840. [Google Scholar] [CrossRef]
  38. Köhl, M.; Lasco, R.; Cifuentes, M.; Jonsson, O.; Korhonen, K.; Mundhenk, P.; de Jesus Navar, J.; Stinson, G. Changes in forest production, biomass and carbon: Results from the 2015 UN FAO Global Forest Resource Assessment. For. Ecol. Manag. 2015, 352, 21–34. [Google Scholar] [CrossRef]
  39. Klein, D.; Fuentes, J.P.; Schmidt, A.; Schmidt, H.; Schulte, A. Soil organic C as affected by silvicultural and exploitative interventions in Nothofagus pumilio forests of the Chilean Patagonia. For. Ecol. Manag. 2008, 255, 3549–3555. [Google Scholar] [CrossRef]
  40. Dube, F.; Thevathasan, N.V.; Zagal, E.; Gordon, A.M.; Stolpe, N.B.; Espinosa, M. Carbon sequestration potential of silvopastoral and other land use systems in the Chilean Patagonia. In Carbon Sequestration Potential of Agroforestry Systems; Kumar, B., Nair, P., Eds.; Advances in Agroforestry; Springer: Dordrecht, The Netherlands, 2011; Volume 8, pp. 101–127. [Google Scholar]
  41. Dube, F.; Espinosa, M.; Stolpe, N.; Zagal, E.; Thevathasan, N.; Gordon, A. Productivity and carbon storage in silvopastoral systems with Pinus ponderosa and Trifolium spp. plantations and pasture on an Andisol in Patagonia, Chile. Agrofor. Syst. 2012, 86, 113–128. [Google Scholar] [CrossRef]
  42. Huang, S.; Tang, L.; Hupy, J.P.; Wang, Y.; Shao, G. A commentary review on the use of normalized difference vegetation index (NDVI) in the era of popular remote sensing. J. For. Res. 2021, 32, 1–6. [Google Scholar] [CrossRef]
  43. Li, S.; Xu, L.; Jing, Y.; Yin, H.; Li, X.; Guan, X. High-quality vegetation index product generation: A review of NDVI time series reconstruction techniques. Int. J. Appl. Earth Obs. Geoinf. 2021, 105, e102640. [Google Scholar] [CrossRef]
  44. Kai, Z.; Jianbo, X.; Zhizhong, Z.; Lisheng, S.; Ke, X. Cross comparison of HJ-1A/B CCD and Landsat TM/ETM+ multispectral measurements for NDVI, SAVI and EVI vegetation index. Rem. Sens. Technol. Appl. 2013, 28, 674–680. [Google Scholar]
  45. Li, P.; Xiao, C.; Feng, Z. Mapping rice planted area using a new normalized EVI and SAVI (NVI) derived from Landsat-8 OLI. IEEE Geosci. Rem. Sens. Lett. 2018, 15, 1822–1826. [Google Scholar]
  46. Berry, S.; Mackey, B.; Brown, T. Potential applications of remotely sensed vegetation greenness to habitat analysis and the conservation of dispersive fauna. Pacific Conserv. Biol. 2017, 13, 120–127. [Google Scholar] [CrossRef]
  47. Radeloff, V.C.; Dubinin, M.; Coops, N.C.; Allen, A.M.; Brooks, T.M.; Clayton, M.K.; Costa, G.C.; Graham, C.H.; Helmers, D.P.; Ives, A.R.; et al. The Dynamic Habitat Indices (DHIs) from MODIS and global biodiversity. Rem. Sen. Environ. 2019, 222, 204–214. [Google Scholar] [CrossRef]
  48. Dirección Nacional de Bosques. Datos del Segundo Inventario Nacional de Bosques Nativos de la República Argentina; Ministerio de Ambiente y Desarrollo Sostenible de la Nación: Buenos Aires, Argentina, 2021; 67p.
  49. Hansen, M.C.; Potapov, P.V.; Moore, R.; Hancher, M.; Turubanova, S.A.; Tyukavina, A.; Thau, D.; Stehmans, S.; Goetzt, S.; Loveland, T.; et al. High-resolution global maps of 21st-century forest cover change. Science 2013, 80, 850–853. [Google Scholar] [CrossRef] [Green Version]
  50. Matteucci, S.D.; Martínez Pastur, G.; Lencinas, M.V.; Rovere, A.E.; Amoroso, M.M.; Barberis, I.; Vesprini, J.L.; Galetto, L.; Torres, C.; Villagra, P.E.; et al. Breve descripción de las regiones forestales de la Argentina. In Uso Sustentable del Bosque: Aportes Desde la Silvicultura Argentina; Peri, P.L., Martínez Pastur, G., Schlichter, T., Eds.; Ministerio de Ambiente y Desarrollo Sostenible de la Nación Argentina: Buenos Aires, Argentina, 2021; pp. 48–77. [Google Scholar]
  51. Peri, P.L.; Martínez Pastur, G.; Schlichter, T. Uso Sustentable del Bosque: Aportes Desde la Silvicultura Argentina; Ministerio de Ambiente y Desarrollo Sostenible de la Nación Argentina: Buenos Aires, Argentina, 2021; 888p.
  52. Fick, S.E.; Hijmans, R.J. WorldClim 2: New 1-km spatial resolution climate surfaces for global land areas. Int. J. Clim. 2017, 37, 4302–4315. [Google Scholar] [CrossRef]
  53. Gorelick, N.; Hancher, M.; Dixon, M.; Ilyushchenko, S.; Thau, D.; Moore, R. Google Earth Engine: Planetary-scale geospatial analysis for everyone. Rem. Sen. Environ. 2017, 202, 18–27. [Google Scholar] [CrossRef]
  54. Vermote, E.; Justice, C.; Claverie, M.; Franch, B. Preliminary analysis of the performance of the Landsat 8/OLI land surface reflectance product. Rem. Sen. Environ. 2016, 185, 46–56. [Google Scholar] [CrossRef] [PubMed]
  55. Foga, S.; Scaramuzza, P.L.; Guo, S.; Zhu, Z.; Dilley, R.D.; Beckmann, T.; Schmidt, G.L.; Dwyer, J.L.; Joseph Hughes, M.; Laue, B. Cloud detection algorithm comparison and validation for operational Landsat data products. Rem. Sen. Environ. 2017, 194, 379–390. [Google Scholar] [CrossRef] [Green Version]
  56. Farwell, L.S.; Elsen, P.R.; Razenkova, E.; Pidgeon, A.M.; Radeloff, V.C. Habitat heterogeneity captured by 30-m resolution satellite image texture predicts bird richness across the United States. Ecol. Appl. 2020, 30, e02157. [Google Scholar] [CrossRef]
  57. Silveira, E.M.O.; Radeloff, V.C.; Martinuzzi, S.; Martínez Pastur, G.; Rivera, L.O.; Politi, N.; Lizarraga, L.; Farwell, L.S.; Elsen, P.; Pidgeon, A.M. Spatio-temporal remotely sensed indices identify hotspots of biodiversity conservation concern. Rem. Sen. Environ. 2021, 258, e112368. [Google Scholar] [CrossRef]
  58. Breiman, L. Random forests. Mach. Learn. 2001, 45, 5–32. [Google Scholar] [CrossRef] [Green Version]
  59. Liaw, A.; Wiener, M. Classification and regression by randomForest. R News 2002, 2, 18–22. [Google Scholar]
  60. R Core Team. R: A Language and Environment for Statistical Computing; R Foundation for Statistical Computing: Vienna, Austria, 2021; Available online: https://cran.r-project.org/web/packages/FSelector/FSelector.pdf (accessed on 1 July 2021).
  61. Bergstra, J.; Bengio, Y. Random search for hyper-parameter optimization. J. Mach. Learn. Res. 2012, 13, 281–305. [Google Scholar]
  62. Csillik, O.; Kumar, P.; Asner, G.P. Challenges in estimating tropical forest canopy height from planet dove imagery. Rem. Sens. 2020, 12, 1160. [Google Scholar] [CrossRef] [Green Version]
  63. Dos Reis, A.A.; Werner, J.P.; Silva, B.C.; Figueiredo, G.K.; Antunes, J.F.; Esquerdo, J.C.; Coutinho, A.C.; Lamparelli, R.A.; Rocha, J.V.; Magalhães, P.S. Monitoring pasture aboveground biomass and canopy height in an integrated crop-livestock system using textural information from PlanetScope imagery. Rem. Sens. 2020, 12, 2534. [Google Scholar] [CrossRef]
  64. ESRI. ArcGIS Desktop: Release 10; Environmental Systems Research Institute Inc.: Redlands, CA, USA, 2011. [Google Scholar]
  65. Paruelo, J.M.; Beltrán, A.; Jobbágy, E.; Sala, O.E.; Golluscio, R.A. The climate of Patagonia: General patterns and controls on biotic processes. Ecol. Austral. 1998, 8, 85–101. [Google Scholar]
  66. Pérez-Haase, A.; Iturraspe, R.; Ninot, J.M. Macroclimate and local hydrological regime as drivers of fen vegetation patterns in Tierra del Fuego (Argentina). Ecohydrology 2019, 12, e2155. [Google Scholar] [CrossRef]
  67. Vivanco, L.; Austin, A.T. The importance of macro- and micro-nutrients over climate for leaf litter decomposition and nutrient release in Patagonian temperate forests. For. Ecol. Manag. 2019, 441, 144–154. [Google Scholar] [CrossRef]
  68. Zomer, R.J.; Trabucco, A.; Bossio, D.A.; VanStraaten, O.; Verchot, L.V. Climate change mitigation: A spatial analysis of global land suitability for clean development mechanism afforestation and reforestation. Agric. Ecosyst. Environ. 2008, 126, 67–80. [Google Scholar] [CrossRef]
  69. Kunkel, M.L.; Flores, A.N.; Smith, T.J.; McNamara, J.P.; Benner, S.G. A simplified approach for estimating soil carbon and nitrogen stocks in semi-arid complex terrain. Geoderma 2011, 165, 1–11. [Google Scholar] [CrossRef]
  70. Dai, W.; Fu, W.; Jiang, P.; Zhao, K.; Li, Y.; Tao, J. Spatial pattern of carbon stocks in forest ecosystems of a typical subtropical region of southeastern China. For. Ecol. Manag. 2018, 409, 288–297. [Google Scholar] [CrossRef]
  71. Cao, B.; Domke, G.M.; Russell, M.B.; Walters, B.F. Spatial modeling of litter and soil carbon stocks on forest land in the conterminous United States. Sci. Total Environ. 2019, 654, 94–106. [Google Scholar] [CrossRef] [PubMed]
  72. Lin, C.; Tsai, C.F.; Lin, W.C. Towards hybrid over- and under-sampling combination methods for class imbalanced datasets: An experimental study. Artif. Intell. Rev. 2022. [Google Scholar] [CrossRef]
  73. Sahin, E.K.; Colkesen, I.; Kavzoglu, T. A comparative assessment of canonical correlation forest, random forest, rotation forest and logistic regression methods for landslide susceptibility mapping. Geocarto. Int. 2020, 35, 341–363. [Google Scholar] [CrossRef]
  74. Amiro, B.D.; Barr, A.; Barr, J.; Black, T.; Bracho, R.; Brown, M.; Chen, J.; Clark, K.; Davis, K.; Desai, A.; et al. Ecosystem carbon dioxide fluxes after disturbance in forests of North America. J. Geophys. Res. 2010, 115, G00K02. [Google Scholar] [CrossRef] [Green Version]
  75. Lorenz, K.; Lal, R.; Ehlers, K. Soil organic carbon stock as an indicator for monitoring land and soil degradation in relation to United Nations’ Sustainable Development Goals. Land Deg. Develop. 2019, 30, 824–838. [Google Scholar] [CrossRef]
  76. Lehtomäki, J.; Tuominen, S.; Toivonen, T.; Leinonen, A. What data to use for forest conservation planning? A comparison of coarse open and detailed proprietary forest inventory data in Finland. PLoS ONE 2015, 10, e0135926. [Google Scholar] [CrossRef] [PubMed] [Green Version]
  77. Ladd, B.; Laffan, S.W.; Amelung, W.; Peri, P.L.; Silva, L.; Gervassi, P.; Bonser, S.P.; Navall, M.; Sheil, D. Estimates of soil carbon concentration in tropical and temperate forest and woodland from available GIS data on three continents. Glob. Ecol. Biogeogr. 2013, 22, 461–469. [Google Scholar] [CrossRef]
  78. Cusack, D.F.; Turner, B.L. Fine root and soil organic carbon depth distributions are inversely related across fertility and rainfall gradients in lowland tropical forests. Ecosystems 2021, 24, 1075–1092. [Google Scholar] [CrossRef]
  79. Knapp, A.K.; Fay, P.A.; Blair, J.M.; Collins, S.L.; Smith, M.D.; Carlisle, J.D.; Harper, C.W.; Danner, B.T.; Lett, M.S.; McCarron, J.K. Rainfall variability, carbon cycling, and plant species diversity in a mesic grassland. Science 2002, 298, 2202–2205. [Google Scholar] [CrossRef]
  80. Liu, W.; Zhang, Z.; Wan, S. Predominant role of water in regulating soil and microbial respiration and their responses to climate change in a semiarid grassland. Glob. Chang. Biol. 2009, 15, 184–195. [Google Scholar] [CrossRef]
  81. Bahamonde, H.A.; Peri, P.L.; Alvarez, R.; Barneix, A.; Moretto, A.; Martínez Pastur, G. Litter decomposition and nutrients dynamics in Nothofagus antarctica forests under silvopastoral use in Southern Patagonia. Agrofor. Syst. 2012, 84, 345–360. [Google Scholar] [CrossRef]
  82. Domke, G.M.; Perry, C.; Walters, B.; Nave, L.; Woodall, C.; Swanston, C. Toward inventory-based estimates of soil organic carbon in forests of the United States. Ecol. Appl. 2017, 27, 1223–1235. [Google Scholar] [CrossRef]
  83. United States Department of Agriculture, Natural Resources Conservation Service. Soil Survey Staff—Rapid Carbon Assessment (RaCA) Project; FY2013; United States Department of Agriculture, Natural Resources Conservation Service: New York, NY, USA, 2013.
  84. Hoover, C.M. Management impacts on forest floor and soil organic carbon in northern temperate forests of the US. Carbon Bal. Manag. 2011, 6, e17. [Google Scholar] [CrossRef] [Green Version]
  85. Toro-Manríquez, M.; Soler, R.; Lencinas, M.V.; Promis, A. Canopy composition and site are indicative of mineral soil conditions in Patagonian mixed Nothofagus forests. Ann. For. Sci. 2019, 76, e117. [Google Scholar] [CrossRef]
  86. Satti, P.; Mazzarino, M.J.; Roselli, L.; Crego, P. Factors affecting soil P dynamics in temperate volcanic soils of southern Argentina. Geoderma 2007, 139, 229–240. [Google Scholar] [CrossRef]
  87. de Koning, F.; Olschewski, R.; Veldkamp, E.; Benítez, P.; Laclau, P.; López, M.; de Urquiza, M.; Schlichter, T. Evaluation of the CO2 Sequestration Potential of Afforestation Projects and Secondary Forests in Two Different Climate Zones of South America; Tropical Forest Research; TWF-37e: Eschborn, Germany, 2002; 147p. [Google Scholar]
  88. Relva, M.A.; Castán, E.; Mazzarino, M.J. Litter and soil properties are not altered by invasive deer browsing in forests of NW Patagonia. Acta Oecol. 2014, 54, 45–50. [Google Scholar] [CrossRef]
  89. Urretavizcaya, F.; Peri, P.L.; Monelos, L.; Arriola, H.; Oyharcabal, M.F.; Contardi, L.; Muñoz, M.; Sepúlveda, E.; Defossé, G. Condiciones de suelo y vegetación en tres bosques quemados de Nothofagus pumilio en Argentina y experiencias para su restauración activa. Ecol. Austral 2018, 28, 383–399. [Google Scholar] [CrossRef]
  90. van Noordwijk, M.; Akon-Minang, P. If we cannot define it, we cannot save it. Forests and climate change: Adaptation and mitigation. ETFRN News 2009, 50, 5–10. [Google Scholar]
  91. Gibbs, H.K.; Brown, S.; Niles, J.O.; Foley, J.A. Monitoring and estimating tropical forest carbon stocks: Making REDD a reality. Environ. Res. Lett. 2007, 2, e045023. [Google Scholar] [CrossRef] [Green Version]
  92. Sanderman, J.; Hengl, T.; Fiske, G. Soil carbon debt of 12,000 years of human land use. Proc. Natl. Acad. Sci. USA 2017, 114, 9575–9580. [Google Scholar] [CrossRef]
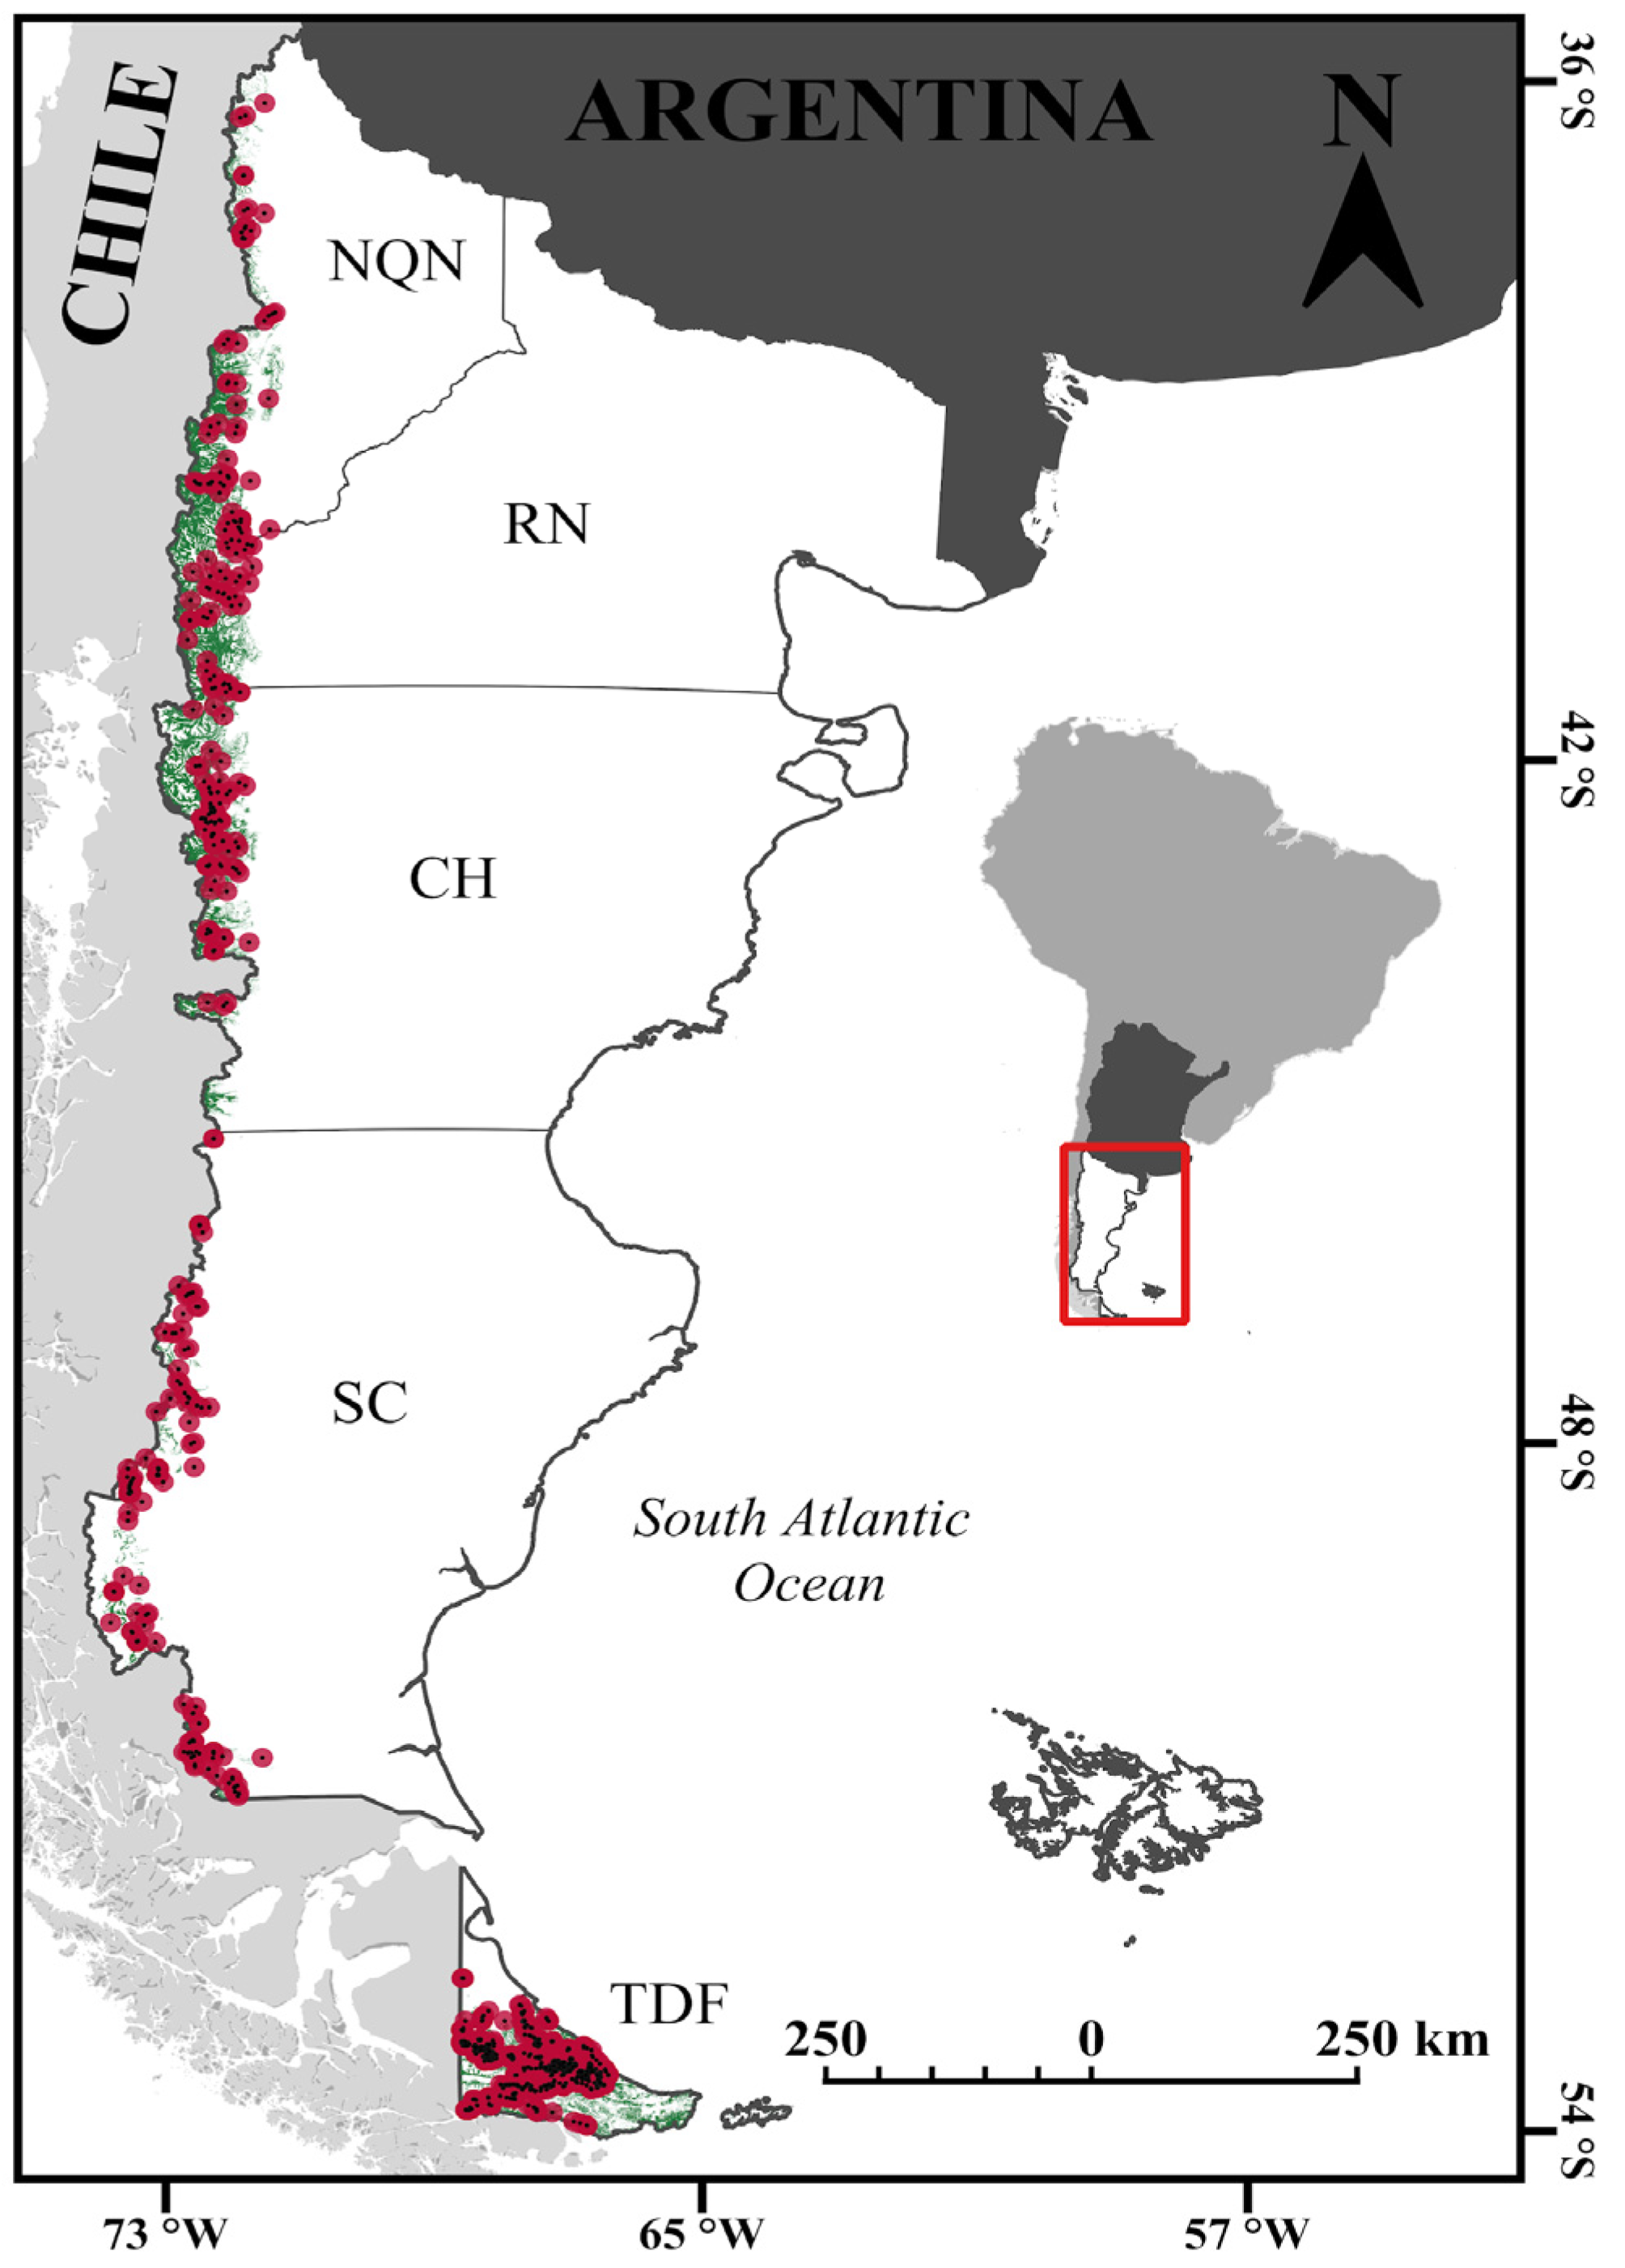
Figure 1. Location of the study area, indicating the sampled stands (black dots), and 10 km buffer (red area) and Patagonian forests of Argentina (green area) at the different provinces (TDF = Tierra del Fuego, SC = Santa Cruz, CHU = Chubut, RN = Río Negro, NQN = Neuquén).
Remotesensing 14 05702 g001
Figure 2. Scatterplots for the regression model of soil organic carbon content (SOC), with fitted line indicated in dashes.
Remotesensing 14 05702 g002
Figure 3. Relative importance of the predictor variables (IncMSE, %) in random models of soil organic carbon content (SOC, ton C ha−1) across the Patagonia region. RAI = mean annual rainfall, LST = land surface temperature, ELE = elevation, VarDHI = annual variation of Landsat-8 Dynamic Habitat Indices, EVI_p90 = 90th percentile of the Enhanced Vegetation Index, and CumDHI = annual cumulative productivity of Landsat-8 Dynamic Habitat Indices.
Remotesensing 14 05702 g003
Figure 4. Model estimates of soil organic carbon content (SOC, ton C ha−1) in the Patagonia region, where dark green represents the lowest (53.5 ton C ha−1) values and red the highest (277.8 ton C ha−1). (AI) figures are zoom to forest sectors of the whole Patagonia region (left figure).
Remotesensing 14 05702 g004
Figure 5. Scatterplots for the 10 bins (based on natural breaks) created to test the regression model of soil organic carbon content (SOC) in the Patagonia region showing the predicted relative RMSE (%) and the predicted absolute RMSE (ton C ha−1).
Remotesensing 14 05702 g005
Figure 6. Predicted relative RMSE (%) maps for the modeling of soil organic carbon content (SOC) in the Patagonia region, where dark green represents the lowest values (0%) and dark brown the highest (12%). (AI) figures are zoom to forest sectors of the whole Patagonia region (left figure).
Remotesensing 14 05702 g006
Figure 7. Predicted absolute RMSE (ton C ha−1) maps for the modeling of soil organic carbon content (SOC) in the Patagonia region, where light brown represents the lowest values (0 ton C ha−1) and blue the highest (15 ton C ha−1). (AI) figures are zoom to forest sectors of the whole Patagonia region (left figure).
Remotesensing 14 05702 g007
Table 1. Forest type classification for Patagonian forests.
AcronymDescription
NPForests with >70% basal area (BA) of Nothofagus pumilio, where the remaining 30% may be composed of other associated native tree species.
NAForests with >70% BA of N. antarctica, where the remaining 30% may be composed of other associated native tree species.
N-MIXPure and mixed deciduous Nothofagus forests, where >70% BA belongs to other deciduous Nothofagus species such as N. obliqua and N. alpina, where the remaining 30% may be composed for other associated native tree species.
N-EVEPure evergreen Nothofagus forests, where >70% BA belongs to evergreen Nothofagus species such as N. dombeyi and N. betuloides, and the remaining 30% may be composed of other associated native tree species.
CONPure and mixed coniferous forests, where >70% BA belongs to Austrocedrus chilensis, Araucaria araucana, Fitzroya cupressoides, Pilgerodendron uviferum, and other native coniferous species, where the remaining 30% may be composed of other associated native tree species.
EVEPure and mixed broadleaved evergreen forests, where >70% BA belongs to Maytenus boaria, Lomatia hirsuta, Luma apiculata, Myrceugenia exsucca, and other native broadleaved species, where the remaining 30% may be composed of other associated native tree species.
MIXMixed forests combining native broadleaved and deciduous tree species, where none exceeds 70% BA, and which do not fit into the above categories.
Table 2. Sampling effort for the modeling, showing the area (km2) of the different forest types (see Table 1) and number of plots (stands) in each province (TDF = Tierra del Fuego, SC = Santa Cruz, CHU = Chubut, RN = Río Negro, NQN = Neuquén). Sampling effort compares the percentage of forest area and percentage of plots in each category, where (+) indicates over-sampling relative to extent of forest type, and (−) indicates under-sampling.
TypeTDFSCCHURNNQNTotal
AreaNP4054.02104.44232.41835.24001.216,227.3
NA2007.3260.22239.1747.71023.86278.0
N-MIX0.030.214.47.2253.6305.5
N-EVE1013.70.01013.4546.41198.23771.8
CON0.00.1521.7318.4956.21796.5
EVE0.00.026.39.615.351.2
MIX217.475.0344.0275.9729.11641.4
Total7292.42469.88391.43740.58177.630,071.7
N PlotsNP709442733786
NA2437448011376
N-MIX03112025
N-EVE24023231
CON0121143672
EVE003238
MIX5552522
Total98112710725801320
Sampling effortNP16.7%−50.6%−25.2%−37.1%−45.2%5.6%
NA−2.8%47.7%18.2%−20.0%1.2%7.6%
N-MIX0.0%1.1%0.8%3.8%21.9%0.9%
N-EVE−11.5%0.0%−10.2%−2.6%−12.2%−10.2%
CON0.0%0.8%13.4%47.5%33.3%−0.5%
EVE0.0%0.0%2.5%7.7%3.6%0.4%
MIX−2.5%0.9%0.6%0.6%−2.7%−3.8%
Total50.1%1.4%−19.8%−10.5%−21.1%
Table 3. Forest cover (FC, km²), soil organic carbon content (SOC, ton C ha−1) and standard deviation (SD, ton C ha−1) to calculate the total C stock of Patagonian forests (million ton C), classified by forest types (see Table 1), provinces (TDF = Tierra del Fuego, SC = Santa Cruz, CHU = Chubut, RN = Río Negro, NQN = Neuquén), protection status according to national law 26.331/07 (OTBN), and reserve networks (NAT = National Parks, PRO = Provincial Reserves, UNP = Unprotected).
TypeFC
(km2)
SOC
(ton C ha−1)
SD
(ton C ha−1)
Total SOC
(million ton C)
Total30,071.7134.425.2404.2
Forest typesNP16,227.3134.823.1218.7
NA6278.0131.723.082.7
N-MIX305.5128.718.63.9
N-EVE3771.8145.532.054.9
CON1796.5116.422.920.9
EVE51.2124.017.90.6
MIX1641.4136.624.922.4
ProvinceTDF7292.4158.127.9115.3
SC2469.8125.416.131.0
CHU8391.4127.617.3107.1
RN3740.5128.516.248.1
NQN8177.6125.620.7102.7
OTBNRed8791.3139.027.3122.2
Yellow10,200.7136.226.2139.0
Green489.8131.518.96.4
Unclassified10,589.9129.021.3136.6
Reserve networksNAT9986.5131.516.3131.3
PRO889.1129.319.111.5
UNP19,196.1136.228.8261.4
Publisher’s Note: MDPI stays neutral with regard to jurisdictional claims in published maps and institutional affiliations.