
Water Level Change of Qinghai Lake from ICESat and ICESat-2 Laser Altimetry


Abstract
1. Introduction
2. Study Area and Data
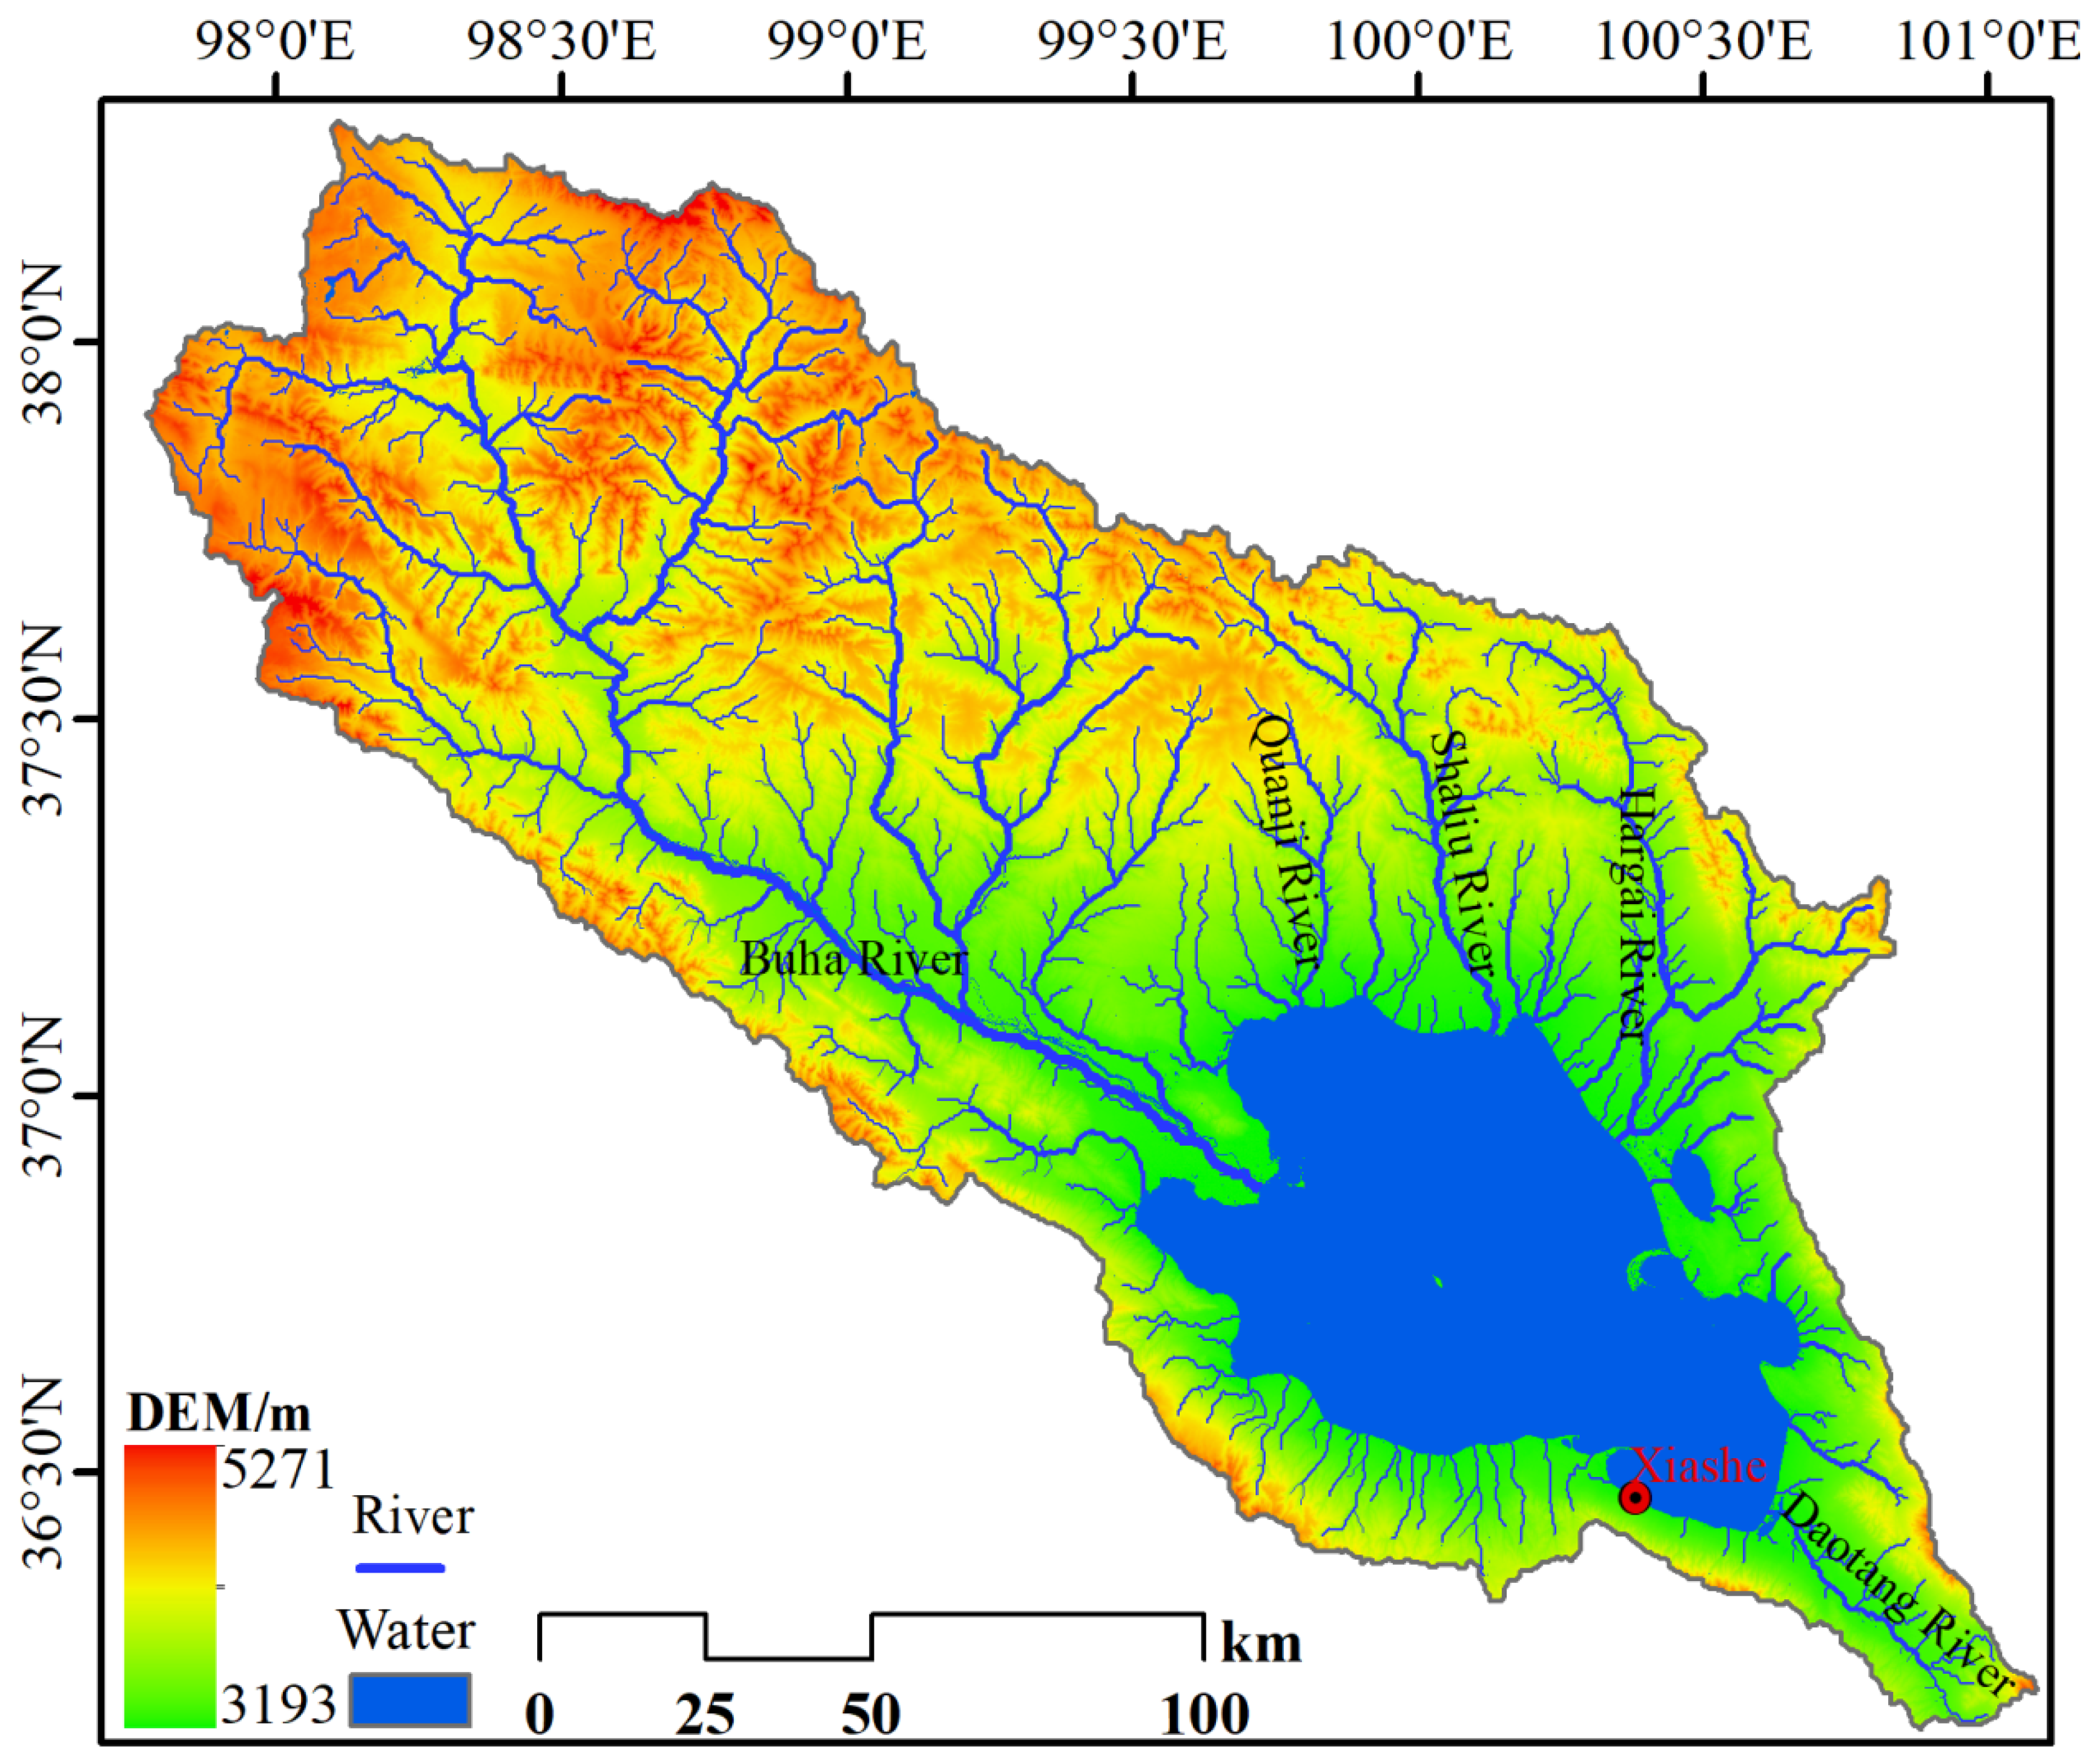
2.1. Study Area
2.2. Data
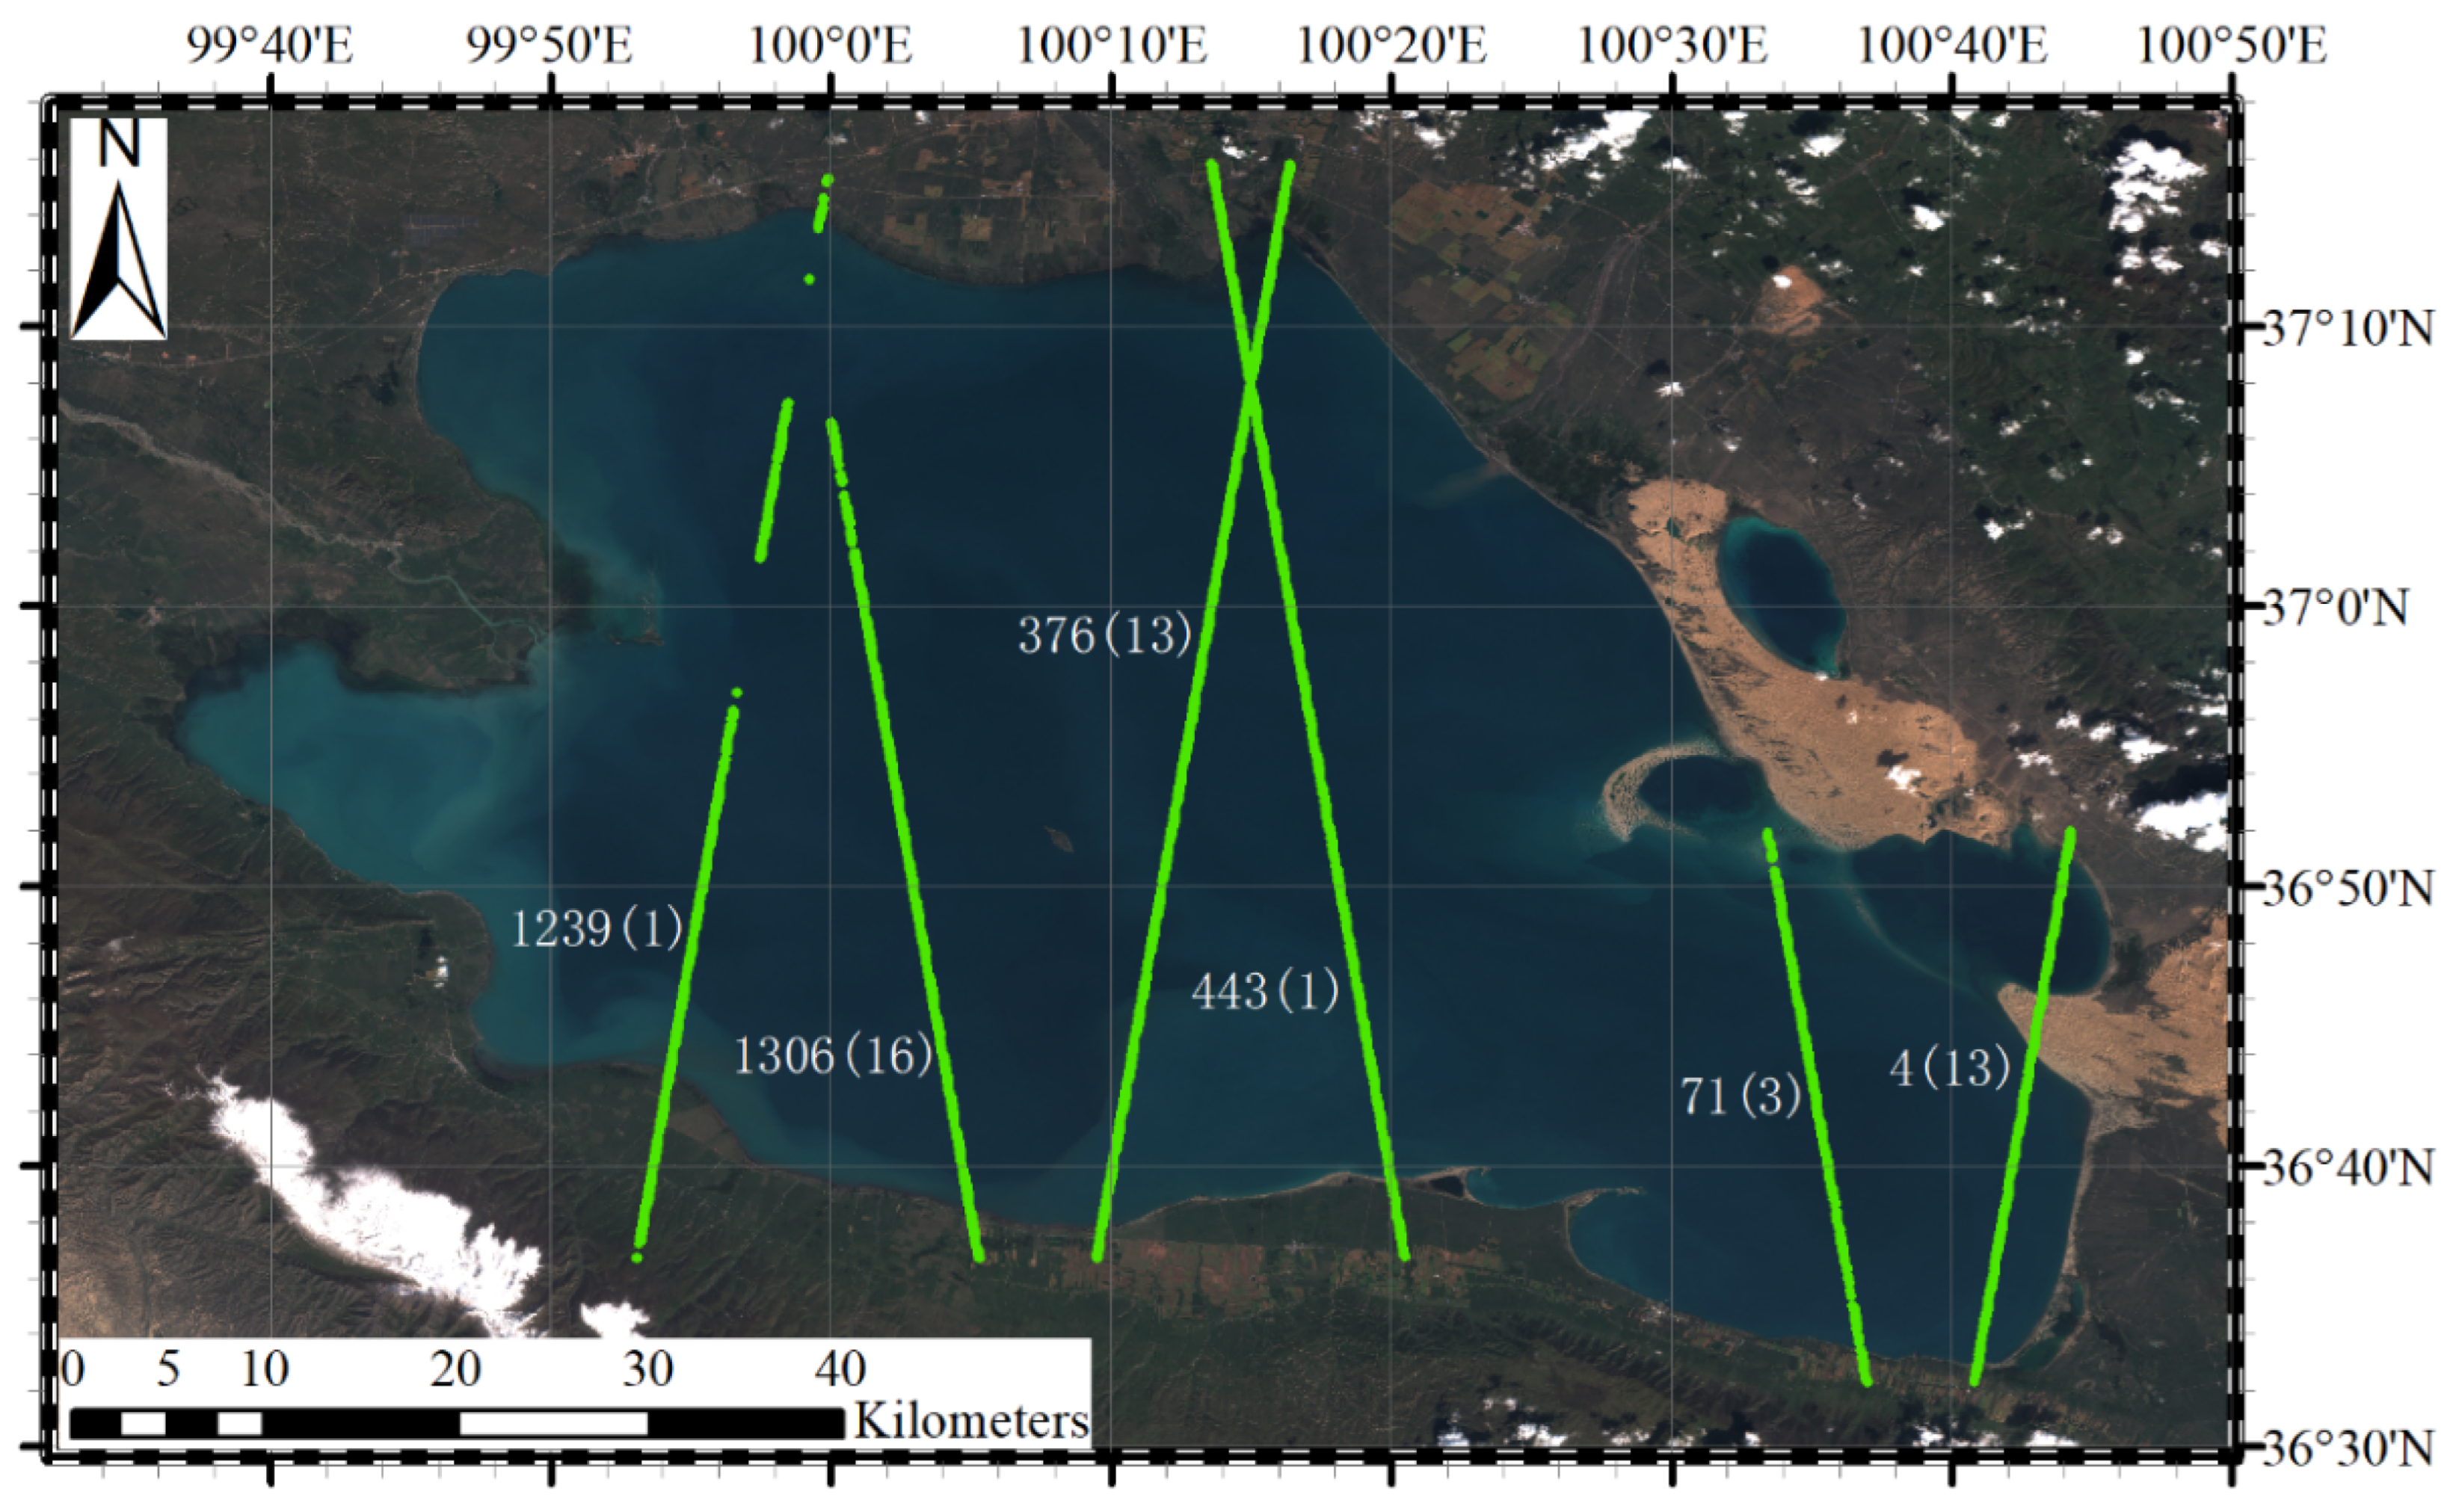
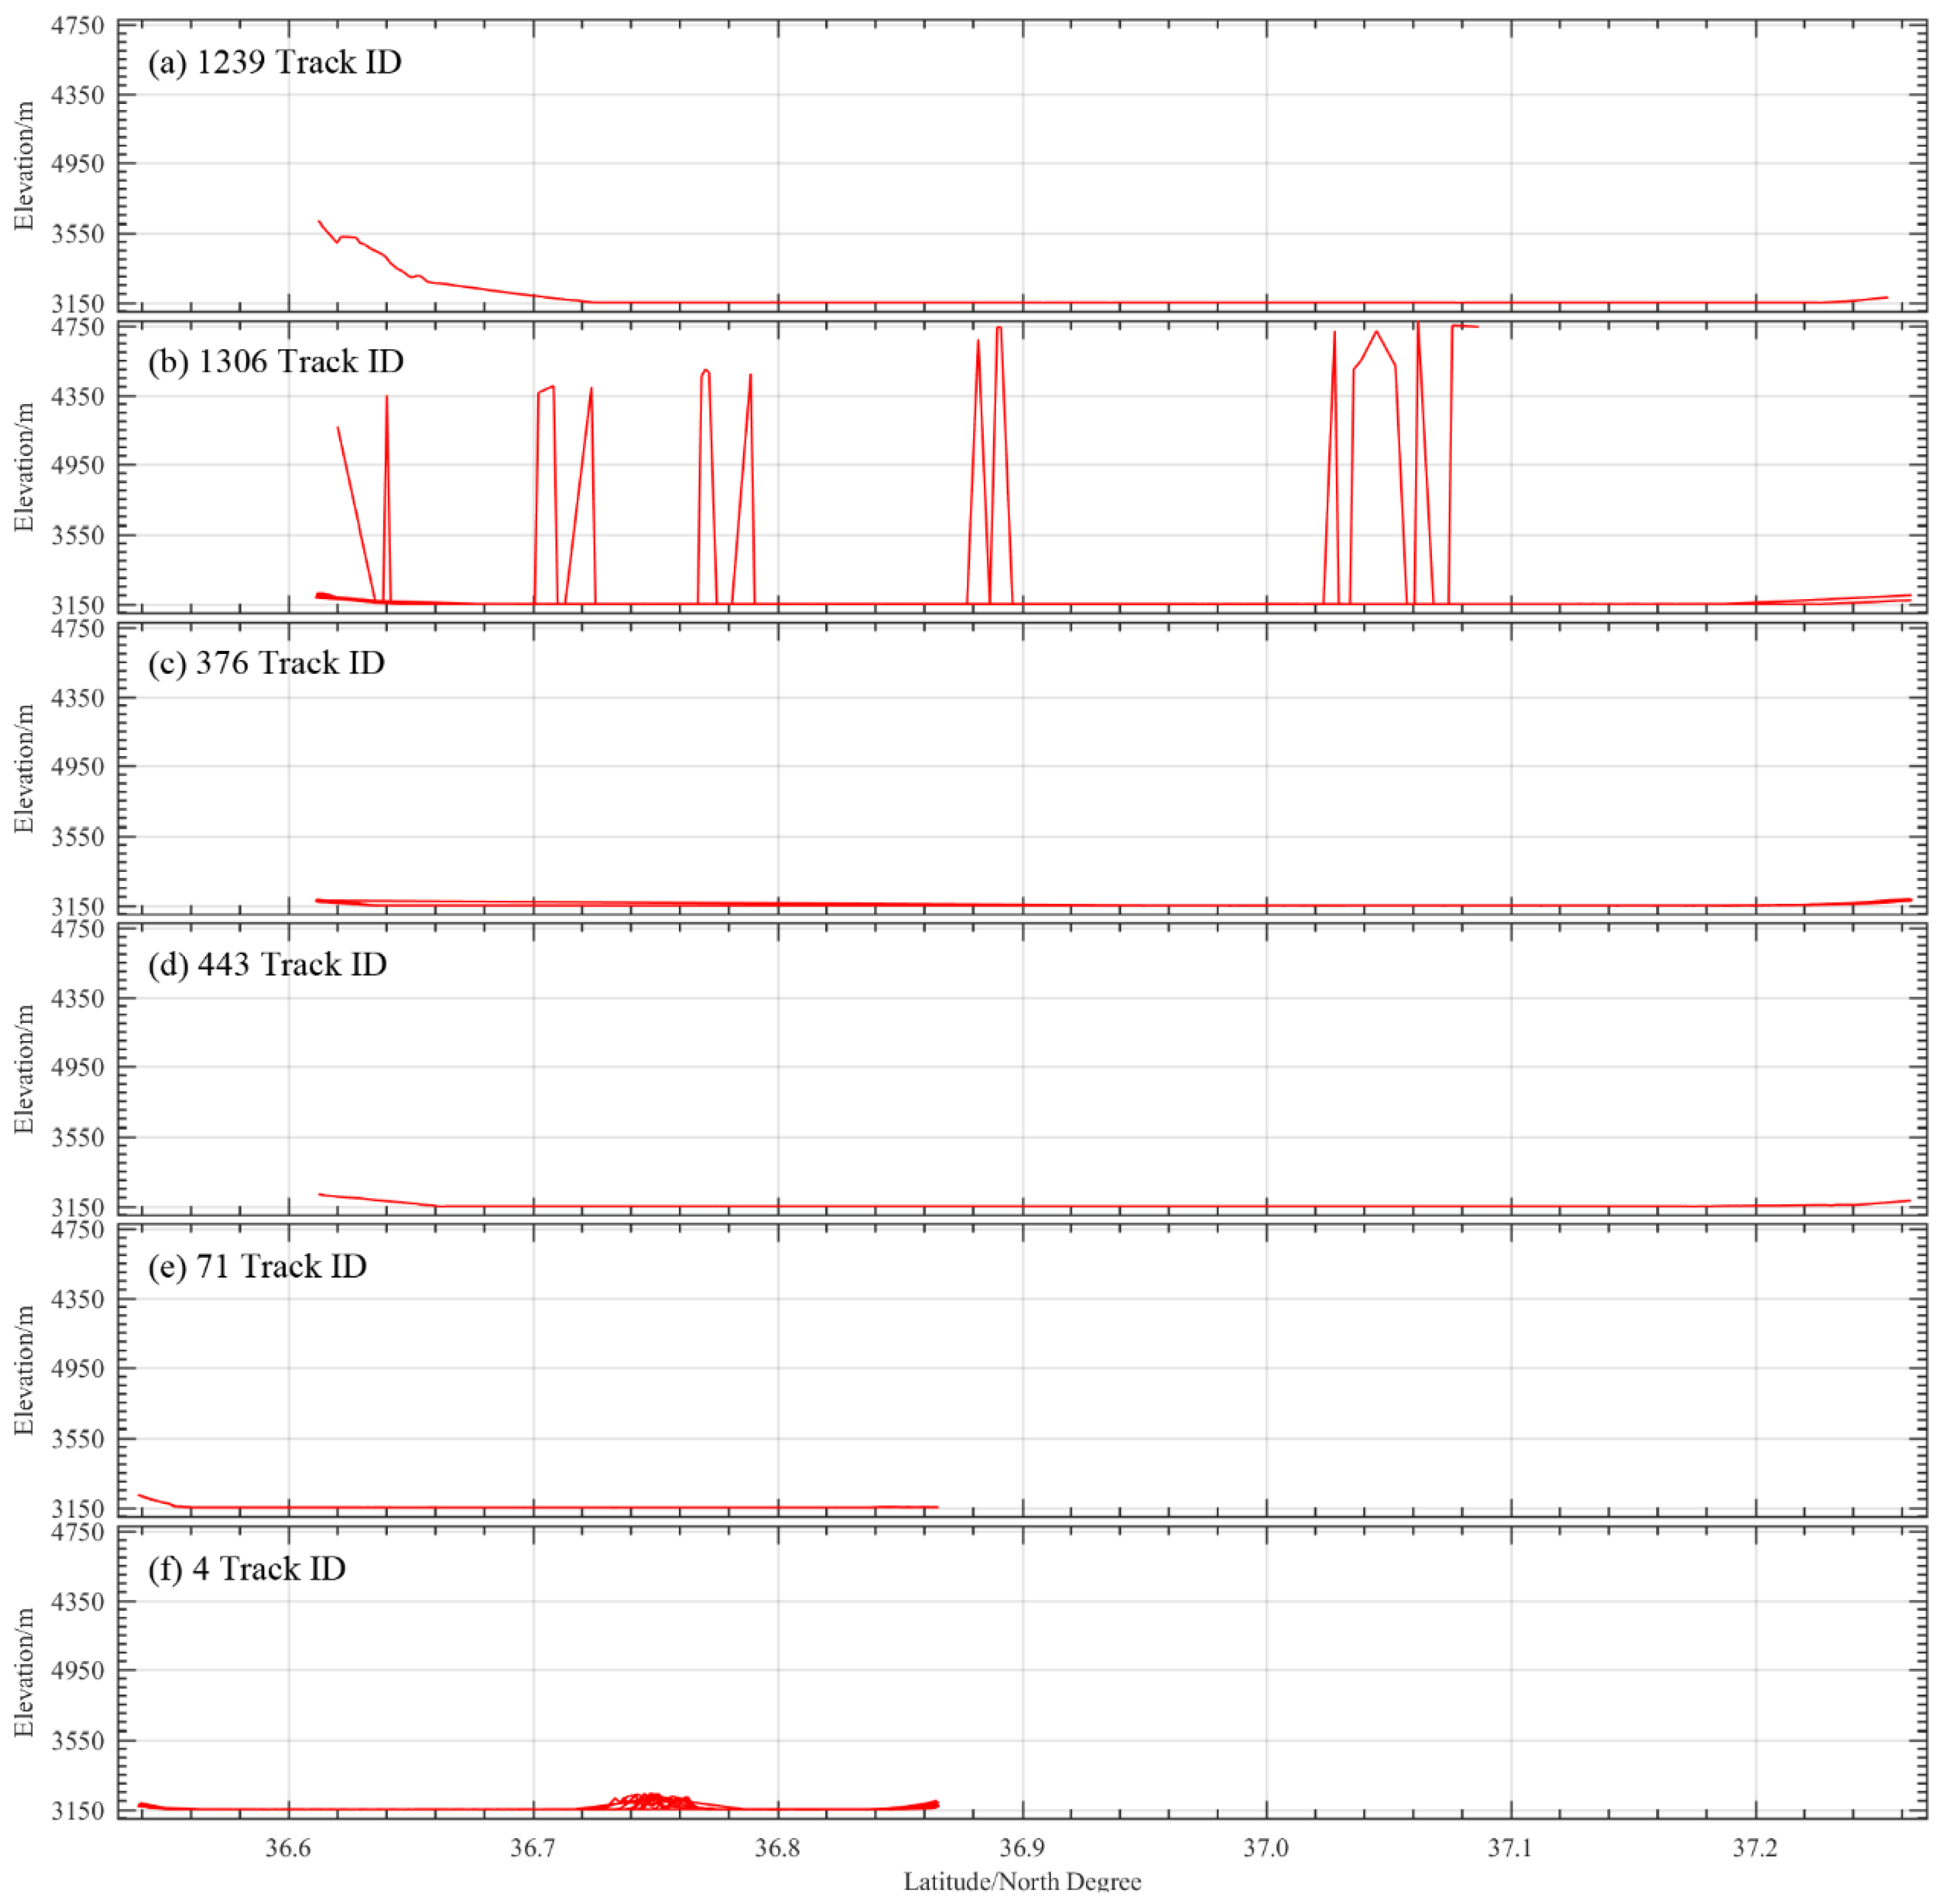
2.2.1. ICESat
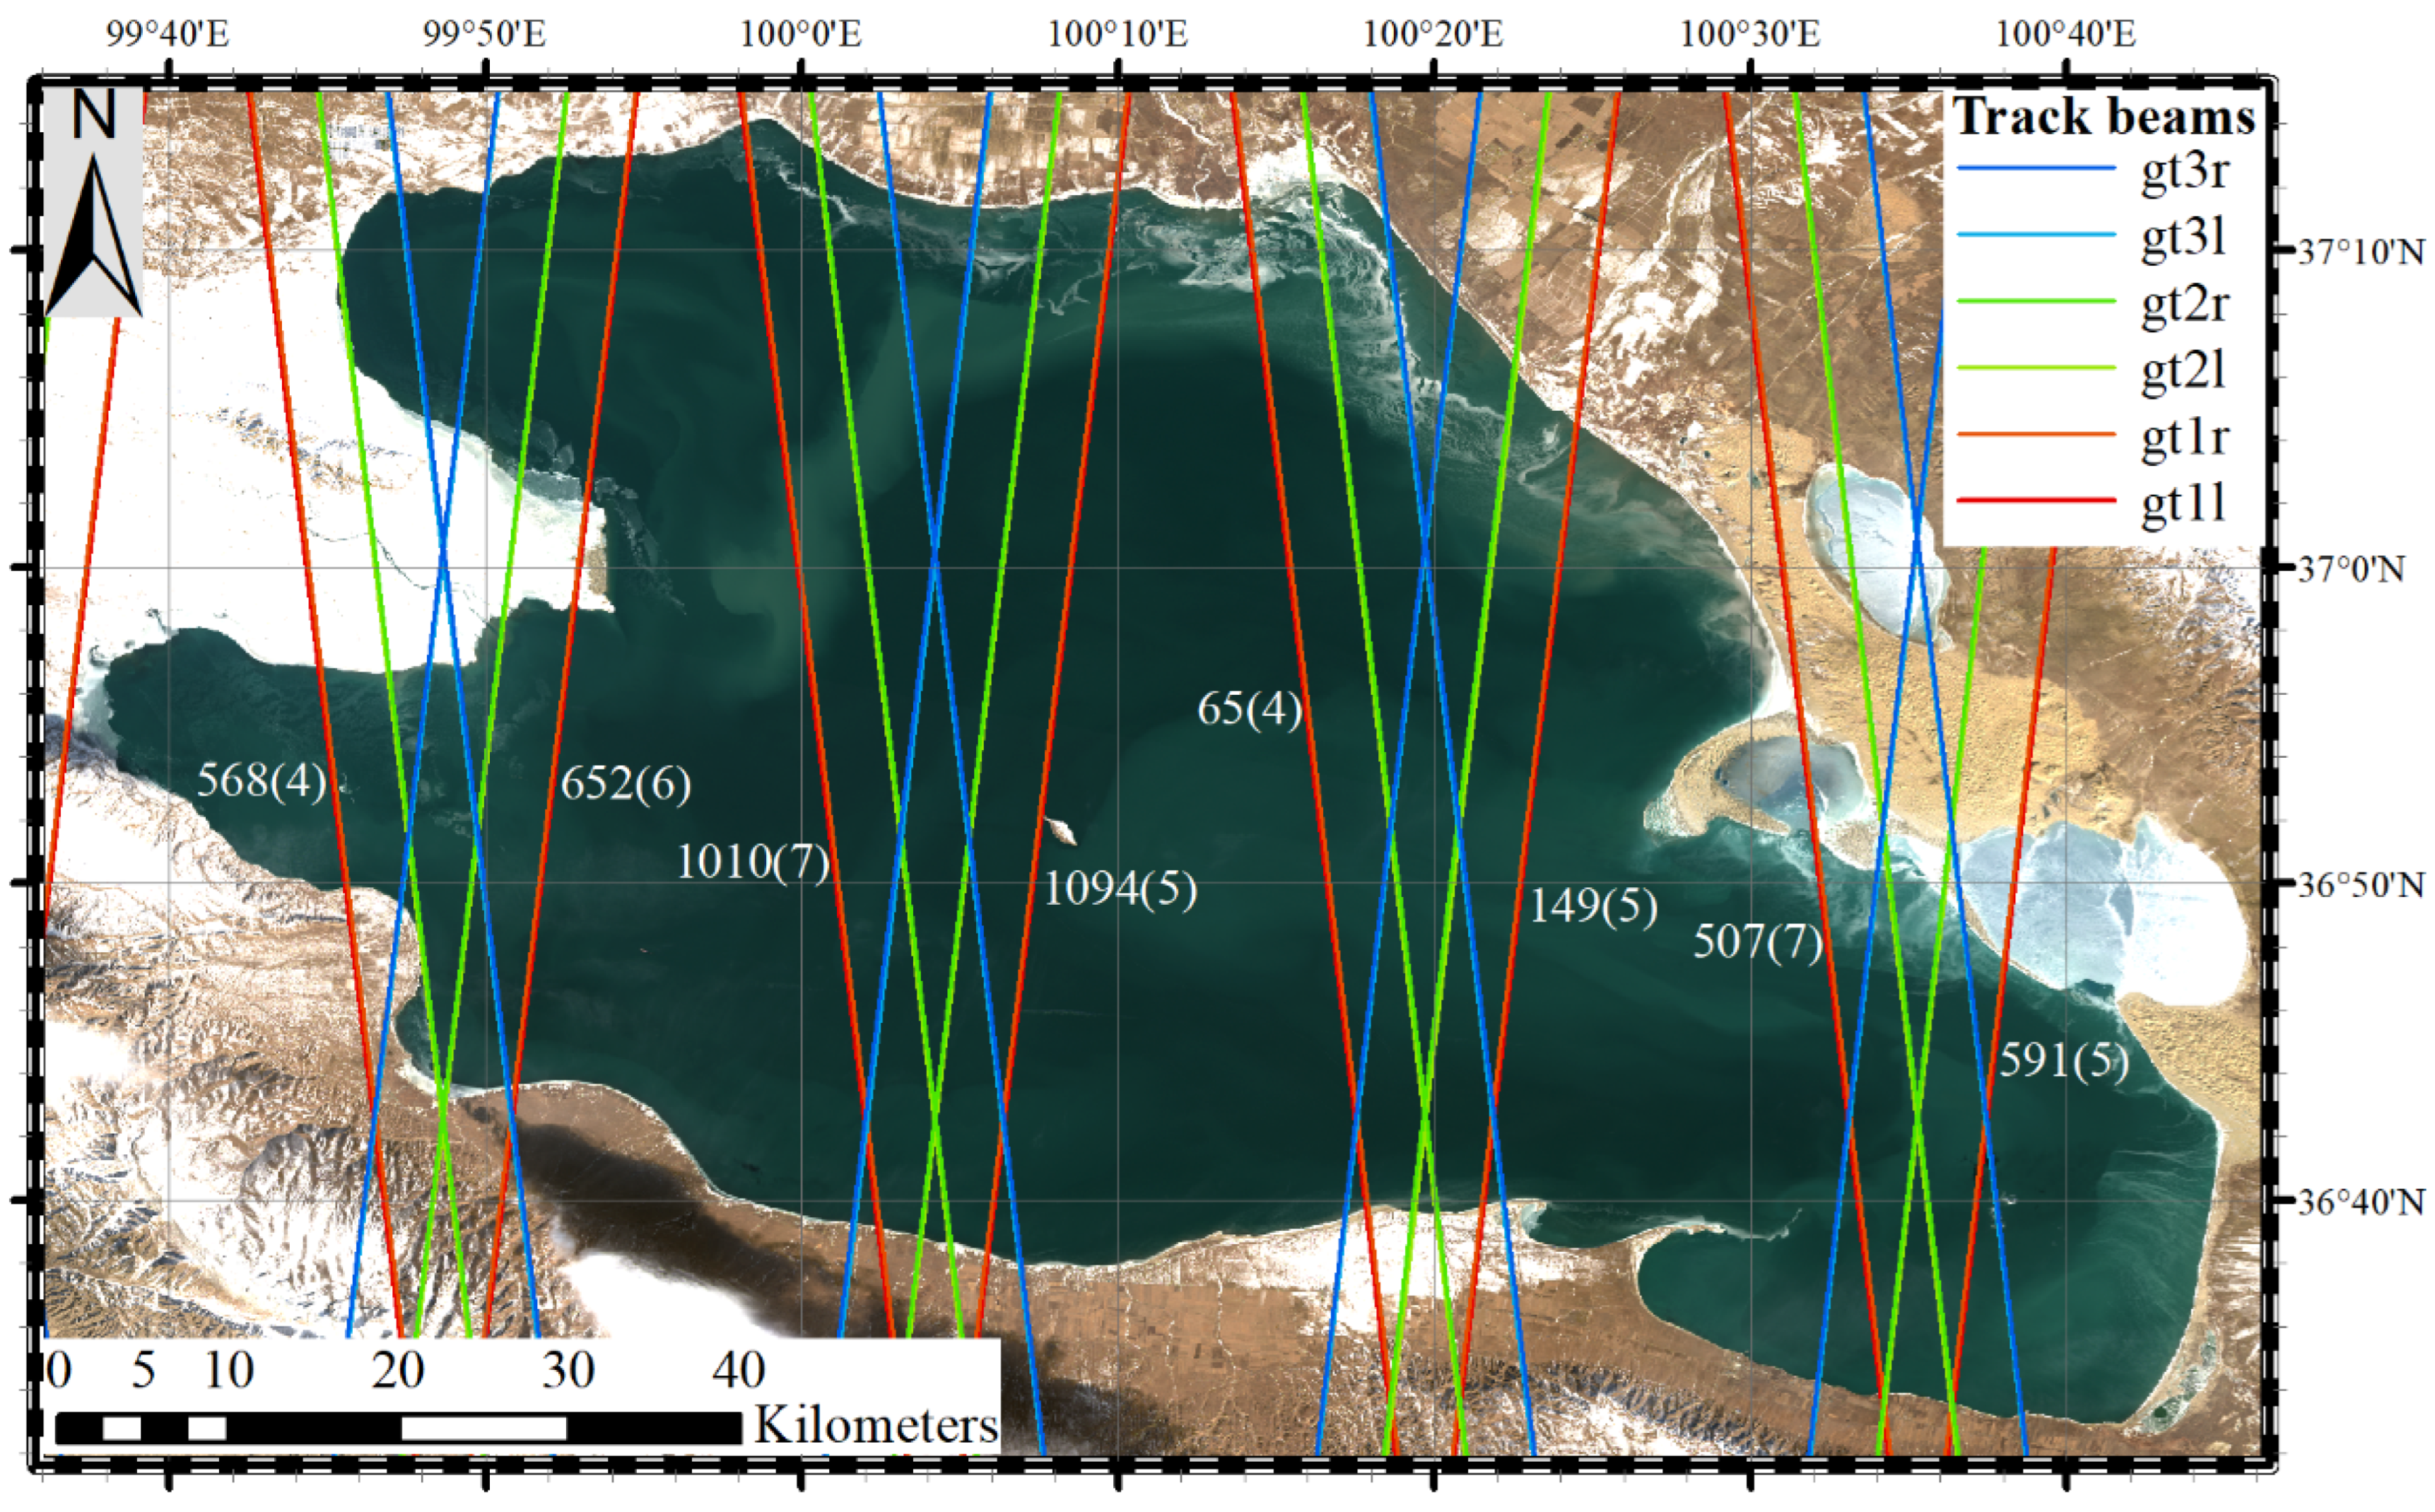
2.2.2. ICESat-2
2.2.3. Hydrological Station
2.2.4. Land/Water Mask
2.2.5. NASADEM
3. Methodology
3.1. ICESat
3.1.1. ICESat Reference Ellipsoid and Datum Transform
3.1.2. ICESat Preprocessing
3.2. ICESat-2
3.2.1. ICESat-2 Reference Ellipsoid and Datum
3.2.2. ICESat-2 Preprocessing
3.3. Reference Ellipsoid and Datum Transform of Hydrological Station
3.4. Outlier Removal
4. Results
4.1. ICESat
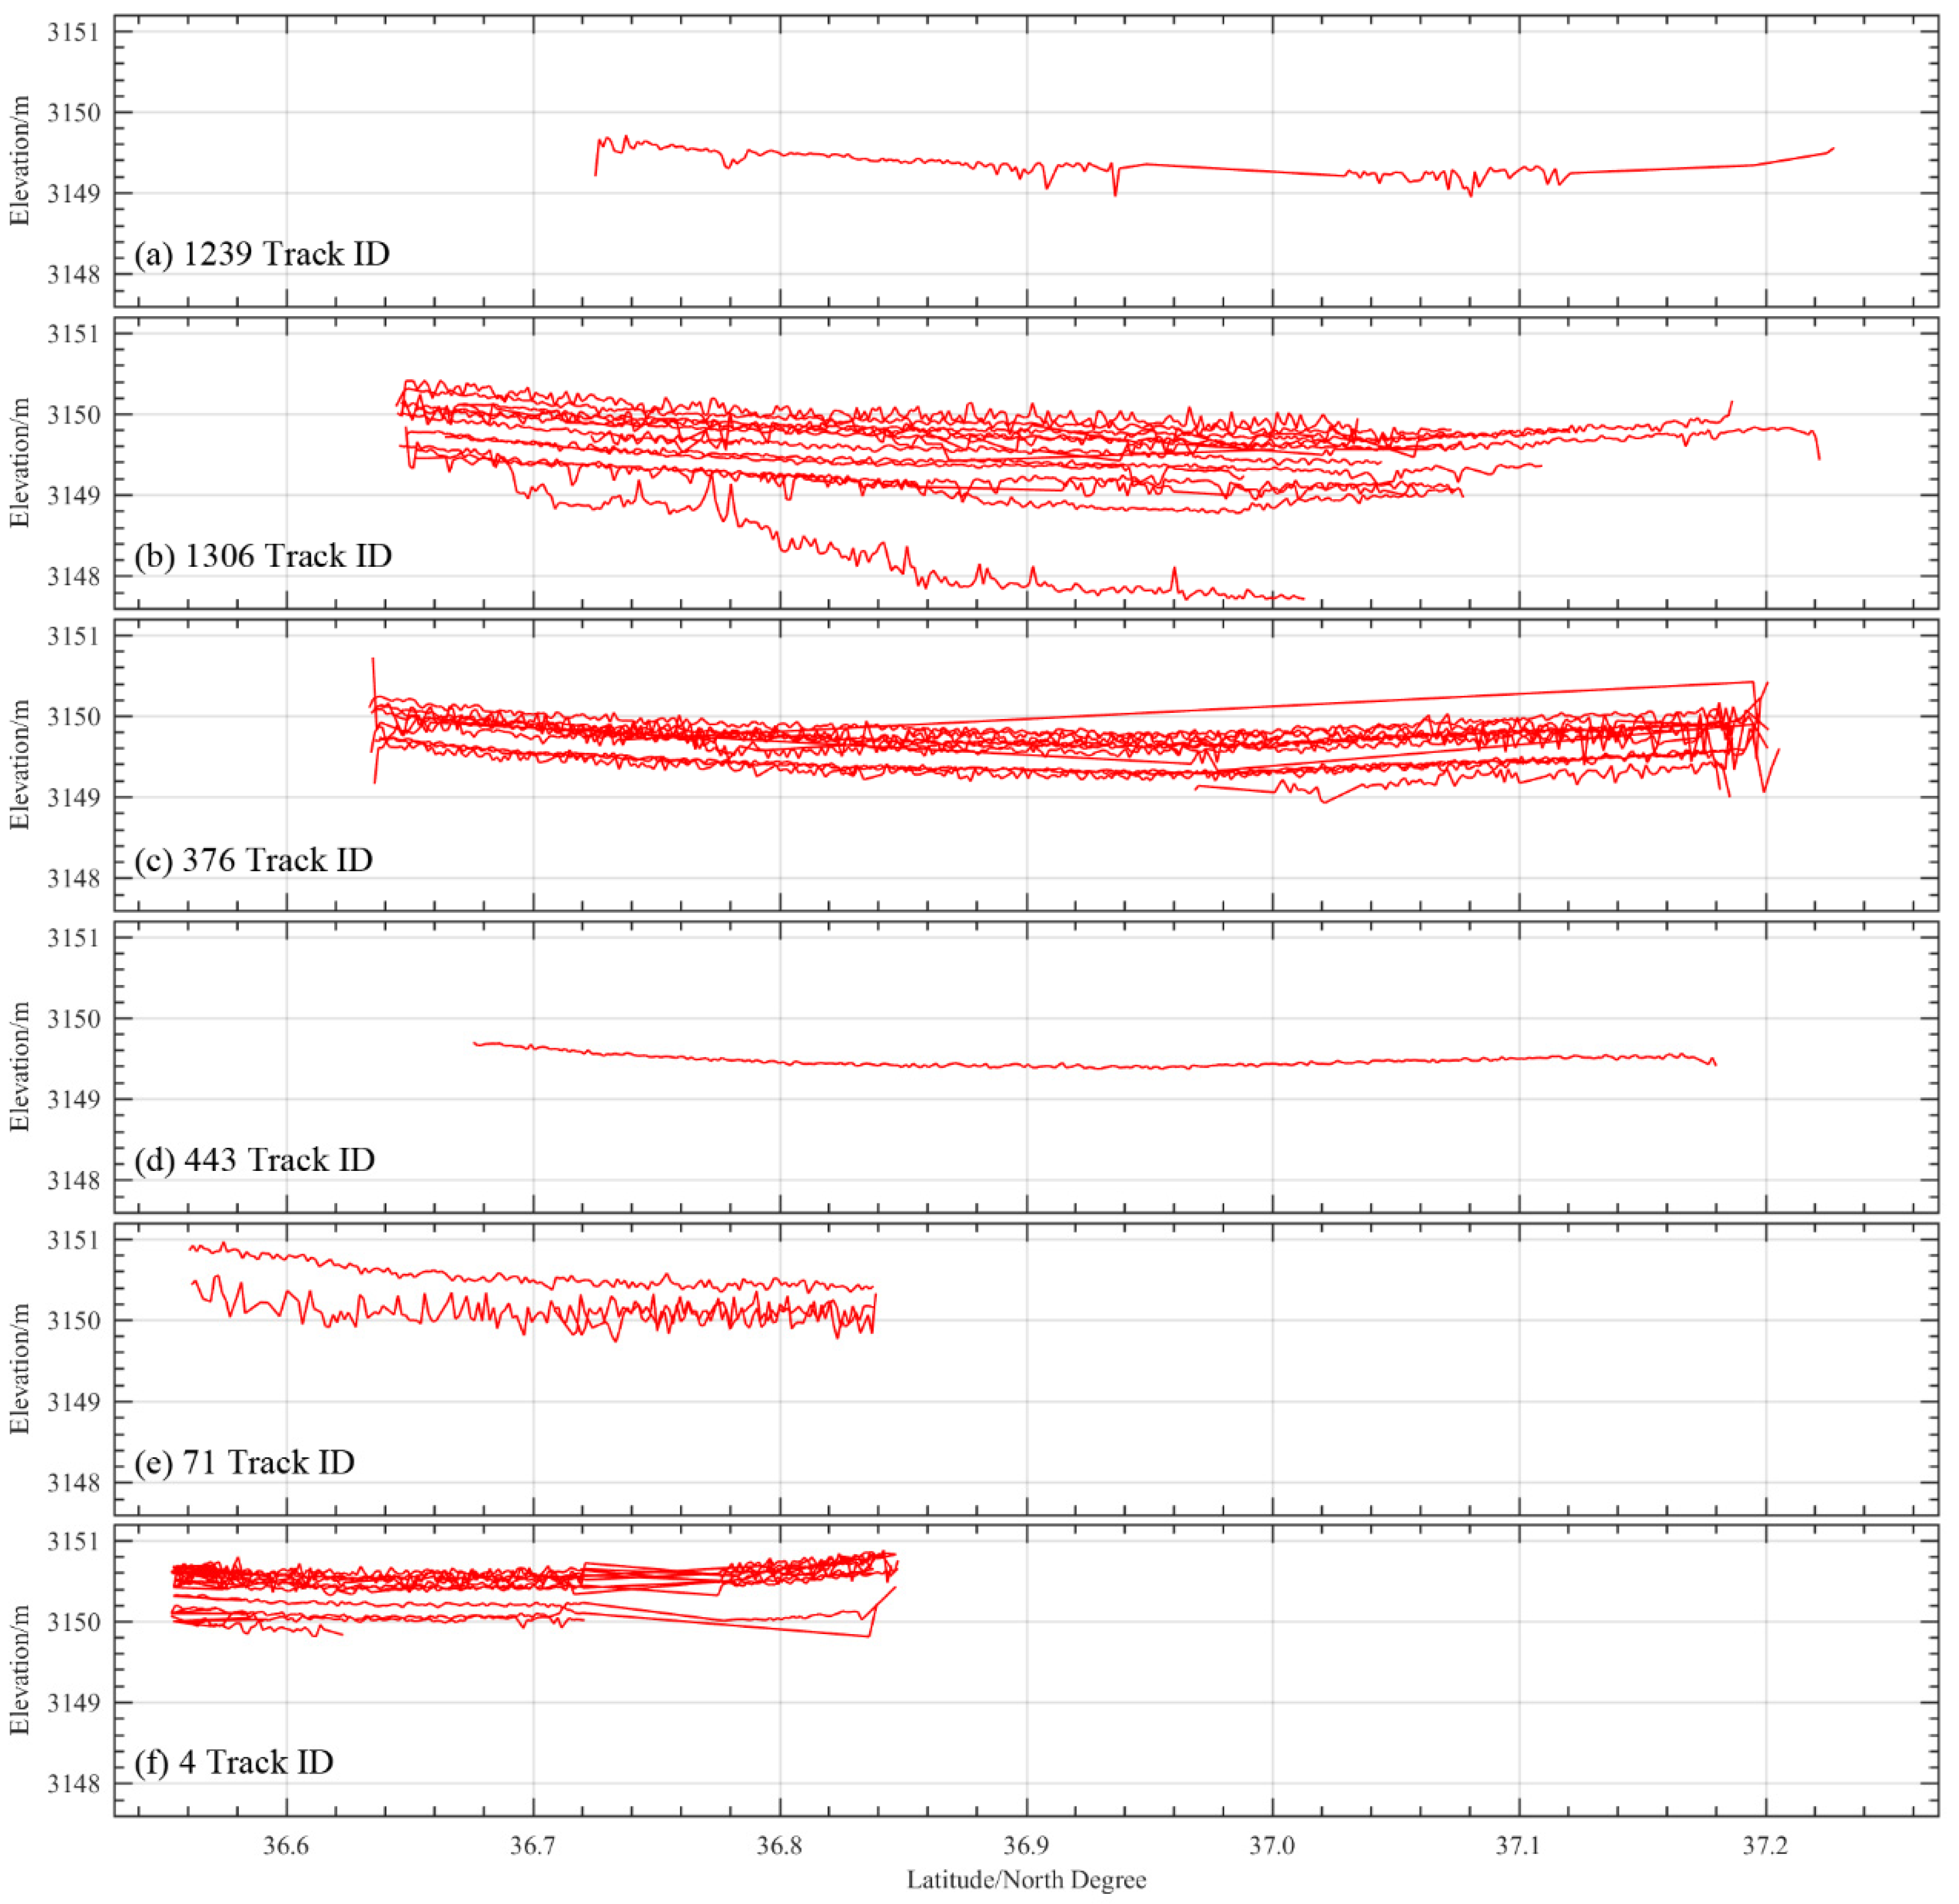
4.1.1. ICESat Outlier Removal
4.1.2. ICESat EGM2008 Geoid and Ellipsoid Transfer
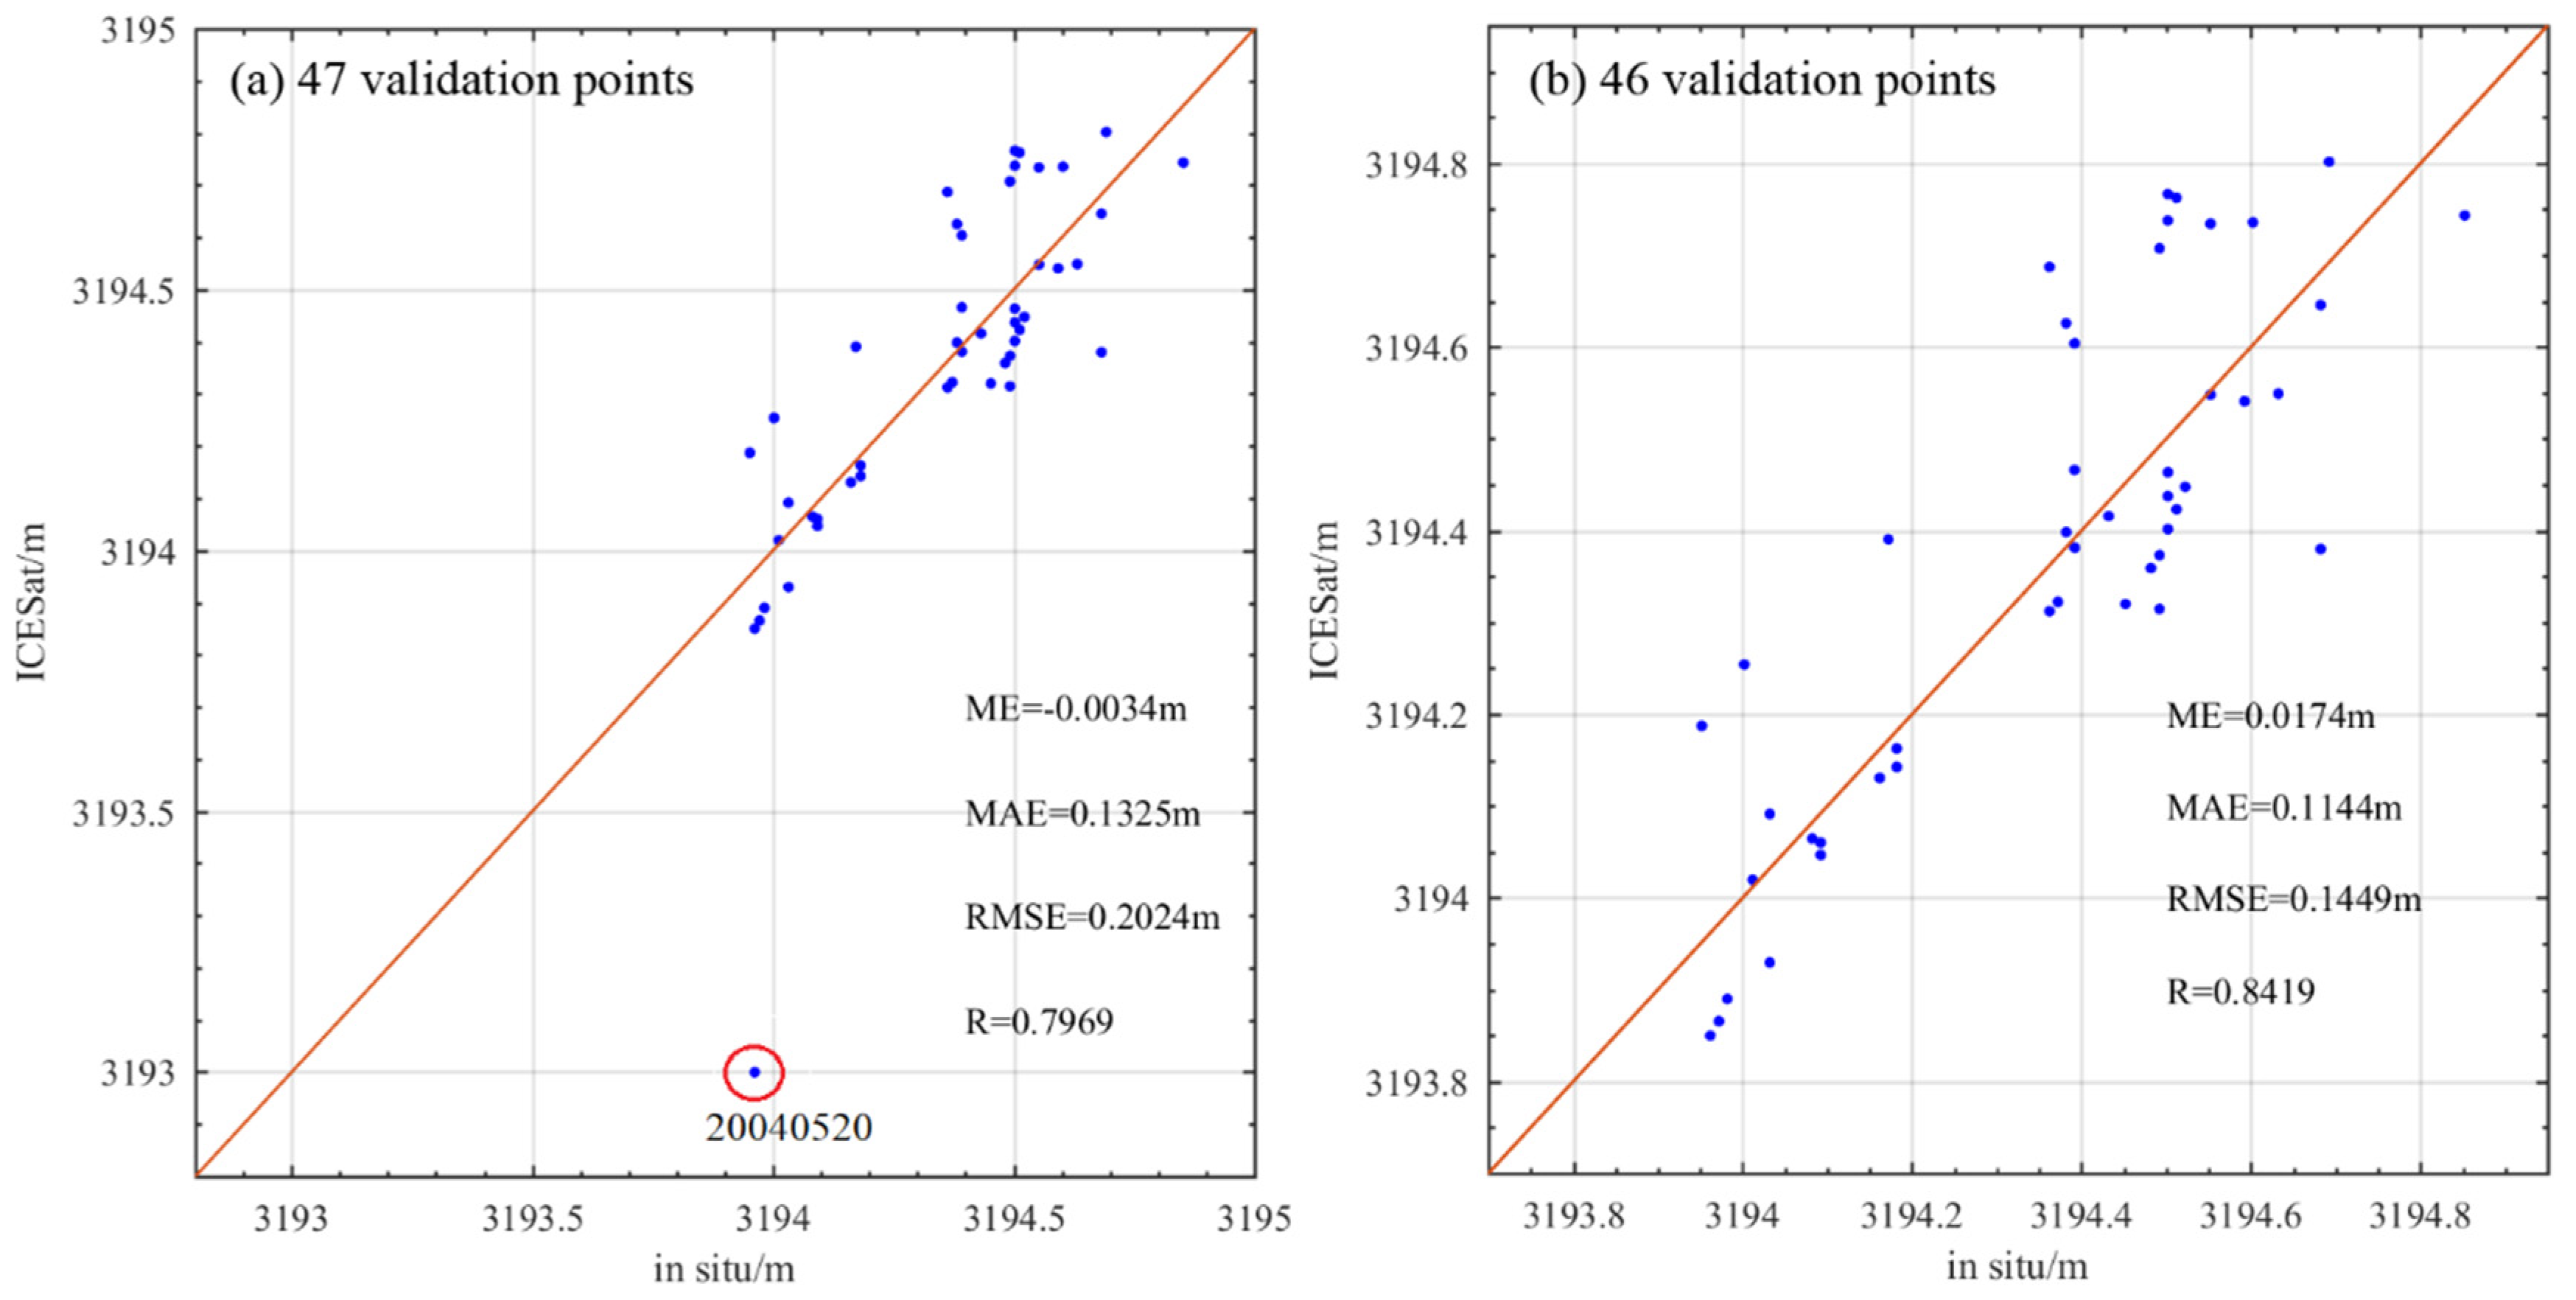
4.1.3. Validation of ICESat
4.2. ICESat-2
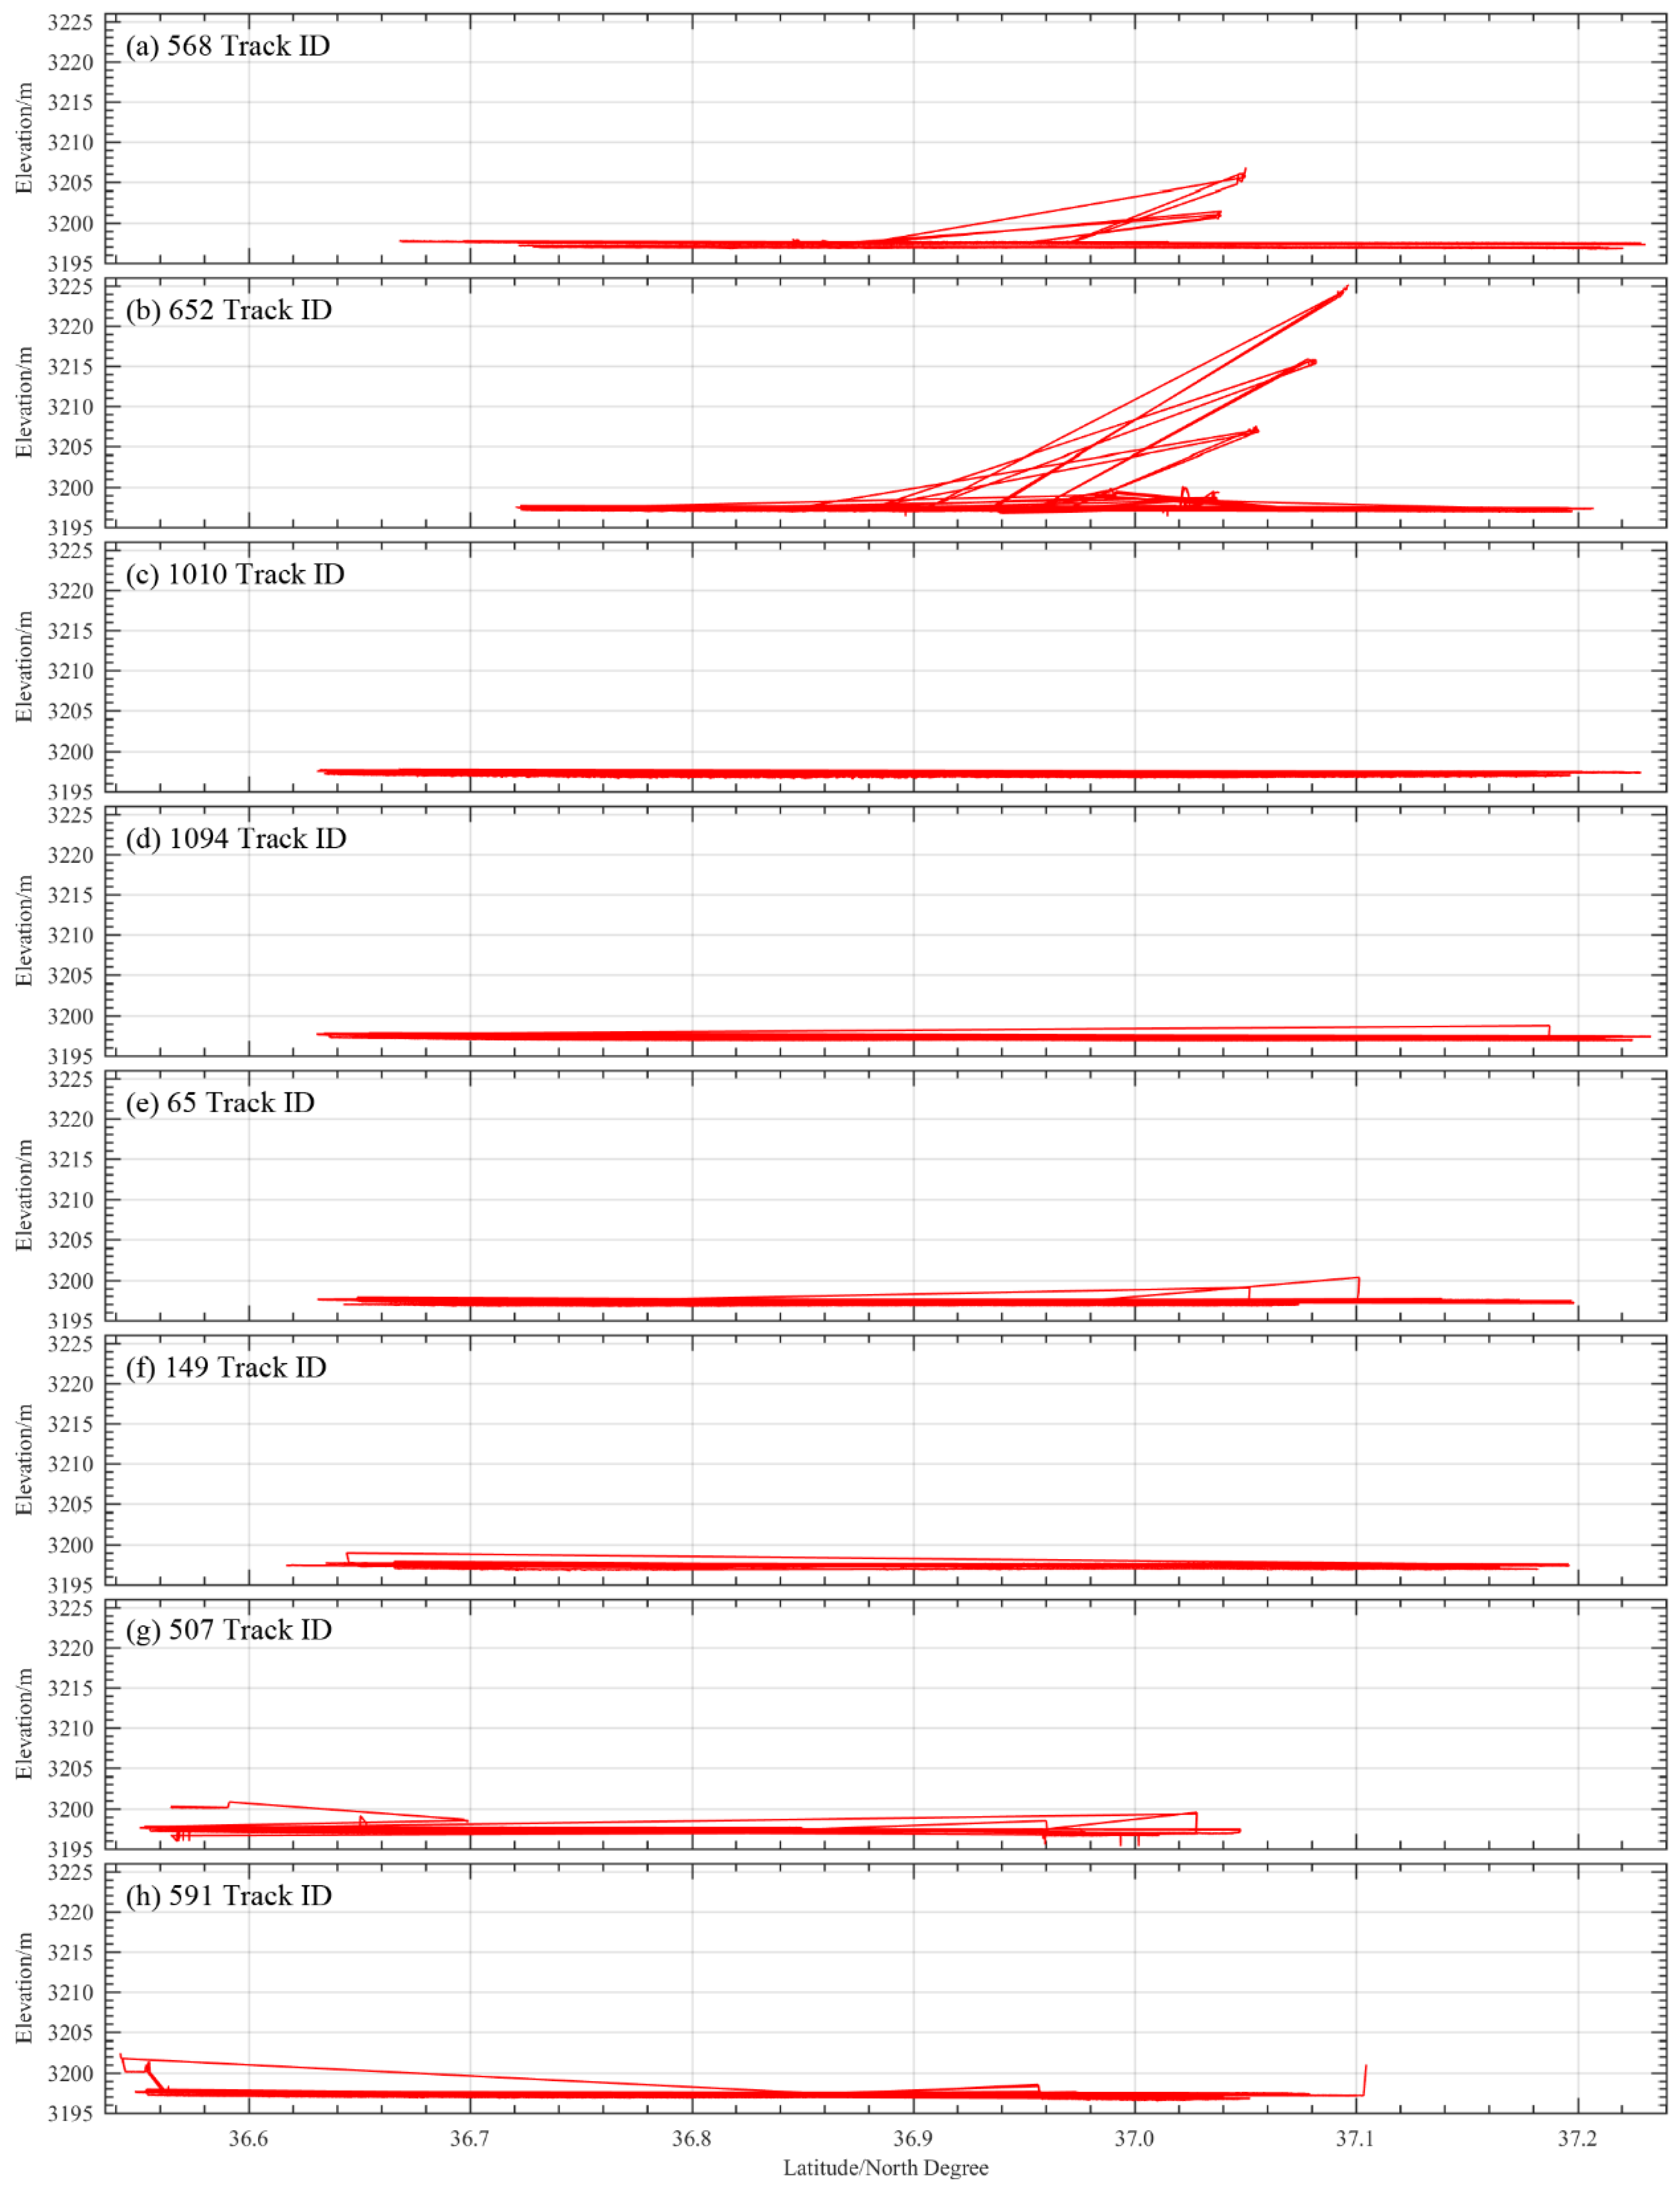
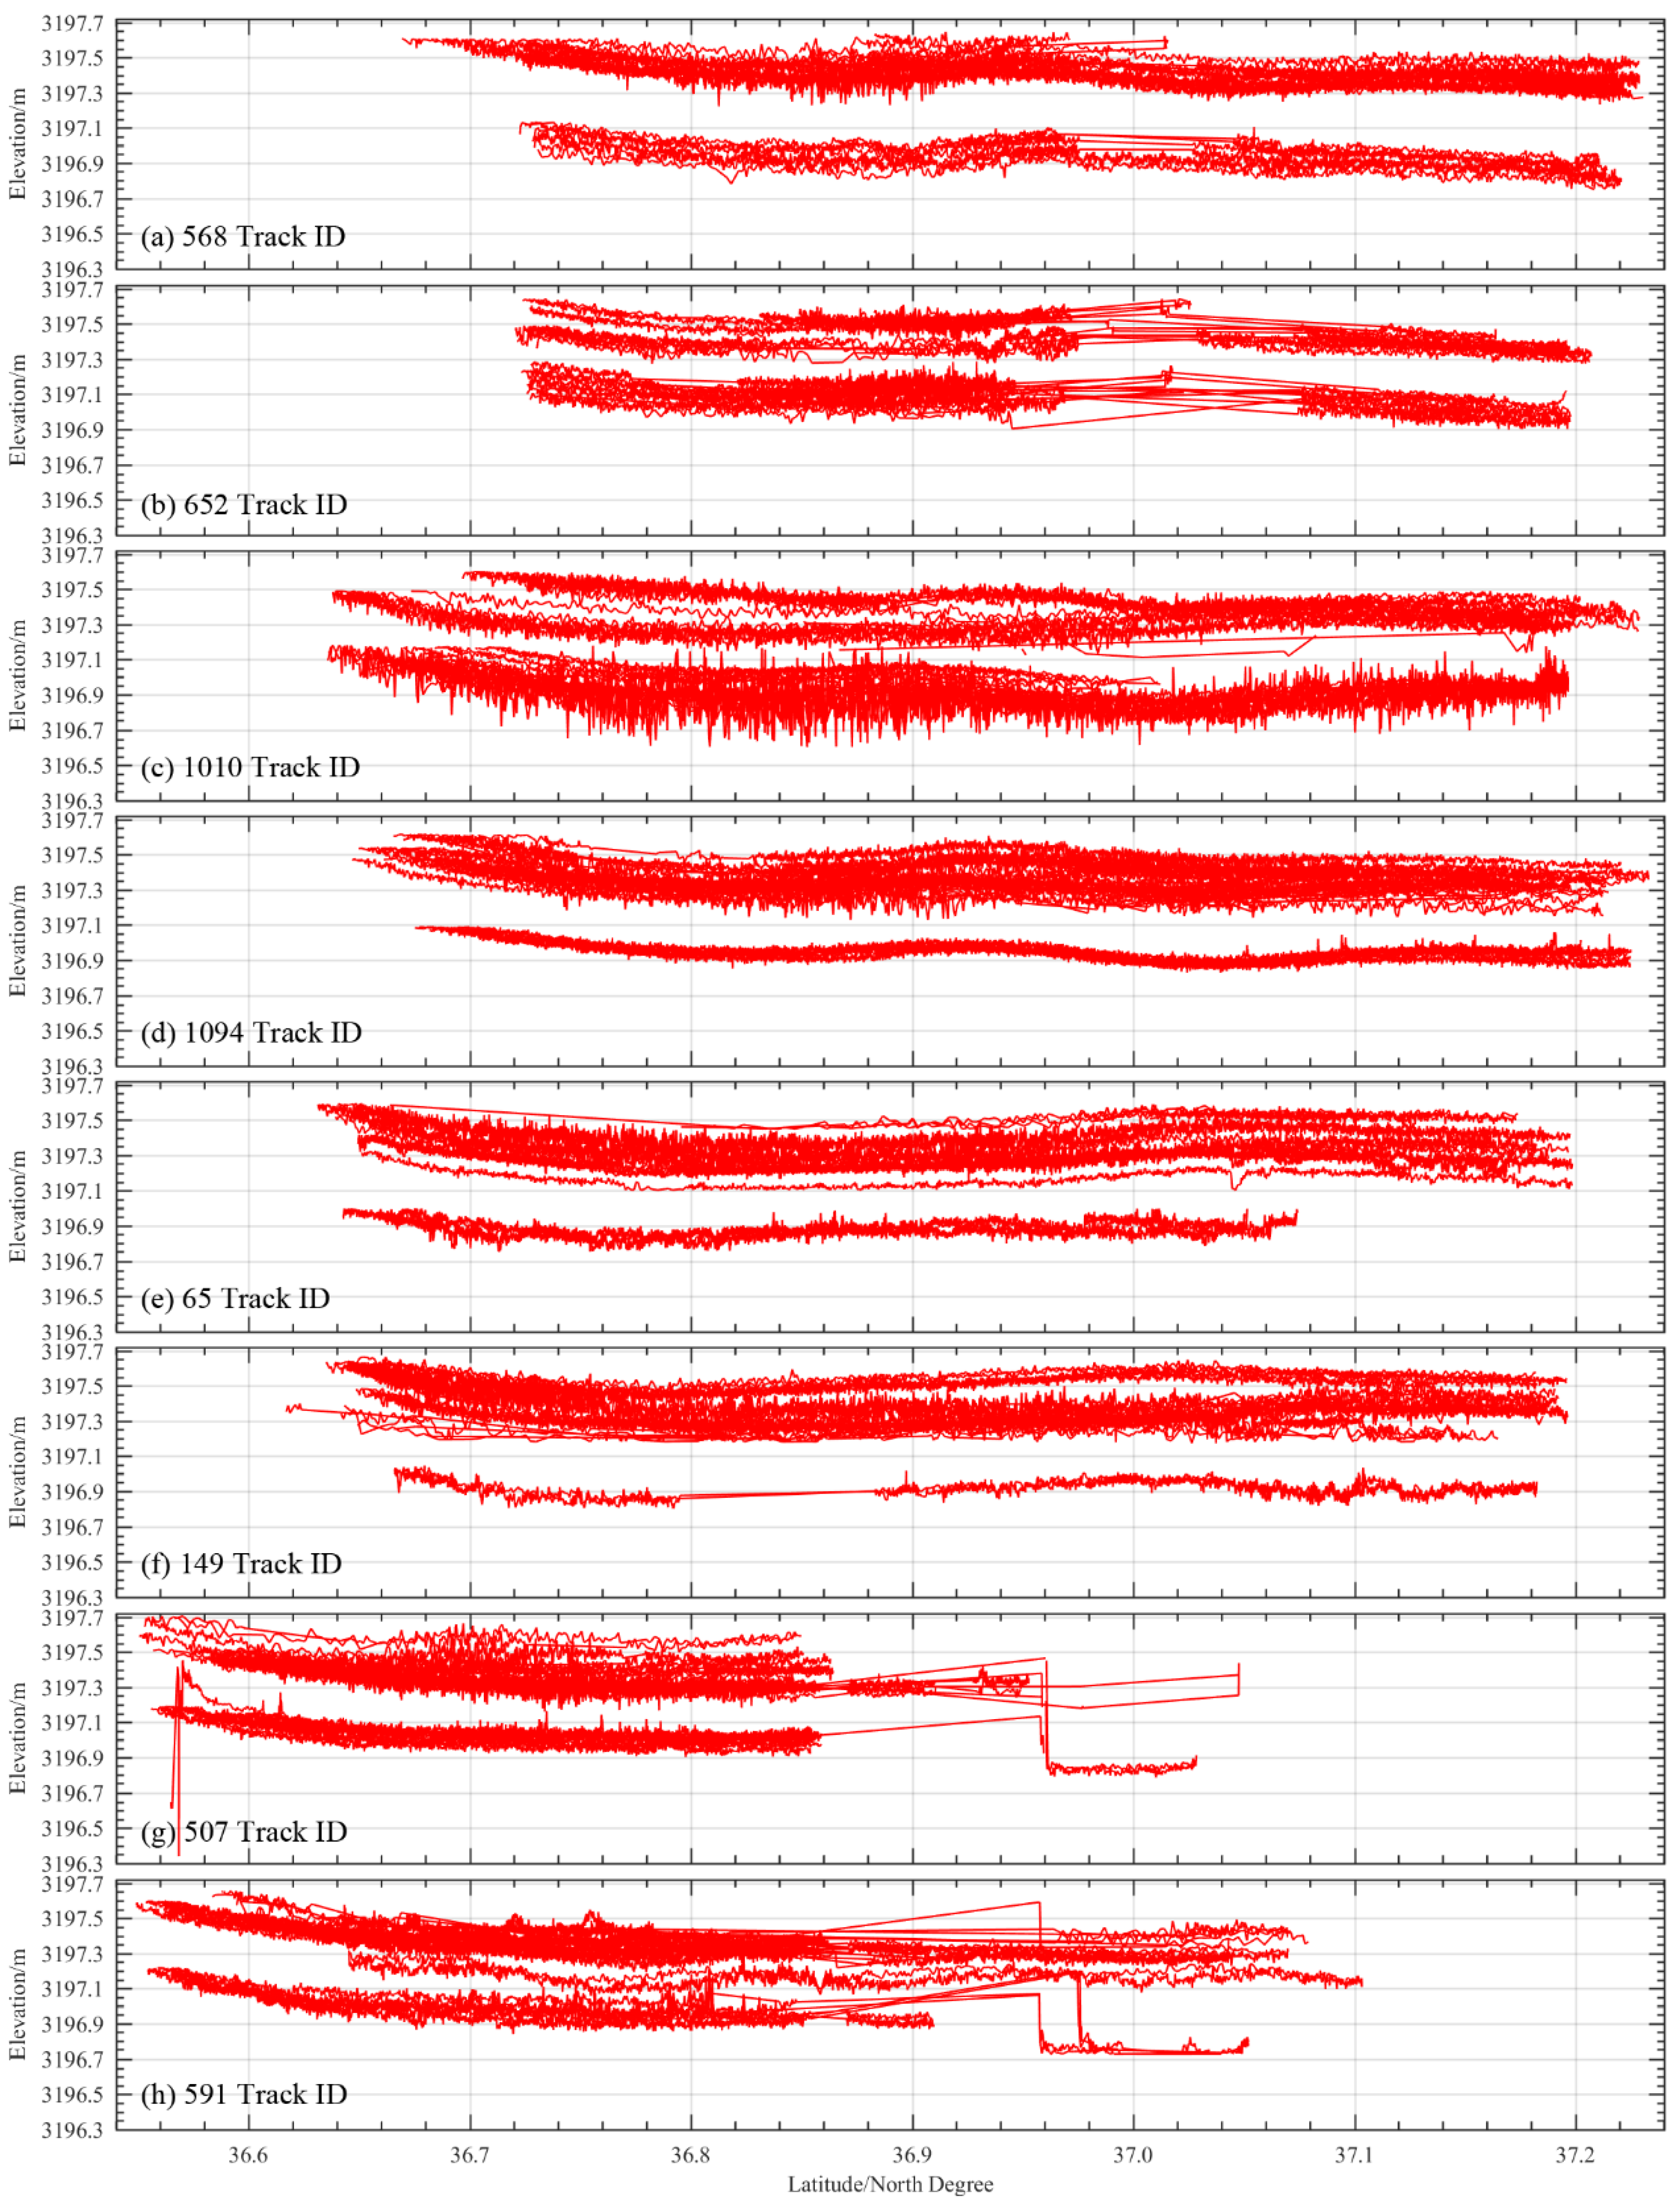
4.2.1. ICESat-2 Outlier Removal
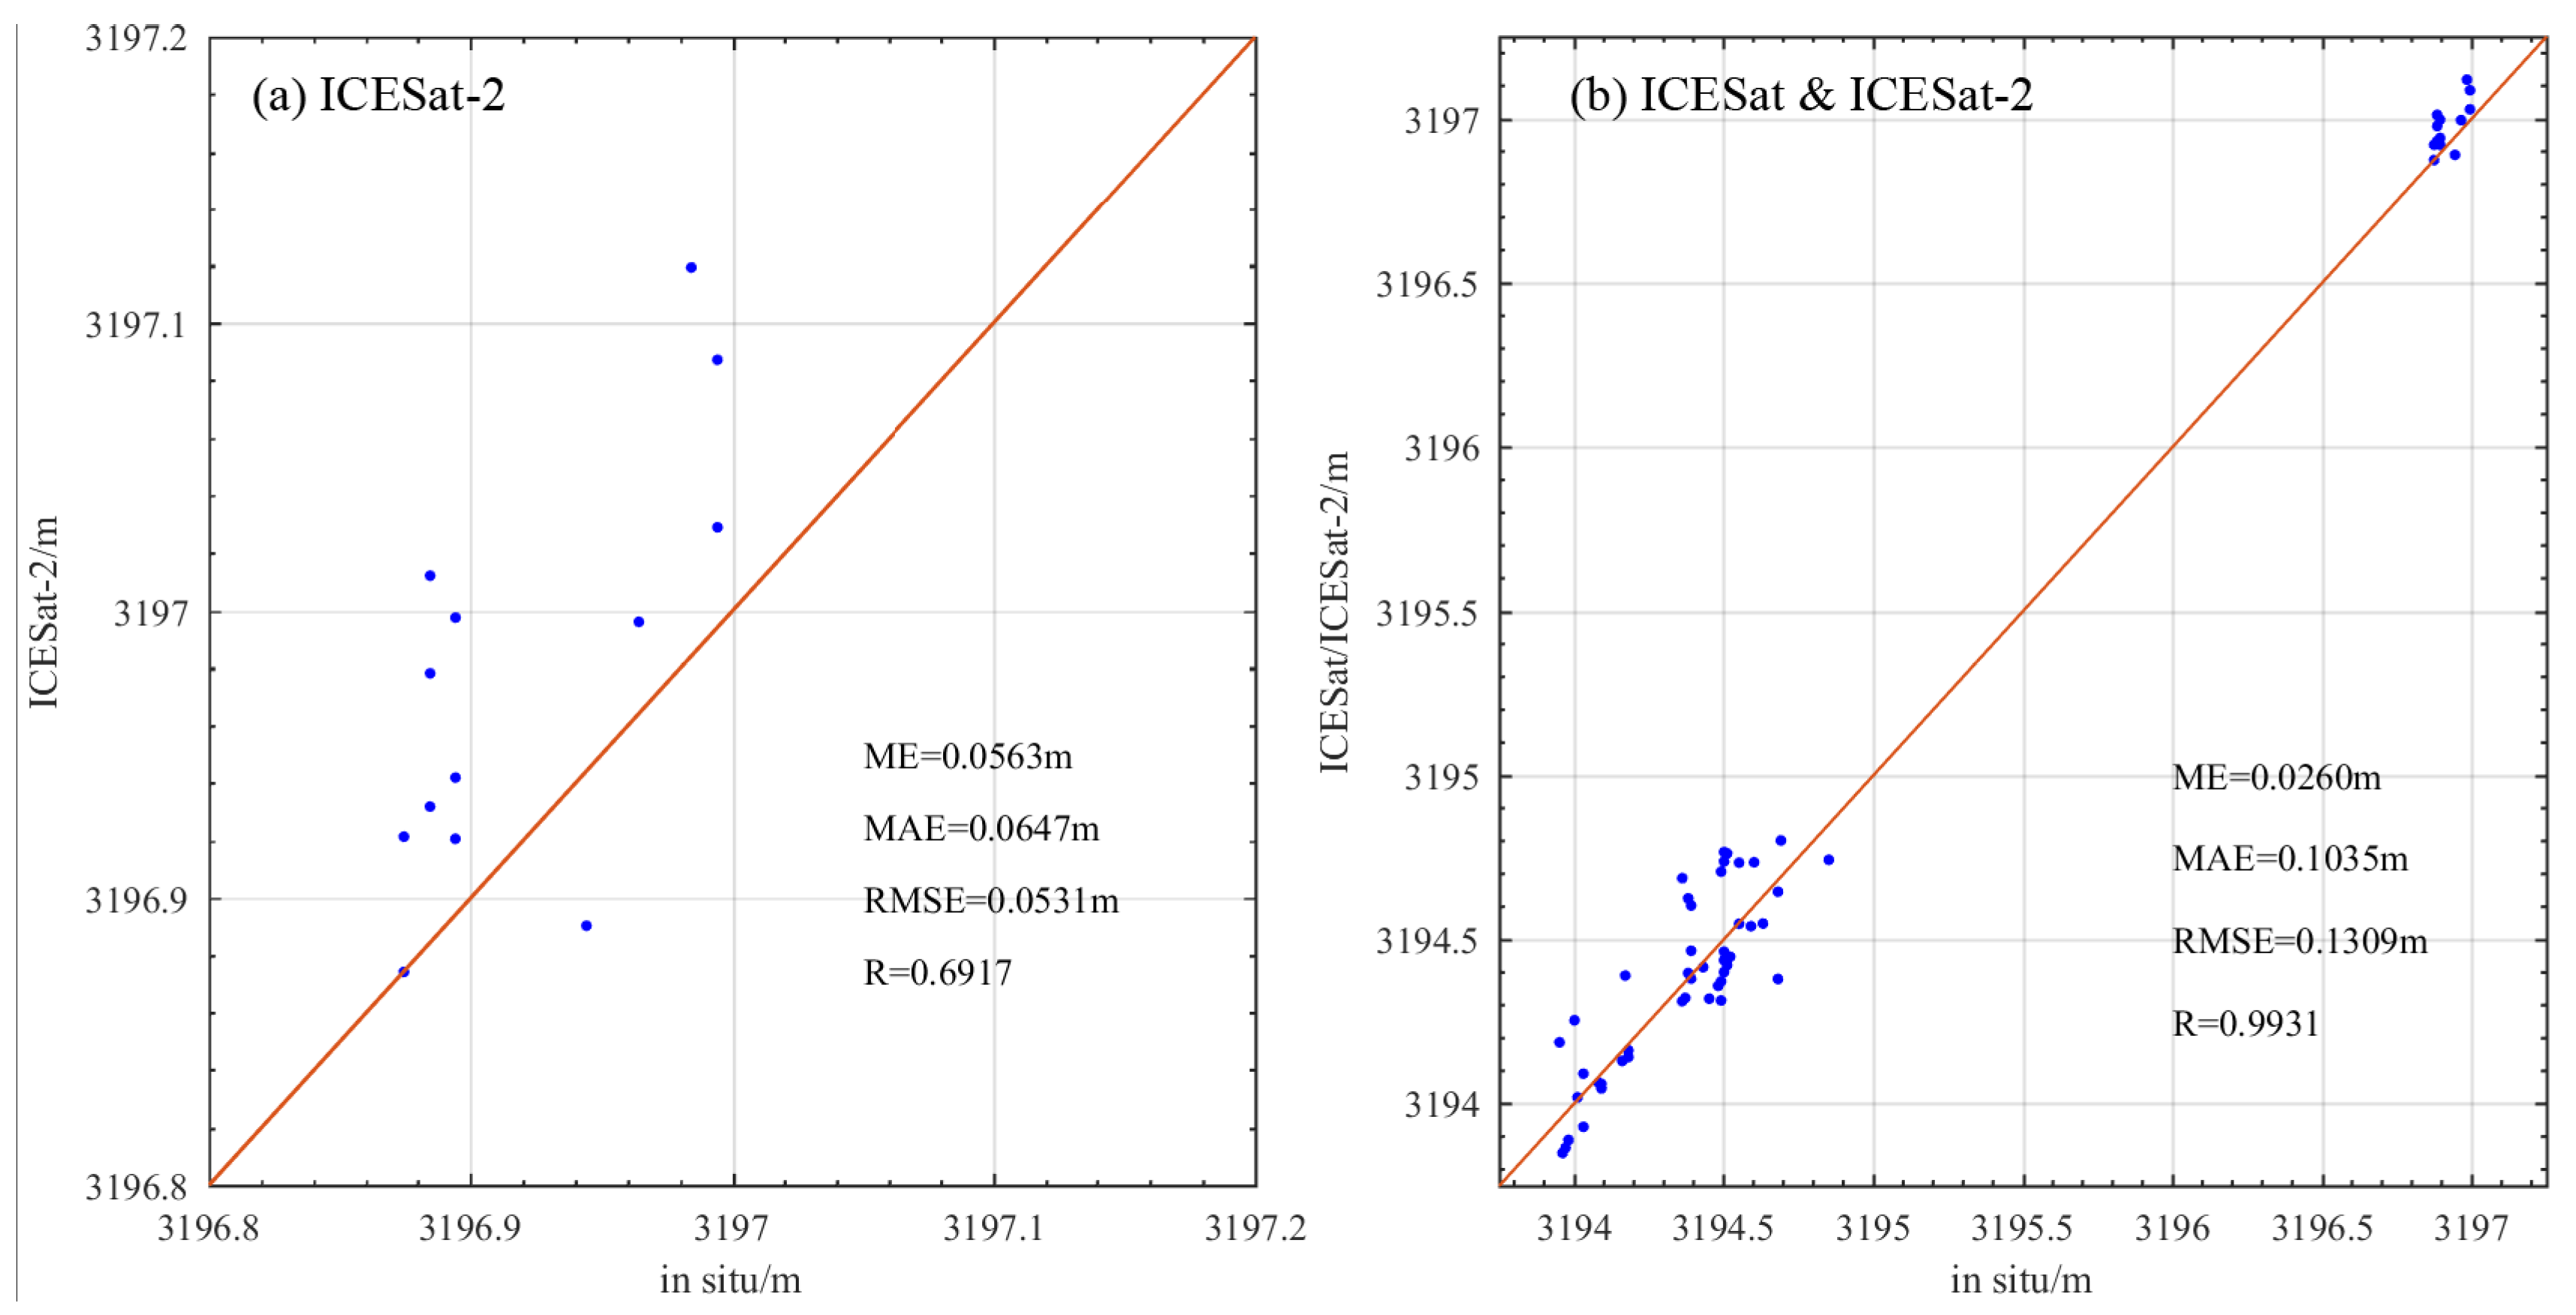
4.2.2. Validation of ICESat-2
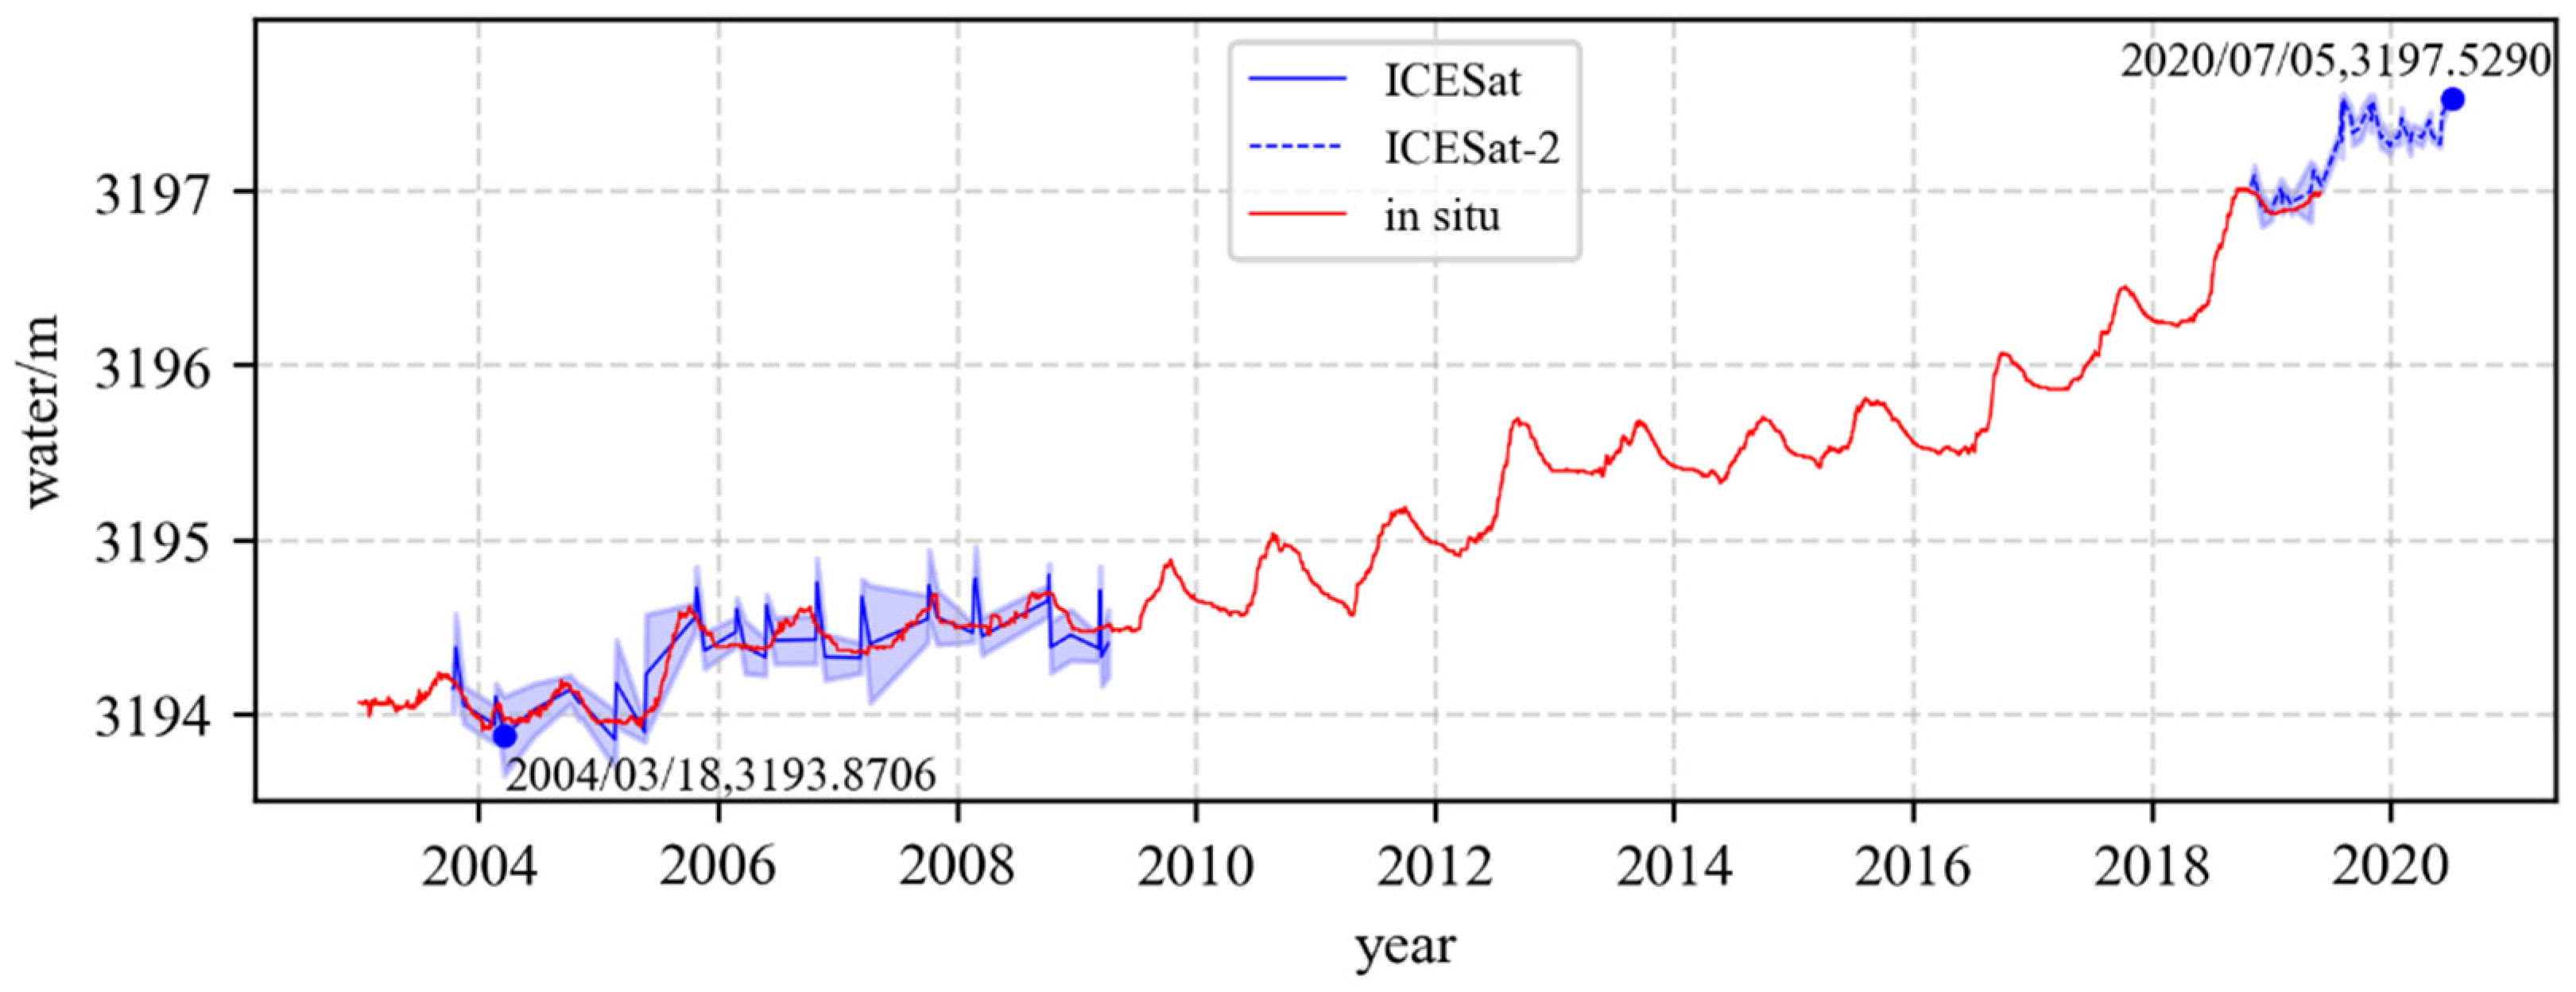
4.3. Water-Level Change in 2003–2020
5. Discussion
6. Conclusions
Author Contributions
Funding
Data Availability Statement
Acknowledgments
Conflicts of Interest
Appendix A

| Date | Track | M | MAD | Min | Max | |||
|---|---|---|---|---|---|---|---|---|
| 14/10/2003 | 1239 | 3149.3610 | 0.1040 | 0.1542 | 3148.8984 | 3149.8236 | 3148.5610 | 3153.1570 |
| 18/10/2003 | 1306 | 3149.4170 | 0.0840 | 0.1245 | 3149.0434 | 3149.7906 | 3148.8500 | 3151.4060 |
| 22/10/2003 | 4 | 3150.2190 | 0.0505 | 0.0749 | 3149.9944 | 3150.4436 | 3148.4040 | 3150.4320 |
| 16/11/2003 | 376 | 3149.4080 | 0.0820 | 0.1216 | 3149.0433 | 3149.7727 | 3149.2410 | 3152.5610 |
| 19/02/2004 | 1306 | 3149.1740 | 0.0660 | 0.0979 | 3148.8804 | 3149.4676 | 3148.8750 | 3152.0230 |
| 22/02/2004 | 4 | 3149.9235 | 0.0375 | 0.0556 | 3149.7567 | 3150.0903 | 3149.8150 | 3150.1460 |
| 18/03/2004 | 376 | 3149.2780 | 0.1080 | 0.1601 | 3148.7976 | 3149.7584 | 3148.7590 | 3152.5040 |
| 20/05/2004 | 1306 | 3148.2990 | 0.4960 | 0.7354 | 3146.0929 | 3150.5051 | 3147.7000 | 3154.0590 |
| 17/06/2004 | 376 | 3149.3685 | 0.0865 | 0.1282 | 3148.9838 | 3149.7532 | 3148.0690 | 3152.5780 |
| 06/10/2004 | 1306 | 3149.4110 | 0.0720 | 0.1067 | 3149.0908 | 3149.7312 | 3149.0970 | 3156.9160 |
| 03/11/2004 | 376 | 3149.4270 | 0.0870 | 0.1290 | 3149.0400 | 3149.8140 | 3148.2100 | 3152.2790 |
| 08/11/2004 | 443 | 3149.4660 | 0.0525 | 0.0778 | 3149.2325 | 3149.6995 | 3148.1810 | 3152.5440 |
| 20/02/2005 | 1306 | 3149.0840 | 0.2110 | 0.3128 | 3148.1455 | 3150.0225 | 3148.7600 | 3152.6270 |
| 24/02/2005 | 4 | 3150.0160 | 0.0525 | 0.0778 | 3149.7825 | 3150.2495 | 3149.1380 | 3154.2530 |
| 22/05/2005 | 1306 | 3149.1085 | 0.0565 | 0.0838 | 3148.8572 | 3149.3598 | 3148.9580 | 3149.4390 |
| 26/05/2005 | 4 | 3150.0560 | 0.0670 | 0.0993 | 3149.7580 | 3150.3540 | 3147.7580 | 3150.1950 |
| 23/10/2005 | 1306 | 3149.7940 | 0.0730 | 0.1082 | 3149.4693 | 3150.1187 | 3149.6490 | 3151.0830 |
| 27/10/2005 | 4 | 3150.5720 | 0.0380 | 0.0563 | 3150.4030 | 3150.7410 | 3150.3310 | 3150.7940 |
| 21/11/2005 | 376 | 3149.7135 | 0.0885 | 0.1312 | 3149.3199 | 3150.1071 | 3148.4730 | 3152.3130 |
| 24/02/2006 | 1306 | 3149.7195 | 0.1040 | 0.1542 | 3149.2569 | 3150.1821 | 3149.4930 | 3151.7300 |
| 27/02/2006 | 4 | 3150.4430 | 0.0380 | 0.0563 | 3150.2740 | 3150.6120 | 3150.3620 | 3150.6850 |
| 24/03/2006 | 376 | 3149.7350 | 0.0810 | 0.1201 | 3149.3747 | 3150.0953 | 3148.0560 | 3152.6870 |
| 26/05/2006 | 1306 | 3149.5785 | 0.0980 | 0.1453 | 3149.1426 | 3150.0144 | 3149.3570 | 3153.2280 |
| 29/05/2006 | 4 | 3150.4790 | 0.0510 | 0.0756 | 3150.2522 | 3150.7058 | 3150.3210 | 3150.7280 |
| 23/06/2006 | 376 | 3149.7880 | 0.0980 | 0.1453 | 3149.3521 | 3150.2239 | 3149.1770 | 3152.6930 |
| 27/10/2006 | 1306 | 3149.6705 | 0.0735 | 0.1090 | 3149.3436 | 3149.9974 | 3149.2910 | 3150.4330 |
| 30/10/2006 | 4 | 3150.6190 | 0.0770 | 0.1142 | 3150.2765 | 3150.9615 | 3150.3350 | 3151.9620 |
| 24/11/2006 | 376 | 3149.6630 | 0.0750 | 0.1112 | 3149.3294 | 3149.9966 | 3149.3330 | 3151.1560 |
| 13/03/2007 | 1306 | 3149.6620 | 0.0360 | 0.0534 | 3149.5019 | 3149.8221 | 3149.5200 | 3150.0200 |
| 17/03/2007 | 4 | 3150.5620 | 0.0670 | 0.0993 | 3150.2640 | 3150.8600 | 3150.3220 | 3158.2440 |
| 11/04/2007 | 376 | 3149.8600 | 0.3165 | 0.4692 | 3148.4523 | 3151.2677 | 3149.3190 | 3153.1860 |
| 04/10/2007 | 1306 | 3149.8580 | 0.1255 | 0.1861 | 3149.2998 | 3150.4162 | 3149.4610 | 4781.5790 |
| 08/10/2007 | 4 | 3150.6580 | 0.0600 | 0.0890 | 3150.3911 | 3150.9249 | 3150.3280 | 3151.2490 |
| 02/11/2007 | 376 | 3149.9015 | 0.0850 | 0.1260 | 3149.5234 | 3150.2796 | 3148.5240 | 3152.4240 |
| 19/02/2008 | 1306 | 3149.8020 | 0.1045 | 0.1549 | 3149.3372 | 3150.2668 | 3149.5480 | 3173.1230 |
| 22/02/2008 | 4 | 3150.5820 | 0.0595 | 0.0882 | 3150.3174 | 3150.8466 | 3150.4190 | 3150.8590 |
| 27/02/2008 | 71 | 3150.5230 | 0.1050 | 0.1557 | 3150.0560 | 3150.9900 | 3150.3240 | 3153.7340 |
| 18/03/2008 | 376 | 3149.7730 | 0.0520 | 0.0771 | 3149.5417 | 3150.0043 | 3149.4270 | 3151.3500 |
| 06/10/2008 | 1306 | 3149.9030 | 0.0930 | 0.1379 | 3149.4894 | 3150.3166 | 3149.6300 | 3152.2210 |
| 09/10/2008 | 4 | 3150.6310 | 0.0480 | 0.0712 | 3150.4175 | 3150.8445 | 3150.4000 | 3150.8650 |
| 14/10/2008 | 71 | 3150.1200 | 0.1095 | 0.1623 | 3149.6330 | 3150.6070 | 3149.8110 | 3153.4950 |
| 14/12/2008 | 376 | 3149.8105 | 0.0865 | 0.1282 | 3149.4258 | 3150.1952 | 3149.3640 | 3155.9920 |
| 10/03/2009 | 1306 | 3149.6260 | 0.0510 | 0.0756 | 3149.3992 | 3149.8528 | 3149.4120 | 3149.7290 |
| 14/03/2009 | 4 | 3150.5730 | 0.0670 | 0.0993 | 3150.2750 | 3150.8710 | 3150.3550 | 3154.2580 |
| 18/03/2009 | 71 | 3150.0755 | 0.1085 | 0.1609 | 3149.5929 | 3150.5581 | 3149.7200 | 3153.3600 |
| 08/04/2009 | 376 | 3149.8580 | 0.1830 | 0.2713 | 3149.0441 | 3150.6719 | 3149.6370 | 3152.5690 |
| 02/10/2009 | 1306 | 3150.0040 | 0.0940 | 0.1394 | 3149.5859 | 3150.4221 | 3149.6200 | 3152.6030 |
| Date | ICESat/m | In Situ/m | Bias/m | Date | ICESat/m | In Situ/m | Bias/m |
|---|---|---|---|---|---|---|---|
| 14/10/2003 | 3194.1426 | 3194.1822 | −0.0396 | 23/06/2006 | 3194.4160 | 3194.4322 | −0.0162 |
| 18/10/2003 | 3194.1629 | 3194.1822 | −0.0193 | 27/10/2006 | 3194.4231 | 3194.5122 | −0.0891 |
| 22/10/2003 | 3194.3903 | 3194.1722 | 0.2181 | 30/10/2006 | 3194.7624 | 3194.5122 | 0.2502 |
| 16/11/2003 | 3194.0468 | 3194.0922 | −0.0454 | 24/11/2006 | 3194.3200 | 3194.4522 | −0.1322 |
| 19/02/2004 | 3193.9296 | 3194.0322 | −0.1026 | 13/03/2007 | 3194.3122 | 3194.3622 | −0.0500 |
| 22/02/2004 | 3194.0914 | 3194.0322 | 0.0592 | 17/03/2007 | 3194.6874 | 3194.3622 | 0.3252 |
| 18/03/2004 | 3193.8656 | 3193.9722 | −0.1066 | 11/04/2007 | 3194.3986 | 3194.3822 | 0.0164 |
| 20/05/2004 | 3193.0000 | 3193.9622 | −0.9622 | 04/10/2007 | 3194.5407 | 3194.5922 | −0.0515 |
| 17/06/2004 | 3194.0195 | 3194.0122 | 0.0073 | 08/10/2007 | 3194.7357 | 3194.6022 | 0.1335 |
| 06/10/2004 | 3194.1307 | 3194.1622 | −0.0315 | 02/11/2007 | 3194.5490 | 3194.6322 | −0.0832 |
| 03/11/2004 | 3194.0602 | 3194.0922 | −0.0320 | 19/02/2008 | 3194.4633 | 3194.5022 | −0.0389 |
| 08/11/2004 | 3194.0647 | 3194.0822 | −0.0175 | 22/02/2008 | 3194.7377 | 3194.5022 | 0.2355 |
| 20/02/2005 | 3193.8500 | 3193.9622 | −0.1122 | 27/02/2008 | 3194.7666 | 3194.5022 | 0.2644 |
| 24/02/2005 | 3194.1872 | 3193.9522 | 0.2350 | 18/03/2008 | 3194.4374 | 3194.5022 | −0.0648 |
| 22/05/2005 | 3193.8900 | 3193.9822 | −0.0922 | 06/10/2008 | 3194.6458 | 3194.6822 | −0.0364 |
| 26/05/2005 | 3194.2541 | 3194.0022 | 0.2519 | 09/10/2008 | 3194.8020 | 3194.6922 | 0.1098 |
| 23/10/2005 | 3194.5480 | 3194.5522 | −0.0042 | 14/10/2008 | 3194.3799 | 3194.6822 | −0.3023 |
| 27/10/2005 | 3194.7340 | 3194.5522 | 0.1818 | 14/12/2008 | 3194.4477 | 3194.5222 | −0.0745 |
| 21/11/2005 | 3194.3592 | 3194.4822 | −0.1230 | 10/03/2009 | 3194.3732 | 3194.4922 | −0.1190 |
| 24/02/2006 | 3194.4660 | 3194.3922 | 0.0738 | 14/03/2009 | 3194.7073 | 3194.4922 | 0.2151 |
| 27/02/2006 | 3194.6040 | 3194.3922 | 0.2118 | 18/03/2009 | 3194.3146 | 3194.4922 | −0.1776 |
| 24/03/2006 | 3194.3813 | 3194.3922 | −0.0109 | 08/04/2009 | 3194.4016 | 3194.5022 | −0.1006 |
| 26/05/2006 | 3194.3225 | 3194.3722 | −0.0497 | 02/10/2009 | 3194.7432 | 3194.8522 | −0.1090 |
| 29/05/2006 | 3194.6258 | 3194.3822 | 0.2436 |
| Date | Track | M | MAD | Min | Min | |||
|---|---|---|---|---|---|---|---|---|
| 31/10/2018 | 507 | 3197.0319 | 0.0269 | 0.0400 | 3196.9120 | 3197.1517 | 3195.3083 | 3197.3267 |
| 10/11/2018 | 652 | 3197.0874 | 0.0447 | 0.0663 | 3196.8886 | 3197.2862 | 3196.3560 | 3199.8335 |
| 03/12/2018 | 1010 | 3196.8918 | 0.0653 | 0.0968 | 3196.6014 | 3197.1822 | 3196.4710 | 3197.5435 |
| 01/01/2019 | 65 | 3196.8745 | 0.0281 | 0.0417 | 3196.7495 | 3196.9995 | 3196.7197 | 3199.0810 |
| 07/01/2019 | 149 | 3196.9214 | 0.0283 | 0.0420 | 3196.7955 | 3197.0473 | 3196.7236 | 3197.8706 |
| 30/01/2019 | 507 | 3197.0142 | 0.0395 | 0.0586 | 3196.8385 | 3197.1899 | 3196.9004 | 3197.4950 |
| 03/02/2019 | 568 | 3196.9324 | 0.0449 | 0.0666 | 3196.7327 | 3197.1321 | 3196.7305 | 3197.2004 |
| 05/02/2019 | 591 | 3196.9710 | 0.0556 | 0.0824 | 3196.7239 | 3197.2181 | 3196.4463 | 3198.5261 |
| 09/02/2019 | 652 | 3196.9988 | 0.0303 | 0.0449 | 3196.8640 | 3197.1336 | 3196.8960 | 3199.3718 |
| 04/03/2019 | 1010 | 3196.9268 | 0.0380 | 0.0563 | 3196.7578 | 3197.0958 | 3196.8232 | 3197.4172 |
| 10/03/2019 | 1094 | 3196.9460 | 0.0320 | 0.0474 | 3196.8037 | 3197.0883 | 3196.8254 | 3197.7234 |
| 01/05/2019 | 507 | 3196.9957 | 0.1543 | 0.2288 | 3196.3092 | 3197.6822 | 3195.9036 | 3199.5193 |
| 10/05/2019 | 652 | 3197.1220 | 0.0255 | 0.0378 | 3197.0086 | 3197.2354 | 3196.3460 | 3199.8610 |
| 03/06/2019 | 1010 | 3197.0398 | 0.0298 | 0.0442 | 3196.9073 | 3197.1723 | 3196.9248 | 3197.3562 |
| 31/07/2019 | 507 | 3197.3162 | 0.0354 | 0.0525 | 3197.1587 | 3197.4737 | 3196.8142 | 3199.3313 |
| 04/08/2019 | 568 | 3197.5017 | 0.0335 | 0.0497 | 3197.3527 | 3197.6507 | 3197.1624 | 3206.7554 |
| 05/08/2019 | 591 | 3197.2856 | 0.0551 | 0.0817 | 3197.0405 | 3197.5307 | 3197.0452 | 3201.0264 |
| 09/08/2019 | 652 | 3197.5242 | 0.0279 | 0.0414 | 3197.4001 | 3197.6483 | 3197.3916 | 3225.0750 |
| 02/09/2019 | 1010 | 3197.4275 | 0.0391 | 0.0580 | 3197.2536 | 3197.6014 | 3197.2568 | 3197.7520 |
| 07/09/2019 | 1094 | 3197.3416 | 0.0449 | 0.0666 | 3197.1419 | 3197.5413 | 3197.0996 | 3197.6536 |
| 01/10/2019 | 65 | 3197.3672 | 0.0518 | 0.0768 | 3197.1368 | 3197.5976 | 3197.1467 | 3197.6533 |
| 06/10/2019 | 149 | 3197.4019 | 0.0529 | 0.0784 | 3197.1666 | 3197.6372 | 3197.1616 | 3198.9220 |
| 30/10/2019 | 507 | 3197.4937 | 0.0477 | 0.0707 | 3197.2815 | 3197.7059 | 3197.3208 | 3200.8225 |
| 03/11/2019 | 568 | 3197.4080 | 0.0456 | 0.0676 | 3197.2052 | 3197.6108 | 3197.1970 | 3197.7524 |
| 04/11/2019 | 591 | 3197.4382 | 0.0490 | 0.0726 | 3197.2203 | 3197.6561 | 3197.2910 | 3197.7036 |
| 08/11/2019 | 652 | 3197.5032 | 0.0315 | 0.0467 | 3197.3631 | 3197.6433 | 3196.7175 | 3200.1177 |
| 02/12/2019 | 1010 | 3197.3088 | 0.0408 | 0.0605 | 3197.1273 | 3197.4903 | 3197.1333 | 3197.6780 |
| 07/12/2019 | 1094 | 3197.3200 | 0.0460 | 0.0682 | 3197.1154 | 3197.5246 | 3197.0970 | 3197.6494 |
| 30/12/2019 | 65 | 3197.2590 | 0.0356 | 0.0528 | 3197.1007 | 3197.4173 | 3197.0645 | 3197.8610 |
| 05/01/2020 | 149 | 3197.2927 | 0.0254 | 0.0377 | 3197.1797 | 3197.4057 | 3197.0063 | 3197.4465 |
| 28/01/2020 | 507 | 3197.3135 | 0.0320 | 0.0474 | 3197.1712 | 3197.4558 | 3196.7650 | 3199.1064 |
| 03/02/2020 | 591 | 3197.4170 | 0.0410 | 0.0608 | 3197.2346 | 3197.5994 | 3196.8748 | 3202.4230 |
| 07/02/2020 | 652 | 3197.3823 | 0.0249 | 0.0369 | 3197.2715 | 3197.4931 | 3197.2146 | 3197.5930 |
| 01/03/2020 | 1010 | 3197.2832 | 0.0535 | 0.0793 | 3197.0452 | 3197.5212 | 3197.0305 | 3197.3716 |
| 07/03/2020 | 1094 | 3197.3394 | 0.0314 | 0.0466 | 3197.1997 | 3197.4791 | 3197.1887 | 3198.7146 |
| 05/04/2020 | 149 | 3197.3088 | 0.0396 | 0.0587 | 3197.1327 | 3197.4849 | 3197.1948 | 3197.5405 |
| 28/04/2020 | 507 | 3197.4090 | 0.0240 | 0.0356 | 3197.3023 | 3197.5157 | 3197.3054 | 3197.6902 |
| 02/05/2020 | 568 | 3197.3930 | 0.0443 | 0.0657 | 3197.1960 | 3197.5900 | 3197.2550 | 3197.6220 |
| 04/05/2020 | 591 | 3197.3318 | 0.0272 | 0.0403 | 3197.2108 | 3197.4528 | 3197.2188 | 3197.6396 |
| 31/05/2020 | 1010 | 3197.2709 | 0.0120 | 0.0179 | 3197.2173 | 3197.3245 | 3197.2400 | 3197.4082 |
| 06/06/2020 | 1094 | 3197.4440 | 0.0387 | 0.0574 | 3197.2719 | 3197.6161 | 3197.3137 | 3197.8300 |
| 29/06/2020 | 65 | 3197.5205 | 0.0164 | 0.0243 | 3197.4476 | 3197.5934 | 3197.3547 | 3200.3542 |
| 05/07/2020 | 149 | 3197.5290 | 0.0307 | 0.0455 | 3197.3925 | 3197.6655 | 3197.3720 | 3197.6995 |
| Date | ICESat-2/m | In Situ/m | Bias/m | Date | ICESat-2/m | In Situ/m | Bias/m |
|---|---|---|---|---|---|---|---|
| 31/10/2018 | 3197.0288 | 3196.9944 | 0.0344 | 05/02/2019 | 3196.978 | 3196.8844 | 0.0936 |
| 10/11/2018 | 3197.0872 | 3196.9944 | 0.0928 | 09/02/2019 | 3196.9976 | 3196.8944 | 0.1032 |
| 03/12/2018 | 3196.8901 | 3196.9444 | −0.0543 | 04/03/2019 | 3196.9204 | 3196.8944 | 0.0260 |
| 01/01/2019 | 3196.8743 | 3196.8744 | −0.0001 | 10/03/2019 | 3196.942 | 3196.8944 | 0.0476 |
| 07/01/2019 | 3196.9214 | 3196.8744 | 0.0470 | 01/05/2019 | 3196.9962 | 3196.9644 | 0.0318 |
| 30/01/2019 | 3197.0122 | 3196.8844 | 0.1278 | 10/05/2019 | 3197.1194 | 3196.9844 | 0.1350 |
| 03/02/2019 | 3196.932 | 3196.8844 | 0.0476 |
References
- Gleick, P.H. Global freshwater resources: Soft-path solutions for the 21st century. Science 2003, 302, 1524–1528. [Google Scholar] [CrossRef]
- Tranvik, L.J.; Downing, J.A.; Cotner, J.B.; Loiselle, S.A.; Striegl, R.G.; Ballatore, T.J.; Dillon, P.; Finlay, K.; Fortino, K.; Knoll, L.B. Lakes and reservoirs as regulators of carbon cycling and climate. Limnol. Oceanogr. 2009, 54, 2298–2314. [Google Scholar] [CrossRef]
- Verpoorter, C.; Kutser, T.; Seekell, D.A.; Tranvik, L.J. A global inventory of lakes based on high-resolution satellite imagery. Geophys. Res. Lett. 2014, 41, 6396–6402. [Google Scholar] [CrossRef]
- Williamson, C.E.; Saros, J.E.; Vincent, W.F.; Smol, J.P. Lakes and reservoirs as sentinels, integrators, and regulators of climate change. Limnol. Oceanogr. 2009, 54, 2273–2282. [Google Scholar] [CrossRef]
- Pekel, J.-F.; Cottam, A.; Gorelick, N.; Belward, A.S. High-resolution mapping of global surface water and its long-term changes. Nature 2016, 540, 418–422. [Google Scholar] [CrossRef]
- Palmer, S.C.J.; Kutser, T.; Hunter, P.D. Remote sensing of inland waters: Challenges, progress and future directions. Remote Sens. Environ. 2015, 157, 1–8. [Google Scholar] [CrossRef]
- Li, P.; Li, H.; Chen, F.; Cai, X. Monitoring Long-Term Lake Level Variations in Middle and Lower Yangtze Basin over 2002–2017 through Integration of Multiple Satellite Altimetry Datasets. Remote Sens. 2020, 12, 1448. [Google Scholar] [CrossRef]
- Ma, Y.; Xu, N.; Zhang, W.; Wang, X.H.; Sun, J.; Feng, X.; Sun, Y. Increasing Water Levels of Global Lakes between 2003 and 2009. IEEE Geosci. Remote Sens. Lett. 2020, 17, 187–191. [Google Scholar] [CrossRef]
- Mohamed, A. Gravity applications in estimating the mass variations in the Middle East: A case study from Iran. Arab. J. Geosci. 2020, 13, 364. [Google Scholar] [CrossRef]
- Al-Abadi, A.M.; Ghalib, H.B.; Al-Mohammdawi, J.A. Delineation of Groundwater Recharge Zones in Ali Al-Gharbi District, Southern Iraq Using Multi-criteria Decision-making Model and GIS. J. Geovisualization Spat. Anal. 2020, 4, 9. [Google Scholar] [CrossRef]
- Zhang, G.; Chen, W.; Xie, H. Tibetan Plateau’s lake level and volume changes from NASA’s ICESat/ICESat-2 and Landsat Missions. Geophys. Res. Lett. 2019, 46, 13107–13118. [Google Scholar] [CrossRef]
- Lu, C.; Yu, G.; Xie, G. Tibetan plateau serves as a water tower. In Proceedings of the IGARSS 2005—IEEE International Geoscience and Remote Sensing Symposium, Seoul, Republic of Korea, 29 July 2005; pp. 3120–3123. [Google Scholar]
- Immerzeel, W.W.; Van Beek, L.P.; Bierkens, M.F. Climate change will affect the Asian water towers. Science 2010, 328, 1382–1385. [Google Scholar] [CrossRef] [PubMed]
- Wan, W.; Xiao, P.; Feng, X.; Li, H.; Ma, R.; Duan, H.; Zhao, L. Monitoring lake changes of Qinghai-Tibetan Plateau over the past 30 years using satellite remote sensing data. Chin. Sci. Bull. 2014, 59, 1021–1035. [Google Scholar] [CrossRef]
- Zhou, J.; Wang, L.; Zhang, Y.; Guo, Y.; Li, X.; Liu, W. Exploring the water storage changes in the largest lake (Selin Co) over the Tibetan Plateau during 2003–2012 from a basin-wide hydrological modeling. Water Resour. Res. 2015, 51, 8060–8086. [Google Scholar] [CrossRef]
- Shen, Y.; Chen, H.; Xu, C. Remote Sensing Monitoring Study for the Tendency of Qinghai Lake’s Water Area in Last 41 Years. J. Water Resour. Res. 2013, 2, 309–315. [Google Scholar]
- Fang, J.; Li, G.; Rubinato, M.; Ma, G.; Zhou, J.; Jia, G.; Yu, X.; Wang, H. Analysis of Long-Term Water Level Variations in Qinghai Lake in China. Water 2019, 11, 2136. [Google Scholar] [CrossRef]
- Zhang, G.; Xie, H.; Kang, S.; Yi, D.; Ackley, S.F. Monitoring lake level changes on the Tibetan Plateau using ICESat altimetry data (2003–2009). Remote Sens. Environ. 2011, 115, 1733–1742. [Google Scholar] [CrossRef]
- Jiang, L.; Nielsen, K.; Andersen, O.B.; Bauer-Gottwein, P. Monitoring recent lake level variations on the Tibetan Plateau using CryoSat-2 SARIn mode data. J. Hydrol. 2017, 544, 109–124. [Google Scholar] [CrossRef]
- Song, C.; Huang, B.; Richards, K.; Ke, L.; Hien Phan, V. Accelerated lake expansion on the Tibetan Plateau in the 2000s: Induced by glacial melting or other processes? Water Resour. Res. 2014, 50, 3170–3186. [Google Scholar] [CrossRef]
- Wang, X.; Gong, P.; Zhao, Y.; Xu, Y.; Cheng, X.; Niu, Z.; Luo, Z.; Huang, H.; Sun, F.; Li, X. Water-level changes in China’s large lakes determined from ICESat/GLAS data. Remote Sens. Environ. 2013, 132, 131–144. [Google Scholar] [CrossRef]
- Crétaux, J.-F.; Birkett, C. Lake studies from satellite radar altimetry. Comptes Rendus Geosci. 2006, 338, 1098–1112. [Google Scholar] [CrossRef]
- Shiklomanov, A.I.; Lammers, R.B.; Vörösmarty, C.J. Widespread decline in hydrological monitoring threatens pan-Arctic research. Eos Trans. Am. Geophys. Union 2002, 83, 13–17. [Google Scholar] [CrossRef]
- Lawford, R.; Strauch, A.; Toll, D.; Fekete, B.; Cripe, D. Earth observations for global water security. Curr. Opin. Environ. Sustain. 2013, 5, 633–643. [Google Scholar] [CrossRef]
- Han, W.; Huang, C.; Duan, H.; Gu, J.; Hou, J. Lake Phenology of Freeze-Thaw Cycles Using Random Forest: A Case Study of Qinghai Lake. Remote Sens. 2020, 12, 4098. [Google Scholar] [CrossRef]
- Peng, Y.; Li, Z.; Xu, C.; Zhang, H.; Han, W. Surface Velocity Analysis of Surge Region of Karayaylak Glacier from 2014 to 2020 in the Pamir Plateau. Remote Sens. 2021, 13, 774. [Google Scholar] [CrossRef]
- Liu, D.; Duan, H.; Loiselle, S.; Hu, C.; Zhang, G.; Li, J.; Yang, H.; Thompson, J.R.; Cao, Z.; Shen, M.; et al. Observations of water transparency in China’s lakes from space. Int. J. Appl. Earth Obs. Geoinf. 2020, 92, 102187. [Google Scholar] [CrossRef]
- Nhu, V.-H.; Mohammadi, A.; Shahabi, H.; Shirzadi, A.; Al-Ansari, N.; Ahmad, B.B.; Chen, W.; Khodadadi, M.; Ahmadi, M.; Khosravi, K.; et al. Monitoring and Assessment of Water Level Fluctuations of the Lake Urmia and Its Environmental Consequences Using Multitemporal Landsat 7 ETM+ Images. Int. J. Environ. Res. Public Health 2020, 17, 4210. [Google Scholar] [CrossRef]
- El-Shirbeny, M.A.; Abutaleb, K.A. Monitoring of Water-Level Fluctuation of Lake Nasser Using Altimetry Satellite Data. Earth Syst. Environ. 2018, 2, 367–375. [Google Scholar] [CrossRef]
- Berry, P.A.M.; Garlick, J.D.; Freeman, J.A.; Mathers, E.L. Global inland water monitoring from multi-mission altimetry. Geophys. Res. Lett. 2005, 32, 1–4. [Google Scholar] [CrossRef]
- Birkett, C.M. The contribution of TOPEX/POSEIDON to the global monitoring of climatically sensitive lakes. J. Geophys. Res. Ocean. 1995, 100, 25179–25204. [Google Scholar] [CrossRef]
- Crétaux, J.F.; Abarca-del-Río, R.; Bergé-Nguyen, M.; Arsen, A.; Drolon, V.; Clos, G.; Maisongrande, P. Lake Volume Monitoring from Space. Surv. Geophys. 2016, 37, 269–305. [Google Scholar] [CrossRef]
- Gao, L.; Liao, J.; Shen, G. Monitoring lake-level changes in the Qinghai–Tibetan Plateau using radar altimeter data (2002–2012). J. Appl. Remote Sens. 2013, 7, 073470. [Google Scholar] [CrossRef]
- Kleinherenbrink, M.; Lindenbergh, R.C.; Ditmar, P.G. Monitoring of lake level changes on the Tibetan Plateau and Tian Shan by retracking Cryosat SARIn waveforms. J. Hydrol. 2015, 521, 119–131. [Google Scholar] [CrossRef]
- Liao, J.; Gao, L.; Wang, X. Numerical Simulation and Forecasting of Water Level for Qinghai Lake Using Multi-Altimeter Data Between 2002 and 2012. IEEE J. Sel. Top. Appl. Earth Obs. Remote Sens. 2014, 7, 609–622. [Google Scholar] [CrossRef]
- Song, C.; Huang, B.; Ke, L. Heterogeneous change patterns of water level for inland lakes in High Mountain Asia derived from multi-mission satellite altimetry. Hydrol. Process. 2015, 29, 2769–2781. [Google Scholar] [CrossRef]
- Song, C.; Huang, B.; Ke, L.; Richards, K.S. Seasonal and abrupt changes in the water level of closed lakes on the Tibetan Plateau and implications for climate impacts. J. Hydrol. 2014, 514, 131–144. [Google Scholar] [CrossRef]
- Song, C.; Ye, Q.; Cheng, X. Shifts in water-level variation of Namco in the central Tibetan Plateau from ICESat and CryoSat-2 altimetry and station observations. Sci. Bull. 2015, 60, 1287–1297. [Google Scholar] [CrossRef]
- Song, C.; Ye, Q.; Sheng, Y.; Gong, T. Combined ICESat and CryoSat-2 Altimetry for Accessing Water Level Dynamics of Tibetan Lakes over 2003–2014. Water 2015, 7, 4685–4700. [Google Scholar] [CrossRef]
- Schutz, B.E.; Zwally, H.J.; Shuman, C.A.; Hancock, D.; DiMarzio, J.P. Overview of the ICESat Mission. Geophys. Res. Lett. 2005, 32, 1–4. [Google Scholar] [CrossRef]
- Markus, T.; Neumann, T.; Martino, A.; Abdalati, W.; Brunt, K.; Csatho, B.; Farrell, S.; Fricker, H.; Gardner, A.; Harding, D. The Ice, Cloud, and land Elevation Satellite-2 (ICESat-2): Science requirements, concept, and implementation. Remote Sens. Environ. 2017, 190, 260–273. [Google Scholar] [CrossRef]
- Su, D.; Hu, X.; Wen, L.; Lyu, S.; Gao, X.; Zhao, L.; Li, Z.; Du, J.; Kirillin, G. Numerical study on the response of the largest lake in China to climate change. Hydrol. Earth Syst. Sci. 2019, 23, 2093–2109. [Google Scholar] [CrossRef]
- Guoqing, Z. Dataset of river basins map over the TP (2016). Natl. Tibet. Plateau Data Cent. 2019. [Google Scholar] [CrossRef]
- Zhang, G.; Yao, T.; Xie, H.; Kang, S.; Lei, Y. Increased mass over the Tibetan Plateau: From lakes or glaciers? Geophys. Res. Lett. 2013, 40, 2125–2130. [Google Scholar] [CrossRef]
- Yuan, Y.; Li, D.L.; An, D. Response of water level in Qinghai Lake to climate change in the Qinghai-Xizang Plateau. Plat. Meteorol. 2012, 31, 57–64. [Google Scholar]
- Ao, H.; Wu, C.; Xiong, X.; Jing, L.; Huang, X.; Zhang, K.; Liu, J. Water and sediment quality in Qinghai Lake, China: A revisit after half a century. Environ. Monit. Assess. 2014, 186, 2121–2133. [Google Scholar] [CrossRef] [PubMed]
- ChongYi, E.; Zhang, J.; Chen, Z.Y.; Sun, Y.J.; Zhao, Y.J.; Li, P.; Sun, M.P.; Shi, Y.K. High resolution OSL dating of aeolian activity at Qinghai Lake, Northeast Tibetan Plateau. CATENA 2019, 183, 104180. [Google Scholar] [CrossRef]
- Wang, Y.; Jin, Z.; Zhou, L.; Li, F.; Zhang, F.; Chen, L.; Qiu, X.; Qi, R. Stratigraphy and otolith microchemistry of the naked carp Gymnocypris przewalskii (Kessler) and their indication for water level of Lake Qinghai during the Ming Dynasty of China. Sci. China Earth Sci. 2014, 57, 2512–2521. [Google Scholar] [CrossRef]
- Han, W.; Huang, C.; Wang, Y.; Gu, J. Study on the Area Variation of Qinghai Lake Based on Long-Term Landsat 5/8 Multi-Band Remote Sensing Imagery. Adv. Earth Sci. 2019, 34, 346–355. [Google Scholar] [CrossRef]
- Wei, H.; Chongyi, E.; Zhang, J.; Sun, Y.; Li, Q.; Hou, G.; Duan, R. Climate change and anthropogenic activities in Qinghai Lake basin over the last 8500 years derived from pollen and charcoal records in an aeolian section. CATENA 2020, 193, 104616. [Google Scholar] [CrossRef]
- Ding, Z.; Lu, R.; Lyu, Z.; Liu, X. Geochemical characteristics of Holocene aeolian deposits east of Qinghai Lake, China, and their paleoclimatic implications. Sci. Total Environ. 2019, 692, 917–929. [Google Scholar] [CrossRef]
- Li, X.-Y.; Xu, H.-Y.; Sun, Y.-L.; Zhang, D.-S.; Yang, Z.-P. Lake-Level Change and Water Balance Analysis at Lake Qinghai, West China during Recent Decades. Water Resour. Manag. 2007, 21, 1505–1516. [Google Scholar] [CrossRef]
- Cai, Y.; Ke, C.-Q.; Duan, Z. Monitoring ice variations in Qinghai Lake from 1979 to 2016 using passive microwave remote sensing data. Sci. Total Environ. 2017, 607, 120–131. [Google Scholar] [CrossRef] [PubMed]
- Yin, Q.J.; Yang, Y.L. Remote sensing monitoring of Lake Qinghai based on EOS/MODIS data. J. Lake Sci. 2005, 17, 356–360. [Google Scholar]
- Che, T.; Li, X.; Jin, R. Monitoring the frozen duration of Qinghai Lake using satellite passive microwave remote sensing low frequency data. Chin. Sci. Bull. 2009, 54, 787–791. [Google Scholar] [CrossRef]
- Phan, V.H.; Lindenbergh, R.; Menenti, M. ICESat derived elevation changes of Tibetan lakes between 2003 and 2009. Int. J. Appl. Earth Obs. Geoinf. 2012, 17, 12–22. [Google Scholar] [CrossRef]
- Duan, Z.; Bastiaanssen, W.; Muala, E. Icesat-derived water level variations of roseires reservoir (Sudan) in the Nile basin. In Proceedings of the 2013 IEEE International Geoscience and Remote Sensing Symposium-IGARSS, Melbourne, Australia, 21–26 July 2013; pp. 2884–2887. [Google Scholar]
- Duan, Z.; Bastiaanssen, W. Estimating water volume variations in lakes and reservoirs from four operational satellite altimetry databases and satellite imagery data. Remote Sens. Environ. 2013, 134, 403–416. [Google Scholar] [CrossRef]
- Kwok, R.; Zwally, H.J.; Yi, D. ICESat observations of Arctic sea ice: A first look. Geophys. Res. Lett. 2004, 31. [Google Scholar] [CrossRef]
- Zwally, H.J.; Yi, D.; Kwok, R.; Zhao, Y. ICESat measurements of sea ice freeboard and estimates of sea ice thickness in the Weddell Sea. J. Geophys. Res. Ocean. 2008, 113, 1–17. [Google Scholar] [CrossRef]
- Bhang, K.J.; Schwartz, F.W.; Braun, A. Verification of the vertical error in C-band SRTM DEM using ICESat and Landsat-7, Otter Tail County, MN. IEEE Trans. Geosci. Remote Sens. 2006, 45, 36–44. [Google Scholar] [CrossRef]
- Braun, A.; Cheng, K.-C.; Csatho, B.; Shum, C. ICESat laser altimetry in the Great Lakes. In Proceedings of the Proceedings of the 60th Annual Meeting of The Institute of Navigation (2004), Dayton, OH, USA, 7–9 June 2004; pp. 409–416.
- Swenson, S.; Wahr, J. Monitoring the water balance of Lake Victoria, East Africa, from space. J. Hydrol. 2009, 370, 163–176. [Google Scholar] [CrossRef]
- Urban, T.J.; Schutz, B.E.; Neuenschwander, A.L. A survey of ICESat coastal altimetry applications: Continental coast, open ocean island, and inland river. Terr. Atmos. Ocean. Sci. 2008, 19, 1–19. [Google Scholar] [CrossRef]
- Jasinski, M.; Stoll, J.; Hancock, D.; Robbins, J.; Nattala, J.; Pavelsky, T.; Morrison, J.; Arp, C.; Jones, B. ATLAS/ICESat-2 L3A Inland Water Surface Height, Version 1; [Indicate subset used]; NASA National Snow and Ice Data Center Distributed Active Archive Center: Boulder, CO, USA, 2019. [Google Scholar]
- Jasinski, M.; Stoll, J.; Hancock, D.; Robbins, J.; Nattala, J.; Pavelsky, T.; Morrison, J.; Arp, C.; Jones, B.; Ondrusek, M.; et al. Algorithm Theoretical Basis Document (ATBD) for Inland Water Data Products, ATL13, Version 1; Goddard Space Flight Center: Greenbelt, MD, USA, 2019; p. 89. [Google Scholar]
- Magruder, L.; Neuenschwander, A.; Klotz, B. Digital terrain model elevation corrections using space-based imagery and ICESat-2 laser altimetry. Remote Sens. Environ. 2021, 264, 112621. [Google Scholar] [CrossRef]
- Wang, C.; Zhu, X.; Nie, S.; Xi, X.; Li, D.; Zheng, W.; Chen, S. Ground elevation accuracy verification of ICESat-2 data: A case study in Alaska, USA. Opt. Express 2019, 27, 38168–38179. [Google Scholar] [CrossRef] [PubMed]
- Bureau, Q.H. Water Level Monitoring Data of Qinghai Lake in Xiashe Water Level Station; TPDC: Beijing, China, 2019. [Google Scholar]
- Zhang, G.; Xie, H.; Duan, S.; Tian, M.; Yi, D. Water level variation of Lake Qinghai from satellite and in situ measurements under climate change. J. Appl. Remote Sens. 2011, 5, 053532. [Google Scholar] [CrossRef]
- Guo, H.; Jiao, W.; Yang, Y. The systematic difference and its distribution between the 1985 national height datum and the global quasigeoid. Acta Geod. Et Cartogr. Sin. 2004, 33, 100–104. [Google Scholar]
- Carroll, M.L.; DiMiceli, C.M.; Townshend, J.; Sohlberg, R.A.; Elders, A.; Devadiga, S.; Sayer, A.; Levy, R. Development of an operational land water mask for MODIS Collection 6, and influence on downstream data products. Int. J. Digit. Earth 2017, 10, 207–218. [Google Scholar] [CrossRef]
- JPL, N. NASADEM Merged DEM Global 1 arc Second V001; NASA EOSDIS Land Processes DAAC: Sioux Falls, SD, USA, 2020. [Google Scholar] [CrossRef]
- Neumann, T.; Brenner, A.; Hancock, D.; Robbins, J.; Saba, J.; Harbeck, K.; Gibbons, A.; Lee, J.; Luthcke, S.; Rebold, T. ATLAS/ICESat-2 L2A Global Geolocated Photon Data, Version 3; NASA National Snow and Ice Data Center Distributed Active Archive Center: Boulder, CO, USA, 2020; Volume 10. [Google Scholar]
- Yang, Y. Chinese geodetic coordinate system 2000. Chin. Sci. Bull. 2009, 54, 2714–2721. [Google Scholar] [CrossRef]
- Leys, C.; Ley, C.; Klein, O.; Bernard, P.; Licata, L. Detecting outliers: Do not use standard deviation around the mean, use absolute deviation around the median. J. Exp. Soc. Psychol. 2013, 49, 764–766. [Google Scholar] [CrossRef]
- Jiang, L.; Andersen, O.B.; Nielsen, K.; Zhang, G.; Bauer-Gottwein, P. Influence of local geoid variation on water surface elevation estimates derived from multi-mission altimetry for Lake Namco. Remote Sens. Environ. 2019, 221, 65–79. [Google Scholar] [CrossRef]
- Blewitt, G.; Kreemer, C.; Hammond, W.C.; Gazeaux, J. MIDAS robust trend estimator for accurate GPS station velocities without step detection. J. Geophys. Res. Solid Earth 2016, 121, 2054–2068. [Google Scholar] [CrossRef]
- Treichler, D.; Kääb, A.; Salzmann, N.; Xu, C.-Y. Recent glacier and lake changes in High Mountain Asia and their relation to precipitation changes. Cryosphere 2019, 13, 2977–3005. [Google Scholar] [CrossRef]
- Yao, T.; Xue, Y.; Chen, D.; Chen, F.; Thompson, L.; Cui, P.; Koike, T.; Lau, W.K.-M.; Lettenmaier, D.; Mosbrugger, V. Recent third pole’s rapid warming accompanies cryospheric melt and water cycle intensification and interactions between monsoon and environment: Multidisciplinary approach with observations, modeling, and analysis. Bull. Am. Meteorol. Soc. 2019, 100, 423–444. [Google Scholar] [CrossRef]
- Fan, C.; Song, C.; Li, W.; Liu, K.; Cheng, J.; Fu, C.; Chen, T.; Ke, L.; Wang, J. What drives the rapid water-level recovery of the largest lake (Qinghai Lake) of China over the past half century? J. Hydrol. 2021, 593, 125921. [Google Scholar] [CrossRef]
- Dong, H.; Song, Y. Shrinkage history of Lake Qinghai and causes during the last 52 years. In Proceedings of the 2011 International Symposium on Water Resource and Environmental Protection, Xi’an, China, 20–22 May 2011; pp. 446–449. [Google Scholar]
- Luo, S.; Song, C.; Zhan, P.; Liu, K.; Chen, T.; Li, W.; Ke, L. Refined estimation of lake water level and storage changes on the Tibetan Plateau from ICESat/ICESat-2. CATENA 2021, 200, 105177. [Google Scholar] [CrossRef]
- Xu, N.; Ma, Y.; Wei, Z.; Huang, C.; Li, G.; Zheng, H.; Wang, X.H. Satellite observed recent rising water levels of global lakes and reservoirs. Environ. Res. Lett. 2022, 17, 074013. [Google Scholar] [CrossRef]
- Araki, S.; Deguchi, I. Prediction of Wave Force Acting on Horizontal Plate above Still Water Level; Department of Civil Engineering, Osaka University: Suita, Japan, 2012; pp. 1–2. [Google Scholar]
- Haigh, I.D.; Nicholls, R.; Wells, N. A comparison of the main methods for estimating probabilities of extreme still water levels. Coast. Eng. 2010, 57, 838–849. [Google Scholar] [CrossRef]
- Ryan, J.C.; Smith, L.C.; Cooley, S.W.; Pitcher, L.H.; Pavelsky, T.M. Global Characterization of Inland Water Reservoirs Using ICESat-2 Altimetry and Climate Reanalysis. Geophys. Res. Lett. 2020, 47, e2020GL088543. [Google Scholar] [CrossRef]


| Orbit Inclination | 92° | Coverage | Up to 88°N and S |
|---|---|---|---|
| Pointing control | 45 m | Pointing knowledge | 6.5 m |
| ATLAS | |||
| Laser wavelength | 532 nm | Number of beams | 6 beams organized in 3 pairs |
| Pulse repetition rate | 10 kHz (~0.7 m along-track spacing at nominal altitude) | Beam spacing (across-track) at nominal altitude | 90 m within pairs; 3.3 km between pairs |
| Parameters | ICESat/GLAS | CGCS2000 | WGS84 |
|---|---|---|---|
| Equatorial radius (a) | 6,378,136.300000 m | 6,378,137.000000 m | 6,378,137.000000 m |
| Polar radius (b) | 6,356,751.600563 m | 6,356,752.314140 m | 6,356,752.314245 m |
| Reciprocal flattening (1/f) | 298.25700000 | 298.257222101 | 298.25722356 |
| Eccentricity (e) | 0.081819221456 | 0.0818191910428 | 0.081819190843 |
| Track (Days) | Date | Track (Days) | Date | Track (Days) | Date |
|---|---|---|---|---|---|
| 1306 (16) | 18/10/2003 | 1239 (1) | 14/10/2003 | 71 (3) | 27/02/2008 |
| 19/02/2004 | 376 (13) | 16/11/2003 | 14/10/2008 | ||
| 20/05/2004 | 18/03/2004 | 18/03/2009 | |||
| 06/10/2004 | 17/06/2004 | 4 (13) | 22/10/2003 | ||
| 20/02/2005 | 03/11/2004 | 22/02/2004 | |||
| 22/05/2005 | 21/11/2005 | 24/02/2005 | |||
| 23/10/2005 | 24/03/2006 | 26/05/2005 | |||
| 24/02/2006 | 23/06/2006 | 27/10/2005 | |||
| 26/05/2006 | 24/2112006 | 27/02/2006 | |||
| 27/10/2006 | 11/04/2007 | 29/05/2006 | |||
| 13/03/2007 | 02/11/2007 | 30/10/2006 | |||
| 04/10/2007 | 18/03/2008 | 17/03/2007 | |||
| 19/02/2008 | 14/12/2008 | 08/10/2007 | |||
| 06/10/2008 | 08/04/2009 | 22/02/2008 | |||
| 10/03/2009 | 443 (1) | 08/11/2004 | 09/10/2008 | ||
| 02/10/2009 | 14/03/2009 |
| Track (Days) | Date | Track (Days) | Date | Track (Days) | Date |
|---|---|---|---|---|---|
| 568 (4) | 03/02/2019 | 1094 (5) | 10/03/2019 | 507 (7) | 31/10/2018 |
| 04/08/2019 | 07/09/2019 | 30/01/2019 | |||
| 03/11/2019 | 07/12/2019 | 01/05/2019 | |||
| 02/05/2020 | 07/03/2020 | 31/07/2019 | |||
| 652 (6) | 10/11/2018 | 06/06/2020 | 30/10/2019 | ||
| 09/02/2019 | 65 (4) | 01/01/2019 | 28/01/2020 | ||
| 10/05/2019 | 01/10/2019 | 28/04/2020 | |||
| 09/08/2019 | 30/12/2019 | 591 (5) | 05/02/2019 | ||
| 08/11/2019 | 29/06/2020 | 05/08/2019 | |||
| 07/02/2020 | 149 (5) | 07/01/2019 | 04/11/2019 | ||
| 1010 (7) | 03/12/2018 | 06/10/2019 | 03/02/2020 | ||
| 04/03/2019 | 05/01/2020 | 04/05/2020 | |||
| 03/06/2019 | 05/04/2020 | ||||
| 02/09/2019 | 05/07/2020 | ||||
| 02/12/2019 | |||||
| 01/03/2020 | |||||
| 31/05/2020 |
| Track | M/m | MAD/m | Min/m | Max/m | |||
|---|---|---|---|---|---|---|---|
| 4 | 3150.5050 | 0.1200 | 0.1779 | 3149.9713 | 3151.0387 | 3147.7580 | 3158.2440 |
| 71 | 3150.3450 | 0.2470 | 0.3662 | 3149.2464 | 3151.4436 | 3149.7200 | 3153.7340 |
| 376 | 3149.7020 | 0.1600 | 0.2372 | 3148.9904 | 3150.4136 | 3148.0560 | 3155.9920 |
| 443 | 3149.4660 | 0.0525 | 0.0778 | 3149.2326 | 3149.6994 | 3148.1810 | 3152.5440 |
| 1239 | 3149.3610 | 0.1040 | 0.1542 | 3148.8984 | 3149.8236 | 3148.5610 | 3153.1570 |
| 1306 | 3149.6570 | 0.2470 | 0.3662 | 3148.5584 | 3150.7556 | 3147.7000 | 4781.5790 |
| Track | M/m | MAD/m | Min/m | Max/m | |||
|---|---|---|---|---|---|---|---|
| 65 | 3197.3131 | 0.0319 | 0.0472 | 3197.1714 | 3197.4548 | 3196.7197 | 3200.3542 |
| 149 | 3197.3088 | 0.0307 | 0.0455 | 3197.1723 | 3197.4453 | 3196.7236 | 3198.9220 |
| 507 | 3197.3135 | 0.0354 | 0.0525 | 3197.1560 | 3197.4710 | 3195.3083 | 3200.8225 |
| 568 | 3197.4005 | 0.0446 | 0.0661 | 3197.2021 | 3197.5989 | 3196.7305 | 3206.7554 |
| 591 | 3197.3318 | 0.0490 | 0.0726 | 3197.1139 | 3197.5497 | 3196.4463 | 3202.4230 |
| 652 | 3197.2522 | 0.0291 | 0.0431 | 3197.1227 | 3197.3816 | 3196.3460 | 3225.0750 |
| 1010 | 3197.2709 | 0.0391 | 0.0580 | 3197.0970 | 3197.4448 | 3196.4710 | 3197.7520 |
| 1094 | 3197.3394 | 0.0387 | 0.0574 | 3197.1673 | 3197.5115 | 3196.8254 | 3198.7146 |
Publisher’s Note: MDPI stays neutral with regard to jurisdictional claims in published maps and institutional affiliations. |
© 2022 by the authors. Licensee MDPI, Basel, Switzerland. This article is an open access article distributed under the terms and conditions of the Creative Commons Attribution (CC BY) license (https://creativecommons.org/licenses/by/4.0/).
Share and Cite
Han, W.; Huang, C.; Gu, J.; Hou, J.; Zhang, Y.; Wang, W. Water Level Change of Qinghai Lake from ICESat and ICESat-2 Laser Altimetry. Remote Sens. 2022, 14, 6212. https://doi.org/10.3390/rs14246212
Han W, Huang C, Gu J, Hou J, Zhang Y, Wang W. Water Level Change of Qinghai Lake from ICESat and ICESat-2 Laser Altimetry. Remote Sensing. 2022; 14(24):6212. https://doi.org/10.3390/rs14246212
Chicago/Turabian StyleHan, Weixiao, Chunlin Huang, Juan Gu, Jinliang Hou, Ying Zhang, and Weizhen Wang. 2022. "Water Level Change of Qinghai Lake from ICESat and ICESat-2 Laser Altimetry" Remote Sensing 14, no. 24: 6212. https://doi.org/10.3390/rs14246212
APA StyleHan, W., Huang, C., Gu, J., Hou, J., Zhang, Y., & Wang, W. (2022). Water Level Change of Qinghai Lake from ICESat and ICESat-2 Laser Altimetry. Remote Sensing, 14(24), 6212. https://doi.org/10.3390/rs14246212