Abstract
In this study, we explored the capability of coda wave interferometry (CWI) for monitoring CO2 storage by estimating the seismic velocity changes caused by CO2 injection. Given that the CWI method is highly efficient, the primary aim of this study was to provide a quick detection tool for the long-term monitoring of CO2 storage safety. In particular, we looked at monitoring with a cross-well geometry. We also expected that CWI could help to reduce the inversion errors of existing methods. Time-lapse upgoing waves and downgoing waves from two-component datasets were utilized to efficiently monitor the area between the wells and provide a quick indication of possible CO2 leakage. The resulting mean velocity changes versus the depth indicated the depth where velocity changes occurred. Combining the upgoing and downgoing wavefields provided a more specific indication of the depth range for changes. The calculated velocity changes were determined using the time shift between the time-lapse wavefields caused by CO2 injection/leakage. Hence, the resulting velocity changes were closely related to the ratio of propagation path length through the CO2 injection/leakage layer over the length of the entire travel path. The results indicated that the noise level and repeatability of the time-lapse datasets significantly influenced the results generated using CWI. Therefore, denoising and time-lapse processing were very important for improving the detectability of any change. Applying CWI to time-lapse cross-well surveys can be an effective tool for monitoring CO2 in the subsurface at a relatively low computational cost. As a highly efficient monitoring method, it is sensitive to changes in the seismic response caused by velocity changes in the subsurface and provides additional constraints on the inversion results from conventional travel time tomography and full waveform inversion.
1. Introduction
Geological storage of CO2 is a promising strategy to reduce greenhouse gas emissions. If implemented, it requires effective long-term monitoring of CO2 plumes to ensure storage safety. Time-lapse seismic methods are one of the effective tools for monitoring and ensuring the safe storage of CO2. Changes in fluid saturation and pressure in the reservoir due to the injection and movement of CO2 will cause changes in seismic velocities [1]. Previous studies found that the P wave velocity decreases as little as 3% and as much as 23%, while the S wave velocity decreases from 3.3% to 9.5% [1,2,3,4,5,6,7,8,9,10]. Many studies investigated such changes over varying survey scales, such as sonic well logging, surface seismic exploration, vertical seismic profiling (VSP), and cross-well surveys. Two- and three-dimensional time-lapse surface seismic surveys were widely applied to characterize subsurface CO2 plumes [9,11,12,13]. High-resolution VSP surveys were also effectively used for detecting subsurface CO2 movement and possible leakage scenarios, providing better resolution for CO2 distribution in small-scale injection projects [14,15,16,17]. Furthermore, high-resolution cross-well seismic surveys were successfully applied for delineating and evaluating the velocity decreases caused by CO2 injection in reservoirs. In time-lapse cross-well seismic surveys, travel time tomography and travel time difference tomography were widely used to detect velocity changes in reservoirs caused by CO2 injection [7,8,14,18,19,20,21]. Moreover, full waveform inversion (FWI) can also be applied for monitoring CO2 sequestration and providing a possible way to quantify the amount of injected CO2 [21,22,23,24,25].
The above methods for monitoring velocity changes in reservoirs caused by CO2 injection have in common that they mainly image the CO2 plume via reflection and velocity inversion methods. However, Lumley et al. [26] showed that coda waves contain significant changes caused by CO2 injection and that these have the potential for monitoring velocity changes in the reservoir. The coda waves consist of multiply scattered waves. Compared with direct arrivals, coda waves are more sensitive to the subtle velocity perturbations in the medium due to small changes amplified by multiple scattering and longer propagation paths. Poupinet et al. [27] pioneered the method using the coda of earthquake multiples to detect subtle velocity changes along fault zones. Snieder et al. [28] developed coda wave interferometry (CWI) using phase information to obtain the relative signal delay and estimate seismic velocity changes. CWI utilizes the high sensitivity of multiply scattered waves for monitoring time-lapse changes in a medium, especially for small changes in the medium properties [28,29]. Most past applications of CWI were in seismology. For example, the coda wave interferometry method was applied to detect the relative location of seismic sources [30,31], locate a cluster of events [32,33], and monitor velocity changes in seismic waves [34,35,36,37,38,39,40]. In applied geophysics, there are only a few applications. Zhou et al. [41] verified the capability of the CWI method for monitoring velocity changes in a CO2 reservoir using time-lapse VSP data. Tang et al. [42] applied CWI to synthetic elastic VSP data to detect 2% changes in velocities in a reservoir. Brenguier et al. [34] combined Green’s function retrieval from ambient noise with coda wave interferometry to perform passive monitoring. Zhu et al. [43] presented an approach for quantifying the dynamics of sequestered CO2 and monitoring CO2 plume evolution by utilizing the continuous seismic coda waves acquired in a borehole. Alcantara and Roehl [44] applied CWI to measure small velocity variations for poroelastic reservoir time-lapse monitoring.
In this study, we applied CWI on time-lapse cross-well datasets to measure velocity changes caused by CO2 injection and detect possible CO2 leakage. We first tested the methodology on synthetic vertical and horizontal component data. The upgoing waves and downgoing waves could delineate the top and bottom interfaces of the layer in which velocity changes occurred, respectively. We also tested the influence of two different acquisition geometries and random noise on the CWI method. We then tested CWI on real time-lapse cross-well datasets acquired at the Ketzin pilot site in Germany [45,46]. Denoising and time-lapse processing steps were applied to the datasets to improve the signal-to-noise ratio (SNR) and repeatability. We suggest that the application of CWI on time-lapse cross-well datasets provides an efficient methodology for monitoring CO2 sequestration, and the results supplement conventional velocity inversion methods.
2. Theory
Snieder et al. [28] used CWI to measure the temporal change in a medium from scattered coda waves. For time-lapse seismic monitoring of CO2 geological storage, a velocity change in the reservoir will lead to changes in the waveforms and travel times of reflected and transmitted waves. The changes in the reservoir can be characterized by a time shift between the wavefields before and after CO2 injection, which can be inferred using CWI.
Assume the time-lapse surveys before and after CO2 injection obtained by repeatable sources represent the unperturbed wavefield and perturbed wavefield, respectively. According to the theory of CWI, the baseline wavefield can be written as a sum of waves that propagate along all possible paths in the medium, which is given by
where is the travel time and denotes the waves propagating along the path . After the CO2 injection, the new, or repeat, wavefield can be written as
where denotes the travel time perturbation of waves propagating along the path caused by the CO2 injection.
The changes in waveforms before and after the CO2 injection can be inferred using time-shifted cross-correlation over a sliding time window. It is defined in Snieder, 2006 [29]:
where the time window is centered at the time with a temporal length of , denotes the travel time, and denotes the time shift of the repeat wavefield relative to the baseline wavefield.
When the time-shift cross-correlation coefficient reaches the maximum value at , the repeat wavefield equals the baseline wavefield within the time window such that the travel time perturbation is equal to the time shift , which can also be written as
For each time window, the relative velocity change is given by Snieder et al. [28]:
The relative velocity change is saved as a function of the central time of the specified time window. The mean velocity change can then be written as
where ⟨⟩ is the mean travel time perturbation of waves that arrive at the specified time window. After calculating the mean velocity changes at all receiver positions, the obtained mean velocity changes as a function of receiver depth can be further used for detecting velocity changes caused by CO2 injection.
3. Synthetic Data Examples
3.1. Synthetic Two-Component (2C) Time-Lapse Cross-Well Datasets
In this section, we applied CWI to synthetic time-lapse cross-well datasets generated using a 2D finite-difference program [47]. The synthetic P wave velocity models used, as well as the baseline, first-repeat, and second-repeat surveys, are shown in Figure 1a–c. The first-repeat survey simulated CO2 injection monitoring and the second-repeat survey simulated CO2 leakage scenarios. The P wave velocities, S wave velocities, and densities used for the synthetic baseline seismic datasets are shown in Figure 1d. The velocity models are based upon information from the field 3D surface seismic and well logging surveys at the Ketzin pilot site, Germany. The acquisition geometry is shown in Figure 1e. The source was located at a depth of 400 m in the source well, and 301 two-component (2C) receivers (one vertical component and one radial horizontal component) were evenly placed at an interval of 1 m in the receiver well from a depth of 400 m to 700 m. The red star indicates the source location and the blue inverted triangles represent the receivers. The time-sampling interval was 0.2 ms, and the total recording time was 0.6 s. The dominant frequency of the source wavelet was 70 Hz. For the monitoring survey, we utilized a 10% decrease in P wave velocity and a 9% decrease in S wave velocity caused by CO2 injection in the injection layer based on rock physics modeling [10,48]. The blue arrow indicates the CO2 injection layer with a thickness of 20 m in Figure 1b. Furthermore, the leakage layer was above the top of the cap layer with a thickness of 58 m, as indicated by the green arrow in Figure 1c. We changed the velocities in the leakage layer with the same percentage decrease as in the CO2 injection layer. Examples of vertical component recordings of an original cross-well shot gather from the baseline survey, first-repeat survey, and second-repeat survey are shown in Figure 2a–c, respectively. The corresponding horizontal components are shown in Figure 2d–f, respectively.
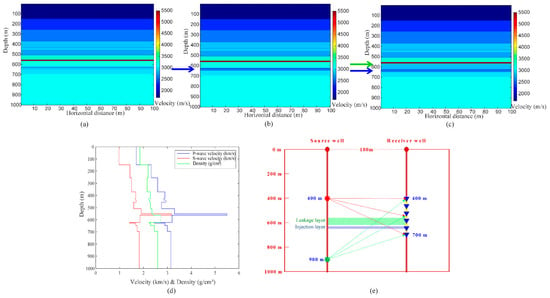
Figure 1.
(a–c) The P wave velocity models for the baseline survey, first-repeat survey, and second-repeat survey, respectively. The injection and leakage layers are indicated by blue arrows and a green arrow, respectively. (d) The P wave velocity profile, S wave velocity profile, and density profile used for generating the synthetic elastic cross-well datasets. (e) The sketch shows the acquisition geometry.
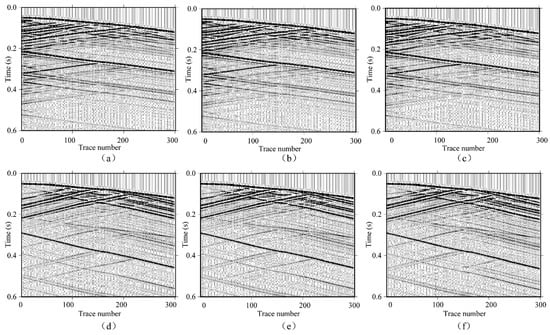
Figure 2.
(a–c) The vertical component of the time-lapse cross-well shot gather with the shallow source position (400 m) from the baseline survey, first-repeat, and second-repeat surveys, respectively. (d–f) as in (a–c) but displaying the horizontal components instead.
Previous studies that applied CWI in time-lapse VSP surveys used only upgoing waves because most of the downgoing wavefield was not recorded below the injection layer [41]. In the upgoing wavefield of VSP data, the coda waves are multiply scattered waves due to the geologic interfaces below the receiver positions. The acquisition condition limits the application of CWI to time-lapse VSP datasets that have sources located on the surface. However, a time-lapse cross-well geometry can provide the potential for using downgoing waves. The coda waves in the downgoing wavefield of cross-well datasets are waves that are multiply scattered from the geologic interfaces above the receiver positions. Therefore, we chose another shot gather with a source located below the injection layer at 900 m depth in the source well, as indicated by the green star in Figure 1e. The original recorded 2C shot gathers are shown in Figure 3. The vertical components from the baseline survey, first-repeat survey, and second-repeat survey are shown in Figure 3a–c, respectively, and the corresponding horizontal components are shown in Figure 3d–f, respectively. It was hard to observe any obvious differences between the shot gathers from the baseline survey and repeat surveys.
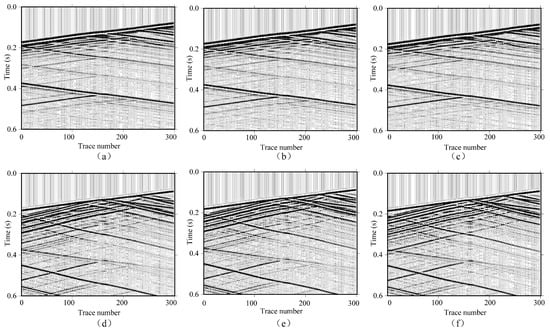
Figure 3.
(a–c) The vertical component of time-lapse cross-well shot gathers with the deep source position (900 m) from the baseline survey, first-repeat, and second-repeat surveys, respectively. (d–f) as in (a–c) but displaying the horizontal components instead.
3.2. Indication of Velocity Changes Using CWI
First, the upgoing and downgoing wavefields were separated by applying a Radon transform. Figure 4a,b present the upgoing waves in the vertical component from the baseline and first-repeat datasets with the source at a shallow depth (400 m), respectively, while Figure 4c,d present the corresponding upgoing waves in the horizontal component. The downgoing waves in the vertical component from the baseline and first-repeat datasets with the source at the deeper level (900 m) are shown in Figure 5a,b, respectively, and the corresponding downgoing waves in the horizontal component are shown in Figure 5c,d. We further separated the P waves from the vertical component and the PS waves from the horizontal component using a Radon transform. Examples after this separation are shown in Figure 6a–d.
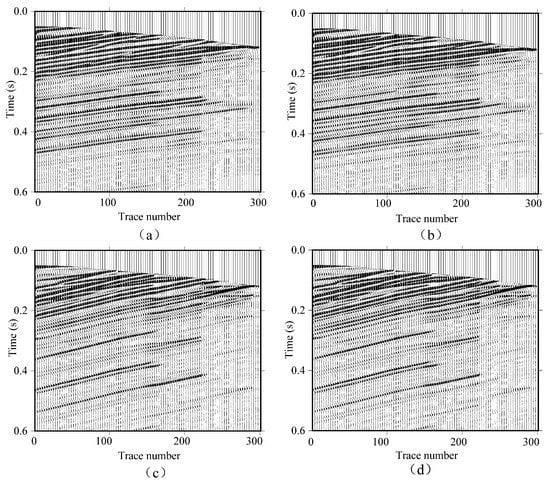
Figure 4.
(a,b) The upgoing waves separated from the corresponding vertical component of the time-lapse cross-well shot gathers with the shallow source position (400 m) from the baseline survey and first-repeat survey, respectively. (c,d) as in (a,b) but displaying the horizontal components instead.
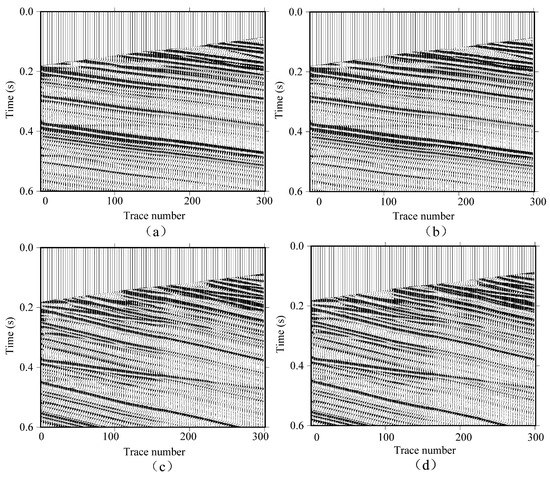
Figure 5.
(a,b) The downgoing waves separated from the corresponding vertical component of the time-lapse cross-well shot gathers with the deep source position (900 m) from the baseline survey and first-repeat survey, respectively. (c,d) as in (a,b) but displaying the horizontal components instead.
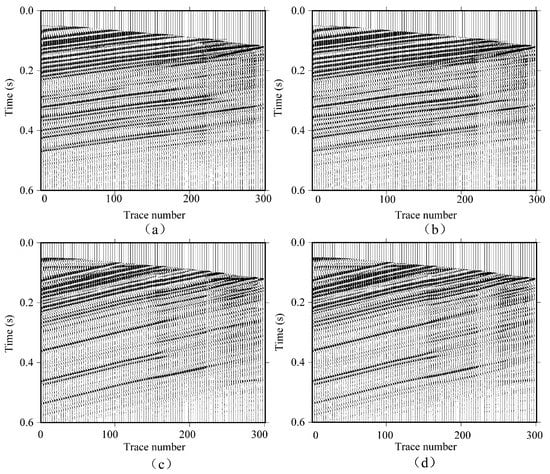
Figure 6.
(a,b) The P waves separated from the upgoing waves in the corresponding vertical component of time-lapse cross-well shot gathers with the shallow source position (400 m) from the baseline survey and first-repeat survey, respectively. (c,d) as in (a,b) but displaying the PS waves separated from upgoing waves in the horizontal components instead.
Next, we utilized CWI to estimate the velocity changes due to the CO2 injection by cross-correlating the signals from the baseline and first-repeat cross-well seismic datasets over a moving time window for each receiver position. The size of the time window chosen depends on the wavelet frequency [44]. In order to avoid some fluctuations and outliers, the length of the time window should be at least four times the wave period [41]. The temporal velocity change was calculated at the center of the moving time window. Then, the mean velocity change was obtained by averaging the calculated temporal velocity changes over the entire seismic trace. Here, the moving time window length was equivalent to six periods at the center frequency. To avoid the cycle-skipping problem, Robinson et al. [30] restricted the time window range to find the maximum correlation coefficient. We also utilized the same method. The workflow chart including the utilized steps for CWI is shown in Figure 7.
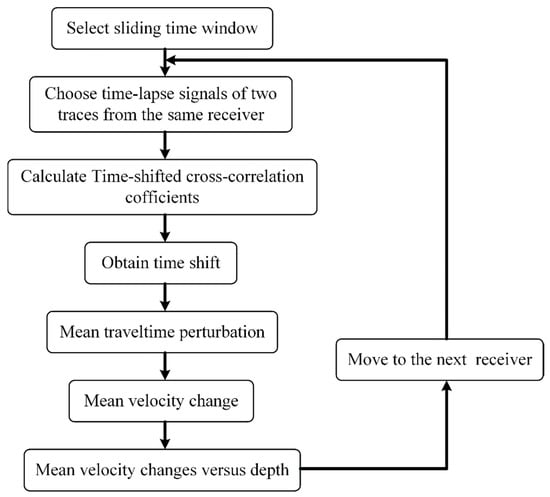
Figure 7.
The workflow chart for CWI.
The calculated mean velocity changes versus the receiver depth from upgoing P waves of the vertical component and PS waves of the horizontal component are shown in Figure 8a and Figure 8b, respectively. The resulting curves from the upgoing waves of the vertical component and horizontal component without separation of the P and S waves are shown in Figure 8c and Figure 8d, respectively. From Figure 8, we can observe that all the curves had similar trends. We can clearly see that the velocity changed with the receiver depth, even though the thickness of the CO2 injection layer was relatively thin. Compared with the P wave wavefield (Figure 8a), the curve obtained from the vertical component without P wave separation (Figure 8c) showed a larger maximum mean velocity change. This was probably due to the larger time delay caused by the interference of P waves and PS waves. Furthermore, compared with the vertical component, which was dominated by P waves (Figure 8c), the curve obtained from the horizontal component, which was dominated by PS waves, presented a larger maximum mean velocity change (Figure 8d). This was probably due to more P wave interference patterns remaining in the horizontal component compared with the PS wave interference remaining in the vertical component. These results also showed that the curves from wavefields without additional separation of P and PS waves could be directly utilized to indicate velocity changes. Therefore, we did not apply additional separation of the P wave and PS wave in the following analysis.
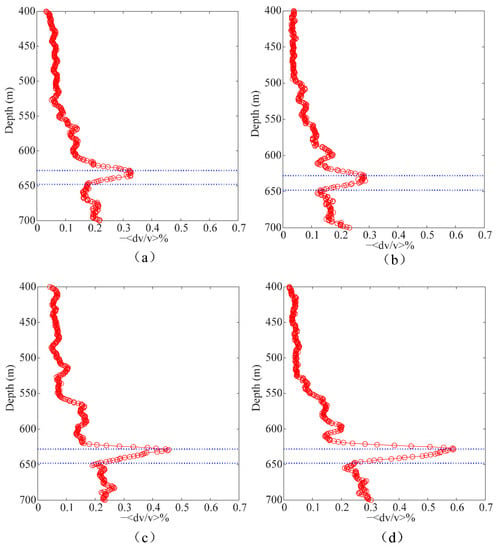
Figure 8.
The estimated mean velocity change versus the receiver depth from the baseline survey and first-repeat survey using (a) CWI processing of the upgoing P waves of the vertical component obtained via wavefield separation, (b) CWI processing of the upgoing PS waves of the horizontal component obtained via wavefield separation, (c) CWI processing of the upgoing waves of the vertical component, and (d) CWI processing of the upgoing waves of the horizontal component. The CO2 injection layer is indicated by blue dotted lines.
Starting from the receivers located at the shallowest depth, the fluctuation of the mean velocity changes was relatively small. The mean velocity change had a significant increase when the receiver position approached the top of the CO2 injection layer. For the upgoing wavefield, the maximum mean velocity change occurred at the receiver just above the top interface of the injection layer. Below that, the velocity change decreased with increasing receiver depth inside the CO2 injection layer. Below the injection layer, the velocity changes were again relatively small values. By considering the propagation paths, we found that the upgoing waves recorded by each receiver had variable propagation paths through the model and the upgoing waves through the injection layer where the velocity changed occupied different proportions of the total travel paths. Compared with other receivers, the upgoing waves recorded by the receiver located right at the top interface of the injection layer propagated to the highest proportion through the injection layer, leading to the maximum mean velocity change.
Compared with the previous studies of CWI applied to time-lapse VSP datasets [41], the curves from both upgoing waves of time-lapse VSP and cross-well datasets had very similar trends over the whole receiver array. The obtained maximum mean velocity changes indicated the top interface of the injection layer. However, if both upgoing and downgoing waves of the time-lapse cross-well datasets can be used, we can then define the base of the injection layer.
To show this, we obtained the mean velocity changes versus the receiver depth from the downgoing waves of the vertical and horizontal components, as shown in Figure 9a and Figure 9b, respectively. In this case, the mean velocity changes estimated by the downgoing waves at most receiver positions were always larger than those estimated by the upgoing waves. According to the geometry and the depth of the CO2 injection layer, we inferred that a larger proportion of the downgoing wavefield was traveling within the injection layer compared with the upgoing waves, leading to a larger mean velocity change. In addition, in contrast to the results from the upgoing waves, the maximum mean velocity change occurred near the bottom interface of the CO2 injection layer. Compared with other receivers, the downgoing waves recorded by the receiver located at the bottom interface of the injection layer had the largest proportion of their travel path passing through the injection layer, leading to the maximum mean velocity change at this location. This result showed that the processing of the downgoing waves also allowed for the detection of relative velocity changes when CWI was applied to time-lapse cross-well datasets. In particular, the combination of upgoing and downgoing waves provided a better indication of the depth range of velocity changes.
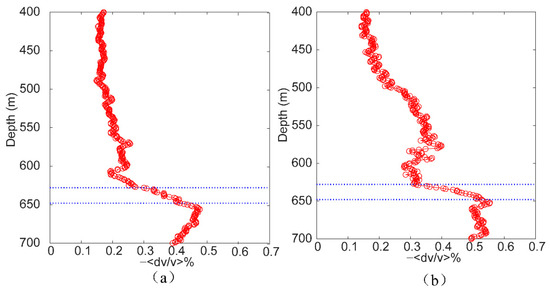
Figure 9.
The estimated mean velocity change versus the receiver depth from the baseline survey and first-repeat survey using (a) CWI processing of the downgoing waves of the vertical component and (b) CWI processing of the downgoing waves of the horizontal component. The CO2 injection layer is indicated by blue dotted lines.
The obtained mean velocity changes versus the receiver depth from upgoing waves of the vertical and horizontal components for the CO2 leakage scenario are shown in Figure 10a and Figure 10b, respectively. The local maximum mean velocity changes occurred at the top interfaces of the injection and leakage layers, and the mean velocity changes decreased continuously within the injection layer. The global maximum mean velocity changes appeared in the leakage layer caused by the accumulation of velocity changes in upgoing waves. Figure 10c,d present the velocity change curves from downgoing waves of the vertical and horizontal components, respectively. The local maximum mean velocity changes appeared near the bottom interfaces of the injection layer and leakage layer, and the global maximum mean velocity change was located at the bottom interface of the injection layer due to the cumulative effect of velocity changes in the downgoing waves. In this case, the vertical resolution of the curve obtained from the upgoing waves was better than that obtained from the downgoing waves. The results for the leakage scenario show the overall contribution from the injection and leakage layers.
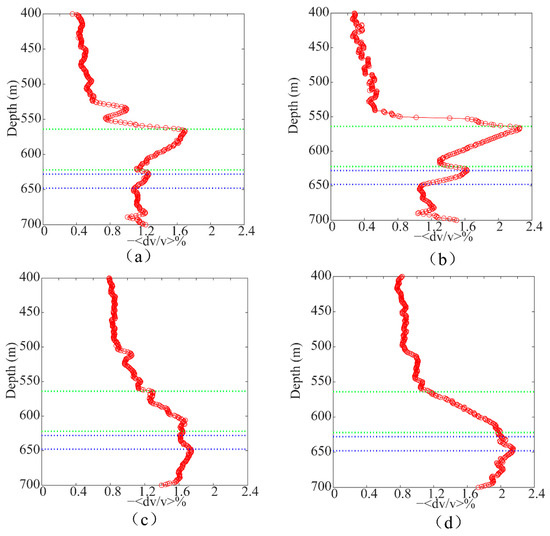
Figure 10.
The estimated mean velocity change versus the receiver depth from the baseline survey and second-repeat survey using (a) CWI processing of the upgoing waves of the vertical component, (b) CWI processing of the upgoing waves of the horizontal component, (c) CWI processing of the downgoing waves of the vertical component, and (d) CWI processing of the downgoing waves of the horizontal component. The CO2 injection layer is indicated by blue dotted lines and the CO2 leakage layer is indicated by green dotted lines.
We also applied CWI to the first-repeat survey and second-repeat survey to verify the characteristics of the mean velocity change curves. The estimated mean velocity changes from the vertical component and horizontal component of the upgoing waves are shown in Figure 11a and Figure 11b, respectively, and the ones from the vertical component and horizontal component of the downgoing waves are shown in Figure 11c and Figure 11d, respectively. Similar conclusions can be drawn from these tests. In addition, the comparisons between Figure 8, Figure 9, Figure 10 and Figure 11 show that CWI had the ability to detect CO2 leakage scenarios.
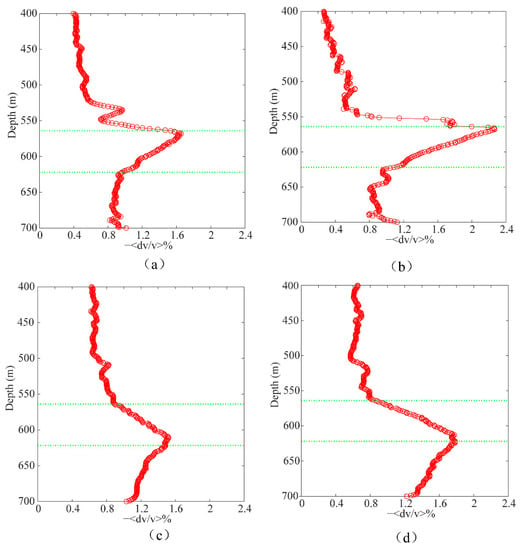
Figure 11.
The estimated mean velocity change versus the receiver depth from the first-repeat survey and second-repeat survey using (a) CWI processing of the upgoing waves of the vertical component, (b) CWI processing of the upgoing waves of the horizontal component, (c) CWI processing of the downgoing waves of the vertical component, and (d) CWI processing of the downgoing waves of the horizontal component, respectively. The CO2 leakage layer is indicated by green dotted lines.
3.3. Application of a Typical Cross-Well Geometry
Next, we tested CWI on the synthetic datasets with a typical cross-well geometry modified from the real geometry of the Ketzin pilot site. The survey had six sources that were evenly distributed from 425 m to 675 m at 50 m intervals along the source well. The 2C receivers were evenly spaced from 400 m to 700 m at 1 m intervals along the receiver well, as before. Every source location corresponded to the central position of the receiver array, which consisted of 50 receivers. A sketch of the geometry is shown in Figure 12a. CWI was applied to the baseline and first-repeat time-lapse cross-well datasets as an example. The resulting mean velocity changes versus the receiver depth from upgoing waves of the vertical and horizontal components are shown in Figure 12b and Figure 12c, respectively. Compared with the geometry with all receivers recording the wavefields at the same time (Figure 1e), the maximum mean velocity change under the new geometry was more significant due to a larger proportion of travel paths within the injection layer, leading to a larger detectable time shift. For the downgoing waves, the resulting vertical and horizontal curves are shown in Figure 12d and Figure 12e, respectively. The velocity changes were nearly zero at geophones above 600 m since there were no downgoing waves that passed through the injection layer under the new geometry.
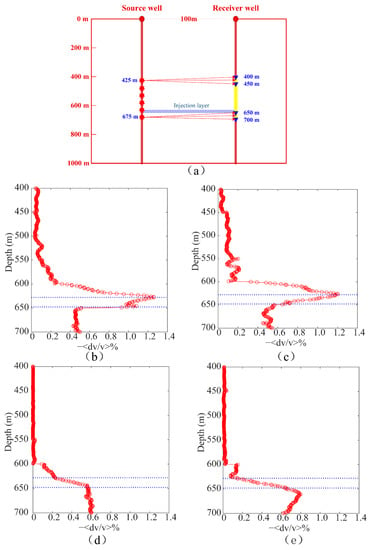
Figure 12.
(a) The sketch shows the utilized acquisition geometry. The estimated mean velocity change versus the receiver depth from the baseline survey and the first-repeat survey using (b) CWI processing of the upgoing waves of the vertical component, (c) CWI processing of the upgoing waves of the horizontal component, (d) CWI processing of the downgoing waves of the vertical component, and (e) CWI processing of the downgoing waves of the horizontal component.
Based on the above results, we found that the mean velocity changes were related to the geometry and subsurface structure. The geometry determines how ray paths travel in the specific subsurface structure and affects how coda waves pass through the region where velocity changes occur. The greater the wavefield that passes through the layer where the velocity change occurs, the larger the time shift will be, and thus, larger mean velocity changes can be observed. The synthetic tests suggested that CWI has potential as a method for time-lapse cross-well reservoir monitoring to delineate the CO2 injection and leakage scenarios.
3.4. Test of Noise-Contaminated Time-Lapse Datasets
When the SNR is low, it is common to use the section of signals with a relatively small noise level for the CWI calculation [49]. On the other hand, low SNRs also have a negative influence on time-lapse seismic monitoring. Therefore, we tested the noise sensitivity of CWI applied to time-lapse seismic data. A random Gaussian white noise with an SNR of 10 dB was added to the original time-lapse cross-well shot gathers from the baseline and first-repeat surveys. An example of upgoing waves of the vertical component from the baseline survey with random noise added is shown in Figure 13a. After applying CWI to the noise-contaminated time-lapse datasets, we obtained the mean velocity changes versus the depth, as shown in Figure 13c. The resulting curve fluctuated significantly due to the random noise. To improve the SNR of noise-contaminated time-lapse seismic datasets, we utilized a combination of FX deconvolution, median filtering, and singular value decomposition (SVD) filtering for noise suppression in this case. The shot gather after denoising is shown in Figure 13b, and the obtained velocity change curve is shown in Figure 13d. A comparison between Figure 13c,d shows that the curve was coherent again, and the indication of the CO2 injection layer using the maximum mean velocity change was clearer after denoising.
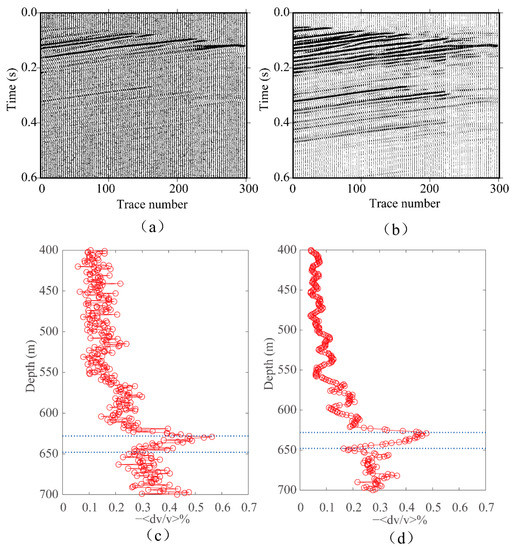
Figure 13.
(a) The upgoing waves of the vertical component contaminated with random noise. (b) as in (a) but contains the wavefields after FX deconvolution, median filtering, and SVD filtering. (c,d) The estimated mean velocity change versus the receiver depth from the CWI processing of the datasets without and with denoising.
4. Real Data Example
Real time-lapse cross-well seismic datasets were acquired at the Ketzin pilot site, west of Berlin, Germany (Figure 14a). Three wells had been drilled at the site at the time of the surveys, one being the CO2 injection well and the other two as observation wells (Figure 14b). The receiver well KTZI-202 was about 100 m away from the source well KTZI-200. The distances from the injection well KTZI-201 to the source well KTZI-200 and the receiver well KTZI-202 were 50 m and 120 m, respectively. A time-distributed VIBSIST piezoelectric borehole source was activated along the source well KTZI-200 at an interval of 1 m from depths 452 m to 739 m (288 source positions in total). The utilized VIBSIST-SPH source was based on the swept impact seismic technique (SIST), and the seismic energy generated by each pulse was approximately 4–8 J in a frequency band of 350–3500 Hz [21]. The receivers were placed along the receiver well KTZI-202 at 1 m intervals from depths 464 m to 726 m, where the number of receivers per shot gather varied, but with a maximum number of 36 and with a 12-level hydrophone chain being used. The baseline survey was performed in May 2008 before the CO2 injection. The first-repeat survey was conducted in July 2008 after about 650 tons of CO2 had been injected. The second-repeat survey was conducted in August 2008 after about 1750 tons CO2 had been injected. The CO2 was injected into a saline sandstone aquifer within the heterogeneous upper part of the Triassic Stuttgart Formation at approximately 630–650 m in depth [50,51]. The caprock of the CO2 storage consisted of the Weser and Arnstadt Formations, which comprised mudstone and evaporated with a thickness of almost 210 m. At the top of the Weser formation, there was a nearly 20 m-thick high-velocity anhydrite layer (K2).
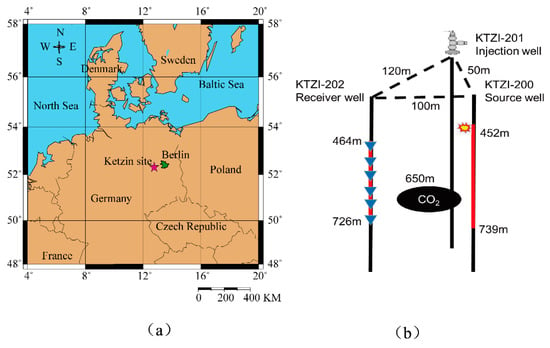
Figure 14.
(a) Location of the Ketzin pilot site, west of Berlin, Germany. (b) A sketch of the geometry of the cross-well surveys at the Ketzin site.
In the first-repeat survey, the injected CO2 was detected in the observation well KTZI-200 but not in the observation well KTZI-202. In the second-repeat survey, CO2 still had not reached the observation well KTZI-202. Travel time tomography was applied to the cross-well data at Ketzin to monitor CO2-induced velocity changes [18,21]. In a previous study of CO2 injection monitoring via waveform tomography, velocity changes could be detected when comparing the baseline and the second-repeat surveys between the source well and receiver well [21]. Hence, in this study, we performed CWI by utilizing these cross-well field seismic datasets from the baseline and second-repeat surveys. First, we selected nine shot gathers from each time-lapse dataset that included all receiver positions, and the geometries of these shot gathers were the same. Shot gathers from a source depth of about 617 m from the baseline survey and the second-repeat survey are shown in Figure 15a and Figure 15b, respectively. Inconsistent hydrophone coupling conditions, small differences in source/sensor locations, and possibly changed conditions in the casing annulus between the different surveys could explain the visible differences between the time-lapse cross-well seismic datasets. For both time-lapse datasets, the Radon transform was used for the separation of upgoing waves and downgoing waves. FX deconvolution was applied to improve the SNR. In order to further improve the repeatability of the time-lapse cross-well datasets, time-lapse processing, including a matching filter, was applied to reduce the time-lapse differences that were not related to the CO2 injection. The primary processing steps for the time-lapse cross-well datasets are listed in Table 1. Figure 16a–d present the upgoing and downgoing wavefields from the baseline and second-repeat surveys after processing.
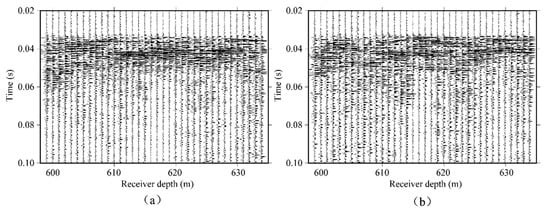
Figure 15.
(a) An example shot gather from the baseline survey. (b) The corresponding shot gather from the second-repeat survey.

Table 1.
Processing steps used in the real time-lapse cross-well datasets.
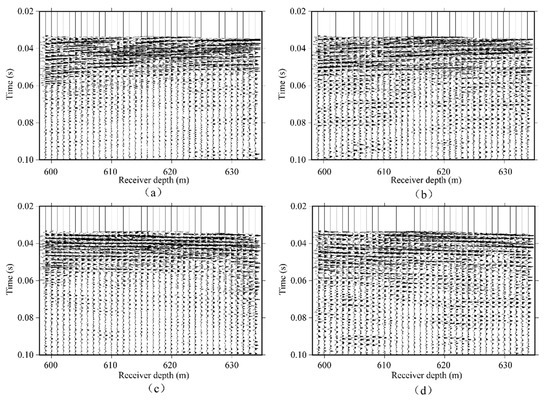
Figure 16.
(a,b) Processed upgoing wavefields from the baseline and second-repeat surveys, respectively. (c,d) Processed downgoing wavefields from the baseline and second-repeat surveys, respectively.
Next, we utilized CWI to estimate the seismic velocity changes caused by CO2 injection. For the processed upgoing wavefields from the baseline datasets and second-repeat datasets, the relative travel time shift in each specific time window was measured using time-shifted cross-correlation. The size of the utilized sliding time window was equal to six periods at the center frequency. The obtained relative velocity change as a function of time and the mean velocity change for the specific trace pair were estimated by averaging the relative velocity changes over the entire seismic trace. Then, all the mean velocity changes became a function of the receiver depth. We then applied CWI for the downgoing wavefields in the same way. For the real time-lapse datasets, it was hard to completely remove the differences between them due to inherent experimental noise. Therefore, the quality and repeatability of the time-lapse seismic datasets affected the calculated mean velocity changes. Curve smoothing was utilized to further filter the resulting curves. Mean velocity changes as a function of receiver depth from upgoing waves and downgoing waves after five-point smoothing are shown in Figure 17a and Figure 17b, respectively. The two blue dotted lines denote the CO2 injection zone at around 630–650 m in depth. The remaining differences, which were unrelated to CO2 injection, affected the vertical resolution of the curves. However, these two curves could be interpreted to indicate the location of velocity changes because the global maximum mean velocity changes corresponded to the interfaces of the CO2 injection layer. Based on the previous synthetic tests, CWI may have performed even better if our data sets had higher data resolution and better repeatability.
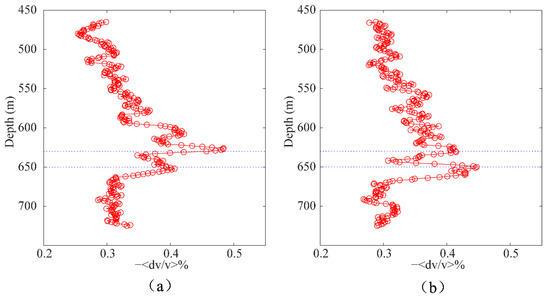
Figure 17.
(a,b) Estimated mean velocity change curves from upgoing and downgoing waves, respectively.
Waveform tomography was successfully applied to previous time-lapse cross-well surveys at the Ketzin pilot site and other sites. It generally performs better than travel time tomography in identifying small velocity changes, whereas classical P wave travel time tomography has difficulty in detecting small velocity changes. The difference image from the waveform tomography results between the baseline and second-repeat surveys (from Zhang et al. [21]) versus the mean velocity change curves using CWI is shown in Figure 18. In the waveform tomography difference image, the velocity differences appeared between 630 and 650 m (marked by a red ellipse) due to the presence of CO2. This corresponded to the depth range indicated by the global maximum values of the curves for the upgoing and downgoing wavefields. The velocity change curves generated using CWI were calculated from just nine source gathers. However, the waveform tomography image was based on the inversion of 269 source gathers. Given that CWI appeared to delineate the top and bottom of the CO2 injection zone, we concluded that CWI is an effective monitoring method for detecting velocity changes in time-lapse surveys by only using a small amount of the dataset and that CWI has the potential to provide an additional constraint on the seismic response caused by CO2 injection and possible CO2 leakage.
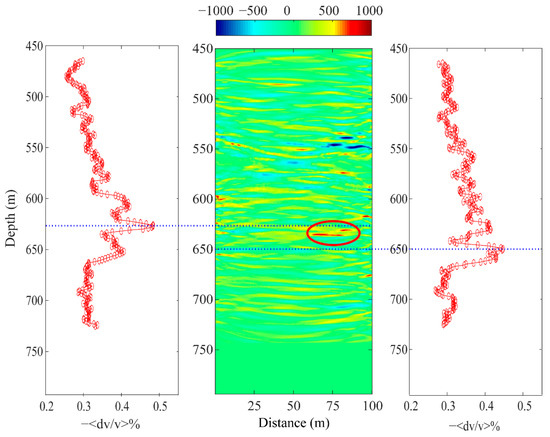
Figure 18.
Comparison of the velocity difference between the baseline and second-repeat surveys from waveform tomography (middle) and the mean velocity change curves from the upgoing (left) and downgoing (right) wavefields.
5. Conclusions
Coda wave interferometry (CWI) applied to time-lapse cross-well surveys has the potential to be an effective tool to monitor CO2 sequestration and detect possible CO2 leakage. The upgoing and downgoing waves can be combined to indicate the presence of velocity changes in the CO2 injection layer and any possible leakage layer. The maximum mean velocity change locations from upgoing and downgoing waves occurred near the top and bottom interface of the layer where the CO2 was assumed to reduce the velocity, respectively. The characteristics of the resulting velocity-changes-versus-depth curves were related to the geometry and the properties of the subsurface medium. The calculated mean velocity changes were closely related to the ratio of the path length of the coda waves passing through the velocity change layer to the entire path of the upgoing/downgoing waves. The larger the ratio, the larger the detectable time shift recorded at the corresponding receiver depth position, which led to a larger mean velocity change. In the synthetic data examples, we tested datasets with two geometry types. Analysis of both datasets showed that the maximum mean velocity change always indicated the depth position of the velocity change. However, the magnitude of the mean velocity changes was related to the specific geometry. The different geometries influenced the ratio of the path length of coda waves passing through the reservoir to the total travel path. Therefore, the values of the mean velocity change depended on the resulting time shifts in the coda waves. In our cases, the datasets from the geometry with a shorter receiver array presented mean velocity change curves with larger maximum mean velocity changes within the reservoir but smaller mean velocity changes outside of it. Therefore, designing a suitable geometry is important in applying the CWI methodology. To some extent, the geometry determines how wavefields pass through the reservoirs and the medium, affecting the estimation of the mean velocity changes.
Furthermore, random noise can have a negative effect on the application of CWI, resulting in incoherency in the velocity change curve. Data repeatability also influences the CWI calculation. We suppressed the random noise and utilized time-lapse dataset processing to improve the quality of the input for CWI on the real time-lapse cross-well datasets. Therefore, improving the quality and repeatability of the input time-lapse datasets is also a very important factor in the CWI methodology’s application.
Time-lapse seismic surveys generally need a high source density to increase the capability of CO2 sequestration monitoring. However, our study demonstrated that CWI is a potentially effective tool for time-lapse reservoir monitoring with high computational efficiency and a lower data density requirement compared with other conventional time-lapse dataset processing methods, such as time-lapse imaging, travel time tomography, and waveform inversion. Since only one or several source gathers are needed to detect velocity changes in the reservoir, CWI has the potential to be used for permanent source and receiver setups, which are usually sparse, compared with conventional seismic surveys. In addition, CWI can be used as an effective supplement to other time-lapse analysis results. The obtained velocity changes versus the depth provide another constraint on the CO2 injection monitoring and reduce the uncertainty. For CWI, neither time-consuming imaging nor a large number of first-arrival picks is required. However, some time-lapse dataset processing is necessary to improve the repeatability of the surveys. Just as time-lapse image processing may be affected by imaging errors, the inversion of the velocity field may be affected by inversion errors, and the quality of time-lapse datasets has an influence on the detection accuracy of CWI. In a future study, we will further investigate other CWI algorithms to determine whether the accuracy and stability of the resulting velocity curves can be improved.
Though our case history only considered CO2 storage, CWI may be a relevant methodology for other time-lapse cross-well, VSP, and exploration seismic datasets. The method utilized in this study can be further extended to the application of distributed acoustic sensing (DAS) monitoring surveys. Permanently installed receivers and sources can significantly improve the repeatability of time-lapse seismic monitoring.
Finally, given that CWI detected velocity perturbations in the reservoir as low as 1% for synthetic time-lapse VSP datasets, we inferred that CWI also has the potential to detect small velocity changes when applied to other time-lapse cross-well surveys.
Author Contributions
Conceptualization, Z.X. and F.Z.; methodology, Z.X., X.G. and L.H.; software, Z.X., X.G. and L.H.; validation, Z.X., F.Z. and C.J.; formal analysis, Z.X., X.G. and L.H.; resources, Z.X., F.Z., C.J., C.C. and S.L.; data curation, Z.X., F.Z., C.J., C.C. and S.L.; writing—original draft preparation, Z.X. and F.Z.; writing—review and editing, Z.X., F.Z., X.G., L.H., C.J., C.C. and S.L.; visualization, Z.X. and F.Z.; supervision, Z.X., F.Z., X.G., L.H., C.J., C.C. and S.L.; project administration, Z.X., F.Z., X.G., L.H., C.J., C.C. and S.L.; funding acquisition, Z.X., F.Z., X.G., L.H., C.J., C.C. and S.L. All authors have read and agreed to the published version of the manuscript.
Funding
This research was funded by the National Natural Science Foundation of China, grant nos. 41874139, 42274164, 41974138, and 42074151.
Data Availability Statement
The data is available on request.
Acknowledgments
The seismic data sets were acquired by Vibrometric Oy. The Geotechnologien program of the German Federal Ministry of Education and Research partly funded the seismic data acquisition.
Conflicts of Interest
The authors declare no conflict of interest.
References
- Harris, J.M.; Langan, R.T.; Fasnacht, T.; Melton, D.; Smith, B.; Sinton, J.; Tan, H. Experimental verification of seismic monitoring of CO2 injection in carbonate reservoirs. In SEG Technical Program Expanded Abstracts 1996; Society of Exploration Geophysicists: Houston, TX, USA, 1996; pp. 1870–1872. [Google Scholar]
- Azuma, H.; Konishi, C.; Nobuoka, D.; Xue, Z.; Watanabe, J. Quantitative CO2 saturation estimation from time lapse sonic logs by consideration of uniform and patchy saturation. Energy Procedia 2011, 4, 3472–3477. [Google Scholar] [CrossRef][Green Version]
- Onishi, K.; Ueyama, T.; Matsuoka, T.; Nobuoka, D.; Saito, H.; Azuma, H.; Xue, Z. Application of crosswell seismic tomography using difference analysis with data normalization to monitor CO2 flooding in an aquifer. Int. J. Greenh. Gas Control 2009, 3, 311–321. [Google Scholar] [CrossRef]
- Saito, H.; Nobuoka, D.; Azuma, H.; Tanase, D.; Xue, Z. Time-Lapse Cross-Well Seismic Tomography for Monitoring CO2 Geological Sequestration at the Nagaoka Pilot Project Site. J. MMIJ 2008, 124, 78–86. [Google Scholar] [CrossRef]
- Daley, T.M.; Solbau, R.D.; Ajo-Franklin, J.B.; Benson, S.M. Continuous active-source seismic monitoring of C O2 injection in a brine aquifer. Geophysics 2007, 72, A57–A61. [Google Scholar] [CrossRef]
- Xue, Z.; Tanase, D.; Watanabe, J. Estimation of CO2 Saturation from Time-Lapse CO2 well Logging in an Onshore Aquifer, Nagaoka, Japan. Explor. Geophys. 2006, 37, 19–29. [Google Scholar] [CrossRef]
- Saito, H.; Nobuoka, D.; Azuma, H.; Xue, Z.; Tanase, D. Time-Lapse Crosswell Seismic Tomography for Monitoring Injected CO2 in an Onshore Aquifer, Nagaoka, Japan. Explor. Geophys. 2006, 37, 30–36. [Google Scholar] [CrossRef]
- Xue, Z.; Tanase, D.; Saito, H.; Nobuoka, D.; Watanabe, J. Time-lapse crosswell seismic tomography and well logging to monitor the injected CO2 in an onshore aquifer, Nagaoka, Japan. In SEG Technical Program Expanded Abstracts 2005; Society of Exploration Geophysicists: Houston, TX, USA, 2005; pp. 1433–1436. [Google Scholar]
- Arts, R.; Eiken, O.; Chadwick, A.; Zweigel, P.; van der Meer, L.; Zinszner, B. Monitoring of CO2 injected at Sleipner using time-lapse seismic data. Energy 2004, 29, 1383–1392. [Google Scholar] [CrossRef]
- Wang, Z.; Cates, M.E.; Langan, R.T. Seismic monitoring of a CO2 flood in a carbonate reservoir: A rock physics study. Geophysics 1998, 63, 1604–1617. [Google Scholar] [CrossRef]
- Chadwick, R.A.; Noy, D.J. History-matching flow simulations and time-lapse seismic data from the Sleipner CO2 plume. Geol. Soc. Lond. Pet. Geol. Conf. Ser. 2011, 7, 1171–1182. [Google Scholar] [CrossRef]
- Ivandic, M.; Juhlin, C.; Lüth, S.; Bergmann, P.; Kashubin, A.; Sopher, D.; Ivanova, A.; Baumann, G.; Henninges, J. Geophysical monitoring at the Ketzin pilot site for CO2 storage: New insights into the plume evolution. Int. J. Greenh. Gas Control 2015, 32, 90–105. [Google Scholar] [CrossRef]
- White, D.J. Geophysical monitoring of the Weyburn CO2 flood: Results during 10 years of injection. Energy Procedia 2011, 4, 3628–3635. [Google Scholar] [CrossRef]
- Daley, T.M.; Myer, L.R.; Peterson, J.E.; Majer, E.L.; Hoversten, G.M. Time-lapse crosswell seismic and VSP monitoring of injected CO2 in a brine aquifer. Environ. Geol. 2007, 54, 1657–1665. [Google Scholar] [CrossRef]
- Harris, K.; White, D.; Samson, C.; Tao, J. 4D vertical seismic profile modeling of CO2 injection scenarios to evaluate field results at Aquistore. Int. J. Greenh. Gas Control 2018, 72, 192–207. [Google Scholar] [CrossRef]
- Lüth, S.; Bergmann, P.; Cosma, C.; Enescu, N.; Giese, R.; Götz, J.; Ivanova, A.; Juhlin, C.; Kashubin, A.; Yang, C.; et al. Time-lapse seismic surface and down-hole measurements for monitoring CO2 storage in the CO2SINK project (Ketzin, Germany). Energy Procedia 2011, 4, 3435–3442. [Google Scholar] [CrossRef][Green Version]
- O’Brien, J.; Kilbride, F.; Lim, F. Time-lapse VSP reservoir monitoring. Lead. Edge 2004, 23, 1178–1184. [Google Scholar] [CrossRef]
- Cosma, C.; Enescu, N. CO2 Injection Monitoring by High Resolution Time-lapse Crosshole Seismics (The CO2SINK Team-CO2SINK Project). In Proceedings of the 1st Sustainable Earth Sciences Conference and Exhibition (SES2011), Valencia, Spain, 8–11 November 2011. [Google Scholar]
- Lazaratos, S.K.; Marion, B.P. Crosswell seismic imaging of reservoir changes caused by CO2injection. Lead. Edge 1997, 16, 1300–1308. [Google Scholar] [CrossRef]
- Spetzler, J.; Xue, Z.; Saito, H.; Nishizawa, O. Case story: Time-lapse seismic crosswell monitoring of CO2 injected in an onshore sandstone aquifer. Geophys. J. Int. 2008, 172, 214–225. [Google Scholar] [CrossRef]
- Zhang, F.; Juhlin, C.; Cosma, C.; Tryggvason, A.; Pratt, R.G. Cross-well seismic waveform tomography for monitoring CO2 injection: A case study from the Ketzin Site, Germany. Geophys. J. Int 2012, 189, 629–646. [Google Scholar] [CrossRef]
- Singh, S.C.; Queisser, M. Quantitative Seismic Monitoring of CO2 at Sleipner Using 2D Full–waveform Inversion in the Time–lapse Mode. In Proceedings of the 72nd EAGE Conference and Exhibition incorporating SPE EUROPEC 2010, Barcelona, Spain, 14–17 June 2010. [Google Scholar]
- Gosselet, A.; Singh, S. 2D Full wave form inversion in time-lapse mode: CO2 quantification at Sleipner. In Proceedings of the 70th EAGE Conference and Exhibition-Workshops and Fieldtrips, Rome, Italy, 9–12 June 2008. [Google Scholar]
- Ichikawa, M.; Mouri, T.; Shigematsu, A.; Kato, A.; Nakata, R.; Nakata, N.; Xue, Z. Application of time-lapse acoustic FWI to cross-well seismic monitoring data sets in a CCS field. In Proceedings of the 82nd EAGE Annual Conference & Exhibition, Amsterdam, The Netherlands, 18–21 October 2021; pp. 1–5. [Google Scholar]
- Nakata, R.; Nakata, N.; Girard, A.; Ichikawa, M.; Kato, A.; Lumley, D.; Xue, Z. Time-lapse crosswell seismic monitoring of CO2 injection at the Nagaoka CCS site using elastic full-waveform inversion. In Proceedings of the Second International Meeting for Applied Geoscience & Energy, Houston, TX, USA, 28 August–1 September 2022; pp. 802–806. [Google Scholar]
- Lumley, D.; Adams, D.; Wright, R.; Markus, D.; Cole, S. Seismic monitoring of CO2 geo-sequestration: Realistic capabilities and limitations. In SEG Technical Program Expanded Abstracts 2008; Society of Exploration Geophysicists: Houston, TX, USA, 2008; pp. 2841–2845. [Google Scholar]
- Poupinet, G.; Ellsworth, W.L.; Frechet, J. Monitoring velocity variations in the crust using earthquake doublets: An application to the Calaveras Fault, California. J. Geophys. Res. Solid Earth 1984, 89, 5719–5731. [Google Scholar] [CrossRef]
- Snieder, R.; Gret, A.; Douma, H.; Scales, J. Coda wave interferometry for estimating nonlinear behavior in seismic velocity. Science 2002, 295, 2253–2255. [Google Scholar] [CrossRef]
- Snieder, R. The Theory of Coda Wave Interferometry. Pure Appl. Geophys. 2006, 163, 455–473. [Google Scholar] [CrossRef]
- Robinson, D.J.; Sambridge, M.; Snieder, R. A probabilistic approach for estimating the separation between a pair of earthquakes directly from their coda waves. J. Geophys. Res. 2011, 116, B04309. [Google Scholar] [CrossRef][Green Version]
- Snieder, R.; Vrijlandt, M. Constraining the source separation with coda wave interferometry: Theory and application to earthquake doublets in the Hayward fault, California. J. Geophys. Res. Solid Earth 2005, 110, B04301. [Google Scholar] [CrossRef]
- Robinson, D.J.; Sambridge, M.; Snieder, R.; Hauser, J. Relocating a Cluster of Earthquakes Using a Single Seismic Station. Bull. Seismol. Soc. Am. 2013, 103, 3057–3072. [Google Scholar] [CrossRef]
- Zhao, Y.; Curtis, A.; Baptie, B. Locating microseismic sources with a single seismometer channel using coda wave interferometry. Geophysics 2017, 82, A19–A24. [Google Scholar] [CrossRef]
- Brenguier, F.; Campillo, M.; Hadziioannou, C.; Shapiro, N.M.; Nadeau, R.M.; Larose, E. Postseismic relaxation along the San Andreas fault at Parkfield from continuous seismological observations. Science 2008, 321, 1478–1481. [Google Scholar] [CrossRef]
- Schaff, D.P.; Beroza, G.C. Coseismic and postseismic velocity changes measured by repeating earthquakes. J. Geophys. Res. Solid Earth 2004, 109, B10302. [Google Scholar] [CrossRef]
- Sheng, Y.; Ellsworth, W.L.; Lellouch, A.; Beroza, G.C. Depth Constraints on Coseismic Velocity Changes from Frequency-Dependent Measurements of Repeating Earthquake Waveforms. J. Geophys. Res. Solid Earth 2021, 126, e2020JB020421. [Google Scholar] [CrossRef]
- Wang, B.; Zhu, P.; Chen, Y.; Niu, F.; Wang, B. Continuous subsurface velocity measurement with coda wave interferometry. J. Geophys. Res. 2008, 113, B12313. [Google Scholar] [CrossRef]
- Chen, J.H.; Froment, B.; Liu, Q.Y.; Campillo, M. Distribution of seismic wave speed changes associated with the 12 May 2008 Mw 7.9 Wenchuan earthquake. Geophys. Res. Lett. 2010, 37, L18302. [Google Scholar] [CrossRef]
- Minato, S.; Tsuji, T.; Ohmi, S.; Matsuoka, T. Monitoring seismic velocity change caused by the 2011 Tohoku-oki earthquake using ambient noise records. Geophys. Res. Lett. 2012, 39, L09309. [Google Scholar] [CrossRef]
- Richter, T.; Sens-Schönfelder, C.; Kind, R.; Asch, G. Comprehensive observation and modeling of earthquake and temperature-related seismic velocity changes in northern Chile with passive image interferometry. J. Geophys. Res. Solid Earth 2014, 119, 4747–4765. [Google Scholar] [CrossRef]
- Zhou, R.; Huang, L.; Rutledge, J.T.; Fehler, M.; Daley, T.M.; Majer, E.L. Coda-wave interferometry analysis of time-lapse VSP data for monitoring geological carbon sequestration. Int. J. Greenh. Gas Control 2010, 4, 679–686. [Google Scholar] [CrossRef]
- Tang, J.; Li, J.-J.; Yao, Z.-A.; Shao, J.; Sun, C.-Y. Reservoir time-lapse variations and coda wave interferometry. Appl. Geophys. 2015, 12, 244–254. [Google Scholar] [CrossRef]
- Zhu, T.; Ajo-Franklin, J.; Daley, T.M.; Marone, C. Dynamics of geologic CO2 storage and plume motion revealed by seismic coda waves. Proc. Natl. Acad. Sci. USA 2019, 116, 2464–2469. [Google Scholar] [CrossRef] [PubMed]
- Roehl, K.F.A.D. Coda wave interferometry analysis on 4D seismic response from poroelastic and elastic reservoirs. In Proceedings of the 53rd US Rock Mechanics/Geomechanics Symposium, New York, NY, USA, 23–26 June 2019. [Google Scholar]
- Förster, A.; Giese, R.; Juhlin, C.; Norden, B.; Springer, N. The Geology of the CO2SINK Site: From Regional Scale to Laboratory Scale. Energy Procedia 2009, 1, 2911–2918. [Google Scholar] [CrossRef]
- Martens, S.; Liebscher, A.; Möller, F.; Henninges, J.; Kempka, T.; Lüth, S.; Norden, B.; Prevedel, B.; Szizybalski, A.; Zimmer, M.; et al. CO2 Storage at the Ketzin Pilot Site, Germany: Fourth Year of Injection, Monitoring, Modelling and Verification. Energy Procedia 2013, 37, 6434–6443. [Google Scholar] [CrossRef]
- Thorbecke, J.W.; Draganov, D. Finite-difference modeling experiments for seismic interferometry. Geophysics 2011, 76, H1–H18. [Google Scholar] [CrossRef]
- Yang, C.; Fan, W.; Juhlin, C. Coda-wave interferometry analysis of Synthetic time-lapse VSP data at CO2SINK project site, Ketzin, Germany. In Proceedings of the Borehole Geophysics Workshop-Emphasis on 3D VSP 2011, Istanbul, Turkey, 16–20 January 2011. [Google Scholar]
- Douma, H.; Snieder, R. Correcting for bias due to noise in coda wave interferometry. Geophys. J. Int. 2006, 164, 99–108. [Google Scholar] [CrossRef]
- Götz, J.; Lüth, S.; Krawczyk, C.M.; Cosma, C. Zero-Offset VSP Monitoring of CO2Storage: Impedance Inversion and Wedge Modelling at the Ketzin Pilot Site. Int. J. Geophys. 2014, 2014, 1–15. [Google Scholar] [CrossRef]
- Norden, B.; Förster, A.; Vu-Hoang, D.; Marcelis, F.; Springer, N.; Le Nir, I. Lithological and Petrophysical Core-Log Interpretation in CO2SINK, the European CO2 Onshore Research Storage and Verification Project. SPE Reserv. Eval. Eng. 2010, 13, 179–192. [Google Scholar] [CrossRef]
Publisher’s Note: MDPI stays neutral with regard to jurisdictional claims in published maps and institutional affiliations. |
© 2022 by the authors. Licensee MDPI, Basel, Switzerland. This article is an open access article distributed under the terms and conditions of the Creative Commons Attribution (CC BY) license (https://creativecommons.org/licenses/by/4.0/).