Article

High-Dimensional Seismic Data Reconstruction Based on Linear Radon Transform–Constrained Tensor CANDECOM/PARAFAC Decomposition

1
Wave Phenomena and Intelligent Inversion Imaging group (WPI), School of Ocean and Earth Science, Tongji University, Shanghai 200092, China
2
School of Ocean and Earth Science, Tongji University, Shanghai 200092, China
*
Author to whom correspondence should be addressed.
Remote Sens. 2022, 14(24), 6275; https://doi.org/10.3390/rs14246275
Submission received: 25 October 2022 / Revised: 2 December 2022 / Accepted: 6 December 2022 / Published: 11 December 2022
(This article belongs to the Special Issue Geophysical Data Processing in Remote Sensing Imagery)

Abstract

:
Random noise and missing seismic traces are common in field seismic data, which seriously affects the subsequent seismic processing flow. The complete noise-free high-dimensional seismic dataset in the frequency–space (f-x) domain under the local linear assumption are regarded as a low-rank tensor, and each high dimensional seismic dataset containing only one linear event is a rank-1 tensor. The tensor CANDECOM/PARAFAC decomposition (CPD) method estimates complete noise-free seismic signals by characterizing high-dimensional seismic signals as the sum of several rank-1 tensors. In order to improve the stability and effect of the tensor CPD algorithm, this paper proposes a linear Radon transform–constrained tensor CPD method (RCPD) by using the sparsity of factor matrix in the Radon domain after high-dimensional seismic signal tensor CPD and uses alternating direction multiplier method (ADMM) to solve the established optimization problem. This proposed method is an essential realization of the high-dimensional linear Radon transform, and the results of synthetic and field data reconstruction prove the effectiveness of the proposed method.

Graphical Abstract

1. Introduction

Noise and missing seismic traces are inevitable in field seismic data, which reduces the quality of seismic data and affects the accuracy of seismic inversion imaging. Therefore, seismic data denoising and interpolation reconstruction have long been an important part of seismic data preprocessing.
Seismic data reconstruction is based on the best prediction of the signal contained in the seismic data. In recent decades, people have proposed various methods to solve the problem. These methods can be divided into different parts by using the different features of seismic signals, such as the predictive filtering method using the predictability between traces, the low-rank decomposition method using the low rank of data, and the sparse transform method using the sparsity of signals. Based on the predictability of seismic signals, the industry has developed methods such as predictive filtering and Wiener filtering, among others [1,2,3,4]. In addition to predictability, the low rank of seismic signals is also an important feature. The multi-channel singular spectrum analysis (MSSA) [5,6,7] and the feature image filtering method in the 3D frequency–space (f-x-y) domain use the eigenvalue decomposition of the matrix [8] to preserve low-rank effective signals and suppress random noise.
At present, 3D seismic exploration is widely used in modern industry. The original data collected by this method can be arranged according to certain parameters to obtain 5D data volume. The widely used 5D data types include common middle point (CMP) gathers D ( t , C M P x , C M P y , H x , H y ) and offset vector tile (OVT) gathers D ( t , H , ϕ , C M P x , C M P y ) , where H x , H y , and H are the offset in x and y directions and the total offset, C M P x and C M P y are the x , y coordinates of CMP, and ϕ is the azimuth. To further consider the statistical information in high dimensional signal space, seismic data reconstruction needs to be extended to 5D seismic data. The low-rank tensor decomposition method is regarded as a high dimensional extension of the low-rank matrix decomposition method. This kind of method regards the n-dimensional data volume as an n-order tensor. Unlike the rank of a matrix, the definition of the rank of a tensor is not unique. Therefore, there are different decomposition methods with different tensor rank definitions. The Tucker decomposition is regarded as a higher-order representation of principal component analysis (PCA) [9,10]. This high-dimensional decomposition method has been gradually introduced into the field of seismic data processing in recent years. Like PCA, some tensor decomposition methods are also implemented using the singular value decomposition (SVD) algorithm, such as high-order singular value decomposition (HO-SVD) [11,12], nuclear norm minimization method [13], and tensor singular value decomposition (t-SVD) [14]. Different from the Tucker decomposition method, the tensor CANDECOM\PARAFAC decomposition (CPD) does not require that the decomposed basis functions are orthogonal to each other. The CPD treats a tensor as the sum of R rank-1 tensors, and each rank-1 tensor is composed of the outer product of n vectors [15,16,17]. The minimum number R of rank-1 tensors that can recover the tensor is the CP rank of the tensor. Gao et al. [18] used random CPD to suppress the random noise in 3D seismic data and also improved the computational efficiency. Zhang et al. [19] proposed constraint CPD with Vandermonde structure (VCPD) to fit the exponential characteristics of frequency domain data.
Sparse transform methods transform seismic signals into some sparse domains, making the distinction between noise and signals more obvious, such as wavelet transform [20,21], Radon transform [22,23,24,25], curvelet transform [26,27,28], contourlet [29], and shearlet [30]. Radon transform is a classical and widely used sparse transform method. Radon transform projects the events (linear, hyperbolic, and parabolic) in seismic data onto the corresponding Radon basis functions. After these events are projected, they become the corresponding energy groups in the Radon domain. Because of its distribution characteristics, random noise does not converge in the Radon domain so as to achieve signal-to-noise separation. However, the size of the Radon basis function to be constructed for high-dimensional Radon transform exponentially increases with increasing dimension. Therefore, the current Radon transform basically stays in the processing of three-dimensional data, such as three-dimensional linear, parabolic, and conical Radon transforms [31,32,33,34]. Based on the assumption of local plane waves, the high-dimensional seismic data containing one linear event is a rank-1 tensor. The aim of tensor CPD is to decompose R linear events in high-dimensional data volume, and the separated factor matrix can be regarded as local plane waves in the corresponding dimension direction. However, due to the instability of the high-dimensional tensor algorithm and the complexity of field seismic data, such ideal decomposition is difficult to achieve.
The VCPD method proposed by Zhang et al. [19] used the Vandermonde structure constraint of the factor matrix to improve the computational efficiency and signal-to-noise ratio of the traditional CPD method for reconstructing seismic data. However, this method is a data-driven method, which depends on the quality of seismic data before reconstruction. Therefore, this paper proposes a linear Radon transform–constrained tensor CPD method for the reconstruction of high-dimensional seismic data. This method projects the factor matrix obtained by CPD onto the linear Radon basis function in the frequency domain so that each column of the factor matrix corresponds to a local plane wave of a certain dimension. This method belongs to the semi-data driven method, which not only makes the CPD method more stable but also realizes high-dimensional plane wave decomposition, which is regarded as a variant of high-dimensional linear Radon transform for seismic data.
Firstly, this paper briefly reviews the basic concepts and algorithms of tensor CPD and the basic concepts of linear Radon transform and puts forward the basic logic of this work: based on the local plane wave assumption, the factor matrix obtained by CPD is projected onto the linear Radon basis function in the frequency domain so that each column of the factor matrix corresponds to a local plane wave of a certain dimension. This method not only makes CPD more stable but also achieves high-dimensional plane wave decomposition. Based on this, the inverse problem of CPD under the constraint of linear Radon transform is proposed, which is solved by the ADMM algorithm. Next, the method is applied to the interpolation reconstruction process of 5D synthesis and field data, and the effectiveness of the method is verified. Finally, we discuss the parameter selection problem of the proposed RCPD method with the numerical experiment on synthesis data.

2. Methods

2.1. Notations

The notations used in this paper are maintained with Kolda and Bader [9] in the literature. Firstly, the x , x I , X I 1 × I 2 , X I 1 × I 2 × × I N represent the zero-order tensor (scalar), the first-order tensor (vector) of size I , the second-order tensor (matrix) of size I 1 × I 2 , and the N-order tensor (N > 2) of size I 1 × I 2 × × I N in the real Euclidean space, respectively. Similarly, replacing with represents the tensor in the complex Euclidean space. The N-order tensor can be expanded in matrix form in N directions, where the mode-n unfolding is represented by X n I n × m n m = 1 N 1 I m . In addition, several matrix multiplication operations need to be mentioned: the Hadamard product operator , the Kronecker product operator , and the Khatri–Rao product operator . The specific meaning of these symbols will be given in Appendix A.

2.2. Tensor CPD Method and Linear Radon Transform

2.2.1. Tensor CPD Method

An N-dimensional data volume X I 1 × I 2 × × I N can be viewed as an N-order tensor. If this tensor is a low-rank tensor, then it can be decomposed into a smaller number of R (which is called CP-rank) rank-1 tensors, which can be expressed as
X = r = 1 R u r r a n k 1 ,
where u r r a n k 1 represents a rank-1 tensor, which can be represented by N vector products:
u r r a n k 1 = u r ( 1 ) u r ( 2 ) u r ( N ) , 1 r R ,
where the outer product of the vector is represented by the symbol . Current algorithms generally use the factor matrix U ( n ) to represent the CPD model:
X = U ( 1 ) , U ( 2 ) , , U ( N ) .
The symbol · represents the CPD model, and the matrix U ( n ) is called factor matrix, which consists of R vectors of a certain dimension arranged in sequence as a column:
U ( n ) = [ u 1 ( n ) , u 2 ( n ) , , u R ( n ) ] I n × R ,
After converting the tensor to mode-n unfoldings, it can be approximated by the factor matrices
X ( n ) = U ( n ) U ( n ) T ,
where U ( n ) = U ( N ) U ( n + 1 ) U ( n 1 ) U ( 1 ) . Finally, N factor matrices are obtained by approximating N unfoldings, and the solution of CPD problem is obtained. Figure 1 shows a cartoon of CPD model.

2.2.2. Linear Radon Transform

The linear Radon transform was proposed by Radon [35] in 1917. Its essence is to perform an integral transform along straight lines in different directions so that the points originally located on the same straight line are focused into a point in the Radon domain.
The basic principle of linear Radon transform in seismic data processing is to approximate the event in two-dimensional seismic data as a linear event. The process of transforming t x domain data d ( t , x ) into τ p domain s ( τ , p ) is to perform integral transformation along straight lines with different slopes, where the linear events of t x domain will converge to energy cluster through integral operation in τ p domain. The τ denotes the intercept of the line on the time axis, and p denotes the slope of the integral path.
In order to ensure the stability of the algorithm and the transformation effect, the current linear Radon transform is generally performed in the frequency–space f x domain, which can be written as
S ( ω , p ) = D ( ω , x ) e i ω p x d x ,
D ( ω , x ) = S ( ω , p ) e i ω p x d p ,
where D ( ω , x ) , S ( ω , p ) are the results of the one-dimensional Fourier transform of the original data d ( t , x ) , s ( τ , p ) along the time dimension, and ω is the circular frequency. Since the traditional linear Radon transform has the problems of energy leakage, spatial aliasing, and low resolution, the current Radon transform generally constructs a numerical inverse problem to obtain the Radon transform coefficients. The formula is as follows:
D ( ω ) = φ ( ω ) S ( ω ) ,
where D ( ω ) = ( d 1 , d 2 , , d n x ) T is the single-frequency spatial seismic data, n x is the space length of the data, S ( ω ) = ( s 1 , s 2 , , s n p ) T is the corresponding Radon spectrum, and n p is the number of ray parameters p . The Radon transform operator φ ( ω ) is defined as
φ ( ω ) = e i ω p 1 ( x 1 x 0 ) e i ω p 2 ( x 1 x 0 ) e i ω p n p ( x 1 x 0 ) e i ω p 1 ( x 2 x 0 ) e i ω p 2 ( x 2 x 0 ) e i ω p n p ( x 2 x 0 ) e i ω p 1 ( x n x x 0 ) e i ω p 2 ( x n x x 0 ) e i ω p n p ( x n x x 0 ) n x × n p .
In the formula, ω is the circular frequency, p is the ray parameter, x is the spatial position of each trace, x 0 is the reference trace, and the position of the central trace is generally taken. To solve the Radon coefficient, the objective function is defined as
J S = φ S D 2 2 + λ S p p = 2 , 1 , 0 ,
By solving the above inverse problem, the linear Radon spectrum S can be obtained.

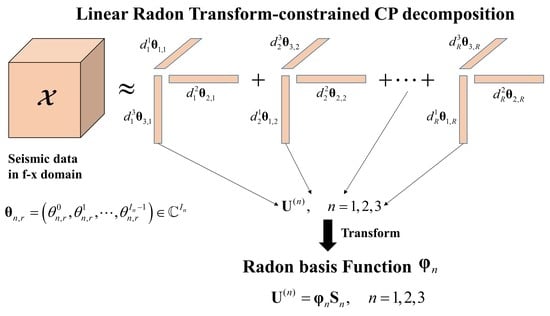
2.3. Linear Radon Transform–Constrained CPD for Tensor Completion

Based on the local plane wave assumption, the element ( I 1 , I 2 , , I N ) of the noiseless complete local N-dimensional seismic signal slice at the frequency ω with R linear events can be expressed in the f x domain as
D ( ω , I 1 , I 2 , , I N ) = r = 1 R d r n = 1 N θ n , r I n 1 ,
where ω is the circular frequency, d r is the frequency spectrum of the wavelet, and the θ n , r I n 1 = e i ω p n , r ( I n 1 ) Δ x n . The p n , r is the ray parameter of the r th events in the n th dimension, and the Δ x n is the spatial sample interval in the nth dimension. If the ideal CPD achieves a unique rank-1 decomposition, each rank-1 tensor should correspond to a linear event. Figure 2 shows an ideal CPD model for a three-dimensional single-frequency seismic slice with R linear events.
Therefore, using the factor matrix to express the CPD model, the tensor X can be represented by
X = r = 1 R d r 1 θ 1 , r d r 2 θ 2 , r d r N θ N , r = U 1 , U 2 , , U N ,
where the factor matrix in the nth dimension can be defined as
U ( n ) = d 1 n θ n , 1 0 d 2 n θ n , 2 0 d r n θ n , r 0 d 1 n θ n , 1 1 d 2 n θ n , 2 1 d r n θ n , r 1 d 1 n θ n , 1 I n 1 d 2 n θ n , 2 I n 1 d r n θ n , r I n 1 , n = 1 , 2 , N ,
However, due to the complexity of seismic signals and the instability of the CPD algorithm itself, unconstrained tensor CPD is difficult to achieve such ideal decomposition. It is not difficult to see from Equation (13) that each column of the ideal factor matrix can be considered as a plane wave signal in that direction, such as the ith column of the factor matrix U ( n ) :
U ( n ) ( : , i ) T = ( d i n     d i n θ n , i 1         d i n θ n , i I n 1 ) , ,
where U ( n ) ( : , i ) is the i th column of the factor matrix U ( n ) Since a rank-1 tensor corresponds to a linear event in seismic data under the local linear assumption (due to changes in slope, parabolic or hyperbolic events cannot correspond to a rank-1 tensor), the linear Radon basis function corresponding to each dimension can be constructed, and each column of the factor matrix corresponding to a linear event is projected onto the basis function. This approach is equivalent to the linear Radon transform of the factor matrix after decomposition:
U ( n ) = φ n S n ,     n = 1 , 2 , , N .
The linear Radon transform basis function is defined as
φ n = e i ω p n , 1 ( x 1 n x 0 n ) e i ω p n , 2 ( x 1 n x 0 n ) e i ω p n , n p n ( x 1 n x 0 n ) e i ω p n , 1 ( x 2 n x 0 n ) e i ω p n , 2 ( x 2 n x 0 n ) e i ω p n , n p n ( x 2 n x 0 n ) e i ω p n , 1 ( x I n n x 0 n ) e i ω p n , 2 ( x I n n x 0 n ) e i ω p n , n p n ( x I n n x 0 n ) I n × n p n ,
where p n , i ,   i = 1 , 2 , , n p n is the ray parameter in the n th dimension, n p n is the number of p n , i , S n represent the Radon spectrum after the projection of the factor matrix in the n th dimension, which can be written as
S n = s 1 , 1 n s 1 , 2 n s 1 , R n s 2 , 1 n s 2 , 2 n s 2 , R n s n p n , 1 n s n p n , 2 n s n p n , R n n p n × R .
Since the local seismic events should be concentrated in a few slopes, the Radon spectrum should be sparse. So, the L1 norm is used to express the sparsity of the Radon spectrum in this problem. Simultaneously because the reconstruction of high-dimensional seismic data is aimed at high-dimensional irregular missing data, the N-dimensional linear Radon transform–constrained CPD (RCPD) can be written as
min | | X P U ( 1 ) , U ( 2 ) , , U ( N ) | |     F 2 + λ n = 1 N | | S n | | 1 s . t .         U ( n ) φ n S n = 0         n = 1 , 2 , , N ,
where X is the original data tensor with dimension I 1 × I 2 × × I N in the f x domain, P is the spatial sampling operator of the data which has the form as p i 1 , i 2 , , i N = 1 i f ( i 1 , i 2 , , i N ) Ω 0 i f ( i 1 , i 2 , , i N ) Ω , where Ω is a subset containing the observed data. U ( n ) is the factor matrix after decomposition, and U ( 1 ) , U ( 2 ) , , U ( N ) represents the CPD model, as shown in Formula (3), where U ( n ) I n × R . The definition of R and tensor CP rank is basically the same, which means that the original seismic data is approximated by R rank-1 tensors. The difference is that R also means that there are R column vectors in each factor matrix to be projected onto the linear Radon basis function in the RCPD algorithm. φ n is the Radon transform basis function in the n-direction of the dimension, which is defined as Formula (16), S n is the corresponding Radon spectrum of each column of U ( n ) projected onto the φ n , and λ is the regularization parameter. · F and · 1 are the Frobenius and L1 norm of a matrix respectively.
The problem can be solved by the ADMM algorithm [36], and the specific solution is as follows.
By introducing an auxiliary variable M , let M n = S n , 1 n N , then the inverse problem can be rewritten as
min | | X P U ( 1 ) , U ( 2 ) , , U ( N ) | |       F 2 + λ n = 1 N | | M n | | 1 s . t .       U ( n ) φ n S n = 0       n = 1 , 2 , , N                     M n S n = 0 .
Write the problem in the form of an augmented Lagrangian function. Let
L ρ 1 , ρ 2 ( U ( n ) , M n , S n , u n , v n ) = 1 2 | | X P U ( 1 ) , U ( 2 ) , , U ( N ) | |     F 2 + λ n = 1 N | | M n | | 1 + n = 1 N u n , U ( n ) φ n S n + n = 1 N v n , M n S n + ρ 1 2 n = 1 N | | U ( n ) φ n S n | | F 2 + ρ 2 2 n = 1 N | | M n S n | | F 2 ,
where u n , v n are the Lagrangian multiplier, ρ 1 , ρ 2 are the Penalty coefficient, and an represents the inner product operation of two matrices. In order to obtain the optimal solution of the problem, update U ( n ) , M n , S n , u n and v n sequentially until the maximum number of iterations is reached or the convergence criterion is satisfied. The update formula is as follows:
1.
Update U ( n ) .
When update U ( n ) , the Formula (20) can be rewritten as
arg min U ( n )   1 2 X ( n ) P ( n ) U ( n ) U ( n ) T F 2 + u n , U ( n ) φ n S n + ρ 1 2 U ( n ) φ n S n F 2 ,     1 n N ,
where P ( n ) is the mode-n unfolding of the sampling operator P . Because of the existence of P ( n ) , the inverse problem on the left cannot be solved by directly solving the partial derivative of U ( n ) , according to the solution in Zeng and So [37], we can obtain the updated formula for U ( n ) :
U ( i , : ) ( n ) = X ( i , c i ) U ( c i , : ) ( n ) u n ( i , : ) + ρ 1 φ n S n ( i , : ) ρ 1 I + U ( c i , : ) ( n ) T U ( c i , : ) ( n ) 1 w h e r e     1 n N , 1 i I n ,
where · represents the conjugation of a matrix. U ( i , : ) ( n ) represents the i th row of the factor matrix U ( n ) , and I R × R is a unit matrix. The specific process of solving is given in Appendix B.
2.
Update M n .
Since the L1 norm is non-differentiable at zero, the update formula of M n can be obtained by using the proximal gradient descent method:
M n k + 1 = arg min M n k L ρ 1 k , ρ 2 k ( U ( n ) k + 1 , M n k , S n k , u n k , v n k ) = arg min D n λ M n k 1 + v n k , M n k S n k + ρ 2 k 2 M n k S n k F 2 × 2 ρ 2 k arg min D n 2 λ ρ 2 M n k 1 + ρ 2 k 2 v n k ρ 2 + S n k M n k F 2 v n k ρ 2 F 2 × 2 ρ 2 k = S λ ρ 2 k S n k v n k ρ 2 k ,
where S represents the soft threshold operator [38], which is defined as
S a ( b ) = sign ( b ) max b a , 0 ,
where s i g n ( x ) represents the sign function of x , max ( a , b ) represents the maximum value in a , b .
3.
Update S n .
When update S n , the Formula (20) can be rewritten as
arg min S n   u n , U ( n ) φ n S n + v n , M n S n + ρ 1 2 U ( n ) φ n S n F 2 + ρ 2 2 M n S n F 2 , 1 n N ,
Formula (25) is the least squares problem of S n , then let it take the partial derivative of S n equal to 0, and the update formula of S n can be obtained by
L ρ 1 , ρ 2 S n = φ n H u n v n ρ 1 φ n H U ( n ) φ n S n ρ 2 M n S n = 0 S n = ρ 1 φ n H φ n + ρ 2 I 1 φ n H u n + ρ 1 U ( n ) + v n k + ρ 2 M n ,
where · H is the matrix conjugate transpose operator.
4.
Update u n , v n .
The Lagrangian multiplier update formula in the augmented Lagrangian function is
u n k + 1 = u n k + ρ 1 k U ( n ) k + 1 φ n S n k + 1 ,
v n k + 1 = v n k + ρ 2 k M n k + 1 S n k + 1 ,
The algorithm can also accelerate the calculation by changing penalty coefficients ρ 1 , ρ 2 . According to Ying et al. [39], let ρ 1 k = μ 1 ρ 1 k 1 , ρ 2 k = μ 2 ρ 2 k 1 , where μ 1 , μ 2 1 , 1.8 , which helps the penalty term be gradually increased with the iteration rounds. Update the above variables until the maximum number of iterations is reached or the convergence criterion is satisfied. The convergence criteria are as follows:
n = 1 N U k ( n ) U k 1 ( n ) F U k 1 ( n ) F ε ,
where ε is the minimum convergence residual. The workflow of the RCPD algorithm is demonstrated in Figure 3.

3. Results

The following numerical experiments are designed to verify the role of RCPD in seismic data reconstruction. The signal-to-noise ratio (SNR) of the reconstructed time–space domain seismic data is used to measure the effectiveness of the algorithm, which is defined as follows:
S N R = 10 lg D t r u e F 2 D t r u e D r e c F 2 ,
where D t r u e is the synthesized data with no noise and missing, and D r e c is the reconstructed low-rank data. The iterative reconstruction formula of the CPD algorithm for missing data is
D k = L C P ( D o b s + ( I P ) D k 1 ) ,
where L C P represents the CP low-rank operator, k is the current iteration round, D o b s is the original observation missing data, P is an N-dimensional sampling operator, and is a tensor that is 1 for all elements of the same size. To maintain the reliability of the experiments, all experiments were performed on the same computer with 16GB RAM, an RTX3060 graphics card, and an Intel i5-10500H processor, and no parallel algorithms were applied.

3.1. Synthesis Data Experiment

To verify the rationality of introducing linear Radon transform into the CPD method, we compare the reconstruction effect and calculation efficiency of the RCPD algorithm and CPD algorithm on synthetic data. The scale of the synthesized five-dimensional seismic data D t , C M P x , C M P y , H x , H y is 301 × 15 × 15 × 15 × 15 , where t is the time dimension, CMPx, C M P y are the CMP coordinate along x , y direction, and H x , H y are the offset along x , y direction. The time sampling interval is 2 ms. The synthesized data consists of three hyperplane waves; that is, there are all linear events in the four spatial dimension directions C M P x , C M P y , H x , H y in the synthesized data.
There are three different experiments for the method test. The first experiment aims to compare the denoising ability and efficiency of the RCPD algorithm and the CPD algorithm on Gaussian white noise synthetic data with a SNR of −8 dB to 2 dB. The frequency band range processed by the two methods in this experiment is 1~100 Hz and the CP ranks of both algorithms are set to R = 5, where the regularization operator λ of the RCPD algorithm is set to 1, the penalty coefficients ρ 1 , ρ 2 are set to 0.5, μ 1 , μ 2 are set to 1.3, minimum iteration error is 1 × 10 4 , the maximum number of iterations 150. the range of each ray parameter p n , 1 n 4 is 3 , 3 × 10 4 , and n p n is set to 100. Figure 4 depicts the denoising SNR and calculation time of two algorithms with different SNR (–8 dB~2 dB). Figure 5 displays the denoising results by two methods on noisy synthesis data with the SNR of −8 dB. Figure 5a shows a 3D slice of the original 5D data when H x = 10 , H y = 10 , and Figure 5b shows the corresponding noisy data with SNR = −8 dB. The RCPD denoising result and data residual are illustrated in Figure 5c,d, and the CPD denoising result and data residual are illustrated in Figure 5e,f. Figure 5g shows the single-trace denoising effect comparison of the 5D data noisy trace D ( : , 11 , 10 , 10 , 10 ) , in which the black solid line is the original noise-free data, the red dotted line is the RCPD reconstruction data, the blue dotted line is the CPD reconstruction data, and Figure 5h is the amplification display at the wavelet peak of the trace. As a result, both the RCPD method and CPD method can effectively suppress Gaussian noise in seismic data and prevent the loss of effective signals. In addition, the RCPD method with linear Radon constraint can effectively improve the computational efficiency while improving the denoising SNR of the traditional CPD method as the result in Figure 4.
The second experiment aims to compare the data reconstruction ability and computational efficiency of the RCPD algorithm and the CPD algorithm for noisy synthesis data with the SNR of −1 dB missing from 80% to 30%. The frequency band range processed by the two methods in this experiment is 1~100 Hz and the CP ranks of both algorithms are set to R = 5, and the iteration number of the CPD reconstruction method is set to 10 (set to 15 when processing data with 80% missing percentage). In addition, the regularization operator λ of the RCPD algorithm is set to 1, the penalty coefficients ρ 1 , ρ 2 are set to 0.5, μ 1 , μ 2 are set to 1.3, the minimum iteration error is 1 × 10 4 , the maximum number of iterations 150, the range of each ray parameter p n , 1 n 4 is 3 , 3 × 10 4 , and n p n is set to 100. Figure 6 shows the reconstruction SNR and calculation time of two algorithms with different missing percentages (80~30%). Figure 7 displays the reconstruction results by two methods on noisy synthesis data with 80% missing. Figure 7a shows a 3D slice of the original 5D data when H x = 10 , H y = 10 , and Figure 7b shows the corresponding noisy missing data with 80% missing. The RCPD reconstruction result and data residual are illustrated in Figure 7c,d, and the CPD reconstruction result and data residual are illustrated in Figure 7e,f. Figure 7g shows the single-trace reconstruction effect comparison of the 5D data missing trace D ( : , 11 , 10 , 10 , 10 ) , in which the black solid line is the original noise-free data, the red dotted line is the RCPD reconstruction data, the blue dotted line is the CPD reconstruction data, and Figure 7h is the amplification display at the wavelet peak of the trace. As a result, both the RCPD method and CPD method can effectively reconstruct seismic signals, and interpolate missing traces for the low missing percentages. However, when the percentage of missing traces reaches 80%, the CPD method requires more iteration rounds, resulting in more computation time. The result for the seismic signal with 80% of the percentage of missing traces in Figure 7f has an obvious residual of effective signal, even though we increased the number of iterations to 15. In contrast, as shown from Figure 7c to Figure 7h, the RCPD algorithm can still have a higher reconstruction SNR and effectively prevent signal loss even when the percentage of missing traces reaches 80%. In addition, the computational efficiency of the RCPD method can still be maintained in the case of a high missing percentage.
The third experiment aims to compare the performance of RCPD and CPD algorithms for amplitude fidelity in seismic data reconstruction. We synthesized a 5D data containing three linear events with amplitude ratios of 15:10:1 and AVO (amplitude variation with offset) characteristics in the C M P x direction. Gaussian white noise is added to the data to make the SNR −6 dB, and then randomly missing to 60%. Then, the RCPD algorithm and CPD algorithm are used to reconstruct the noisy missing data. The frequency band range processed by the two methods in this experiment is 1~100 Hz and the CP ranks of both algorithms are set to R = 5, and the iteration number of the CPD reconstruction method is set to 10. In addition, the regularization operator λ of the RCPD algorithm is set to 1, the penalty coefficients ρ 1 , ρ 2 are set to 0.5, μ 1 , μ 2 are set to 1.3, the minimum iteration error is 1 × 10 4 , the maximum number of iterations is 150, the range of each ray parameter p n , 1 n 4 is 3 , 3 × 10 4 , and n p n is set to 100. Figure 8 displays the reconstruction results by two methods on noisy synthesis data with 60% missing containing AVO characteristics. Figure 8a shows a 3D slice of the original 5D data when H x = 10 , H y = 10 , and Figure 8b shows the corresponding noisy missing data with 60% missing. The RCPD reconstruction result and data residual are illustrated in Figure 8c,d, and the CPD reconstruction result and data residual are illustrated in Figure 8e,f (we use a smaller grayscale range to represent the data residuals to better show the difference between the two methods). Figure 8g shows the single-trace reconstruction effect comparison of the 5D data missing trace D ( : , 11 , 10 , 10 , 10 ) , in which the black solid line is the original noise-free data, the red dotted line is the RCPD reconstruction data, the blue dotted line is the CPD reconstruction data, and Figure 8h is the amplification display at the wavelet peak of the trace. As a result, both methods can suppress noise and interpolate missing traces while preserving amplitude of high-dimensional seismic signals. As can be seen from Figure 8c to Figure 8h, the RCPD method performs better than the CPD method in protecting the amplitude of the reflected signal.

3.2. Field Data Experiment

To further confirm the effectiveness of the RCPD method in seismic data reconstruction, we compare the reconstruction results of RCPD and CPD methods on a land prestack CMP data. Figure 9 shows the source, receiver point, and CMP distribution of this data. The number of CMP is 21 × 10, the number of sampling points per time is 2901 (the experiment on the paper only uses the sampling point data in the range of 801~1200 to test), the sampling interval is 2 ms, and the size of the CMP bin is 12.5 m × 12.5 m. Moreover, the offset range in the x and y directions are (−2000 m, 2000 m) and (−3000 m, 3000 m). In order to make the original data closer to the local linear hypothesis, the field data has been normal-moveout (NMO) corrected before processing. Next, the original three-dimensional gathers are arranged in a five-dimensional grid of 1 ms × 12.5 m × 12.5 m × 250 m × 250 m, which makes the field data reshape to a 5D tensor D t , C M P x , C M P y , H x , H y of the size 400 × 21 × 10 × 16 × 24 with 50.55% missing. After repeated testing, the experiment finally set the CP ranks R of both algorithms to 5, and the iteration number of the CPD reconstruction algorithm is set to 10. In addition, the regularization operator λ of the RCPD algorithm is set to 1, the penalty coefficients ρ 1 , ρ 2 are set to 0.1, μ 1 , μ 2 are set to 1.3, the minimum iteration error is 1 × 10 4 , the maximum number of iterations 150, the range of each ray parameter p n , 1 n 4 is 2 , 4 × 10 4 , and n p n is set to 100. The frequency band ranges processed by the two methods in this experiment are both 1~100 Hz.
Figure 10 and Figure 11 show the reconstruction effect of the RCPD method and CPD method on the 5D field data. In order to display the results more clearly, we expand the 3D CMP gathers with fixed CMP coordinates and the 3D common-offset gathers with fixed offset coordinates into 2D images for display. Figure 10a displays the gather ( C M P x = 10 , C M P y = 8 ) with the H y number from 7 to 11, and Figure 10b displays the gather ( H x = 13 , H y = 14 ) with the C M P y number from 6 to 10. Figure 10c,d depict the reconstruction effect of the RCPD method and Figure 10e,f depict the reconstruction effect of the CPD method. In order to show the difference between the two methods in data reconstruction more clearly, Figure 10g,h show the comparison of reconstruction effects of noisy single trace and missing single trace, respectively. Figure 11 shows the grayscale display of common-offset gathers, which corresponds to the data in Figure 10b, Figure 10d, and Figure 10f, respectively.
The reconstruction results of field data illustrate that due to the introduction of linear Radon transform constraints, under the constraints of linear Radon basis functions in each dimension, the RCPD method can effectively reconstruct data even for the field data with a certain proportion of missing traces under complex geological structures. From the 2D profile of Figure 10, it can be found that compared with the CPD method, the seismic data reconstructed by the RCPD method has stronger event continuity, and even the missing continuous gathers can maintain a certain SNR. The result in Figure 10h shows more clearly that the RCPD method has stronger interpolation energy for seismic missing traces than the CPD method. Figure 11 further demonstrates the higher SNR reconstructed by the RCPD method than by the CPD method.

4. Discussion

This section mainly discusses the influence of the two parameters CP-rank and regularization parameter λ of the RCPD method on the experimental results. This experiment uses the noisy data with 60% missing used in Experiment 2 of Section 3.1. In the first experiment, the data is reconstructed while the CP-rank is set to 3 to 13. The line chart of the reconstructed SNR and the calculation time changing with the CP-rank are given in Figure 12. In the second experiment, the data is reconstructed while the λ is set to 10−2 to 104. The reconstructed SNR and the line chart of the calculation time changing with λ are given in Figure 13. The experimental results show that the calculation time of the algorithm increases with the increase of CP-rank, and the reconstructed SNR is the largest when CP-rank R = 5 . From repeated experiments, it can be seen that the CP-rank of the RCPD algorithm should be slightly larger than the number of events in the data volume, such as R = 4 or 5 in the data of three events, to ensure both the calculation efficiency and reconstruction effect. As for the regularization parameter λ , the result in Figure 13 illustrates that the λ cannot be too large and should be controlled between 10−2 and 102 as much as possible, which can not only ensure the reconstruction effect of effective signals but also avoid the increase in algorithm calculation time due to slow convergence.

5. Conclusions

The proposed linear Radon transform–constrained CPD method is based on the local plane wave hypothesis of seismic signals. By using the low-rank of seismic data and introducing the linear Radon transform of the factor matrix, the rank-1 component of the factor matrix is ensured to be composed of high-dimensional hyperplane waves, which enhances the expressiveness and physical interpretability of the algorithm for seismic data reconstruction. By comparing with the traditional CPD method in the application of synthetic and field data, the RCPD method has higher computational efficiency and reconstruction accuracy. Due to the constraint of linear Radon transform, the RCPD method is more suitable for seismic reconstruction with low-rank approximation. Therefore, it can effectively guarantee the continuity of the reconstructed linear events. Moreover, the RCPD algorithm is insensitive to the CP-rank and regularization parameter λ and robust to the selection of parameter size.
As the RCPD method assumes the local linearity of seismic data, it is suitable for NMO-corrected seismic data or windowed seismic data to ensure the approximate linearity of seismic events. In field data applications, aliasing, amplitude anomaly, non-Gaussian noise, etc. reduce the quality of the seismic data regularization results. It deserves further study in the near future.

Author Contributions

Conceptualization, Z.O. and L.Z.; methodology, Z.O., L.Z. and H.W.; writing—original draft and formal analysis, Z.O.; writing—review and editing, L.Z., H.W. and K.Y. All authors have read and agreed to the published version of the manuscript.

Funding

This research was funded by the National Key R & D Program of China on Key Scientific Issues of Transformative Technologies (Grant No. 2018YFA0702503), the National Natural Science Foundation of China ‘Research on Tomographic Inversion and Modeling Method of Characteristic Reflection Wave Theory’ (Grant No. 42174135), ‘Wave Equation Linearization and Velocity Inversion in Strong Scattering Media’ (Grant No. 42074143), ‘Gaussian packet tomography based on triangular mesh model’ (Grant No. 41874118) and CNPC’s Forward-looking Basic Project ‘Research on Geophysical Rock Physics and Frontier Reserve Technology’ (Grant No. 2021DJ3501).

Data Availability Statement

Not applicable.

Acknowledgments

The authors would like to thank the China Petroleum Exploration and Development Research Institute and the Northwest Branch, Sinopec Geophysical Exploration Technology Research Institute, and the Shengli Oilfield Branch, CNOOC Research Institute, and the Zhanjiang Branch for their funding and support for the research work of Wave Phenomenon and Intelligent Inversion Imaging Research Group (WPI).

Conflicts of Interest

The authors declare no conflict of interest.

Appendix A

The Hadamard product requires two matrices A I 1 × I 2 and B I 1 × I 2 of the same size, the result is the product of their corresponding elements, which can be defined as
A B = a 11 b 11 a 12 b 12 a 1 I 2 b 1 I 2 a I 1 1 b I 1 1 a I 1 2 b I 1 2 a I 1 I 2 b I 1 I 2
Unlike the Hadamard product, the Kronecker product does not need the same size of matrices, which, of two matrices A I 1 × I 2 and B I 3 × I 4 , is defined as
A B = a 11 B a 12 B a 1 I 2 B a I 1 1 B a I 1 2 B a I 1 I 2 B I 1 I 3 × I 2 I 4
The Khatri–Rao product is regarded as the Kronecker product of the corresponding column vectors of two matrices. Therefore, two matrices A I 1 × I 3 and B I 2 × I 3 for Khatri–Rao product need to have the same number of columns, which is defined as
A B = a 1 b 1 a 2 b 2 a I 3 b I 3 ( I 1 I 2 ) × I 3

Appendix B

The specific solve process of U ( n ) in RCPD algorithm is given in this appendix. When updating U ( n ) , the Formula (20) is rewritten as
arg min U ( n )   1 2 X ( n ) P ( n ) U ( n ) U ( n ) T F 2 + u n , U ( n ) φ n S n + U ( n ) φ n S n F 2 , 1 n N
Since the sampling operator P ( n ) exists in the left inverse problem, the left term can be transformed into the following I n sub-problem according to the solution in Zeng and So [34]:
arg min U ( i , : ) ( n ) 1 2 X ( i , : ) P ( i , : ) U ( i , : ) ( n ) U ( n ) T F 2 + u n ( i , : ) , U ( i , : ) ( n ) ( φ n S n ) ( i , : ) + ρ 1 2 U ( i , : ) ( n ) ( φ n S n ) ( i , : ) F 2 , 1 i I n , 1 n N
where the mode-n unfolding X ( n ) , P ( n ) are rewritten as X and P to avoid symbol confusion. Equation (A5) can be abbreviated as:
arg min U ( i , : ) ( n ) 1 2 X ( i , c i ) U ( i , : ) ( n ) U ( c i , : ) ( n ) T F 2 + u n ( i , : ) , U ( i , : ) ( n ) ( φ n S n ) ( i , : ) + ρ 1 2 U ( i , : ) ( n ) ( φ n S n ) ( i , : ) F 2 , 1 i I n , 1 n N
where c i represents the set of column subscripts of nonzero values for row i of matrix P . The solution of the problem is
L ρ 1 , ρ 2 U ( i , : ) ( n ) = X ( i , c i ) U ( c i , : ) ( n ) + U ( i , : ) ( n ) U ( c i , : ) ( n ) T U ( c i , : ) ( n ) + u n ( i , : ) + ρ 1 U ( i , : ) ( n ) φ n S n ( i , : ) = 0 U ( i , : ) ( n ) = X ( i , c i ) U ( c i , : ) ( n ) u n ( i , : ) + ρ 1 φ n S n ( i , : ) ρ 1 I + U ( c i , : ) ( n ) T U ( c i , : ) ( n ) 1 , w h e r e     1 i I n , 1 n N

References

  1. Abma, R.; Claerbout, J. Lateral prediction for noise attenuation by t-x and f-x techniques. Geophysics 1995, 60, 1887–1896. [Google Scholar] [CrossRef] [Green Version]
  2. Hornbostel, S.C. Spatial prediction filtering in the t-x and f-x domains. Geophysics 1991, 56, 2019–2026. [Google Scholar] [CrossRef]
  3. Gulunay, N. FXDECON and complex wiener prediction filter. In SEG Technical Program Expanded Abstracts; Society of Exploration Geophysicists: Houston, TX, USA, 1986; pp. 279–281. [Google Scholar] [CrossRef]
  4. Zhang, L.; Wang, H. High-dimensional center filtering method based on block matching. In SEG Technical Program Expanded Abstracts; OnePetro: Richardson, TX, USA, 2019; pp. 4580–4584. [Google Scholar] [CrossRef]
  5. Oropeza, V.E.; Sacchi, M.D. Multifrequency singular spectrum analysis. In SEG Technical Program Expanded Abstracts; OnePetro: Richardson, TX, USA, 2009; pp. 3193–3197. [Google Scholar] [CrossRef]
  6. Oropeza, V.E.; Sacchi, M.D. A randomized SVD for Multichannel Singular Spectrum Analysis (MSSA) noise attenuation. In SEG Technical Program Expanded Abstracts; Society of Exploration Geophysicists: Houston, TX, USA, 2010; pp. 3539–3544. [Google Scholar] [CrossRef]
  7. Huang, W.; Wang, R.; Chen, Y.; Li, H.; Gan, S. Damped multichannel singular spectrum analysis for 3D random noise attenuation. Geophysics 2016, 81, V261–V270. [Google Scholar] [CrossRef]
  8. Trickett, S.R. F-xy eigenimage noise suppression. Geophysics 2003, 68, 751–759. [Google Scholar] [CrossRef]
  9. Kolda, T.G.; Bader, B.W. Tensor Decompositions and Applications. SIAM Rev. 2009, 51, 455–500. [Google Scholar] [CrossRef]
  10. Cichocki, A.; Mandic, D.; Phan, A.-H.; Caiafa, C.; Zhou, G.; Zhao, Q.; Lathauwer, L. Tensor Decompositions for Signal Processing Applications From Two-way to Multiway Component Analysis. Signal Process. Mag. IEEE 2014, 32, 145–163. [Google Scholar] [CrossRef]
  11. Kilmer, M.E.; Martin, C.D. Factorization strategies for third-order tensors. Linear Algebra Appl. 2011, 435, 641–658. [Google Scholar] [CrossRef] [Green Version]
  12. Kreimer, N.; Sacchi, M.D. A tensor higher-order singular value decomposition for prestack seismic data noise reduction and interpolation. Geophysics 2012, 77, V113–V122. [Google Scholar] [CrossRef]
  13. Kreimer, N.; Stanton, A.; Sacchi, M.D. Tensor completion based on nuclear norm minimization for 5D seismic data reconstruction. Geophysics 2013, 78, V273–V284. [Google Scholar] [CrossRef] [Green Version]
  14. Ely, G.; Aeron, S.; Hao, N.; Kilmer, M.E. 5D seismic data completion and denoising using a novel class of tensor decompositions. Geophysics 2015, 80, V83–V95. [Google Scholar] [CrossRef] [Green Version]
  15. Hitchcock, F.L. The Expression of a Tensor or a Polyadic as a Sum of Products. J. Math. Phys. 1927, 6, 164–189. [Google Scholar] [CrossRef]
  16. Harshman, R.A. Foundations of the PARAFAC procedure: Models and conditions for an “explanatory” multi-model factor analysis. UCLA Work. Pap. Phon. 1970, 16, 1–84. [Google Scholar]
  17. Carroll, J.D.; Chang, J.-J. Analysis of individual differences in multidimensional scaling via an n-way generalization of “Eckart-Young” decomposition. Psychometrika 1970, 35, 283–319. [Google Scholar] [CrossRef]
  18. Gao, W.; Sacchi, M. Incoherent noise attenuation via randomized CP decomposition. In 2017 SEG International Exposition and Annual Meeting; OnePetro: Richardson, TX, USA, 2017; pp. 5006–5010. [Google Scholar] [CrossRef]
  19. Zhang, L.; Wang, H.; Wang, B. Vandermonde constrained CANDECOMP/PARAFAC tensor decomposition for high-dimensional seismic data reconstruction. Geophysics 2022, 87, V533–V544. [Google Scholar] [CrossRef]
  20. Zhang, R.; Ulrych, T.J. Physical Wavelet Frame Denoising. Geophysics 2003, 68, 225–231. [Google Scholar] [CrossRef]
  21. Shan, H.; Ma, J.; Yang, H. Comparisons of wavelets, contourlets and curvelets in seismic denoising. J. Appl. Geophys. 2009, 69, 103–115. [Google Scholar] [CrossRef]
  22. Durrani, T.S.; Bisset, D. The Radon transform and its properties. Geophysics 1984, 49, 1180–1187. [Google Scholar] [CrossRef]
  23. Trad, D.; Ulrych, T.; Sacchi, M. Latest views of the sparse Radon transform. Geophysics 2003, 68, 386–399. [Google Scholar] [CrossRef] [Green Version]
  24. Wang, X.; Wang, H. High-Resolution Linear Radon Transformation with L0-norm Constraint. In Proceedings of the Beijing 2014 International Geophysical Conference & Exposition, Beijing, China, 21–24 April 2014; pp. 284–287. [Google Scholar] [CrossRef]
  25. Wang, B.; Zhang, Y.; Lu, W.; Geng, J. A Robust and Efficient Sparse Time-Invariant Radon Transform in the Mixed Time–Frequency Domain. IEEE Trans. Geosci. Remote Sens. 2019, 57, 7558–7566. [Google Scholar] [CrossRef]
  26. Herrmann, F.J.; Böniger, U.; Verschuur, D.J. Non-linear primary-multiple separation with directional curvelet frames. Geophys. J. Int. 2007, 170, 781–799. [Google Scholar] [CrossRef] [Green Version]
  27. Herrmann, F.; Hennenfent, G. Non-parametric seismic data recovery with Curvelet frames. Geophys. J. Int. 2008, 173, 233–248. [Google Scholar] [CrossRef] [Green Version]
  28. Chen, G.-X.; Chen, S.; Wang, H.; Zhang, B. Geophysical data sparse reconstruction based on L0-norm minimization. Appl. Geophys. 2013, 10, 181–190. [Google Scholar] [CrossRef]
  29. Zhao, X.; Li, Y.; Zhuang, G.; Zhang, C.; Han, X. 2-D TFPF based on Contourlet transform for seismic random noise attenuation. J. Appl. Geophys. 2016, 129, 158–166. [Google Scholar] [CrossRef]
  30. Dehui, K.; Peng, Z. Seismic random noise attenuation using shearlet and total generalized variation. J. Geophys. Eng. 2015, 12, 1024–1035. [Google Scholar] [CrossRef] [Green Version]
  31. Wang, S.; Li, J.; Xue, Y.; Zhou, Y.; Ma, X. AVO-preserving data reconstruction by 3D high-order sparse-parabolic Radon transform. In SEG Technical Program Expanded Abstracts; OnePetro: Richardson, TX, USA, 2017; pp. 4338–4342. [Google Scholar] [CrossRef]
  32. Geng, W.; Li, J.; Chen, X.; Ma, J.; Xu, J.; Zhu, G.; Tang, W. 3D high-order sparse radon transform with L1–2 minimization for multiple attenuation. Geophys. Prospect. 2022, 70, 655–676. [Google Scholar] [CrossRef]
  33. Boe, T.H. Enhancement of large faults with a windowed 3D Radon transform filter. In SEG Technical Program Expanded Abstracts 2012; Society of Exploration Geophysicists: Houston, TX, USA, 2012; pp. 1–5. [Google Scholar] [CrossRef]
  34. Sun, W.; Li, Z.; Qu, Y. The 3D conical Radon transform for seismic signal processing. Geophysics 2022, 87, V481–V504. [Google Scholar] [CrossRef]
  35. Radon, J.; Parks, P.; Clark, C. On the determination of functions from their integral values along certain manifolds. IEEE Trans. Med. Imaging 2018, 5, 170–176. [Google Scholar] [CrossRef]
  36. Stephen, B.; Neal, P.; Eric, C.; Borja, P.; Jonathan, E. Distributed Optimization and Statistical Learning via the Alternating Direction Method of Multipliers. Found. Trends® Mach. Learn. 2011, 3, 1–122. [Google Scholar]
  37. Zeng, W.-J.; So, H.C. Outlier-Robust Matrix Completion via Lp-Minimization. IEEE Trans. Signal Process. 2017, 66, 1125–1140. [Google Scholar] [CrossRef]
  38. Bioucas-Dias, J.M.; Figueiredo, M.A.T. A New TwIST: Two-Step Iterative Shrinkage/Thresholding Algorithms for Image Restoration. IEEE Trans. Image Process. 2007, 16, 2992–3004. [Google Scholar] [CrossRef] [Green Version]
  39. Ying, J.; Cai, J.F.; Guo, D.; Tang, G.; Chen, Z.; Qu, X. Vandermonde Factorization of Hankel Matrix for Complex Exponential Signal Recovery—Application in Fast NMR Spectroscopy. IEEE Trans. Signal Process. 2018, 66, 5520–5533. [Google Scholar] [CrossRef]
Figure 1. The CPD cartoon of the third-order tensor.
Remotesensing 14 06275 g001
Figure 2. The CPD model for a three-dimensional seismic data.
Remotesensing 14 06275 g002
Figure 3. The workflow of the proposed RCPD algorithm.
Remotesensing 14 06275 g003
Figure 4. The output SNR and calculation time line chart of the RCPD algorithm and CPD algorithm for different input SNR (−8 dB~2 dB) data. The solid circle solid line represents RCPD, and the hollow circle imaginary line represents CPD. The output SNR is represented by blue, the running time is represented by red.
Remotesensing 14 06275 g004
Figure 5. Denoising results for synthesis data with Gaussian white noise and SNR of −8 dB. (a) 3D slice of original data when H x = 10 , H y = 10 ; (b) Noisy data of SNR = −8 dB; (c) the data reconstructed by RCPD method with SNR = 21.31 dB; (d) data residual by RCPD method; (e) the data reconstructed by CPD method with SNR = 18.22 dB; (f) data residual by CPD method; (g) effect comparison of single trace denoising; (h) enlarged display of Figure (g).
Remotesensing 14 06275 g005aRemotesensing 14 06275 g005b
Figure 6. The output SNR and calculation time line chart of the RCPD algorithm and CPD algorithm for different percentages of miss data (80~30%) data. The solid circle solid line represents RCPD, and the hollow circle imaginary line represents CPD. The output SNR is represented by blue, the running time is represented by red.
Remotesensing 14 06275 g006
Figure 7. Reconstruction results for noisy synthesis data with missing 80%. (a) 3D slice of original data when H x = 10 , H y = 10 ; (b) noisy data with missing 80%; (c) reconstruction result by RCPD method with SNR = 21.37 dB; (d) data residual by RCPD method; (e) reconstruction result by CPD method with SNR = 20.20 dB; (f) data residual by CPD method; (g) effect comparison of single trace reconstruction; (h) enlarged display of Figure (g).
Remotesensing 14 06275 g007aRemotesensing 14 06275 g007b
Figure 8. Reconstruction results for noisy synthesis data with missing 60% containing AVO. (a) 3D slice of original data when H x = 10 , H y = 10 ; (b) noisy data with missing 60%; (c) reconstruction result by RCPD method with SNR = 18.82 dB; (d) data residual by RCPD method; (e) reconstruction result by CPD method with SNR = 17.50 dB; (f) data residual by CPD method; (g) effect comparison of single trace reconstruction; (h) enlarged display of Figure (g).
Remotesensing 14 06275 g008aRemotesensing 14 06275 g008b
Figure 9. The distribution of the source, receiver point, and CMP. The red represents the source point, the blue represents the receiver point, and the green represents CMP.
Remotesensing 14 06275 g009
Figure 10. Reconstruction results comparison of the CMP gathers ( C M P x = 10 , C M P y = 8 ) and the common-offset gathers of 5D field data. (a) CMP gathers with Hy number 7~11 ( C M P x = 10 , C M P y = 8 ) before reconstruction; (b) common-offset gathers with C M P y number 6~10 ( H x = 13 , H y = 14 ) before reconstruction; (c) reconstruction result of CMP gathers by RCPD method; (d) reconstruction result of common-offset gathers by RCPD method; (e) reconstruction result of CMP gathers by CPD method; (f) reconstruction result of common-offset gathers by CPD method; (g) effect comparison of noisy trace reconstruction; (h) effect comparison of missing trace reconstruction.
Remotesensing 14 06275 g010aRemotesensing 14 06275 g010b
Figure 11. Grayscale display of the common-offset gather with C M P y number 6~10 ( H x = 13 , H y = 14 ) of 5D field data. (a) Before reconstruction; (b) reconstruction result by RCPD method; (c) reconstruction result by CPD method.
Remotesensing 14 06275 g011
Figure 12. The output SNR and consumed time of the RCPD algorithm for different CP-rank R (3~13). The blue represents the output SNR, and the red represents the consumed time.
Remotesensing 14 06275 g012
Figure 13. The output SNR and consumed time of the RCPD algorithm for different regularization parameter λ (10−2~104). The blue represents the output SNR, and the red represents the consumed time.
Remotesensing 14 06275 g013
Publisher’s Note: MDPI stays neutral with regard to jurisdictional claims in published maps and institutional affiliations.

