Article

Sentinel-1 InSAR and GPS-Integrated Long-Term and Seasonal Subsidence Monitoring in Houston, Texas, USA

Department of Earth and Atmospheric Sciences, University of Houston, Houston, TX 77204, USA
*
Author to whom correspondence should be addressed.
Remote Sens. 2022, 14(23), 6184; https://doi.org/10.3390/rs14236184
Submission received: 13 November 2022 / Revised: 2 December 2022 / Accepted: 4 December 2022 / Published: 6 December 2022

Abstract

:
For approximately 100 years, the Houston region has been adversely impacted by land subsidence associated with excessive groundwater withdrawals. The rapidly growing population in the Houston region means the ongoing subsidence must be vigilantly monitored. Interferometric synthetic aperture radar (InSAR) has become a powerful tool for remotely mapping land-surface deformation over time and space. However, the humid weather and the heavy vegetation have significantly degraded the performance of InSAR techniques in the Houston region. This study introduced an approach integrating GPS and Sentinel-1 InSAR datasets for mapping long-term (2015–2019) and short-term (inter-annual, seasonal) subsidence within the greater Houston region. The root-mean-square (RMS) of the detrended InSAR-displacement time series is able to achieve a subcentimeter level, and the uncertainty (95% confidence interval) of the InSAR-derived subsidence rates is able to achieve a couple of millimeters per year for 5-year or longer datasets. The InSAR mapping results suggest the occurrence of moderate ongoing subsidence (~1 cm/year) in nothwestern Austin County, northern Waller County, western Liberty County, and the city of Mont Belvieu in Champers County. Subsidence in these areas was not recognized in previous GPS-based investigations. The InSAR mapping results also suggest that previous GPS-based investigations overestimated the ongoing subsidence in southwestern Montgomery County, but underestimated the ongoing subsidence in the northeastern portion of the county. We also compared the InSAR- and GPS-derived seasonal ground movements (subsidence and heave). The amplitudes of the seasonal signals from both datasets are comparable, below 4 mm within non-subsiding areas and over 6 mm in subsiding (>1 cm/year) areas. This study indicates that groundwater-level changes in the Evangeline aquifer are the primary reason for ongoing long-term and seasonal subsidence in the Houston region. The former is dominated by inelastic deformation, and the latter is dominated by elastic deformation. Both could cause infrastructure damage. This study demonstrated the potential of employing the GPS- and InSAR-integrated method (GInSAR) for near-real-time subsidence monitoring in the greater Houston region. The near-real-time monitoring would also provide timely information for understanding the dynamic of groundwater storage and improving both long-term and short-term groundwater resource management.

1. Introduction

The greater Houston region, Texas, comprising Harris, Galveston, Brazoria, Fort Bend, Montgomery Counties, and their adjacent counties (Figure 1), was the sixth-largest metropolitan area by population in the United States with over 7 million inhabitants as of 2020 [1]. The Houston region has been suffering from subsidence caused by excessive groundwater withdrawals since the 1920s [2,3]. The Houston region has provided one of the most extreme cases of land subsidence in the United States (US). According to [2], by the end of the 1970s, about 8300 km2 of the greater Houston area had subsided over 30 cm since human pumping began in the 1920s. As of the end of the 2000s, over three meters of subsidence has been documented in a substantial portion of southeastern Houston, primarily Baytown, Pasadena, and areas adjacent to the Houston Ship Channel [4]. Since the early 1990s, subsidence in downtown and southeastern Houston has essentially ceased because of strict restrictions of groundwater pumping, and subsidence has propagated to the inland, western, and northern Houston areas, because of continued groundwater withdrawals in these areas [5,6].
The Gulf Coast aquifer in Texas outcrops over a large geographic area parallel to the coastline. The aquifer system is often classified into five hydro-stratigraphic units, from the youngest to the oldest: the Chicot aquifer, the Evangeline aquifer, the Burkeville confining system, the Jasper aquifer, and the Catahoula confining system [7]. The sediments of the Gulf Coast Aquifer in Texas were deposited during the Tertiary and the Quaternary periods. The Catahoula confining system is often regarded as consolidated rocks. Its overlain sediments (sands, silts, clays, and gravel beds) are often regarded as unconsolidated [7]. In general, unconsolidated sediments tend to have higher porosity than consolidated ones, and would undertake further compaction under the weight of overlying sediments over time. Most groundwater for municipal, agricultural, and industrial uses in the Houston region is from the three major aquifers: Chicot, Evangeline, and Jasper aquifers. With rapid population growth, the need for groundwater has increased rapidly.
Modern land subsidence is a combination of natural and anthropogenic processes. Natural subsidence is primarily resulted by the slow geological consolidation of unconsolidated aquifers in response to natural overburden loading. The rate of natural subsidence in the Texas coastal area is a couple of millimeters per year and tends to be smaller towards inland areas [8]. Anthropogenic subsidence is primarily resulted by the compaction of aquifers associated with the excessive extraction of underground fluids, specifically water, oil, and gas. The ongoing subsidence within the Houston region is primarily contributed by anthropogenic subsidence, specifically the inelastic compaction of clays within the Chicot and Evangeline aquifers. To cease the rapid subsidence in the Harris and Galveston counties, the Texas Legislature established the Harris–Galveston Subsidence District (HGSD) in 1975, the first district of its kind in the United States. As a result of groundwater regulations and conservations, the overall subsidence rate and the size of the subsiding area in the Houston region have been reducing since the middle 1980s [4]. Following the success of the HGSD in minimizing subsidence in Galveston County and eastern Harris County, the Texas Legislature created the Fort Bend Subsidence District (FBSD) in 1989, the Lone Star Groundwater Conservation District (LSGCD) in 2001, and the Brazoria County Groundwater Conservation District (BCGCD) in 2005. The areas of each district’s jurisdiction are depicted in Figure 1.
Houston is one of the earliest urban regions to use the Global Positioning System (GPS) for subsidence monitoring. Campaign GPS surveys were employed in subsidence monitoring at benchmarks in the Houston region in the late 1980s, before the complement of the GPS satellite constellation. Permanent GPS stations have become the primary subsidence-monitoring tools in the Houston region since the 1990s. The HGSD, the FBSD, the University of Houston (UH), and several other local entities, have established a dense GPS network (HoustonNet) for ground deformation monitoring in the Houston region since the 2010s [9]. As of 2022, approximately 250 GPS stations have been integrated into the routine subsidence monitoring of the Houston region. The average spatial resolution of the GPS sites is about 15 km by 15 km. Though the HoustonNet provides continuous and dense subsidence measurement crossover in the Houston region, there are still large sparse areas with few subsidence measurements, particularly in the northwestern and northern areas, where moderate to rapid subsidence (1 to 2 cm/year) is ongoing. Long-term GPS observations have clearly indicated that subsidence could be considerably site-specific. An ordinary understanding is that land subsidence estimates (rates) interpolated from nearby sites should be interpreted with caution [10,11].
Interferometric Synthetic Aperture Radar (InSAR) techniques have been frequently applied in urban subsidence studies since the 1990s [12,13,14,15]. Interferometric Synthetic Aperture Radar uses the difference in the carrier signal phase between SAR images to recover relative displacements over wide areas. In contrast to GPS, the InSAR techniques have the ability to map ground deformation over large areas with a high spatial resolution at a near-zero cost for users. Since 1992, several Synthetic Aperture Radar (SAR) images have been available over the Houston region, including the ERS-1/2, Envisat, Advanced Land Observing Satellite (ALOS), and Sentinel-1 satellites. [16] utilized 60 ERS-1/2 interferograms spanning from 1996 to 1998 to map the spatial extent of the regional subsidence in northwestern Harris County and Seabrook. [17] examined land subsidence that centered at Jersey Village in Harris County during the 1990s by integrating the C-band ERS-1/2 interferograms, GPS, and extensometer data. [18] mapped land deformation in a portion of northwest Harris County using 25 ERS scenes from 1992 to 2002. [19] utilized a Multi-Temporal InSAR (MTI) technique based on ERS-1/2, Envisat, and ALOS to derive land surface deformation within the Houston region. [20] utilized Sentinel-1A data to investigate subsidence patterns in the greater Houston region. These investigations have successfully demonstrated the great potential of using InSAR techniques for depicting temporal trends and spatial patterns of past subsidence in the Houston region. Unfortunately, the ERS-1 satellite was decommissioned in 2000, and ERS-2 was decommissioned in 2011. Envisat was decommissioned in 2012. The Advanced Land Observing Satellite was terminated in 2011. Currently (as of 2022), only the Sentinel-1 mission provides SAR images covering the Houston region.
Previous InSAR-based investigations mostly focused on deliberating long-term (multiple years) subsidence trends. This study focuses on both long-term and short-term (inter-annual and seasonal) vertical ground deformation time series derived from both InSAR and GPS datasets. One of the fundamental challenges for obtaining high-accuracy subsidence estimates from InSAR data is the unmodeled atmospheric phase delay due to the moisture weather condition in the Gulf of Mexico region and the low coherence associated with the heavy vegetation [21]. In order to employ the InSAR techniques into the routine monitoring of ongoing subsidence, these two challenges must be overcome. In this study, we use long-history GPS observations to estimate and correct the errors in InSAR displacements. The multiple satellite signal paths employed in GPS positioning would be able to constrain the InSAR errors associated with tropospheric effects. Most GPS stations in Houston are mounted on one- or two-story buildings that are free from soil moisture and vegetation effects. Thus, GPS-derived displacements are able to correct the soil moisture and vegetation effects in the InSAR-derived displacements. Global Positioning System-derived displacements are derived from dual-frequency signals (L1 and L2), which have minimized the effect of the ionospheric delay. Accordingly, GPS-derived ground surface displacements are also able to correct the errors associated with unmodeled ionospheric signal delay superimposed into the InSAR observations.

2. Data and Processing

2.1. Groundwater-Level Data

While GPS and InSAR datasets provide the land surface deformation over time and space, the groundwater-level dataset explains the reasons for land subsidence and uplift. The groundwater pumping in the Houston region is primarily from the lower Chicot and Evangeline aquifers. Groundwater levels in Houston are monitored by the U.S. Geological Survey (USGS). As of the 2020s, the USGS regularly checks groundwater levels in 200 Chicot wells and 385 Evangeline wells in the Houston region (Figure 1) [22]. The groundwater wells are completed at various depths within the local aquifer system. The monthly or yearly sampled groundwater level datasets are publicly available through the USGS National Water Information System (NWIS) website [23]. Most groundwater-level measurements are collected at the beginning (January or February) and the end of the year (December). The yearly groundwater-level change is estimated according to the groundwater-level altitudes at the beginning and the end of the year.

2.2. GPS Data

A detailed introduction to current geodetic infrastructure and the stable Houston reference frame (Houston20) is presented in [24]. Houston20 is realized by 25 long-history (>8 years) continuous GPS stations located outside the subsiding area. The stability of the regional reference frame is below 1 mm/year in all three directions. In general, daily GPS solutions in the Houston region are able to provide 6–8 mm root-mean-square (RMS) accuracy daily solutions in the vertical direction in the Houston area [10]. Global Positioning System-derived subsidence time series are available to the public through the website of the HGSD [25]. The detailed methods for GPS data processing are documented in [11]. For this study, we use the daily positions, specifically daily displacement time series, with respect to the global reference frame, International GPS Service Reference Frame 2014 (IGS14), and the regional reference frame Houston20. The rate of vertical displacements with respect to the global reference frame is about 1 mm/year faster than the subsidence rate with respect to the regional reference frame [24].
In order to correct the InSAR LOS displacement, a group of reference GPS stations is selected primarily based on data continuity and geo-distribution. One GPS station is selected in each grid cell of approximately 20 km by 20 km. If there are multiple GPS stations within the same grid, we choose the one with the highest data continuity and linearity. In total, we select 27 GPS stations as references to correct InSAR results and use the other GPS solutions to validate our corrected InSAR displacements and velocities (Figure 1). In general, the subsidence rate derived from 5-year daily GPS measurements would be able to result in submillimeter per year (<1 mm/year) accuracy, 95% confidence interval (95%CI) [26].

2.3. InSAR Data

The Sentinel-1 mission is the European Radar Observatory for the Copernicus joint initiative of the European Commission (EC) and the European Space Agency (ESA). It continues the C-band SAR Earth Observation heritage of the ESA’s ERS-1, ERS-2, and ENVISAT. The mission is composed of a constellation of two satellites, Sentinel-1A and Sentinel-1B, launched on 3 April 2014 and 25 April 2016, respectively. Sentinel-1A and Sentinel-1B share a near-polar, sun-synchronous orbit with a 180° orbital phasing difference. Unfortunately, the Sentinel-1B satellite was decommissioned on 23 December 2021, because of certain unrepairable hardware problems. It is expected that Sentinel-1C will be launched soon.
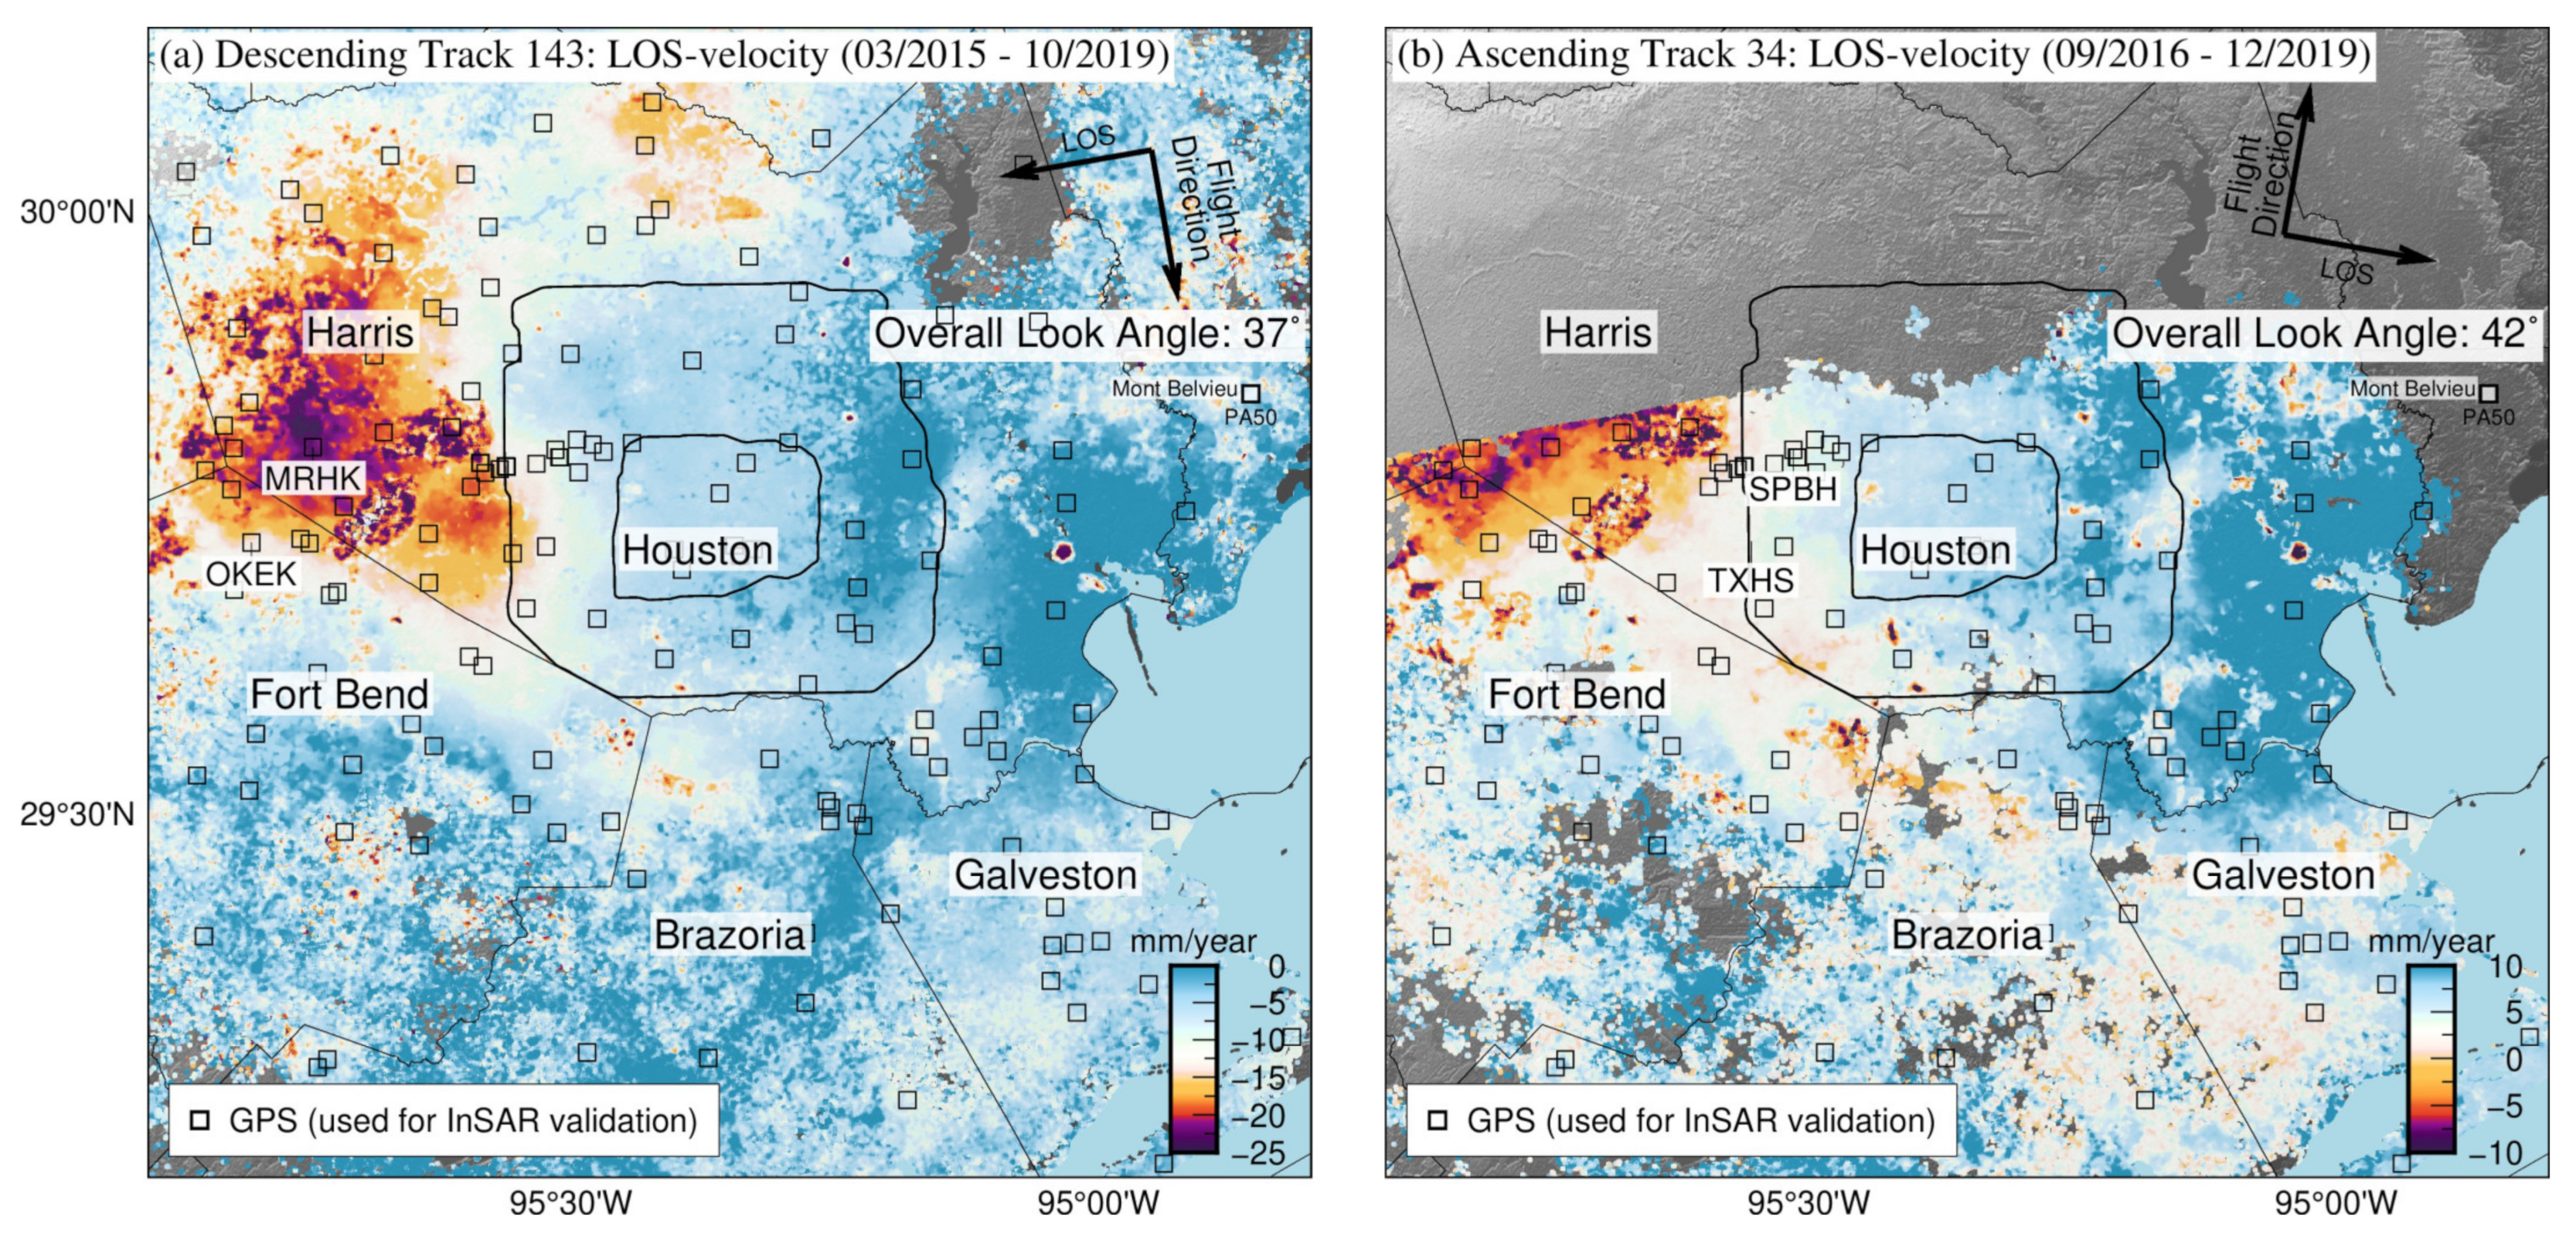
The Sentinel-1 satellites have provided SAR images covering the Houston region through two tracks since March 2015, descending track 143 and ascending track 34 (Figure 1). Track 143 covers the whole Houston region (Figure 2a). Track 34 only covers the southeastern portion of the Houston region (Figure 2b), where recent subsidence is insignificant compared to the northern and northwestern portions. Accordingly, this study primarily relies on the Sentinel-1 data on the descending track 143. We processed Sentinel-1A SAR images acquired from both ascending and descending tracks with Interferometric Wide Swath (IWS) mode spanning over a 5-year period (2015–2019). The Sentinel-1B satellite was launched in 2016, missing data in 2015. Hence, we did not use the Sentinel-1B data in this study. The footprints of descending track 143 and ascending track 34 are illustrated in Figure 1. In total, 89 ascending and 121 descending SAR images were acquired from tracks 43 and 143, respectively. From these scenes, we generated 543 ascending and 756 descending interferograms by using the GMTSAR software package [27]. A full description of GMTSAR processing steps and parameter options is outlined in the GMTSAR manual. Firstly, we co-registered the Single Look Complex (SLC) images using the 30-m resolution digital elevation model (DEM) from the Shuttle Radar Topography Mission (SRTM) [28]. Secondly, we processed all interferograms with a maximum temporal baseline of 100 days and maximum perpendicular baselines of 250 m. The SAR image on 16 November 2017 is used as a common master to align all images on track 143 and the SAR image on 20 May 2018 is used as a common master for track 34. The final precise orbits of the satellites are used [29]. The wrapped interferograms are converted to the LOS-displacement by employing the Snaphu algorithm [30] with a pixel correlation threshold of 0.2.
The errors in InSAR-derived displacements primarily comprise unmodeled ionospheric signal propagation delay, unmodeled tropospheric delay, the impact of soil moisture and vegetation on surface heights, and scattering properties [31,32]. To correct the large-scale atmospheric errors superimposed into each interferogram prior to InSAR time series construction, we employ an approach that is similar to the GPS-enhanced InSAR (abbreviated as GInSAR) introduced in [33]. The major steps of the GInSAR processing are summarized as:
  • Smoothing the three components (east-west, north-south, and up-down directions, abbreviated as ENU) of daily GPS-derived time series (with respect to IGS14) with a 6-day Gaussian filter to minimize the multipath and tropospheric errors.
  • Projecting the GPS-derived ENU displacements at 27 selected long-history GPS (>7 years) sites to the LOS direction according to the SAR look angles at each site (see Figure 1 for GPS locations).
  • Estimating the errors superimposed into the uncorrected InSAR displacements caused by atmospheric delay. Firstly, the difference between the GPS-derived LOS-displacement and co-located InSAR-derived LOS-displacement during the same time window is calculated at each GPS site. The InSAR-derived LOS-displacement is obtained by averaging the measurement within a 5-pixel by 5-pixel grid (approximately 300 m by 300 m) centered on the GPS site. Secondly, a smooth residual surface is formed using the differences obtained from the first step. We employ the module “surface” in the Generic Mapping Tools (GMT) package [34] to produce the time series of the residual surface, which represents the errors in each uncorrected interferogram caused by atmospheric delay and other sources.
  • Correcting each uncorrected interferogram with the residual surface (see Figure 3 for an example).
  • Constructing InSAR LOS-displacement time series from all corrected 543 ascending and 756 descending interferograms using a coherence-based small baseline subset (SBAS) approach [35].
  • Aligning the LOS-displacement time series to a stable regional reference frame by removing the average LOS-displacement of these 27 reference sites at each time (day).
  • Projecting the LOS-displacements to the ENU coordinates. Since there is no considerable coherent horizontal ground deformation within the Houston region [11], the LOS-projected UD-displacement would precisely represent the vertical ground deformation [36].
  • Aligning the ENU displacement time series to the stable Houston Reference Frame 2020 according to the average ENU site velocities (with respect to Houston20) at these 27 reference GPS sites.
The GPS correction process has significantly reduced the uncertainty of the InSAR-derived displacements, in turn significantly increasing the accuracy of the InSAR-derived site velocity. Figure 4 depicts the comparisons of the LOS-displacement before and after employing the GPS corrections at two sites (OKEK, MRHK) located in the Katy area. The locations of these two sites are marked in Figure 2a. While MRHK is one of these 27 reference GPS stations, OKEK is not. The root-mean-square (RMS) of the detrended LOS-displacement time series is approximately 24 to 25 mm before the GPS correction, and 7 to 8 mm after the GPS correction. That is to say, the GInSAR technique has improved the accuracy (repeatability) of the LOS-displacement by approximately 70%.
Interferometric synthetic aperture radar could only measure a projection vector of the three-dimensional displacements in the LOS direction (either away from or towards the satellite). Some previous investigations used the LOS-displacements to study subsidence in the Houston region [17,18,20]. Figure 5 depicts the GInSAR-derived displacement time series (2015–2019) at two sites along the LOS direction (track 143) and the vertical direction (UD). The difference between the displacements in the LOS direction and the UD direction increases over time. The subsidence rate in the LOS direction is about 3 to 4 mm/year larger than the subsidence rate in the UD direction, which is about 2 to 3 times larger than the 95%CI of the GInSAR-derived subsidence rate. Accordingly, we suggest that the UD-displacement time series, rather than the LOS-displacement time series, are used for precise subsidence investigations.

2.4. Validation of LOS Velocities

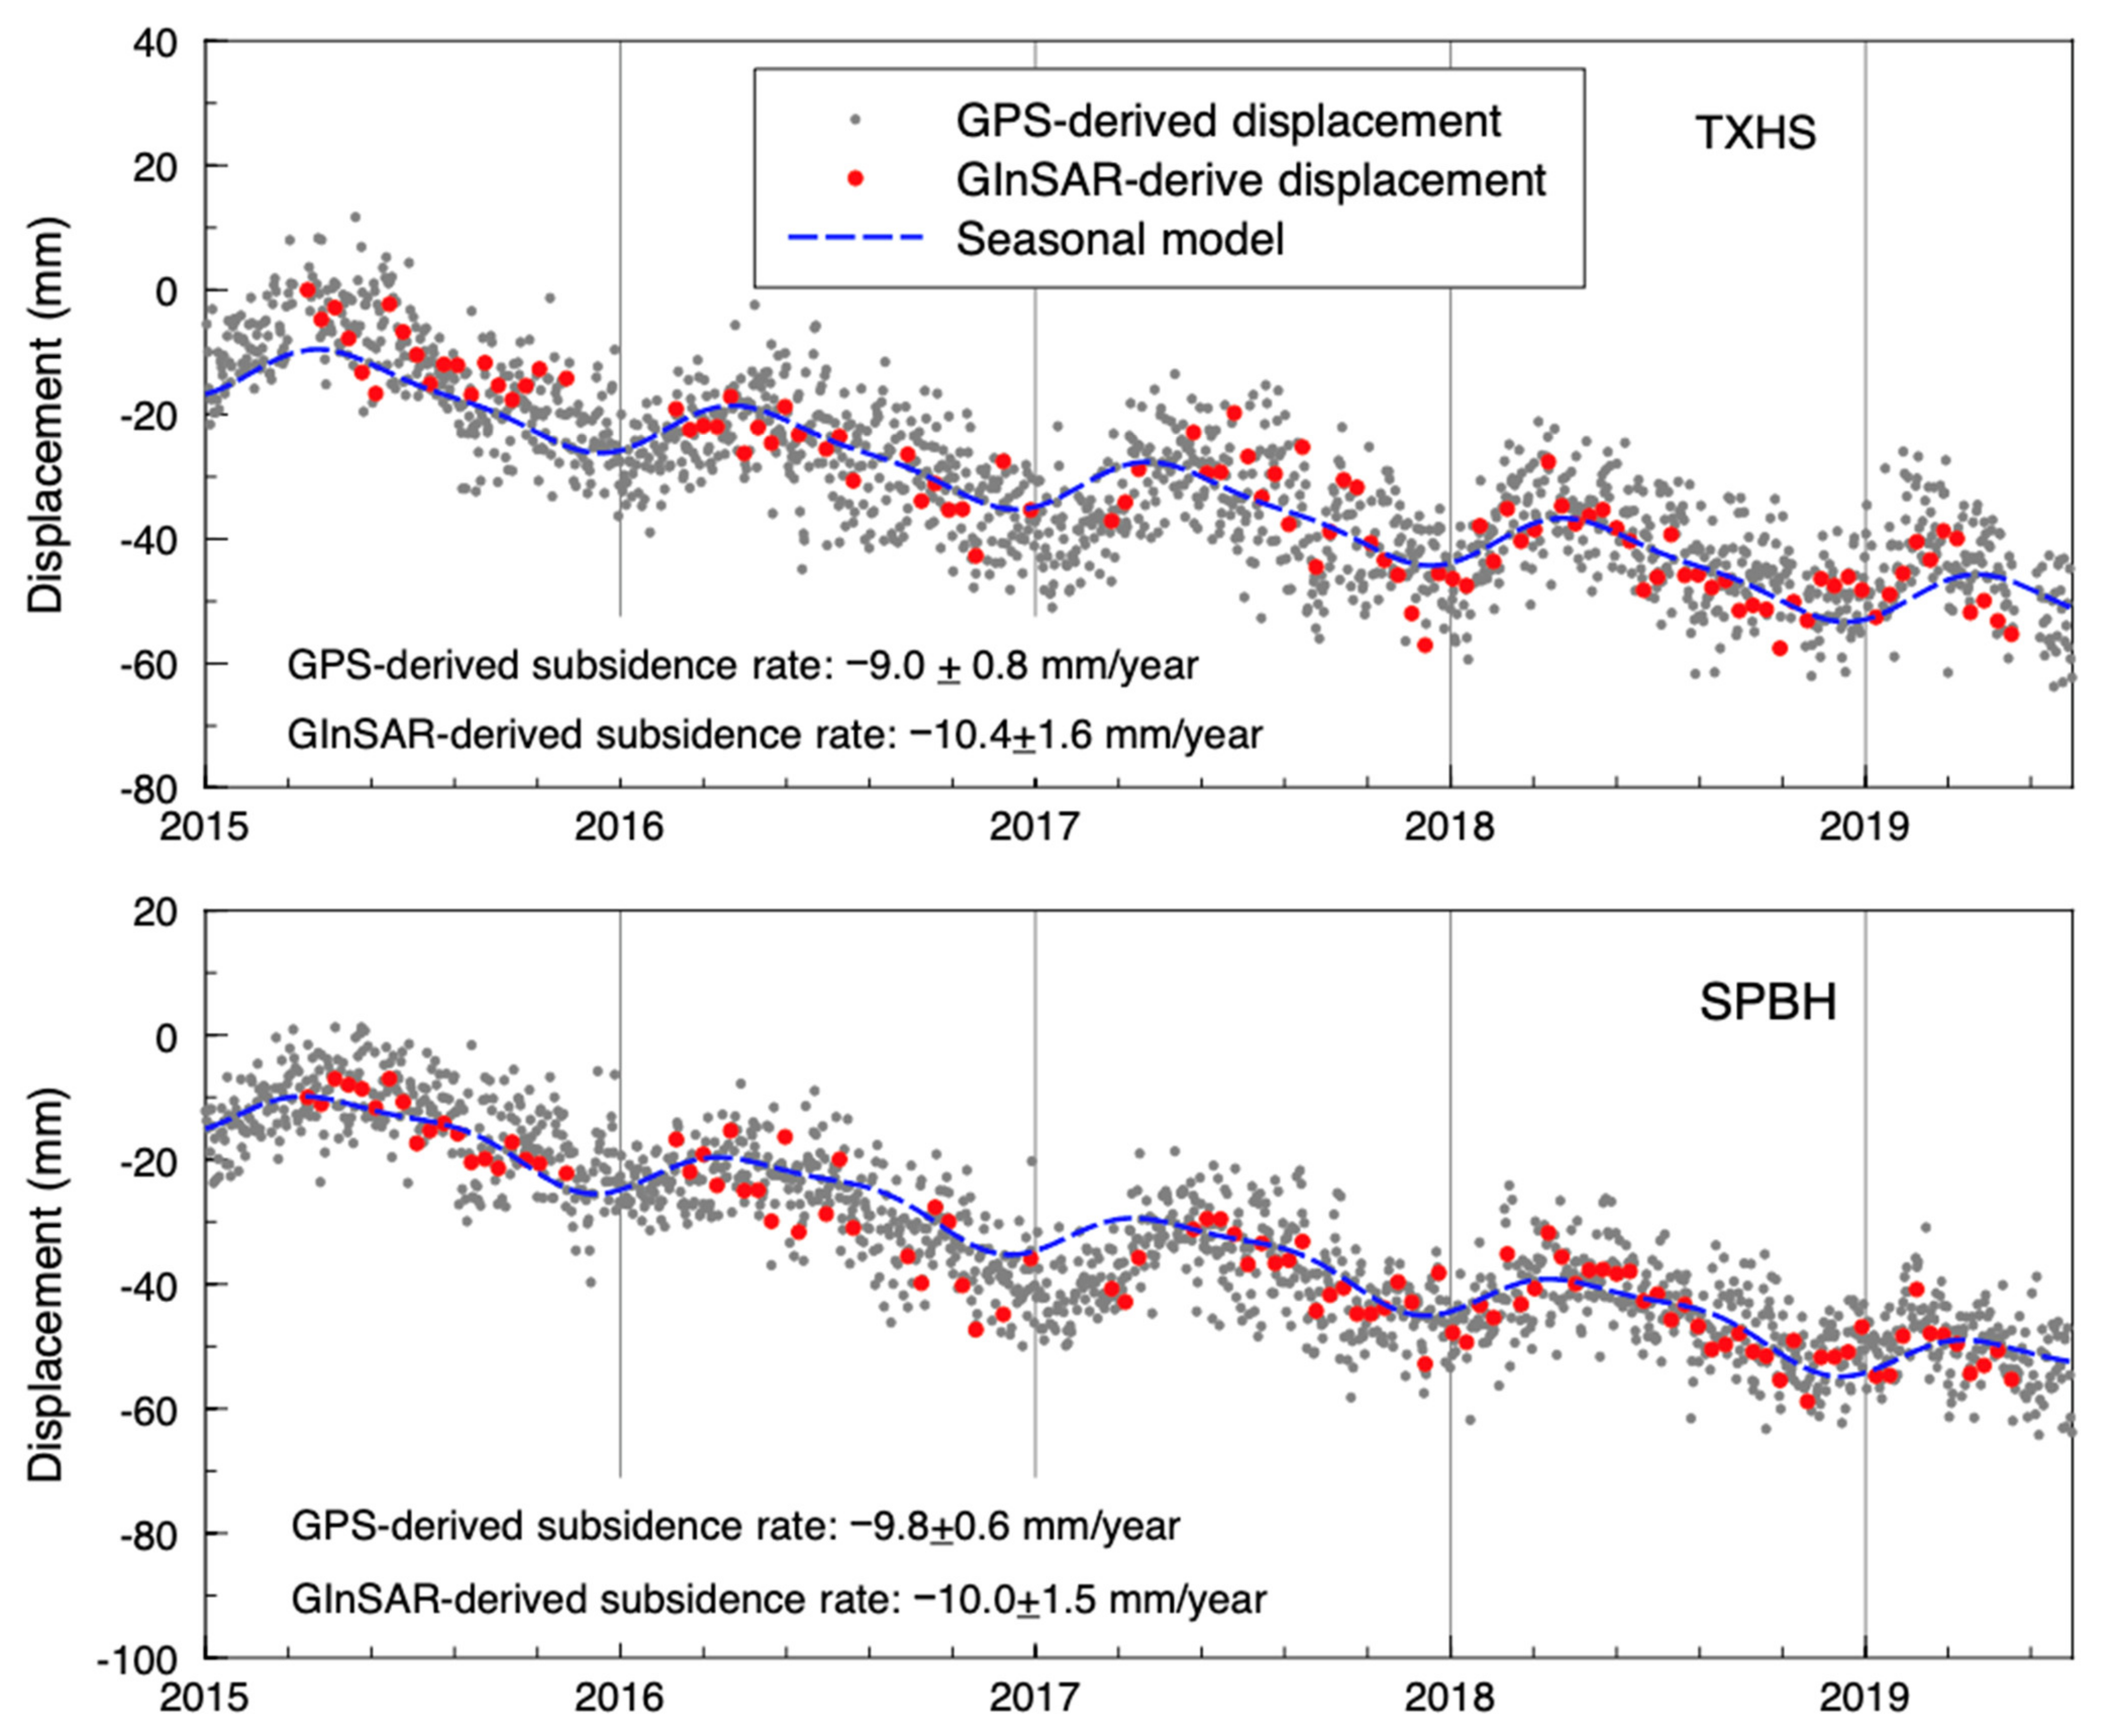
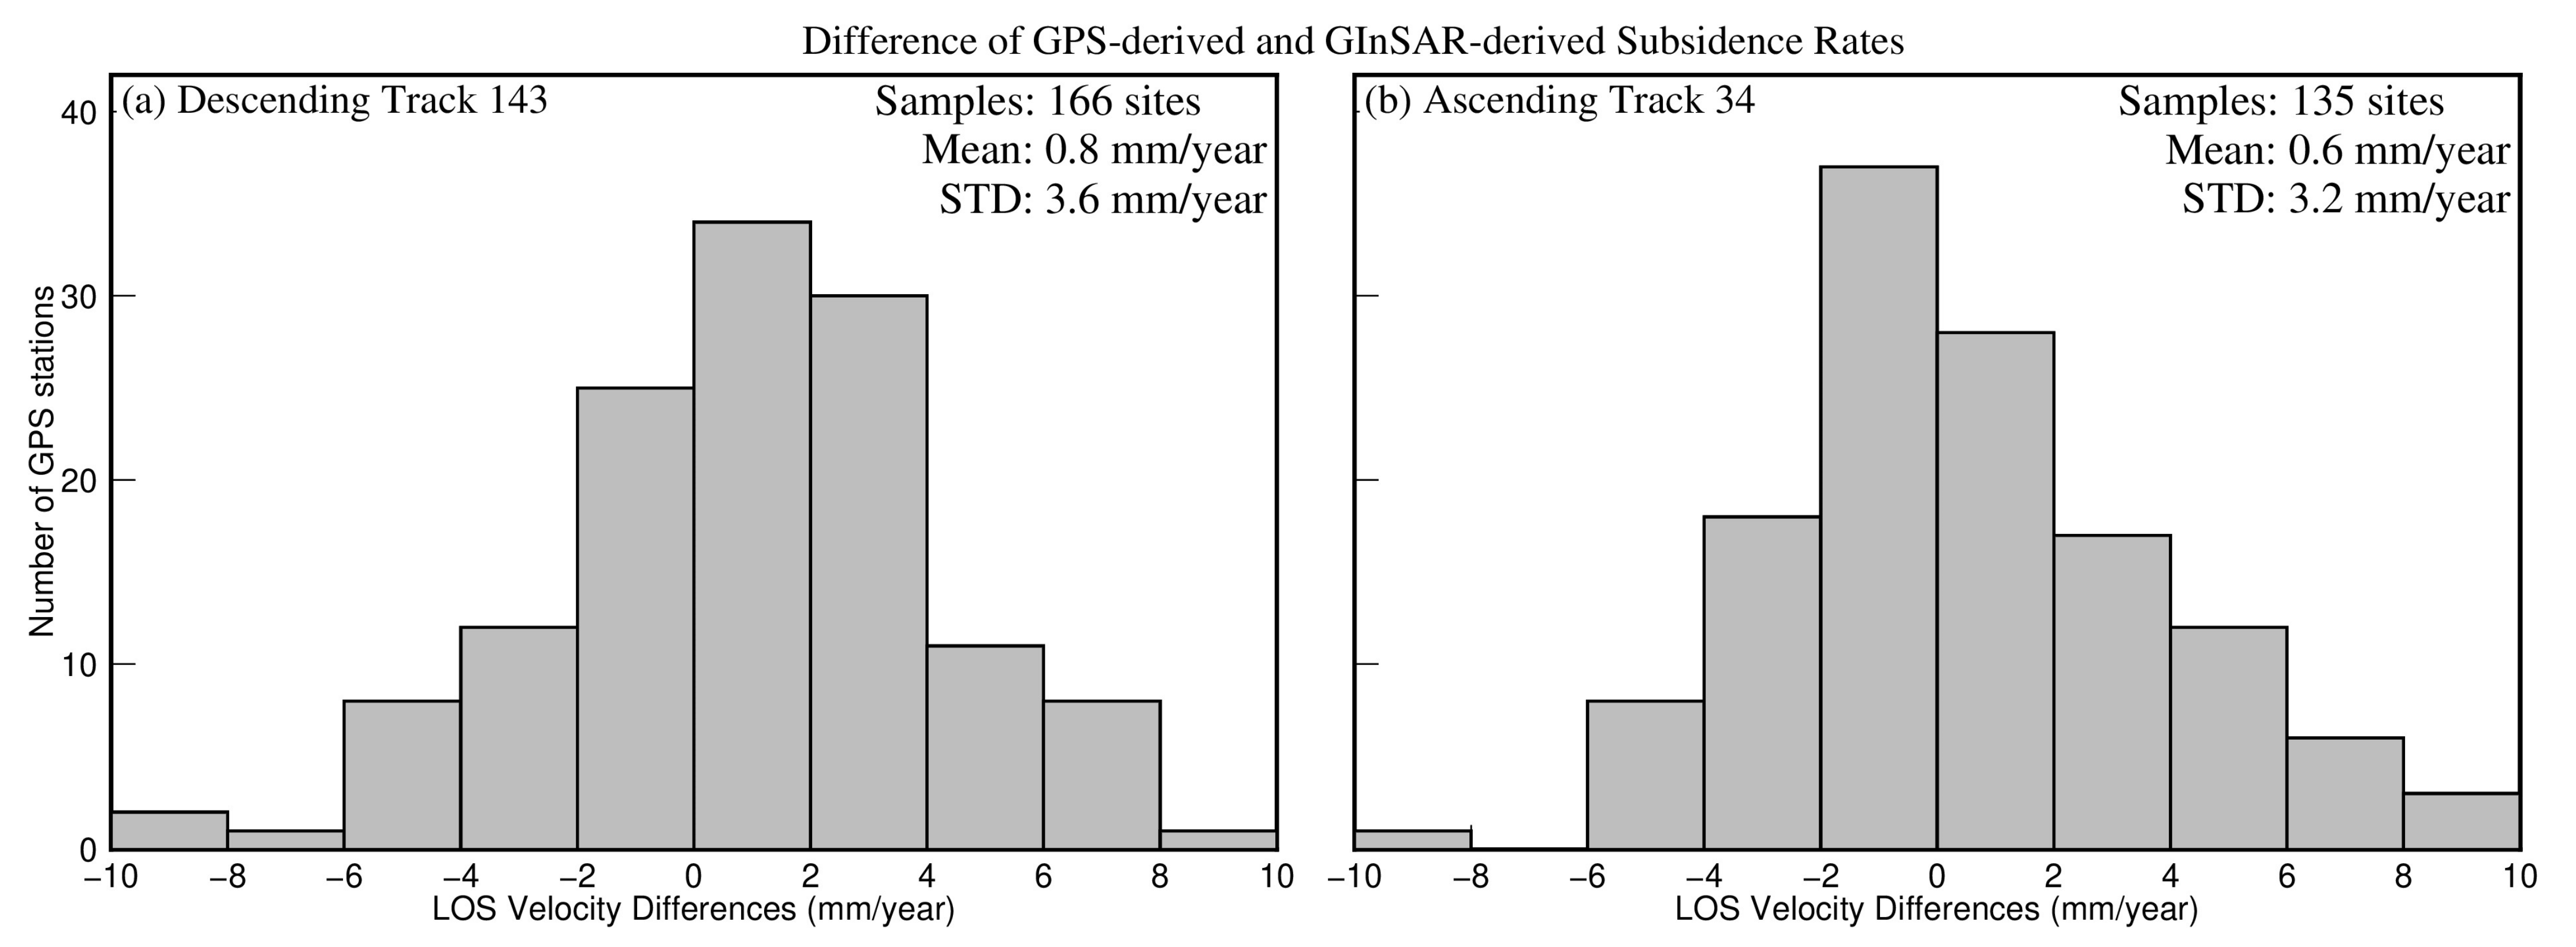
Figure 6 illustrates the vertical displacement time series (2015–2019) derived from GInSAR processing at two permanent GPS sites: TXHS and SPBH (Figure 2b). Both GPS stations do not belong to the 27 reference stations for GInSAR processing. Global Positioning System-derived vertical displacements are often used as ground truth to assess the credibility of GInSAR-derived displacements. The GInSAR- and GPS-derived displacements are aligned to the stable Houston Reference Frame 2020 (Houston20). The GInSAR-derived displacement time series are able to precisely track both the long-term subsidence and the seasonal ground movements, as well as the inter-annual variations. In order to fully assess the reliability of the GInSAR-derived LOS-velocity, we further compared the GPS-derived and GInSAR-derived LOS-velocities at 166 GPS sites for track 143 and 135 GPS sites for track 34. The locations of these GPS stations are marked in Figure 2. The GPS-derived ENU displacement time series are projected to the LOS direction according to their local incidence angles. The statistical results are illustrated in Figure 7. The mean differences between GPS-derived and GInSAR-derived LOS-velocities are below 1 mm/year in both descending and ascending track directions. The standard deviation (1 σ ) is about 3 to 4 mm/year.

3. Results

3.1. GInSAR-Derived Long-Term Subsidence Trend

Figure 8 depicts the GInSAR-derived land surface deformation rates (March 2015–October 2019) in the vertical direction with respect to the regional reference frame Houston20. We used 756 scenes from the Sentinel-1A satellite along the descending track 143. According to the GInSAR map, approximately 20 km2 is undergoing rapid subsidence (>20 mm/year); 2400 km2 is undergoing moderate subsidence (10 to 20 mm/year), and 5800 km2 is undergoing minor subsidence (5 to 10 mm/year). The contour lines indicate the 5-year (2015–2019) average subsidence rates derived from the subsidence rates at approximately 200 permanent GPS sites [37]. Overall, the subsidence rates estimated from these two datasets agree well. Both the GInSAR-mapping and GPS-mapping results depict moderate to rapid (1 to 3 cm/year) ongoing subsidence in western and northern Harris County and southern Montgomery County, and insignificant subsidence and minor uplift in the southeastern Houston region. However, the GInSAR results provide more detailed and accurate subsidence estimates in areas with a few GPS stations, such as in Austin County, Waller County, Liberty County, and Chambers County. It appears that the GPS-derived subsidence contour lines overestimated the ongoing subsidence in southwestern Montgomery County, but underestimated ongoing subsidence in the northeast of the county, where a few GPS stations are available. The GInSAR map also suggests very considerable ongoing subsidence in the western part of Austin County (~10 mm/year), northern part of Waller County (>10 mm/year), and the western part of Liberty County (>10 mm/year). Subsidence in these areas was not recognized in previous GPS-based investigations [6,37,38], because there were only a few GPS stations in these areas. The ongoing subsidence in Austin, Waller, and Liberty counties needs to be closely monitored.
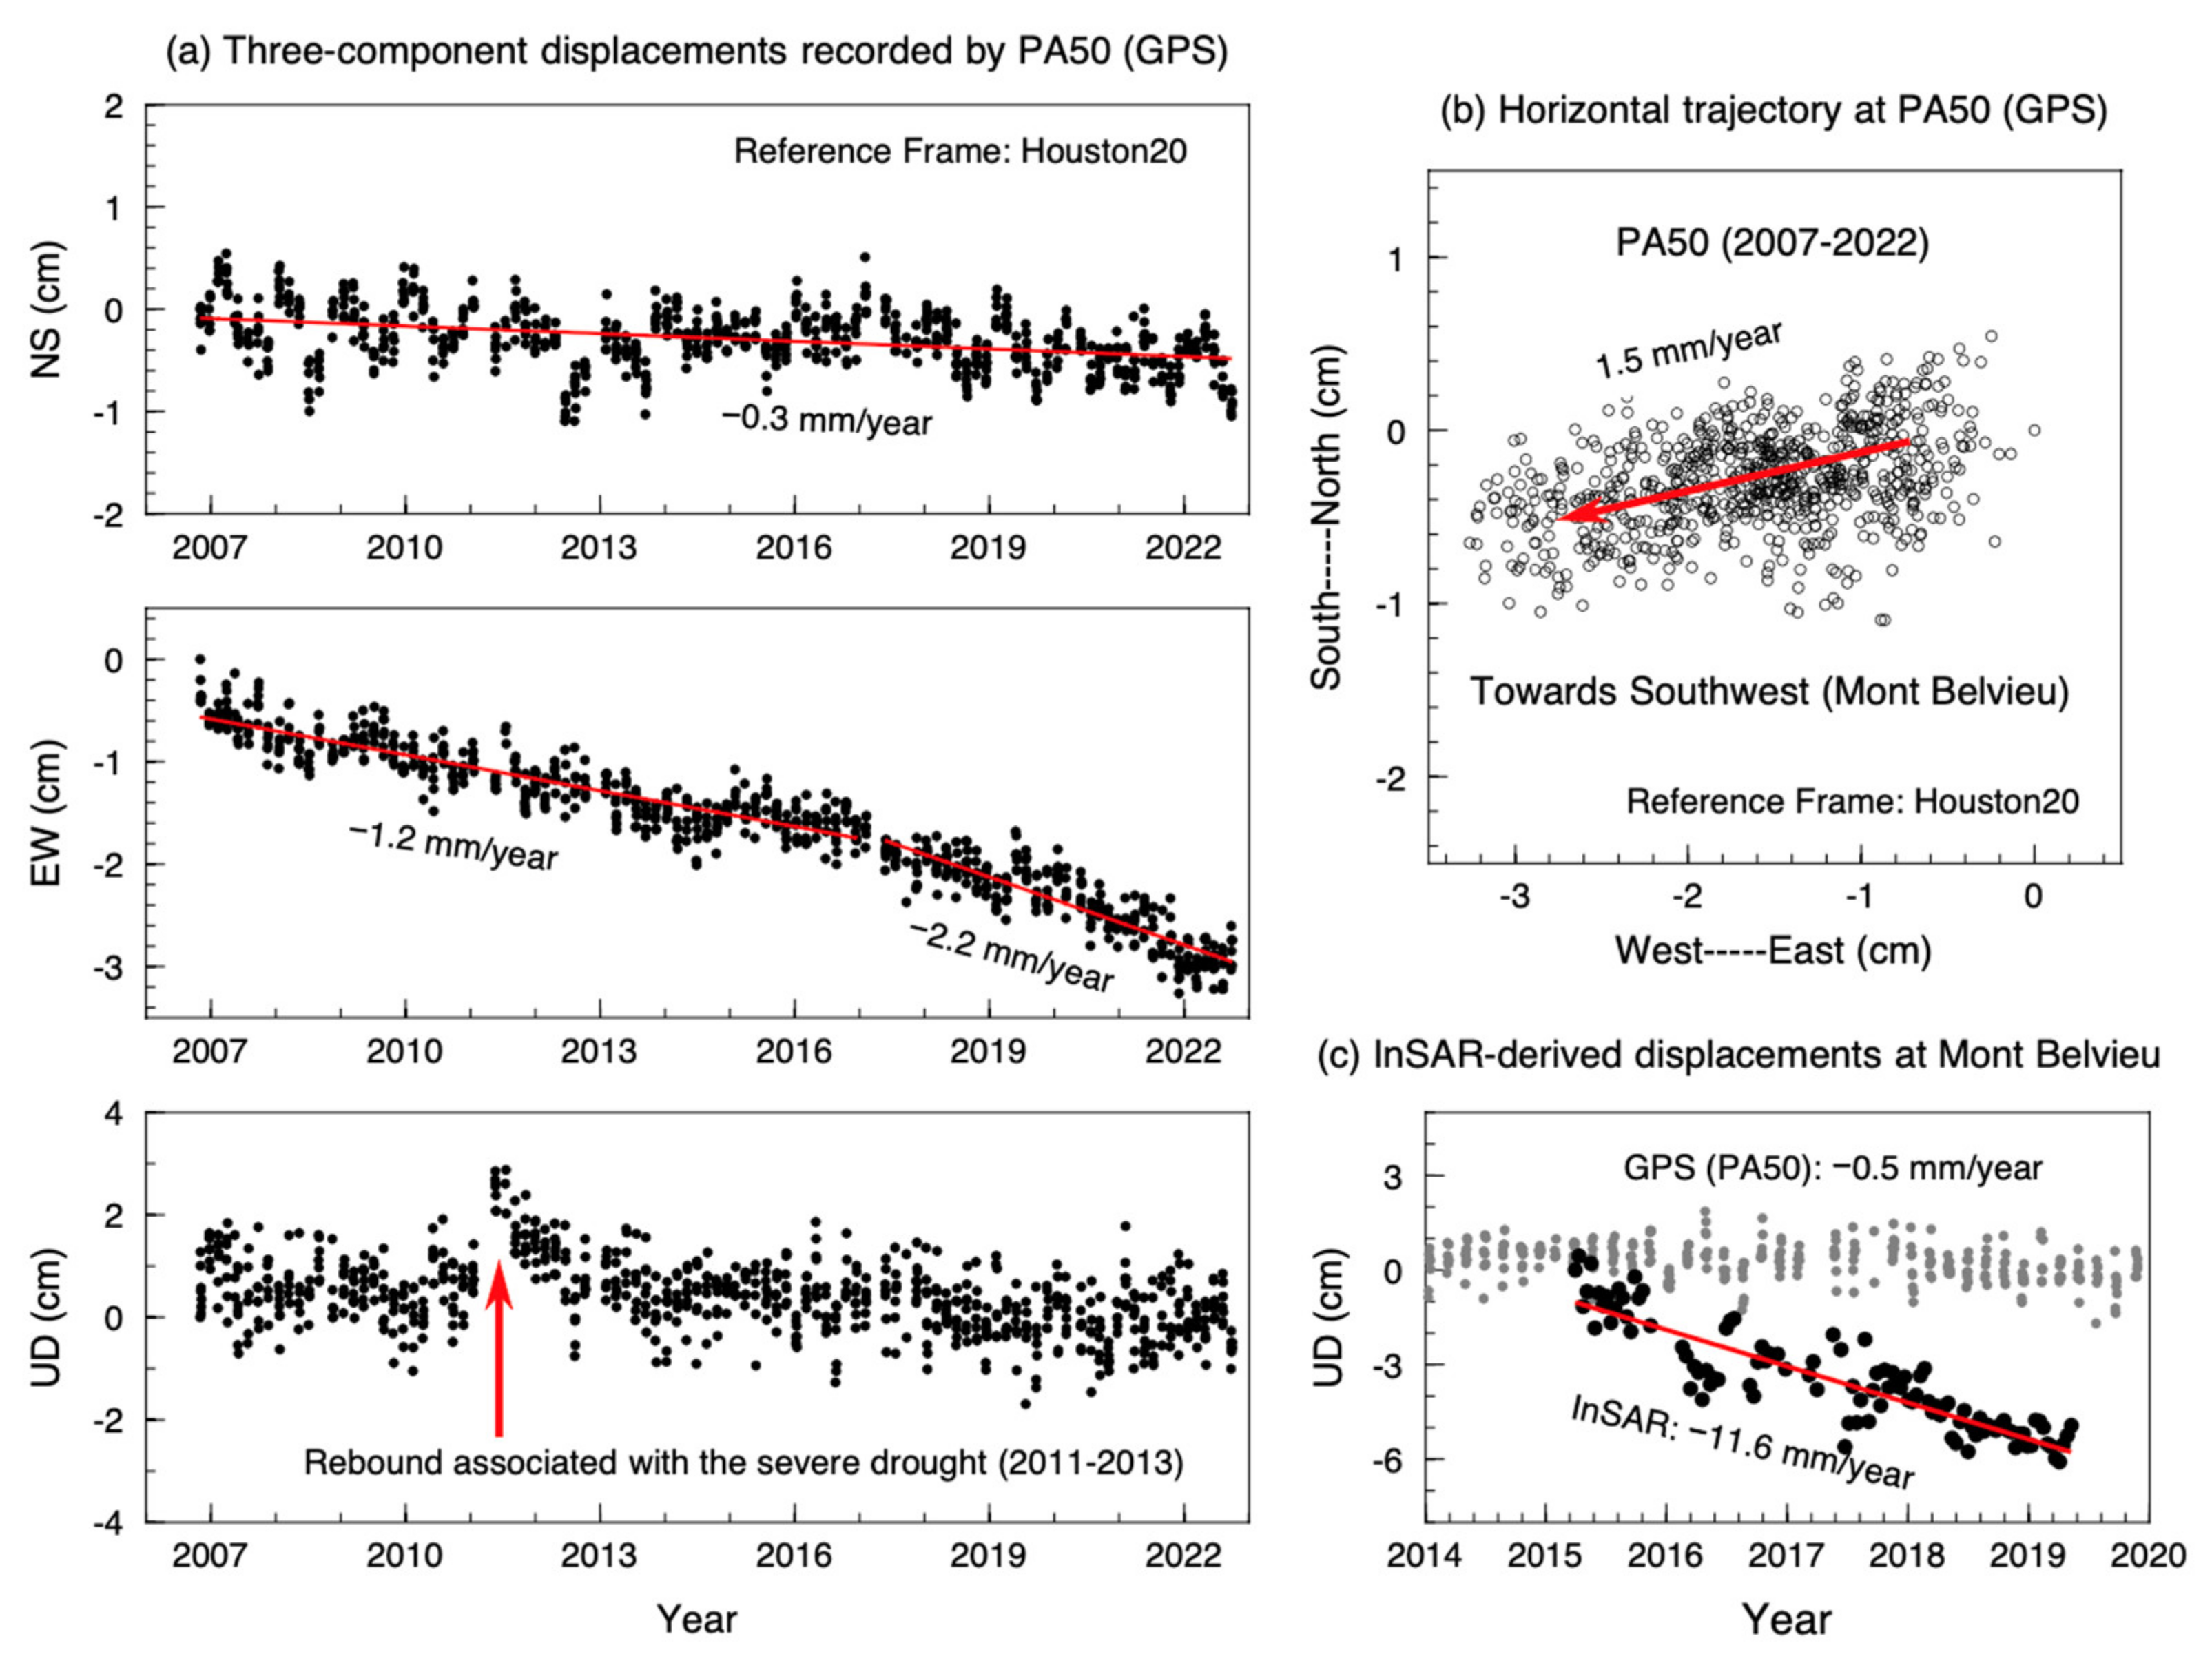
The GInSAR-derived velocity map also indicates that a small subsidence bowl is developing in the Mont Belvieu area in Chambers County (Figure 2 and Figure 8). The subsidence in this area has been reported by recent investigations using InSAR [19,20]. The ongoing subsidence in this area was not recognized in our previous GPS investigations, though there is a long-history permanent GPS station (PA50) adjacent to Mont Belvieu. Mont Belvieu is a city adjacent to the Harris and Liberty counties, where the largest underground storage facility for liquefied petroleum gas in the US is located. The center of the subsidence bowl (>1 cm/year) is located in the facility area of the Enterprise Products Partners L.P.
Figure 9 depicts the GInSAR-derived subsidence time series in the center of the subsidence bowl and the GPS-derived subsidence time series at PA50. PA50 is 4.5 km northeast to the center of the subsidence bowl. PA50 does not show any considerable ongoing subsidence (Figure 9a). Therefore, the subsidence in this area has not been identified in previous investigations relying on GPS. The GPS-derived displacements suggest that site PA50 is moving towards the southwest with an average speed of approximately 1.5 mm/year, where Mont Belvieu is located (Figure 9b). The horizontal displacement time series indicate that the horizontal movement has accelerated since around 2015. The InSAR-derived subsidence time series in Mont Belvieu indicate that the ongoing subsidence rate is about 12 mm/year (Figure 9c). It is most likely that horizontal movement is associated with the development of the subsidence bowl. Thus, the GPS-derived horizontal displacements at PA50 indirectly verified the occurrence of the ongoing subsidence in the Mont Belvieu area. The reasons for the ongoing subsidence in this area will be investigated in our future studies.
In summary, the GPS and InSAR techniques completed each other, and successfully identified subsiding areas (>10 mm/year) that were not recognized in previous GPS-based investigations.
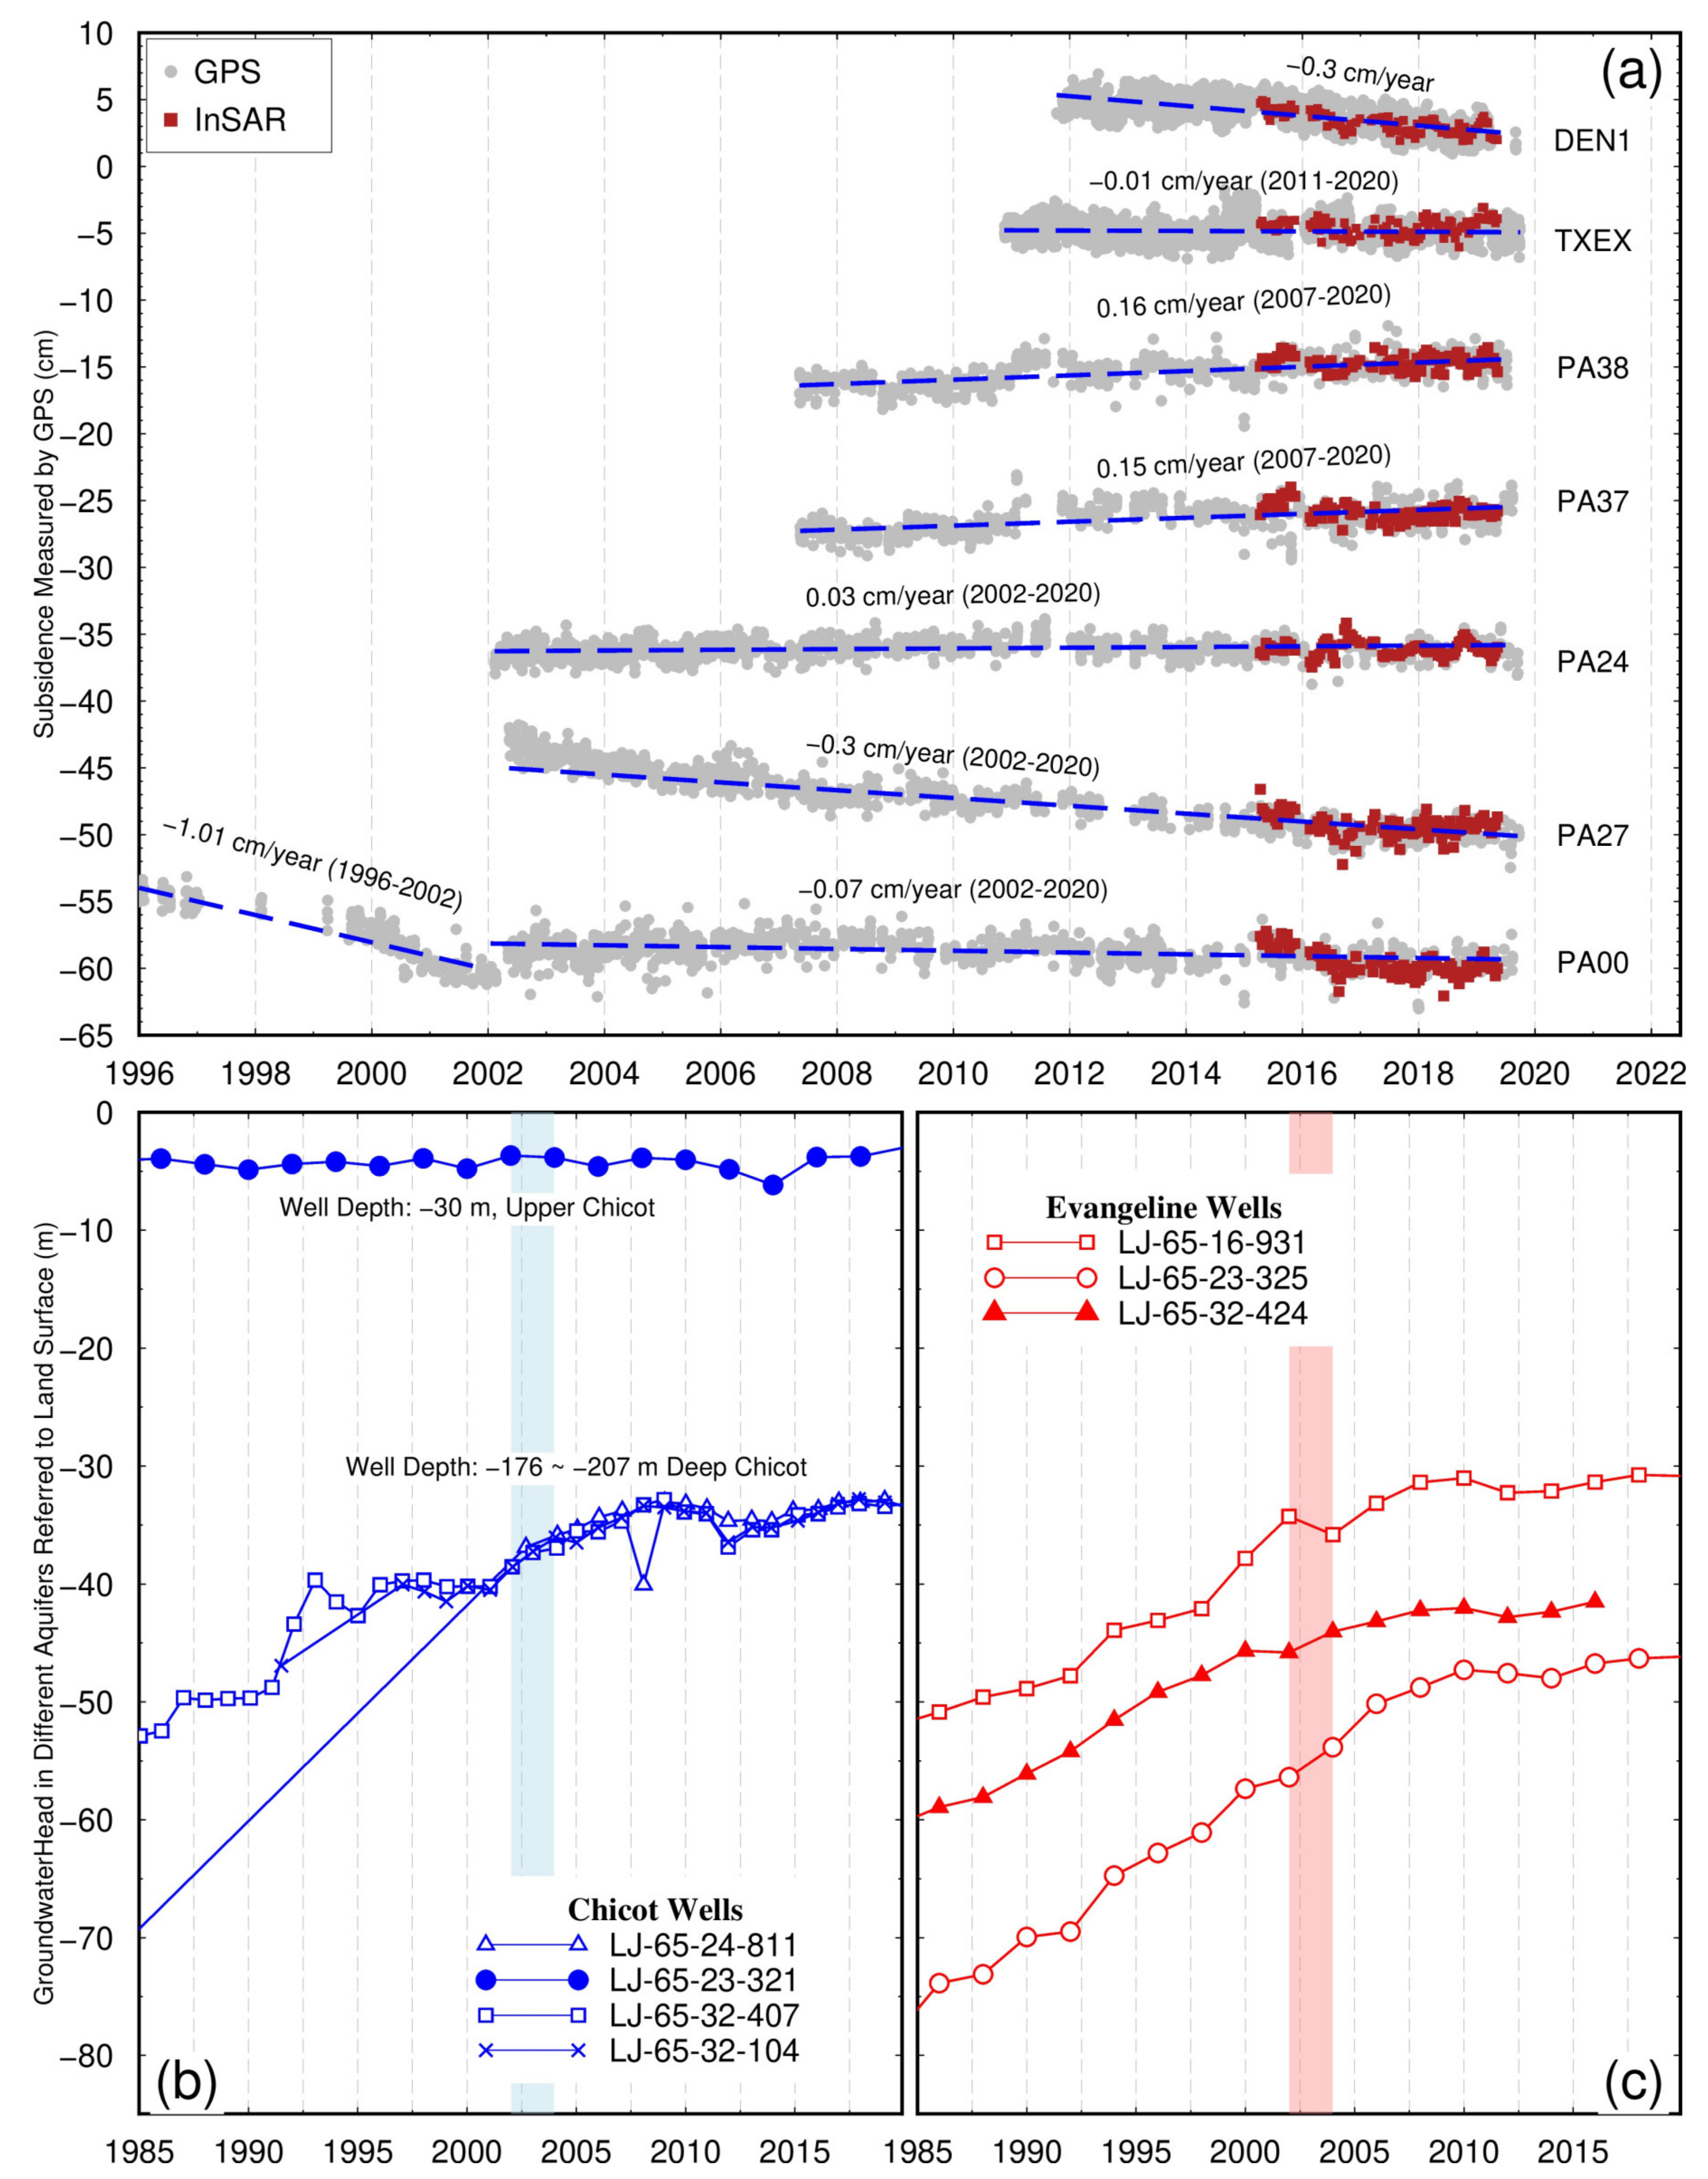
Figure 10a illustrates the long-term subsidence time series derived from GPS and GInSAR in southeastern Houston, where subsidence has ceased since the 2000s [11]. Overall, the GInSAR- and GPS-derived vertical displacement time series agree very well. Several sites (PA24, PA37, PA38) indicate minor ongoing land rebound (~2 mm/year). Figure 10b and Figure 10c depict the history of groundwater levels in the upper Chicot, lower Chicot, and Evangeline aquifers. The locations of these GPS and groundwater-well sites are marked in Figure 8. The groundwater level in the upper Chicot aquifer has been stable over its entire history. The groundwater levels in the lower Chicot and Evangeline aquifers have been rising since the middle 1980s. The HGSD started to regulate groundwater withdrawals in the eastern area when it was created in 1976. In general, the groundwater levels in the lower Chicot and Evangeline aquifers reached a new preconsolidation head in the 2000s [39]. Subsequently, subsidence has ceased in the eastern portion since the 2000s and minor land rebound (~2 mm/year) has been recorded by GPS and InSAR. In summary, GInSAR-derived displacement time series spanning over five years are able to detect minor subsidence and uplift at a couple of millimeters per year level.

3.2. Inter-Annual Subsidence

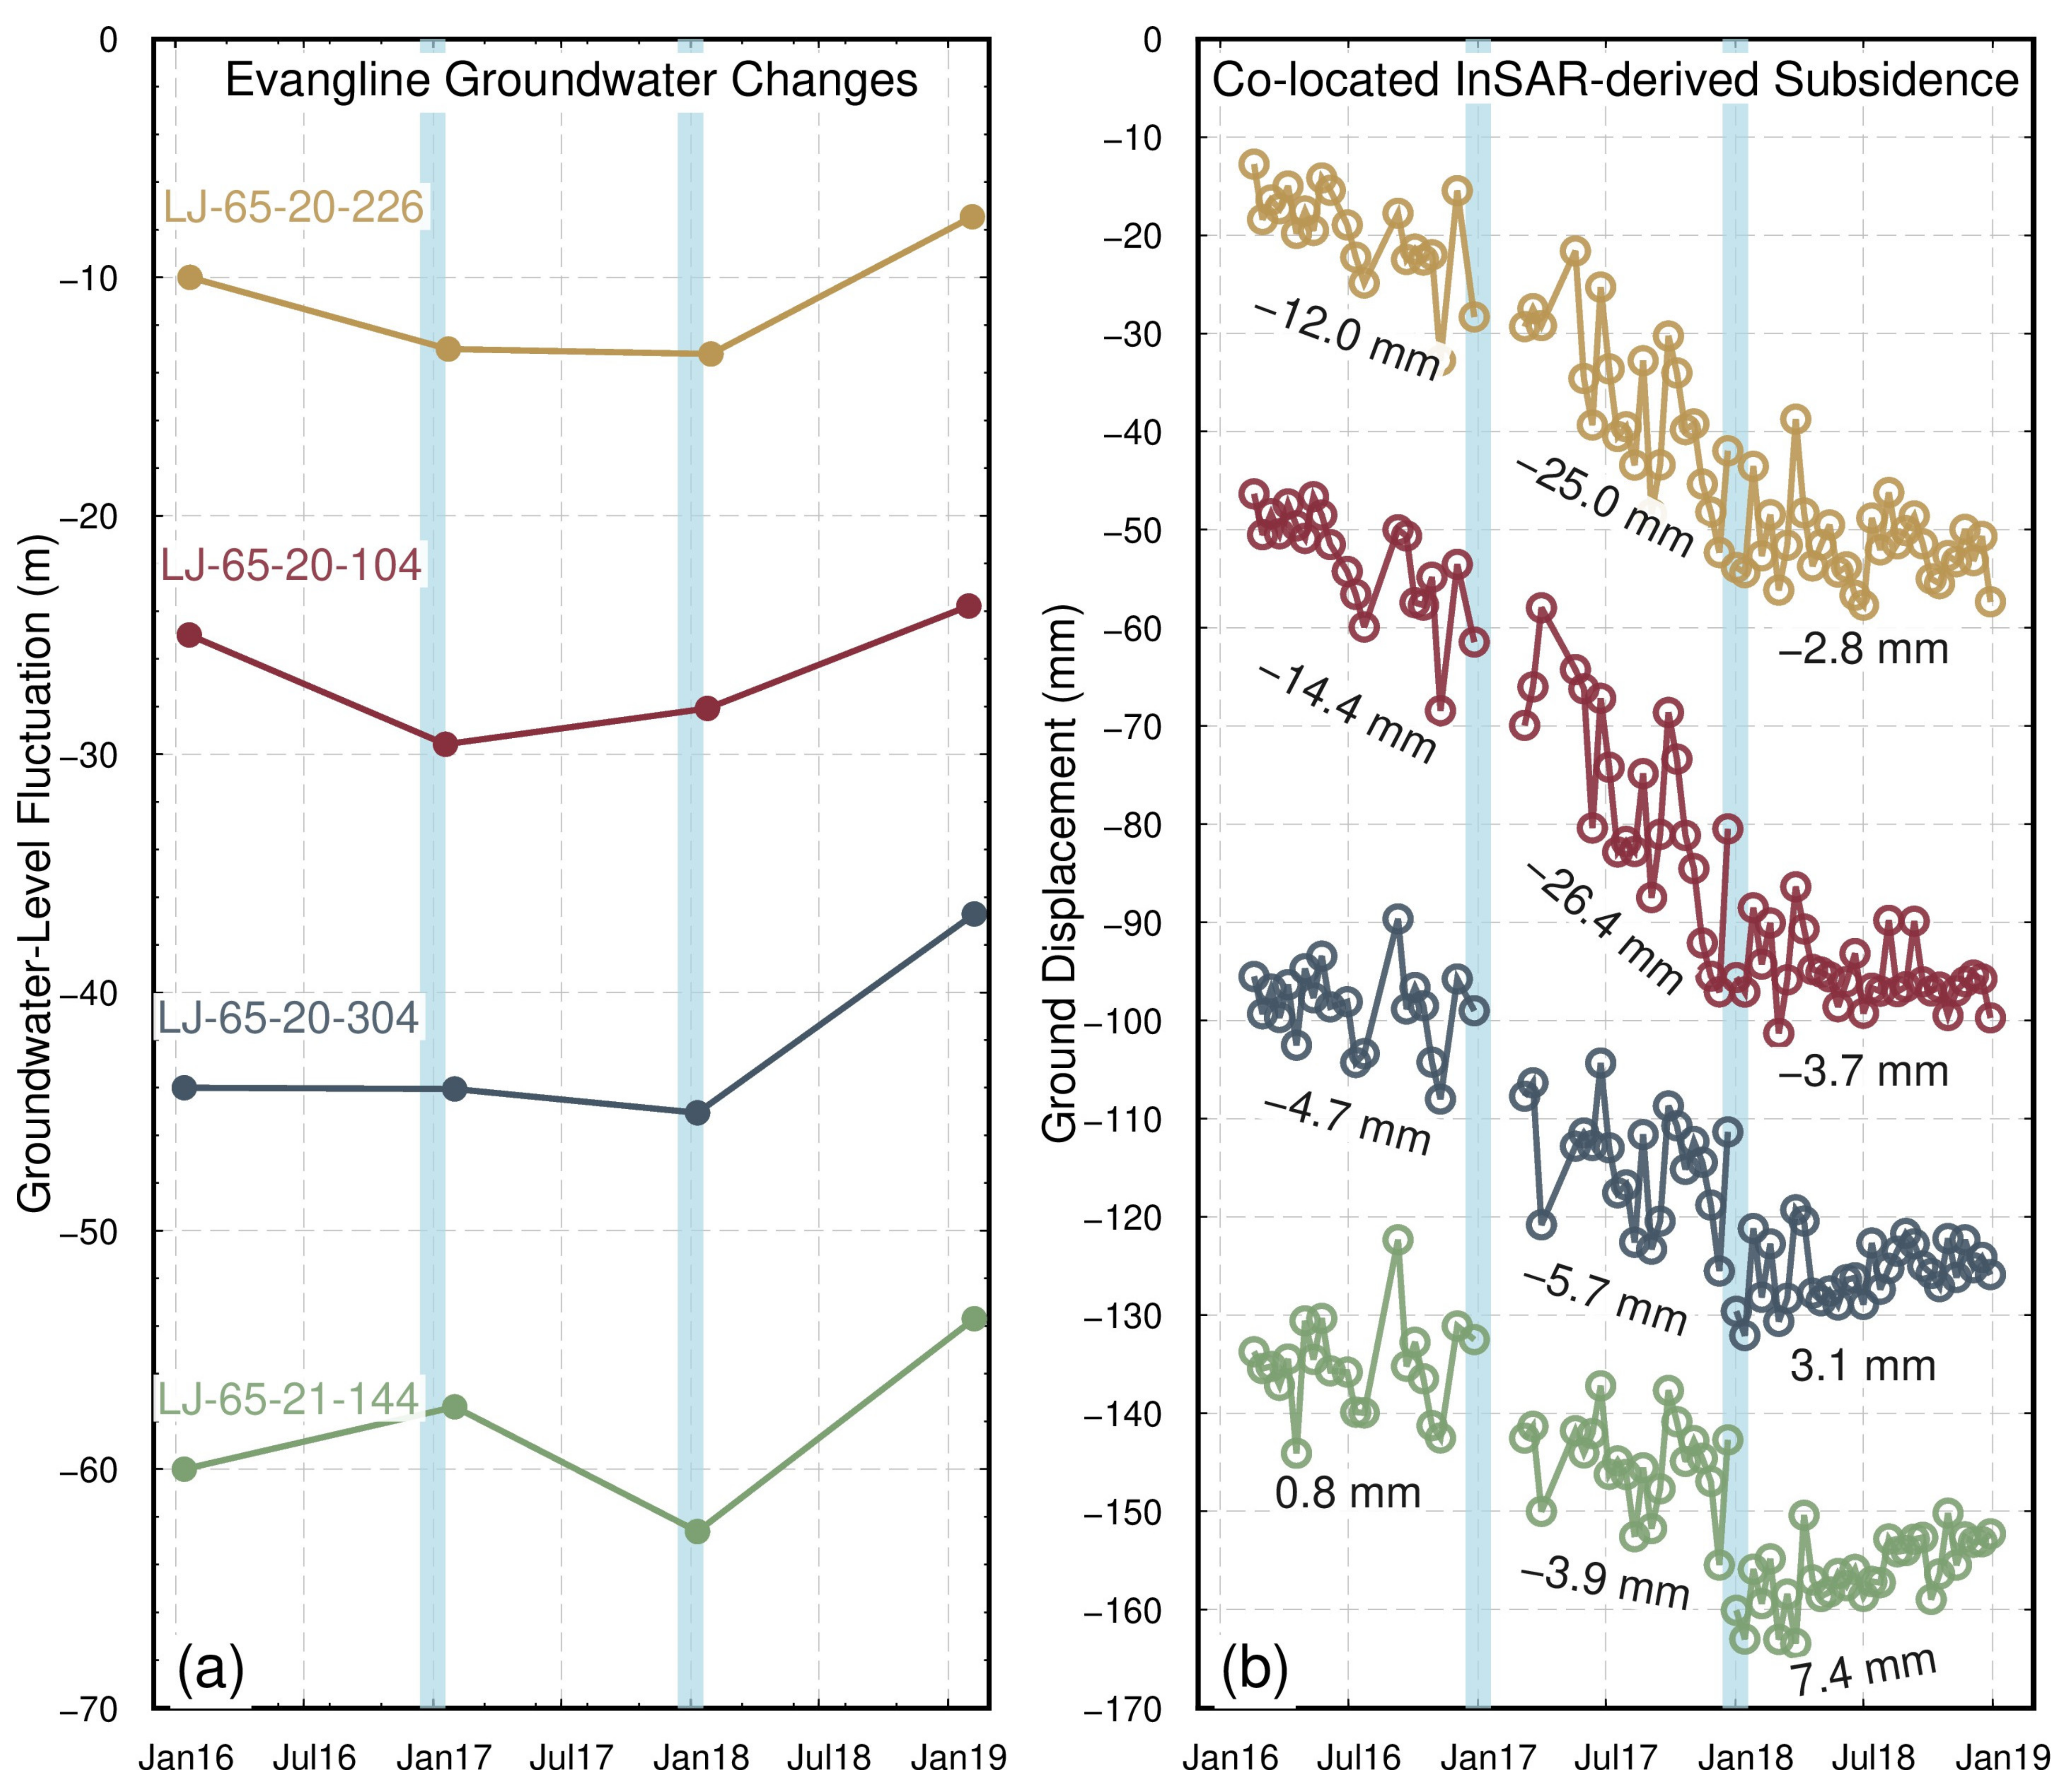
The rate of land subsidence varies over time depending on the level and change of the hydraulic head in the primary aquifer. Subsidence will be dominated by the inelastic compaction of clays (aquitards) when the hydraulic head is below the regional new preconsolidation head [39]. Figure 11 depicts the GInSAR-derived annual cumulative subsidence across the study area in 2016, 2017, and 2018. It appears that the rapidly subsiding areas are limited to western Harris County for all three years, and there is a clear trend that the rapid subsidence (>10 mm/year) is propagating to the further northern and western areas over the years. Furthermore, the spatial patterns of the rapid subsidence vary remarkably year by year. The year 2018 shows a broader subsidence area but with smaller magnitudes. The maximum subsidence was around 10 mm in 2018, but was over 20 mm in 2016 and 2017. To explore the reasons causing the year-by-year (inter-annual) variations of subsidence, we investigated the Evangeline hydraulic heads at four Evangeline well sites in southwestern Harris County (Figure 11). Figure 12 illustrates the relative hydraulic-head changes, and the ground elevation changes (subsidence) at these four well sites: LJ-65-20-226, LJ-65-20-104, LJ-65-20-304, and LJ-65-21-144. It is convincing that the annual subsidence closely corresponds to the annual change of the hydraulic head. The hydraulic head was elevated at all four sites in 2018. Consequently, the magnitude of subsidence reduced in 2018 compared to 2016 and 2017, and two sites even showed slight land rebounds.
The observations from Figure 11 and Figure 12 suggest that the GInSAR-derived subsidence time series are able to distinguish the inter-annual variance of subsidence at a level of a few millimeters, which provided important information on the inter-annual changes of the hydraulic heads in the primary aquifers. The long-term subsidence time series at two GPS sites (TXHS and SPBH) depicted in Figure 6 also indicate that the GInSAR technique has the ability to detect subsidence at a level of a few millimeters within a one-year or even shorter time window.

3.3. Seasonal Subsidence

Repeated seasonal ground movements, particularly heave and subsidence, could exert significant damage on roadways, parking lots, underground utility lines, and buried culverts, particularly on pavements with light weight and that extend over large areas. Accordingly, seasonal subsidence and heave have become a major research topic in geotechnical engineering. In general, two causes can contribute to the seasonal ground movements: the shrinking and swelling of shallow clay-rich soils, and the elastic deformation of aquifers below the groundwater table [40]. The former often involves shallow soils, while the latter is associated with the elastic deformation of unconsolidated deep sediments (specifically sand layers). The elastic deformation is caused by the fluctuations of the hydraulic heads within the primary aquifers. In general, large seasonal amplitudes correspond to large seasonal groundwater fluctuations; small amplitudes typically indicate relatively stable groundwater levels throughout the year. That is to say, the amplitude of seasonal subsidence and heave is an indicator of seasonal change in hydraulic heads and groundwater storage. Interferometric synthetic aperture radar has emerged as a remote sensing method providing high-resolution measures to constrain large-scale hydrogeologic models and improve groundwater storage estimates [41,42,43,44,45,46].

Seasonal Amplitude Variations

To evaluate the seasonal vertical surface deformation, the InSAR-derived vertical displacement time series for each year at each pixel (60-m by 60-m) is modeled by a combination of a linear trend and a single sinusoid that can be described as:
Y t = V t + A c o s 2 π t T + Y 0
where Y t is GInSAR-derived vertical displacement (mm); t is time in fractional years; V is the linear rate of displacement (mm/year); A is the seasonal amplitude (mm); T is the time corresponding to the maximum heave (in a fractional year, where T = 0 corresponds to Jan 1st), and Y 0 is a constant shift in the model (mm). We solve Equation 1 using least-squares minimization and then map A and V across the study area to investigate spatial patterns in the seasonal signal.
Figure 13 depicts the amplitudes ( A in Equation (1)) of seasonal ground deformation (subsidence and heave) across the greater Houston region during three consecutive years: 2016, 2017, and 2018. The maps reveal that the patterns of amplitudes vary considerably year by year. In general, the amplitudes are below 4 mm within over two-thirds of the study area, and over 10 mm within several rapidly subsiding (>20 mm/year) areas. It is a challenge to assess the spatial variations of the amplitudes in a quantitative way across the entire study area. Accordingly, we selected three typical sites for detailed investigations. Site 1 is located in the rapid subsidence areas (>10 mm/year). Site 2 is located in the moderate subsidence (~5 mm/year) areas. Site 3 is located in the minor subsidence or uplift (~ ±2 mm/year) areas. Detailed information on current hydraulic heads and new preconsolidation heads in these areas is addressed in [39]. We also selected a pair of groundwater wells adjacent to each site for assessing hydraulic heads in the Chicot and Evangeline aquifers.
Figure 14 depicts the time series of seasonal ground movements and hydraulic head variations in three years (2016, 2017, 2018) at three sites. Site 1 is located in Katy, in the western Houston area, where rapid subsidence (>10 mm/year) is ongoing, and the current hydraulic head (~−110 m) in the Evangeline aquifer is below the regional new preconsolidation head (~−90 m) [39]. Figure 14a indicates that the GInSAR-derived amplitudes respond well to the changes of hydraulic head in the Evangeline aquifer. In 2018, the amplitude of the ground movement was approximately 10 mm, and the amplitude of the groundwater level change was approximately 7 m, which resulted in a strain (land surface vertical displacement) to stress (hydraulic head change) ratio of 1:700. The land surface displacements and hydraulic head changes in 2016 and 2017 resulted in a similar strain-to-stress ratio. The estimate of the elastic strain-to-stress ratio in the Evangeline aquifer agrees with the estimate based on decadal GPS and extensometer observations in the western portion of the Houston region [40]. Site 2 is located in the southern border area of Harris County, adjacent to Fort Bend County, where the hydraulic heads (~−70 to −60 m) in the Evangeline aquifer are approaching the regional new preconsolidation head (~−60 m), and the ongoing subsidence is minor (~5 mm/year). Site 3 is located in the southeastern portion of the greater Houston region, where current hydraulic heads (~−30 m) are above the regional new preconsolidation head (~−40 m), and the inelastic compaction has ceased since the 1990s. The fluctuations of hydraulic heads in both the Chicot and Evangeline aquifers are minor in Site 3. The amplitude of seasonal ground displacement is below 5 mm, primarily resulted by the seasonal shrinking and swelling of shallow sediments.
In summary, the observations at these three sites indicate that the amplitudes of GInSAR-derived seasonal ground movements correspond well with the fluctuations of hydraulic head in the Evangeline aquifer. The elastic strain-to-stress ratios estimated from GInSAR are comparable to the ratios estimated from decadal extensometer measures [40]. In addition to the amplitude, Figure 14 illustrates a temporal agreement between the phase (timing) of seasonal surface displacement and the groundwater level change. The peak uplift mostly happened from April to June, corresponding to the annual maximum groundwater storage, whereas the peak subsidence mostly happened from August to October, corresponding to the annual minimum groundwater storage. Accordingly, GInSAR provides an indirect approach for assessing the seasonal fluctuations of the hydraulic heads with a higher temporal resolution that cannot be achieved by in situ measures.

4. Discussion

This paper presents a case study using Sentinel-1 data to study long-term (multi-year), short-term (inter-annual), and seasonal urban subsidence over the greater Houston region. The GInSAR-derived subsidence map identified several subsiding areas that were not recognized by previous GPS-based investigations. GInSAR has the potential to provide high-accuracy, high-resolution (in both time and space domains), and timely subsidence monitoring. The accuracy of InSAR measures and their potential for near-real-time monitoring have always been major concerns for practical users, such as the administrators at the City of Houston and HGSD.

4.1. Accuracy

Previous InSAR studies in the Houston region mainly focused on historical subsidence (before 2015), while this study focused on the most recent subsidence (2015–2019) and applied the GInSAR technique. Therefore, we did not try to compare the results from this study with the previous InSAR studies. A general understanding is that different software packages and different SAR datasets would result in similar estimates for subsidence rates spanning over multiple years (e.g., >3 years), but the accuracy (uncertainty or confidence interval) of the subsidence rates could be considerably different among different datasets and methods. The uncertainty issue has not been investigated in previous investigations.
This investigation has demonstrated that the GInSAR method has significantly improved the accuracy (repeatability) of the InSAR-derived displacements and, in turn, InSAR-derived velocities. After applying the GPS correction, the RMS of InSAR-derived LOS-displacements (detrended) has reduced by 70%. The GInSAR-derived subsidence rates within a five-year time window agree well with the GPS-derived subsidence rates. According to this study, the 95% CI of the GInSAR-derived subsidence rate is at a level of a couple of millimeters per year (~2 mm/year) for single-track Sentinel-1A data spanning over five years in the Houston region. If both Satellite-1A and 1B data along both ascending and descending tracks are used, the confidence interval could be even better. In general, the accuracy of GInSAR-derived subsidence rates would be poorer than the GPS-derived subsidence rates within a similar time span, but the difference would get smaller with the increase in the time span. This study suggests that the accuracy of the GInSAR results (displacements and velocities) ensures the precise tracking of subsidence rates, the modeling of seasonal subsidence and heave, and the identification of inter-annual variations of subsidence.

4.2. Near-Real-Time Monitoring

The revisit period of the Sentinel-1 satellites is 12 days. A single Sentinel-1 satellite will be able to map the entire world once every 12 days. The two-satellite constellation offers a 6-day repeat cycle. The ESA releases the Sentinel-1 Level-1 data products (e.g., Single Look Complex data) to the public within 24 h of being sensed by the satellite. The final satellite orbital data are available within 20 days after the data acquisition. The GPS data from the Houston GPS network are available to the public on the second day after raw data are archived at UNAVCO. The InSAR data processing is carried out on a high-performance computing (HPC) cluster at the University of Houston. The whole data process can be performed within a day after all data are available. With the benefit of free access to GPS data, Sentinel-1 data, and the supercomputing resource, we are able to update the GInSAR-derived results (velocity map, displacement time series) over the Houston region every three weeks. It is convincing that the methods demonstrated in this study can be applied to near-real-time subsidence monitoring, allowing land subsidence researchers and managers to track what has happened in the period among the latest few acquisitions. For example, during the prolonged drought season in the summer of 2022, urban managers certainly need to track the land surface deformation, as well as the hydraulic-head (groundwater storage) changes, with a week-to-month frequency rather than a yearly frequency.
The authors routinely process GPS data from the Houston GPS Network for ongoing subsidence monitoring. The Sentinel-1 data will be integrated into our automated subsidence monitoring system in the next step. Our ultimate goal is to develop a GPS- and InSAR-integrated, near-real-time (one-month lag), and automated subsidence monitoring system in the Houston region, which will greatly advance our capabilities to track ongoing subsidence and assess its risks in a timely manner.

5. Conclusions

We developed GPS- and Sentinel-1 InSAR-integrated techniques (GInSAR) to conduct long-term and short-term (inter-annual, seasonal) subsidence investigations in the greater Houston region. According to this study, the ongoing subsidence in the Houston region has expanded to western Austin County, northern Waller County, western Liberty County, and the Mont Belvieu area in Chambers County. The subsidence in these four counties has not yet been recognized because of the lack of ground-based measurements. The InSAR results also indicate that previous studies based on GPS observations overestimated the ongoing subsidence in the southwestern portion of Montgomery County, but underestimated the ongoing subsidence in the northeastern portion of the county. The InSAR results and groundwater level measurements indicate that both the long-term and short-term (inter-annual, seasonal) vertical ground deformation are primarily dominated by the hydraulic-head changes in the Evangeline aquifer. Interferometric synthetic aperture radar completes the sparse GPS and groundwater-level measures and provides insights into the hydraulic history with a higher resolution in both time and space domains. The GInSAR method bridges the two observational datasets, and provides continuous and precise subsidence monitoring over time and space. The key to the success of GInSAR is to use long-term GPS observations from the Houston GPS network to correct the InSAR-derived LOS displacements. The GInSAR-derived vertical ground deformation measures also provide dense and timely information on the fluctuations of hydraulic heads in the primary aquifers, which allows the precise estimation of volumetric changes in groundwater storage and would be important for improving groundwater resource management.
With the availability of GPS data, Sentinel-1 data, open-source software packages, and high-performance computing resources for both GPS and InSAR processing, the potential for precisely tracking ground surface deformation in near-real-time is rapidly growing. This study has demonstrated that the GInSAR technique can be employed for near-real-time land subsidence monitoring in the greater Houston region, with the potential of significantly improving our capabilities in managing ongoing subsidence and groundwater resources.

Author Contributions

Conceptualization, Y.L. and G.W.; methodology, Y.L., X.Y. and K.W.; data analysis, Y.L., X.Y. and K.W.; writing—Y.L. and G.W. All authors have read and agreed to the published version of the manuscript.

Funding

This research received no external funding.

Data Availability Statement

The Sentinel-1 data used in this study are available from the European Space Agency [47]. The InSAR data processing is based on the open software GMTSAR [27]. The groundwater level data are available from the USGS National Water Information System (NWIS) website [23]. Global Positioning System-derived subsidence time series are available to the public through the website of HGSD [25].

Acknowledgments

The authors would like to express their gratitude to the editors and three reviewers for their thoughtful comments.

Conflicts of Interest

The authors declare no conflict of interest.

References

  1. Census Bureau. Statistical Abstract of the United States; U.S. Government Printing Office: Washington, DC, USA, 2009; ISBN 9780160838859.
  2. Coplin, L.S.; Galloway, D. Houston-Galveston, Texas: Managing coastal subsidence. In Land Subsidence in the United States; Galloway, D., Jones, D.R., Ingebritsen, S.E., Eds.; U.S. Geological Survey: Reston, VA, USA, 1999; Volume 1182, pp. 35–48. [Google Scholar]
  3. Turco, M.J.; Petrov, A. Effects of groundwater regulation on aquifer-system compaction and subsidence in the Houston-Galveston Region, Texas, USA. Proc. Int. Assoc. Hydrol. Sci. 2015, 372, 511–514. [Google Scholar] [CrossRef] [Green Version]
  4. Kasmarek, M.C.; Gabrysch, R.K.; Johnson, M.R. Estimated Land-Surface Subsidence in Harris County, Texas, 1915–1917 to 2001; US Department of the Interior: Washington, DC, USA; US Geological Survey: Reston, VA, USA, 2009.
  5. Greuter, A.; Turco, M.J.; Petersen, C.M.; Wang, G. Impacts of Groundwater Withdrawal Regulation on Subsidence in Harris and Galveston Counties, Texas, 1978–2020. GeoGulf Trans. 2021, 71, 109–118. [Google Scholar]
  6. Kearns, T.J.; Wang, G.; Bao, Y.; Jiang, J.; Lee, D. Current Land Subsidence and Groundwater Level Changes in the Houston Metropolitan Area (2005–2012). J. Surv. Eng. 2015, 141, 05015002. [Google Scholar] [CrossRef]
  7. Baker, E.T., Jr. Stratigraphic and Hydrogeologic Framework of Part of the Coastal Plain of Texas; Texas Department of Water Resources: Austin, TX, USA, 1979; Volume 236, p. 43.
  8. Zhou, X.; Wang, G.; Wang, K.; Liu, H.; Lyu, H.; Turco, M.J. Rates of Natural Subsidence along the Texas Coast Derived from GPS and Tide Gauge Measurements (1904–2020). J. Surv. Eng. 2021, 147, 04021020. [Google Scholar] [CrossRef]
  9. Wang, G.; Welch, J.L.; Kearns, T.J.; Yang, L.; Serna, J., Jr. Introduction to GPS geodetic infrastructure for land subsidence monitoring in Houston, Texas, USA. Proc. Int. Assoc. Hydrol. Sci. 2015, 372, 297–303. [Google Scholar] [CrossRef] [Green Version]
  10. Wang, G.; Turco, M.; Soler, T.; Kearns, T.J.; Welch, J. Comparisons of OPUS and PPP Solutions for Subsidence Monitoring in the Greater Houston Area. J. Surv. Eng. 2017, 143, 5017005. [Google Scholar] [CrossRef]
  11. Wang, G.; Greuter, A.; Petersen, C.M.; Turco, M.J. Houston GNSS Network for Subsidence and Faulting Monitoring: Data Analysis Methods and Products. J. Surv. Eng. 2022, 148, 04022008. [Google Scholar] [CrossRef]
  12. Galloway, D.L.; Hudnut, K.W.; Ingebritsen, S.E.; Phillips, S.P.; Peltzer, G.; Rogez, F.; Rosen, P.A. Detection of aquifer system compaction and land subsidence using interferometric synthetic aperture radar, Antelope Valley, Mojave Desert, California. Water Resour. Res. 1998, 34, 2573–2585. [Google Scholar] [CrossRef]
  13. Amelung, F.; Galloway, D.; Bell, J.W.; Zebker, H.A.; Laczniak, R.J. Sensing the ups and downs of Las Vegas: InSAR reveals structural control of land subsidence and aquifer-system deformation. Geology 1999, 27, 483–486. [Google Scholar] [CrossRef]
  14. Chaussard, E.; Wdowinski, S.; Cabral-Cano, E.; Amelung, F. Land subsidence in central Mexico detected by ALOS InSAR time-series. Remote Sens. Environ. 2014, 140, 94–106. [Google Scholar] [CrossRef]
  15. Perissin, D.; Wang, T. Time-Series InSAR Applications Over Urban Areas in China. IEEE J. Sel. Top. Appl. Earth Obs. Remote Sens. 2010, 4, 92–100. [Google Scholar] [CrossRef]
  16. Buckley, S.M.; Rosen, P.A.; Hensley, S.; Tapley, B. Land subsidence in Houston, Texas, measured by radar interferometry and constrained by extensometers. J. Geophys. Res. Earth Surf. 2003, 108, 2542. [Google Scholar] [CrossRef]
  17. Bawden, G.W.; Johnson, M.R.; Kasmarek, M.C.; Brandt, J.T.; Middleton, C.S. Investigation of Land Subsidence in the Houston-Galveston Region of Texas by Using the Global Positioning System and In-terferometric Synthetic Aperture Radar, 1993–2000; US Geological Survey Scientific Investigations Report 2012-5211; U.S. Geological Survey: Reston, VA, USA, 2012.
  18. Khan, S.D.; Huang, Z.; Karacay, A. Study of ground subsidence in northwest Harris county using GPS, LiDAR, and InSAR techniques. Nat. Hazards 2014, 73, 1143–1173. [Google Scholar] [CrossRef]
  19. Qu, F.; Lu, Z.; Zhang, Q.; Bawden, G.W.; Kim, J.-W.; Zhao, C.; Qu, W. Mapping ground deformation over Houston–Galveston, Texas using multi-temporal InSAR. Remote Sens. Environ. 2015, 169, 290–306. [Google Scholar] [CrossRef]
  20. Khan, S.D.; Gadea, O.C.A.; Alvarado, A.T.; Tirmizi, O.A. Surface Deformation Analysis of the Houston Area Using Time Series Interferometry and Emerging Hot Spot Analysis. Remote Sens. 2022, 14, 3831. [Google Scholar] [CrossRef]
  21. Casu, F.; Buckley, S.; Manzo, M.; Pepe, A.; Lanari, R. Large scale InSAR deformation time series: Phoenix and Houston case studies. In Proceedings of the 2005 IEEE International Geoscience and Remote Sensing Symposium, Seoul, Republic of Korea, 29 July 2005; pp. 5240–5243. [Google Scholar] [CrossRef]
  22. Braun, C.L.; Ramage, J.K. Status of water-level altitudes and long-term water-level changes in the Chicot and Evangeline (undifferentiated) and Jasper aquifers, greater Houston area, Texas, 2021. In Scientific Investigations Report; U.S. Geological Survey: Reston, VA, USA, 2022. [Google Scholar] [CrossRef]
  23. USGS Groundwater Data for the Nation. Available online: https://waterdata.usgs.gov/nwis/gw (accessed on 3 December 2022).
  24. Agudelo, G.; Wang, G.; Liu, Y.; Bao, Y.; Turco, M.J. GPS geodetic infrastructure for subsidence and fault monitoring in Houston, Texas, USA. Proc. Int. Assoc. Hydrol. Sci. 2020, 382, 11–18. [Google Scholar] [CrossRef] [Green Version]
  25. Harris-Galveston Subsidence District. Available online: https://hgsubsidence.org (accessed on 3 December 2022).
  26. Wang, G. The 95% Confidence Interval for GNSS-Derived Site Velocities. J. Surv. Eng. 2022, 148, 04021030. [Google Scholar] [CrossRef]
  27. Sandwell, D.T.; Mellors, R.J.; Tong, X.; Wei, M.; Wessel, P. Open radar interferometry software for mapping surface Deformation. Eos 2011, 92, 234. [Google Scholar] [CrossRef] [Green Version]
  28. Farr, T.G.; Rosen, P.A.; Caro, E.; Crippen, R.; Duren, R.; Hensley, S.; Kobrick, M.; Paller, M.; Rodriguez, E.; Roth, L.; et al. The Shuttle Radar Topography Mission. Rev. Geophys. 2007, 45, RG2004. [Google Scholar] [CrossRef]
  29. Sentinel1 Orbit State Vectors. Available online: https://s1qc.asf.alaska.edu/aux_poeorb/ (accessed on 17 October 2022).
  30. Chen, C.W.; Zebker, H.A. Phase unwrapping for large SAR interferograms: Statistical segmentation and generalized network models. IEEE Trans. Geosci. Remote Sens. 2002, 40, 1709–1719. [Google Scholar] [CrossRef] [Green Version]
  31. Hanssen, R.F. Radar Interferometry: Data Interpretation and Error Analysis; Springer Science & Business Media: New York, NY, USA, 2001; ISBN 9780792369455. [Google Scholar]
  32. Zebker, H.A.; Rosen, P.A.; Hensley, S. Atmospheric effects in interferometric synthetic aperture radar surface deformation and topographic maps. J. Geophys. Res. Solid Earth 1997, 102, 7547–7563. [Google Scholar] [CrossRef]
  33. Neely, W.R.; Borsa, A.A.; Silverii, F. GInSAR: A cGPS Correction for Enhanced InSAR Time Series. IEEE Trans. Geosci. Remote Sens. 2019, 58, 136–146. [Google Scholar] [CrossRef]
  34. Wessel, P.; Luis, J.F.; Uieda, L.; Scharroo, R.; Wobbe, F.; Smith, W.H.F.; Tian, D. The Generic Mapping Tools Version 6. Geochem. Geophys. Geosystems 2019, 20, 5556–5564. [Google Scholar] [CrossRef] [Green Version]
  35. Berardino, P.; Fornaro, G.; Lanari, R.; Sansosti, E. A new algorithm for surface deformation monitoring based on small baseline differential SAR interferograms. IEEE Trans. Geosci. Remote. Sens. 2002, 40, 2375–2383. [Google Scholar] [CrossRef] [Green Version]
  36. Fuhrmann, T.; Garthwaite, M.C. Resolving Three-Dimensional Surface Motion with InSAR: Constraints from Multi-Geometry Data Fusion. Remote Sens. 2019, 11, 241. [Google Scholar] [CrossRef] [Green Version]
  37. Wang, K.; Wang, G.; Cornelison, B.; Liu, H.; Bao, Y. Land subsidence and aquifer compaction in Montgomery County, Texas, U.S.: 2000–2020. Geoenvironmental Disasters 2021, 8, 1–24. [Google Scholar] [CrossRef]
  38. Liu, Y.; Sun, X.; Wang, G.; Turco, M.J.; Agudelo, G.; Bao, Y.; Zhao, R.; Shen, S. Current Activity of the Long Point Fault in Houston, Texas Constrained by Continuous GPS Measurements (2013–2018). Remote Sens. 2019, 11, 1213. [Google Scholar] [CrossRef] [Green Version]
  39. Wang, G. New Preconsolidation Heads Following the Long-Term Hydraulic-Head Decline and Recovery in Houston, Texas. Ground Water 2022. online ahead of print. [Google Scholar] [CrossRef]
  40. Wang, G. Seasonal Subsidence and Heave Recorded by Borehole Extensometers in Houston. J. Surv. Eng. 2022, 149, 1. [Google Scholar] [CrossRef]
  41. Lu, Z.; Danskin, W.R. InSAR analysis of natural recharge to define structure of a ground-water basin, San Bernardino, California. Geophys. Res. Lett. 2001, 28, 2661–2664. [Google Scholar] [CrossRef] [Green Version]
  42. Reeves, J.A.; Knight, R.; Zebker, H.A.; Schreüder, W.A.; Agram, P.S.; Lauknes, T.R. High quality InSAR data linked to seasonal change in hydraulic head for an agricultural area in the San Luis Valley, Colorado. Water Resour. Res. 2011, 47, W12510. [Google Scholar] [CrossRef] [Green Version]
  43. Miller, M.M.; Shirzaei, M.; Argus, D. Aquifer Mechanical Properties and Decelerated Compaction in Tucson, Arizona. J. Geophys. Res. Solid Earth 2017, 122, 8402–8416. [Google Scholar] [CrossRef]
  44. Hu, X.; Lu, Z.; Wang, T. Characterization of Hydrogeological Properties in Salt Lake Valley, Utah, using InSAR. J. Geophys. Res. Earth Surf. 2018, 123, 1257–1271. [Google Scholar] [CrossRef] [Green Version]
  45. Peng, M.; Lu, Z.; Zhao, C.; Motagh, M.; Bai, L.; Conway, B.D.; Chen, H. Mapping land subsidence and aquifer system properties of the Willcox Basin, Arizona, from InSAR observations and independent component analysis. Remote Sens. Environ. 2022, 271, 112894. [Google Scholar] [CrossRef]
  46. Qu, F.; Lu, Z.; Kim, J.-W.; Zheng, W. Identify and Monitor Growth Faulting Using InSAR over Northern Greater Houston, Texas, USA. Remote Sens. 2019, 11, 1498. [Google Scholar] [CrossRef]
  47. ESA Copernicus Open Access Hub. Available online: https://scihub.copernicus.eu/dhus/#/home (accessed on 3 December 2022).
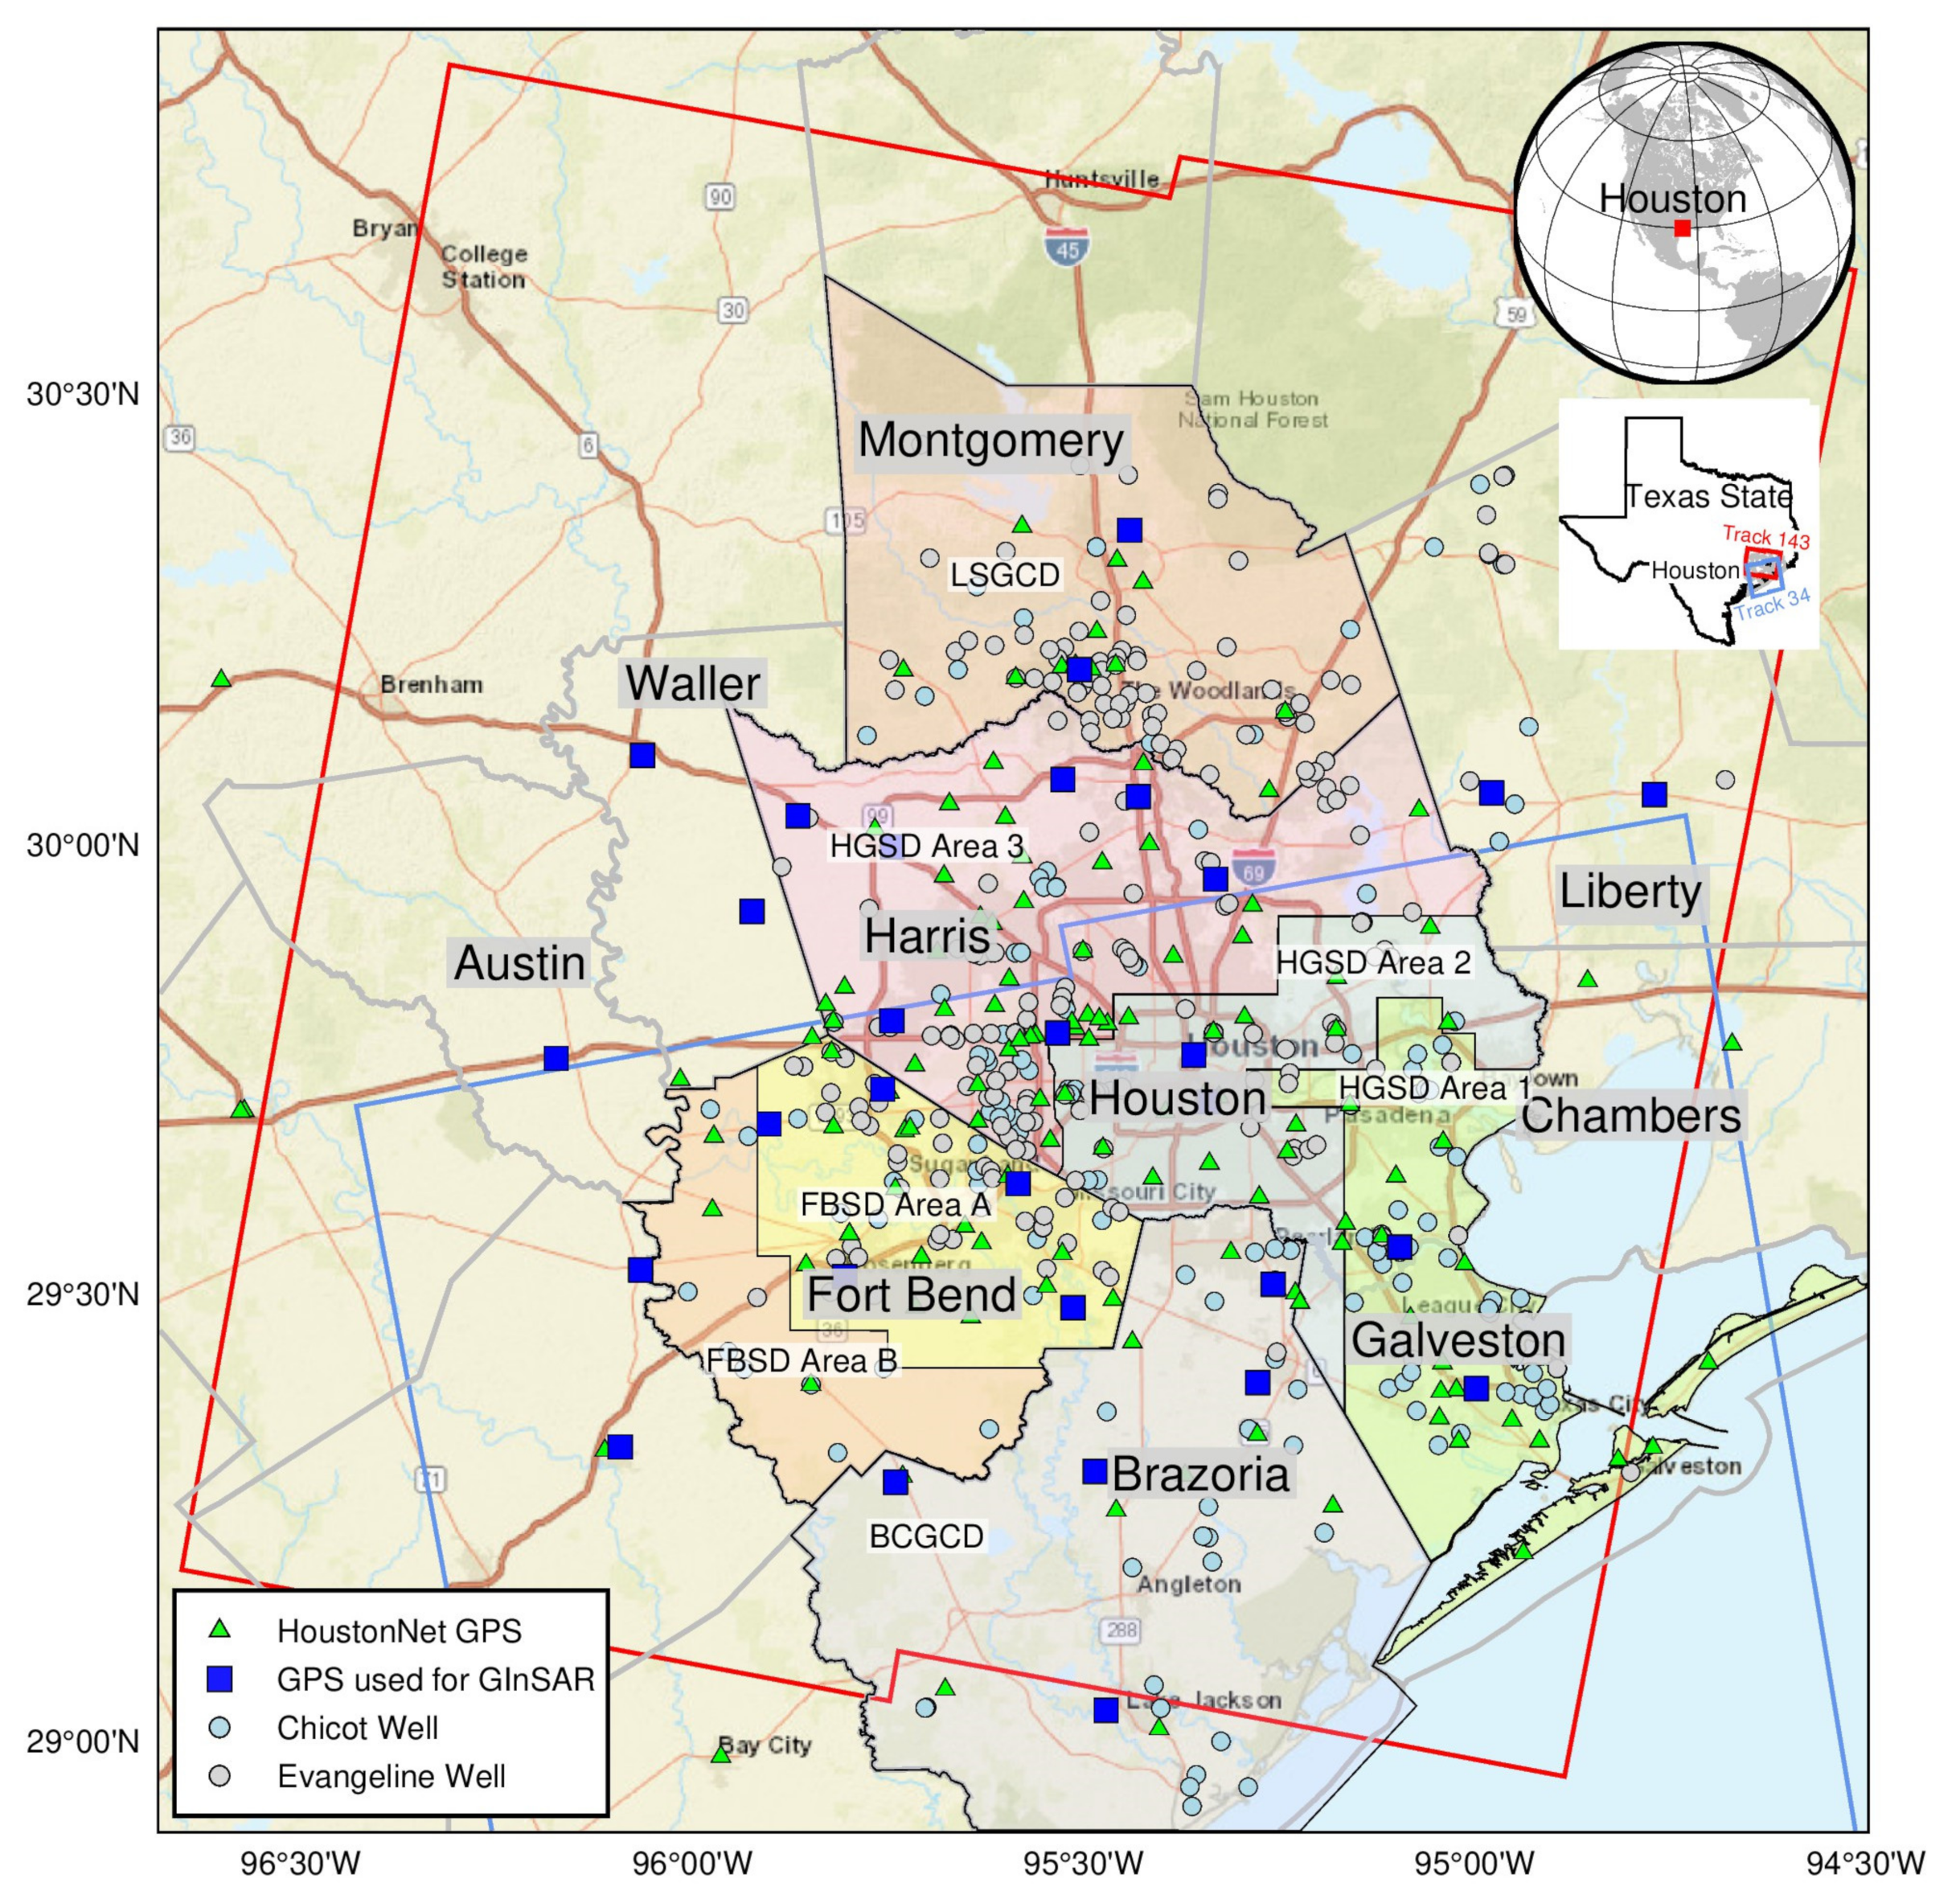
Figure 1. Map depicting GPS stations and groundwater wells within the greater Houston region, Texas. The inset shows two Sentinel-1A/B tracks (descending Track143 and ascending Track 34) covering the study area.
Remotesensing 14 06184 g001
Figure 2. Land surface deformation rate in the line-of-sight (LOS) direction (LOS-velocity, mm/year) derived from the Sentinel-1A data along two tracks. The negative values indicate ground surface moving away from the satellite (a) along the descending Track 143 (March 2015–October 2019); (b) along the ascending Track 34 (September 2016–December 2019).
Remotesensing 14 06184 g002
Figure 3. Interferograms before and after applying the GPS correction. (a) Uncorrected interferogram over the study area between Julian days 021 and 033, 2019 (interval: 12 days); (b) the residual model showing the differences between GPS- and InSAR-derived displacements during the period from days 021 to 033, 2019; (c) the corrected interferogram after removing the residual model (b).
Remotesensing 14 06184 g003
Figure 4. Comparisons of the LOS-displacements before and after applying the GPS corrections at two sites: (a) OKEK, (b) MRHK. The bottom subplots illustrate the detrended displacement time series. RMS represents the root-mean-square (RMS) of the detrended displacement time series. Locations of OKEK and MRHK are marked in Figure 2a.
Remotesensing 14 06184 g004
Figure 5. Comparisons of the GInSAR-derived LOS-displacements, the vertical displacements (UD: up-down), and GPS-derived vertical (UD) displacements. The UD displacements are aligned to Houston20. Locations of OKEK and MRHK are marked in Figure 2a.
Remotesensing 14 06184 g005
Figure 6. Comparisons of the GPS-derived and GInSAR-derived displacement time series in the up-down (UD) direction at two sites: TXHS and SPBH. The locations of GPS stations TXHS and SPBH are marked in Figure 2b.
Remotesensing 14 06184 g006
Figure 7. Histograms illustrating the differences of the GPS-derived and GInSAR-derived site velocities (rates) in the line-of-sight (LOS) direction. (a) Descending Track 143, 166 sites; (b) ascending Track 34, 135 sites. Locations of GPS sites are plotted in Figure 2.
Remotesensing 14 06184 g007
Figure 8. Comparisons of the GInSAR-derived land surface deformation rates in the up-down direction (UD) (mm/year; March 2015 to October 2019) and GPS-derived subsidence-rate contours (mm/year, January 2015 to December 2019).
Remotesensing 14 06184 g008
Figure 9. (a) Global Positioning System-derived three-component (NS: north-south, EW: east-west, UD: up-down) displacement time series at site PA50, with respect to the stable Houston reference frame 2020 (Houston20). (b) The horizontal trajectory (2007–2022) of the GPS antenna at PA50. (c) A comparison of GPS- and GInSAR-derived subsidence time series in the Mont Belvieu area, Chambers County. Locations of PA50 and Mont Belvieu are marked in Figure 8.
Remotesensing 14 06184 g009
Figure 10. GPS- and GInSAR-derived land subsidence time series and groundwater-level histories in the eastern Houston region.
Remotesensing 14 06184 g010
Figure 11. Annual vertical displacements over the greater Houston region in three consecutive years: (a) 2016, (b) 2017, (c) 2018.
Remotesensing 14 06184 g011
Figure 12. (a) The Evangeline groundwater level changes at four well sites during a 3-year period from January 2016 to December 2019; (b) GInSAR-derived vertical land surface displacement time series at well sites shown in (a). The locations of Evangeline wells are marked in Figure 11.
Remotesensing 14 06184 g012
Figure 13. Maps showing the amplitudes of GInSAR-derived seasonal subsidence and heave in three consecutive years: (a) 2016, (b) 2017, and (c) 2018.
Remotesensing 14 06184 g013
Figure 14. Comparisons of the fluctuations of hydraulic heads (Chicot and Evangeline) and GInSAR-derived seasonal subsidence and heave in three consecutive years (2016, 2017, and 2018) at three locations (a) Site 1, (b) Site 2, and (c) Site 3. The locations of Sites 1, 2, and 3, and six wells are marked in Figure 13.
Remotesensing 14 06184 g014
Publisher’s Note: MDPI stays neutral with regard to jurisdictional claims in published maps and institutional affiliations.