Abstract
During the last two decades, the Etna volcano has undergone several sequences of lava fountaining (LF) events that have had a major impact on road conditions, infrastructure and the local population. In this paper, we consider the LF episodes occurring between 2011 and 2022, calculating their erupted volumes using the images recorded by the monitoring thermal cameras and applying a manual procedure and a dedicated software to determine the lava fountain height over time, which is necessary to obtain the erupted volume. The comparison between the results indicates the two procedures match quite well, the main differences occurring when the visibility is poor and data are interpolated. With the aim of providing insights for hazard assessment, we have fitted some probabilistic models of both the LF inter-event times and the erupted volumes of pyroclastic material. In more detail, we have tested power-law distributions against log-normal, Weibull, generalised Pareto and log-logistic. Results show that the power-law distribution is the most likely among the alternatives. This implies the lack of characteristic scales for both the inter-event time and the pyroclastic volume, which means that we have no indication as to when a new episode of LF will occur and/or how much material will be erupted. What we can reasonably say is only that short inter-event times are more frequent than long inter-event times, and that LF characterised by small volumes are more frequent than LF with high volumes. However, if the hypothesis that magma accumulates on Etna at a rate of about 0.8 holds, the material accumulated in the source region from the beginning of the observation period (2011) to the present (2022) has already been ejected. In simple terms, there is no accumulated magma in the shallow storage that is prone to be erupted in the near future.
1. Introduction
Mt. Etna is one of the best monitored volcanoes in the world, and its eruptions have been almost continuously recorded for 3500 years [1,2,3,4,5]. However, the systematic quantification of its output is more recent, and the first attempt to estimate the volumes erupted during Etna’s effusive activity over time was probably the work carried out by Wadge et al. [1] and followed by Wadge and Guest [6]. Taking into account the decade 1971–1981, [6] assessed that the average output rate of Etna was ~0.70 m3 s−1, compared to 0.68 m3 s−1 for the period 1971–1974 [1]. These values have been obtained considering mostly flank eruptions, normally more voluminous and easier to quantify than the almost persistent and volumetrically less important eruptive activity occurring at the summit craters. No systematic quantification of the explosive activity was given at that time, except for a few cases considering the volume of cinder cones built up by the proximal accumulation of spatter [7,8]. Taking account of all these uncertainties, [6] used this average output to predict that a flank eruption was expected before May 1982 ± 3 months, and that the volume erupted by then would have been ~ 25 ± 6 × 10⁶ m3. It is worth noting here that the last eruption considered in the list of [6] was the flank eruption of 17–20 March 1981, which erupted ~20 × 106 m3 of lava. The next eruption occurred on 28 March 1983 and erupted a lava volume of 80–100 × 106 m3 [9,10,11], about twice what was predicted with the rate estimated by [6]. This holds even when considering the longer lapse of time and thus the greater magma accumulation within the source region (~50 × 106 m3). However, even accounting for these limits, the idea of [6] to compute the erupted volume of Etna’s activity in order to analyze the pattern and estimate its next output was followed also by Harris et al. [12], who integrated the existing dataset with 656 satellite-derived time-averaged discharge rate (TADR) values [13] and extended the database to 2010, obtaining an average output rate of ~0.8 m3 s−1 for the three decades spanning between 1980 and 2010. A change in the eruptive style was detected following the 2001 eruption on the basis of the volumetric properties [12]. This consisted in the period 1983–1993 being characterised by less frequent but longer-duration effusive eruptions at lower TADRs, whereas the period 2000–2010 saw more frequent effusive eruptions of shorter duration and higher TADRs. Another important difference that Harris et al. [12] revealed was the average volume erupted during each eruption, which between 1983 and 1993 was twice higher than those for eruptions between 2000 and 2010. This change began with the activity of 2001, suggesting that this year marked a change in the style of effusion, as already explored by other studies that pointed out the increased explosivity of this phase [14,15,16,17]. Harris et al. [12] concluded that the output rate at Etna is controlled by the supply from the deep system and cannot be changed by processes occurring in the shallow system. On the contrary, shallow system processes can modify the way in which the flux of magma is erupted. Thus, to change Etna’s output rate, some profound change must occur in the deep system. Bonaccorso and Calvari [18], based on these previous studies, considered the contribution of both explosive and effusive activity to the volumetric output rate. Using the estimated volumes of pyroclastic material erupted during the lava fountain episodes between 2011 and 2013 [19,20,21] compared with the output rate of effusive eruptions [12], they found that the pause in eruptive activity allows the accumulation of magma within the feeding system. The longer the pause, the greater the amount of magma accumulated, with an average of ~25 × 106 m3 magma entering the supply system every year (or 0.8 m3 s−1). The equilibrium between output and input can then be restored either by a large number of explosive lava fountain events, each releasing on average ~2.5 × 10⁶ m3 of magma, or with a small number of effusive eruptions, each releasing ~50 × 106 m3 magma on average. In this framework, the lava fountain episodes do not herald a major effusive eruption. They are instead a different means for the volcano to restore equilibrium between input and output. In order to keep monitoring the state of the volcano and update its release of magma, we have computed all volumes for the lava fountains that occurred between 2011 and 2022 [19,20,21] and have integrated this large dataset with the volumes from effusive eruptions taking place between 2008 and 2022 using all available estimates. The result of this analysis is the topic of this paper, and we used it for hazard assessment.
2. Methods
This section is organised into two subsections. In Section 2.1, we provide a description of the methods adopted to obtain the dataset, while in Section 2.2 we describe the motivations and the basics of the mathematical approaches applied to model the observed trend.
2.1. Data Set Acquisition
The data set considered in this paper consists of lava fountaining (LF) episodes recorded at Mt Etna during the interval from 1 January 2011 to July 2022 (see Supplementary Material, Table S1) by using the INGV-OE (Istituto Nazionale di Geofisica e Vulcanologia—Osservatorio Etneo) thermal camera network. Thermal images have been processed both manually following the routine described by Calvari et al. [19,22] and with the help of a software tool described in Calvari and Nunnari [23]. The manual routine consists of selecting from the thermal videos a thermal image at steps of 1 min and measuring the height of the saturated portion of the thermal image, which represents the height of the lava fountain. The automated routine described in detail in [23] does the same measurements by performing the following steps:
The RGB frames are extracted from the original film file (in avi format) and converted to grey images.
- From the grey images the information bars (reporting the colour bar and other information such as the camera name and time of the frame) are cropped.
- The cropped images in grey scale are binarised by using appropriate threshold levels. In these images, the hot areas will appear as white, while the remaining will appear black.
- Masking is applied to the binarised images to delimit the region of interest (ROI) areas. This will help filter undesired hot objects (e.g., previously ejected cooling matter).
- The obtained images are transformed into labelled images in order to extract some geometrical features. In particular, the software returns for each frame the LF area and the corresponding (x,y) centroid coordinates.
- The y-coordinate is considered as the mean LF height H, which allows to compute the volume of released pyroclastic material based on Equations (1) and (2) below.
- Furthermore, since each frame is associated with a time-mark, it is possible to estimate the start and end time of each LF episode by using a semi-automated algorithm based on approximating the LF by one or a series of Gaussian functions, with the help of a threshold criterion.
In more detail, the duration, LF mean height and LF maximum height are estimated (both manually and automated) from thermal images at a sampling rate of 1 min. In order to compute the volume of pyroclastic material, the fluid volume V (gas + pyroclastic material) erupted by the LF is firstly estimated by using the Equation (1):
where U is the mean fluid exit velocity at the vent (m s−1), is the vent section area (m2) and D is the duration of the LF in seconds.
In order to estimate U, the following Equation (2) is considered:
where g is the gravity acceleration and H the mean LF height (m). The vent surface area is calculated assuming a circular vent with a diameter of 30 m [19] and supposed to be constant. Finally, the volume of pyroclastic material is obtained from the total erupted volume V (gas + pyroclastic material) considering 0.18% as the ratio between the volumes of magma and volatiles within the eruptive column as typical for Etna’s fountains [22]. The TADR of pyroclasts is simply computed as
where is expressed in m3 and D is the duration in seconds.
For the effusive activity occurring from flank eruptive fissures or in association with the LF episodes (see Supplementary Material, Table S2), we have used all estimates available in literature or in the monitoring reports published weekly by INGV-OE (available at www.ct.ingv.it (accessed on 16 October 2022). To estimate the volume erupted during the Strombolian activity, often persisting for long periods at the summit craters, and provided that this activity was observed for more than a week and occurring at two or more of the four summit craters, we have used the average of 0.2 m3 s−1 obtained by Slatcher et al. [24]. This value was measured during a summit eruption displaying Strombolian activity and mild lava flows within one of the summit craters. Thus, we have used this estimation multiplied by the duration of the observed Strombolian activity to also take into account the volume erupted by summit Strombolian activity.
2.2. Methods for Modeling Some LF Features
In order to model the inter-event time and the volume of pyroclastic material of the recorded dataset, we follow the idea that a volcano behaves as a self-organised critical (SOC) system, a term used in physical statistics to refer to a class of non-equilibrium dynamic systems which are able to evolve in the absence of control or manipulation by an external agent [25,26]. SOC is a property of dynamic systems which have a critical point as an attractor. Their macroscopic behaviour displays both the spatial and temporal scale-invariance or self-similarity characteristics of the critical point at the phase transition, but without the need to tune control parameters to precise values. Without going into the vast literature existing in many application fields (spanning from geology, biology, astronomy, economy and many others), the concept of SOC was probably first applied in volcanology by Luongo et al. [27], who claimed that seismic and eruptive activities recorded at Vesuvius are self-similar, with no particular scale, even if within specific ranges of sizes. More recently, Cannavò and Nunnari [28], analysing data of eruptions available in the GVP (Global Volcanism Program) database, proposed the idea that the duration of eruptions seems to be described by a universal distribution which characterises eruption duration dynamics.
Since one of the features characterising SOC systems is that they exhibit scale invariance (i.e., the absence of a characteristic scale) both in time and space, we have considered the power-law distribution as a statistical model for LF features and evaluated its plausibility.
To improve the readability of the paper, we summarise some basic knowledge concerning the so-called power-law distribution. Indicating as x a generic variable that we are investigating, which for simplicity we assume continuous (but it can also be discrete, with some modification of the formulas), a continuous power-law distribution is described by a probability density function such that:
where X is the observed value of x, C is a normalisation constant and α is the power-law exponent. Since this density diverges as , Equation (4) cannot hold for any , it is therefore necessary to introduce some lower bound for x, indicated here as . This explains why a power-law density for a continuous variable x is written as:
In many cases, when dealing with power-law, it is useful to consider the complementary cumulative distribution function (CCDF), which is expressed as:
One of the main consequences for a system characterised by a power-law distribution is the so-called scale invariance; indeed, the following relation holds:
That is, scaling by a constant simply multiplies the original power-law relation by the constant. Scale invariance can be interpreted as saying that there is not a typical size of the phenomena under investigation.
In order to fit a power-law distribution for a given variable x, the parameter and the lower bound need to be estimated. This problem can easily be solved by using almost standard approaches, as described in [29], that we follow in this paper. In particular, it has been demonstrated that assuming to be known, a maximum likelihood estimation (MLEs) of the scaling parameter α, for the continuous case can be expressed in closed form as
where are the observed values such that . Furthermore, it is known that the standard error for can be computed as
where the high-order term is positive [29]. However, prior to using expression (8), it is required to estimate . In principle, the choice for can be performed by simply plotting the empirical CCDF of the dataset on a log-log scale and seeing when the distribution becomes roughly straight. However, since this approach is subjective, often the choice is performed by using numerical algorithms which choose according to the following equation:
where is the the CDF of the data with value at least , and is the CDF for the power-law model that best fits the data in the same region. The estimation is the value of, which minimises Equation (10), where is referred to as the Kolmogorov-Smirnov (KS) distance.
After having fitted a power-law model, which is almost always possible, regardless of the assigned dataset, the designer is generally asked to answer two questions:
- Is the power-law model a plausible choice?
- If yes, is it the best choice that could be made or are there different models that are equally valid or even better?
The answer to these questions is not always so straightforward. However, it is normally performed by calculating appropriate goodness of fit indices.
Referring to question (1), in [29] it is suggested to compute the so-called p-value, a term that indicates a plausibility index. The basic strategy for calculating the p-value consists of generating synthetic datasets using a practice, very common in statistics, which is generically indicated with the term bootstrap, based on computing for each synthetic data set the Kolmogorov-Smirnov (KS) . Without elaborating here, we simply report that if p is large, then any difference between the data and the model can be explained with statistical fluctuation. Instead, if 0 then the model does not provide a plausible fit for the data. To this end, a common practice is to discard the power-law model if ; otherwise it is considered plausible, a term that however does not mean that this is the best choice.
To deal with question 2, the designer can test the power-law model against alternative distributions. Despite the fact that there are an unlimited number of alternative distributions, only a few are usually given as valid alternatives to a power-law. In this paper, we have chosen the following: log-normal, Weibull, generalised Pareto and log-logistics. In particular, the latter has been found suitable to fit inter-event times of volcanic eruptions [30,31]. For completeness, we report the equations of these alternative distributions in Equations from (11) to (14) in the order they are mentioned above.
Dealing with these alternative distributions, it must be stressed that to fit their model parameters, it is not required to compute an value, as instead is done for the power-law model. Therefore, in this paper, we have considered the whole dataset. However, to make the comparison consistent with the power-law model, we have evaluated the performances on the region .
Among various performance indices to compare the probabilistic models proposed, in this paper, we have chosen the negative log likelihood, which is defined as in Equation (15):
where is the partial density function (PDF) of the candidate distribution model j, considered for fitting a given dataset . This choice was motivated because this index is usually taken as the cost function to be minimised during the search for the best model parameters and it is easy to compute. Lowest values of are best.
As regards the software for fitting the power-law distributions, we have adapted routines coded in Matlab by Aaron Clauset and freely available from https://aaronclauset.github.io/powerlaws/ (accessed on 16 October 2022), while the fitting of the alternative distributions was based on the fitdist function of the Matlab Statistics and Machine Learning Toolbox [32], to which the reader can also refer in order to understand the meaning of the parameters reported in Equations from (11) to (14).
3. Results
The results reported in this work have three main aspects. Firstly, we report in the Supplementary Material, Table S1 the LF activity recorded on Etna during the decade from 2011 to 2022, resulting from both an accurate manual and computer aided processing of the cameras thermal images. Secondly, we report in the Supplementary Material, Table S2 the results of the effusive (lava flow) activity during summit and lateral or flank eruptions, in the decade from 2011 to 2022, resulting from an accurate study of available literature and reports. Thirdly, we report the results of the statistical modeling of two features that can be extracted from Table S1, namely the inter-event time between the LFs, and the volumes of pyroclastic material.
3.1. Estimation of the LF Pyroclastic Material
During the time interval between 1 January 2011 and 10 October 2022, 116 LF episodes were recorded at the Etna volcano. A summary of relevant features is reported in the Supplementary Material, Table S1, including the starting and ending time (in UTC), the duration (in minutes), the mean and maximum altitude of the LF portion of the eruptive column (in meters), the volume of pyroclastic material (in 106 m3) and the time averaged discharge rate (TADR, in m3 s−1).
To simplify the reading of Table S1, we report in Figure 1 some graphs that compare the LF features obtained with the manual and automated routines, i.e., estimated by using the software tool.
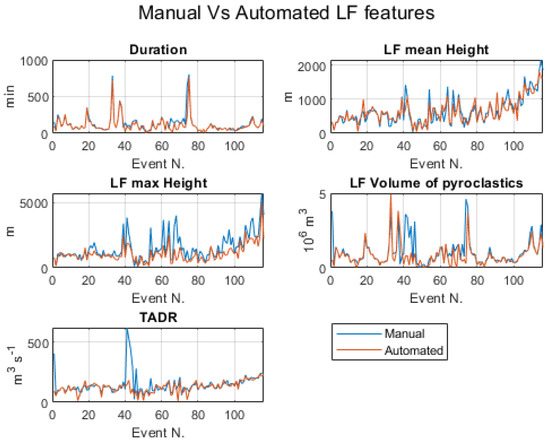
Figure 1.
Comparison between the manually and automated estimation of lava fountain features. The event N (in abscissa) is the same as the LF event number reported in column 1 of Table S1.
Using the two systems, manual and automatic, we obtain both comparable duration and mean altitude of the lava fountains, which are the basic features for estimating the volume of pyroclastic material erupted during the LF events. Occasionally, it is possible to observe some marked differences in the LF volume of pyroclastic material and TADR. This is usually related to episodes recorded in conditions of poor visibility, which requires interpolation due to the lack of data. In order to characterise the differences between manual and automated estimates, we have computed mean and standard deviation for each of the five features, shown in Figure 2. The numerical values are given in Table 1.
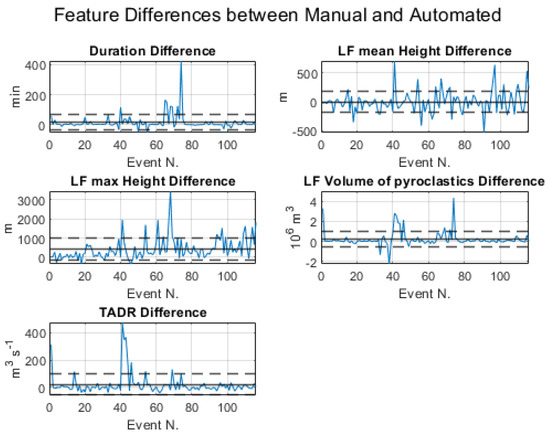
Figure 2.
Differences in duration, mean and maximum LF altitude, volume of pyroclastic material and TADR for each episode obtained by the manual and automated procedures. The solid horizontal lines in black represent the mean error, whereas the dashed horizontal lines indicate the standard deviation error.

Table 1.
Numerical values for the mean difference and the standard deviation comparing the manual and automated procedures of pyroclastic material volume calculation.
The differences are greater for the LF maximum height and relatively small for the durations and for the LF mean height, these last two being the parameters involved in the estimate of the pyroclastic volumes. We therefore conclude that using the software tool is acceptable at least for a quick estimate of the main features of the LF episodes.
3.2. Lava Flows Volumes
The LF episodes represent only one of the mechanisms of magma output release at the Etna volcano. The other is represented by the emission of lava flows during summit and lateral or flank eruptions. Lava flow output occurs also during most of the LF episodes, both as overflows from the crater rim or from fissure and vents on the flanks of the summit cone [19,22,33]. It is therefore essential to make a more complete analysis of the volcano’s output by also considering the volumes of lava flows erupted over time, which we report in the Supplementary Material, Table S2.
If both effusive and explosive events are considered, the cumulative volume ejected over time is obtained, as shown in Figure 3.
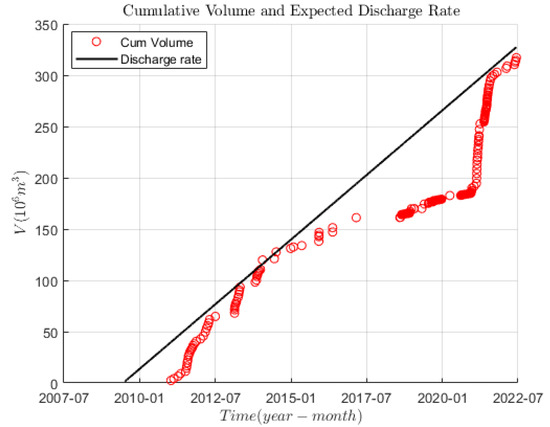
Figure 3.
Cumulative volume of lava flows and pyroclastic material (in millions of cubic meters) erupted by Mt. Etna between January 2011 and July 2022 considering both lava fountains and effusive eruptions (red circles), compared to the expected discharge rate (black line) of 0.8 m3 s−1 [18]. The values used can be found in the (Supplementary Material, Table S2) in the column “Cumulative Total Volume”. The graph starts from 2009 because it is the updated extension of the graph published by [18].
In Figure 3, the pattern indicated by the red circles represents the cumulative (lava flows plus pyroclastic material) volume erupted by the Etna volcano between 2011 and 2022, while the straight black line represents what Bonaccorso and Calvari [18] defined as the “expected discharge rate”, or the 0.8 m3 s−1 rate identifying the volcano in a steady state. The fact that the pattern defined by the red circles approaches the black straight line and touches it suggests that the volcano is in “equilibrium”, or that the system is devoid of magma accumulated in the supply system that could be erupted in the near future. The stalling of output in 2016 determines a shift of the data from the predicted line. While the low activity persists for 5 years, it is followed by a sharp increase in activity until it reaches the ‘equilibrium’ line. This suggested that the system was blocked, and that magma pressure within the supply system increased until 2021, when the eruptive activity led the system to return to equilibrium. It is worth noting here that the year when the volume was considered zero and the plumbing system was in equilibrium is taken from Bonaccorso and Calvari [18] as the end of the 1991–93 flank eruption, which erupted ~250 × 106 m3 of lava and was volumetrically the greatest eruption to occur during the last three centuries [34].
3.3. Probabilistic Models of LF Inter-Event Time and Pyroclastic Volume
The quantification of the eruptive activity of an active volcano, especially if it considers both lava flows and pyroclastic material, can be used to infer its future behaviour. This is the reason why so much effort has been dedicated to quantifying the eruptive activity using visual or infrared observations [1,6,13,18,22,23]. The graph in Figure 3 is intended to help with the hazard assessment, comparing the erupted volume with the “expected discharge rate” [18], following the idea that the steady state behaviour of the volcano (considering the average over a period of decades) observed during the latest five decades will continue in the future. Figure 3 highlights how our knowledge of the equilibrium state of a volcano can be used to assess the eruptive potential in the near future. When a volcano is known to have persistent emissions but has reduced activity over a substantial period of time, a heightened level of alert should be considered due to the likelihood of a larger eruption volume.
In order to illustrate the meaning of “expected discharge rate”, we could hypothesise that a volcano works as a slowly driven interaction-dominated threshold (SDIDT) system [26]. That is, it is a system that slowly accumulates stress, which is released during episodes that could be either effusive or explosive eruptions. Of course, these may also occur at the same time. On the other hand, a recognised example of an SDIDT system in geophysics is represented by earthquakes, as illustrated by the mechanical models proposed by Burridge and Knopoff [35] in 1D, and further extended by Olami et al. [36] in 2D. Both models are based on the idea that masses can move following a spring-block model: one side of the seismic fault is simulated by a rigid plate, while the other side is represented as a number of blocks, connected by springs, that stick on the rigid plate due to friction. Moreover, one of the plates is supposed to move with constant slow velocity, thus simulating the mechanism of stress accumulation. In a similar way, although the physical phenomena involved are probably much more complex, we may conjecture that stress in a volcanic area accumulates slowly but continuously, following a simple linear trend. However, from a practical point of view, the problem is not how the stress is accumulated, but how it is released, given that this has paramount implications for hazard mitigation.
3.3.1. Modelling the LF Inter-Event Time
The inter-event time between the individual LFs, reported in the Supplementary Material Table S1, is shown in Figure 4.
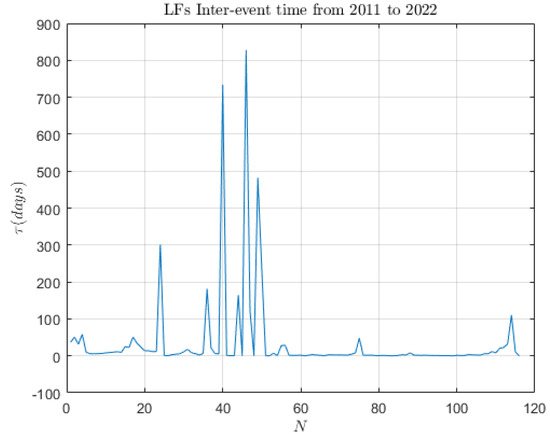
Figure 4.
Inter-event time interval (days) between lava fountain (LF) episodes occurring at Etna from January 2011 to July 2022 plotted against the event number (reported in the first column of Table S1).
For this dataset, the parameters of the fitted power-law model, the corresponding standard deviation and the plausibility index (see Section 2.2. for explanation) are reported in Table 2, while the graphic behaviour of the model is shown in Figure 5 together with the empirical CCDF.

Table 2.
Parameters of the power-law model for the inter-event time dataset.
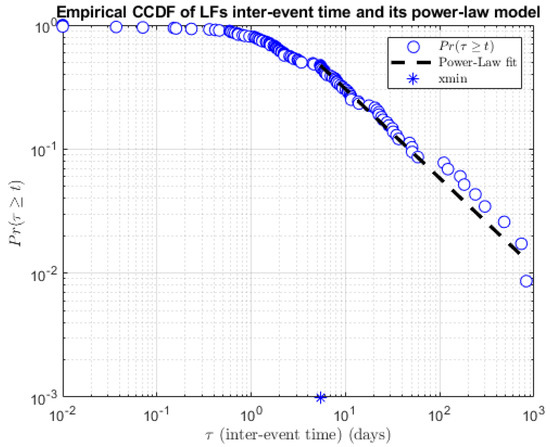
Figure 5.
Empirical complementary cumulative distribution function (CCDF) (blue circles) and its power-law model fit (dotted black line) obtained by using the inter-event time of lava fountains (LF) at Etna between January 2011 and July 2022. The symbol ‘*’ in the abscissa indicates the estimated for the inter-event time interval .
The obtained p-index, , indicates that this power-law model is plausible, as can also be graphically appreciated on observing Figure 5.
The comparison among the empirical CCDF, the power-law model and the alternative distribution models of LF inter-event times are reported in Figure 6 to enable a visual comparison. However, for an objective comparison between models, we report in Table 3 the negative log likelihood, which has been chosen as goodness of fit index. This index being a cost, then the lowest values are best.
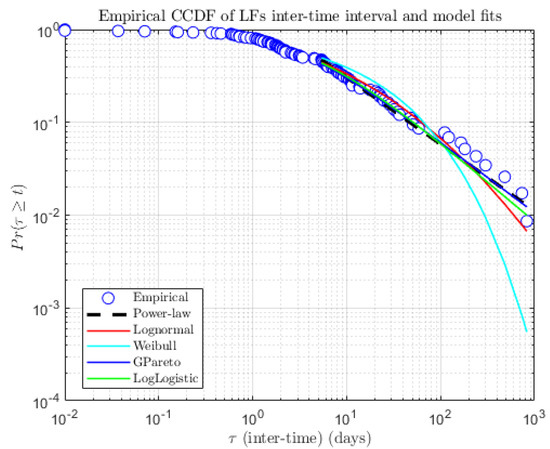
Figure 6.
Log-log plot of the empirical complementary cumulative distribution function (CCDF) of lava fountain (LF) inter-event times and the five considered cumulative probability distribution models.

Table 3.
Negative log likelihood of compared models for the inter-event time dataset.
Since the power-law model is characterised by the lowest value, it can be concluded that it is better than the alternative models.
3.3.2. Modelling the LF Pyroclastic Volume
The pyroclastic volume associated with the 116 LF episodes listed in the Supplementary Material Table S1 is shown in Figure 7.
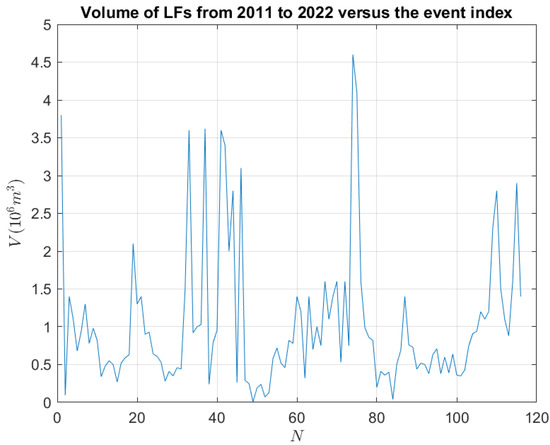
Figure 7.
Volume of lava fountain (LF) pyroclastic material erupted (in millions of cubic meters) versus N (the number of lava fountain events reported in Table S1).
Following the same scheme adopted for the LF inter-event times, we have fitted a power-law model also for the LF volume dataset. The graphic behaviour of this model, with respect to the empirical data, is shown in Figure 8, while the model estimated parameters are reported in Table 4.
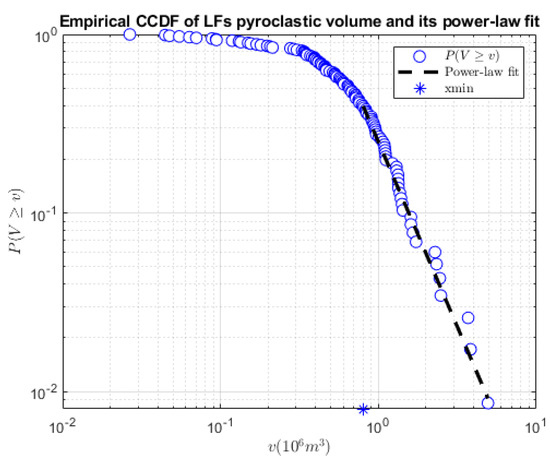
Figure 8.
Log-log plot of the complementary cumulative distribution function (CCDF) for lava fountains (LF) pyroclastic volume with the power-law probability distribution model. The symbol ‘*’ in the abscissa indicates the estimated for the pyroclastic volume .

Table 4.
Parameters of the power-law model for the pyroclastic volume dataset.
The obtained p-index , indicates that this power-law model is also plausible, even if compared with the corresponding inter-event time model, the plausibility is lower.
The comparison among the power-law and the alternative models is graphically shown in Figure 9, while the negative log likelihood index is reported in Table 5.
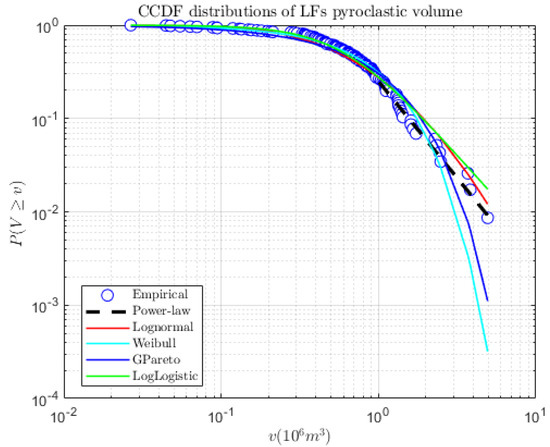
Figure 9.
Log-log plot of the empirical complementary cumulative distribution function CCDF of lava fountain pyroclastic volume and the five considered probability distribution models.

Table 5.
Negative log likelihood of the compared models for the pyroclastic volume dataset.
Also, in this case, the power-law distribution results as the most likely against the alternative models.
4. Discussion and Conclusive Remarks
One of the main consequences for a system characterised by a power-law distribution is the so-called scale invariance, which can be interpreted as indicating that there is not a typical size of the phenomena under investigation. For instance, in the case of LF, there is neither a typical inter-time event nor a typical pyroclastic volume. We only know that long inter-event times are less frequent than short inter-event times, and high volumes are less frequent than small volumes. Obviously, these conclusions are related to whether the hypothesis that a power-law model is a correct interpolation of our data. For the moment, also considering the limited dataset and the non-negligible technical difficulty of proving that a power-law model is a correct interpolation of our data, we continue to adopt this as a working hypothesis on which to further investigate. Another stimulating hypothesis we intend to investigate is the idea of a linearly accumulating stress as shown in Figure 3, which compares the volume erupted by the volcano with the expected steady rate of 0.8 m3 s−1 [18]. The analysis of Figure 3 shows that the pattern of erupted volume at present (July 2022) touches the line of the expected trend of Bonaccorso and Calvari [18]; thus, the volcano is now in “equilibrium”, or the amount of stored magma within the supply system has been erupted and there is no magma available for a next eruption. This statement is confirmed by the current eruptive pause observed at Etna, with the last paroxysmal episode occurring in February 2022, followed by just degassing at the summit craters, which also lack the common persistent mild to weak Strombolian activity. This quiet phase is somehow at odds with the observation by Calvari and Nunnari [23] that the LF episodes that occurred in 2022 were displaying a growing trend of erupted volumes and TADRs, which was leading us to suppose that an even greater event would follow the sequence. Further studies and possibly longer datasets are necessary to unravel this question and increase our capacity for predicting events.
Supplementary Materials
The following supporting information can be downloaded at: https://www.mdpi.com/article/10.3390/rs14236183/s1, Table S1: Paroxysmal explosive episodes of lava fountaining (LF) occurring at Etna volcano between 1 January 2011 and July 2022. The table consists of two halves that show the same features: the half on the left shows the quantities manually detected, while the one on the right those determined by using the software tool; Table S2: Eruptive activity occurring at Etna volcano between 13 January 2011 and 10 October 2022, with the erupted volumes obtained by available references. Fountain volume refers to pyroclastic material erupted during each single episode, whereas cumulative fountain volume refers to the cumulated volumes of pyroclastic material erupted over time. Similarly, lava volume refers to the lava flow volume erupted during each single episode, whereas the cumulative lava volume is the cumulated volume of lava flows erupted over time. Fountain + lava volume refers to the volume of pyroclastic material and lava flows erupted during each episode, and the cumulative total volume refers to the cumulated volume of pyroclastic material and lava flow erupted over time. The episode numbers in the first column refer to the lava fountain episodes. No numbers correspond to a just effusive (lava flow) episode. References [37,38,39,40,41,42,43,44,45,46,47,48,49,50,51,52] are cited in the supplementary materials.
Author Contributions
Conceptualization, S.C. and G.N.; methodology, S.C. and G.N.; software, G.N.; validation, S.C. and G.N.; formal analysis, S.C. and G.N.; investigation, S.C. and G.N.; resources, S.C. and G.N.; data curation, S.C. and G.N.; writing—original draft preparation, S.C. and G.N.; writing—review and editing, S.C. and G.N.; visualization, S.C. and G.N.; supervision, S.C. and G.N.; project administration, S.C.; funding acquisition, S.C. All authors have read and agreed to the published version of the manuscript.
Funding
This research was funded by Project FIRST—ForecastIng eRuptive activity at Stromboli volcano: timing, eruptive style, size, intensity, and duration, INGV-Progetto Strategico Dipartimento Vulcani 2019 (Delibera n. 144/2020; Scientific Responsibility: S.C.).
Data Availability Statement
The videos of eruptive activity used in this paper belong to the Istituto Nazionale di Geofisica e Vulcanologia, Osservatorio Etneo—Sezione di Catania and are used for monitoring purposes. Selected videos can be made available upon request to the first author of this paper.
Acknowledgments
We would like to thank the INGV-OE scientists and technicians for the monitoring network maintenance, and especially Michele Prestifilippo for providing essential information for this work.
Conflicts of Interest
The authors declare no conflict of interest.
References
- Wadge, G.; Walker, G.P.L.; Guest, J.E. The output of the Etna volcano. Nature 1975, 255, 385–387. [Google Scholar] [CrossRef]
- Tanguy, J.C. Les Eruptions historiques de l’Etna: Chronologie et localisation. Bull. Volcanol. 1981, 44, 586–640. [Google Scholar] [CrossRef]
- Romano, R. (Editor). Mount Etna Volcano. Mem. Soc. Geol. It. 1982, 23, 205. [Google Scholar]
- Chester, D.K.; Duncan, A.M.; Guest, J.E.; Kilburn, C.J.R. Mount Etna: The Anatomy of a Volcano; Chapman and Hall: London, UK, 1985; p. 404. [Google Scholar]
- Branca, S.; Del Carlo, P. Eruptions of Mt. Etna During the Past 3,200 Years: A Revised Compilation Integrating the Historical and Stratigraphic Records. In Mt. Etna: Volcano Laboratory; American Geophysical Union Monograph Series; AGU: Washington, DC, USA, 2004; Volume 143, pp. 1–25. [Google Scholar] [CrossRef]
- Wadge, G.; Guest, J.E. Steady-state magma discharge at Etna 1971–1981. Nature 1981, 294, 548–550. [Google Scholar] [CrossRef]
- Walker, G.P.L. A Brief Account of the 1971 eruption of Mount Etna. In Philosophical Transactions of the Royal Society of London; Series A; Royal Society: London, UK, 1973; Volume 274, pp. 177–179. [Google Scholar]
- McGetchin, T.R.; Settle, M.; Chouet, B.A. Cinder Cone Growth Modeled After Northeast Crater, Mount Etna, Sicily. J. Geophys. Res. 1974, 79, 3257–3272. [Google Scholar] [CrossRef]
- Frazzetta, G.; Romano, R. The 1983 Etna eruption: Event chronology and morphological evolution of the lava flow. Bull. Volcanol. 1984, 47, 1079–1096. [Google Scholar] [CrossRef]
- Romano, R.; Vaccaro, C. The recent eruptive activity on Mt. Etna, Sicily. Per. Mineral. 1986, 55, 91–111. [Google Scholar]
- Guest, J.E.; Kilburn, C.R.J.; Pinkerton, H.; Duncan, A.M. The evolution of lava flow-fields: Observations of the 1981 and 1983 eruptions of Mount Etna, Sicily. Bull. Volcanol. 1987, 49, 527–540. [Google Scholar] [CrossRef]
- Harris, A.J.L.; Steffke, A.; Calvari, S.; Spampinato, L. Thirty years of satellite-derived lava discharge rates at Etna: Implications for steady volumetric output. J. Geophys. Res. 2011, 116, B08204, Erratum in J. Geophys. Res. 2012, 117, B08207. [Google Scholar] [CrossRef]
- Harris, A.J.L.; Dehn, J.; Calvari, S. Lava effusion rate definition and measurement: A review. Bull. Volcanol. 2007, 70, 1–22. [Google Scholar] [CrossRef]
- Behncke, B.; Neri, M. Cycles and trends in the recent eruptive behaviour of Mount Etna (Italy). Can. J. Earth Sci. 2003, 40, 1405–1411. [Google Scholar] [CrossRef]
- Clocchiatti, R.; Condomines, M.; Guénot, N.; Tanguy, J.C. Magma changes at Mount Etna: The 2001 and 2002–2003 eruptions. Earth Planet. Sci. Lett. 2004, 226, 397–414. [Google Scholar] [CrossRef]
- Métrich, N.; Allard, P.; Spilliaert, N.; Andronico, D.; Burton, M. 2001 flank eruption of the alkali- and volatile-rich primitive basalt responsible for Mount Etna’s evolution in the last three decades. Earth Planet. Sci. Lett. 2004, 228, 1–17. [Google Scholar] [CrossRef]
- Corsaro, R.A.; Miraglia, L.; Pompilio, M. Petrologic evidence of a complex plumbing system feeding the July-August 2001 eruption of Mt. Etna, Sicily, Italy. Bull. Volcanol. 2007, 69, 401–421. [Google Scholar] [CrossRef]
- Bonaccorso, A.; Calvari, S. Major effusive eruptions and recent lava fountains: Balance between erupted and expected magma volumes at Etna volcano. Geophys. Res. Lett. 2013, 40, 6069–6073. [Google Scholar] [CrossRef]
- Calvari, S.; Salerno, G.G.; Spampinato, L.; Gouhier, M.; La Spina, A.; Pecora, E.; Harris, A.J.L.; Labazuy, P.; Biale, E.; Boschi, E. An unloading foam model to constrain Etna’s 11–13 January 2011 lava fountaining episode. J. Geophys. Res. 2011, 116, B11207. [Google Scholar] [CrossRef]
- Bonaccorso, A.; Calvari, S.; Currenti, G.; Del Negro, C.; Ganci, G.; Linde, A.; Napoli, R.; Sacks, S.; Sicali, A. From Source to Surface: Dynamics of Etna’s Lava Fountains Investigated by Continuous Strain, Magnetic, Ground and Satellite Thermal Data. Bull. Volcanol. 2013, 75, 690. [Google Scholar] [CrossRef]
- Bonaccorso, A.; Calvari, S.; Linde, A.; Sacks, S. Eruptive processes leading to the most explosive lava fountain at Etna volcano: The 23 November 2013 episode. Geophys. Res. Letters 2014, 41, 4912–4919. [Google Scholar] [CrossRef]
- Calvari, S.; Cannavò, F.; Bonaccorso, A.; Spampinato, L.; Pellegrino, A.G. Paroxysmal Explosions, Lava Fountains and Ash Plumes at Etna Volcano: Eruptive Processes and Hazard Implications. Front. Earth Sci. 2018, 6, 107. [Google Scholar] [CrossRef]
- Calvari, S.; Nunnari, G. Comparison between automatic and manual detection of lava fountains from fixed monitoring thermal cameras at Etna volcano, Italy. Remote Sens. 2022, 14, 2392. [Google Scholar] [CrossRef]
- Slatcher, N.; James, M.R.; Calvari, S.; Ganci, G.; Browning, J. Quantifying effusion rates at active volcanoes through integrated time-lapse laser scanning and photography. Remote Sens. 2015, 7, 14967–14987. [Google Scholar] [CrossRef]
- Hergarten, S. Self-Organized Criticality in Earth Systems; Springer: Berlin/Heidelberg, Germany, 2002; p. 273. [Google Scholar]
- Jensen, H.J. Self-Organized Criticality: Emergent Complex Behavior in Physical and Biological Systems; Cambridge University Press: Cambridge, UK, 1998; p. 10. [Google Scholar]
- Luongo, G.; Mazzarella, A.; Palumbo, A. On the self-organized critical state of Vesuvio volcano. J. Volcanol. Geotherm. Res. 1996, 70, 67–73. [Google Scholar] [CrossRef]
- Cannavò, F.; Nunnari, G. On a Possible Unified Scaling Law for Volcanic Eruption Durations. Sci. Rep. 2016, 6, 22289. [Google Scholar] [CrossRef]
- Clauset, A.; Cosma, R.S.; Newman, M.E.J. Power-Law Distributions in Empirical Data. SIAM Rev. 2009, 5, 661–703. [Google Scholar] [CrossRef]
- Watt, S.F.L.; Mather, T.A.; Pyle, D.M. Vulcanian explosion cycles: Patterns and predictability. Geology 2007, 35, 839–842. [Google Scholar] [CrossRef]
- Connor, C.B.; Sparks, R.S.J.; Mason, R.M.; Bonadonna, C.; Young, S.R. Exploring links between physical and probabilistic models of volcanic eruptions: The Soufrière Hills Volcano, Montserrat. Geophys. Res. Lett. 2003, 30, 1701. [Google Scholar] [CrossRef]
- MATLAB and Statistics and Machine Learning Toolbox Release 2021; The MathWorks, Inc.: Natick, MA, USA.
- Behncke, B.; Branca, S.; Corsaro, R.A.; De Beni, E.; Miraglia, L.; Proietti, C. The 2011–2012 summit activity of Mount Etna: Birth, growth and products of the new SE crater. J. Volcanol. Geother. Res. 2014, 270, 10–21. [Google Scholar] [CrossRef]
- Calvari, S.; Coltelli, M.; Neri, M.; Pompilio, M.; Scribano, V. The 1991–93 Etna eruption: Chronology and lava flow field evolution. Acta Vulcanol. 1994, 4, 1–14. [Google Scholar]
- Burridge, R.; Knopoff, L. Model and theoretical seismicity. Bull. Seismol. Soc. Amer. 1967, 57, 341–371. [Google Scholar] [CrossRef]
- Olami, Z.; Feder, H.J.S.; Christensen, K. Self-organized criticality in a continuous, nonconservative cellular automaton modeling earthquakes. Phys. Rev. Letters 1992, 68, 8. [Google Scholar] [CrossRef]
- Ganci, G.; Cappello, A.; Bilotta, G.; Herault, A.; Zago, V.; Del Negro, C. Mapping Volcanic Deposits of the 2011–2015 Etna Eruptive Events Using Satellite Remote Sensing. Front. Earth Sci. 2018, 6, 83. [Google Scholar] [CrossRef]
- Behncke, B.; De Beni, E. L’Attività Eruttiva del Nuovo Cratere di Sud-Est dell’Etna fra Ottobre e Dicembre 2013: Campi Lavici e Crescita del Nuovo Cono. Rapporto UFVG del 22 January 2014. pp. 1–4. Available online: www.ct.ingv.it (accessed on 16 October 2022).
- De Beni, E.; Behncke, B.; Branca, S.; Nicolosi, I.; Carluccio, R.; D’Ajello Caracciolo, F.; Chiappini, M. The continuing story of Etna’s New Southeast Crater (2012–2014): Evolution and volume calculations based on field surveys and aerophotogrammetry. J. Volcanol. Geoth. Res. 2015, 303, 175–186. [Google Scholar] [CrossRef]
- Istituto Nazionale di Geofisica e Vulcanologia-Osservatorio Etneo. Relazione Sull’Attività Eruttiva dell’Etna; Confidential report for the Italian Civil Protection; Aggiornamento al novembre 2014; 2014; pp. 1–30. [Google Scholar]
- Bonaccorso, A.; Calvari, S. A new approach to investigate an eruptive paroxysmal sequence using camera and strainmeter networks: Lessons from the 3–5 December 2015 activity at Etna volcano. Earth Plan. Sci. Letters 2017, 475, 231–241. [Google Scholar] [CrossRef]
- Ganci, G.; Cappello, A.; Bilotta, G.; Corradino, C.; Del Negro, C. Satellite-Based Reconstruction of the Volcanic Deposits during the December 2015 Etna Eruption. Data 2019, 4, 120. [Google Scholar] [CrossRef]
- Ganci, G.; Cappello, A.; Zago, V.; Bilotta, G.; Hérault, A.; Del Negro, C. 3D Lava Flow Mapping of the 17-25 May 2016 Etna Eruption Using Tri-Stereo Optical Satellite Data. Ann. Geophys. 2019, 62, VO220. [Google Scholar] [CrossRef]
- Ganci, G.; Bilotta, G.; Calvari, S.; Cappello, A.; Del Negro, C.; Herault, A. Volcanic hazard monitoring using multi-source satellite imagery. In Proceedings of the IGARSS 2021–2021 IEEE International Geoscience and Remote Sensing Symposium, Brussels, Belgium, 11–16 July 2021. [Google Scholar]
- Istituto Nazionale di Geofisica e Vulcanologia-Osservatorio Etneo. Several Weekly Reports on the eruptive activity of Etna volcano. Available online: www.ct.ingv.it (accessed on 16 October 2022).
- Calvari, S.; Bilotta, G.; Bonaccorso, A.; Caltabiano, T.; Cappello, A.; Corradino, C.; Del Negro, C.; Ganci, G.; Neri, M.; Pecora, E.; et al. The VEI 2 Christmas 2018 Etna Eruption: A Small but Intense Eruptive Event or the Starting Phase of a Larger One? Remote Sens. 2020, 12, 905. [Google Scholar] [CrossRef]
- De Beni, E.; Cantarero, M.; Neri, M.; Messina, A. Lava flows of Mt Etna, Italy: The 2019 eruption within the context of the last two decades (1999–2019). J. Maps 2020, 17, 3. [Google Scholar] [CrossRef]
- Del Negro, C.; Bilotta, G.; Cappello, A.; Corradino, C.; Ganci, G. Osservazioni da Satellite dell’Attività Eruttiva dell’Etna; Periodo Analizzato: Dal 27 al 28 Luglio 2019; Confidential report for the Italian Civil Protection; Istituto Nazionale di Geofisica e Vulcanologia; Osservatorio Etneo: Linguaglossa, Italy, 2019. [Google Scholar]
- Calvari, S.; Biale, E.; Bonaccorso, A.; Cannata, A.; Carleo, L.; Currenti, G.; Di Grazia, G.; Ganci, G.; Iozzia, A.; Pecora, E.; et al. Explosive paroxysmal events at Etna volcano of different magnitude and intensity explored through a multidisciplinary monitoring system. Remote Sens. 2022, 14, 4006. [Google Scholar] [CrossRef]
- Amato, E. Machine learning and best fit approach to map lava flows from space. Il Nuovo Cim. 2022, 45C, 80. [Google Scholar] [CrossRef]
- Calvari, S.; Bonaccorso, A.; Ganci, G. Anatomy of a Paroxysmal Lava Fountain at Etna Volcano: The Case of the 12 March, 2021, Episode. Remote Sens. 2021, 13, 3052. [Google Scholar] [CrossRef]
- Istituto Nazionale di Geofisica e Vulcanologia; Osservatorio Etneo. Stato Etna 2 Febbraio 2021; Confidential report for the Italian Civil Protection; 2 February 2021. [Google Scholar]
Publisher’s Note: MDPI stays neutral with regard to jurisdictional claims in published maps and institutional affiliations. |
© 2022 by the authors. Licensee MDPI, Basel, Switzerland. This article is an open access article distributed under the terms and conditions of the Creative Commons Attribution (CC BY) license (https://creativecommons.org/licenses/by/4.0/).