1. Introduction
Accurately detecting the onset of volcanic explosive activity under any visibility conditions may be fundamental to assess volcanic hazard and mitigate the risk; for this purpose, radar (radio detection and ranging) monitoring may represent a powerful tool. Radars work by transmitting an electromagnetic wave at microwave frequencies and measuring the energy reflected back by any object along the propagation direction and within a certain range. In this way, the position, size, and velocity of such reflective bodies can be estimated, from aircraft to particles within clouds (e.g., water drops or volcanic ashes). The radiated energy is transmitted at a frequency band that is not critically affected by extreme temperatures and variations in ambient lighting. Moreover, materials such as plastics are transparent for radar waves, meaning that the antenna can be covered with protective cases (radome) and installed in places that may be characterised by extreme weather conditions.
In particular, in volcanic areas, radar systems can be used to detect pyroclastic materials emitted during explosive activity [
1], or to estimate several parameters such as the tephra size spectra and mass flow rate, as in the case of the 2010 Eyjafjallajökull eruption, where the volcanic plume was many kilometres afar [
2]. Another application employed a radar device to develop an automatic classification system that was capable of investigating lava domes instabilities and the correlation with rainfall [
3,
4].
On Mt. Etna, the first L-band Doppler radar system, namely
VOLDORAD, was first tested in July 1998 for detecting explosive eruptive activity from the summit vents [
5]. Lately, in 2009, a dedicated version of such radar, called
VOLDORAD 2B, was installed at
La Montagnola, on the southern flank of Etna at about 2600 metres above sea level, operated jointly by Istituto Nazionale di Geofisica e Vulcanologia, Sezione di Catania, Osservatorio Etneo (INGV-OE) and Observatoire de Physique du Globe de Clermont-Ferrand (OPGC). This radar detected and recorded important features of the lava fountains that occurred between 2011 and 2015 [
1,
6].
Another radar system was installed in November 2014 alongside the
VOLDORAD 2B at
La Montagnola (
Figure 1). It is the
VAPORS-S (
Volcanic Ash and Plume Observation by Radar System in S band), an S-band pulse Doppler radar operated by (INGV-OE).
Between December 2020 and February 2022, Etna volcano was characterised by the occurrence of frequent eruptive episodes from the South-East Crater (
SEC), forming impressive lava fountains that rose several kilometres above the vents [
7].
In this work, we describe the realisation of a system aimed at detecting and monitoring explosive eruptive activity at Mt. Etna, exploiting the signals acquired by the VAPORS-S radar equipment during the second half of 2021. We performed a processing flow aimed at detecting the possible occurrence of the Strombolian activity and the subsequent evolution into a lava fountain through the estimation of empirical thresholds. Our results represent the first step towards the realisation of an effective monitoring system that will enhance volcanic surveillance at the INGV-OE’s control room, for a better detection of the explosive summit eruptive activity at the Etna volcano.
2. Materials and Methods
Radar systems have been used to monitor volcanic activity by remotely sensing volcanic plumes [
1,
5,
8]. These applications use radar devices designed ad hoc for monitoring purposes [
1], or “weather radars” aimed at scanning the atmosphere [
9]. Several features may be extracted by radar monitoring [
10], e.g., particle size distribution [
11], mass concentration within volcanic clouds [
12] and the volume, mass, and dispersion [
13,
14] of pyroclastic material.
The basic structure of a radar system comprises a transmitter, which generates the electromagnetic wave, an antenna, to radiate the original waveform and to receive the back-reflected one, a receiver, taking and amplifying the incoming signal from the antenna, a signal processor, which filters the amplified signal and increases the signal-to-noise ratio and a data processor (hardware or software), to extract the desired features [
15].
Other components can be added to enhance the estimation of different features from the targets, which has led to the creation of many different types of radar equipment in the past years, such as the pulse Doppler weather radar. It generates a series of almost-rectangular pulses with a specific pulse repetition frequency (PRF), which is regulated to control the range and Doppler ambiguities. These radar systems, originally designed to exploit the Doppler effect for meteorological observations (e.g., precipitations), can also be used to recognise and measure other kinds of particles in the atmosphere (e.g., pyroclastic materials in volcanic plumes [
16]).
2.1. VAPORS-S Radar Equipment
VAPORS-S is a custom radar system developed by Ingegneria Dei Sistemi (IDS), following the specifications given by INGV-OE for monitoring the Etna summit’s explosive activity; its main features are reported in
Table 1.
In particular, the equipment was designed to illuminate that portion of the volcanic plume where pyroclastic materials are projected upward by the expanding volcanic gases (thrust zone), i.e., just above the vents. To this end, the antenna of the radar was oriented to monitor the activity of the
SEC (
Figure 1), which has been the most active vent amongst the Etna summit craters in recent years. Therefore, the field of view of the antenna mainly covers the thrust zone above the
SEC.
To better analyse the dispersion of pyroclastic materials, the sensed volume was subdivided into four regions of interest—namely, range bins (RBs)—by using the range-gating technique. Thus, the radar system only processes the reflections coming from objects falling within a certain radial distance from the antenna (RB 1: 2850–3000 m; RB 2: 3000–3150 m; RB 3: 3150–3300 m; RB 4: 3300–3450 m;
Figure 1).
During an eruptive episode, part of the energy emitted by the radar is reflected back by pyroclastic materials within the sensed volume. The returned echoes are then processed, and a frequency analysis is performed to detect any shifts from the original carrier frequency (i.e., 2.8 GHz). These shifts are caused by the Doppler effect, which produces a frequency change in the waves reflected back by a moving object, with such change being linearly related to the object’s velocity. In this way, the particles’ speed along the direction of the antenna can be derived, providing useful information about upward- or downward-moving materials.
A brief description follows of the main processing steps performed to construct time series that describe the energy reflected back by the pyroclastic materials emitted during the second half of 2021 from the SEC. Such information will represent a further monitor parameter to be used in the INGV-OE control room, for detecting the eruptive explosive activity under any visibility conditions.
2.2. Data Acquisition and Processing
The acquisition and processing of VAPORS-S data are managed via software, in part provided by IDS and in part developed by INGV-OE. The programs are contained in a computer installed alongside the radar system, communicating with the latter and connected to the internal network of INGV-OE.
The programs provided by IDS are VAPORS-S Console and VAPORS-S Viewer, used to record the data and to display Doppler shift information in real time, respectively. In particular, VAPORS-S Console allows the user to manage the radar (set parameters, shut the system down and start or stop scans) and, in addition, stores the incoming data—I/Q demodulated signals—into “raw files”.
The piece of software developed by INGV-OE then automatically reads and processes data saved by
VAPORS-S Console. The processing flow, applied for each RB’s incoming data, is aimed at transforming the raw data into as many time series (
Figure 2); the various processing stages are shown in
Figure 3 and described as follows:
Generation of Doppler spectra The I/Q demodulated signals, contained in the “raw files”, were processed to obtain information about the Doppler velocities (or frequencies) and the associated reflectivity factor expressed in
(decibel relative to the equivalent reflectivity factor). These values were subsequently collected into discrete Doppler spectra, which were generated with a frequency of 10 Hz for each RB (ten Doppler spectra per second). Each spectrum
, considered at timestamp
T, represented the distribution of
values over Doppler velocities ranging from
156 ms
to
= 156 ms
and with a resolution
= 0.5 ms
; it gave information about the amount of reflected energy from objects going towards or away from the antenna. When there was no activity, all the values in the Doppler spectrum were around or below zero, except for a spike at null velocity
= 0 ms
(clutter,
Figure 2a); its presence is a common problem for radar signals since it is produced by unwanted echoes; in our case, it was mostly due to reflections coming from the Mt. Etna summit cones. During the emission of pyroclastic elements, the values on both sides of the null Doppler velocity increased.
Clutter removal To remove the clutter, all the five
values related to the Doppler velocities from −1 ms
to 1 ms
were replaced by exploiting the linear interpolation between the
values at −1.5 ms
and 1.5 ms
[
17]. Considering the generic spectrum
at timestamp
T, the null Doppler velocity
and the Doppler resolution
= 0.5 ms
, the newly interpolated values were given by:
where
is the number of values to replace and
. The resulting spectrum was devoid of the spike at velocity
(
Figure 2b).
Increasing the signal-to-noise ratio The spectra were grouped into intervals of ten seconds (
spectra per interval, from timestamp
to
) and then averaged; the resulting averaged spectrum
was associated with the timestamp
at the centre of the considered time interval. Considering
the number of velocity bins in a Doppler spectrum, the averaged spectrum was:
To avoid the presence of negative
values, the generic averaged Doppler spectrum
at timestamp
T was translated by a value equal to the minimum value:
where
. The result was an averaged Doppler spectrum without negative values
(
Figure 2c):
Time series generation For each averaged spectrum
at timestamp
T, a unique value was calculated by summing the
values within the whole Doppler velocity range; such values resulted in a time series
with one sample every ten seconds. Considering
M as the number of velocity bins in a Doppler spectrum as in the previous step, and
t as the generic timestamp for every averaged spectrum, each value in the time series was:
Such quantity, which derives from the sum of the
values in each average Doppler spectrum, does not reflect the actual
values associated to a certain phase of an eruptive episode, but in this first step it was only used for monitoring purposes. The time series rose as the volcanic activity occurred; in fact, during the emissions of pyroclastic material, the velocities on both sides of the null one rose to higher
values in the Doppler spectra (
Figure 2d).
Time series smoothing The “raw” time series was generally affected by high-frequency noise. As a smoothing procedure, we applied a moving average with windows of
samples (5 min, since the interval between two consecutive values was
). The mean value for each window took the timestamp
of the latest sample, resulting in a much smoother time series
(
Figure 2e):
3. Results
After a relatively long period, lasting from mid-2016 to December 2020, characterised by a remarkable volumetric gap of erupted magma [
18], which led to an anomalous overpressurisation of the plumbing system [
19,
20], the volcanic activity of Mt. Etna resumed through frequent and strong summit explosive eruptions from the
SEC. These last discontinuously occurred until February 2022 and were characterised by an opening Strombolian activity and the subsequent evolution into a lava fountain, which formed rootless lava flows. The
VAPORS-S radar system has almost continuously operated since June 2021 and thus was able to monitor and record the summit explosive activity, including small, occasional ash emissions. The acquired data resulted in four different time series (as described in
Section 2), one for each RB, which marked well the emission of pyroclastic materials from the
SEC (
Figure 2e).
In order to define empirical thresholds aimed at detecting the onset and characterising the explosive activity at the
SEC, we considered the data acquired during the eruptive episodes that occurred from June to September 2021 (
Table 2); one episode, registered on 23 October, was not considered for the threshold estimation due to the bad visibility conditions, which did not allow us to determine the starting times of the volcanic phenomena. The further episodes that occurred later, until February 2022, were not registered due to maintenance operations at the VAPORS-S radar system, which was later restored, becoming fully operative. Hence, the dataset used for this study comprised the time series related to 23 eruptive episodes. The starting and ending times for both the Strombolian activity and the subsequent lava fountains, as well as the termination of volcanic activity for each episode, were derived by examining the images from the visible and thermal cameras of the INGV-OE surveillance network and the information contained in the volcano monitoring bulletins and communications; then, we verified the correspondent values in each time series.
Nevertheless, such estimation of the starting times was affected by uncertainty, mainly related to adverse weather conditions or, more generally, by observation inaccuracies. Therefore, we considered as the value associated with the onset of a given volcanic phenomenon (Strombolian activity and lava fountains) and eruptive episode (
starting value) the mean value around a radius of 18 samples (3 min) from the estimated starting times (
Figure 4). Moreover, to further attenuate the effect of the high-frequency noise on the determination of such
starting values, only the averaged time series were considered for analysis (
Figure 2e). This procedure was then applied to all the 23 considered eruptive episodes, generating as many
starting values (for each RB), for both Strombolian activity and lava fountains (
Figure 4).
It should be noted that the
starting values for RB1 and RB2 (
Figure 4a,b) were generally lower than those for RB3 and RB4 (
Figure 4c,d), considering both kinds of activities. This was because the
SEC was located farther than the volumes within RB1 and RB2, from where only the reflections by particles falling several tens of metres afar from the summit craters were sensed. Moreover, all the time series rose to their highest values during the lava fountains, since a much larger quantity of pyroclastic materials was produced with respect to the preceding Strombolian activity.
As expected, considerable differences in the
starting values were observed, due to the different volumes of pyroclastic materials emitted during the eruptive episodes. In particular, we noticed that the series of
starting values for the lava fountains (squares in
Figure 4) showed a greater standard deviation (
) than that related to the Strombolian activity (circles in
Figure 4).
Finally, to obtain
reference values for volcanic surveillance, we considered the arithmetic mean of the
starting values of all the eruptive episodes, for each RB and volcanic phenomenon (Strombolian and lava fountains); the resulting
reference values are shown in (
Table 3).
The efficiency of such
reference values in detecting the onset of volcanic activity from the
SEC was assessed by examining the differences between the time at which the
reference values were first encountered and maintained for at least five minutes, and the estimated starting times of the volcanic phenomena (Strombolian activity and lava fountains) for each episode (
Figure 5). The resulting differences could be positive, i.e., the
reference value was encountered after the denoted starting time or else, negative.
The observed temporal margins for the episodes until 6 July were quite small; this was valid for both volcanic phenomena, with differences ranging between 15 s and 35 min for the Strombolian activities, and from 34 s to 36 min for the lava fountains. Conversely, from 8 July, such differences slightly widened. Outliers were only detected for two episodes: 3 h and 32 min for the Strombolian activity on 19 July (RB2) and 2 h and 5 min for the lava fountain on 31 July (RB2).
4. Discussion
The S-band
VAPORS-S Doppler radar, which was installed on the southern flank of Mt. Etna, in a shelter at
La Montagnola, was shown to be sensitive to volcanic explosive activity, as highlighted by the data registered from June to September 2021 (
Figure 6). Our analysis resulted in four time series, one for each RB, from which we estimated empirical
reference values aimed at detecting the onset of the Strombolian activity and eventual evolution into a lava fountain.
However, the volumes of pyroclastic materials emitted during each of Etna’s eruptive explosive episodes could vary remarkably, as observed for the examined ones in 2021, which represented a different quantity of radar-pulse energy reflected back by the volcanic plume. It inevitably produced substantially different
starting values (
Figure 4); consequently, the
reference values, calculated as the arithmetic mean of the
starting values, were able to mark the onset of the explosive eruptive activity with a certain ambiguity. It is worth noting that the standard deviation (
) of the
starting values for the lava fountains (squares in
Figure 4) was much greater than that related to the Strombolian activity (circles in
Figure 4). It was due to the fact that the volumes of pyroclastic materials emitted during the Strombolian activity did not vary remarkably, as opposed to what occurred during the lava fountains. Furthermore, the starting times for the set of eruptive episodes from 14 June to 6 July showed quite small differences with the times at which the
reference values were firstly encountered by the time series and maintained for at least five minutes; such differences slightly widened from 8 July onwards. It may be related to temporal changes in the structural condition of the volcanic conduit and its internal dynamics, and/or to variations in the morphology of the
SEC vents with the progressive occurrence of the different explosive eruptive episodes.
Despite the foregoing, to achieve a useful tool for volcanic surveillance at the INGV-OE, such
reference values were here used to set three consecutive thresholds based on RB3 and RB4 only. The
lowest threshold corresponded to the
reference value for the Strombolian activity (
,
Figure 6); when the time series stayed above this threshold for at least five minutes, then Strombolian activity (or a comparable emission of pyroclastic material) was possibly occurring at the
SEC. The
middle threshold corresponded to the
reference value for the lava fountains, minus the standard deviation
(
); above it, a lava fountain was possibly occurring at the
SEC. Finally, the
highest threshold corresponded to the
reference value for the lava fountains themselves (
), over which there was a strong possibility of a lava fountain at the
SEC. For the lava fountains, we decided it was better to use two different thresholds, due to the greater variability in the volumes of pyroclastic materials emitted during this type of activity (
Figure 4).
The choice of only considering RB3 and RB4 was done because they were the only bins that actually detected an atmospheric volume right above the present day SEC vents, sensing both the upward and downward travelling pyroclastic materials; conversely, reflections from RB1 and RB2 were only produced by a reduced quantity of pyroclastic products falling out between 2850 m and 3150 m away from the antenna.
The thresholds used to detect volcanic summit explosive activity at Mt. Etna were calculated on only 23 distinct eruptive explosive episodes that occurred in 2021 and will be adjusted using incoming data from future eruptions, to improve the accuracy in detection and volcanic surveillance.
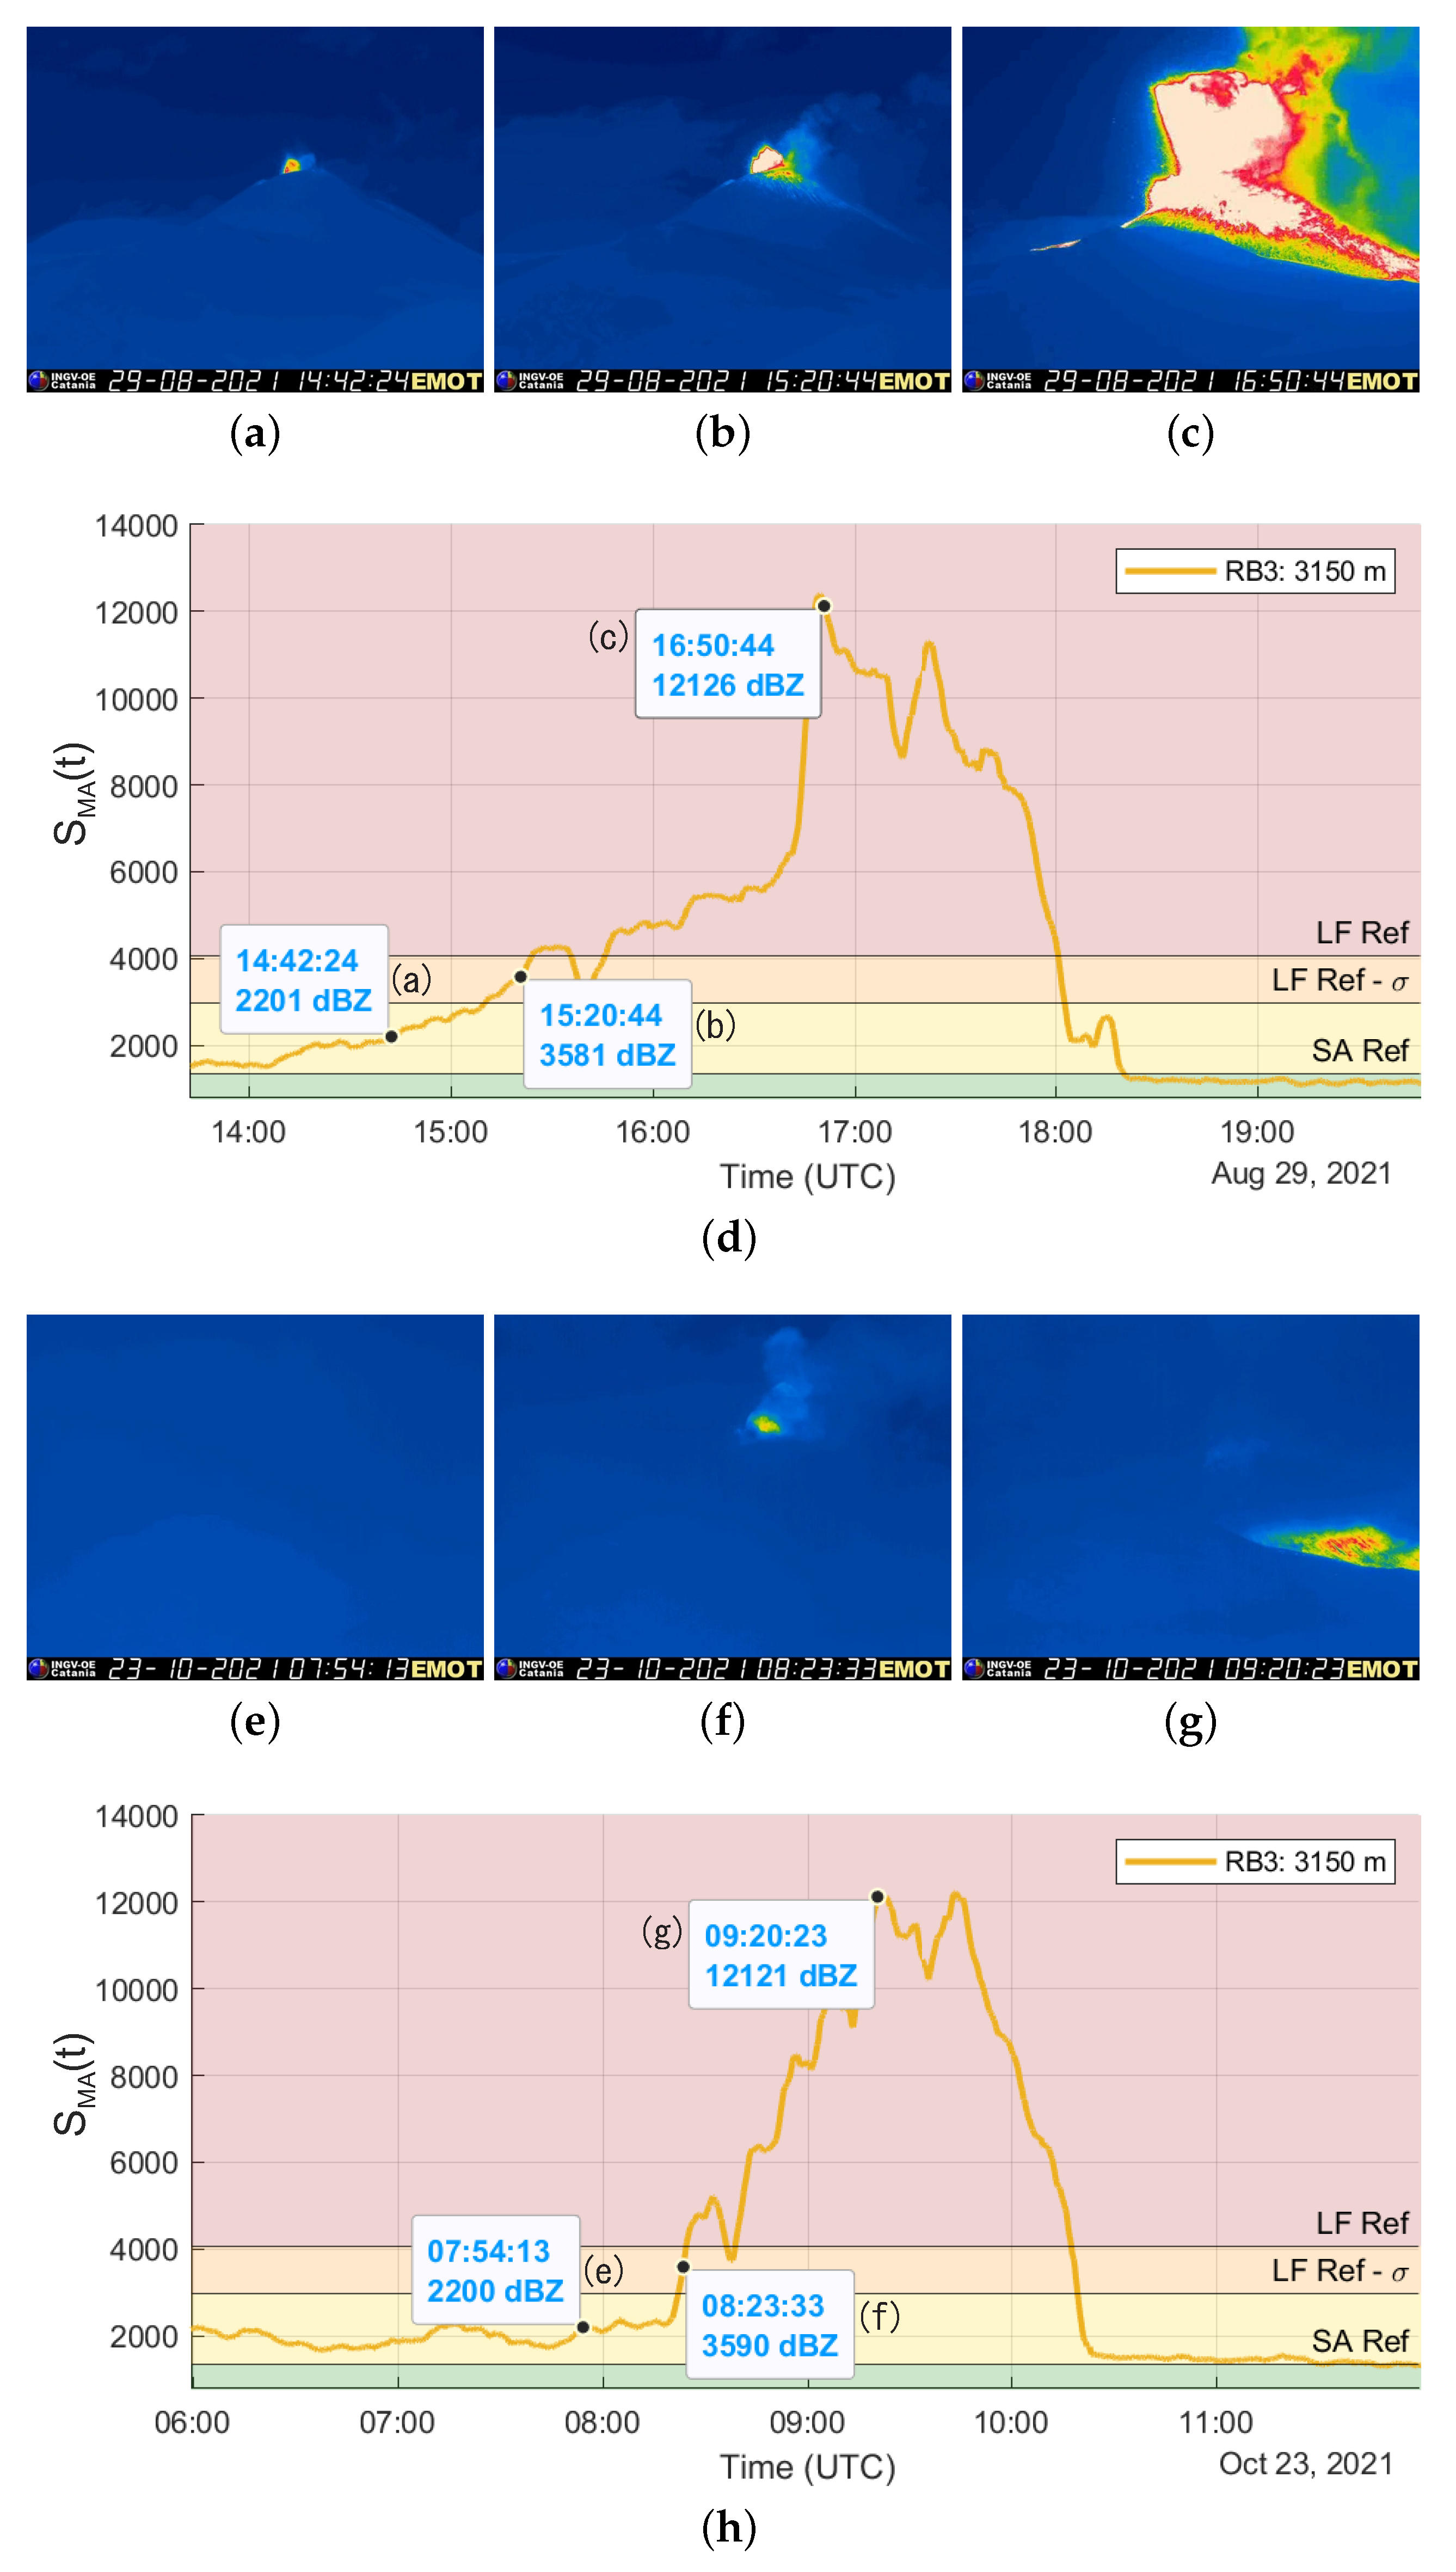
Through this study, we achieved another remarkable result, i.e., the automatic detection of the summit’s explosive activity in poor visibility conditions as well. In
Figure 7, we show two examples of the radar system detection; the first one recorded in good visibility conditions (
Figure 7a–d) and the second one in strong cloudy weather, with no visibility of the summit craters (
Figure 7e–h); here, thermal images only showed the lava flow at the base of the
SEC but not the eruptive column, even during the paroxysmal phase of the lava fountain (
Figure 7g,h). Therefore, this radar system resulted in a robust monitoring tool presently displayed in the INGV-OE control room to detect the explosive eruptions from the Mt. Etna summit craters. Nevertheless, we noticed that bad weather conditions within the observed period, such as rain, were detected by the radar with
values up to 20 in the Doppler spectra, which were comparable to the ones registered during the Strombolian activity; even higher
values might be registered in the future during extreme weather phenomena. However, during such conditions, the trend was almost the same in all the time series associated with each RB. Conversely, during explosive activity, the time series related to RB3 and RB4 generally had much greater values than the ones related to RB1 and RB2. For proper detection, such aspects must be considered during rainy days.
The capability of our system to automatically detect explosive eruptive activity without the need for good visibility, will allow INGV-OE to generate more accurate and prompt alerts to send to the civil protection authorities and VONA (Volcano Observatory Notices for Aviation) messages to air traffic controllers, which makes this system a valuable tool for volcanic activity surveillance. At the time of writing, the system was under testing at the INGV-OE control room and no alerts had been generated.
This work represents the starting point for the development of other future applications that may also take into account the comparison with the information coming from other geophysical measurements (e.g., volcanic tremor). For instance, since radar data are sensitive to the quantity of pyroclastic materials emitted during an eruptive episode, some algorithms to estimate the
mass eruption rate of Etna’s explosive activity can be implemented, exploiting existing results from previous studies [
2,
6,
21]. Radar Doppler spectra may also be processed to extract information about pyroclastic grain size distribution within the volcanic plume. It may be done by estimating the degree of fragmentation of the ejected products: higher velocities may indicate a high fragmentation (i.e., a higher proportion of fine particles) and vice versa. This information, integrated with the meteorological data in dispersal models, may help to forecast the contamination of the air space around the volcano by pyroclastic materials and the tephra fallout on its inhabited flanks, helping to reduce their impact on the air and ground vehicles traffic. With appropriate modifications related to local conditions, this system could be adapted to other volcanoes, making Doppler radar a fundamental monitoring tool.


