Abstract
The Floodwater Depth Estimation Tool (FwDET) calculates water depth from a remote sensing-based inundation extent layer and a Digital Elevation Model (DEM). FwDET’s low data requirement and high computational efficiency allow rapid and large-scale calculation of floodwater depth. Local biases in FwDET predictions, often manifested as sharp transitions or stripes in the water depth raster, can be attributed to spatial or resolution mismatches between the inundation map and the DEM. To alleviate these artifacts, we are introducing a boundary cell smoothing and slope filtering procedure in version 2.1 of FwDET (FwDET2.1). We present an optimization analysis that quantifies the effect of differing parameterization on the resulting water depth map. We then present an extensive intercomparison analysis in which 16 DEMs are used as input for FwDET Google Earth Engine (FwDET-GEE) implementation. We compare FwDET2.1 to FwDET2.0 using a simulated flood and a large remote sensing derived flood map (Irrawaddy River in Myanmar). The results show that FwDET2.1 results are sensitive to the smoothing and filtering values for medium and coarse resolution DEMs, but much less sensitive when using a finer resolution DEM (e.g., 10 m NED). A combination of ten smoothing iterations and a slope threshold of 0.5% was found to be optimal for most DEMs. The accuracy of FwDET2.1 improved when using finer resolution DEMs except for the MERIT DEM (90 m), which was found to be superior to all the 30 m global DEMs used.
1. Introduction
Remote sensing of flood inundation is increasingly used for emergency response, damage assessment, resilience planning, and the development of forecasting systems [1]. Considerable advances in the availability of satellite data, ease of data acquisition, and cloud-based processing systems (e.g., Google Earth Engine (GEE)) have led to a new paradigm in the development and implementation of remote sensing flood mapping platforms [2]. These include emergency-response oriented (near-real-time) applications (e.g., DFO, NASA, Copernicus, ICEYE), which are increasingly relying on automated image analysis, and repositories of historical flood events that are typically used for planning and research (e.g., Copernicus, USFIMR [3], and Cloud2Street [4]). Remote sensing-based flood inundation mapping cannot be readily used to derive floodwater depth, which is an important attribute for near-real-time emergency response and post-event damage assessment [5].
Floodwater depth can be simulated using hydraulic modeling [6] and terrain-based approaches (e.g., Height Above Nearest Drainage (HAND) [3]). Both approaches require detailed hydrological, hydrometeorological, or oceanographic information for fluvial, pluvial, and coastal flood analysis, respectively, hindering their utility in near-real-time and data-sparse regions. The Floodwater Depth Estimation Tool (FwDET), first introduced by Cohen et al. (2018) [5], is a GIS-based algorithm for calculating water depth based solely on an inundation polygon and Digital Elevation Model (DEM). The low data requirement and high computational efficiency of FwDET were shown to be advantageous for the augmentation of remote sensing flood inundation maps [7,8].
The novelty of FwDET is its reliance on the identification of local floodwater elevation, compared to maximum, cross-sectional, and/or interpolation-based analyses. This, however, makes its calculations sensitive to errors in the inundation extent input, which can be a result of errors in the remote sensing analysis or DEM, and spatial mismatch between the DEM and inundation map due to projection or resolution [7]. To alleviate these issues, we developed a new version of FwDET (v2.1) that includes a smoothing and filtering procedure for the inundation boundary raster (grid cells at the edge of the flood). The parameters of the new boundary smoothing and filtering procedure can be adjusted depending on the DEM and inundation map resolutions. Similar to FwDET2.0, the new version was adopted as ArcGIS Pro stand-alone script and script tool and a GEE script (referred to as FwDET-GEE) allowing its users to readily select from GEE’s extensive selection of DEM datasets. FwDET2.1 is also offered as an ArcGIS and ArcGIS Online Notebooks. In this paper, we (1) describe FwDET2.1, (2) conduct an optimization study for using the tool across diverse case studies and DEMs, (3) analyze the tool’s sensitivity to a range of DEMs in GEE, (4) compare the tool improvement over FwDET2.0, (5) discuss its application for large-scale remote sensing derived flood inundation maps, and (6) introduce new FwDET application options.
2. Methodology
2.1. FwDET2.1
FwDET calculates water depth by subtracting local floodwater elevation (above mean sea level (amsl)) from topographic elevation at each grid-cell within the flooded domain. The flooded domain is provided as a GIS polygon layer to FwDET (or optionally as a raster in FwDET-GEE), making the tool agnostic to the source and method used to derive the inundation extent. The elevation of each grid-cell and the floodwater is derived from a DEM. While any DEM can be used, its horizontal and vertical resolutions can have a major effect on the accuracy of the results. This is discussed in more detail below, as well as in Cohen et al. (2018 and 2019) [5,7]. The core of the FwDET algorithm is the identification of local floodwater elevation. FwDET water depth calculation follows this procedure (described and illustrated in detail in Cohen et al., 2018 [5]): (1) conversion of the inundation polygon to a polyline layer, (2) creation of a raster layer from the polyline layer that has the same grid-cell size and alignment as the input DEM, (3) extraction of the DEM value (elevation) for these grid-cells (referred to as boundary grid-cells), (4) allocation of the local floodwater elevation for each grid-cell within the flooded domain from its nearest boundary grid-cell, and (5) calculation of floodwater depth by subtracting local floodwater elevation (step 4) from topographic elevation (DEM) at each grid-cell within the flooded domain. The FwDET-GEE algorithm corresponds with the original but uses raster processes where available (e.g., rasterized border creation instead of polyline) as GEE is optimized for raster structure data.
For flooding within a continuous elevation floodplain, associating the appropriate boundary grid-cell is relatively straightforward. In non-continuous flood domains (e.g., in floodplains of braided rivers), isolated areas of non-flooded land can, and quite often do, exist. Non-flooded isolated areas can be real or represent an error in the remote sensing analysis due to, for example, undetected flooding under dense vegetation or clouds. Errors or outliers in the DEM may also introduce abnormalities. FwDET identifies the cells around these areas as boundary grid-cells, which, if these are real non-flooded (elevated) areas, can improve the water depth calculations as it provides more localized floodwater elevation data. However, if these are not real, they can introduce considerable biases in the output. In coastal floods, the inundation polygon boundary at the coastline or ocean waters cannot be used as boundary grid-cells, as the DEM-extracted elevation will not represent the floodwater depth. Starting in version 2.0, FwDET addressed this issue by removing all boundary grid-cells that have, or are immediately adjacent to, grid-cells that have an elevation equal to or less than zero.
FwDET2.1 introduces a boundary grid-cell smoothing and filtering procedure. A 5 × 5 grid-cell (ArcGIS and GEE equivalent) Focal Statistics tool is applied to the boundary elevation raster. Multiple iterations of smoothing are supported through a loop that applies the Focal Statistics tool on the previous iteration output. The number of iterations is defined by the user (and can be zero). In addition to the aforementioned (coastal) elevation-based filtering introduced in FwDET2.0, topographic slope-based filtering is introduced in FwDET2.1 to remove anomalous (and potentially erroneous) boundary grid-cells, primarily over permanent water bodies. A topographic slope raster is calculated (ArcGIS Slope tool) from the input DEM and a user-defined threshold is used to remove boundary grid-cells with a slope value below the threshold, assuming that ‘true’ flood boundaries grid-cells are less likely to have a very low topographic slope.
2.2. Parameter Sensitivity and Optimization
The sensitivity and optimal values of the two new FwDET2.1 parameters, (i.e., number of smoothing iterations and slope threshold), are analyzed by running the tool with 60 parameter combinations over sixteen (16) benchmark simulated flooding case studies, and for 5 different DEMs. Iteration values ranged from 0–10 at an increment of 1 (11 values), and slope values ranged from 0–2.5% at an increment of 0.5 (6 values). The DEMs used were NED (10 m resolution; U.S. extent), NASADEM (30 m resolution; global extent), MERIT (90 m resolution; global extent), ASTER (30 m resolution; global extent), and SRTM90 (90 m resolution; global extent). These DEMs were selected due to their wide use and availability in GEE. Average absolute Percent Bias (absPBIAS) for all 16 case studies in each parameter space combination was used to infer the optimal combination for each DEM:
where Oi is the observed water depth (hydraulic simulation) and Pi is the predicted water depth (FwDET) in grid-cell i. The absPBIAS was calculated using a pixel-to-pixel (Map Algebra) analysis. The average absPBIAS for each case study and variable combinations is used.
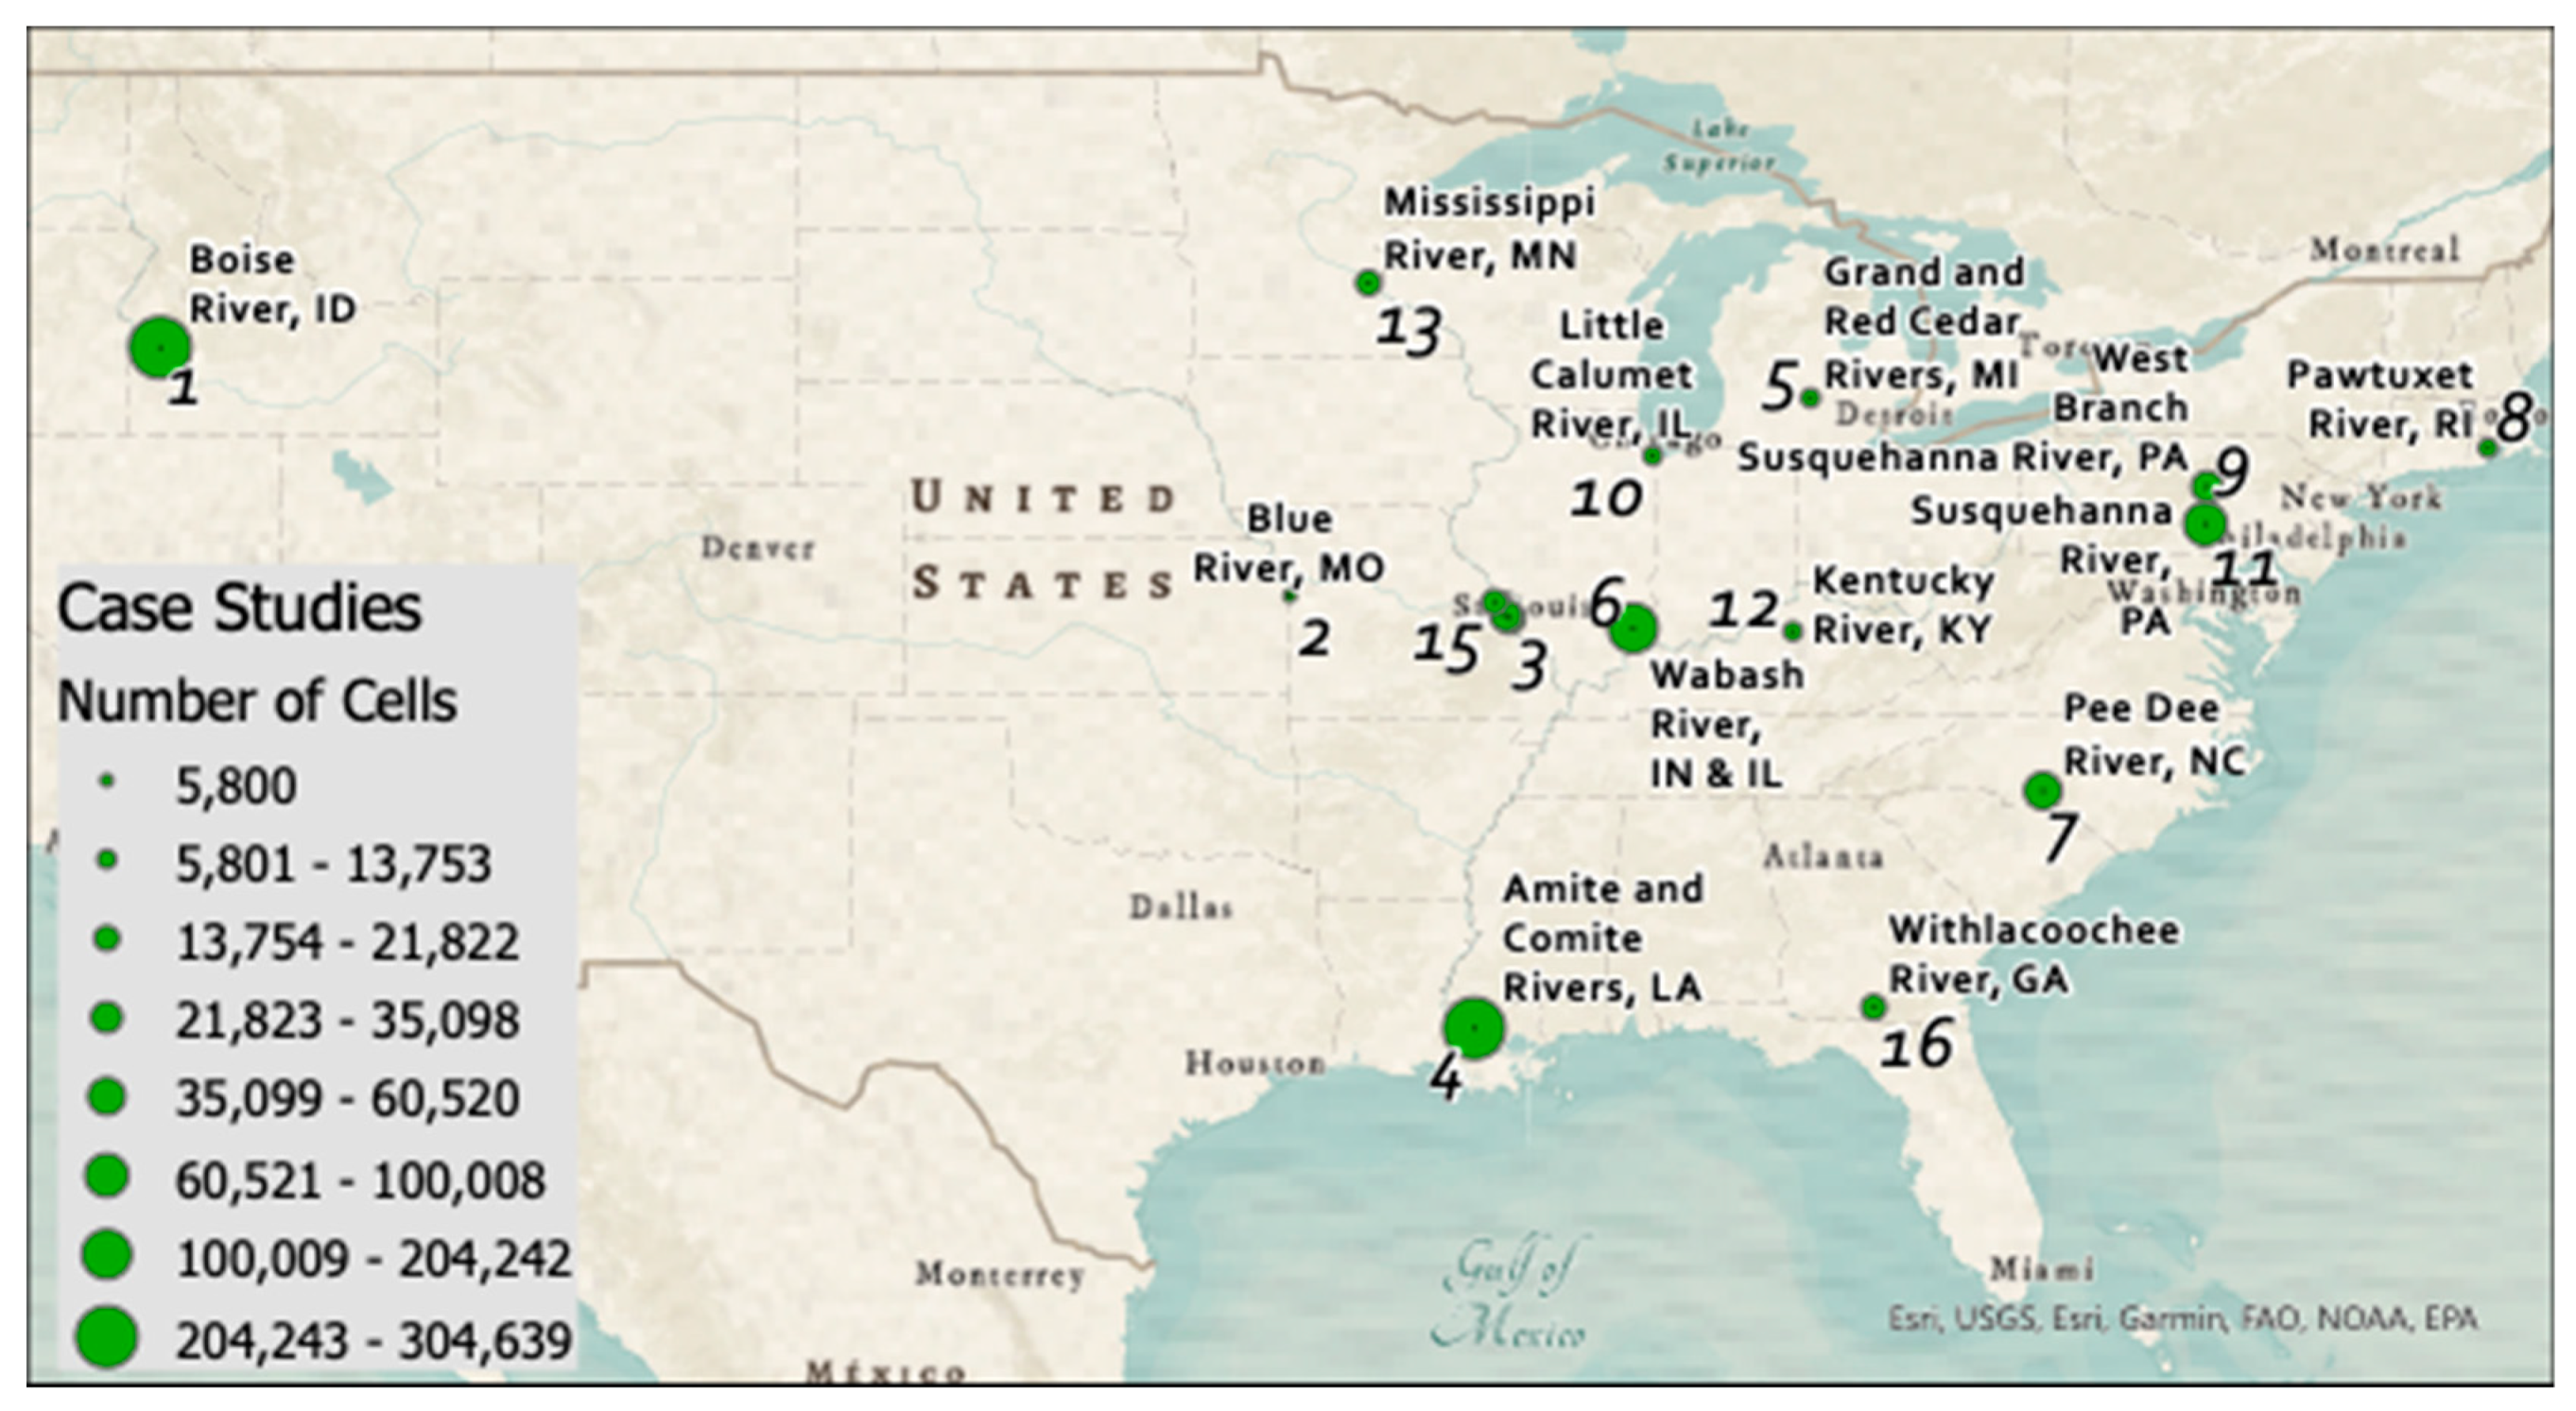
The 16 benchmark case studies (Figure 1; Table 1) were retrieved from the USGS Flood Inundation Mapping (FIM) Program. Each case study includes a floodwater depth raster calculated using HEC-RAS hydraulic model simulations at 3–6 m resolutions. The inundation extent of each case study was vectorized from the modeled water depth raster and used as input to FwDET. Water depth is calculated using FwDET2.1 and was compared to the simulated water depth rasters, which were spatially aggregated to align with FwDET’s output resolutions (for the different input DEM resolutions).
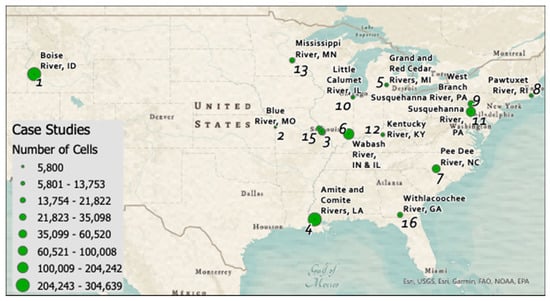
Figure 1.
Distribution and size (number of grid cells) of the 16 USGS FIM case studies used for the optimization and evaluation analyses.

Table 1.
The 16 case studies used in the sensitivity analysis. The number of cells is for the 10 m NED DEM. Mean and max depth are from the USGS FIM floodwater depth rasters (HEC-RAS simulated).
The high resolution of the USGS FIM maps and the fact that many of the 16 case studies are over areas with considerable urban land cover is not ideal for our comparison. While FwDET has been shown to work very well for urban floods using high-resolution (1 m LiDAR) DEM [5], the main utility of the tool is to provide rapid calculations for remote sensing applications. This paper focuses on DEM and parameter selection for typical remote sensing applications, i.e., DEMs of 10 m resolution in the U.S. and 30 m resolution globally. We, however, opted to use the USGS FIM simulations in this study as it is the only open dataset that can provide a large number of flood simulations over diverse domains. To mitigate the issue with the USGS FIM comparison, we use it here for the optimization analysis and the intercomparison between DEMs. A different hydraulic model-driven flood simulation is used in Section 2.4 to evaluate FwDET2.1 prediction accuracy and improvement over FwDET2.0. That case study simulated flood depths at a 10 m resolution and so it provides a more compatible comparison. We also analyze a remote sensing-derived case study in Section 2.5.
2.3. Sensitivity Analysis for DEM Datasets in GEE
To analyze the effect of different DEMs on FwDET predictions, one of the USGS FIM case studies (Amite and Comite Rivers, Louisiana; case study #4 in Figure 1 and Table 1) was modeled using a comprehensive collection of DEMs ranging from 5 m to 100 m spatial resolution (Table 2). The GEE version of FwDET2.1 was used for this assessment without any filtering algorithms to test only the differences between the DEM products and not the effects of the filtering procedure. The Amite and Comite Rivers’ modeled flood extent covers an area of approximately 210 square kilometers and is situated in Central Louisiana near State Highway 64 and U.S. Highway 190. This flood was selected for this analysis as it is one of the largest of the 16 case studies, providing a better approximation of a typical remote sensing inundation mapping application; it is also a relatively continuous inundation extent (as opposed to fragmented), which is preferable for the FwDET algorithm.

Table 2.
DEM datasets used in FwDET intercomparison analysis.
This analysis included 16 DEM datasets, listed in Table 2. In addition to the DEMs described in Section 2.2, the other key DEMs used in the analysis were the GLO 30 m, FABDEM 30 m, and LSLP 5 m DEMs. GLO 30 m is a global dataset distributed by Copernicus with an absolute vertical accuracy of less than 4 m (ESA 2020) and is available in GEE through the ‘awesome-gee-community-datasets’ (AGCD) repository (Roy, 2020). FABDEM 30 m is a forest- and buildings-removed version of the GLO dataset [8] and is available in GEE through the AGCD (Roy, 2020). The 5 m resolution DEM was collected from the Louisiana Statewide Lidar Project (LSLP; LSLP 2000) and was uploaded to GEE as an asset.
2.4. FwDET Evaluation
The Brazos River (Texas, USA) case study [17] was used in our previous studies to evaluate the accuracy of FwDET versions 1.0, 2.0, and FwDET-GEE [5,7,8]. The Brazos case study is a simulated May 2016 flood event using the iRIC-FaSTMECH hydrodynamics model ([18]; https://www.i-ric.org, accessed on 29 September 2022). The simulation and the FwDET calculations use the 10 m NED DEM, providing a more direct comparison compared to the 3–5 m DEMs used in the USGS FIM simulations. RMSE, PBIAS, and absPBIAS statistics are calculated using pixel-to-pixel analysis.
2.5. Remote Sensing Application Case Study
A case study in a data-scarce region is used to evaluate FwDET2.1 application of using remote sensing derived flood inundation maps for any region on Earth. The region of interest is an upstream section of the Irrawaddy (or Ayeyarwady) River in Myanmar, which includes a relatively flat highland floodplain. The Irrawaddy River is heavily influenced by the regional monsoon, which brings in large amounts of rainfall that causes the river to swell and burst over its (natural) banks nearly every year. In July 2019, Northern Myanmar was hit by severe floods [19] which inundated large parts of this study area. Sentinel-1 satellite imagery was acquired on July 16. Sentinel-1′s Synthetic Aperture Radar (SAR) imagery is used extensively for water detection and flood mapping (e.g., [20,21]), with this study using the approach of Markert et al. (2020) [22]. Since the focus of this study is on FwDET, we do not go into the specifics of satellite image processing and flood mapping algorithms, for which the reader is referred to those previous studies. The flood map derived from Sentinel-1 is used as FwDET2.1 inundation extent input, together with four DEMs: ASTER, SRTM90, MERIT, and NASADEM. FwDET2.1-GEE is used for these calculations with two different boundary filtering settings to assess the effect of the new features in FwDET2.1.
Since no validation or water depth reference data exists for these floods, we apply more qualitative means of assessing the usefulness and accuracy of FwDET’s results. This is done by visually comparing water levels and depths for each individual test case, as well as calculating water level statistics over the entire region and certain profiles of interest.
3. Results
3.1. Parameter Optimization
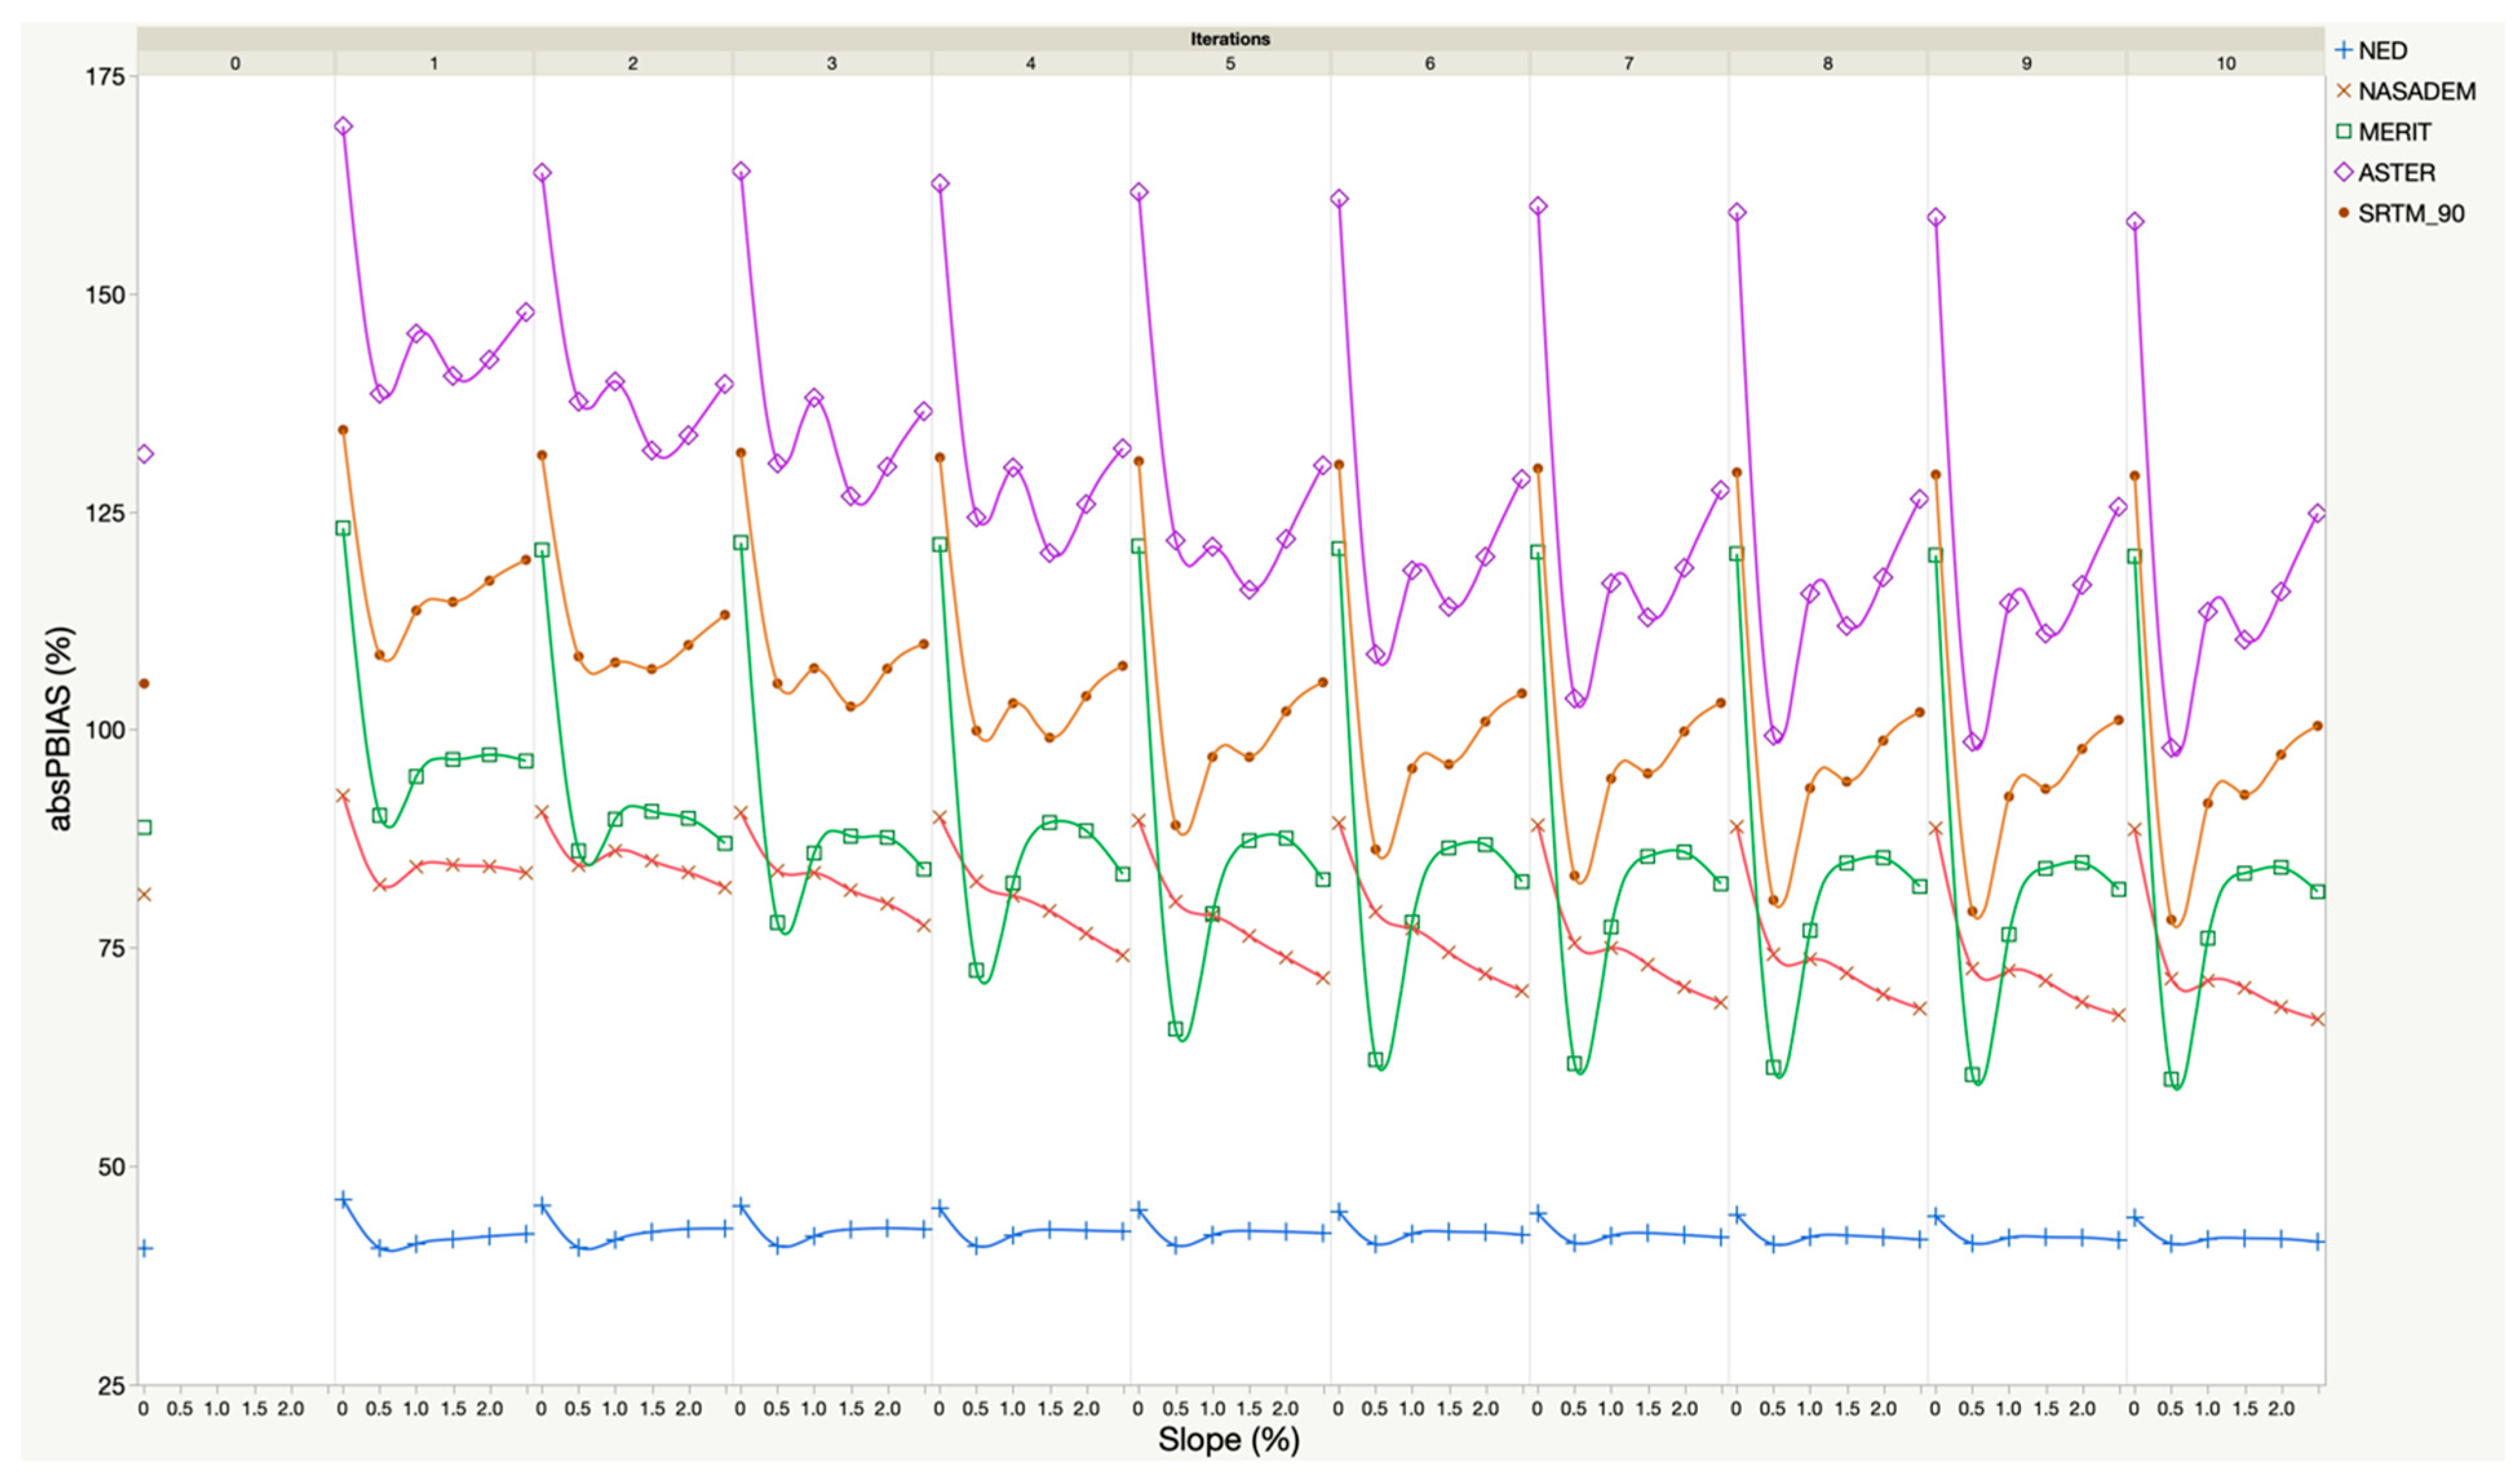
The average performance of FwDET2.1 for the 16 USGS FIM case studies varied considerably as a function of the slope threshold, the number of iterations, and the DEM used (Figure 2 and Table 3). For the 10 m NED DEM, the optimal slope value was consistently 0.5; however, the best performing run was for 0 slope and 0 iterations. Generally, FwDET2.1 performance slightly decreased with an increasing number of iterations when using NED. Relative to the other DEMs, NED shows limited sensitivity to the two variables, with an absPBIAS difference of 5.6 between the best and worst runs. For the 30 m NASADEM, filtering low slope values generally improved accuracy with the optimal performance of ten iterations and slope of 2.5 (highest values tested), with an absPBIAS range of 25 between the best and worst runs. For the 90 m MERIT, the optimal slope value was consistently 0.5 with ten iterations, displaying an absPBIAS range of 63. SRTM 90 m and ASTER DEM 30 m yielded similar optimal slope and iteration configurations as MERIT [I10, S0.5] but at lower correspondence to the benchmark water depth. [I10, S0.5] was also the optimal configuration when averaging the absPBIAS from all 5 DEMs.
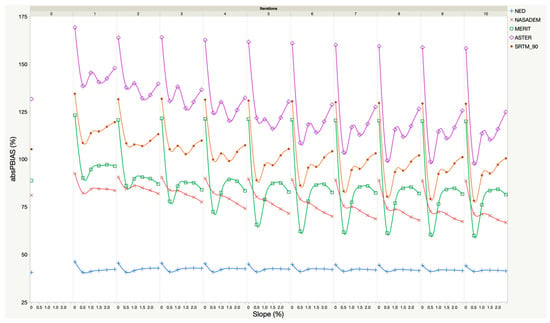
Figure 2.
Average absPBIAS in FwDET2.1 water depth calculations for combination of number of iterations [0–10] (top X-axis) and slope threshold [0–2.5] (bottom X-axis) using NED, NASADEM, MERIT, ASTER, and SRTM_90 DEMs.

Table 3.
Summary of the optimization runs (Figure 2). Slope and absPBIAS are in %.
The results show that the impact of the introduced boundary smoothing and slope-filtering procedures in FwDET2.1 increases for lower resolution DEMs. This is reasonable given that finer resolution DEMs will tend to have a lower degree of spatial mismatch with the flood inundation layer, thus requiring less or no adjustment. The ASTER DEM, while having a relatively high resolution (30 m), yielded the highest absPBIAS. This can be explained by ASTER’s low vertical resolution due to its integer data type. The 90 m MERIT DEM (with a slope value of 0.5) outperformed the best runs with the 30 m NASADEM. MERIT, however, also yielded the highest variability in the results. Generally, variability in the results increases considerably for coarser DEMs, meaning that FwDET2.1 performance is more sensitive to the slope and iteration values when using coarser DEMs.
The relatively high absPBIAS values reported for all DEMs and configurations, and the unexpectedly better outcome for MERIT compared to NASADEM, can be explained by the sensitivity of this analysis to extreme values in individual grid-cells. While FwDET consistently underpredicts average depth (results not shown here), it can yield very high water depth values in a few grid-cells due to misplacement or misrepresentation of their nearest boundary-cell elevation. This issue is more prevalent in coarse resolution DEMs as these capture the average elevation of a larger area. This also explains why FwDET2.1 variable values have a greater impact when using coarser-resolution DEMs.
3.2. DEM Intercomparison
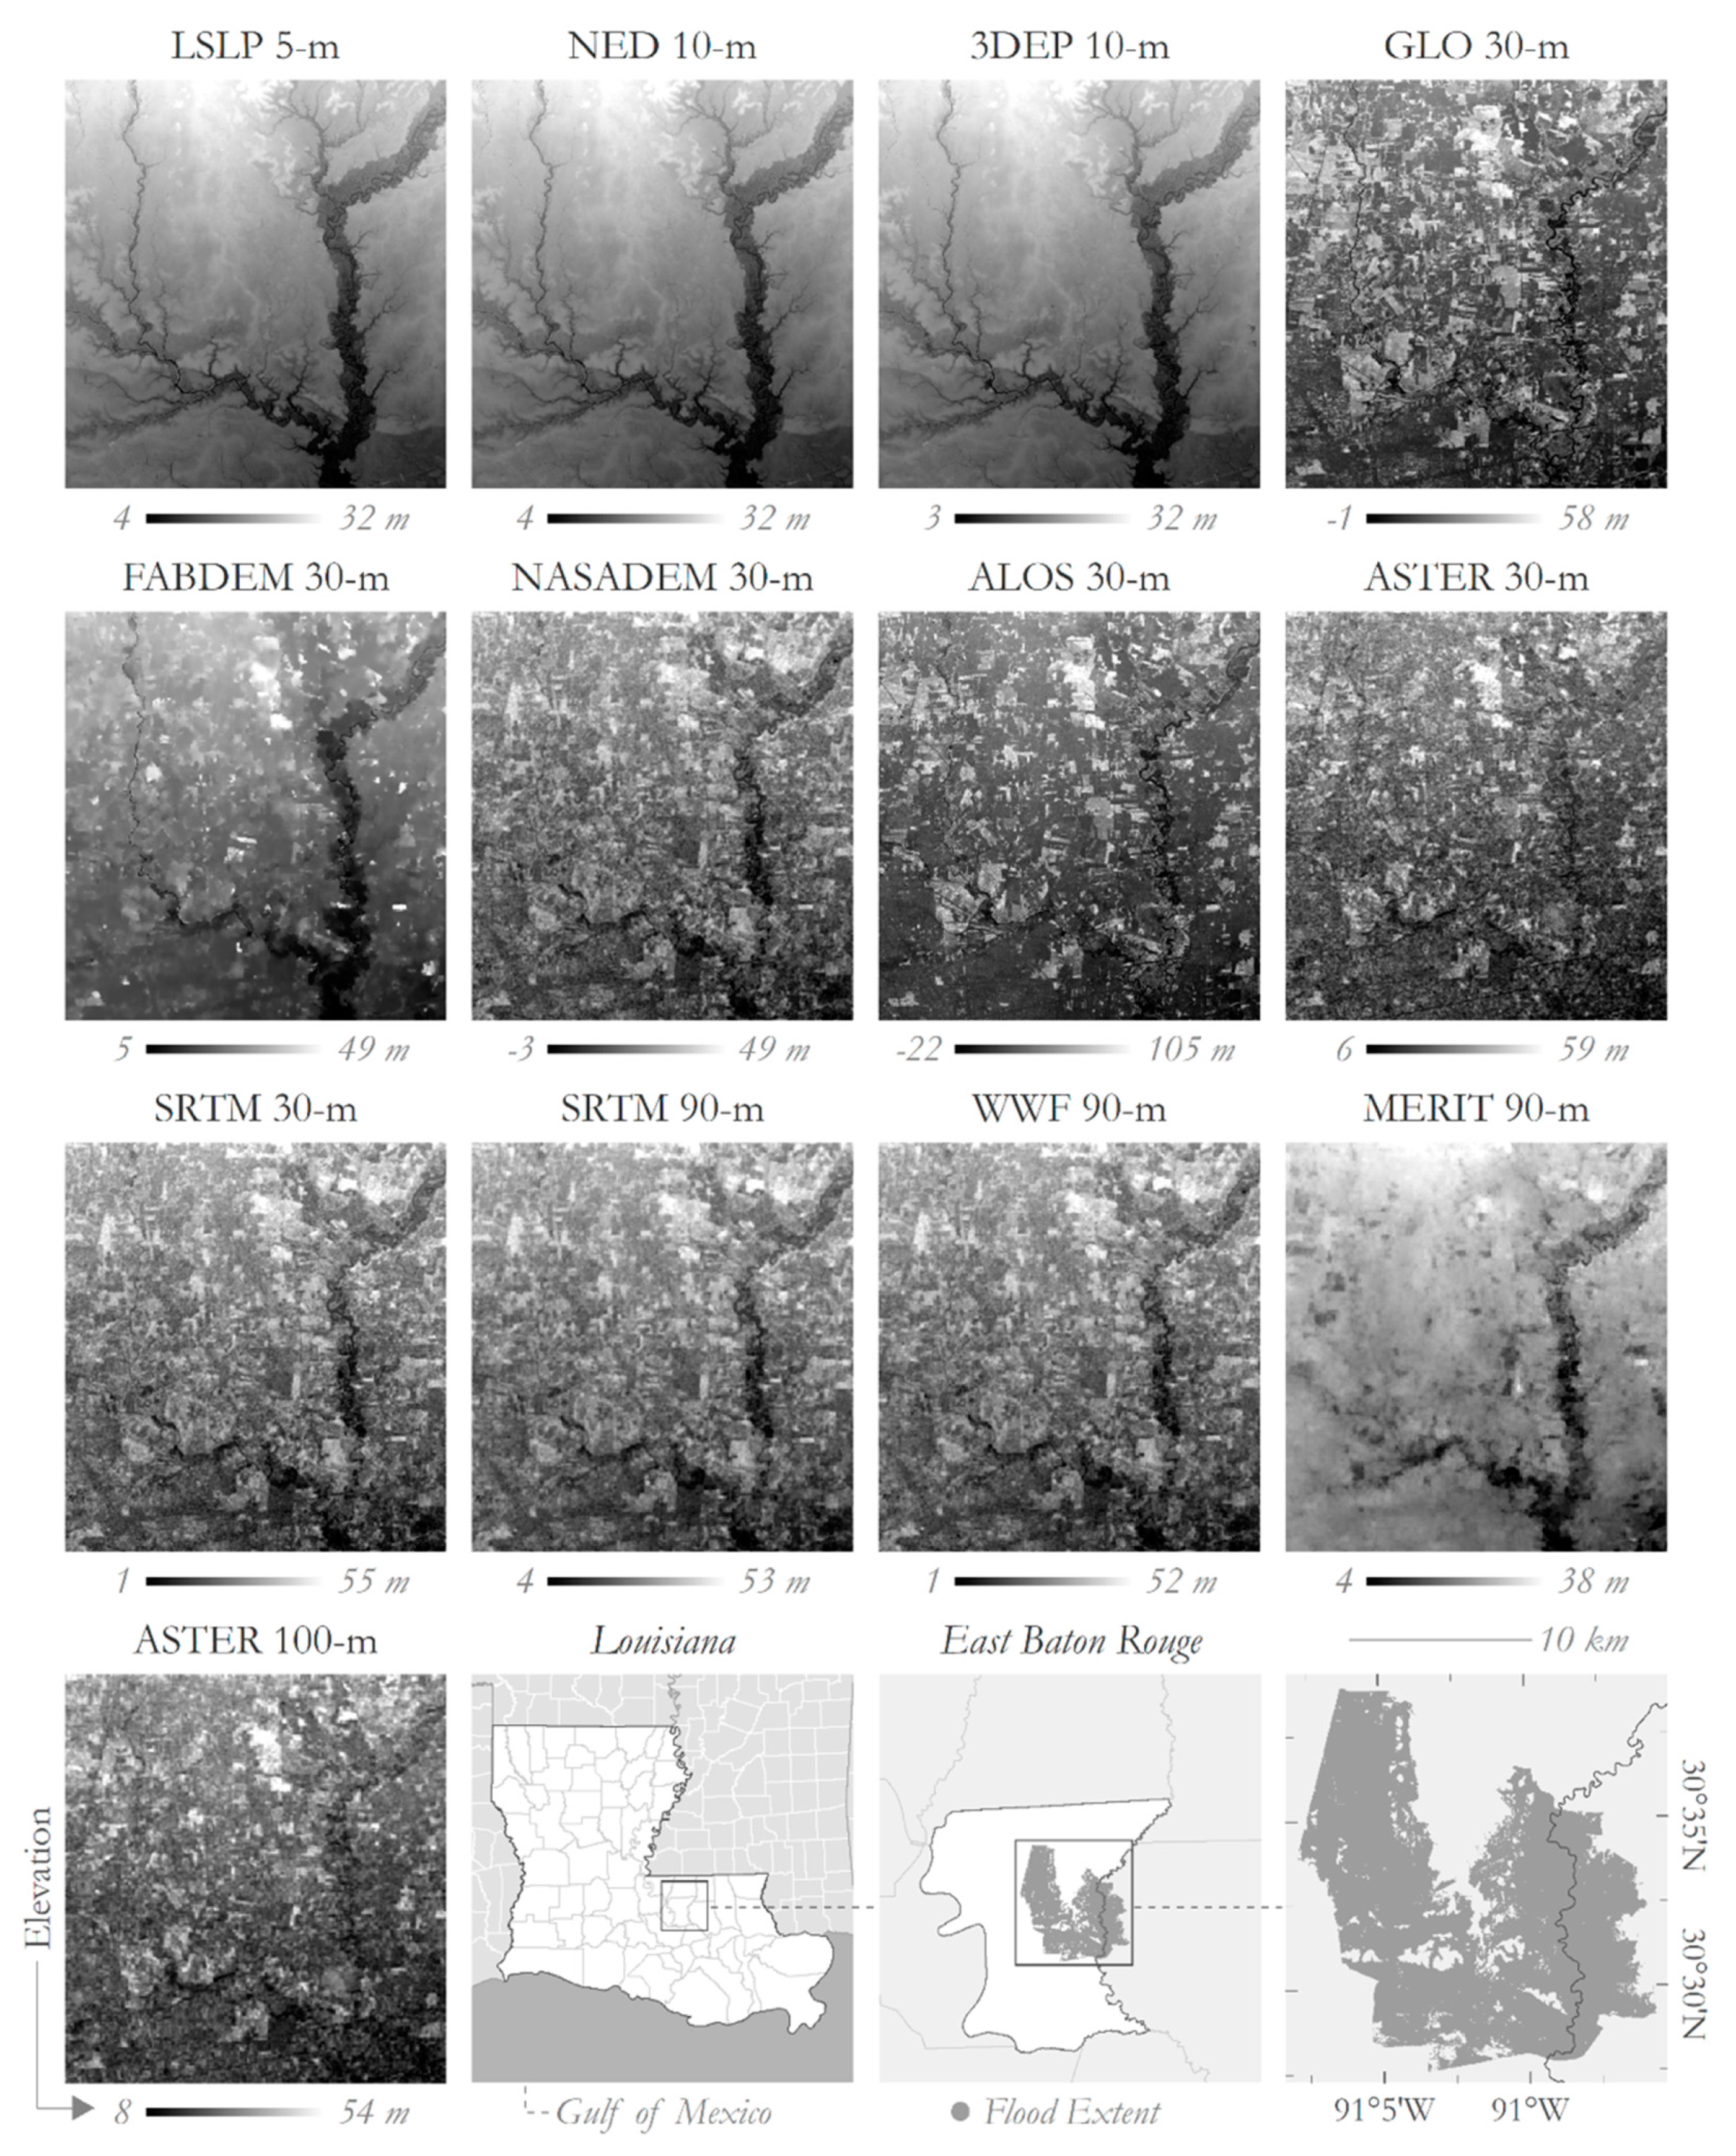
Figure 3 shows all DEMs used in this analysis. Across the DEMs, there is an observable difference in landscape clarity due to the granularity of each dataset, i.e., the rivers/floodplain are clearer in LSLP 5 m, NED 10 m, and 3DEP 10 m compared to the medium/coarse resolution DEMs. Additionally, in some products, there is noise present from buildings and trees (e.g., GLO 30 m and FABDEM 30 m). FABDEM 30 m is derived from GLO 30 m, with forest and building height biases removed. Because of these differences, the lower elevations along the rivers appear more pronounced in FABDEM 30 m than in GLO 30 m.
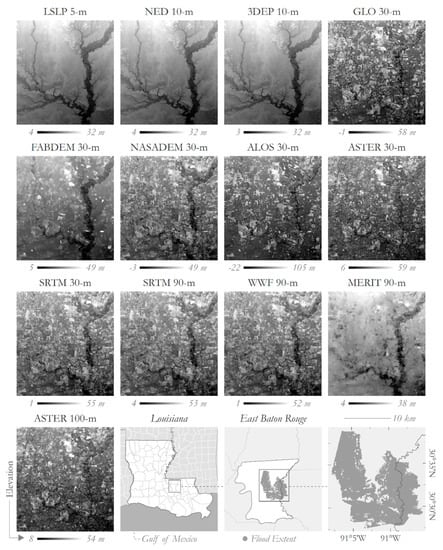
Figure 3.
Maps of the 16 DEMs used in the sensitivity analysis. The modeled flood extent is near the city of Baton Rouge along the Amite and Comite Rivers in Central Louisiana. The bottom right panels are the flood footprint and map extent.
Despite its coarser resolution, MERIT 90 m shows a clear distinction between the river and surrounding areas. MERIT 90 m is visually comparable to finer spatial resolution datasets (e.g., 3DEP 10 m) and visually out-performs medium resolution datasets (e.g., ASTER 30 m), which is counter to what is typically expected—that terrain clarity decreases with increasing spatial resolution. In this case, the noise and error removal in the MERIT algorithm has made it more visually representative of the area than other 30 m and 90 m spatial resolution products. Being a global dataset, MERIT is particularly valuable for scaling FwDET beyond the U.S. (where NED 10 m and 3DEP 10 m are available). MERIT’s coarser resolution also reduces geoprocessing runtime.
Comparing the elevation ranges of the DEMs, marked differences are observed across each product (Figure 3). Finer spatial resolution DEMs tended to have a smaller range of elevation values. For example, LSLP 5 m and NED 10 m both span 4 to 32 m in elevation, while 3DEP 10 m ranges from 3 to 32 m. In contrast, ALOS 30 m covers a broad range (−22 to 105 m) and many of the 30 m DEMs span similar ranges (e.g., SRTM 30 m 1 to 55 m and WWF 90 m 1 to 52 m). Like its visual performance, the elevation range of MERIT is comparable to the finer spatial resolution datasets, with an elevation range of 4 m to 38 m.
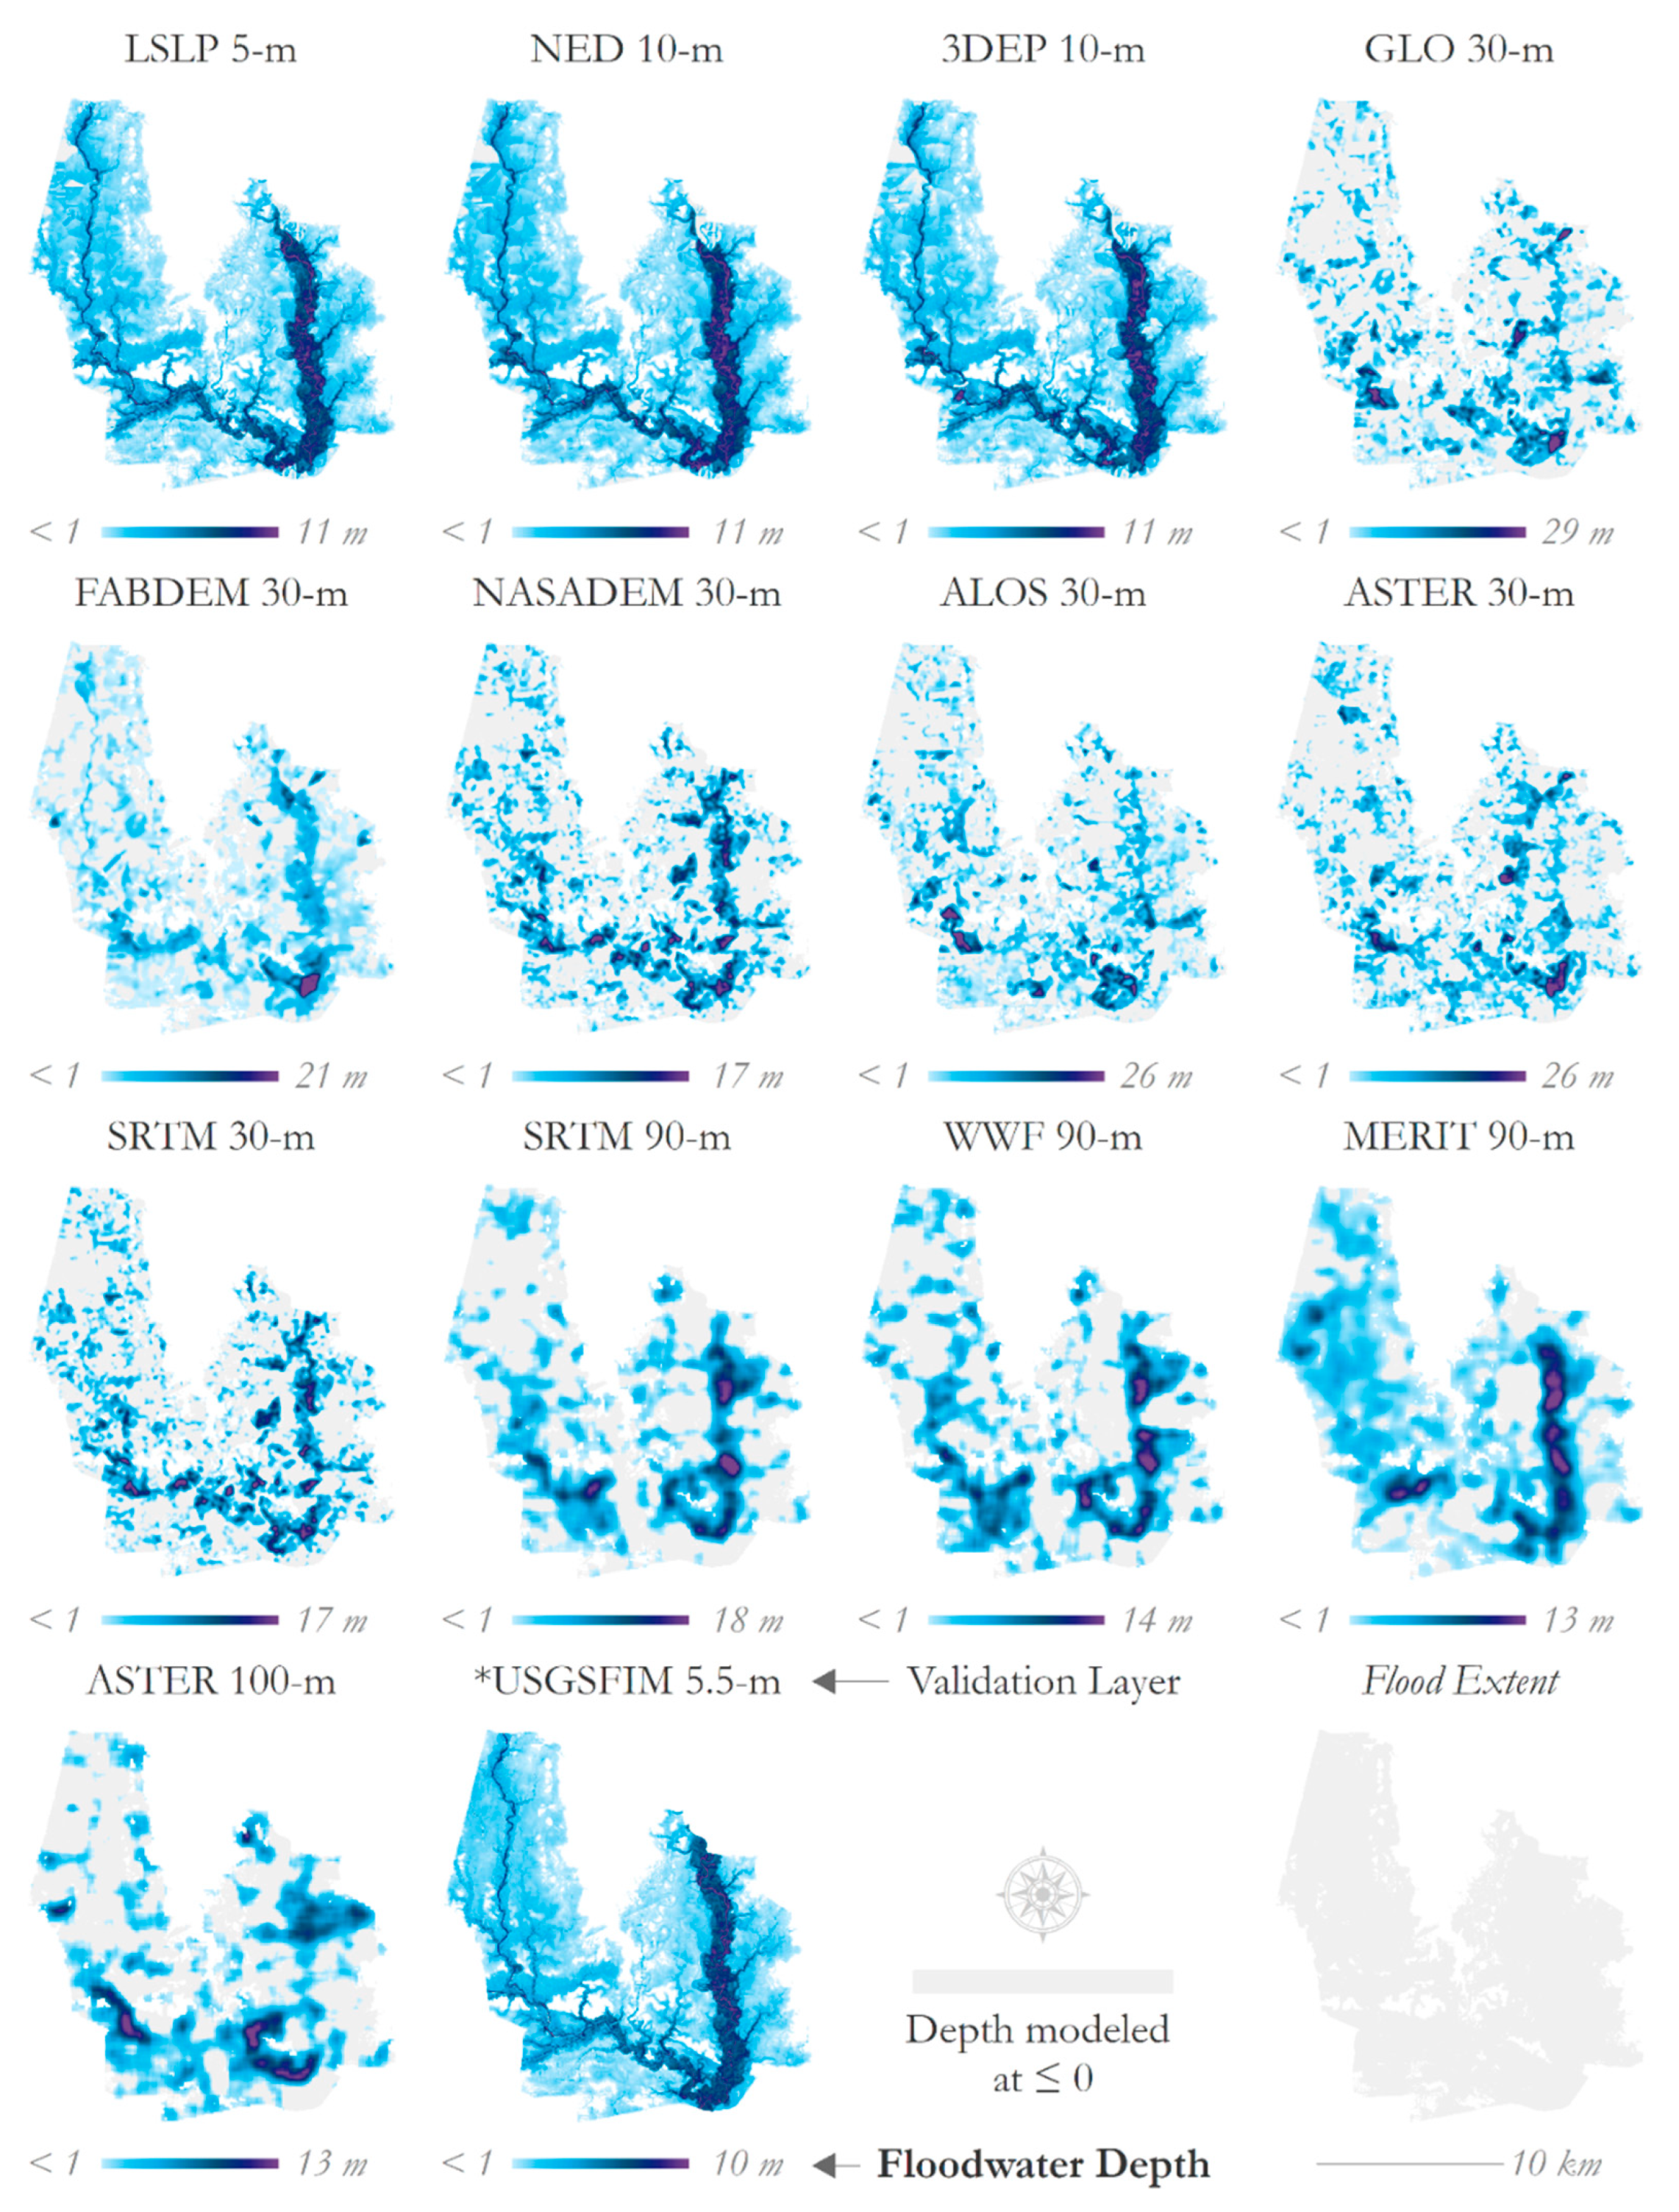
FwDET2.1-GEE was executed using each DEM and the outputs are illustrated in Figure 4. As expected, the granularity of the water depth estimation layers derived from each DEM corresponds with the granularity of the input dataset. LSLP 5 m, NED 10 m, and 3DEP 10 m match well visually with the terrain and the USGS FIM hydraulic model. Additionally, the water depth ranges correspond with the elevation ranges of each input DEM due to the FwDET2.1-GEE algorithm that uses elevation to calculate depth. The water depth range of MERIT (<1 to 13 m) corresponds with the depth ranges of LSLP (<1 to 11 m), NED (<1 to 11 m), and 3DEP (<1 to 11 m), as well as the USGS FIM hydraulic model (<1 to 10 m). FABDEM 30 m, the trees- and buildings-removed version of GLO 30 m, has a water depth range closer to the finer spatial resolution models than GLO 30 m. Of the 30 m resolution datasets, water depths derived from NASADEM 30 m and SRTM 30 m (<1 to 17 m) are closest to the USGS FIM hydraulic model. The estimated water depth range derived from ASTER 100 m, which was the coarsest DEM, also fell within a similar range of the 10 m and 30 m DEMs (<1 to 13 m).
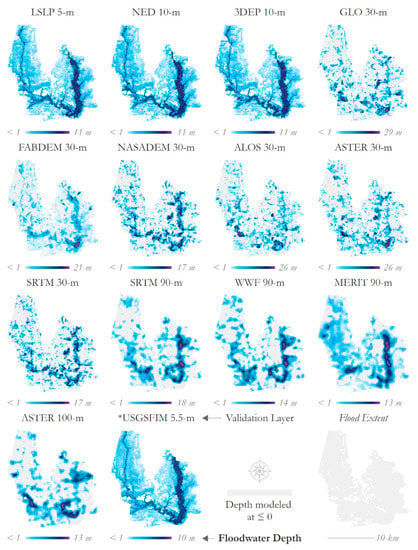
Figure 4.
FwDET-GEE outputs resulting from DEMs of varying spatial resolutions (5–100 m). The areas depicted in gray were modeled at ≤ 0 m depth. * The USGS FIM hydraulic model reference map.
RMSE, absPBIAS, and the Pearson correlation coefficient (r) comparison metrics were calculated for each FwDET2.1-GEE output (Table 4) in relation to the USGS FIM hydraulic model. The comparison metrics support the conclusions drawn from the visual interpretations. The lowest RMSE values were produced by the finest spatial resolution datasets—LSLP 5 m, NED 10 m, and 3DEP 10 m, with RMSE values of 0.63, 0.75, and 0.83 m, respectively. The highest RMSE value overall was observed in GLO 30 m at 4.37. Of the 30 m DEMs, FABDEM 30 m had the lowest RMSE at 2.26, NASADEM 30 m had the second lowest RMSE at 2.73, and SRTM 30 m had the third lowest at 2.75. MERIT 90 m surpassed the 30 m DEMs with an RMSE of 1.58. As for Pearson’s r, the LSLP 5-m, NED 10 m, and 3DEP 10 m datasets had the highest values at 0.95, 0.93, and 0.92, respectively. Pearson’s r was lowest in ASTER 30 m at 0.28. Of the 30 m DEMs, FABDEM 30 m had the highest Pearson’s r at 0.55, NASADEM 30 m had the second highest Pearson’s r at 0.51, and SRTM 30 m had the third highest at 0.50. MERIT 90 m surpassed the 30 m DEMs with a Pearson’s r of 0.73. Table 4 also includes absPBIAS, which tells a similar story to the RMSE and Pearson’s r comparison metrics.

Table 4.
Error metrics relating FwDET-GEE output from DEMs of varying spatial resolutions to the USGS FIM (5.5 m spatial resolution) reference flood depth dataset. The area difference column compares each output to the USGSFIM reference layer (USGSFIM area minus FwDET output area).
Three histogram comparisons were produced to show how the modeled depths from 3DEP 10 m, NASADEM 30 m, and MERIT 90 m compare to the USGS FIM hydraulic model (Figure 5). Depths were resampled at a 10 m spatial resolution for each grid at the intersection of the FwDET2.1-GEE output and USGSFIM 5.5 m layers where depths were greater than zero so that areas were comparable (yielding differences in the USGS FIM histogram). There is a notable similarity between 3DEP 10 m and USGSFIM 5.5 m, though some over- and under-estimations are noted in the shallower flood depths—overestimating in the 0–1 m range and underestimating in the 1–2 m range. Comparing NASADEM 30 m and USGSFIM 5.5 m, NASADEM 30 m underestimates flood depths in the 0–2 m range and overestimates flood depths in the 2–5 m range. Furthermore, NASADEM estimated floods reach depths of up to 17 m whereas USGS FIM extends to only 11 m depths. Similar to NASADEM, the MERIT 90 m output underestimated depths in the 0–2 m and 5–7 ranges and overextends flood depths past 11 m. Despite these differences, the general shape of the MERIT histogram tracks more closely with the USGS FIM hydraulic model than NASADEM.

Figure 5.
Depth histogram comparisons: 3DEP 10 m, NASADEM 30 m, and MERIT 90 m compared to USGSFIM 5.5 m. Depths were resampled at a 10 m spatial resolution for each dataset so that relative areas are comparable across datasets/charts.
3.3. FwDET2.1 Evaluation
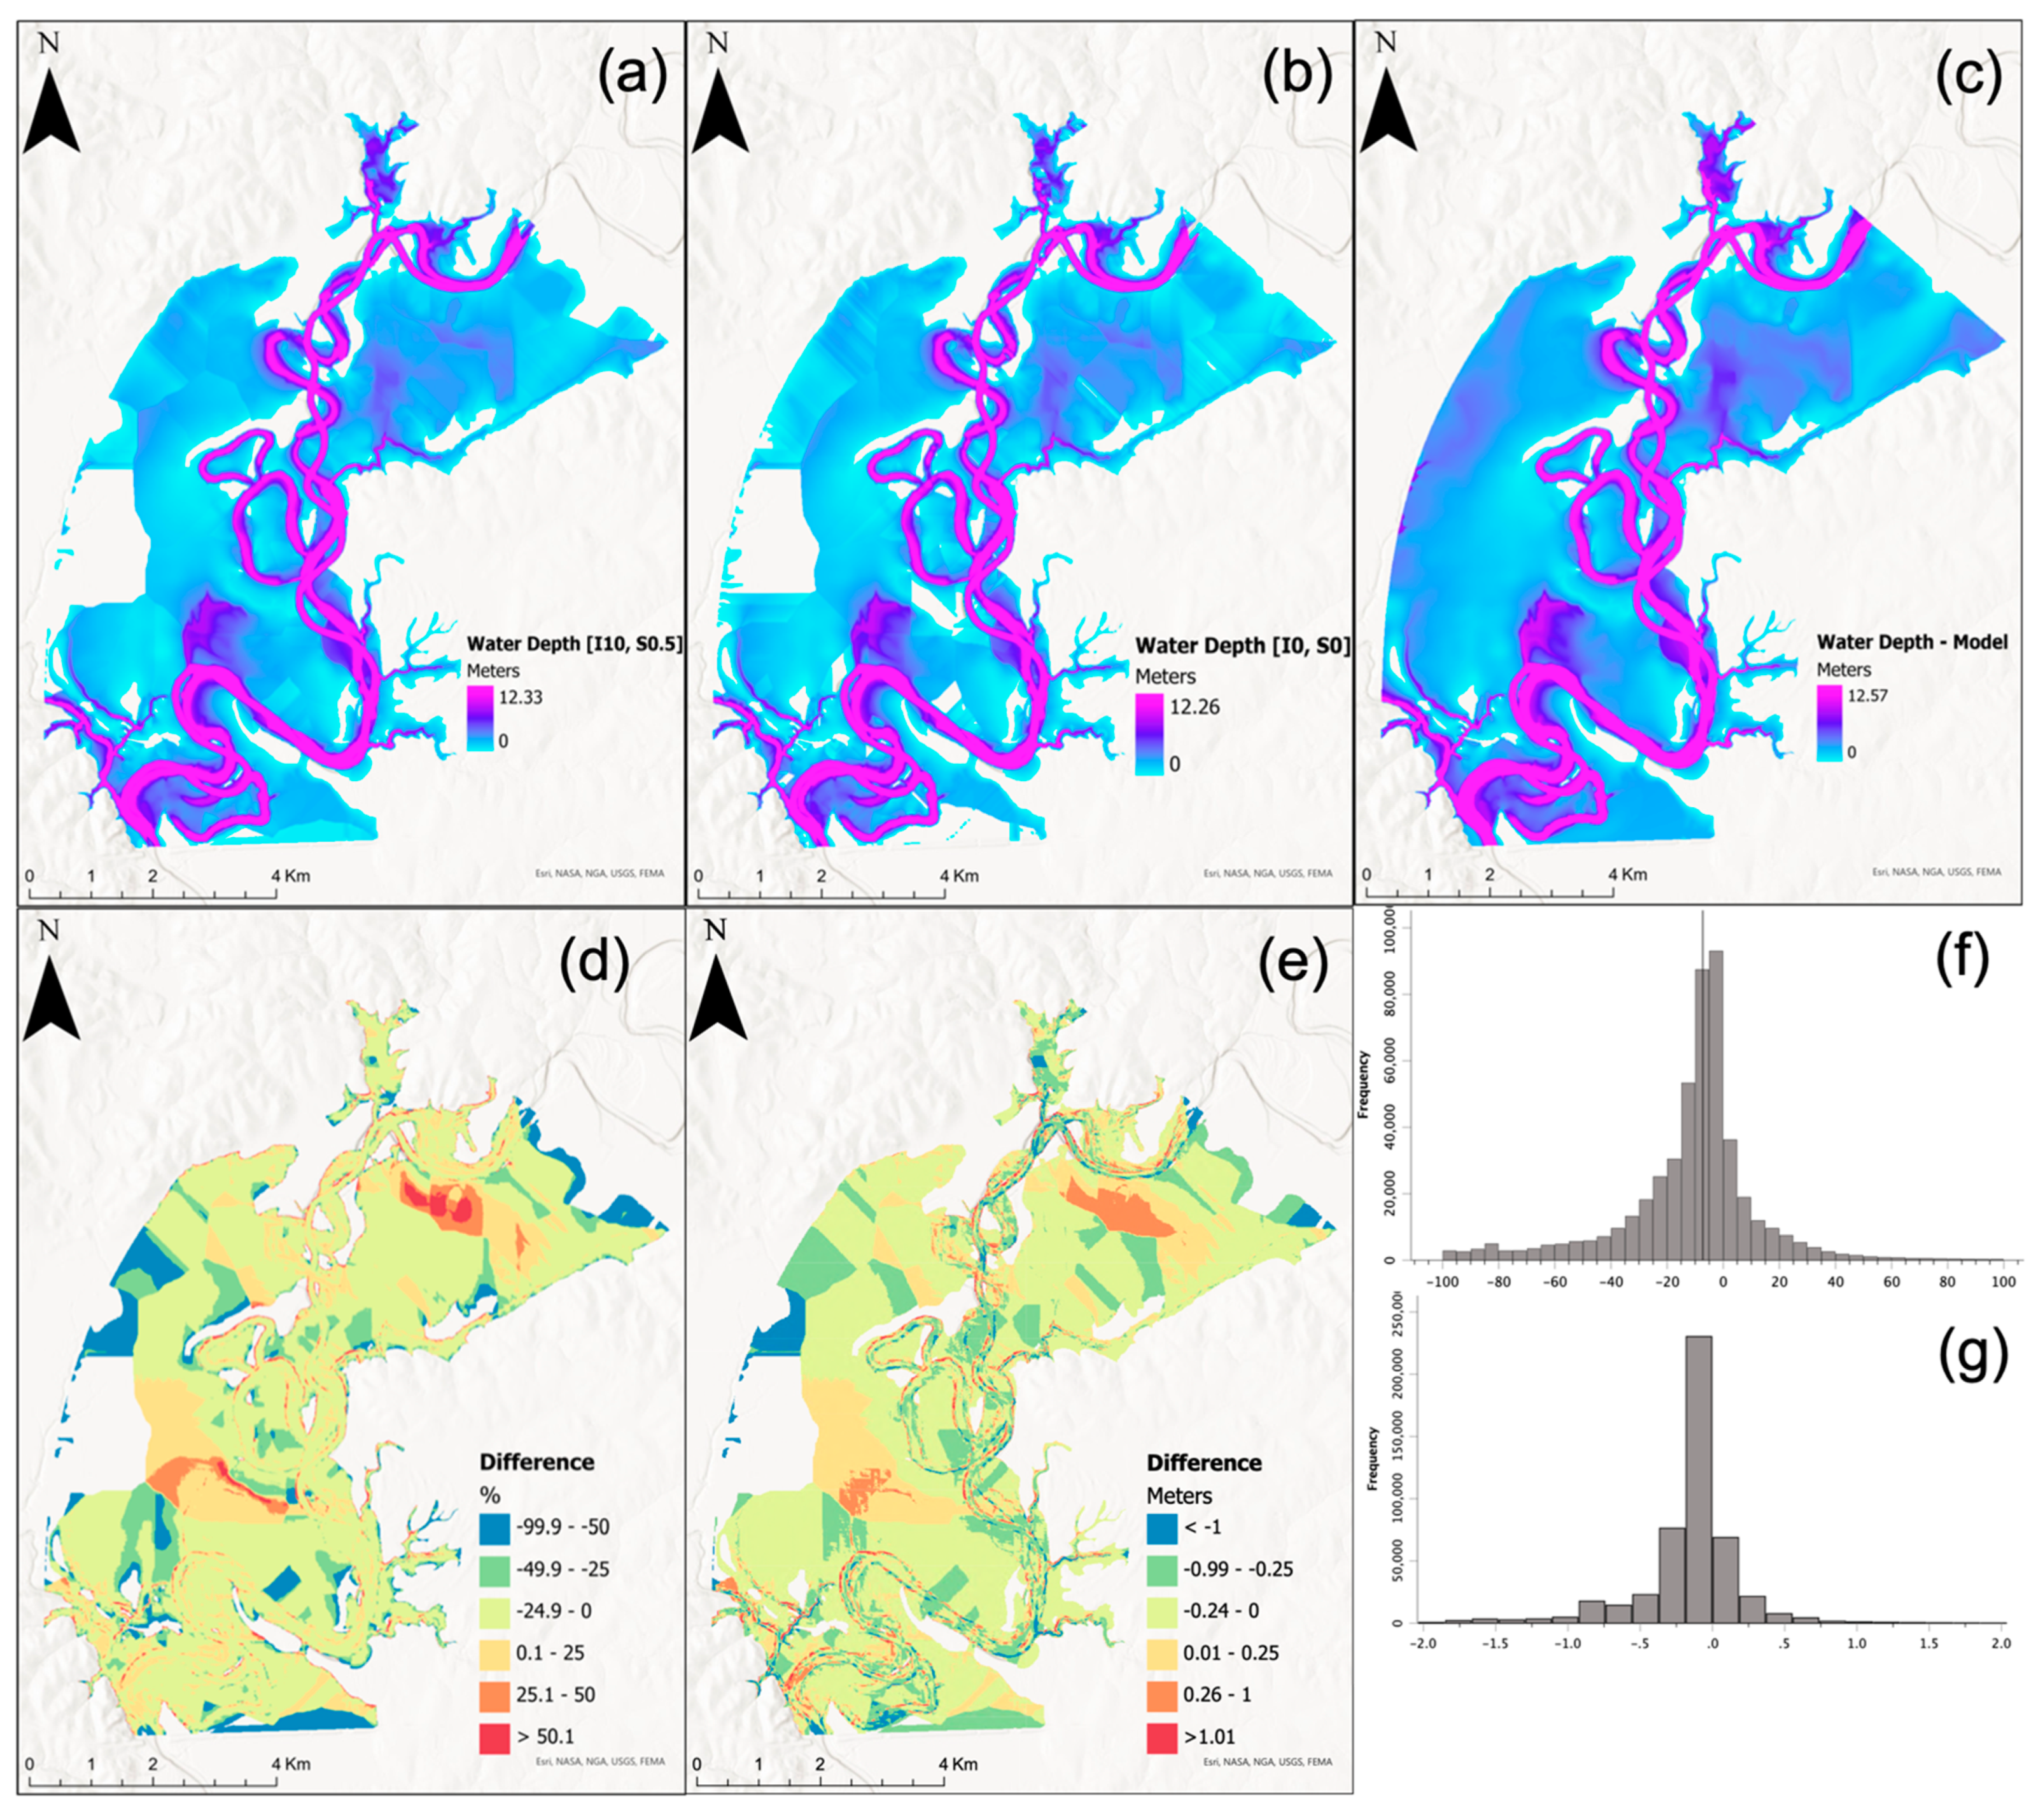
FwDET2.1 yielded strong results for the Brazos River case study, with an RMSE of 0.5 m and absPBIAS of 11% (Table 5). Unlike the 16 USGS FIM case studies, the Brazos benchmark water depth raster was simulated using the same 10 m NED DEM, offering a comparison that is more akin to FwDET’s intended application of using remote sensing-derived flood inundation maps. The results also show improvement for FwDET2.1 [I10, S0.5] over FwDET2.0 (FwDET2.1 [I0, S0]). Underpredictions are mostly along the flood domain boundary (Figure 6d,f), while overpredictions are along the river channel periphery and at locations further from the flood domain boundary. The histogram (Figure 6f,g) of the difference maps ([(FwDET v2.1–benchmark)/benchmark] and ([FwDET v2.1–benchmark]; Figure 6d,e respectively) shows a sharp peak (leptokurtic), indicating that most of the domain had small biases. FwDET2.1 yielded a smoother water depth map compared to FwDET2.0 (Figure 6a,b, respectively). This is important as visualization and qualitative quality assessment can be quite crucial for the adoption of FwDET for operational uses.

Table 5.
Comparison statistics for the Brazos River case study for FwDET2.1 using 0 iterations and 0 slope [I0, S0] (equivalent to FwDET2.0; optimal NED results) and 10 iterations and 0.5 slope [I10, S0.5] (overall optimal) values.
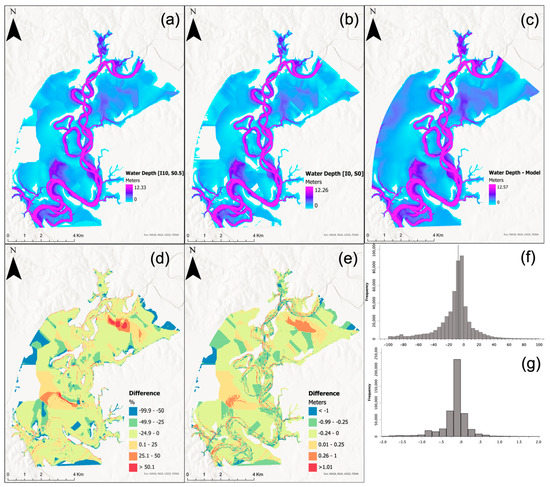
Figure 6.
The May 2016 flood event for the Brazos River (Texas) case study: (a) FwDET2.1 [I10, S0.5] calculated floodwater depth; (b) FwDET2.0 [I0, S0] calculated floodwater depth; (c) benchmark water depth map (hydraulic simulation); (d) percent difference map [100([FwDET v2.1]–benchmark)/benchmark] (negative values are underpredictions by FwDET2.1); (e) difference map ([FwDET v2.1]–benchmark) (negative values are underpredictions by FwDET2.1); (f) histogram of grid-cell values of the percent difference map (%); (g) histogram of grid-cell values of the difference map (meters).
3.4. Remote Sensing Application Case Study
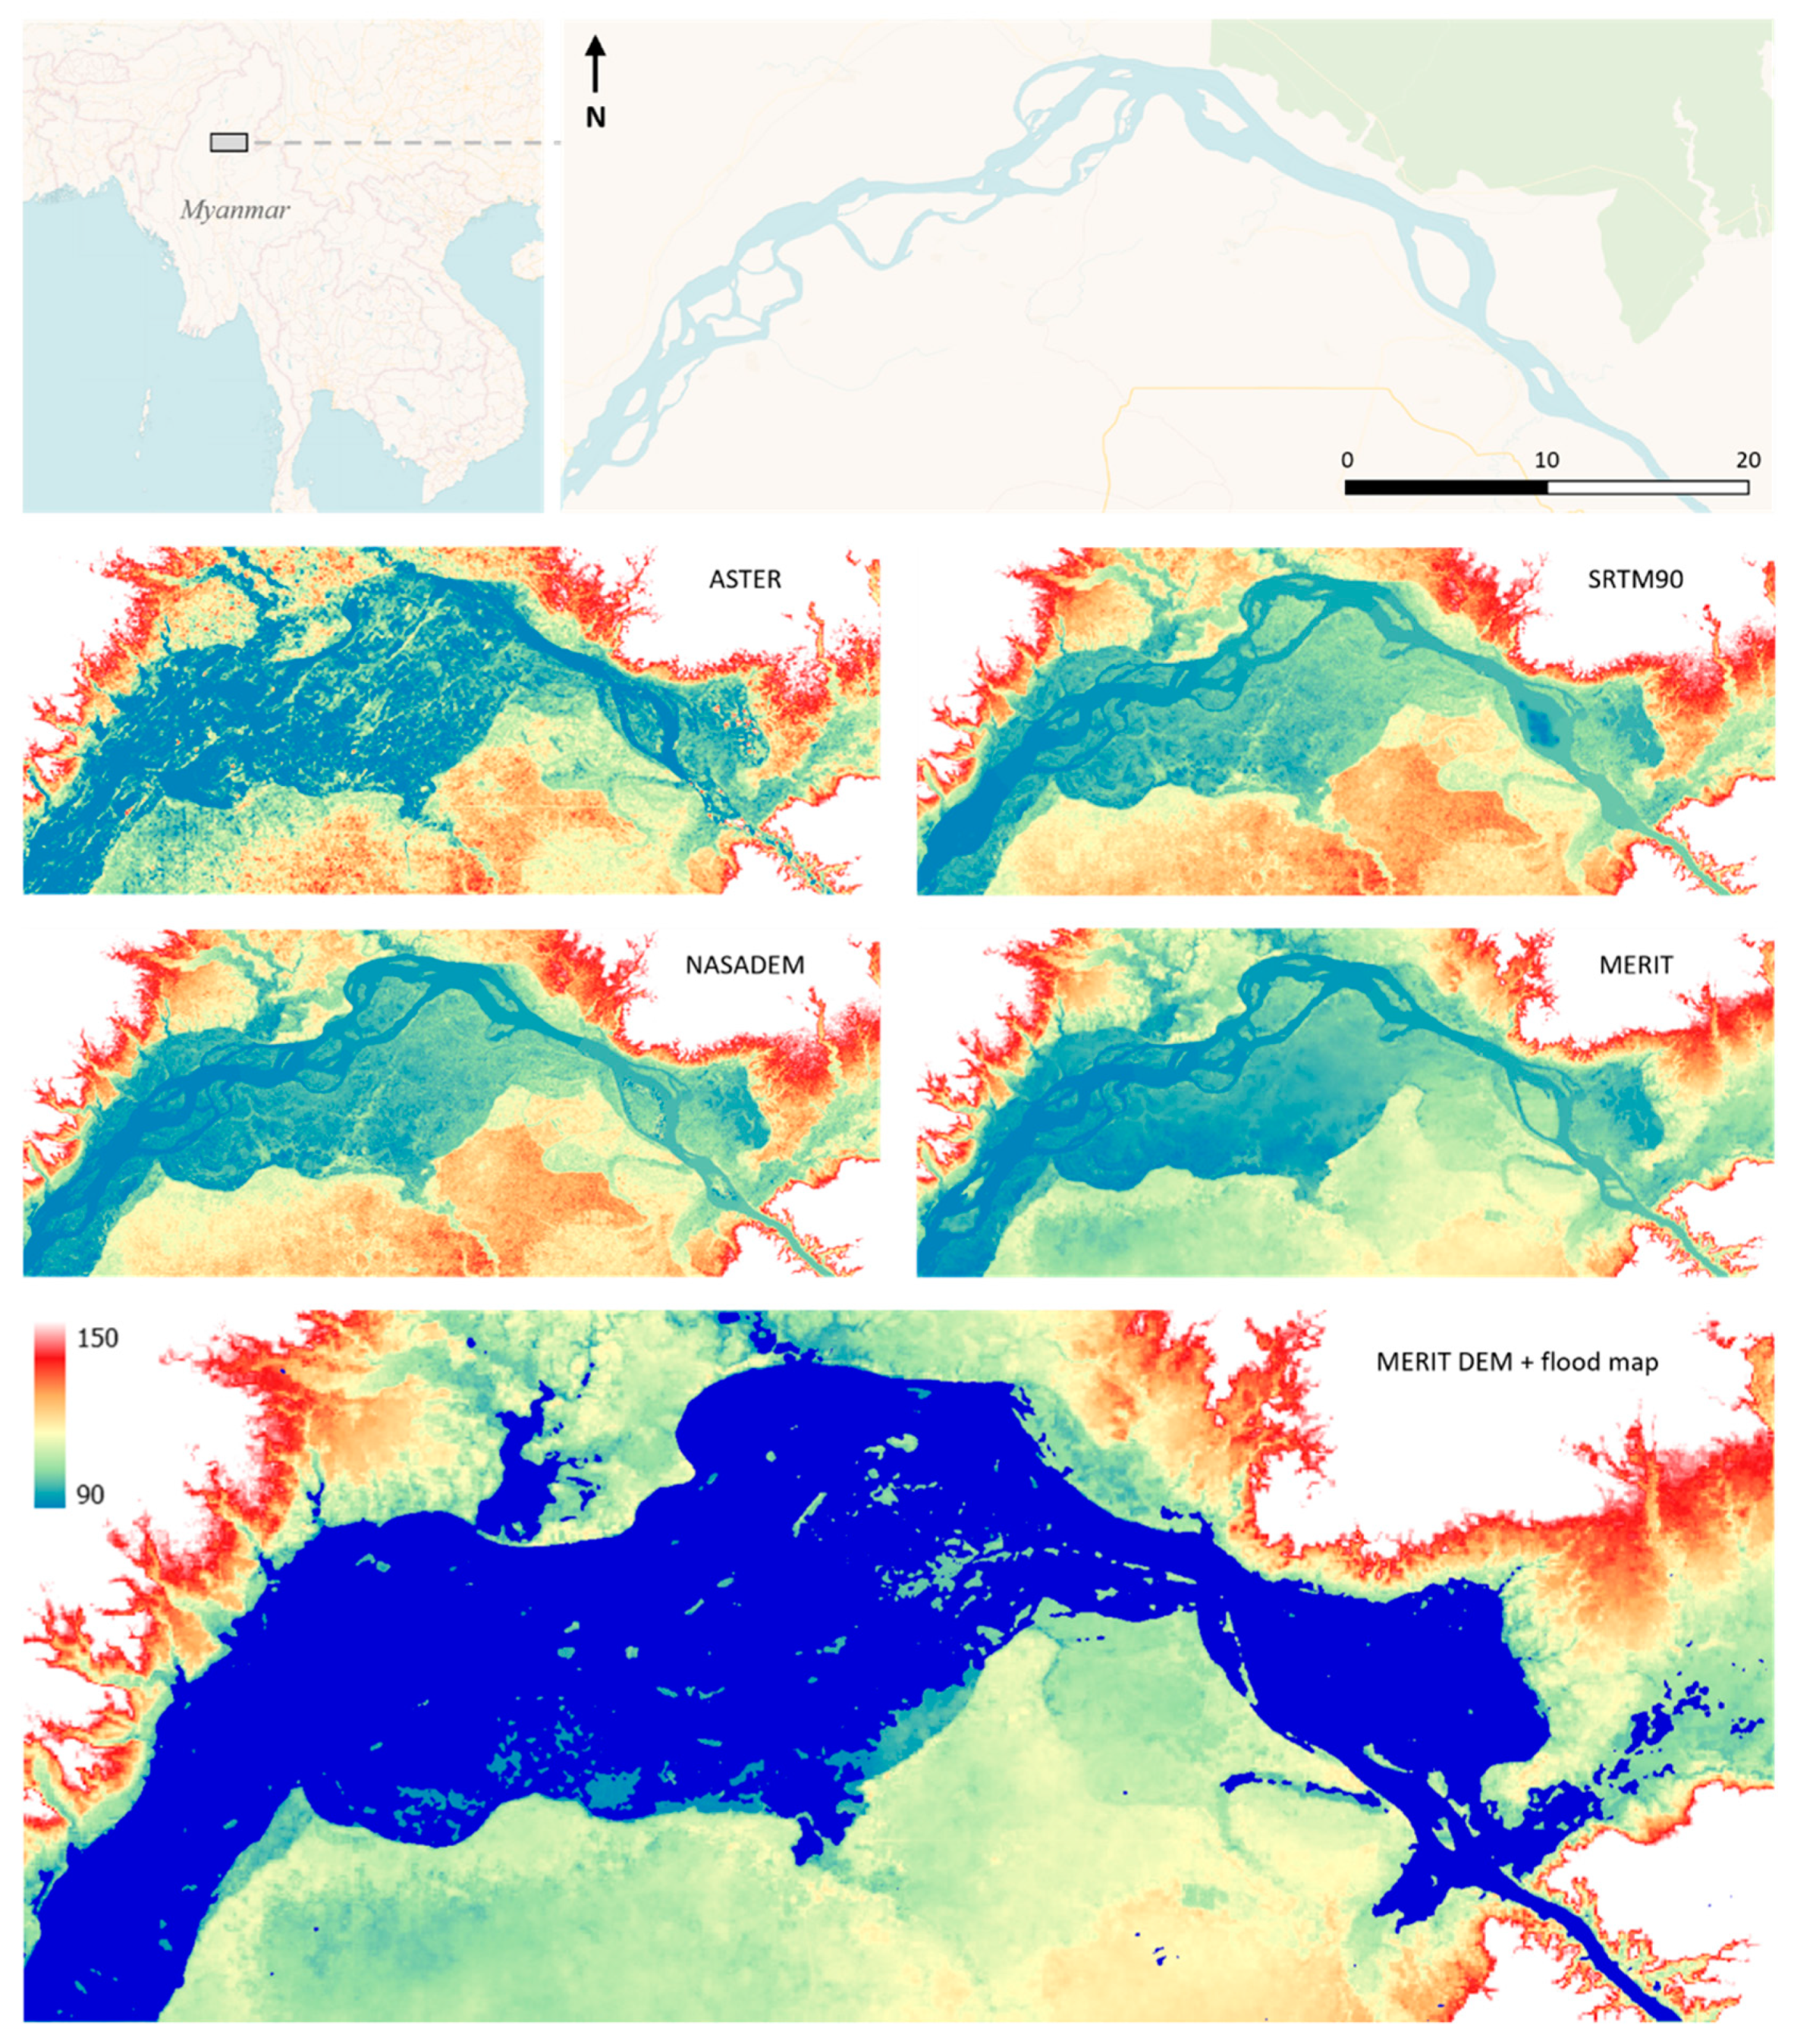
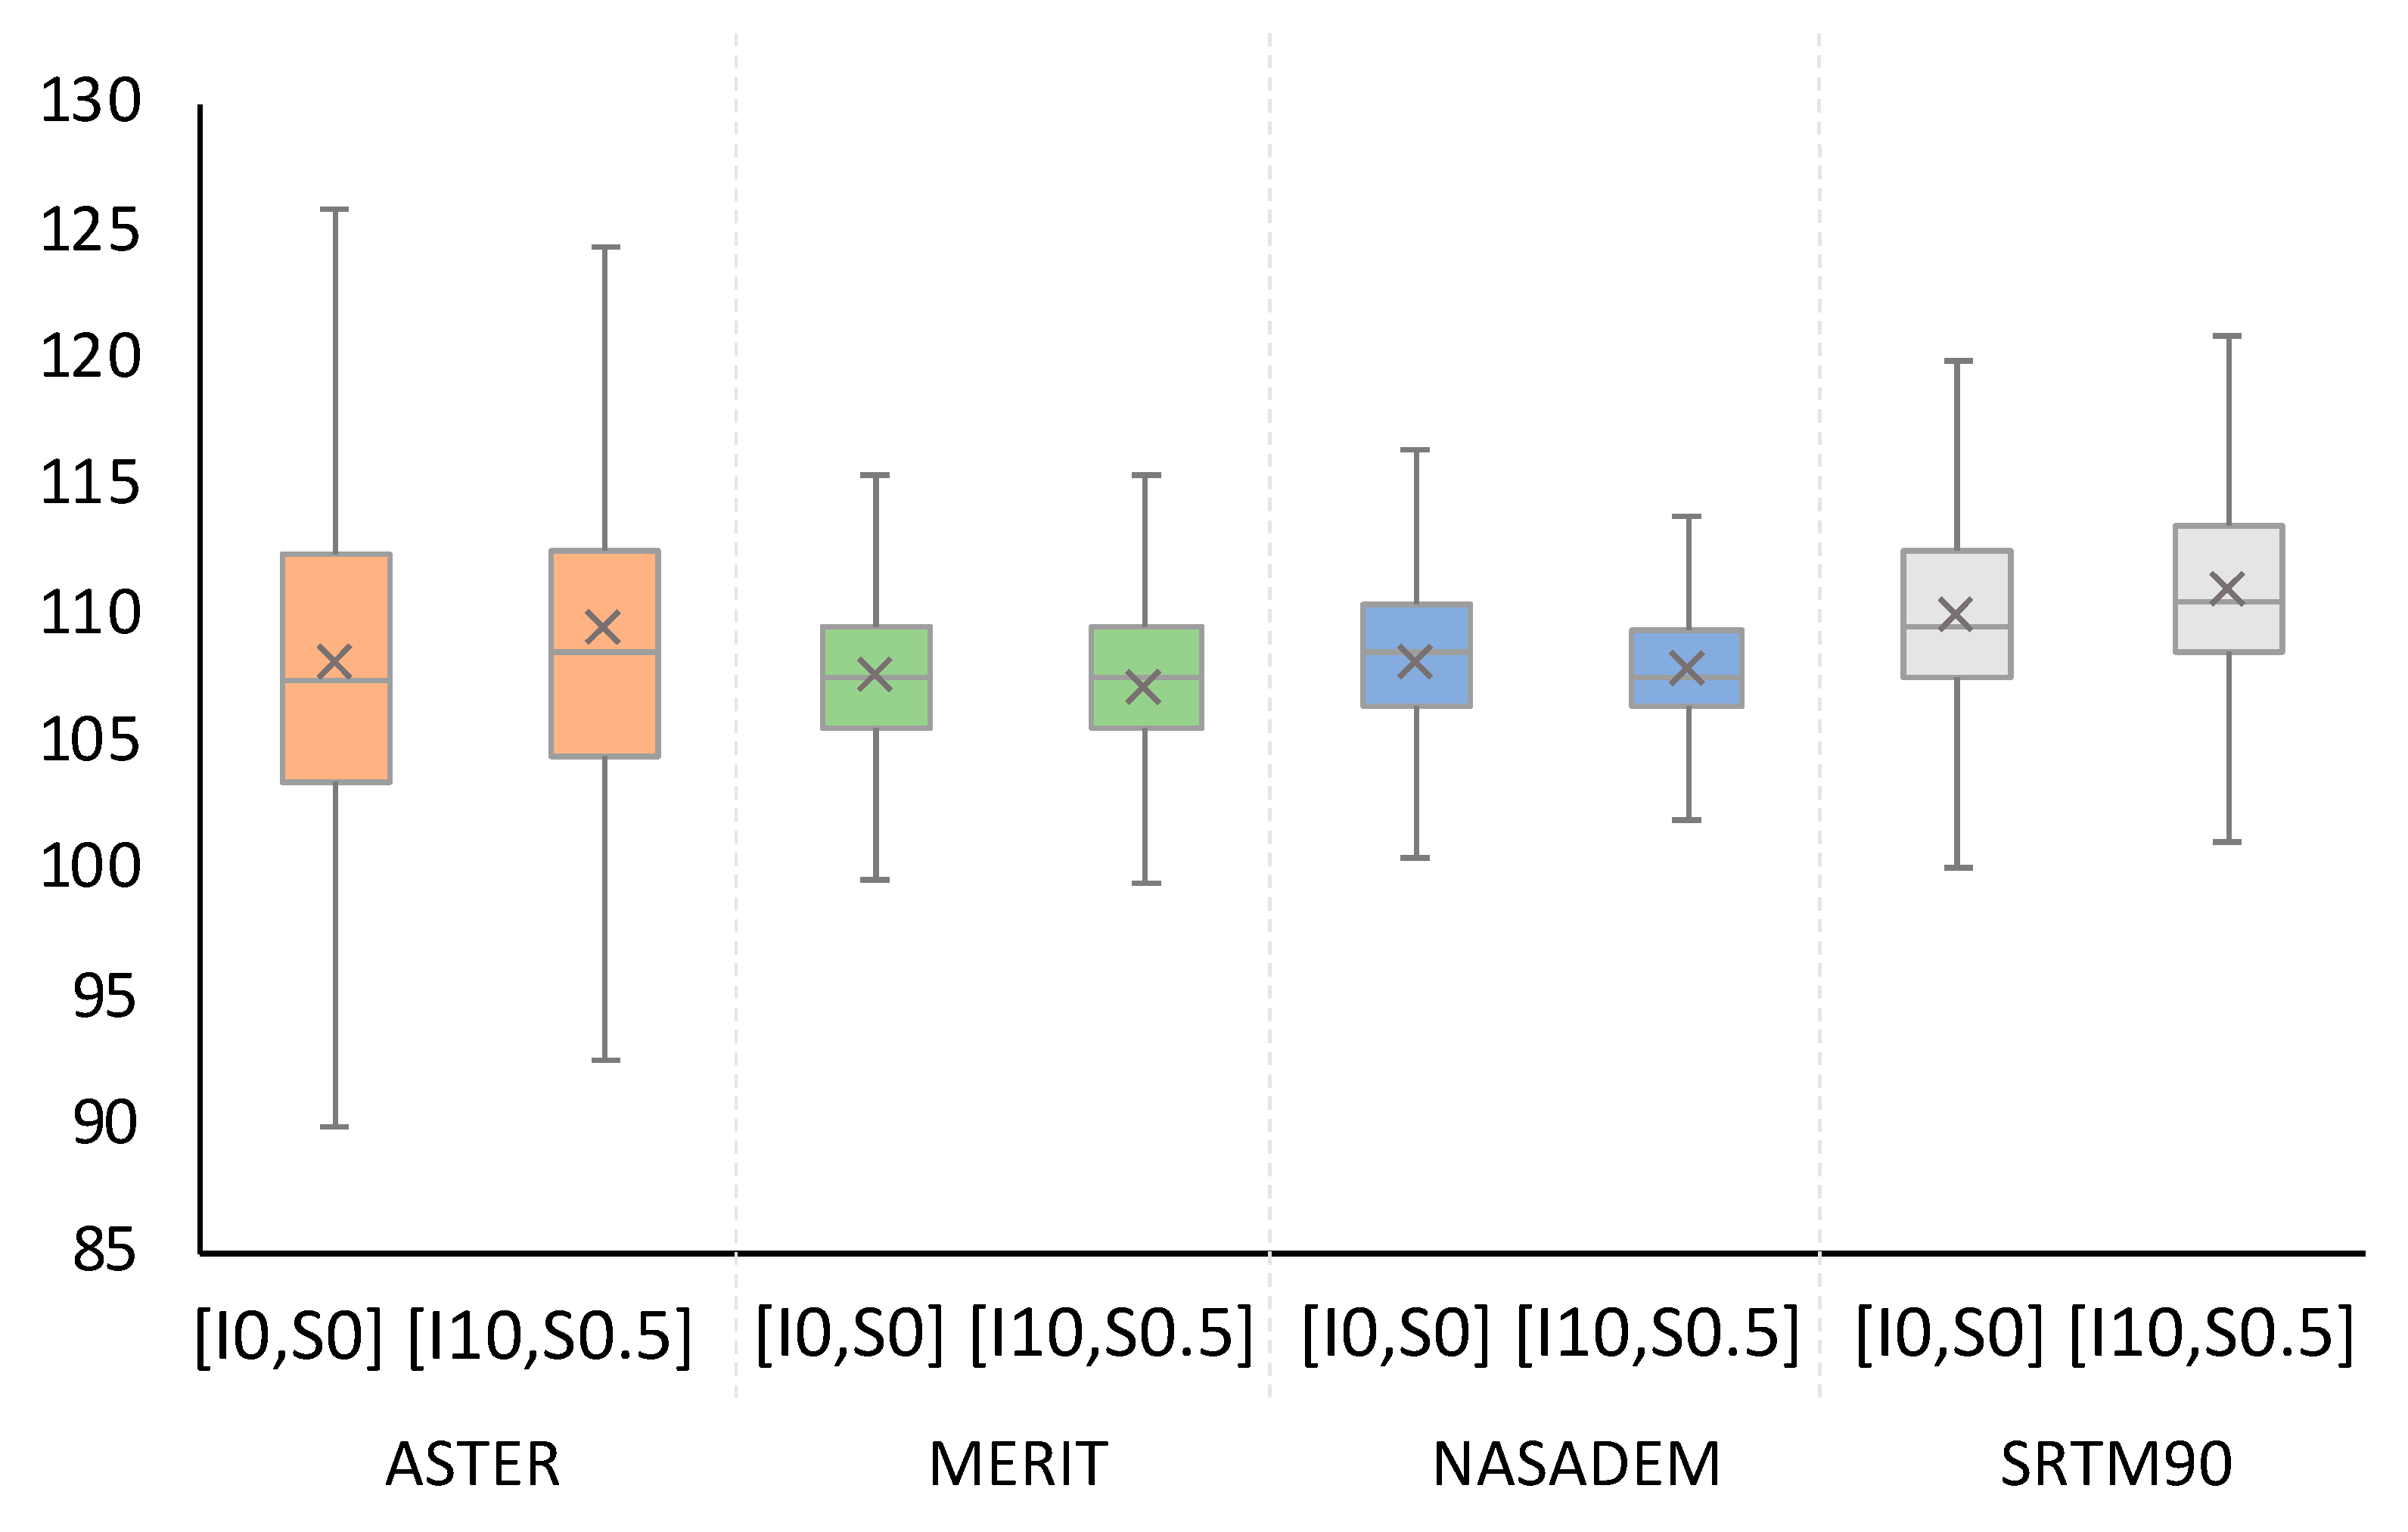
The location of the Irrawaddy River case study, the DEMs for this area, and the flood map derived from Sentinel-1 are shown in Figure 7. Figure 8 shows water level statistics over the entire flood domain, as calculated by FwDET2.1. The spread of water levels is highest with ASTER, followed by SRTM90, and is lower with both MERIT and NASADEM. [I10 S0.5] slightly reduces the spread compared to [I0 S0] for all DEMs. While the patterns between the different DEMs stay roughly the same, MERIT resulted the lowest spread in both cases. The interquartile range (Q3–Q1) for NASADEM and MERIT is within 5 m, which is reasonable for this area (over a length of roughly 60 km, the river drops approximately 8 m based on MERIT, as discussed in detail later). The full range of water level values (max-min) is large, being over 35 m for ASTER at [I0 S0], while the smallest range, found for MERIT at [I10 S0.5], was just below 15 m. These ranges are likely unrealistic. However, errors in the DEMs themselves, which, in a tropical mountainous area like this, can be in the order of 10–20 m [13,16,23] will likely have contributed to these biases.
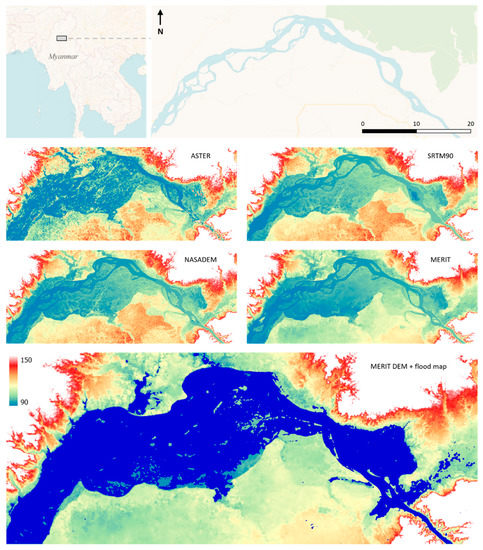
Figure 7.
Region of interest for remote sensing case study; upstream Irrawaddy River in Myanmar (river flow is from east/right to west/left), including the four DEMs used for this case study and a flood map derived from Sentinel-1 imagery of 16 July 2019, overlaid on the MERIT DEM.
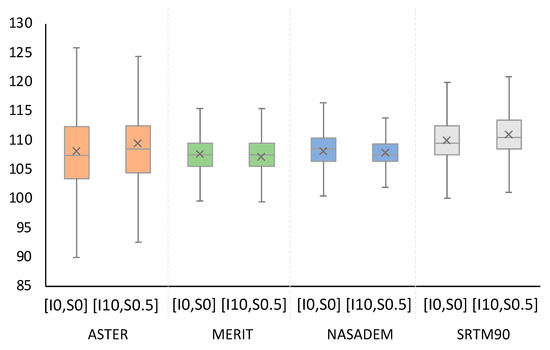
Figure 8.
Water level (in meters) statistics in the form of boxplots (showing min, max, mean, Q25, Q50, and Q75) calculated from FwDET results on the four DEMs and 16 July 2019 flood map.
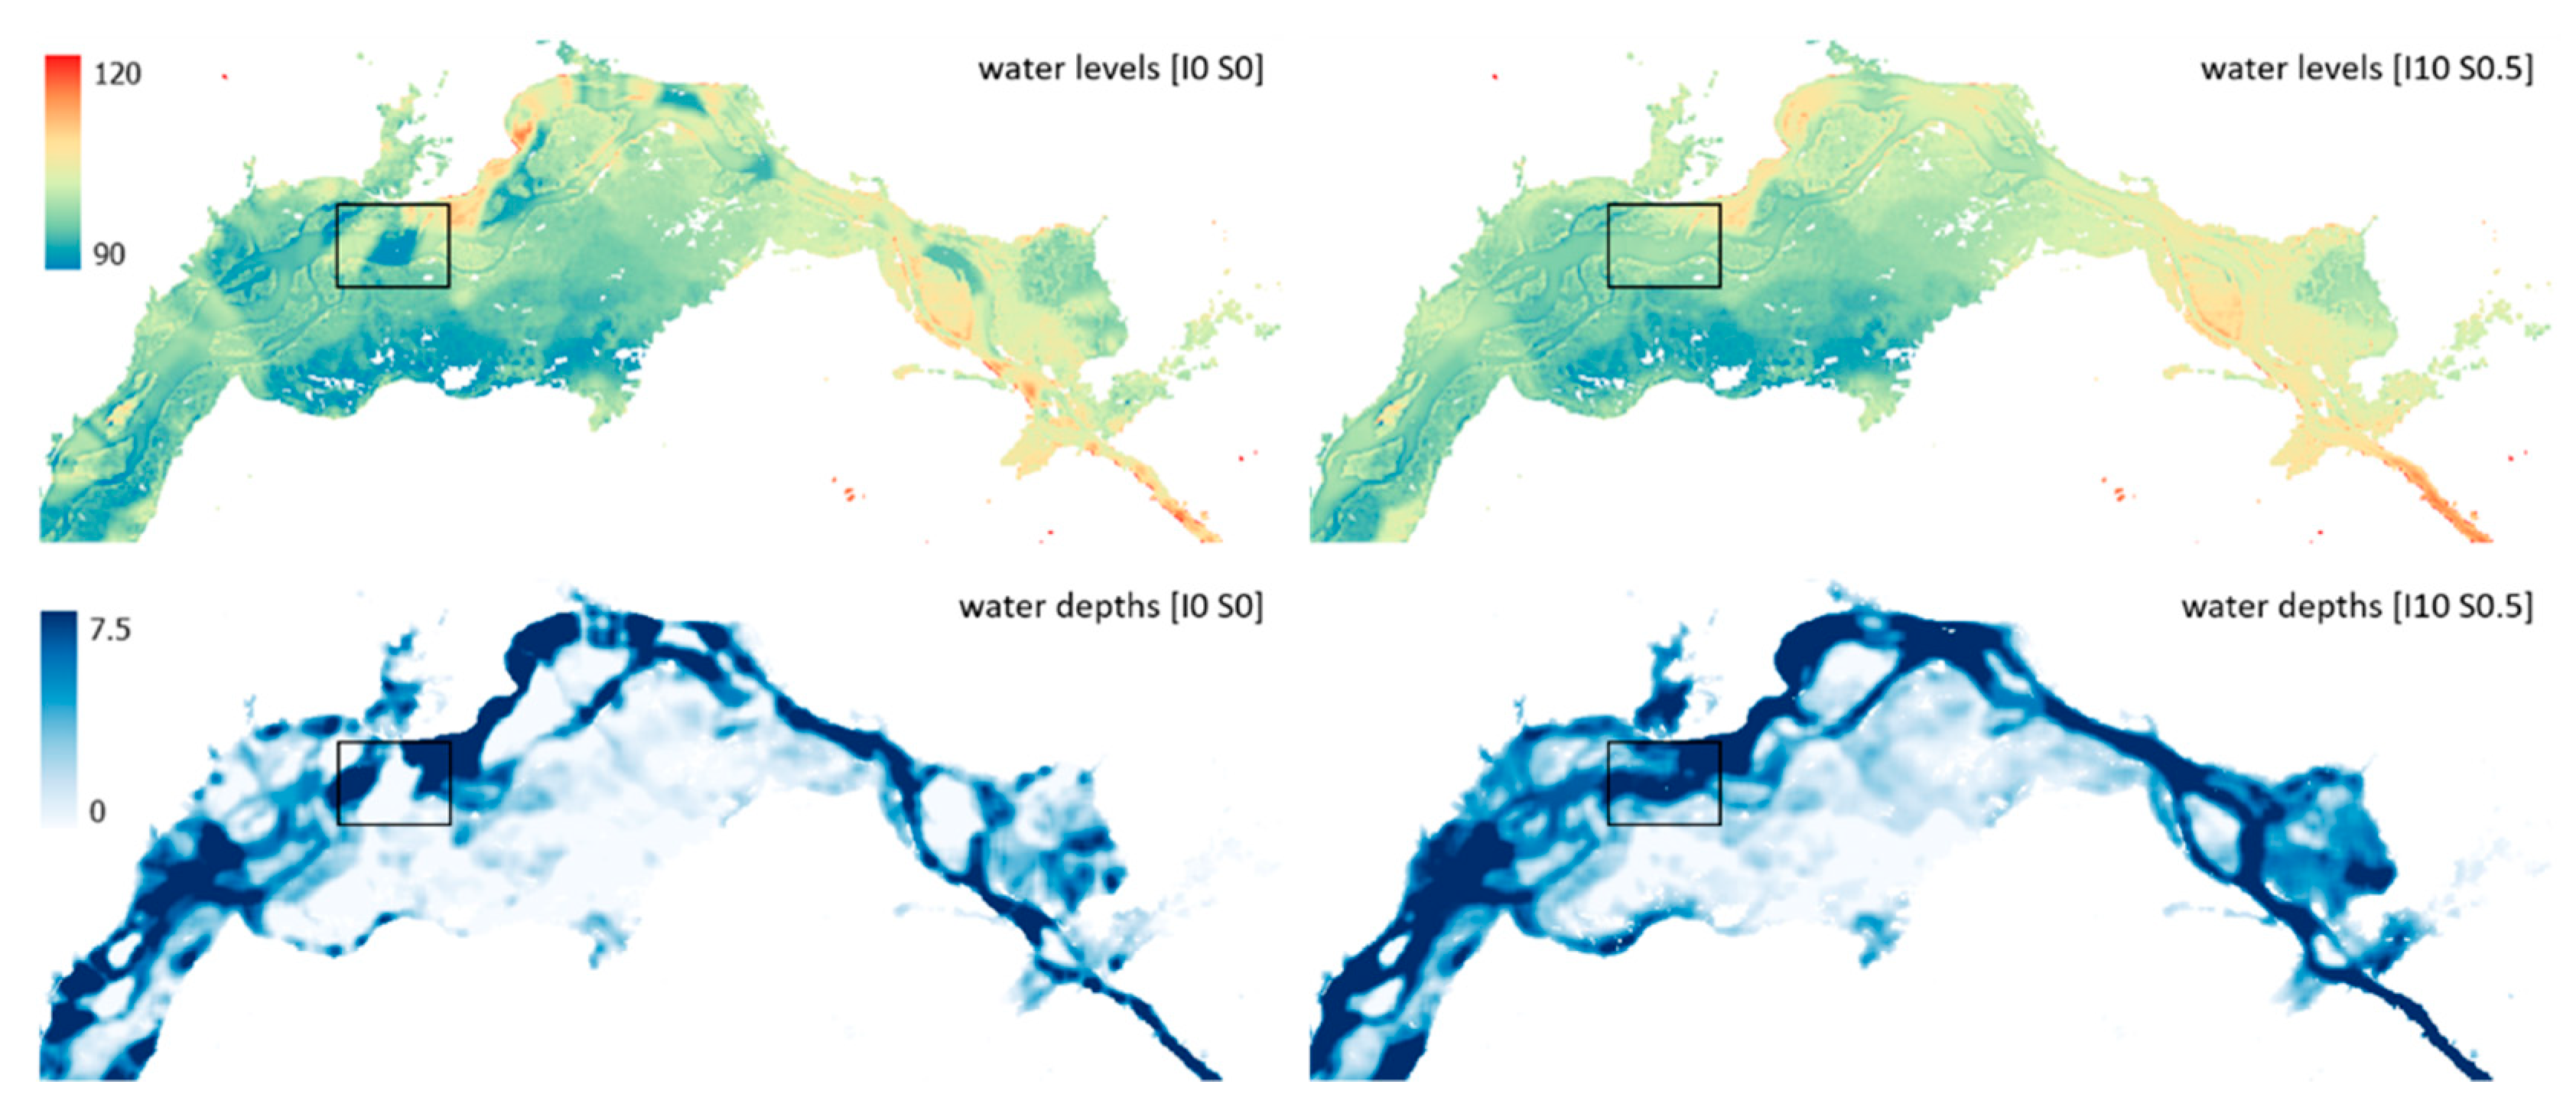
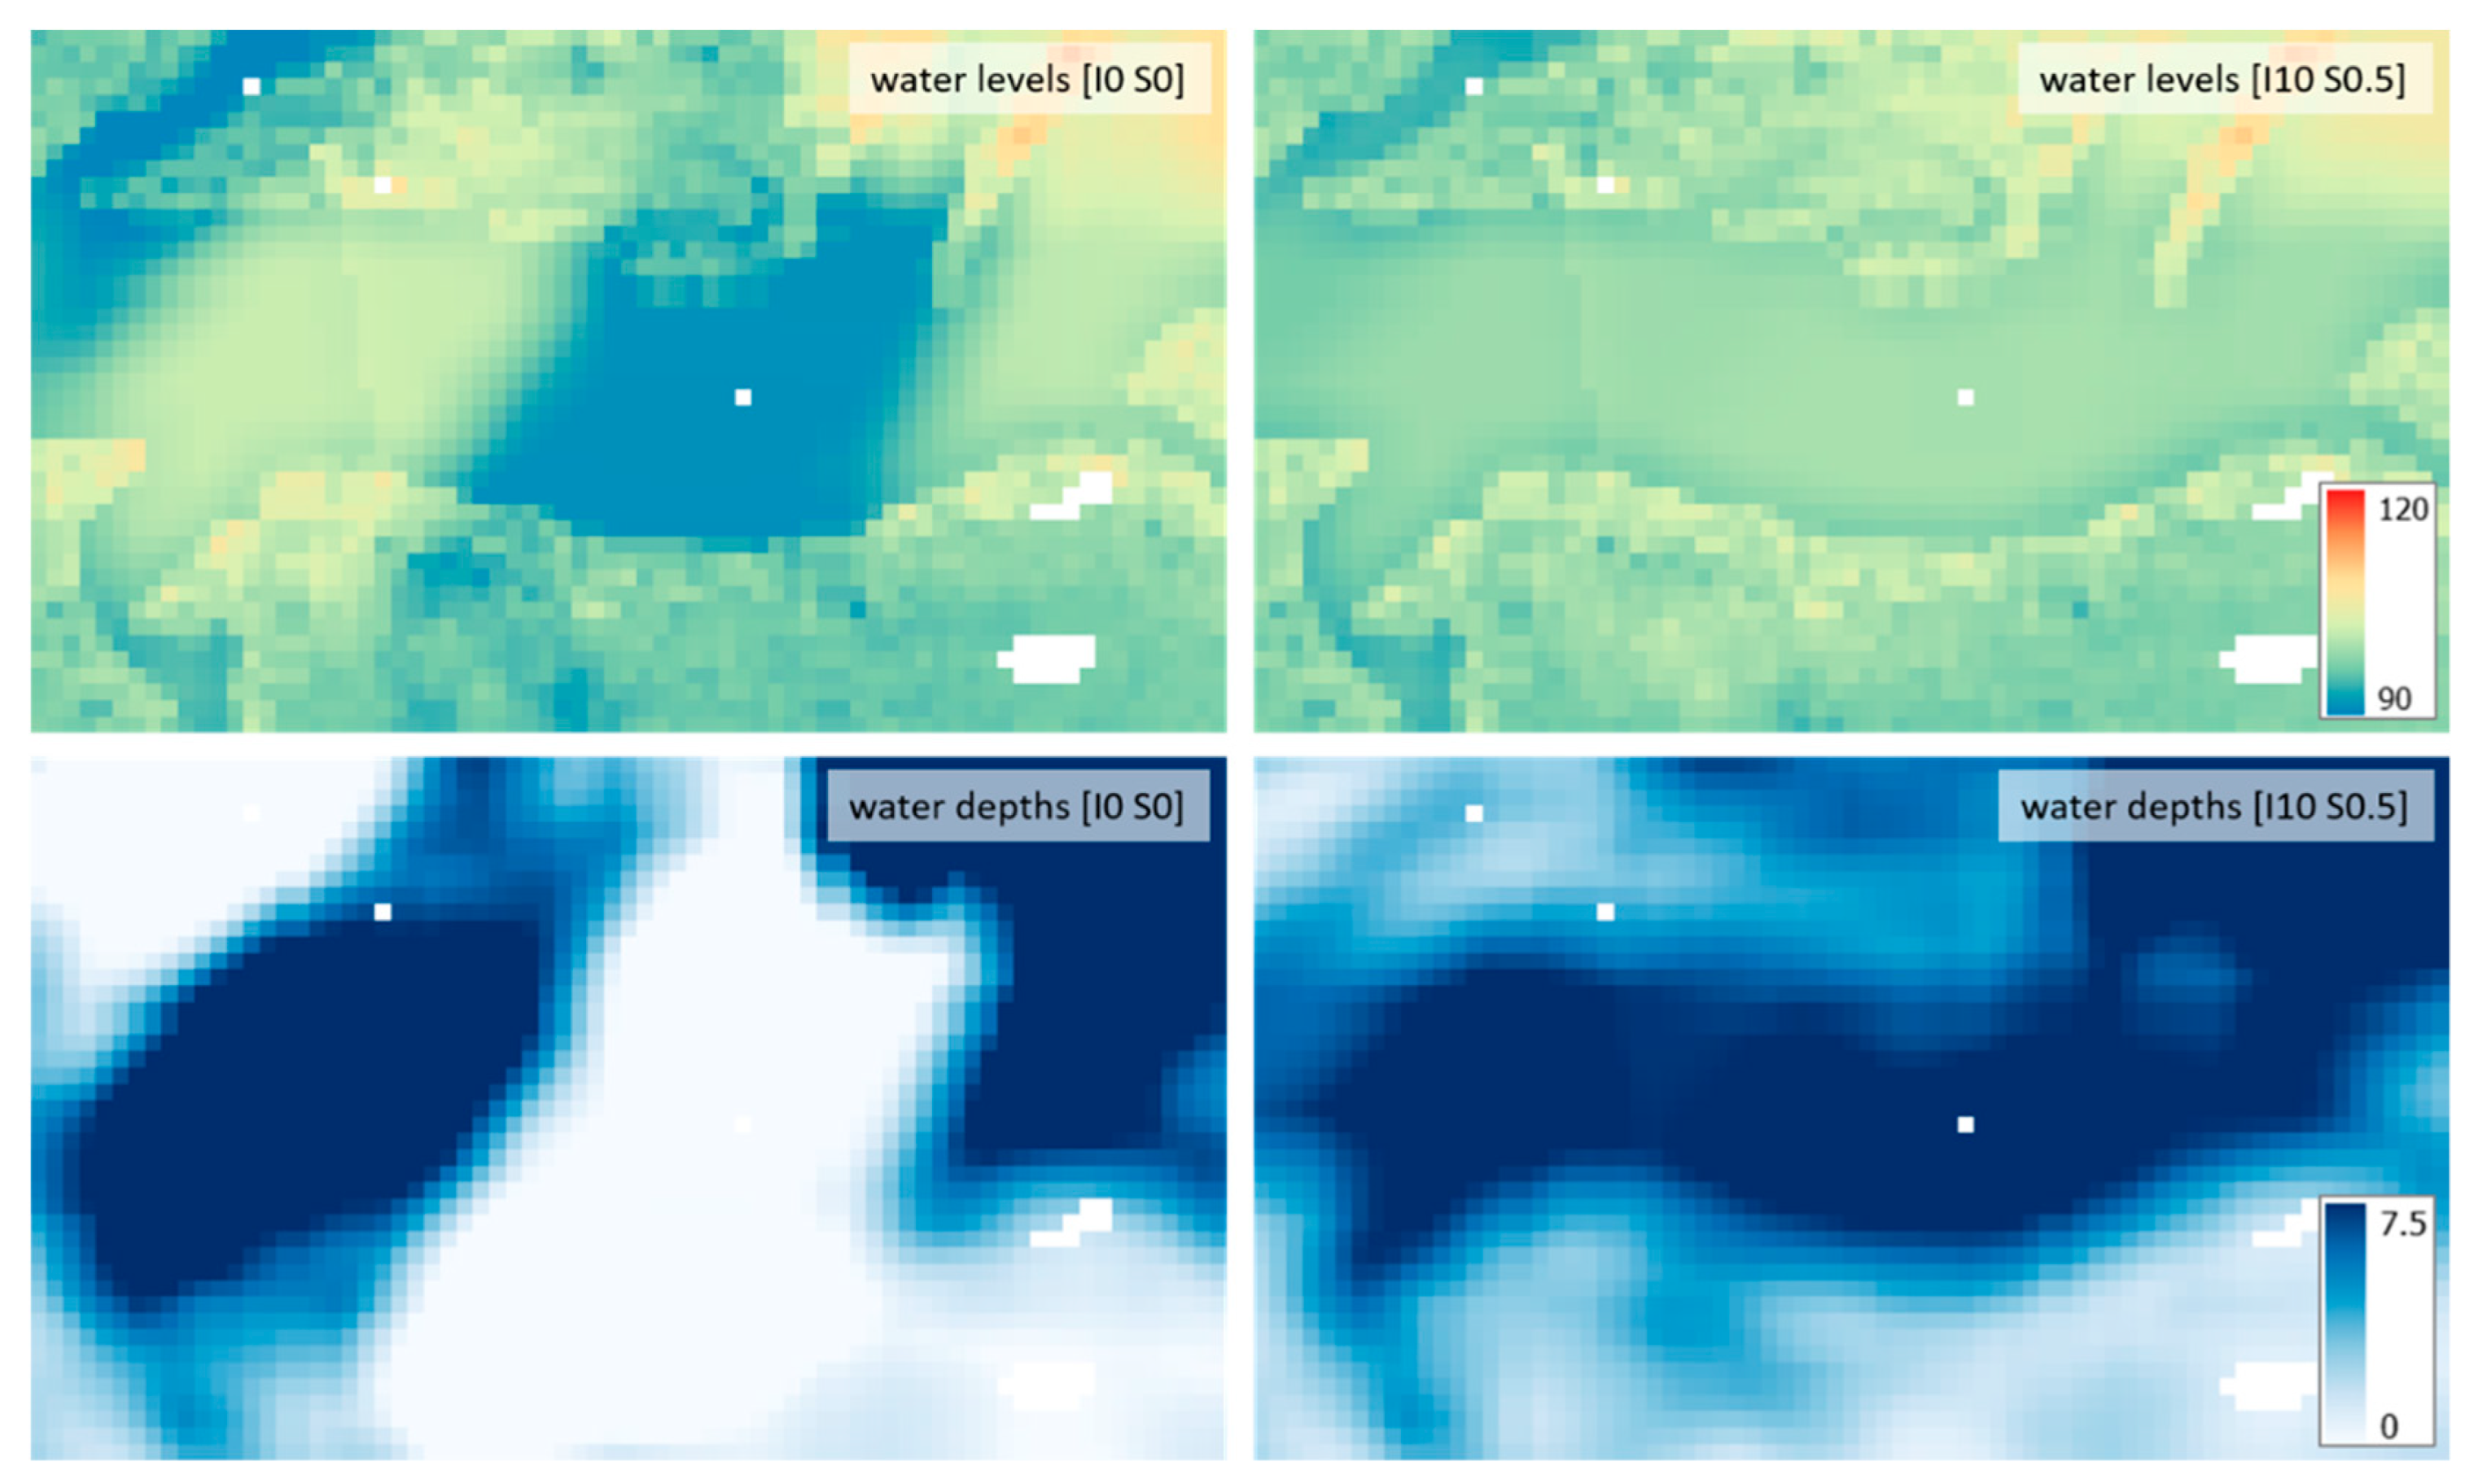
With MERIT performing well for this case study, as well as in the previous tests over the USA, we focus on this DEM for a more in-depth analysis (Figure 9). At first glance these maps might seem roughly similar, but a closer look reveals the [I10 S0.5] map showing improvements over various sections; especially along and near channels, but also at some locations further away from the river. The [I0 S0] map has more hydrologically disconnected areas or abrupt changes in depths, which both occur less in the [I10 S0.5] map. This is exemplified over the highlighted area, for which results are shown in Figure 10 (see also the longitudinal profile in Figure 11. For this area, the effect of a ‘gap’ in the flood map, situated where the river is located within the DEM (and thus having a low elevation value) is clearly visible. This gap is identified as an edge within FwDET and consequently, its elevation value is used as water level, propagating outwards from the individual pixel, resulting in an area of zero water depth within the river and the surrounding floodplains. The issue is largely resolved in [I10 S0.5], where filtering of these boundary cells resulted in a more continuous water level and depth values. However, without any validation data, we cannot determine whether these results are close to the actual water depth values over this area.
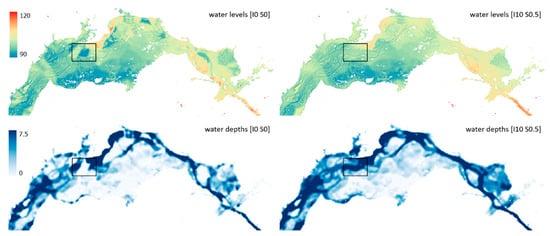
Figure 9.
Results of FwDET2.1 using MERIT DEM and flood map derived from Sentinel-1 imagery of 16 July 2019. The location of an area with substantial changes between the two FwDET2.1 settings ([I0 S0] and [I10 S0.5]) is highlighted in each image and will be described in more detail further down.
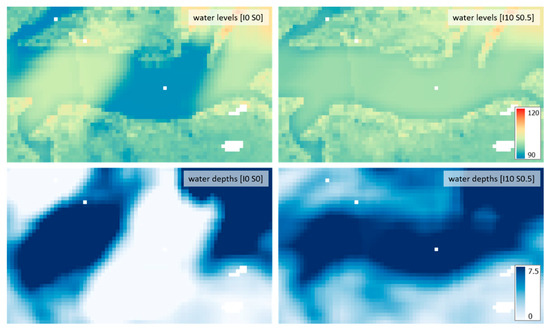
Figure 10.
Results of FwDET using MERIT DEM and flood map derived from Sentinel-1 imagery of 16 July 2019, for the area highlighted in Figure 9. The effect of a ‘gap’ in the flood map, situated where the river is located within the DEM (and thus having a low elevation value) is clearly visible. The issue is largely removed in [I10 S0.5], with the river now having more continuous water depth values.
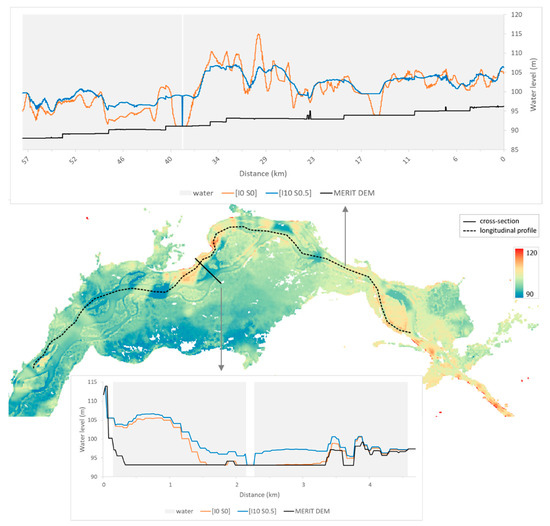
Figure 11.
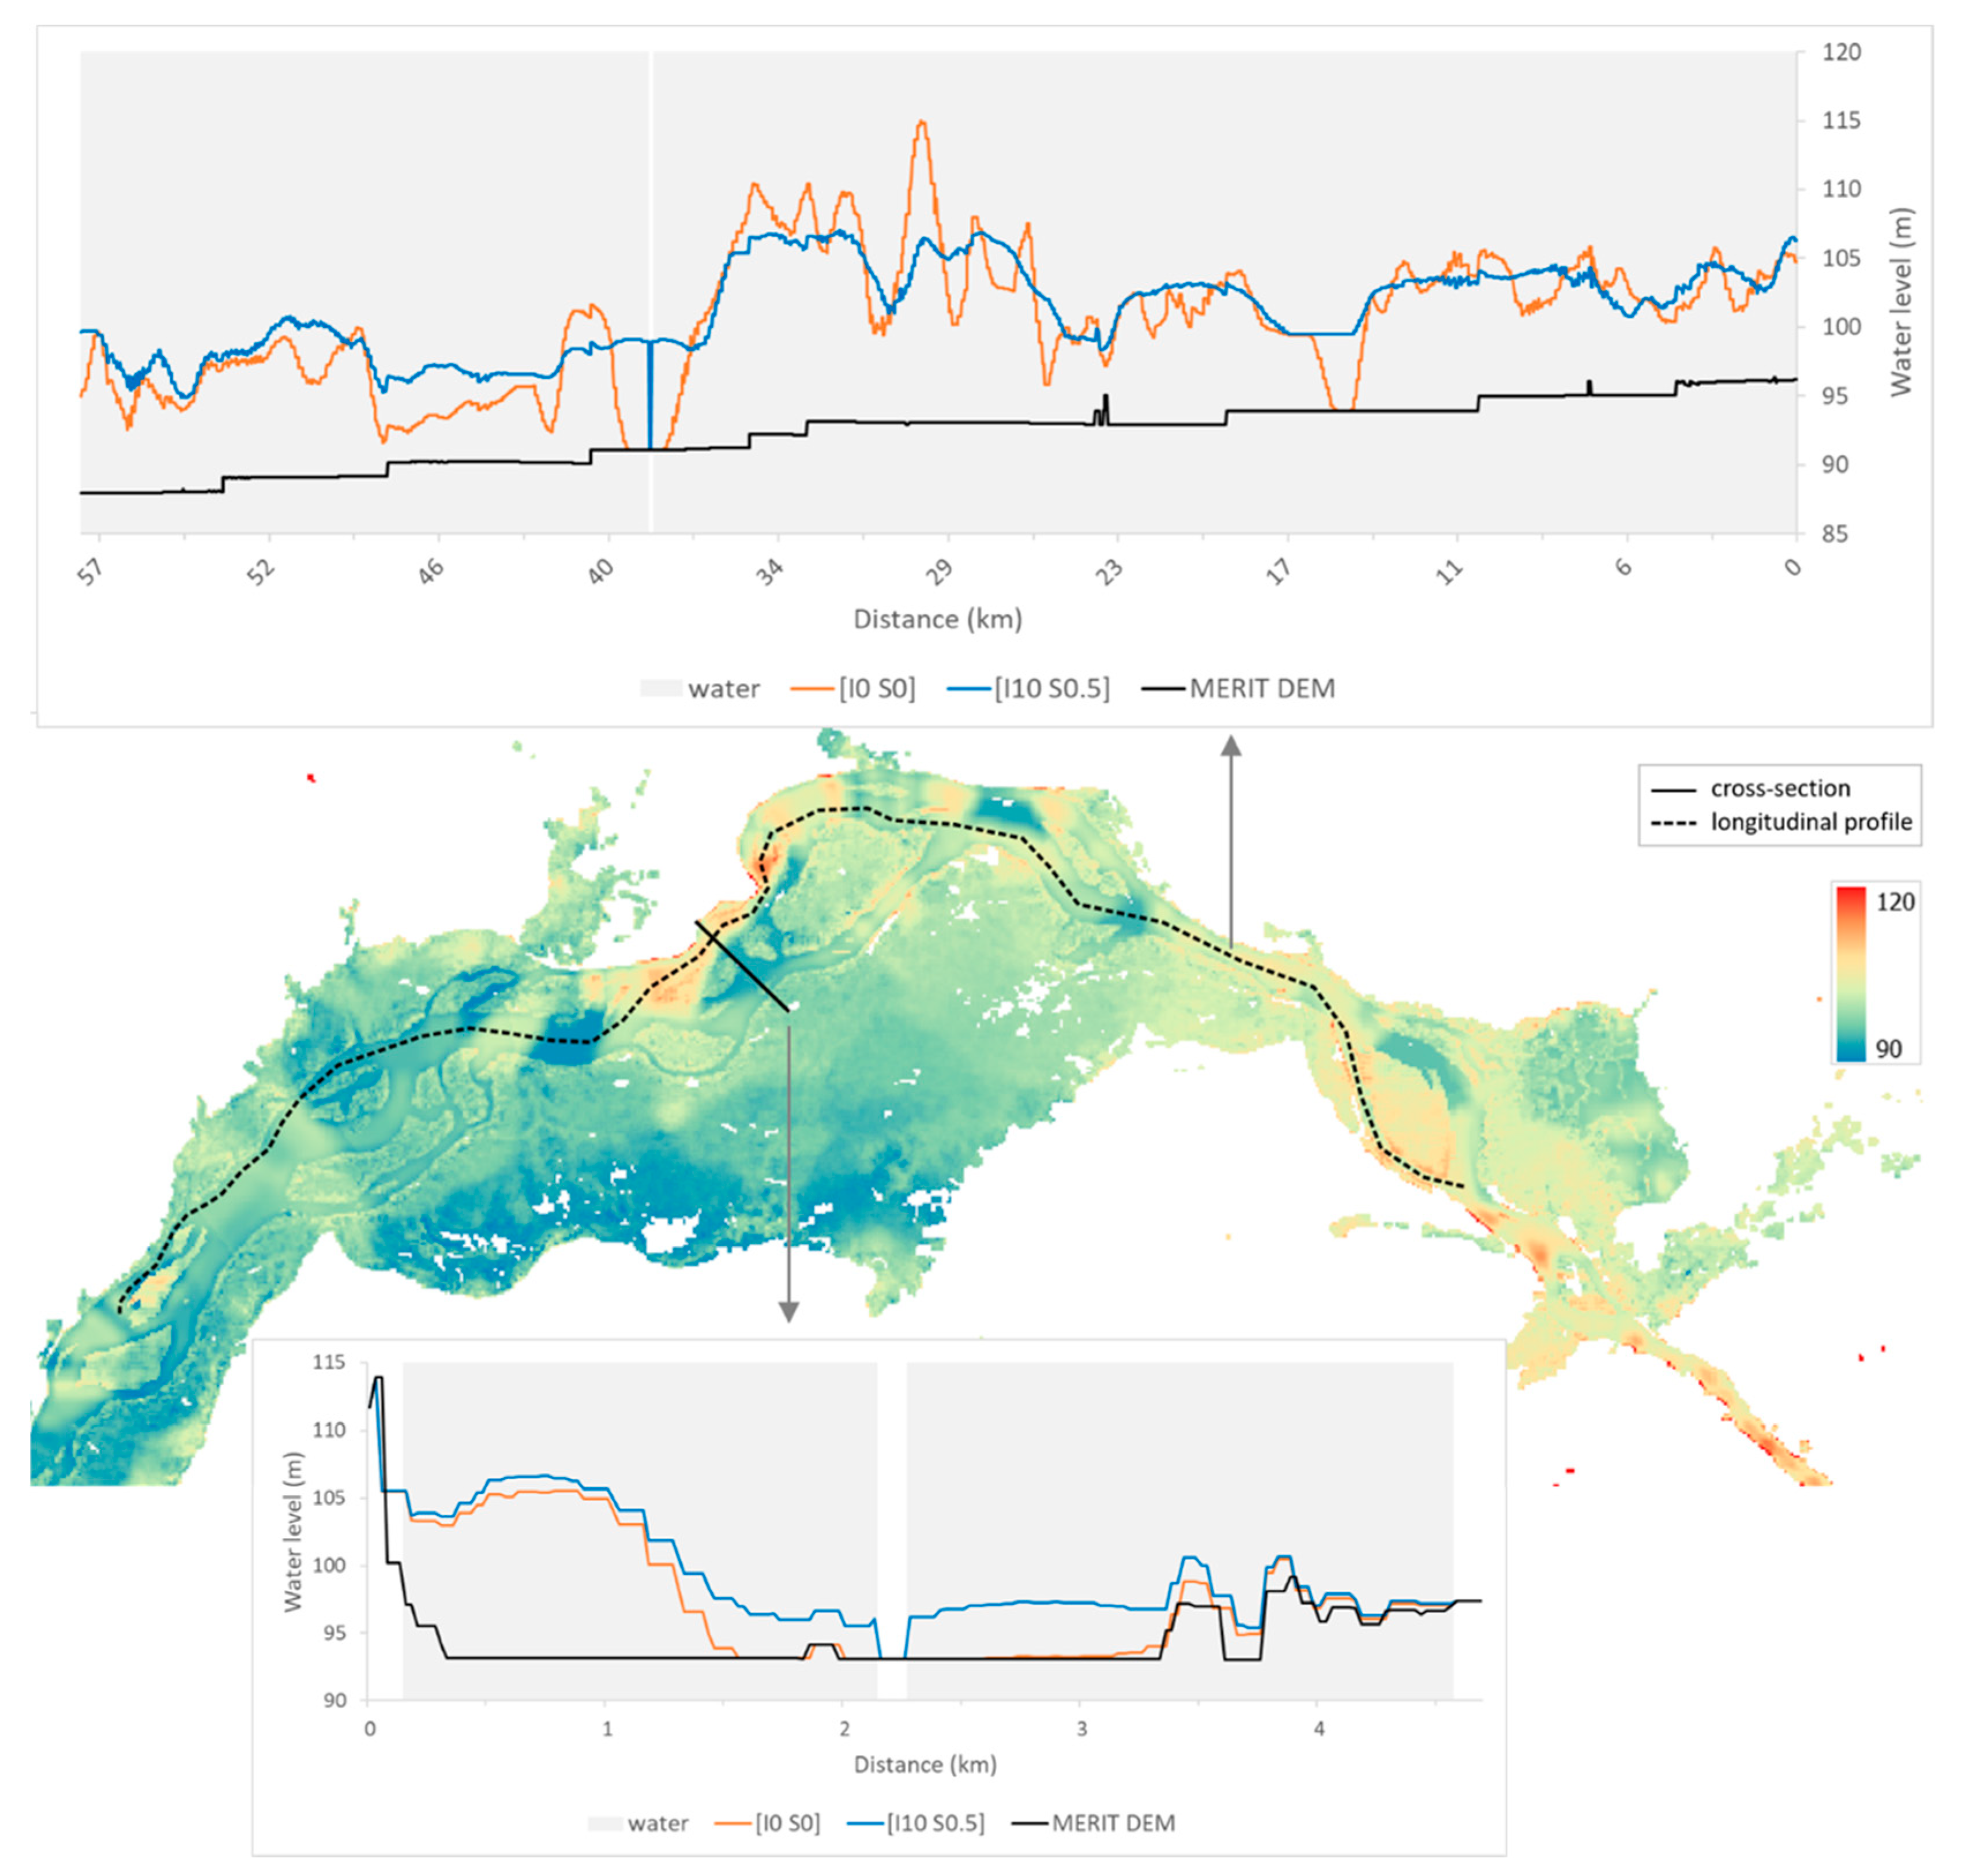
Longitudinal (top) and cross-section (bottom) profiles of the results of FwDET using MERIT DEM and flood map derived from Sentinel-1 imagery of July 16, 2019. The map shows water level results from FwDET2.1-GEE [I0 S0].
When viewing the cross-section and longitudinal profiles of FwDET’s results using MERIT (Figure 11), we see a similar picture: [I10 S0.5] gives more continuous and less variable water levels than [I0 S0]. The effects of flood map gaps for [I0 S0] can also be seen here, as the water levels at these locations are the same as the DEM height (resulting in zero depth) and this propagates outwards on both ends (effectively dragging water levels down towards these gaps). The longitudinal profile includes a single pixel gap within the main river channel just before km 40 (which is the same gap as shown in the highlighted area), where [I10 S0.5] has overcome this issue (and thus producing positive water depths), except at the gap itself, which is masked out. The influence of another gap can be seen before km 17, where [I0 S0] has been dragged down while [I10 S0.5] provides a more continuous water surface. The cross-section shows a comparable pattern with the variability of [I0 S0] being reduced in [I10 S0.5]. The gap within the river channel has a strong effect, although it is mainly a problem for [I0 S0], while the gap at the end, located in the floodplains, is within a higher region with similar elevation values and thus has little effect on water levels and depths produced by FwDET.
3.5. FwDET2.1 Applications Options
FwDET2.1 is provided as a free and open-source tool. It is currently available for users through the five applications listed below. The reported runtime is based on the Boise River case study (#1; Table 2), with 353,000 grid-cells, and ten iterations. Desktop applications were executed on an 8-core Intel i9 3.6 GHz processor with 16 GB of RAM. Online applications’ (GEE and ArcGIS Online) runtime can vary considerably due to differences in available resources on the provider’s server.
- Stand-alone Python script: uses the ArcGIS Python package (ArcPy) and thus requires an ArcGIS license. Code and demo data are available on the CSDMS model repository: https://csdms.colorado.edu/wiki/Model:FwDET (accessed on 29 September 2022) which is linked to the CSDMS GitHub repository: https://github.com/csdms-contrib/fwdet (accessed on 29 September 2022). Runtime: 1:20 min.
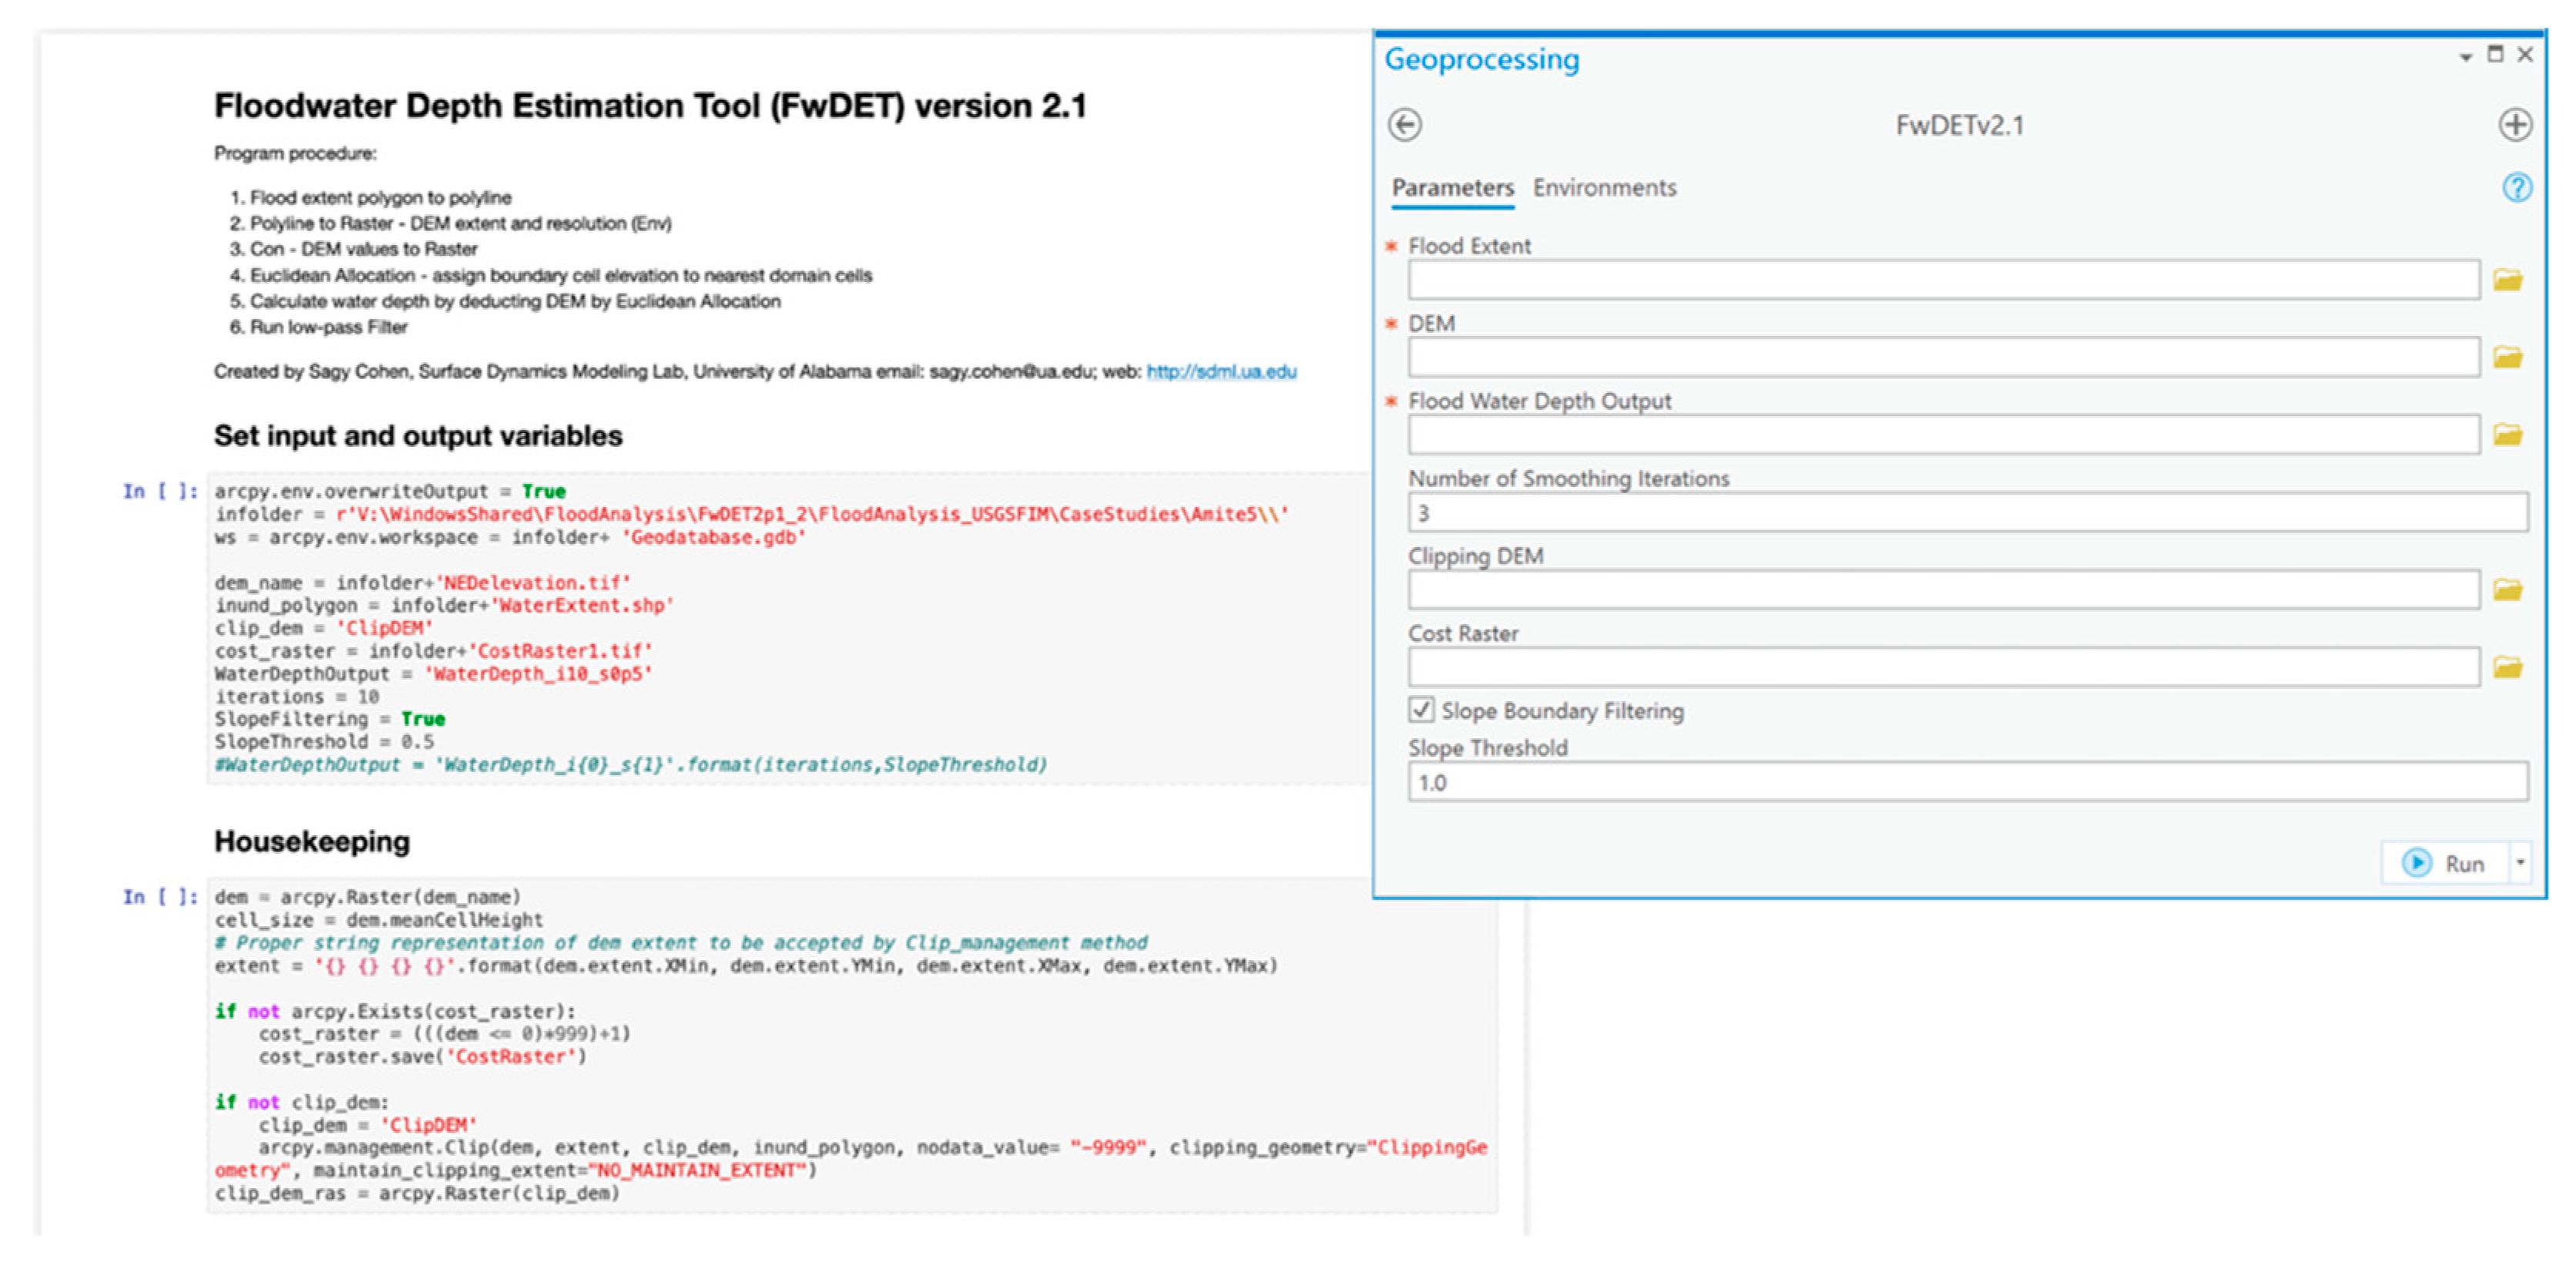
- ArcGIS Script Tool: an ArcGIS Pro geoprocessing tool with a standard interface (Figure 12). The tool and demo data are also available through the CSDMS portals listed above. Requires an ArcGIS license. Runtime: 3:02 min.
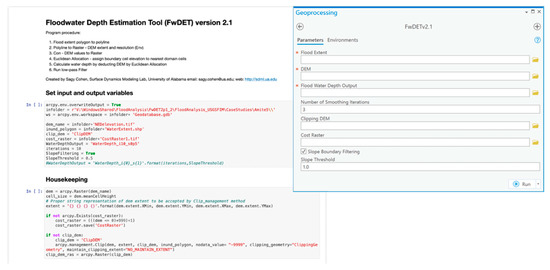 Figure 12. Screenshots of FwDET2.1 ArcGIS Pro interfaces: (left) top section of the Jupiter Notebook, and (right) Geoprocessing Script Tool user interface.
 - ArcGIS Pro Notebook: an ArcGIS Pro Notebook interface (Figure 12) that allows stepping through the code. Available on the ArcGIS online portal: https://arcg.is/0GbzHO (accessed on 29 September 2022). Does not require an ArcGIS Online account to download but requires an ArcGIS Pro license to run. Runtime: 3:47 min.
- ArcGIS Online Notebook: a similar interface as the ArcGIS Pro Notebook but edited to allow execution on the ArcGIS Online cloud. Available with links to demo data at: https://arcg.is/0yzOHP (accessed on 29 September 2022). Requires an ArcGIS Online account. Runtimes (including embedded visualization): between 4:25 and 7:22 min
- Google Earth Engine (GEE): web browser GEE (JavaScript) IDE interface. Requires a (free) GEE account. DEMs available on the GEE cloud can be used without pre-processing and the code includes selection options for the DEMs used in this paper. Code is available here: https://github.com/csdms-contrib/fwdet (accessed on 29 September 2022). Runtime: between 4:30 and 16:00 min.
4. Discussion
The Floodwater Depth Estimations Tool (FwDET) provides a simple and computationally efficient approach for estimating water depth for 2D flood maps. The tool and its underlying methodology have been used and tested by different applications and organizations (e.g., NASA SERVIR and Cloud2Street), as well as our contributions to Global Flood Partnership activations [1]. One of the key limitations of FwDET is that its output floodwater depth maps often include sharp transitions in values, which leads to linear stripes along the flooded domain. These stripes are caused by unrealistic differences in elevation between adjacent boundary grid-cells, often a result of spatial or resolution mismatch between the flood map and the DEM, errors in the input flood map (due to remote sensing misclassification), or errors in the DEM. These issues not only reduce the accuracy of the results but also introduce unrealistic visual artifacts. Visual representation of flood maps can be critical for the proliferation of their use, especially for emergency response and planning. Improving FwDET’s striping issues while maintaining or, preferably, improving its predictive ability is therefore meritorious. Smoothing floodwater depth maps is very simple using GIS filtering; however, these processes also smooth out realistic spatial dynamics and can contribute to reduced overall accuracy. The new boundary smoothing and filtering procedure introduced in FwDET2.1 attempts to improve the output visuals while also improving accuracy.
The results show that the impact of the FwDET2.1 smoothing and filtering procedures on the results is highly dependent on the resolution and quality of the input DEM. Higher resolution DEMs were less sensitive to the number of smoothing iterations and slope filtering threshold and generally yielded a stronger correspondence with the benchmark (simulated) water depth datasets. A notable exception was the MERIT DEM, which, at 90 m resolution, yielded superior results compared to some of the finer-resolution DEMs. This is due to MERIT’s smoother terrain, the result of the artifact removal algorithm used to generate it. This highlights the importance of the quality of DEMs for flood analysis. In terms of DEM selection, the results show that very high-resolution datasets are preferable (LiDAR and 10 m (USGS NED and 3DEP) in the U.S.), but if these are not available (e.g., outside the U.S.), MERIT outperforms the 30 m DEMs. The use of MERIT can be greatly optimized by the FwDET2.1 smoothing and filtering configuration of ten smoothing iterations and a slope threshold of 0.5% ([I10, S0.5]). This configuration was also found to considerably improve FwDET2.1 calculation for the 10 m NED DEM in our evaluation case study.
In addition to improvements in accuracy metrics, FwDET2.1 shows considerable improvement in the results visuals. The smoothing and filtering of boundary cells reduced linear striping in the water depth maps which, while maintaining or improving accuracy, can greatly increase the confidence of users and thus the usability of the results. Further improvements and testing are, however, warranted. Bryant et al. (2022) [24], for example, integrated the Height Above Nearest Drainage (HAND) approach within a FwDET-based tool to improve remote sensing classification and boundary cell biases. This type of innovative coupling of terrain and remote sensing shows great potential for mitigating flood mapping issues. A limiting factor in the development of improved flood mapping (both remote sensing and modeling) and water depth approaches is the limitation of observational data. While improvements in data availability have been made in recent years (e.g., USGS High Water Mark, the USGS FIM databases), the quantity, usability, and geographic representation of these datasets remain limited.
Remote sensing-derived flood map issues, such as gaps, had a strong effect on FwDET results. Gaps are identified as a flood inundation boundary and could thus propagate far into the water depth maps, causing low (or even zero) values if those (unrealistic) gaps are located within the river or other low-lying areas. Flood map gaps can be either false negatives (inaccurately classified as not being water) or true negatives (accurately classified as not being water). In the case of false negatives, this can be caused by issues with the satellite processing chain (e.g., speckle filter in SAR imagery or cloud/object shadows in optical imagery), the flood mapping algorithm, or the presence of a temporary object (e.g., boats and floating debris) blocking the water/flood signal to the satellite’s sensor (which is more of a grey area between a false and true positive). These issues could potentially be solved within the flood map, for example, by gap filling (e.g., [25,26]), although that does require additional processing steps. Errors associated with true negatives can be caused by the fact that rivers are dynamic and can move over time, while the DEM is static and based on the period over which its data were acquired. Most of the global DEMs are not kept up to date, so even recently released DEMs (such as Copernicus DEM GLO 30) might be outdated in a few years’ time. If the DEM no longer matches the actual location of a river, the combination of a flood map and DEM, as required by FwDET, does not align well and can cause issues related to gaps as seen here.
From a socioeconomic and environmental perspective, one question surrounding gap filling revolves around whether accepting errors of commission would be preferable to accepting errors of omission. Through gap filling, errors of commission (i.e., areas labeled as flood that are not flood) may be included in the depth model, which will affect the overall accuracy of the product and could lead to resources being allocated disproportionately. Conversely, accepting errors of omission (i.e., areas not labeled as flood that are flood) could result in areas in need of relief not receiving the attention they warrant, or any at all. The results show that the negative impacts of gaps in the flood map are greatly reduced with the boundary filtering introduced in FwDET2.1. It should be noted that the absolute depth values at the pixel level are likely not accurate enough to directly base decisions on, when derived from freely available satellite imagery and a global DEM. However, the relative values within a region can still provide meaningful insights on water depths and their spatial distribution during a flood, which could help with prioritizing areas to be targeted for flood relief efforts.
5. Conclusions
The new version of the Floodwater Depth Estimation Tool (FwDET2.1) offers considerable visual improvement as well as accuracy improvement with nearly no computational costs. The new boundary smoothing and filtering procedure allow the users to optimize the tool for specific case studies and the DEM dataset used. The comparison between a large set of DEMs showed that, as expected, higher-resolution DEMs generally yield favorable results. The 90 m MERIT dataset outperformed several 30 m DEMs, especially when FwDET2.1 boundary smoothing and filtering parameters are optimized. This was attributed to MERIT’s trees and building smoothing and hydrological conditioning. FwDET2.1 is freely available as a standalone python script, ArcGIS Pro tool, ArcGIS Pro Notebook, ArcGIS Online Notebook, and Google Earth Engine script. Future developments could focus on coupling between FwDET and the remote sensing processing. The methodological concept underlying FwDET has the potential of informing the remote sensing analysis, streamlining topography-informed flood inundation mapping.
Author Contributions
Conceptualization, S.C.; methodology, S.C.; software, S.C. and B.G.P.; validation, S.C., B.G.P. and A.H.; formal analysis, S.C., B.G.P., A.H., D.M., N.M. and A.N.; data curation, S.M.; writing—original draft preparation, S.C., B.G.P. and A.H.; writing—review and editing, S.C., B.G.P., A.H., D.M., N.M. and A.N.; project administration, S.C. and B.G.P.; funding acquisition, S.C. All authors have read and agreed to the published version of the manuscript.
Funding
This research was funded, in part, by the National Oceanic and Atmospheric Administration (NOAA) through the Cooperative Institute for Research to Operations in Hydrology (CIROH), FIM award number A22-0305. Additional support was provided by the University of Alabama CyberSeed grant.
Institutional Review Board Statement
Not applicable.
Informed Consent Statement
Not applicable.
Data Availability Statement
Demo data are available on FwDET GitHub repository (https://github.com/csdms-contrib/fwdet, accessed on 29 September 2022) and through FwDET ArcGIS Online Notebook (https://arcg.is/0yzOHP, accessed on 29 September 2022). The DEMs are available through Google Earth Engine (https://earthengine.google.com/, accessed on 29 September 2022). The simulated floods are available through the USGS FIM Mapper (https://fim.wim.usgs.gov/fim/, accessed on 29 September 2022). Code and ready-to-use tool availability is described in Section 3.5.
Conflicts of Interest
The authors declare no conflict of interest.
References
- Alfieri, L.; Cohen, S.; Galantowicz, J.; Schumann, G.J.; Trigg, M.A.; Zsoter, E.; Prudhomme, C.; Kiewicz, A.; de Perez, E.C.; Flamig, Z.; et al. A global network for operational flood risk reduction. Environ. Sci. Policy 2018, 84, 149–158. [Google Scholar] [CrossRef]
- Mayer, T.; Poortinga, A.; Bhandari, B.; Nicolau, A.P.; Markert, K.; Thwal, N.S.; Markert, A.; Haag, A.; Kilbride, J.; Chishtie, F.; et al. Deep learning approach for Sentinel-1 surface water mapping leveraging Google Earth Engine. ISPRS J. Photogramm. Remote Sens. 2021, 2, 100005. [Google Scholar] [CrossRef]
- Johnson, J.M.; Munasinghe, D.; Eyelade, D.; Cohen, S. An Integrated Evaluation of the National Water Model (NWM)–Height Above Nearest Drainage (HAND) Flood Mapping Methodology. Nat. Hazards Earth Syst. Sci. 2019, 19, 2405–2420. [Google Scholar] [CrossRef]
- Tellman, B.; Sullivan, J.A.; Kuhn, C.; Kettner, A.J.; Doyle, C.S.; Brakenridge, G.R.; Erickson, T.A.; Slayback, D.A. Satellite imaging reveals increased proportion of population exposed to floods. Nature 2021, 596, 80–86. [Google Scholar] [CrossRef] [PubMed]
- Cohen, S.; Brakenridge, G.R.; Kettner, A.; Bates, B.; Nelson, J.; McDonald, R.; Huang, Y.; Munasinghe, D.; Zhang, J. Estimating Floodwater Depths from Flood Inundation Maps and Topography. J. Am. Water Resour. Assoc. 2018, 54, 847–858. [Google Scholar] [CrossRef]
- Teng, J.; Jakeman, A.J.; Vaze, J.; Croke, B.F.; Dutta, D.; Kim, S.J.E.M. Flood inundation modelling: A review of methods, recent advances and uncertainty analysis. Environ. Model Softw. 2017, 90, 201–216. [Google Scholar] [CrossRef]
- Cohen, S.; Raney, A.; Munasinghe, D.; Loftis, J.D.; Molthan, J.A.; Bell, J.; Rogers, L.; Galantowicz, J.; Brakenridge, G.R.; Kettner, A.J.; et al. The Floodwater Depth Estimation Tool (FwDET v2.0) for Improved Remote Sensing Analysis of Coastal Flooding. Nat. Hazards Earth Syst. Sci. 2019, 19, 2053–2065. [Google Scholar] [CrossRef]
- Peter, B.G.; Cohen, S.; Lucey, R.; Munasinghe, D.; Raney, A.; Brakenridge, G.R. Google Earth Engine Implementation of the Floodwater Depth Estimation Tool (FwDET-GEE) for Rapid and Large Scale Flood Analysis. IEEE Geosci. Remote Sens. Lett. 2020, 19, 1501005. [Google Scholar] [CrossRef]
- Hawker, L.; Uhe, P.; Paulo, L.; Sosa, J.; Savage, J.; Sampson, C.; Neal, J. A 30 m global map of elevation with forests and buildings removed. Environ. Res. Lett. 2020, 17, 024016. [Google Scholar] [CrossRef]
- Nasa, J.P.L. NASADEM Merged DEM Global 1 Arc Second V001 [Data Set]. NASA EOSDIS Land Processes DAAC. Available online: https://doi.org/10.5067/MEaSUREs/NASADEM/NASADEM_HGT.001 (accessed on 30 December 2020).
- Tadono, T.; Ishida, H.; Oda, F.; Naito, S.; Minakawa, K.; Iwamoto, H. Precise global DEM generation by ALOS PRISM. ISPRS Ann. Photogramm. Remote Sens. Spat. Inf. Sci. 2014, 2, 71. [Google Scholar] [CrossRef]
- NASA/METI/AIST/Japan Spacesystems, and U.S./Japan ASTER Science Team. ASTER Global Digital Elevation Model V003. 2018, Distributed by NASA EOSDIS Land Processes DAAC. Available online: https://doi.org/10.5067/ASTER/ASTGTM.003 (accessed on 29 September 2022).
- Farr, T.G.; Rosen, P.A.; Caro, E.; Crippen, R.; Duren, R.; Hensley, S.; Kobrick, M.; Paller, M.; Rodriguez, E.; Roth, L.; et al. The shuttle radar topography mission. Rev. Geophys. 2007, 45. [Google Scholar] [CrossRef]
- Jarvis, A.; Reuter, H.I.; Nelson, A.; Guevara, E. Hole-Filled SRTM for the Globe Version 4. 2008. Available online: https://research.utwente.nl/en/publications/hole-filled-srtm-for-the-globe-version-4-data-grid (accessed on 29 September 2022).
- Lehner, B.; Verdin, K.; Jarvis, A. New global hydrography derived from spaceborne elevation data. Eos 2008, 89, 93–94. [Google Scholar] [CrossRef]
- Yamazaki, D.; Ikeshima, D.; Tawatari, R.; Yamaguchi, T.; O’Loughlin, F.; Neal, J.C.; Sampson, C.C.; Kanae, S.; Bates, P.D. A high-accuracy map of global terrain elevations. Geophys. Res. Lett. 2017, 44, 5844–5853. [Google Scholar] [CrossRef]
- Zhang, J.; Huang, Y.; Munasinghe, D.; Fang, Z.; Tsang, Y.; Cohen, S. Comparative Analysis of Inundation Mapping Approaches for the 2016 Flood in the Brazos River, Texas. J. Am. Water Resour. Assoc. 2018, 54, 820–833. [Google Scholar] [CrossRef]
- Nelson, J.M.; Shimizu, Y.; Abe, T.; Asahi, K.; Gamou, M.; Inoue, T.; Watanabe, Y. The international river interface cooperative: Public domain flow and morphodynamics software for education and applications. Adv. Water Resour. 2016, 93, 62–74. [Google Scholar] [CrossRef]
- ReliefWeb. Available online: https://reliefweb.int/disaster/fl-2019-000081-mmr (accessed on 20 July 2022).
- Amitrano, D.; Di Martino, G.; Iodice, A.; Riccio, D.; Ruello, G. Unsupervised rapid flood mapping using Sentinel-1 GRD SAR images. IEEE Trans. Geosci. Remote Sens. 2018, 56, 3290–3299. [Google Scholar] [CrossRef]
- Clement, M.A.; Kilsby, C.G.; Moore, P. Multi-temporal synthetic aperture radar flood mapping using change detection. J. Flood Risk Manag. 2018, 11, 152–168. [Google Scholar] [CrossRef]
- Markert, K.N.; Markert, A.M.; Mayer, T.; Nauman, C.; Haag, A.; Poortinga, A.; Bhandari, B.; Thwal, N.S.; Kunlamai, T.; Chishtie, F.; et al. Comparing sentinel-1 surface water mapping algorithms and radiometric terrain correction processing in southeast asia utilizing google earth engine. Remote Sens. 2020, 12, 2469. [Google Scholar] [CrossRef]
- Uuemaa, E.; Ahi, S.; Montibeller, B.; Muru, M.; Kmoch, A. Vertical accuracy of freely available global digital elevation models (ASTER, AW3D30, MERIT, TanDEM-X, SRTM, and NASADEM). Remote Sens. 2020, 12, 3482. [Google Scholar] [CrossRef]
- Bryant, S.; McGrath, H.; Boudreault, M. Gridded flood depth estimates from satellite-derived inundations. Nat. Hazards Earth Syst. Sci. 2022, 22, 1437–1450. [Google Scholar] [CrossRef]
- Bai, B.; Tan, Y.; Donchyts, G.; Haag, A.; Weerts, A. A simple spatio–temporal data fusion method based on linear regression coefficient compensation. Remote Sens. 2020, 12, 3900. [Google Scholar] [CrossRef]
- Bai, B.; Tan, Y.; Zhou, K.; Donchyts, G.; Haag, A.; Weerts, A.H. Time-series surface water gap filling based on spatiotemporal neighbourhood similarity. Int. J. Appl. Earth Obs. Geoinf. 2022, 112, 102882. [Google Scholar] [CrossRef]
Publisher’s Note: MDPI stays neutral with regard to jurisdictional claims in published maps and institutional affiliations. |
© 2022 by the authors. Licensee MDPI, Basel, Switzerland. This article is an open access article distributed under the terms and conditions of the Creative Commons Attribution (CC BY) license (https://creativecommons.org/licenses/by/4.0/).

