
Contribution of Sentinel-3A Radar Altimetry Data to the Study of the Water Level Variations in Lake Buyo (West of Côte d’Ivoire)

 , ,
, ,  ,
,
Abstract
1. Introduction
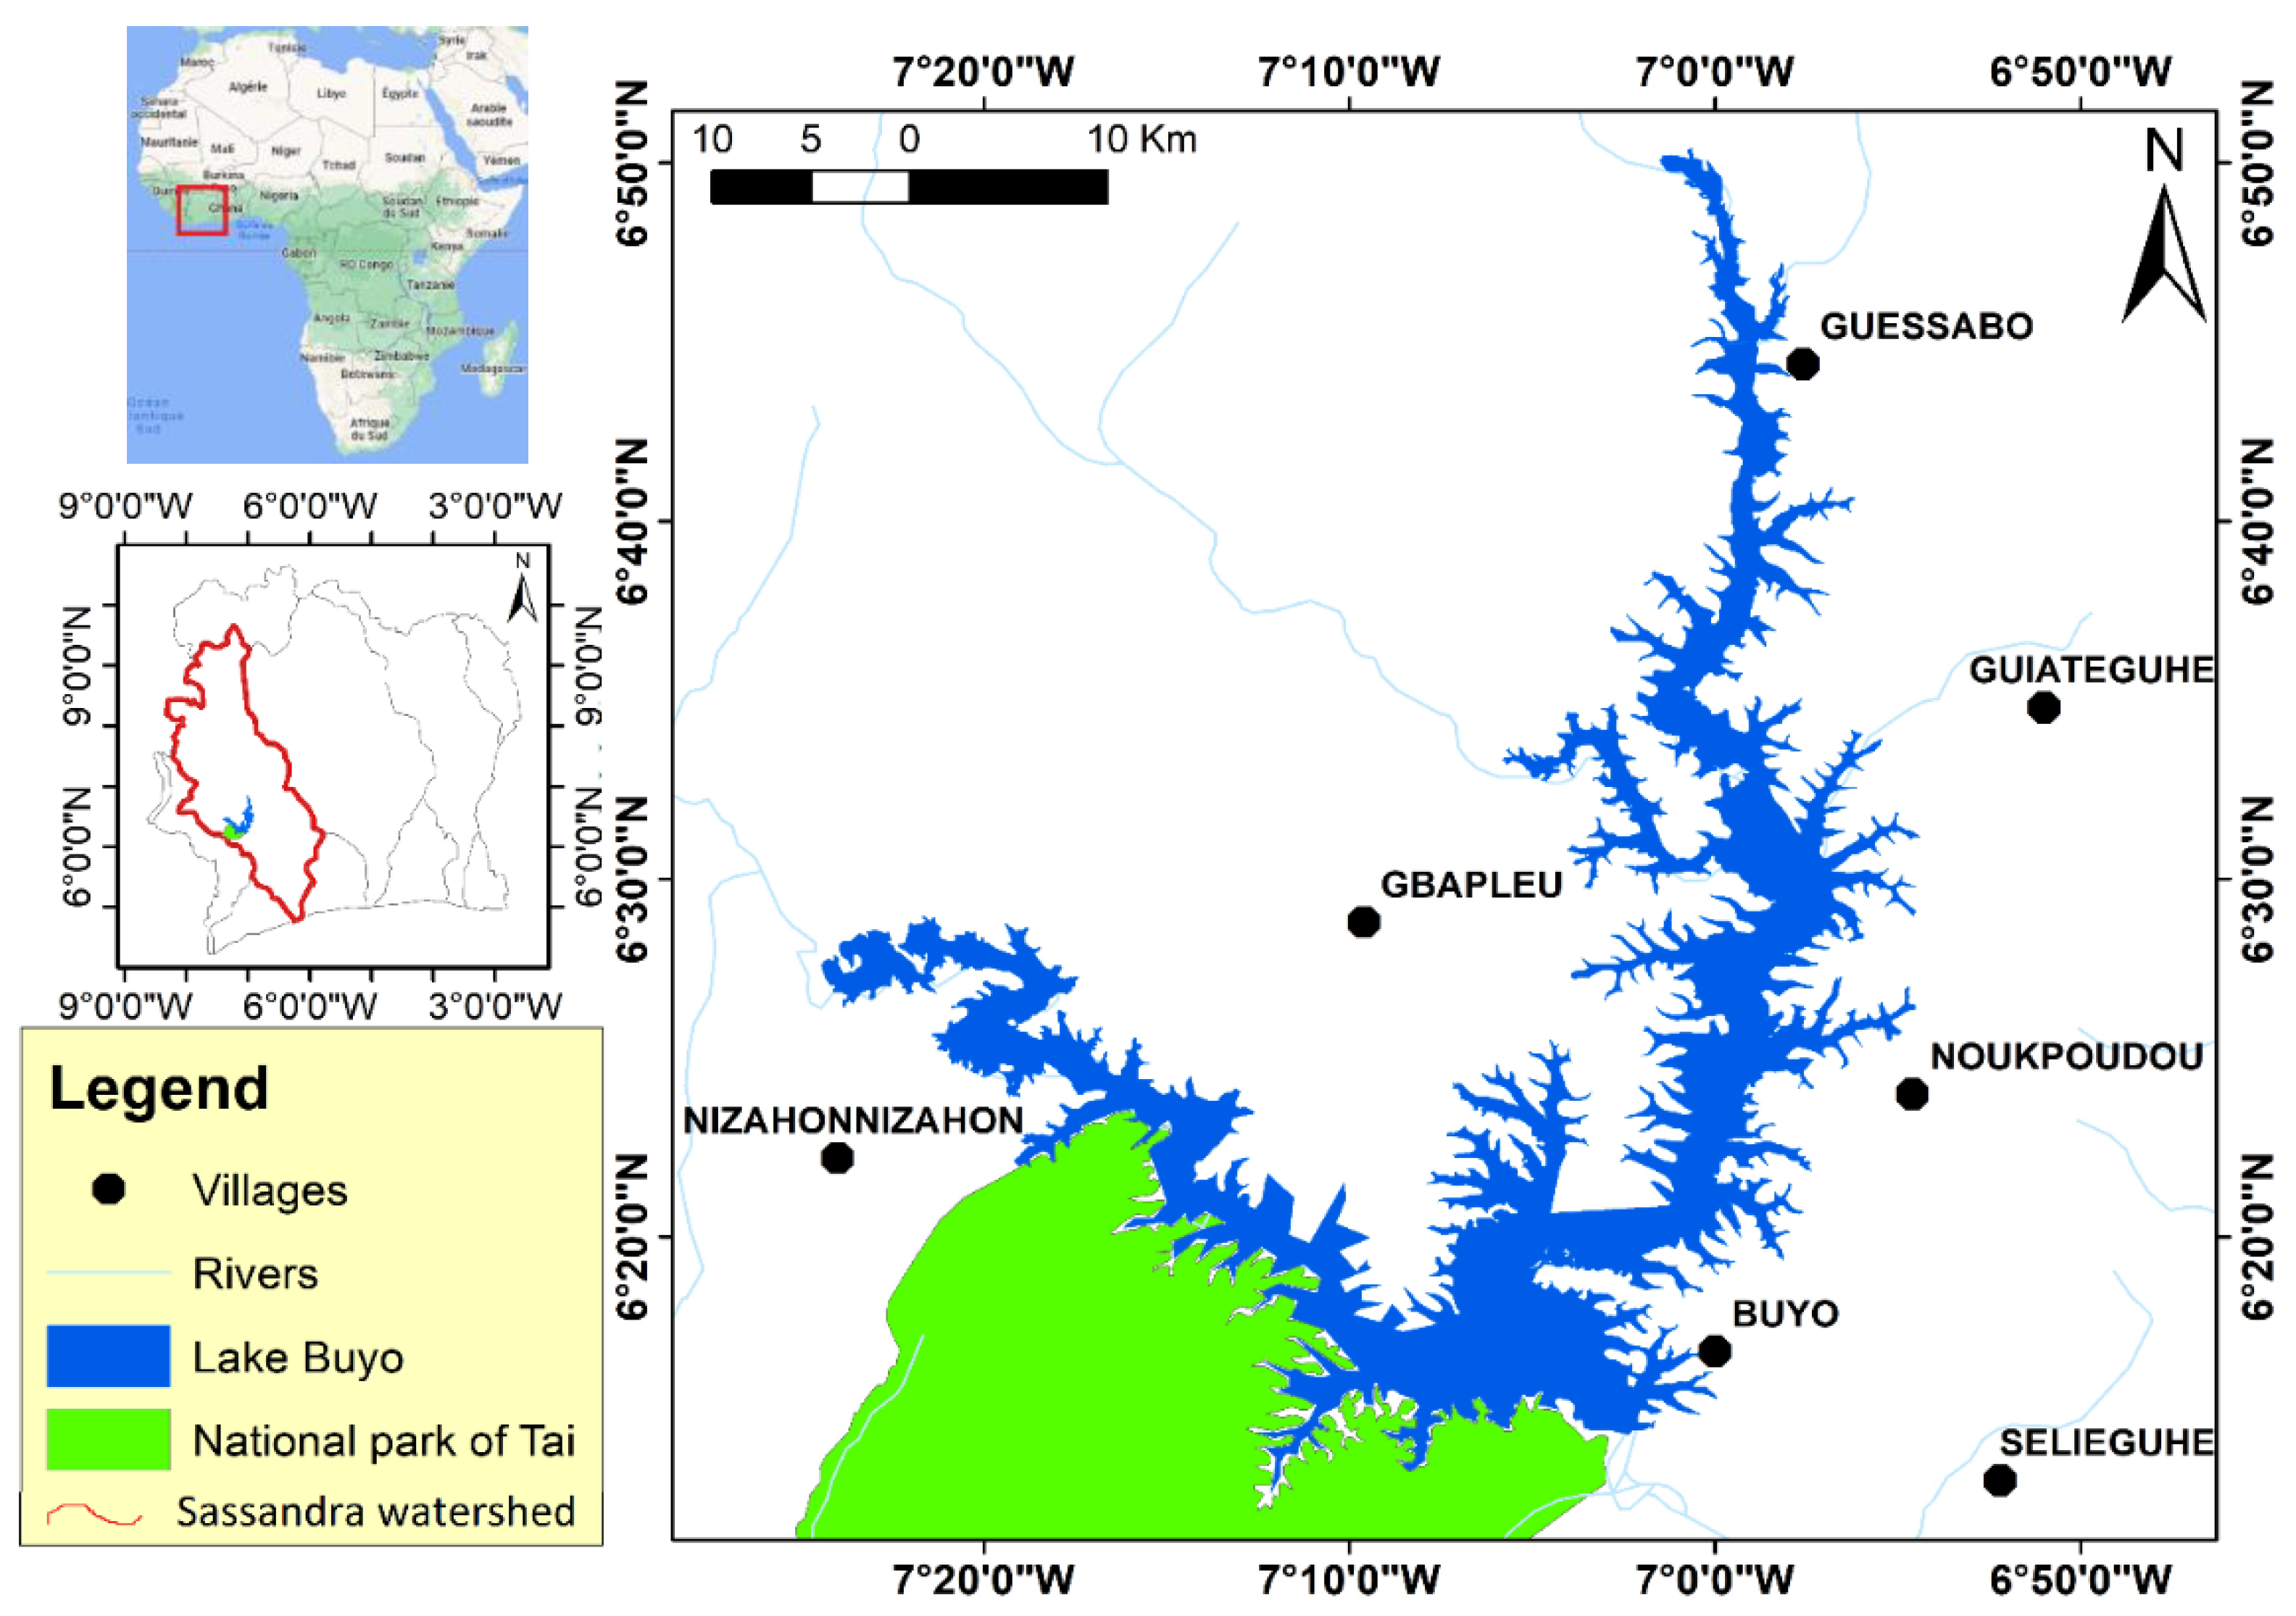
2. Study Area
3. Materials and Methods
3.1. Data and Materials
3.2. Methods
3.2.1. Altimetry Principle
3.2.2. Water Level Time Series Extraction
3.3. Altimetry Data Validation
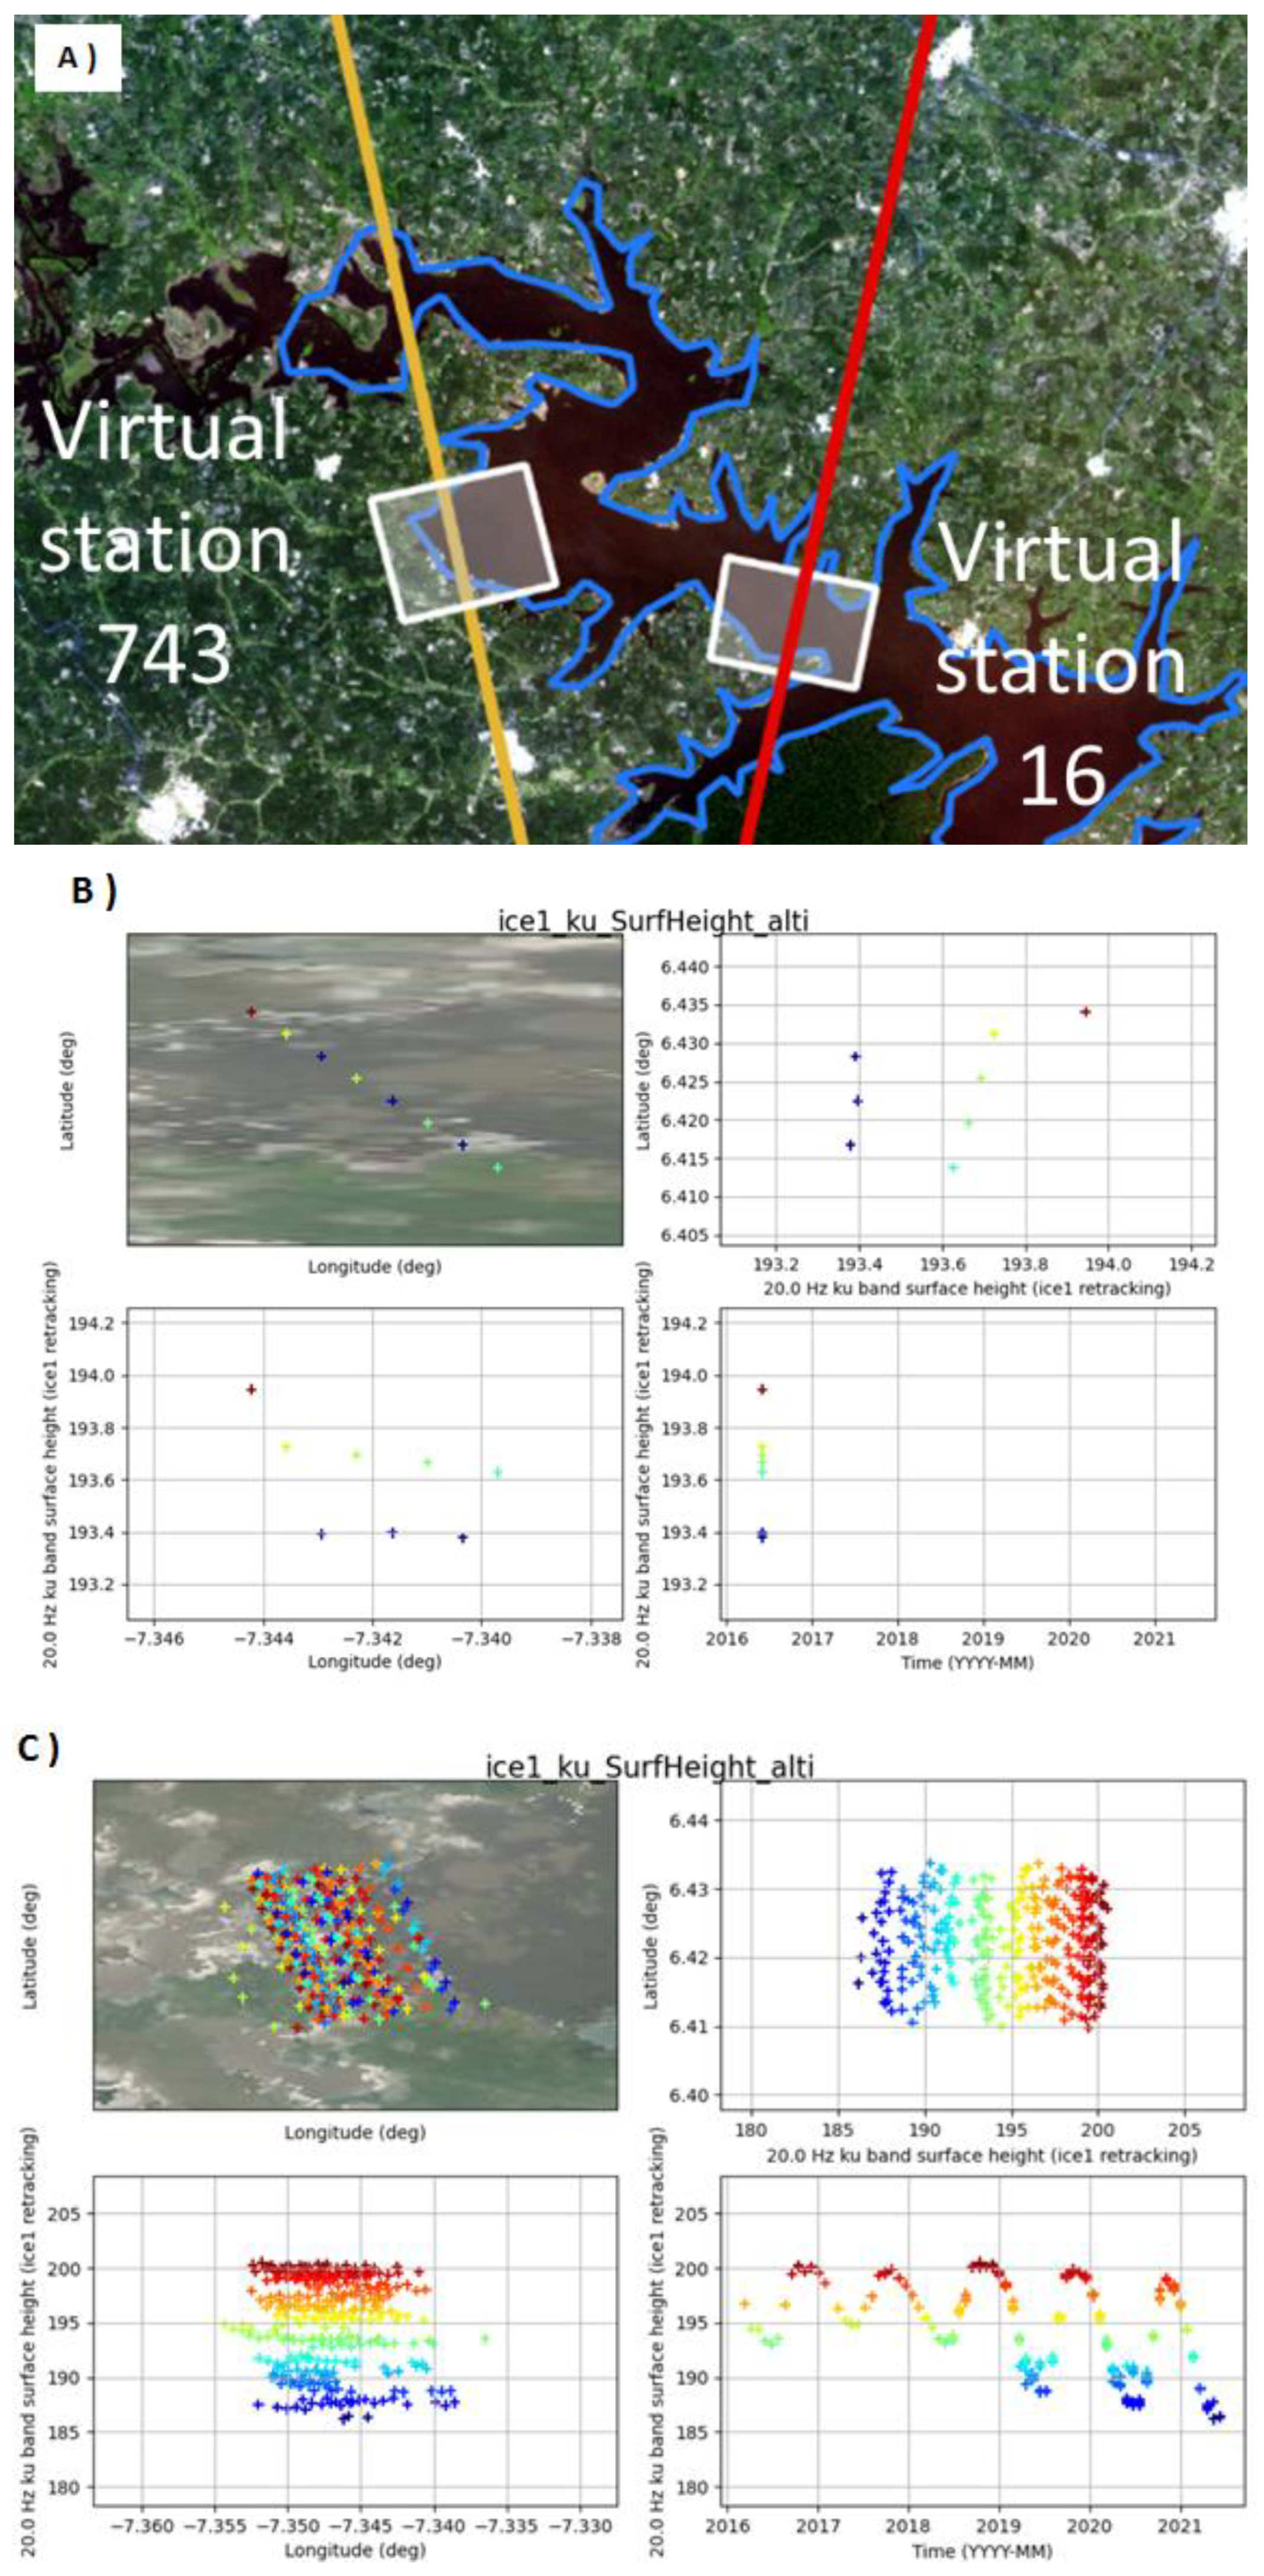
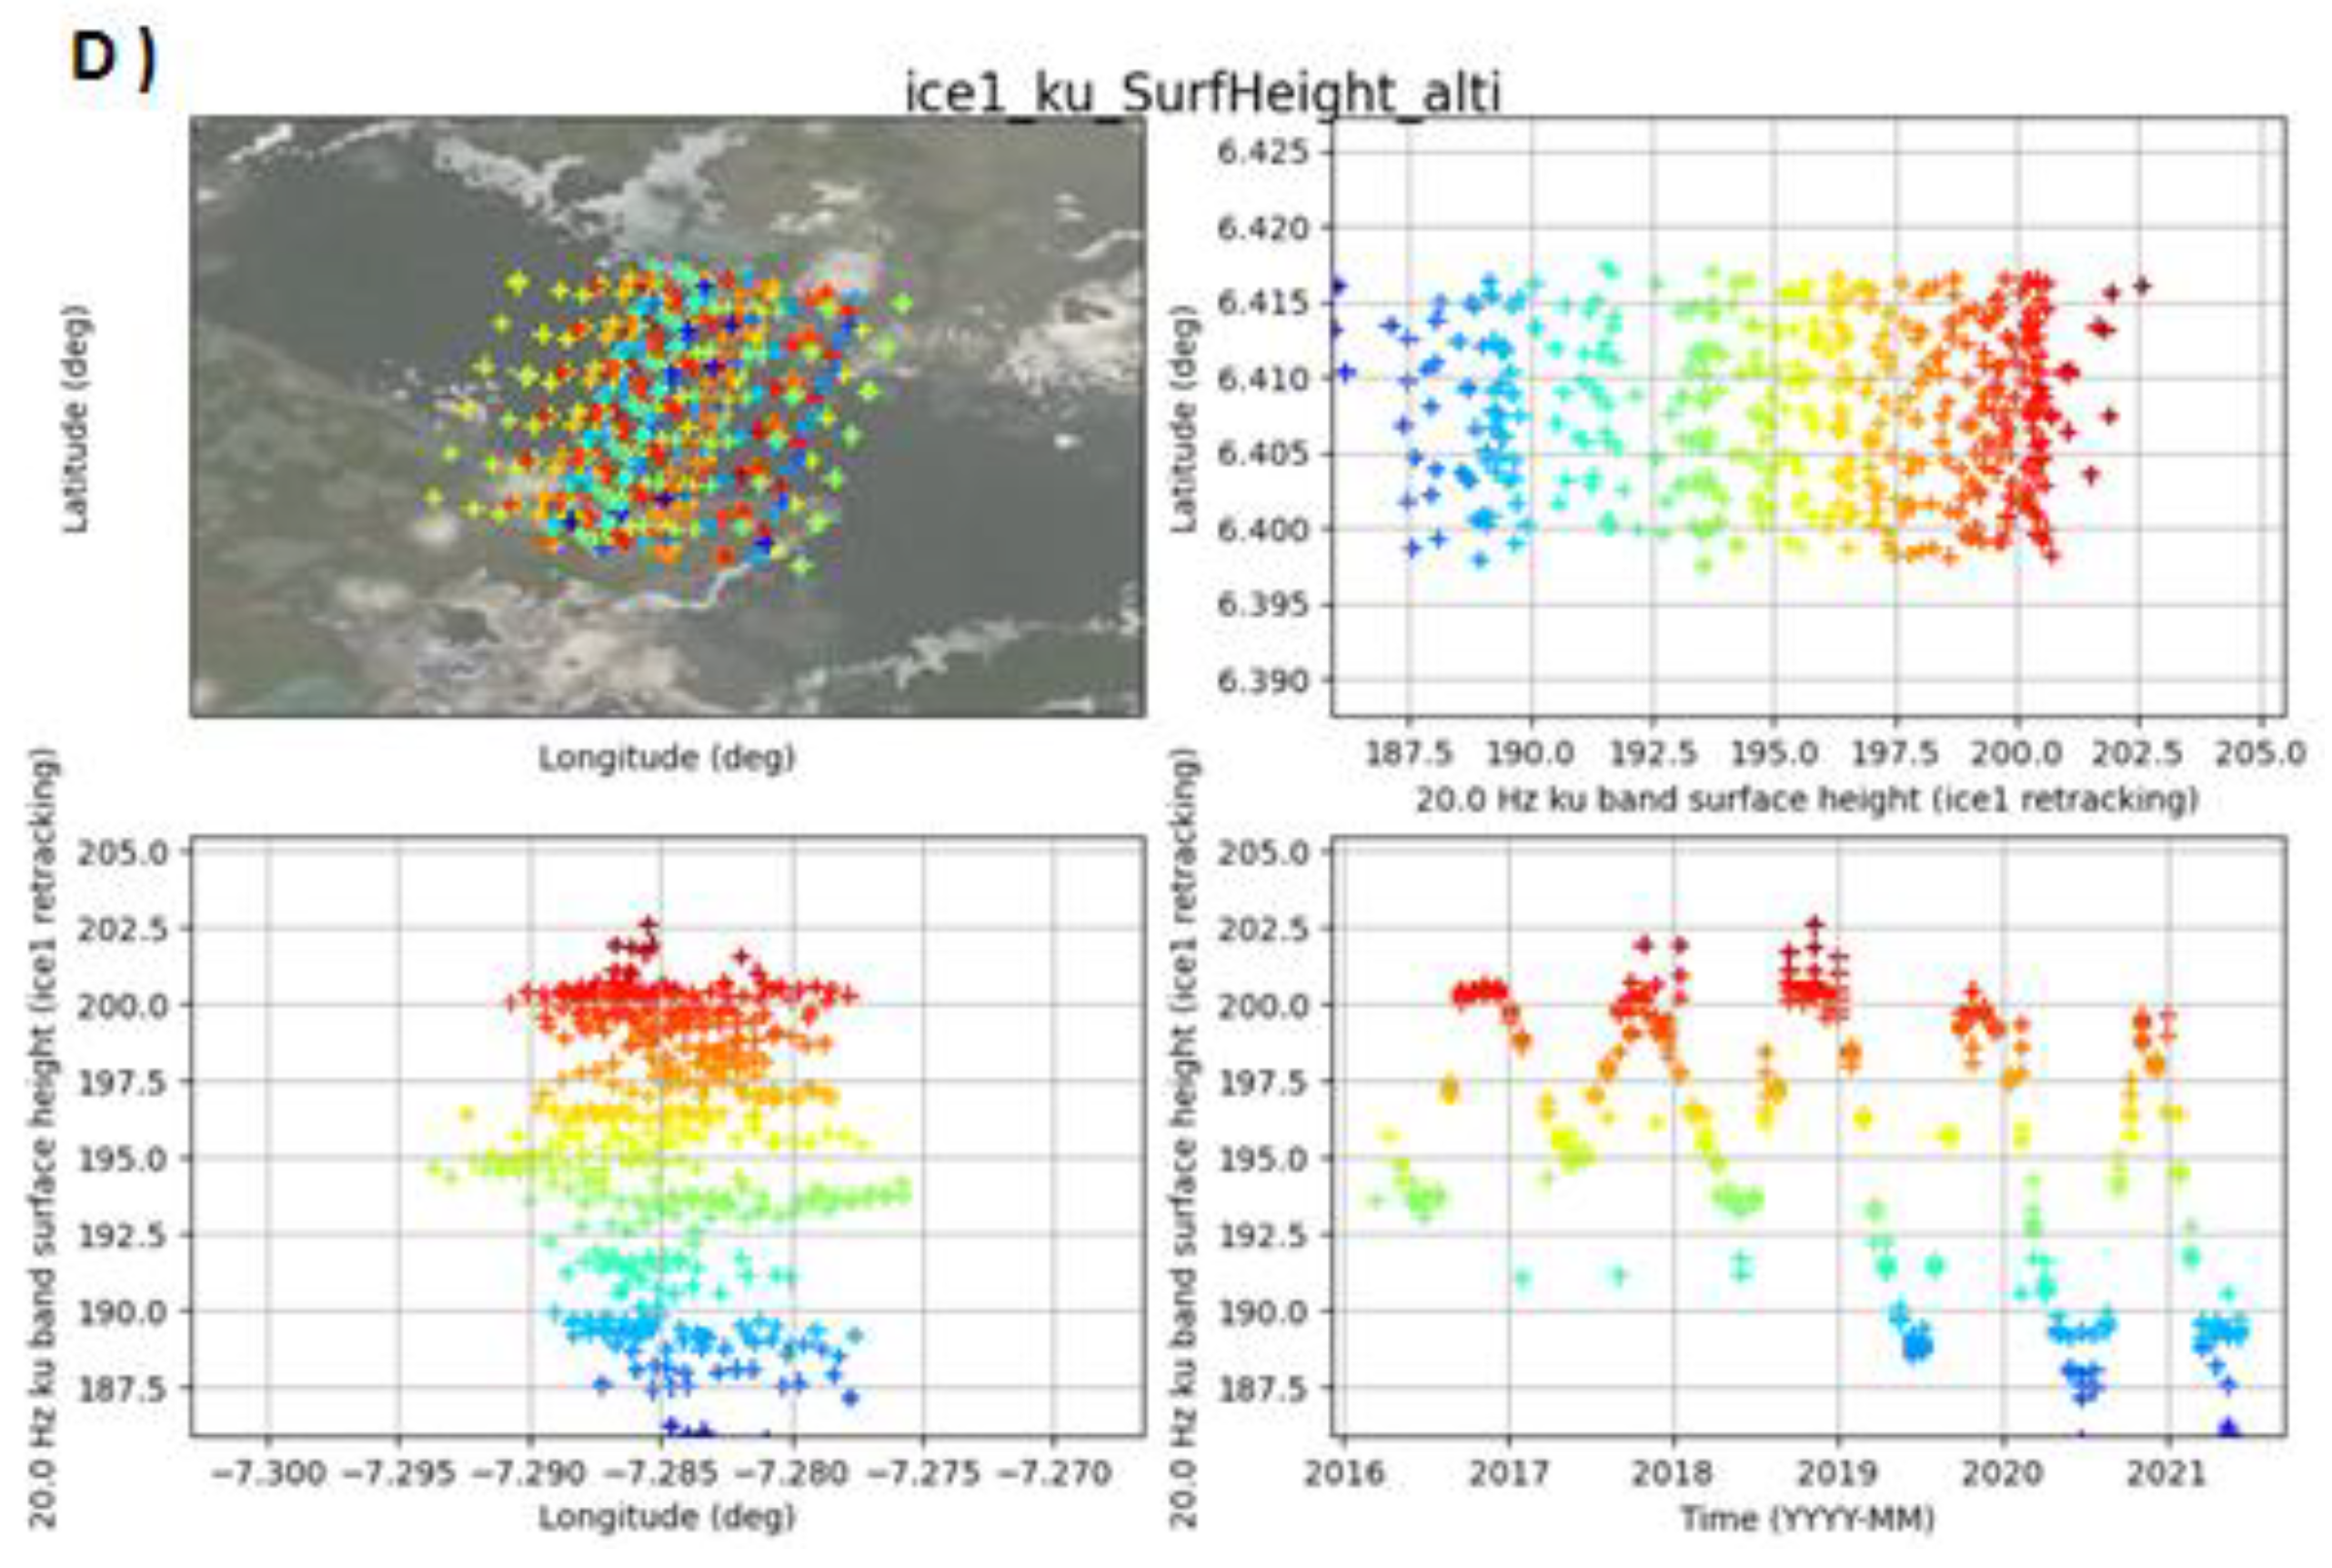
3.3.1. Visual Validation
3.3.2. Quantitative Validation
4. Results
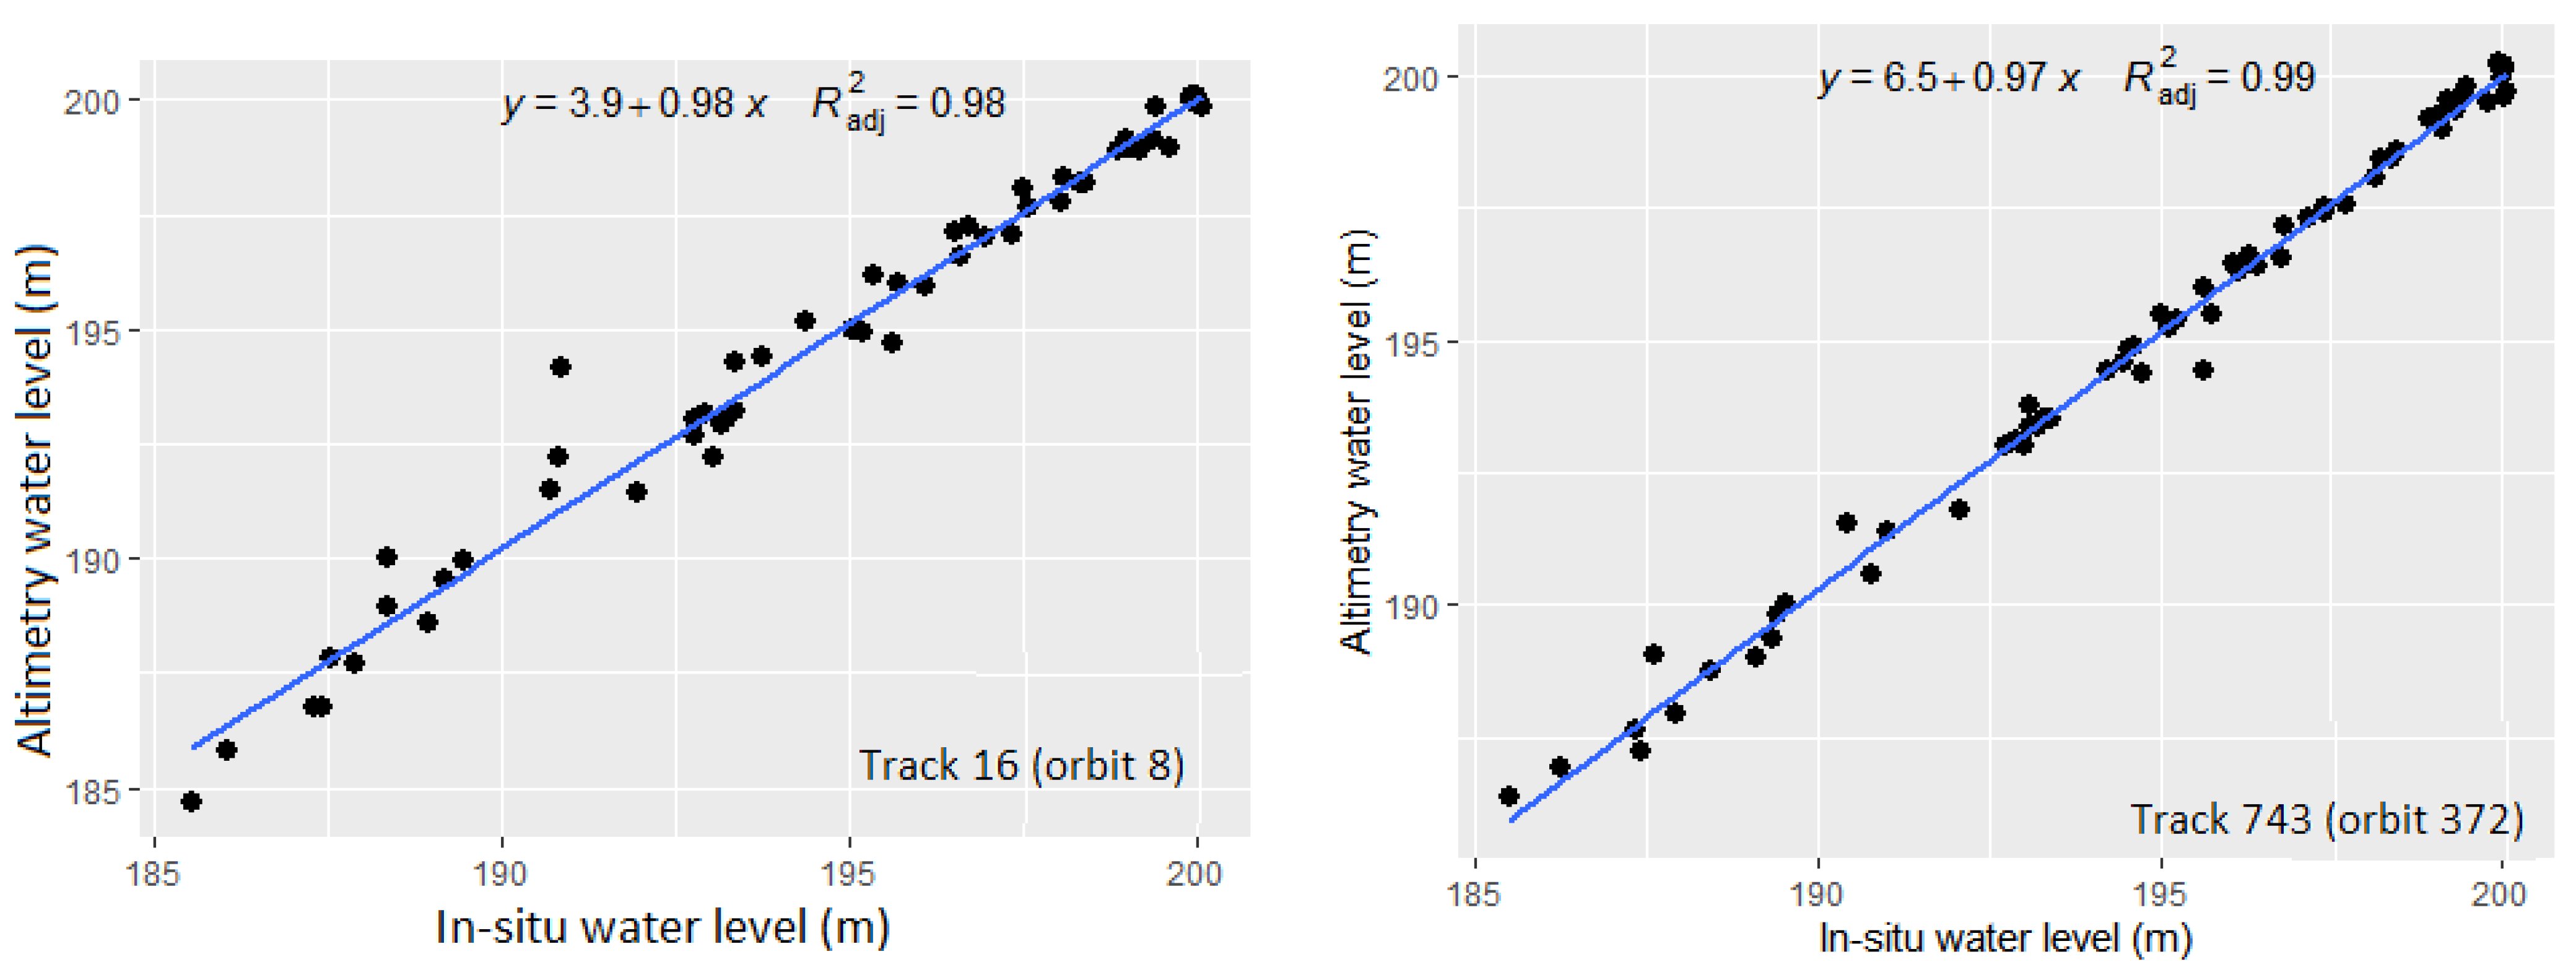
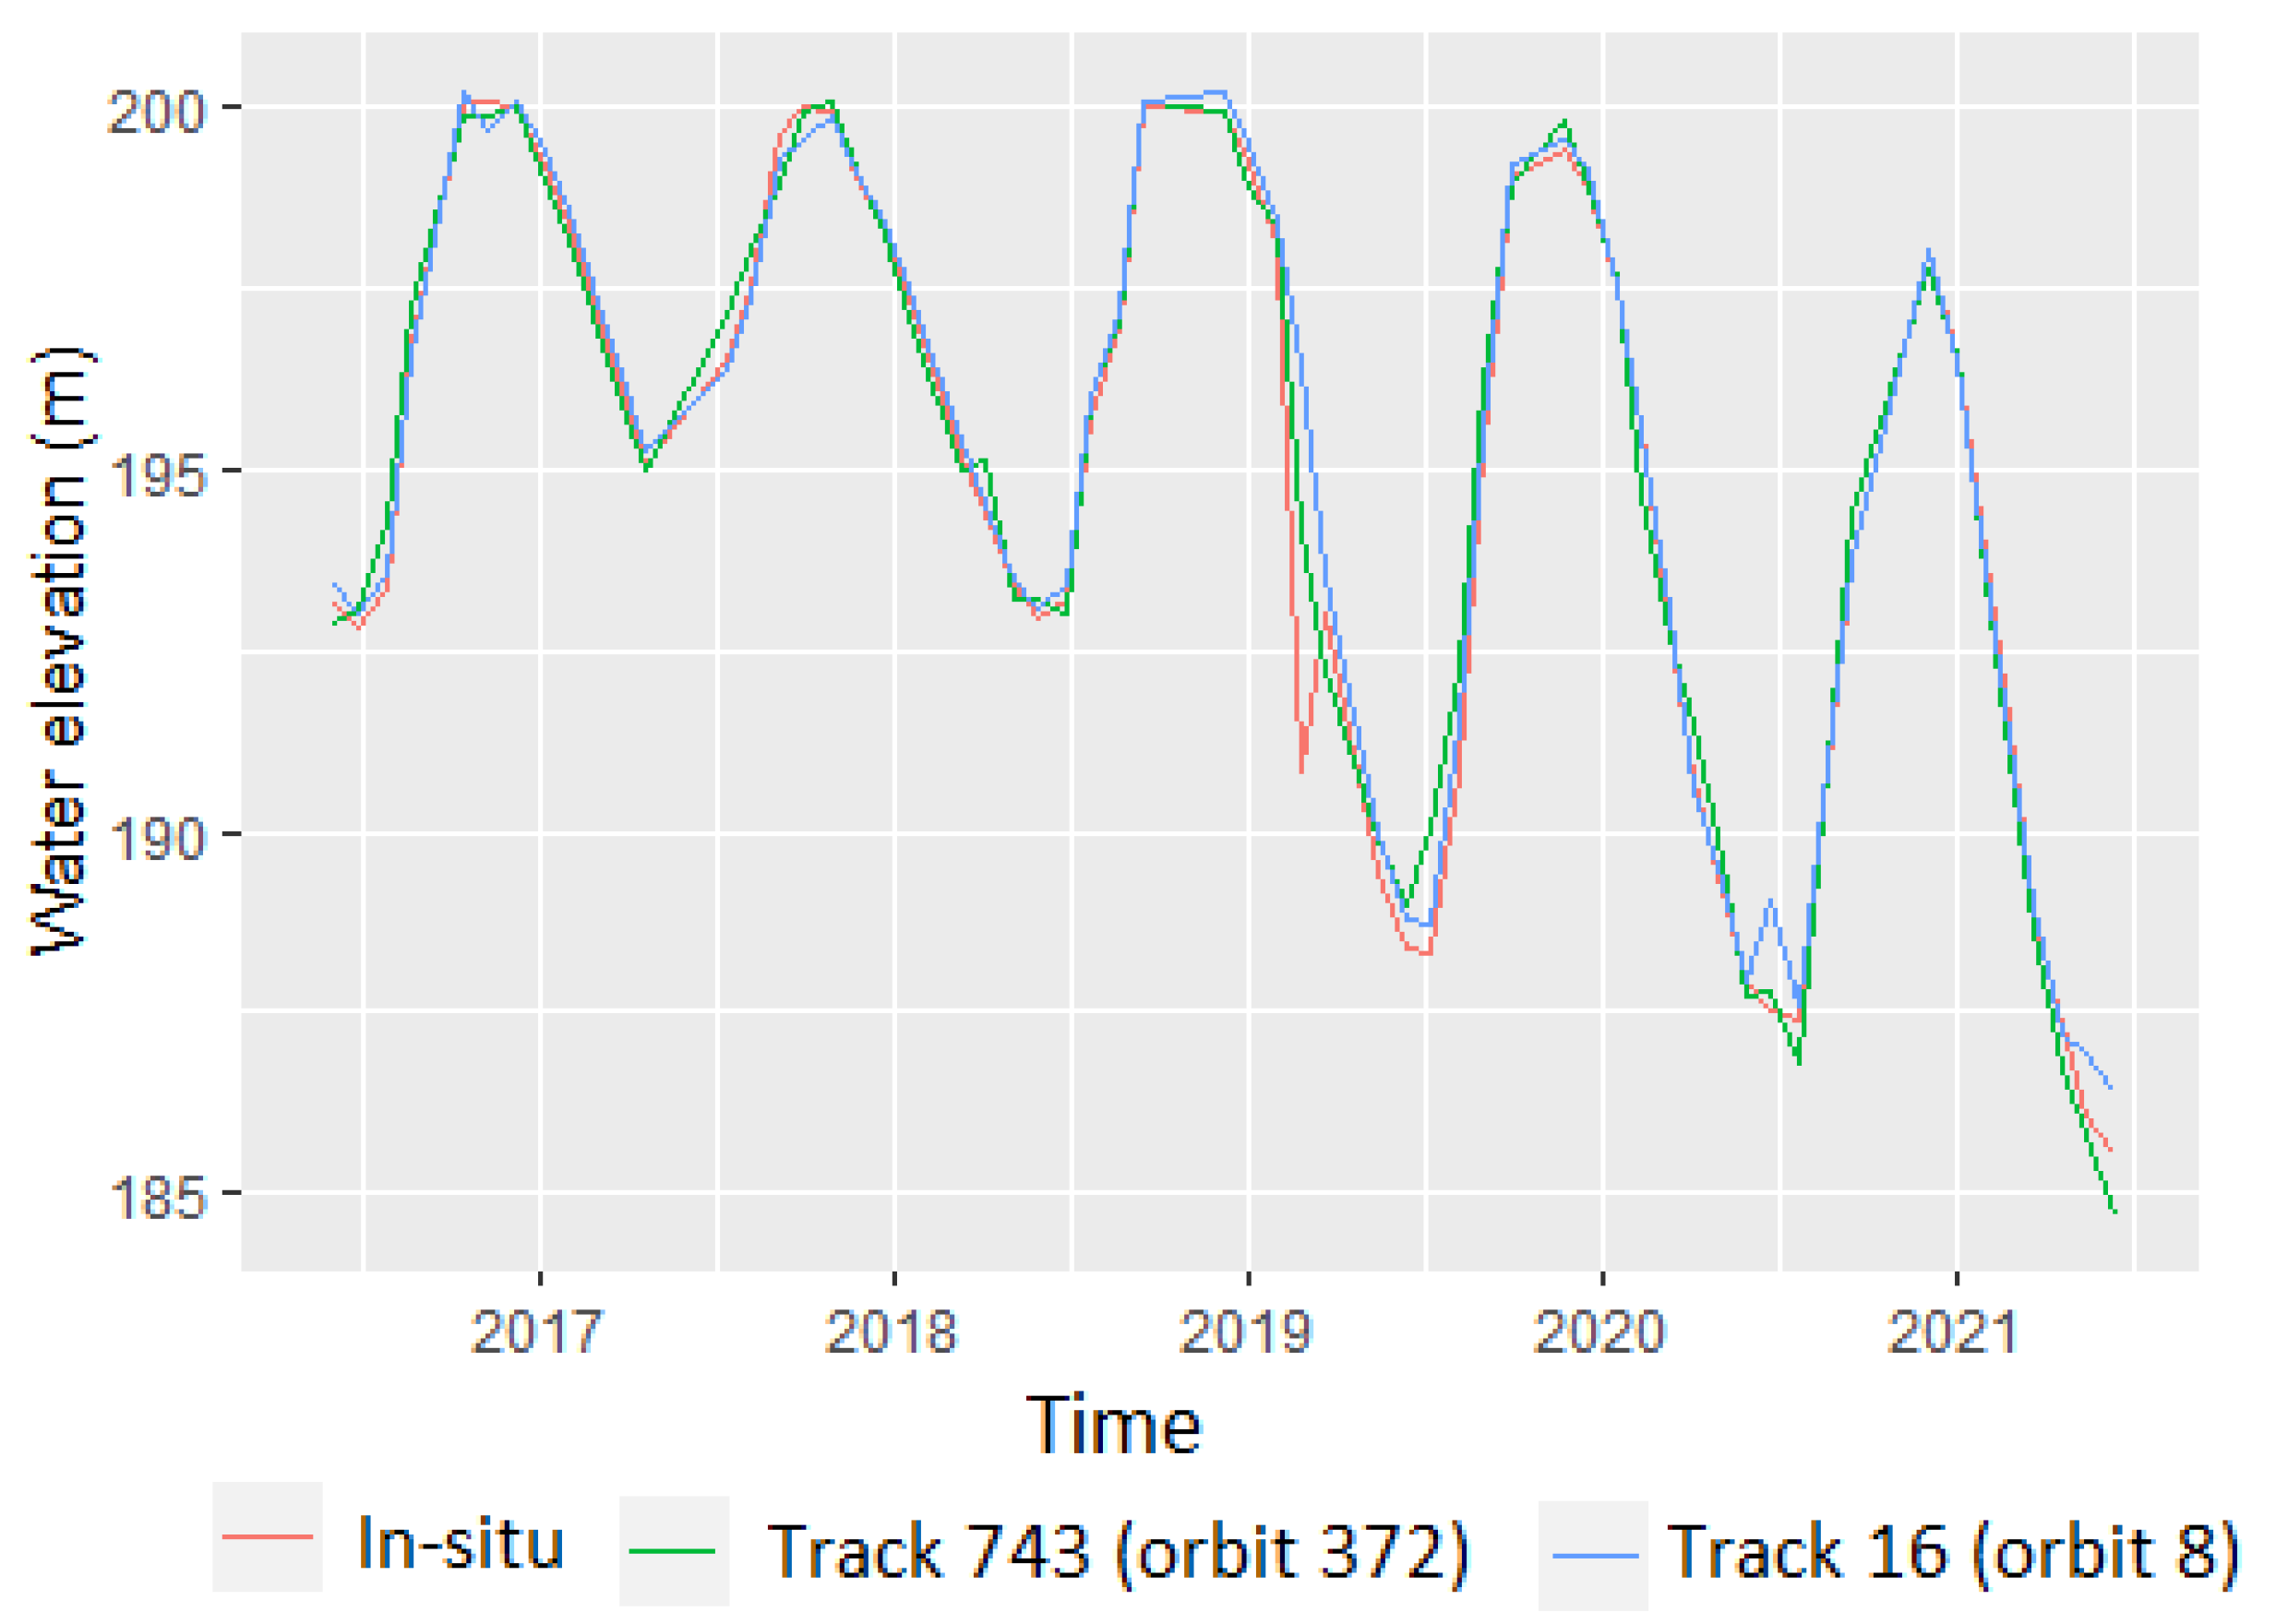
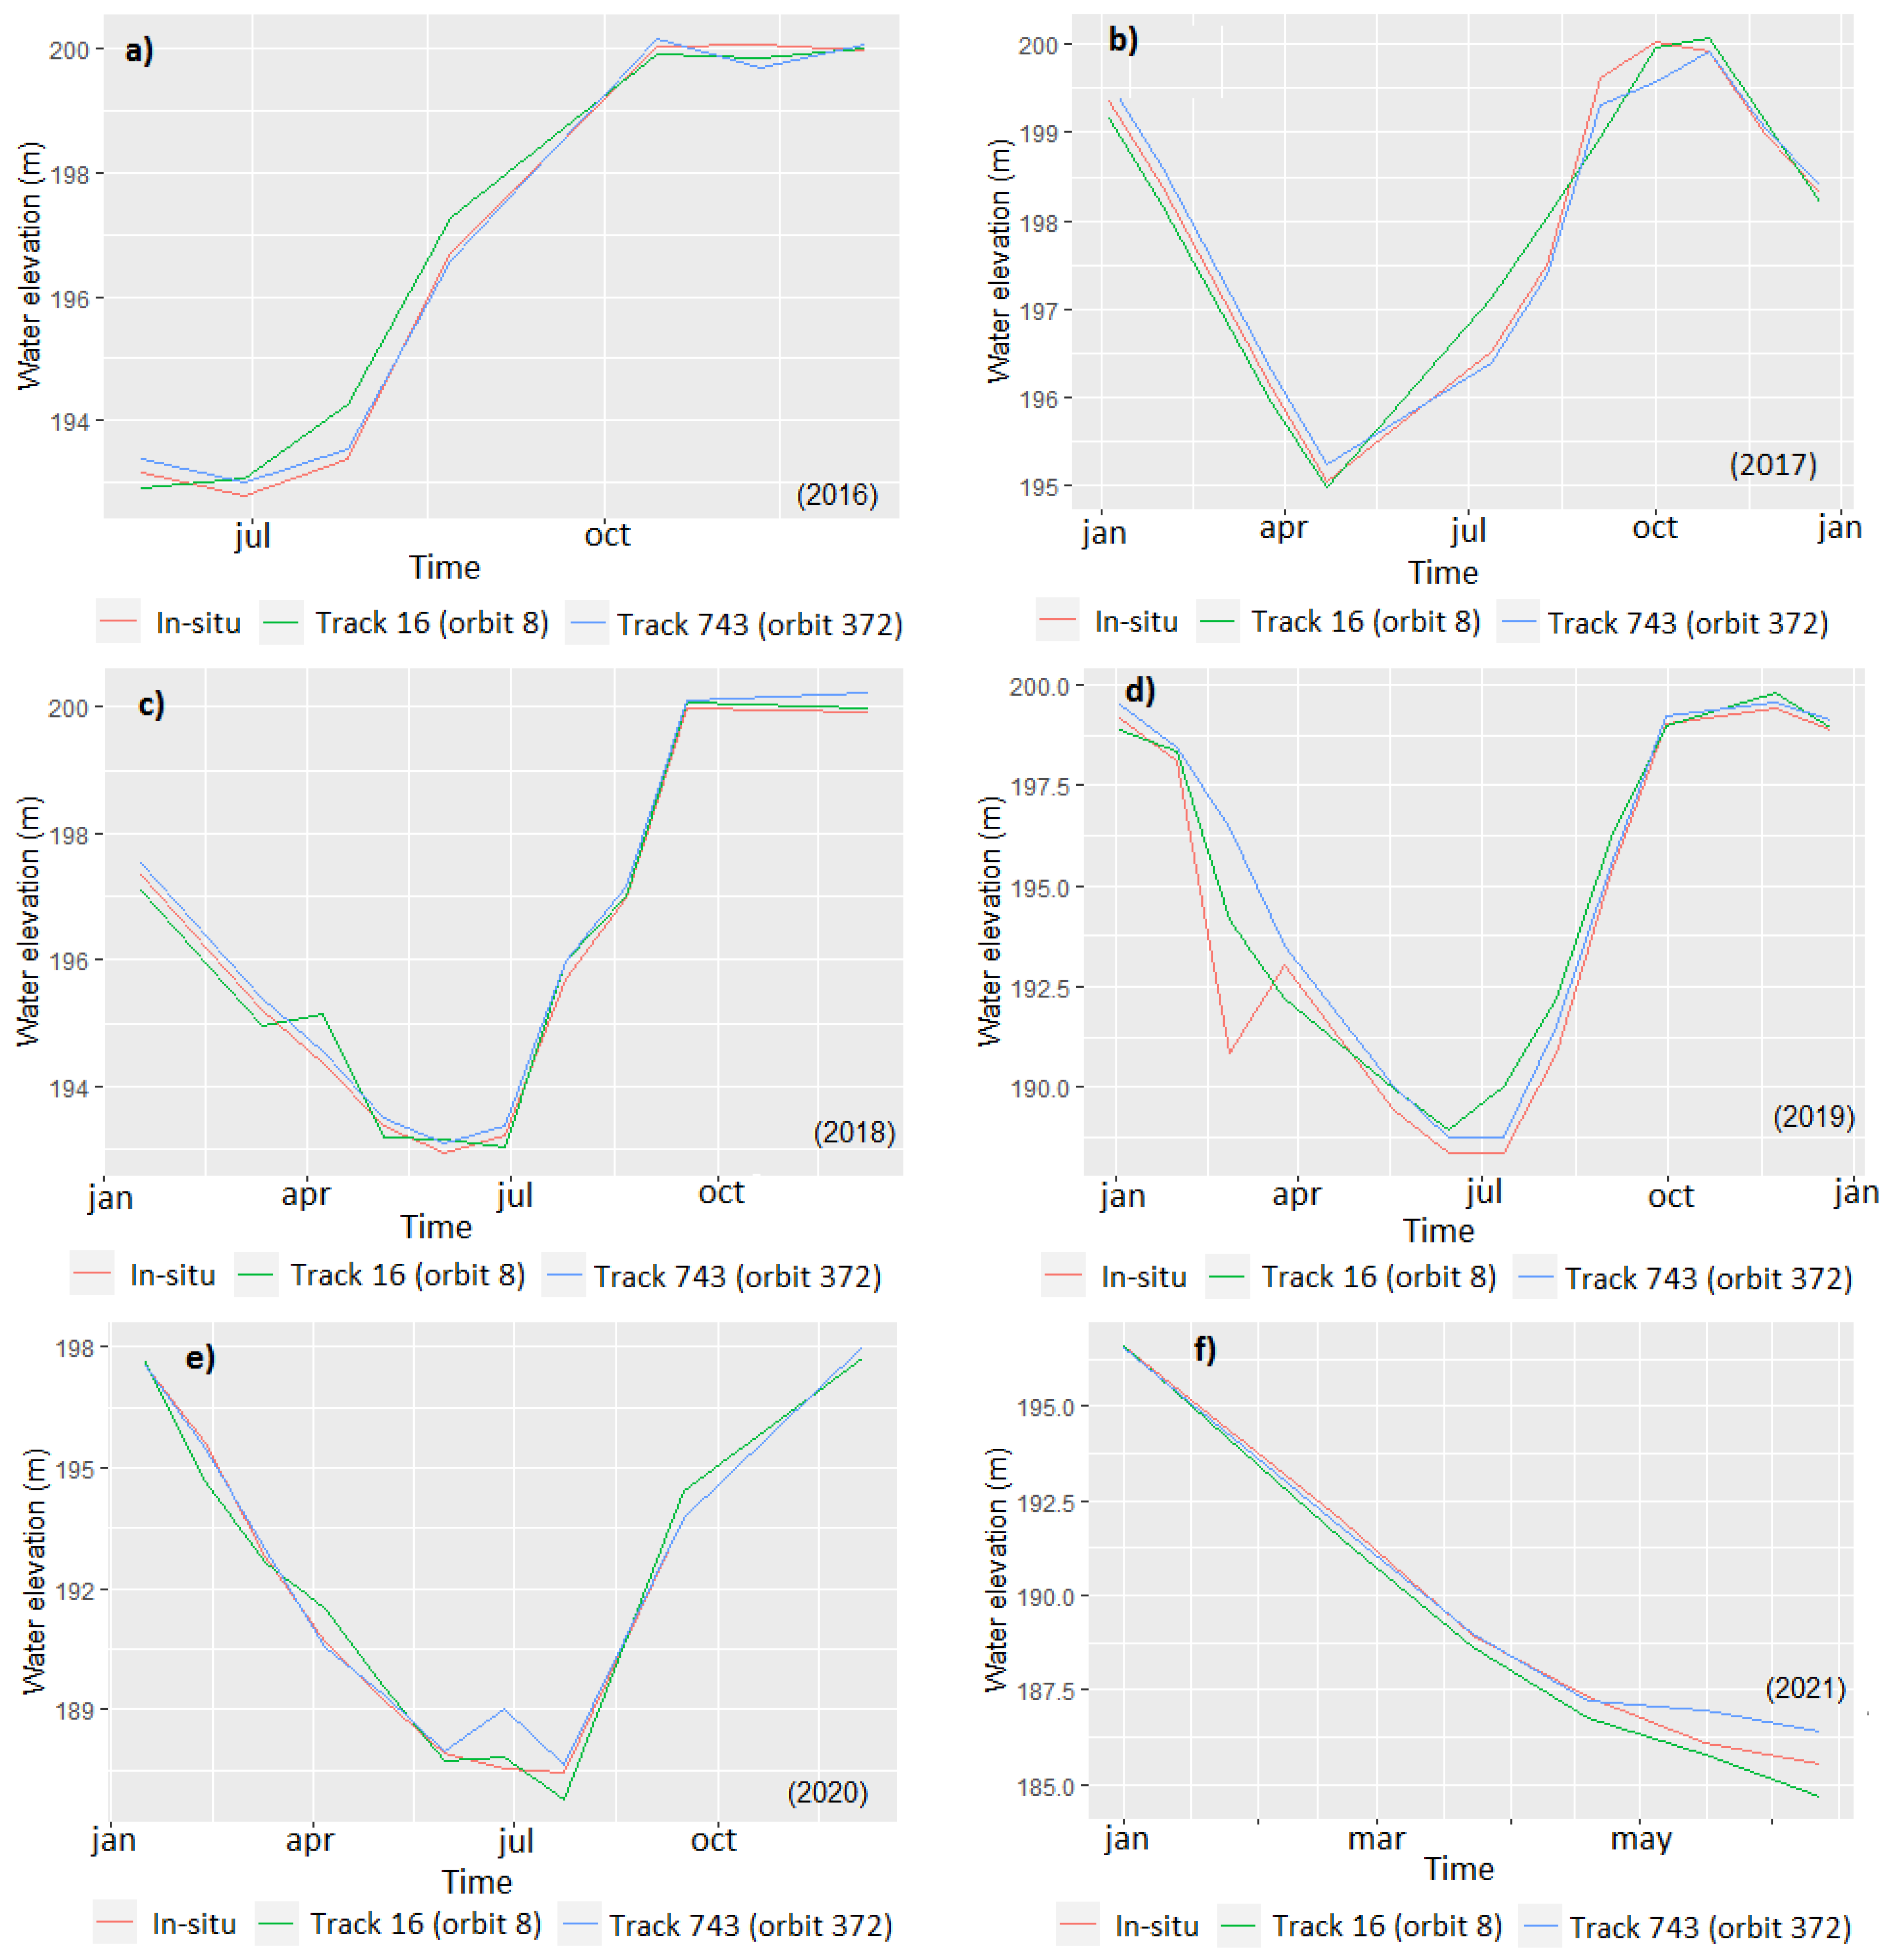
4.1. Agreement of Sentinel-3A Data with In Situ Measurements
4.2. Evolution of Water Levels in Lake Buyo from 2016 to 2021
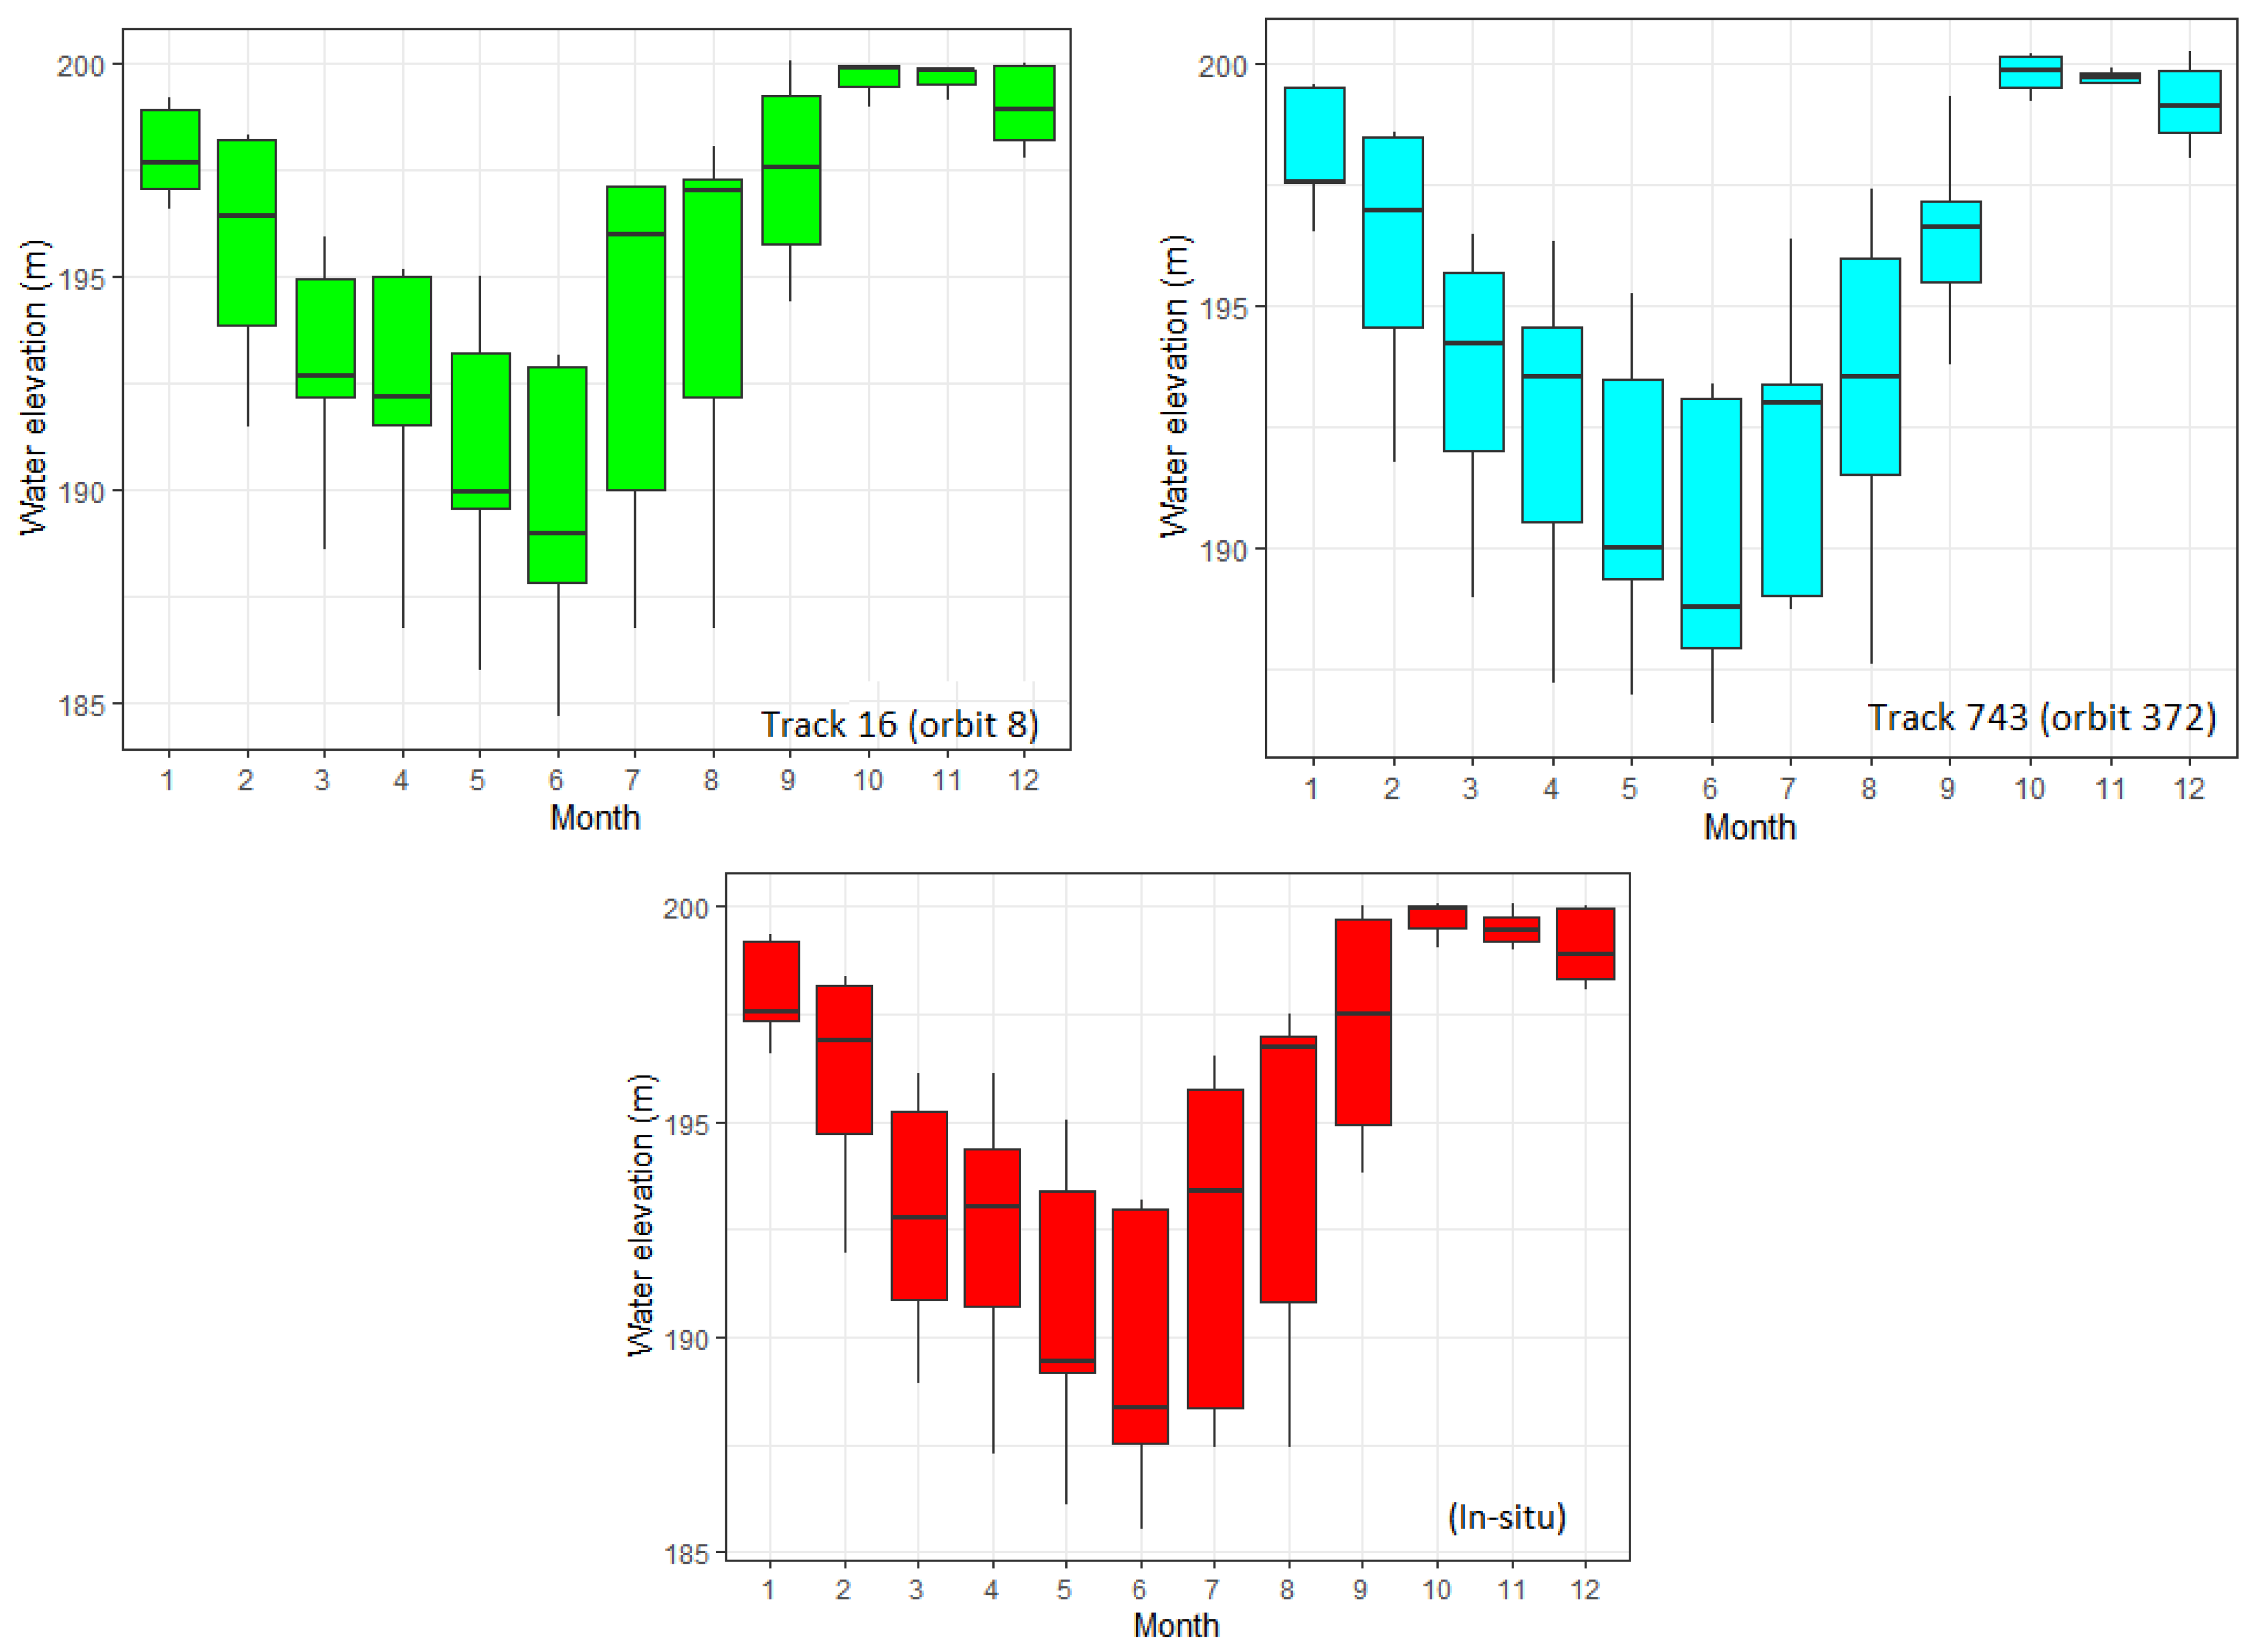
4.3. Annual and Seasonal Variations in Water Levels of Lake Buyo
5. Discussion
6. Conclusions
Author Contributions
Funding
Data Availability Statement
Acknowledgments
Conflicts of Interest
References
- Tramblay, Y.; Rouché, N.; Paturel, J.-E.; Mahé, G.; Boyer, J.-F.; Amoussou, E.; Bodian, A.; Dacosta, H.; Dakhlaoui, H.; Dezetter, A.; et al. ADHI: The African Database of Hydrometric Indices (1950–2018). Earth Syst. Sci. Data 2021, 13, 1547–1560. [Google Scholar] [CrossRef]
- Gleick, P.H. Global Freshwater Resources: Soft-Path Solutions for the 21st Century. Science 2003, 302, 1524–1528. [Google Scholar] [CrossRef] [PubMed]
- Alsdorf, D.E.; Rodríguez, E.; Lettenmaier, D.P. Measuring surface water from space. Rev. Geophys. 2007, 45, RG2002. [Google Scholar] [CrossRef]
- Alsdorf, D.; Beighley, E.; Laraque, A.; Lee, H.; Tshimanga, R.; O’Loughlin, F.; Mahé, G.; Dinga, B.; Moukandi, G.; Spencer, R.G.M. Opportunities for hydrologic research in the Congo Basin. Rev. Geophys. 2016, 54, 378–409. [Google Scholar] [CrossRef]
- Chawla, I.; Karthikeyan, L.; Mishra, A.K.A. Review of remote sensing applications for water security: Quantity, quality, and extremes. J. Hydrol. 2020, 585, 124826. [Google Scholar] [CrossRef]
- Papa, F.; Crétaux, J.-F.; Grippa, M.; Robert, E.; Trigg, M.; Tshimanga, R.M.; Kitambo, B.; Paris, A.; Carr, A.; Fleischmann, A.S.; et al. Water Resources in Africa under Global Change: Monitoring Surface Waters from Space. Surv. Geophys. 2022. [Google Scholar] [CrossRef]
- Tang, Q.; Gao, H.; Lu, H.; Lettenmaier, D.P. Remote sensing: Hydrology. Prog. Phys. Geogr. 2009, 33, 490–509. [Google Scholar] [CrossRef]
- Alsdorf, D.E.; Lettenmaier, D.P. Tracking fresh water from space. Science 2003, 301, 1491–1494. [Google Scholar] [CrossRef]
- Alsdorf, D.; Lettenmaier, D.; Vörösmarty, C. The need for global, satellite-based observations of terrestrial surface waters. Eos Trans. Am. Geophys. Union 2003, 84, 269–276. [Google Scholar] [CrossRef]
- Brown, G. Skylab S-193 Radar Experiment Analysis and Results; 1977. Available online: https://ntrs.nasa.gov/api/citations/19770013601/downloads/19770013601.pdf (accessed on 27 October 2022).
- Birkett, C.M. Contribution of the TOPEX NASA Radar Altimeter to the global monitoring of large rivers and wetlands. Water Resour. Res. 1998, 34, 1223–1239. [Google Scholar] [CrossRef]
- Rosmorduc, V.; Benveniste, J.; Lauret, O.; Milagro, M.; Picot, N. Radar Altimetry Tutorial; Benveniste, J., Picot, N., Eds.; 2006; Available online: http://www.altimetry.info (accessed on 27 October 2022).
- Smith, W.H.; Sandwell, D.T. Global sea floor topography from satellite altimetry and ship depth soundings. Science 2006, 277, 1956–1962. [Google Scholar] [CrossRef]
- Crétaux, J.-F.; Kouraev, A.V.; Papa, F.; Bergé-Nguyen, M.; Cazenave, A.; Aladin, N.; Plotnikov, I.S. Evolution of sea level of the big aral sea from satellite altimetry and its implications for water balance. J. Great Lakes Res. 2005, 31, 520–534. [Google Scholar] [CrossRef]
- Calmant, S.; Berge-Nguyen, M.; Cazenave, A. Global seafloor topography from a least-squares inversion of altimetry-based high-resolution mean sea surface and shipboard soundings. Geophys. J. Int. 2002, 151, 795–808. [Google Scholar] [CrossRef]
- Stammer, D.; Cazenave, A. Satellite Altimetry over Oceans and Land Surfaces, 1st ed.; Taylor & Francis Group, CRC Press: New York, NY, USA, 2017. [Google Scholar] [CrossRef]
- Mercier, F.; Rosmorduc, V.; Carrere, L.; Thibaut, P. Coastal and Hydrology Altimetry Product (PISTACH) Handbook; Centre National d’Études Spatiales (CNES): Paris, France, 2010; Volume 4. [Google Scholar]
- Vignudelli, S.; Birol, F.; Benveniste, J.; Fu, L.-L.; Picot, N.; Raynal, M.; Roinard, H. Satellite altimetry measurements of sea level in the coastal zone. Surv. Geophys. 2019, 40, 1319–1349. [Google Scholar] [CrossRef]
- Cipollini, P.; Benveniste, J.; Birol, F.; Joana Fernandes, M.; Obligis, E.; Passaro, M.; Ted Strub, P.; Valladeau, G.; Vignudelli, S.; Wilkin, J. Satellite altimetry in coastal regions. In Satellite Altimetry Over Oceans and Land Surfaces; CRC Press: Boca Raton, FL, USA, 2017; pp. 343–380. [Google Scholar] [CrossRef]
- Benveniste, J.; Cazenave, A.; Vignudelli, S.; Fenoglio-Marc, L.; Shah, R.; Almar, R.; Andersen, O.; Birol, F.; Bonnefond, P.; Bouffard, J.; et al. Requirements for a coastal hazards observing system. Front. Mar. Sci. 2019, 6, 348. [Google Scholar] [CrossRef]
- Crétaux, J.-F.; Birkett, C. Lake studies from satellite radar altimetry. Comptes Rendus Geosci. 2006, 338, 1098–1112. [Google Scholar] [CrossRef]
- Cretaux, J.-F.; Nielsen, K.; Frappart, F.; Papa, F.; Calmant, S.; Benveniste, J. Hydrological applications of satellite altimetry: Rivers, lakes, man-made reservoirs, inundated areas. In Satellite Altimetry Over Oceans and Land Surfaces; CRC Press: Boca Raton, FL, USA, 2017; pp. 459–504. [Google Scholar] [CrossRef]
- Fu, L.-L.; Cazenave, A. (Eds.) Satellite Altimetry and Earth Sciences; Elsevier: Amsterdam, The Netherlands, 2001; p. 465. [Google Scholar]
- Frappart, F.; Papa, F.; Marieu, V.; Malbeteau, Y.; Jordy, F.; Calmant, S.; Durand, F.; Bala, S. Preliminary Assessment of SARAL/AltiKa Observations over the Ganges-Brahmaputra and Irrawaddy Rivers. Mar. Geod. 2015, 38, 568–580. [Google Scholar] [CrossRef]
- Le Roy, Y.; Deschaux-Beaume, M.; Mavrocordatos, C.; Borde, F. SRAL, A radar altimeter designed to measure a wide range of surface types. In Proceedings of the 2009 IEEE International Geoscience and Remote Sensing Symposium, Honolulu, HI, USA, 25–30 July 2010. [Google Scholar]
- Raney, R.K. The delay/doppler radar altimeter. IEEE Trans. Geosci. Remote Sens. 1998, 36, 1578–1588. [Google Scholar] [CrossRef]
- Salameh, E.; Frappart, F.; Marieu, V.; Spodar, A.; Parisot, J.-P.; Hanquiez, V.; Turki, I.; Laignel, B. Monitoring Sea Level and Topography of Coastal Lagoons Using Satellite Radar Altimetry: The Example of the Arcachon Bay in the Bay of Biscay. Remote Sens. 2018, 10, 297. [Google Scholar] [CrossRef]
- Biancamaria, S.; Frappart, F.; Leleu, A.-S.S.; Marieu, V.; Blumstein, D.; Desjonquères, J.-D.; Boy, F.; Sottolichio, A.; Valle-Levinson, A. Satellite radar altimetry water elevations performance over a 200 m wide river: Evaluation over the Garonne River. Adv. Space Res. 2017, 59, 128–146. [Google Scholar] [CrossRef]
- Biancamaria, S.; Schaedele, T.; Blumstein, D.; Frappart, F.; Boy, F.; Desjonquères, J.D.; Pottier, C.; Blarel, F.; Niño, F. Validation of Jason-3 tracking modes over French rivers. Remote Sens. Environ. 2018, 209, 77–89. [Google Scholar] [CrossRef]
- Schwatke, C.; Dettmering, D.; Bosch, W.; Seitz, F. DAHITI—An innovative approach for estimating water level time series over inland waters using multimission satellite altimetry. Hydrol. Earth Syst. Sci. 2015, 19, 4345–4364. [Google Scholar] [CrossRef]
- Jiang, L.; Schneider, R.; Andersen, O.; Bauer-Gottwein, P. CryoSat-2 altimetry applications over rivers and lakes. Water 2017, 9, 211. [Google Scholar] [CrossRef]
- Chu, Y.H.; Li, J.; Jiang, W.; Zou, X.; Fan, X.; Xu, X.; Dadzie, I. Monitoring level fluctuations of the lakes in the Yangtze River basin from radar altimetry. Terr. Atmos. Ocean. Sci. 2008, 19, 63–70. [Google Scholar] [CrossRef]
- Girard, G.; Sircoulon, J.; Touchebeuf, P. Le Milieu Naturel de la Côte D’ivoire: Régimes Pluviométriques. Mémoire de Master.; ORSTOM: Paris, France, 1971; 401p. [Google Scholar]
- Guillaumet, J.; Et Adjanohoun, E. Le Milieu Naturel de la Côte D’ivoire: La Végétation. Mémoire de Master; ORSTOM: Paris, France, 1971; 401p. [Google Scholar]
- INS. Recensement Général de la Population et de L’habitat (RGPH) 2014; Répertoire des localités; République de Côte d’Ivoire: Abidjan, Côte d’Ivoire, 2015. [Google Scholar]
- Chelton, D.B.; Ries, J.C.; Haines, B.J.; Fu, L.-L.; Callahan, P.S. Chapter 1 Satellite Altimetry. In Satellite Altimetry and Earth Sciences A Handbook of Techniques and Applications; Elsevier: Amsterdam, The Netherlands, 2001; Volume 69, pp. 1–131. ISBN 0074-6142. [Google Scholar]
- Fernandes, M.J.; L’azaro, C.; Nunes, A.L.; Scharroo, R. Atmospheric corrections for altimetry studies over inland water. Remote Sens. 2014, 6, 4952–4997. [Google Scholar] [CrossRef]
- Frappart, F.; Blumstein, D.; Cazenave, A.; Ramillien, G.; Birol, F.; Morrow, R.; Rémy, F. Satellite Altimetry: Principles and Applications in Earth Sciences. In Wiley Encyclopedia of Electrical and Electronics Engineering; John Wiley & Sons, Inc.: Hoboken, NJ, USA, 2017; pp. 1–25. ISBN 047134608X. [Google Scholar]
- Frappart, F.; Blarel, F.; Fayad, I.; Bergé-Nguyen, M.; Crétaux, J.-F.; Shu, S.; Schregenberger, J.; Baghdadi, N. Evaluation of the Performances of Radar and Lidar Altimetry Missions for Water Level Retrievals in Mountainous Environment: The Case of the Swiss Lakes. Remote Sens. 2021, 13, 2196. [Google Scholar] [CrossRef]
- Bogning, S.; Frappart, F.; Blarel, F.; Niño, F.; Mahé, G.; Bricquet, J.P.; Seyler, F.; Onguéné, R.; Etamé, J.; Paiz, M.C.; et al. Monitoring water levels and discharges using radar altimetry in an ungauged river basin: The case of the Ogooué. Remote Sens. 2018, 10, 350. [Google Scholar] [CrossRef]
- Normandin, C.; Frappart, F.; Diepkilé, A.T.; Marieu, V.; Mougin, E.; Blarel, F.; Lubac, B.; Braquet, N.; Ba, A. Evolution of the performances of radar altimetry missions from ERS-2 to Sentinel-3A over the Inner Niger Delta. Remote Sens. 2018, 10, 833. [Google Scholar] [CrossRef]
- Nash, J.E.; Sutcliffe, J.V. River flow forecasting through conceptual models part I—A discussion of principles. J. Hydrol. 1970, 10, 282–290. [Google Scholar] [CrossRef]


| Name | Formula | Validation Criteria |
|---|---|---|
| Bias | must tend to 0 | |
| Root Mean Square Error | must tend to 0 | |
| Pearson correlation coefficient | must tend to 1 | |
| NSE coefficient | must tend to 1 |
| Parameters | Track 16 (Orbit 8) | Track 743 (Orbit 372) |
|---|---|---|
| Bias | 0.12 m | 0.13 m |
| Root Mean Square Error (RMSE) | 0.67 m | 0.38 m |
| Pearson correlation coefficient (R2) | 0.98 | 0.99 |
| NSE coefficient | 0.98 | 0.99 |
Publisher’s Note: MDPI stays neutral with regard to jurisdictional claims in published maps and institutional affiliations. |
© 2022 by the authors. Licensee MDPI, Basel, Switzerland. This article is an open access article distributed under the terms and conditions of the Creative Commons Attribution (CC BY) license (https://creativecommons.org/licenses/by/4.0/).
Share and Cite
Oularé, S.; Sokeng, V.-C.J.; Kouamé, K.F.; Komenan, C.A.K.; Danumah, J.H.; Mertens, B.; Akpa, Y.L.; Catry, T.; Pillot, B. Contribution of Sentinel-3A Radar Altimetry Data to the Study of the Water Level Variations in Lake Buyo (West of Côte d’Ivoire). Remote Sens. 2022, 14, 5602. https://doi.org/10.3390/rs14215602
Oularé S, Sokeng V-CJ, Kouamé KF, Komenan CAK, Danumah JH, Mertens B, Akpa YL, Catry T, Pillot B. Contribution of Sentinel-3A Radar Altimetry Data to the Study of the Water Level Variations in Lake Buyo (West of Côte d’Ivoire). Remote Sensing. 2022; 14(21):5602. https://doi.org/10.3390/rs14215602
Chicago/Turabian StyleOularé, Sékouba, Valère-Carin Jofack Sokeng, Koffi Fernand Kouamé, Christian Armel Kouassi Komenan, Jean Homian Danumah, Benoit Mertens, You Lucette Akpa, Thibault Catry, and Benjamin Pillot. 2022. "Contribution of Sentinel-3A Radar Altimetry Data to the Study of the Water Level Variations in Lake Buyo (West of Côte d’Ivoire)" Remote Sensing 14, no. 21: 5602. https://doi.org/10.3390/rs14215602
APA StyleOularé, S., Sokeng, V.-C. J., Kouamé, K. F., Komenan, C. A. K., Danumah, J. H., Mertens, B., Akpa, Y. L., Catry, T., & Pillot, B. (2022). Contribution of Sentinel-3A Radar Altimetry Data to the Study of the Water Level Variations in Lake Buyo (West of Côte d’Ivoire). Remote Sensing, 14(21), 5602. https://doi.org/10.3390/rs14215602