Article

Distribution Characteristics of Cloud Types and Cloud Phases over China and Their Relationship with Cloud Temperature

Plateau Atmospheric and Environment Laboratory of Sichuan Province, School of Atmospheric Sciences, Chengdu University of Information Technology, Chengdu 610225, China
*
Author to whom correspondence should be addressed.
Remote Sens. 2022, 14(21), 5601; https://doi.org/10.3390/rs14215601
Submission received: 4 September 2022 / Revised: 25 October 2022 / Accepted: 4 November 2022 / Published: 6 November 2022
(This article belongs to the Section Atmospheric Remote Sensing)

Abstract

:
The existence of clouds significantly increases or decreases the net radiation of the Earth. The influence of cloud type and cloud phase on radiation is as important as cloud amount, and the physical processes of different types of clouds are obviously different. In this study, the occurrence frequency of different cloud types (low transparent, low opaque, stratocumulus, broken cumulus, altocumulus transparent, altostratus opaque, cirrus, and deep convective) and cloud phases (ice and water) over China and its surrounding areas (0–55°N, 70–140°E) are calculated based on cloud vertical feature mask products from the Cloud-Aerosol Lidar with Orthogonal Polarization (CALIOP). The results show significant spatial differences and seasonal variations in the distribution of different cloud types and cloud phases. There are four prevailing cloud types over the whole year, among which cirrus and altocumulus transparent are the most widely distributed and have the highest occurrence frequency. Cirrus clouds are mainly distributed at altitudes above 6 km north of 30°N and south of 20°N. Altocumulus transparent clouds are mainly distributed over the Qinghai–Tibet Plateau and at an altitude of 3–6 km to the north of 40°N, and they are more widely distributed in winter than in summer. Water clouds are mainly distributed in the latitude range of 20°N–40°N and are obviously influenced by the Qinghai–Tibet Plateau. Water clouds are widely distributed in autumn and winter. Ice clouds are mainly distributed in the areas south of 20°N and north of 40°N. Regardless of the choice of altitude between 3 km and 7 km, the boundary between ice cloud and water cloud is always near the −14 °C isotherm, and when the −14 °C isotherm moves southward, the ice-cloud distribution range expands southward. The probability density functions of the temperature in the cloud always show the distribution characteristics of two peaks and one valley, which is particularly obvious in the middle and high clouds, and the peak temperature is warmer than the sub-peak temperature. The valley temperature and its corresponding latitude of all cloud types are different: the cirrus valley temperature is not significantly affected by the Qinghai–Tibet Plateau, but the plateau has an effect on the latitude of the valley temperature distribution of other types of cloud. The above conclusions lay the foundation for further research on the radiation effects of different clouds on China and its surrounding areas and also have certain indicating significance for weather effects caused by various cloud physical processes.

1. Introduction

Clouds can act as a radiation source, emitting thermal radiation while also absorbing or scattering shortwave solar radiation and outgoing longwave radiation [1]. The existence of clouds can significantly affect the increase or decrease in the net radiation of the earth, and this effect is closely related to their types and phases [2,3,4]. Chen et al. [5] showed that the adjustment of cloud type change on the radiation field of the Earth-atmosphere system is as important as that of cloud amount. From the global average level, low clouds contribute the most to the net energy balance of the earth [2]. The thin clouds at low and middle latitudes tend to heat the atmosphere [6]. For cloud phases, due to smaller particle sizes, the radiation effect of a liquid cloud is much greater than that of an ice cloud with the same water content [7]. On a global scale, the global radiative forcing caused by ice clouds has caused the net warming of the Earth-atmosphere system [8], while the liquid phase clouds have a negative net radiative effect [3]. Therefore, an important prerequisite for studying the impact of clouds on the Earth’s radiation balance is to accurately understand the spatial and temporal distribution characteristics of cloud types and cloud phases.
The change in cloud macro and micro characteristics is related to multiple meteorological elements [9,10,11]. Previous studies have shown that temperature, relative humidity, vertical velocity, divergence, and aerosol quantity concentration are key influencing factors in dynamic processes [12,13] and microphysical processes [14] of clouds. Background temperature fluctuation can establish a “dynamic balance” between the creation and loss of ice crystals [15]. The optical characteristics of ice crystals in cold clouds have a certain dependence on temperature [16]. The characteristics of cirrus clouds also depend on temperature [17]. For example, the extinction backscattering ratio of cirrus clouds is negatively correlated with temperature [18,19,20,21], and the shape ratio of particles in cirrus clouds are also strongly correlated with temperature, in which the depolarization rate increases with decreasing temperature [22,23]. Therefore, the temperature is one of the meteorological factors that have a greater impact on cloud characteristics, but there are few studies on the relationship between cloud distribution characteristics and intra-cloud temperature.
China is located in the east of the Eurasian continent, facing the Pacific Ocean, which is the world’s largest ocean to the east. It has the East Asian Monsoon (EAM), which is much more complex than other single global monsoon systems [24]. The Qinghai–Tibet Plateau is the largest and highest plateau in the world. Its thermal effects and mechanical forcing greatly affect the local climate and global atmospheric circulation [25,26,27,28]. The cloud system of the Qinghai–Tibet Plateau can not only affect local radiation such as that Min et al. [29] found that the net radiation effect of cirrus clouds on the Qinghai–Tibet Plateau is significantly higher than that in most parts of China but also has an impact on the climatology of the surrounding area [30]. Previous studies on the characteristics of cloud climatology in some parts of China were carried out through meteorological station observation data, ground radar, and Himawari-8 data [31,32,33]. However, due to the lack of observation data with high resolution and accurate identification of cloud types and cloud phases, the cognition of cloud climatology in China, especially in the Qinghai–Tibet Plateau, is still not very accurate [4,34,35]. Because of the insufficient understanding of cloud climatology characteristics and cloud physical processes [36], there is still a lack of cloud parameterization schemes for simulating and accurately predicting weather [37]. Therefore, a more accurate understanding of cloud types and cloud phase distribution characteristics is required to improve the cloud parameterization scheme.
Cloud-aerosol and Infrared Pathfinder Satellite Observation (CALIPSO) was launched in 2006, bringing wider coverage and higher resolution data to the study of cloud climatology [38]. Moreover, it can detect more optical thin clouds [39] and analyze more comprehensive cloud climatology. Cloud-Aerosol Lidar with Orthogonal Polarization (CALIOP) carried on the CALIPSO satellite is the only spaceborne lidar in orbit at present, which is used to detect the vertical structure of clouds and aerosols. Cai et al. [40] analyzed the probability of cloud occurrence and the relationship between cloud layers and cloud height in China and its surrounding areas by using CALIOP cloud layer (Clay) data, and further research needs to reveal the macroscopic characteristics of cloud types and cloud phases. CALIOP vertical feature mask (VFM) product, which classifies clouds uniformly, provides high-resolution data of cloud types and cloud phases and promotes the accurate understanding of the distribution characteristics of cloud types and cloud phases. It is of great significance for the study of cloud climatology.
The remainder of the paper is organized as follows. Section 2 describes the satellite observation and reanalysis data used for statistical analysis of cloud spatiotemporal characteristics and their relationship with cloud temperature. Section 3 and Section 4 describe the spatial characteristics and seasonal variations of different types and phases of clouds. The spatial distribution characteristics of cloud temperature and its relationship with cloud types and cloud phases are provided in Section 5. A summary and prospects are presented in Section 6.

2. Data and Methods

2.1. Data

CALIOP is the first satellite lidar optimized for aerosol and cloud measurements, using active remote sensing to measure detailed vertical distributions of aerosols and clouds as well as their microphysical and optical properties [41]. The inclination of CALIPSO’s orbit is 98.2°. The orbital period is about 99 min, and 14.55 circles around the Earth every day. When passing through the equator, the track of each circle retreats westward with a longitude of 24.7°, and the flight orbit shifts westward by 10.8° day by day. In this way, the vertical detection area of the satellite can cover the whole world (the cross-orbit deviation is less than ± 10 km) after a flight cycle of 233 circles in 16 days. Compared with a variety of detection data, CALIPSO data products were verified to have good measurement sensitivity and spatial characteristics [42,43,44,45,46]. CALIOP classifies clouds and aerosols through scene classification algorithms (SCA) [47,48], and the cloud and aerosol layer information provided by this algorithm are reliable [49].
In this paper, CALIPSO’s Level 2 VFM products from June 2006 to June 2020 are used to statistically analyze the spatial distribution and seasonal variation of the cloud occurrence frequency of different types and phases. Cloud types in VFM products are divided into eight categories: low overcast (transparent), low overcast (opaque), transition stratocumulus, low broken cumulus (transparent), altocumulus (transparent), altostratus (opaque), cirrus (transparent) and deep convective (opaque). VFM can distinguish between ice and water in clouds, which refer to the phases of particles contained in the clouds, not the phases of the entire cloud. Therefore, the water clouds in the following text all represent clouds with liquid components rather than clouds with all liquid components. The samples selected in this paper were obtained with laser beams that can penetrate clouds to the ground. As clouds with an optical thickness of less than 0.02 cannot be detected [50] and an optical thickness greater than 3 is the detection limit of laser radar [51], this paper studies only cloud in the optical thickness range of 0.02–3. Some deep convective clouds cannot be detected in the vertical direction by laser radar owing to their large thickness; therefore, they are not included in the statistical analysis in this paper. In addition, CALIOP L2-VFM provides a corresponding quality assessment. According to the cloud-aerosol identification algorithm, the identification results are labeled with credibility [48], which is divided into four categories: high, moderate, low, and untrusted. In this paper, the quality of the data above 90% is highly credible.
To study the relationship between cloud distribution characteristics and intra-cloud temperature, ERA5 (ECMWF Reanalysis V5) temperature data from June 2006 to June 2020 were used to determine the intra-cloud temperature through vertical interpolation. ERA5 is the fifth generation of atmospheric reanalysis data produced by the European Centre for Medium-Range Weather Forecasts (ECMWF) for global climate from January 1950 to the present, with a resolution of 0.25° × 0.25°, providing estimates of a large number of atmospheric, terrestrial and oceanic climate variables [52].

2.2. Methods

The VFM products have a horizontal resolution of 333 m at altitudes ranging from −0.5 to 8.2 km. In this paper, the data are divided into a grid of 1° × 1°, and the scattering particles on different heights detected by each profile were taken as samples in each grid. Then the gridded data are used to analyze statistically. The prevailing cloud type and cloud phase in each grid are determined by selecting the mode, which means that the type and phase of the cloud with the largest number of occurrences are the prevailing cloud type and cloud phase in the grid. In our study, the method of mode selection to grid data has the advantage that compared with the median and average; it can better represent the typical cloud types and cloud phase of the grid. In the gridded data, the zonal average of the number of observation profiles was above 123,000 (Figure 1a) and the zonal average of the number of observation orbits was above 440 (Figure 1b). Owing to the orbit of the polar-orbiting satellite, the observation frequency in the high-latitude area is greater than that in the low-latitude area.
For ERA5 reanalysis data with 0.25° × 0.25° resolution, we used the nearest neighbor interpolation method to match the 0.25° × 0.25° reanalysis data with the satellite data with 333 m horizontal resolution and then used the processed data for the PDF analysis in Section 5.

3. Frequency Distribution Characteristics of Different Cloud Types

3.1. Annual Cloud Occurrence Frequency Distribution Characteristics

There are four prevailing cloud types (Figure 2a) throughout the year: altocumulus (transparent; Ac tra), altostratus (opaque; As op), cirrus (Ci), and deep convective clouds (Dc). Altocumulus (transparent) clouds are distributed in bands along the west and south sides of the Qinghai–Tibet Plateau, with significant differences between the mainland and the sea in the northeast. They are mainly distributed over land, covering the central and eastern parts of the Mongolian Plateau and the northeastern part of China, whereas a small amount is distributed over the eastern ocean and the Sea of Japan. Altostratus (opaque) are concentrated in the Sichuan Basin and surrounding mountains and scattered into an altocumulus (transparent) band over the south of the Qinghai–Tibet Plateau. Cirrus clouds cover most areas, especially over the ocean. Pan et al. [53] also found this phenomenon in East Asia: the annual average cloud cover is dominated by cirrus (44.4%); that is, cirrus has a dominant role. As described earlier, most of the deep convective clouds were not included in the analysis. Since the frequency of deep convective clouds is low, it is unlikely that they would be the prevailing cloud type if they were included. Over the Qinghai–Tibet Plateau, owing to topographical reasons, some deep convective clouds are not thick and can be completely detected vertically. This is also an important reason why deep convective clouds mainly appear over the southern part of the plateau.
The ratio of the number of cloud samples of each type to the total number of cloud samples is the occurrence frequency of this cloud type. There are also obvious regional differences in the occurrence frequency of the various cloud types. Low overcast (transparent) (Figure 3a) and low overcast (opaque) (Figure 3b) have a similar horizontal distribution of occurrence frequency. They mainly appear on the north side of Balkhash Lake, the eastern and southern coastal areas of China, and the eastern ocean, with a frequency of only 2–6%, and the frequency in other areas is less than 2%. Stratocumulus (Figure 3c) clouds are distributed in all areas except the areas with higher altitudes, and the frequency of stratocumulus is higher over the eastern ocean, up to 14–18%. Low broken cumulus (transparent) (Figure 3d) occur more frequently over the ocean south of 30°N than over land and are more common over the southern slope of the plateau, up to 30%. The occurrence frequency of altocumulus (transparent) (Figure 3e) and altostratus (opaque) (Figure 3f) over the land can reach 26% and is higher than that over the ocean, which is less than 10%. Altocumulus (transparent) clouds are common over 40°N, the Qinghai–Tibet Plateau and its eastern region. Altostratus (opaque) clouds are common around the Qinghai–Tibet Plateau region and the southwest of China. Cirrus clouds (Figure 3g) are the most frequent among the eight types of cloud because the frequency of cirrus is more than 25% in all regions except at latitudes of 20°N–30°N, and the Qinghai–Tibet Plateau is the high-frequency region of cirrus. This is consistent with the research results of Chen and Liu [54], who indicated that there are two independent cirrus active regions over the Qinghai–Tibet Plateau and the Asian monsoon region, one located between the equator and 20°N, and the other over the plateau. Deep convective clouds (Figure 3h) are mainly distributed over the Qinghai–Tibet Plateau and equatorial regions. In general, the frequency distribution of all kinds of clouds is affected by the Qinghai–Tibet Plateau. Except for deep convective clouds, the frequency of low cloud is less than that of medium cloud and high cloud, and the distribution of low cloud and medium cloud shows an obvious sea–land difference. Low cloud is mainly distributed over the ocean, whereas medium cloud is mainly distributed over the land.

3.2. Cloud Frequency Distribution of Seasonal Change

The distribution of prevailing cloud types shows significant seasonal differences (Figure 4). A comparison of the distribution of prevailing cloud types throughout the year (Figure 2a) shows that the distribution range of transparent altocumulus clouds increases significantly in autumn and winter. Due to the high altitude of the Qinghai–Tibet Plateau, the warm and humid air is easily lifted by the terrain to form cirrus clouds [54,55,56]. The prevailing cloud type in the four seasons of the main part of the plateau is cirrus. Therefore, the transparent altocumulus clouds here are divided into a northern band and a southern band; the two bands widen in winter, and the southern boundary of the southern belt reaches 15°N (Figure 4c,d). It may be related to the cirrus moving from north to south from summer to winter with the seasonal movement of the intertropical convergence zone (ITCZ) in the tropical region [55]. In spring (Figure 4a), the distribution of transparent altocumulus clouds in the north decreases, and the northern band almost disappears. The northern boundary of the southern band is located at 30°N, and the western region, namely, the southern side of the Qinghai–Tibet Plateau, is the main distribution region. The distribution pattern in summer (Figure 4b) is opposite to that in spring. The banded distribution disappears in the south and becomes massive, covering Balkhash Lake and its surrounding areas in the north. Altostratus cover also shows the characteristic of more clouds in autumn and winter than in spring and summer. Compared with the whole year (Figure 2a), the distribution of altostratus in autumn (Figure 4c) is slightly larger than that of the whole year. In winter (Figure 4d), altostratus obviously expands eastward, covering the lower–middle reaches of the Yangtze River. Because altostratus clouds are mainly formed by frontal cyclones, the northeast monsoon and northwest monsoon prevail in East Asia in winter, and the frontal cyclone activities are frequent in the lower–middle reaches of the Yangtze River, which may be the reason for tIe increased frequency of altostratus, thus, becoming the prevailing cloud type here. The distribution of altostratus decreases slightly in spring (Figure 4a) and does not appear as the prevailing cloud type in summer (Figure 4b). However, because deep convective clouds mainly depend on convective activities occurring in spring and summer, the distribution of deep convective clouds also shows a significant seasonal difference compared with the annual distribution (Figure 2a). There are more deep convective clouds in spring and summer than in winter and autumn. In spring (Figure 4a), they are mainly distributed in the central and eastern parts of the plateau and the lower–middle reaches of the Yangtze River. In summer (Figure 4b), it occurs sporadically over the Bay of Bengal, the northwest, north, and northeast of China, and the eastern ocean. Cirrus appear all year round in areas south of 20°N, the Qinghai–Tibet Plateau, and Balkhash Lake to Baikal Lake.
To obtain more detailed seasonal differences in the different cloud types, the proportion of cloud types in each season was analyzed (Figure 5). It was found that the proportion of cirrus was the highest in all seasons, followed by low broken cumulus and altocumulus (transparent), which were common clouds. However, the proportion of low overcast (transparent) and low overcast (opaque) was the lowest, which is consistent with the previous conclusion of the horizontal distribution of the occurrence frequency of all kinds of clouds. The seasonal distribution of low overcast (transparent) and low overcast (opaque) is similar, with the lowest occurrence in spring and the highest occurrence in autumn. Stratocumulus appears most in summer and least in spring. As one of the common clouds, low broken cumulus appear most in winter and least in autumn. The proportion of altocumulus (transparent) was the highest in spring and the lowest in summer. Altostratus clouds (opaque) appear most frequently in summer and rarely in spring. Cirrus clouds are most common in spring and less common in autumn. The seasonal percentage of deep convective clouds is quasi-invariant, with the proportion between 8–9%, which is slightly less in winter and slightly more in spring, with the difference far less than 1%. The phenomena may be caused by the fact that most of the deep convective clouds are too thick in summer to be penetratingly detected by lidar, so they are eliminated in the study.

3.3. Vertical Distribution of Cloud Occurrence Frequency

To study the characteristics of the vertical distribution of clouds, the altitude range of 0–8 km (above sea level) is divided into 8 layers because the prevailing cloud type mainly changes at altitudes below 8 km, and the prevailing cloud type in each layer is statistically analyzed (Figure 6). It is found that the prevailing cloud types of the lower layer (altitude of 0–3 km) are stratocumulus and low broken cumulus. The prevailing cloud types in the middle and lower layers (altitude of 3–6 km) are transparent altocumulus and opaque altostratus, whereas the prevailing cloud types in the middle and upper layers (6–8 km) are cirrus and deep convective clouds. As the average altitude of the main body of the Qinghai–Tibet Plateau is above 4000 m, there are no data for the main area of the plateau for the first four layers. In the lower layer, stratocumulus is present over the coastal area, the eastern ocean area, and the area north of Balkhash Lake in the northwest, whereas the rest of the region is mostly fragmented cumulus. The prevailing cloud type in the northern region at 1–3 km gradually changes from fragmented cumulus to transparent altocumulus with increasing altitude. In the middle and lower levels, the prevailing cloud type over central, eastern, and southern China and the eastern ocean is altostratus opaque, whereas the other areas are transparent altocumulus. In the middle and high levels, cirrus is the prevailing cloud type in most of the region, and only deep convective cloud is the prevailing cloud type over most of the 20°N–30°N latitude belt and sporadic areas to the south of it. In general, the prevailing cloud type at different altitude levels is consistent with the World Meteorological Organization (WMO) cloud-height classification criteria, but there are obvious differences in the geographical distribution of all kinds of clouds at different altitude levels, indicating that it is important to study the cloud climate characteristics by classifying clouds into eight types.

4. Frequency Distribution Characteristics of Different Cloud Phases

4.1. Annual Cloud Occurrence Frequency Distribution Characteristics

Similarly, the ratio of the number of cloud samples for a given phase to the total number of cloud samples in the sky is the occurrence frequency of the cloud phase. In a grid, the cloud phase with the highest occurrence frequency is the prevailing cloud phase of this grid. The annual prevailing cloud phase distribution (Figure 7) has significant latitude differences. Water clouds show obvious zonal distribution characteristics in the latitude range of 20°N–40°N. The western segment of the water-cloud belt over East Asia is obviously squeezed by the Tibetan Plateau, resulting in the characteristic of the water-cloud belt being narrow in the west and wide in the east. The northern boundary of the eastern part of the continental water-cloud zone is located over the Qinling Mountain and Huaihe river (QMHR). The ice cloud covers the south of 20°N, the Tibetan Plateau, and the north of 40°N.

4.2. Cloud Frequency Distribution of Seasonal Change

The prevailing cloud phase distribution has obvious seasonal differences (Figure 8). There is a coherent strip of water clouds dominating the south and east of the Qinghai–Tibet Plateau in seasons other than winter. In autumn, the water cloud distribution expands over the northern side of the East Asian continent, covering the North China Plain and the Korean Peninsula; in winter, the northern side of the water cloud band is roughly along the QMHR line. In spring, the northern boundary of the water cloud retreats southward to the Yangtze River and Sichuan Basin. In spring and autumn, the southern boundary of the water cloud is located at 20°N, whereas it retreats to about 15°N in winter, and the western part of the belt retreats to 10°N, covering most of the Indian Peninsula. In summer, the water cloud dominates over the west of the Tibetan Plateau, and the water-cloud belt over the continent in the east of the Tibetan Plateau reaches the northernmost boundary of the year, up to 40°N. The increasing frequency of ice-cloud occurrence causes the water cloud belt to break up.

4.3. Vertical Distribution of Cloud Occurrence Frequency

For the distribution of prevailing cloud phases at different altitude layers (Figure 9), it is found that water clouds are mainly distributed over ocean areas below 3 km, and the distribution range of water clouds expands to land with increasing altitude. At altitudes above 3 km, the temperature decreases with increasing altitude, and the ice-cloud coverage gradually expands southward.

5. The Relationship between Cloud Distribution Characteristics and Cloud Temperature

When the relative humidity is higher than 140% and the temperature is colder than −38 °C, the ice in tropospheric clouds will freeze through homogenous freezing. However, when the relative humidity is lower than 140%, and the temperature is warmer than −38 °C, ice formation can occur through heterogeneous nucleation assisted by aerosol particles called ice nucleating particles (INPs) [57]. To determine the effect of intra-cloud temperature on the distribution characteristics of the different cloud types and phases, we overlay the temperature of the different altitude layers on the cloud-phase distribution (Figure 10). The results show that the southern boundary of ice-cloud coverage and the position of −14 °C and −16 °C isotherms are very close. In all of the 1 km layers from 3 km to 7 km, as the −14 °C isotherm moves southward, the distribution range of the ice cloud also expands southward, and the distribution boundary between the ice cloud and water cloud is always near the −14 °C isotherm. This pattern of temperature variation with altitude at the boundary between ice and water cloud coverage may be due to changes in the concentration of INPs particles with altitude. According to the results from Figure 10, −14 °C may be the transition temperature (T*) indicated by Carlsen and David [58], which is from liquid clouds to mixed-phase clouds (MPCs) due to INPs over China and surrounding areas.
The relationship between the distribution characteristics of different cloud types and the intra-cloud temperature was further explored (Figure 11). The probability density functions (PDFs) of the intra-cloud temperature always show a distribution of two peaks and one valley. The distribution of two peaks and one valley is particularly obvious in the middle and high clouds. Separately, it can be seen that the inner temperature of the low, transparent cloud (Figure 11a) and low opaque cloud (Figure 11b) are between −12 °C and 28 °C, with a span of about 40 °C. The stratocumulus (Figure 11c) and low broken cumulus (Figure 11d) show intra-cloud temperatures ranging from −11 °C to 22 °C with a decreasing temperature span. The intra-cloud temperature of the two types of middle clouds (transparent altocumulus (Figure 11e) and opaque altostratus (Figure 11f)) obviously decreased. The maximum temperature and minimum temperature differ by only about 27 °C between −20 °C and 7 °C. According to the two peaks and one valley distribution of intra-cloud temperature PDFs, we define the temperature corresponding to the maximum PDF value of the peaks as the “peak temperature” and the temperature corresponding to the minimum PDF value between the two peaks as the “valley temperature” for further study. MPCs are composed of liquid droplets and ice crystals, and the formation of ice crystals in MPCs depends on INPs [58]. INPs can be divided into accumulation mode particles (0.3–1 μm) and coarse particles (1–10 μm) according to the particle diameter [59,60]. DeMott et al. [61] indicated that the concentration of active INPs in MPCs may be related to temperature and the concentration of particles larger than 0.5 μm in diameter. Mason et al. [62] further found that the concentration of INPs increased with decreasing temperature, while the concentration of coarse particles decreased with decreasing temperature. For MPCs (such as Ac and As), the two peaks may correspond to the accumulation and coarse modes of INPs in the cloud. Therefore, the relationship between the concentration of particles of two sizes and temperature may provide a new idea for the conversion mechanism of liquid-solid particles in mixed-phase clouds. The distribution of cirrus (Figure 11g) has the most obvious characteristic of two peaks and one valley, in which the peak temperature is about −40 °C, and the secondary peak temperature is about −62 °C. Keckhut et al. [63] found a peak at −45 °C and a subpeak at −60 °C on the cirrus temperature PDF in the south of France. The two peak temperatures are close to the results of this study, and this dual peak structure is similar. Cirrus clouds form by the homogenous freezing of liquid droplets and heterogeneous nucleation of ice nuclei. These two mechanisms are related to temperature. At low temperatures, homogenous freezing is considered to be the main way of cirrus formation, while at temperatures higher than −38 ℃, the formation of cirrus is more dependent on heterogeneous freezing [64,65,66]. Therefore, the dual-peak structure of the PDF of cirrus internal temperature is most likely caused by two formation mechanisms of cirrus. The cold peak may correspond to the cirrus formed by homogenous freezing, while the warm peak may correspond to the cirrus formed by heterogeneous freezing. Therefore, the study of this temperature PDF implies that heterogeneous ice nucleation may be the dominant formation mechanism of cirrus in China (Figure 11g), and the valley temperature may indicate that is the temperature at which both the homogeneous and heterogeneous processes of cirrus formation are not active. As most of the deep convective clouds have been eliminated in this study and the PDFs of the temperature within the cloud are not representative, correlation analysis of the deep convective clouds is not carried out here.
As shown in Figure 12, the valley temperature of low opaque clouds is the coldest among the four types of low clouds, only 2 °C. The valley temperature increases gradually from low opaque cloud to stratocumulus to broken cumulus, and the location extends southward, indicating that the cloud distribution location in the peak of the PDF of low cloud has obvious latitudinal variation. The valley temperatures of the middle clouds (transparent altocumulus and opaque altostratus) were −6 °C and −9 °C, respectively, with little difference in location. According to the geographic distribution of intra-cloud temperature of the two kinds of MPCs, it is suggested that there is a latitude difference between the accumulation and the coarse modes of INPs in the MPCs. The intra-cloud temperature distribution of cirrus shows an opposite trend to that of the other six cloud types. It is characterized by low temperature in the south and high temperature in the north, and the valley temperature is −45 °C, located at 30°N. This temperature difference between mid- and low-latitude cirrus clouds is the same as that in Platt et al. [56], who observed cirrus characteristics in mid-latitude areas (Aspendale, Australia) and tropical areas (Darwin). They found that the occurrence frequency of cirrus varies with latitude and temperature; for example, in mid-latitude areas, cirrus are most frequent when the cloud temperatures range from −50 °C to −40 °C and from −70 °C to −60 °C in the tropics. Sunilkumar and Parameswaran [17] also found that 90% of the cloud temperature of low-latitude cirrus is colder than −50 °C, colder than that of mid-latitude cirrus. Such temperature distribution may indicate that the formation of cirrus clouds at middle and high latitudes depends more on heterogeneous nucleation, so as shown in Figure 11g. As Gierens [67] found, the heterogeneous process plays a more important role in the formation of cirrus clouds at middle latitudes in the Northern Hemisphere, and air pollution is likely to increase cirrus cloud coverage, which will be optically thinner than clouds formed by homogenous freezing. Therefore, further research based on this paper may reveal the morphology of clouds over China. The cirrus valley-temperature isotherm is relatively zonal, roughly along 30°N, located over the south of the Qinghai–Tibet Plateau and not significantly affected by the plateau, whereas the valley temperatures of other types of cloud are obviously affected by the Qinghai–Tibet Plateau. For altocumulus and altostratus (Figure 12e,f), the distribution of valley temperature demonstrates the influence of topography on cloud climatology.
PDF analysis of the intra-cloud temperature for different phases of the cloud was also carried out (Figure 13). It is found that the PDF distribution of intra-cloud temperature for ice cloud and water cloud has an obvious characteristic of two peaks and one valley. The peak temperature of the ice cloud is −35 °C, warmer than that of the cirrus cloud, and the secondary peak temperature is −68 °C. The peak temperature of the water cloud is 2.5 °C, and the secondary peak temperature is −15 °C. As mentioned above, the homogeneous nucleation and heterogeneous nucleation of ice clouds are closely related to temperature. Therefore, Figure 13a further proves that the corresponding relationship between temperature and homogeneous nucleation and heterogeneous nucleation of clouds is determined by cloud phase rather than cloud type.
As shown in Figure 14, the horizontal distribution of temperature in ice clouds and water clouds shows an opposite distribution trend from north to south. The valley temperature of the ice cloud is −53 °C, and the isotherm is between 25°N and 30°N. In particular, the temperature in the northern area of the valley-temperature contour is warmer than that in the southern area of the valley-temperature contour. Murray et al. [68] pointed out that water droplets in the Earth’s troposphere are known to supercool to about −37 °C, at which temperature ice nucleates homogeneously on a short timescale. Therefore, Figure 14a may imply that ice cloud formation in low latitudes may be more dependent on a homogeneous process. The valley temperature of the water cloud is −7 °C, and the valley temperature isotherm is located over the south of the western area, distributed along the southern side of the Qinghai–Tibet Plateau, and retracts to about 25°N as far south as possible. The eastern part of the Sea of Japan extends about 45°N to the north. The temperature to the north of the contour line is colder than the valley temperature, whereas the temperature to the south is warmer than the valley temperature. The temperature distribution in the water cloud also shows an obvious difference between the sea and the land. It can be seen that the temperature over the sea surface is warmer, whereas the temperature over the land decreases with increasing altitude, indicating that the temperature in the water cloud is obviously related to the terrain.

6. Conclusions

To understand the cloud radiation effect and the climatological characteristics of the cloud physical process in China more accurately, using CALIOP Level 2 VFM cloud data products from June 2006 to June 2020, this study analyzed the occurrence frequency of different types and phases of cloud over China and its surrounding areas and determined the regional differences and seasonal variations. In addition, we analyzed the relationship between cloud distribution characteristics and cloud temperature and reached the following conclusions.
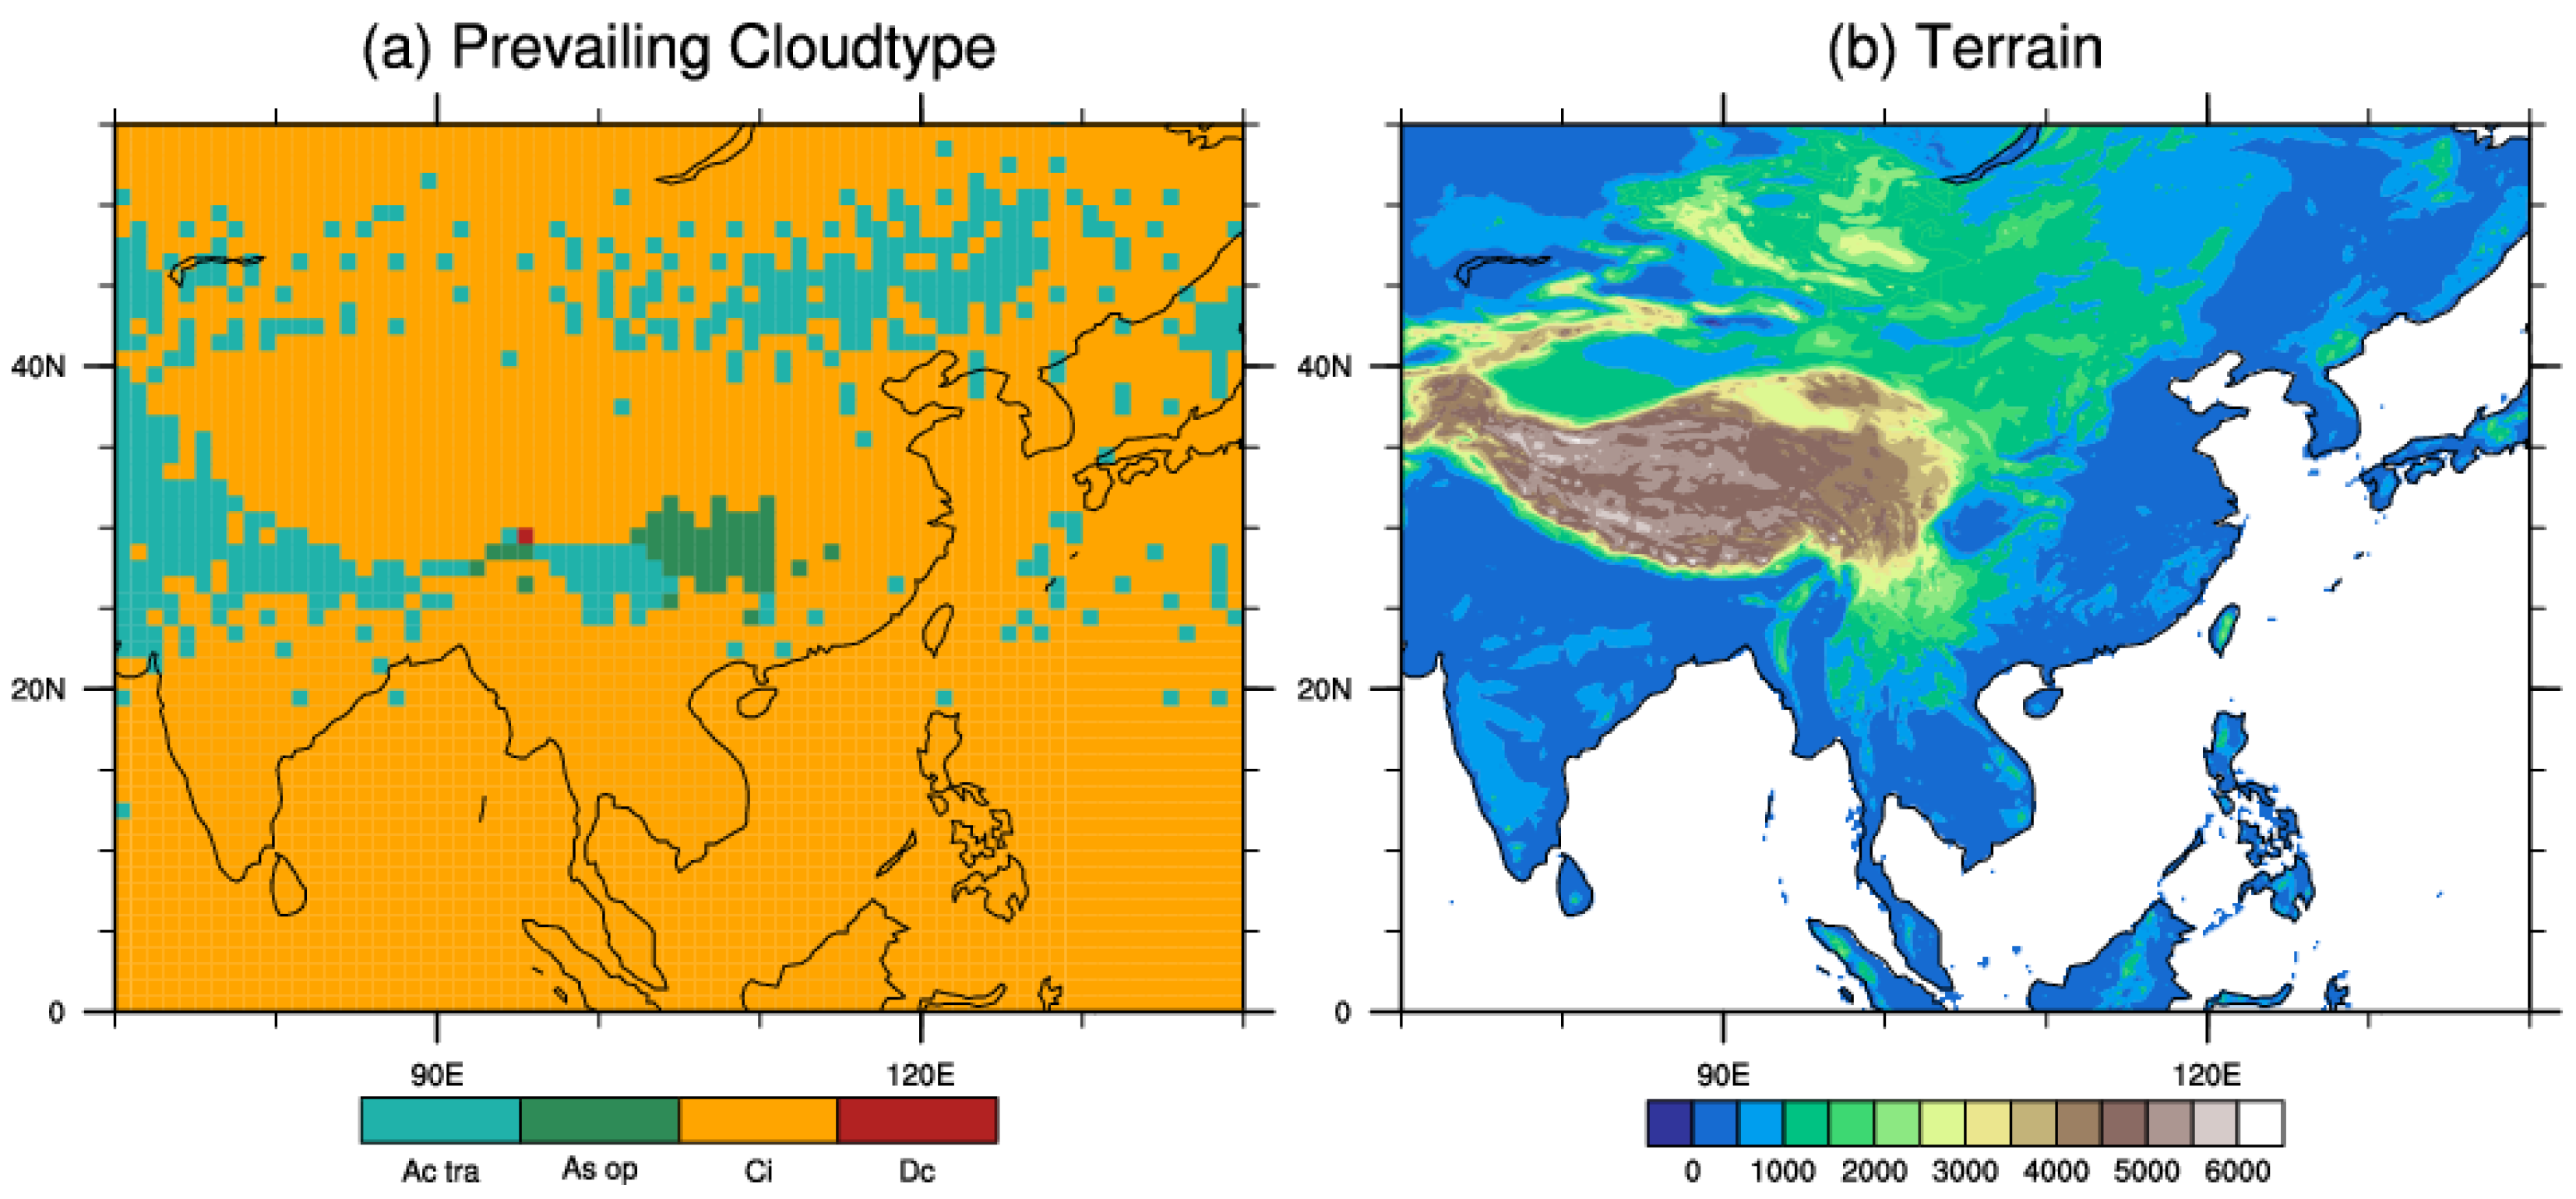
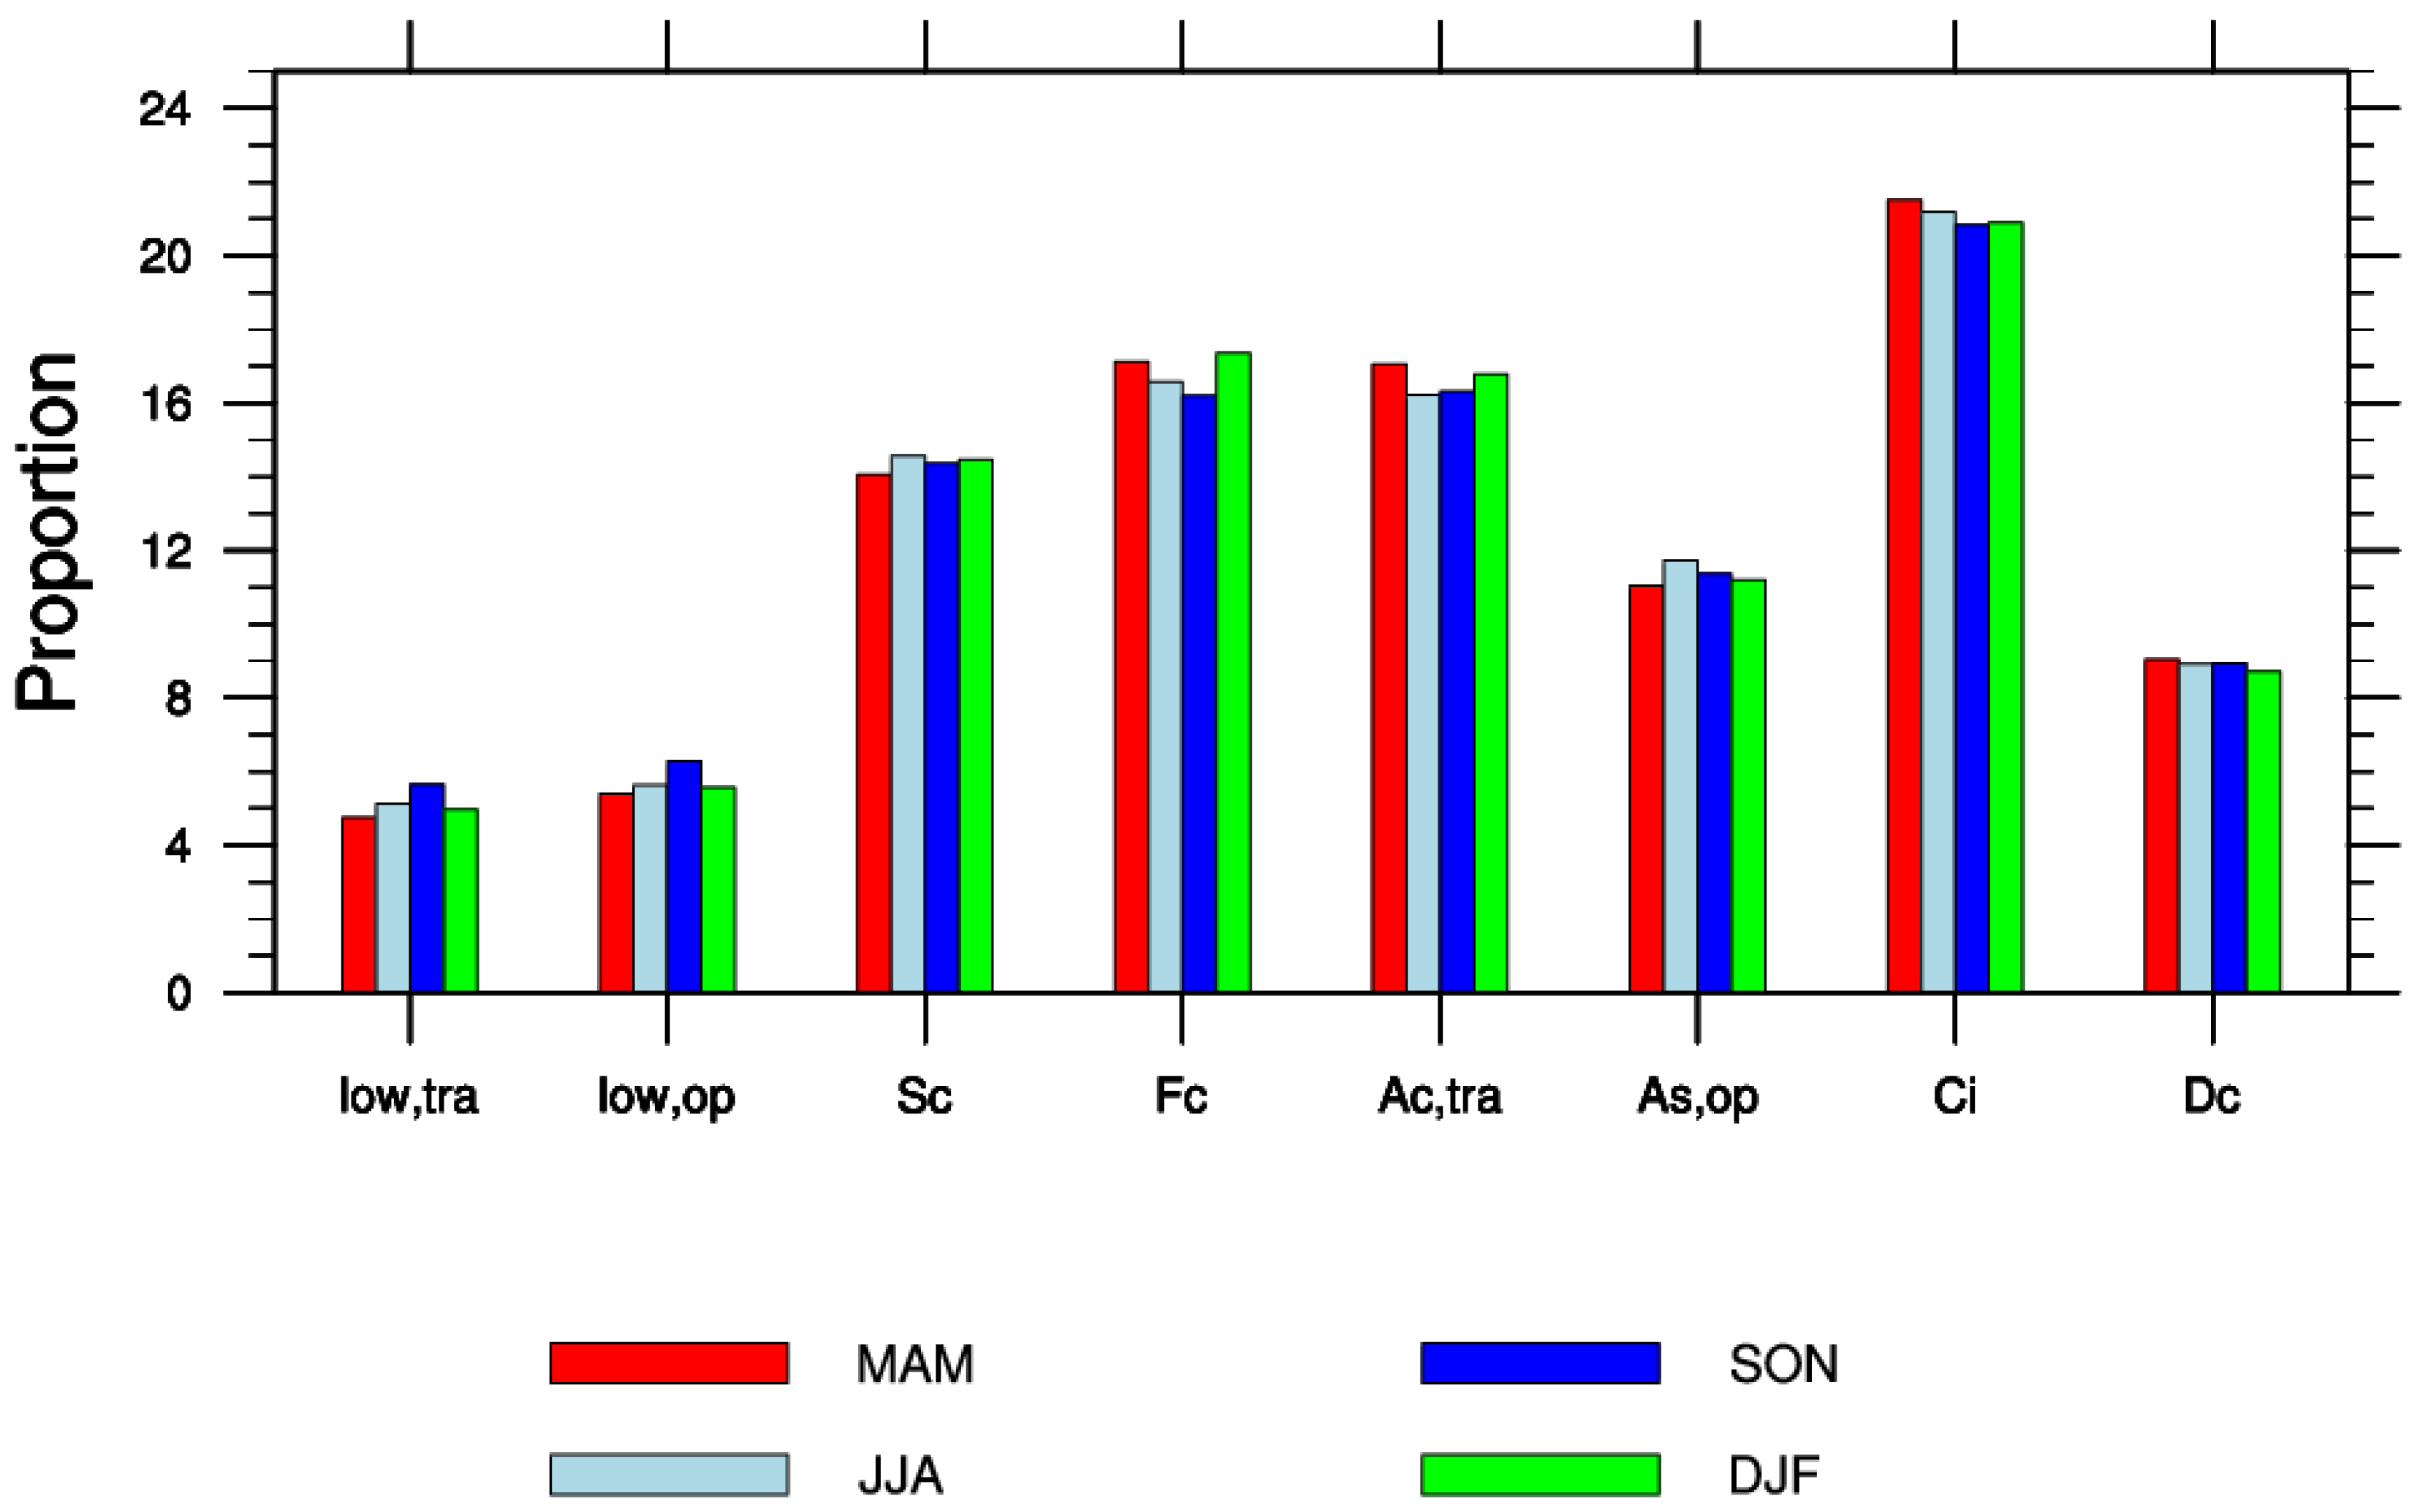
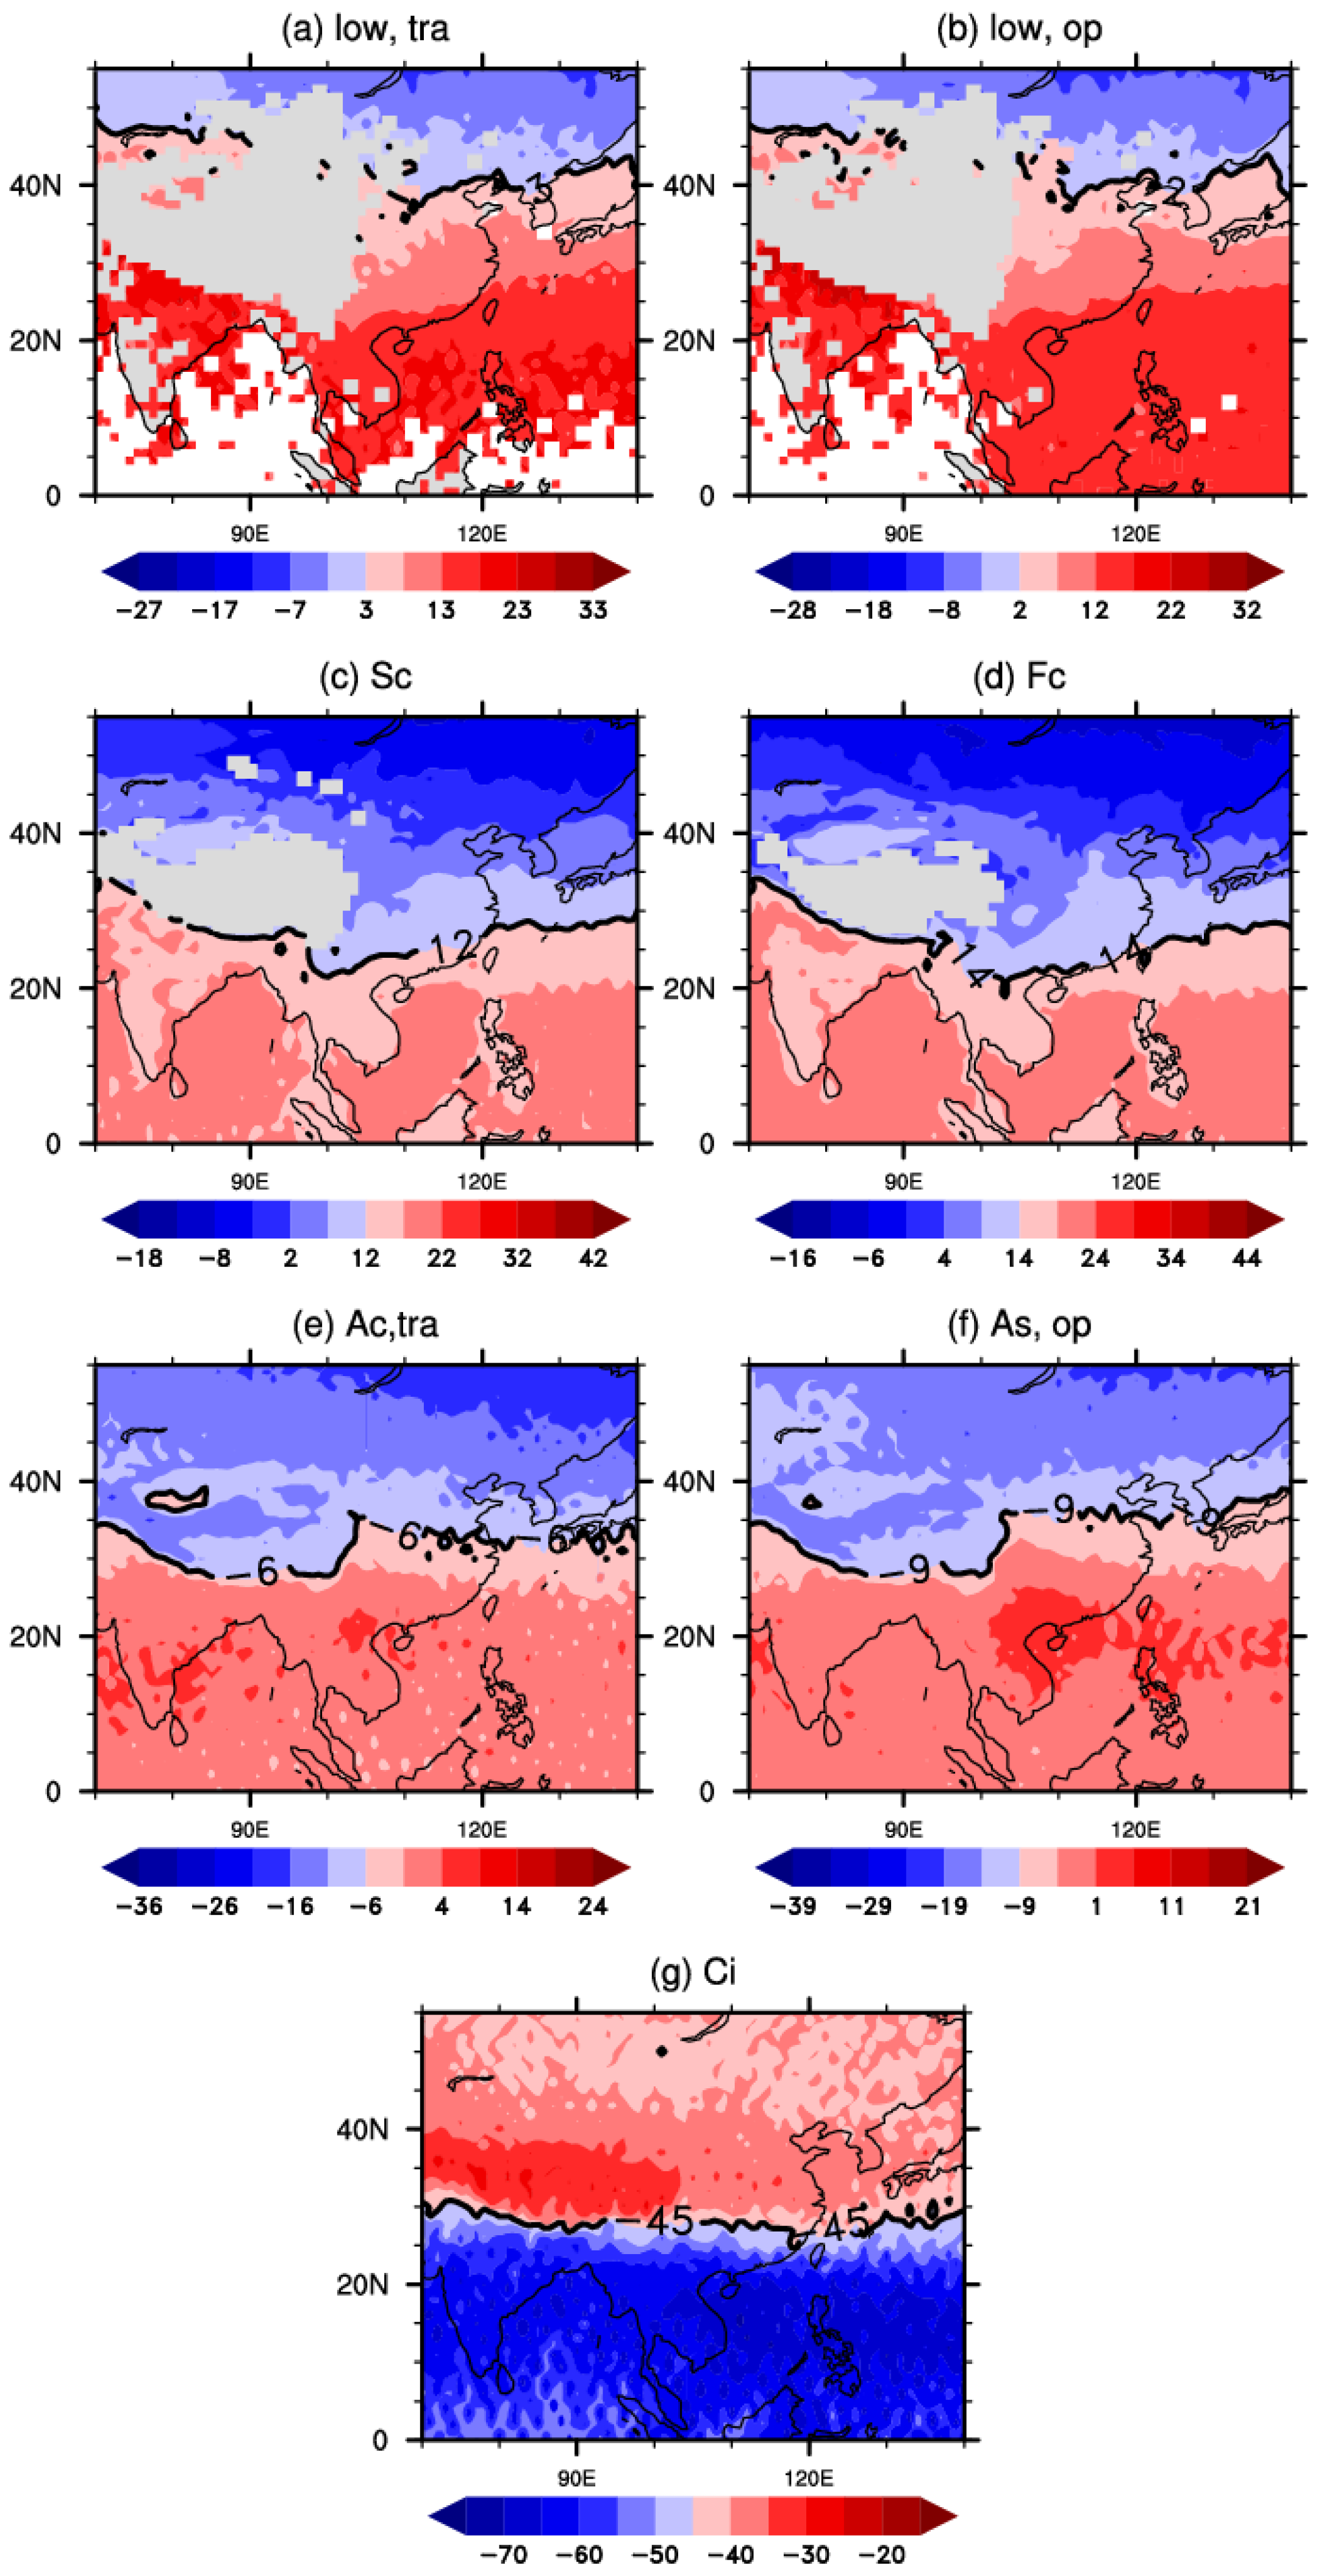
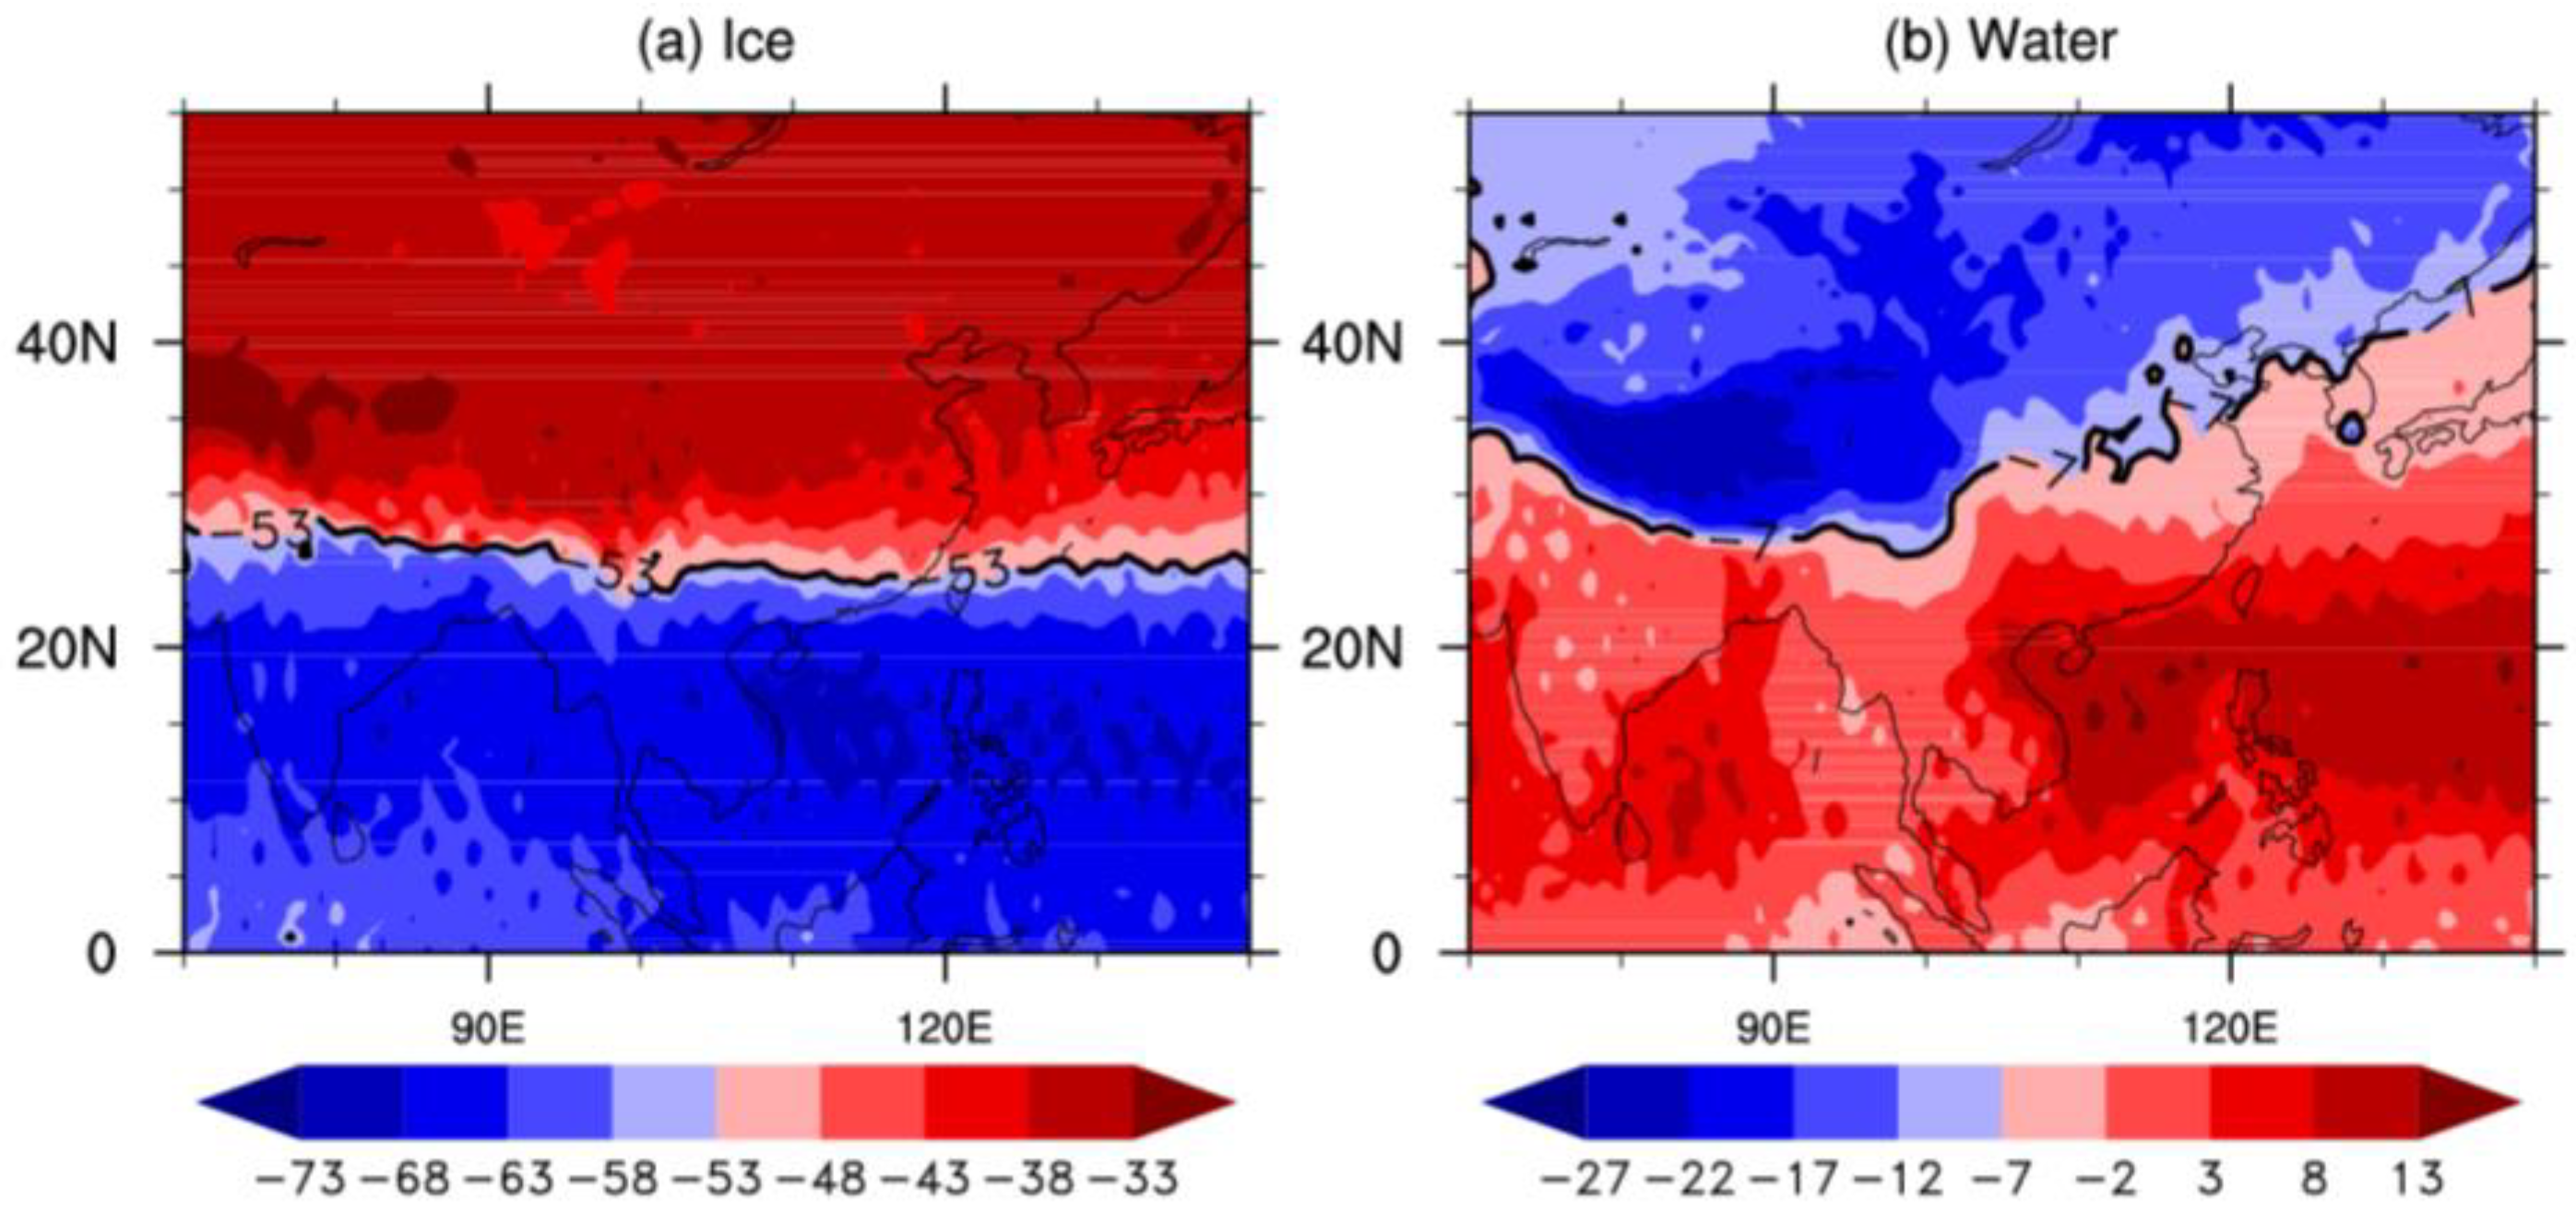
  • The horizontal distribution characteristics of cloud types and cloud phases are obviously affected by large topography, especially in the southern rim of the Qinghai–Tibet Plateau and QMHR. In addition, the prevailing cloud types and cloud phases have significant seasonal differences. At different altitudes, the types and phases of clouds show similar features in the mainland area south of QMHR.
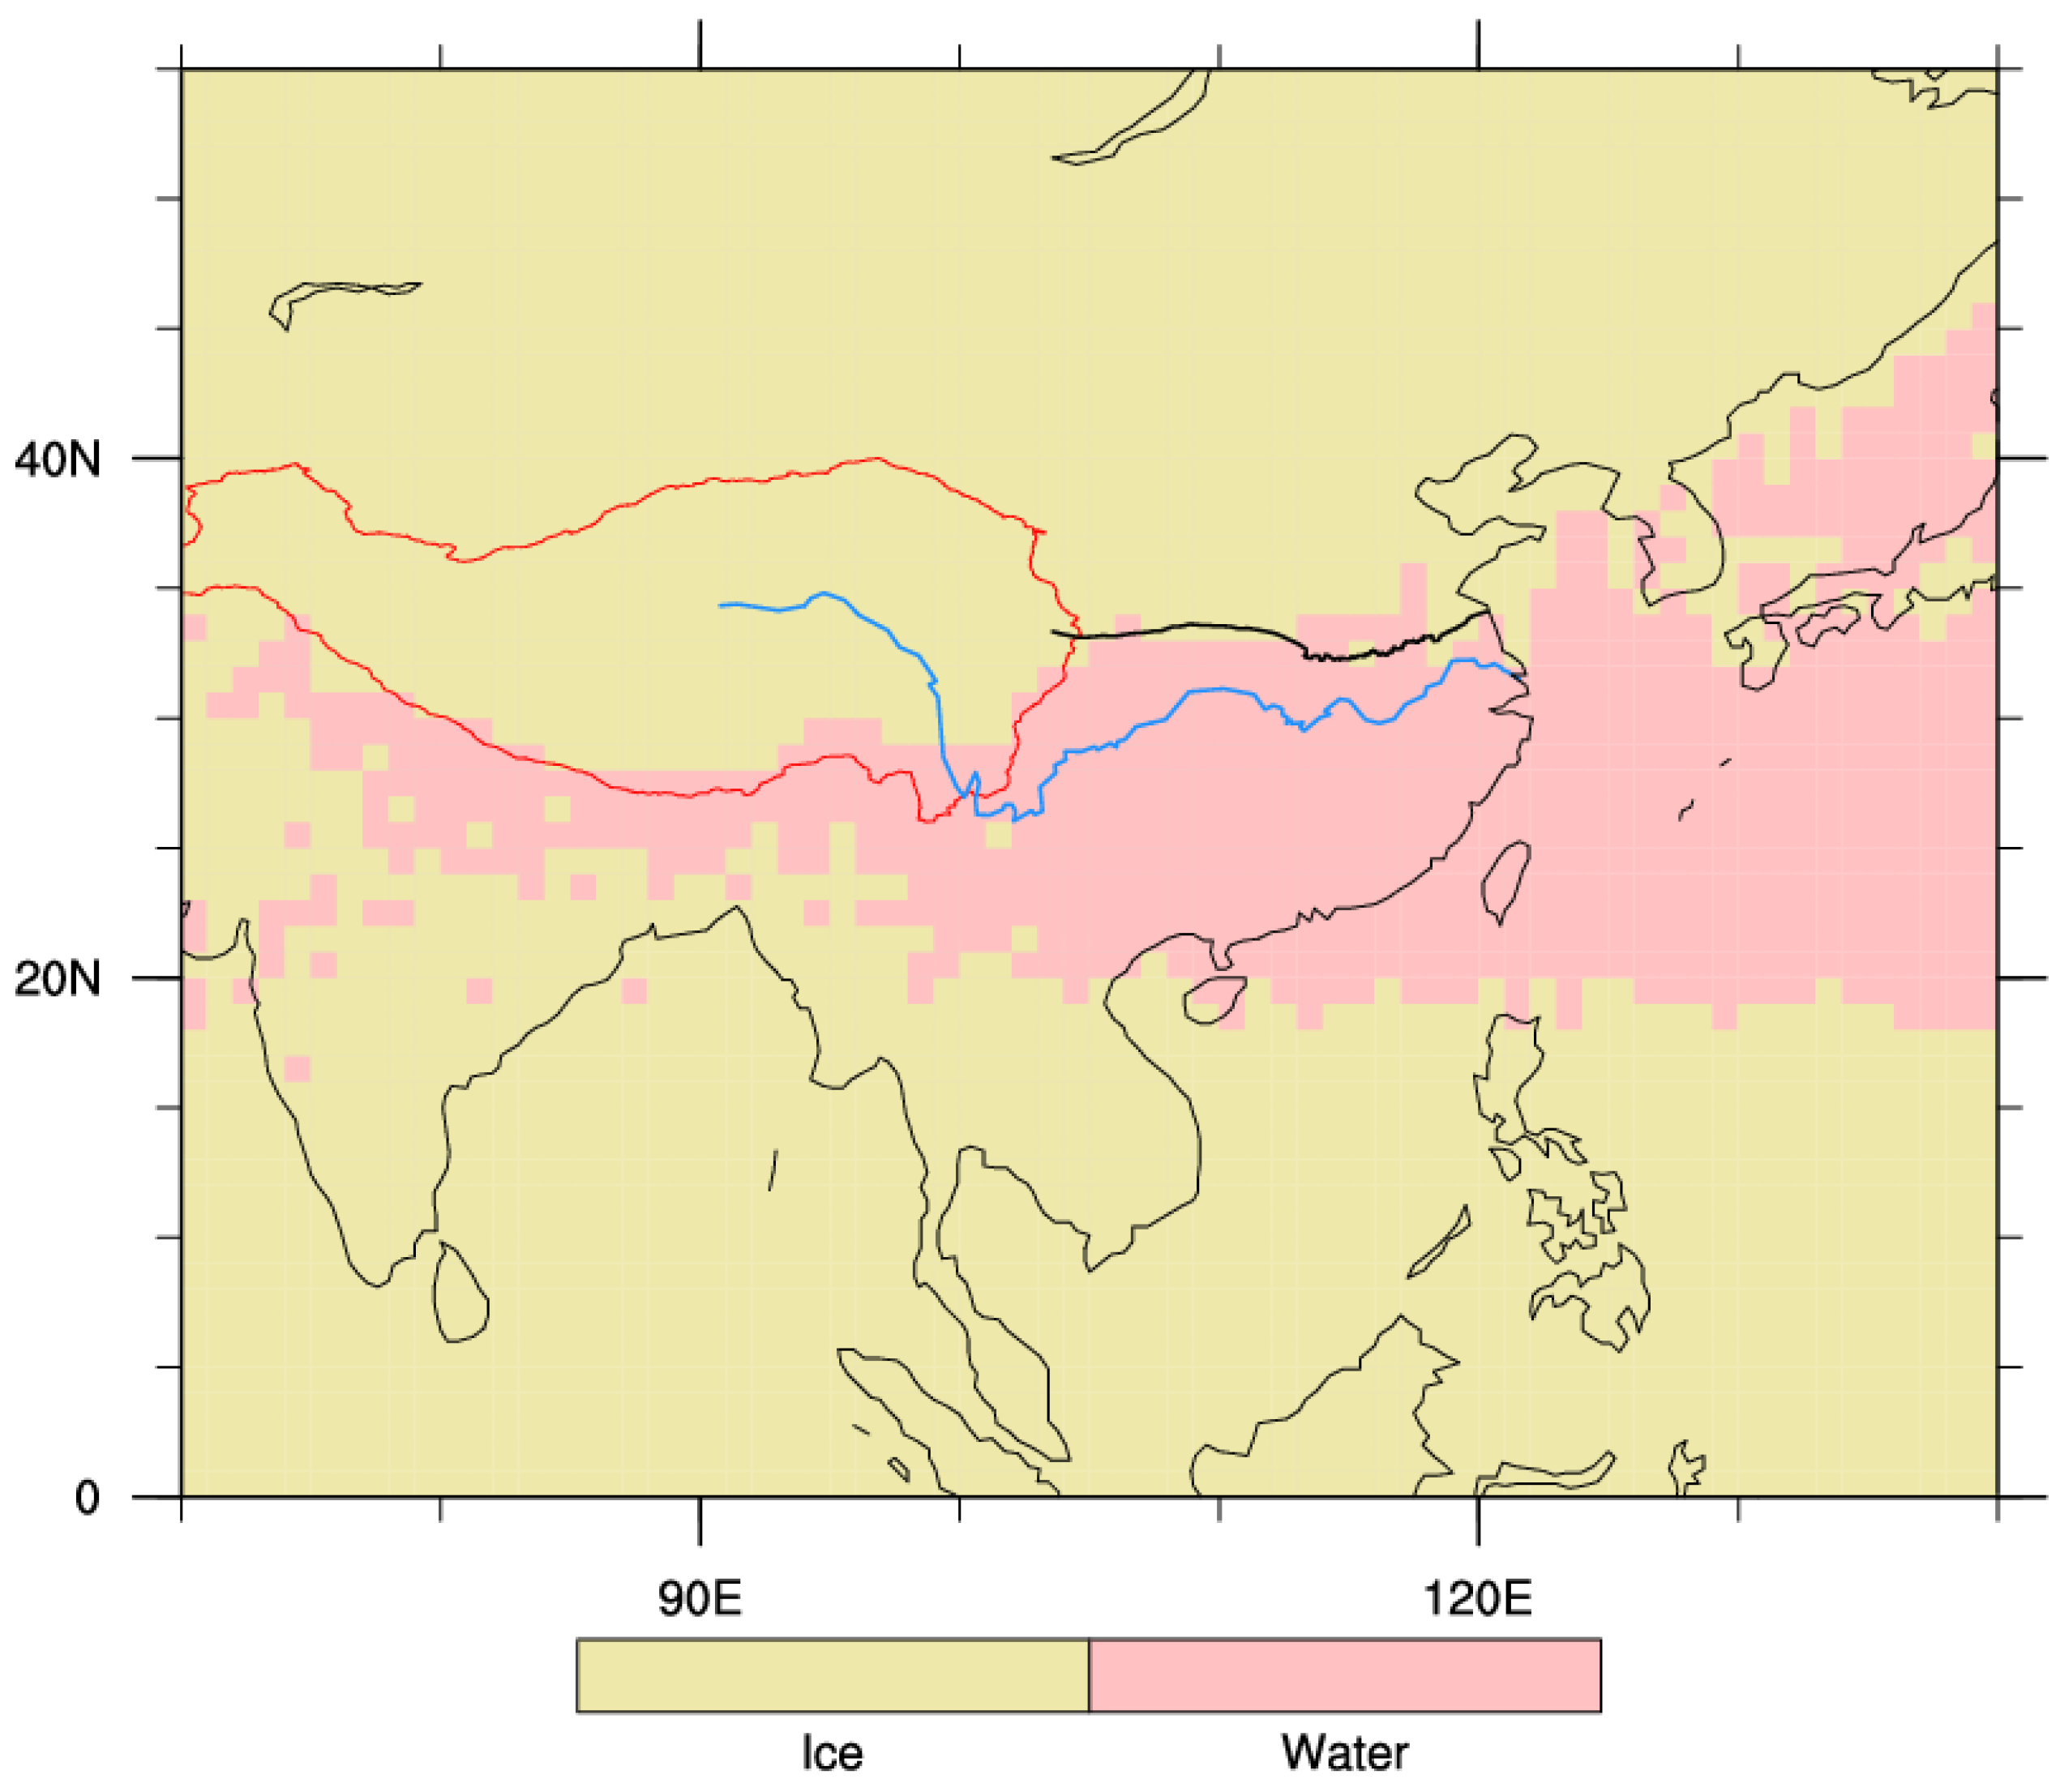
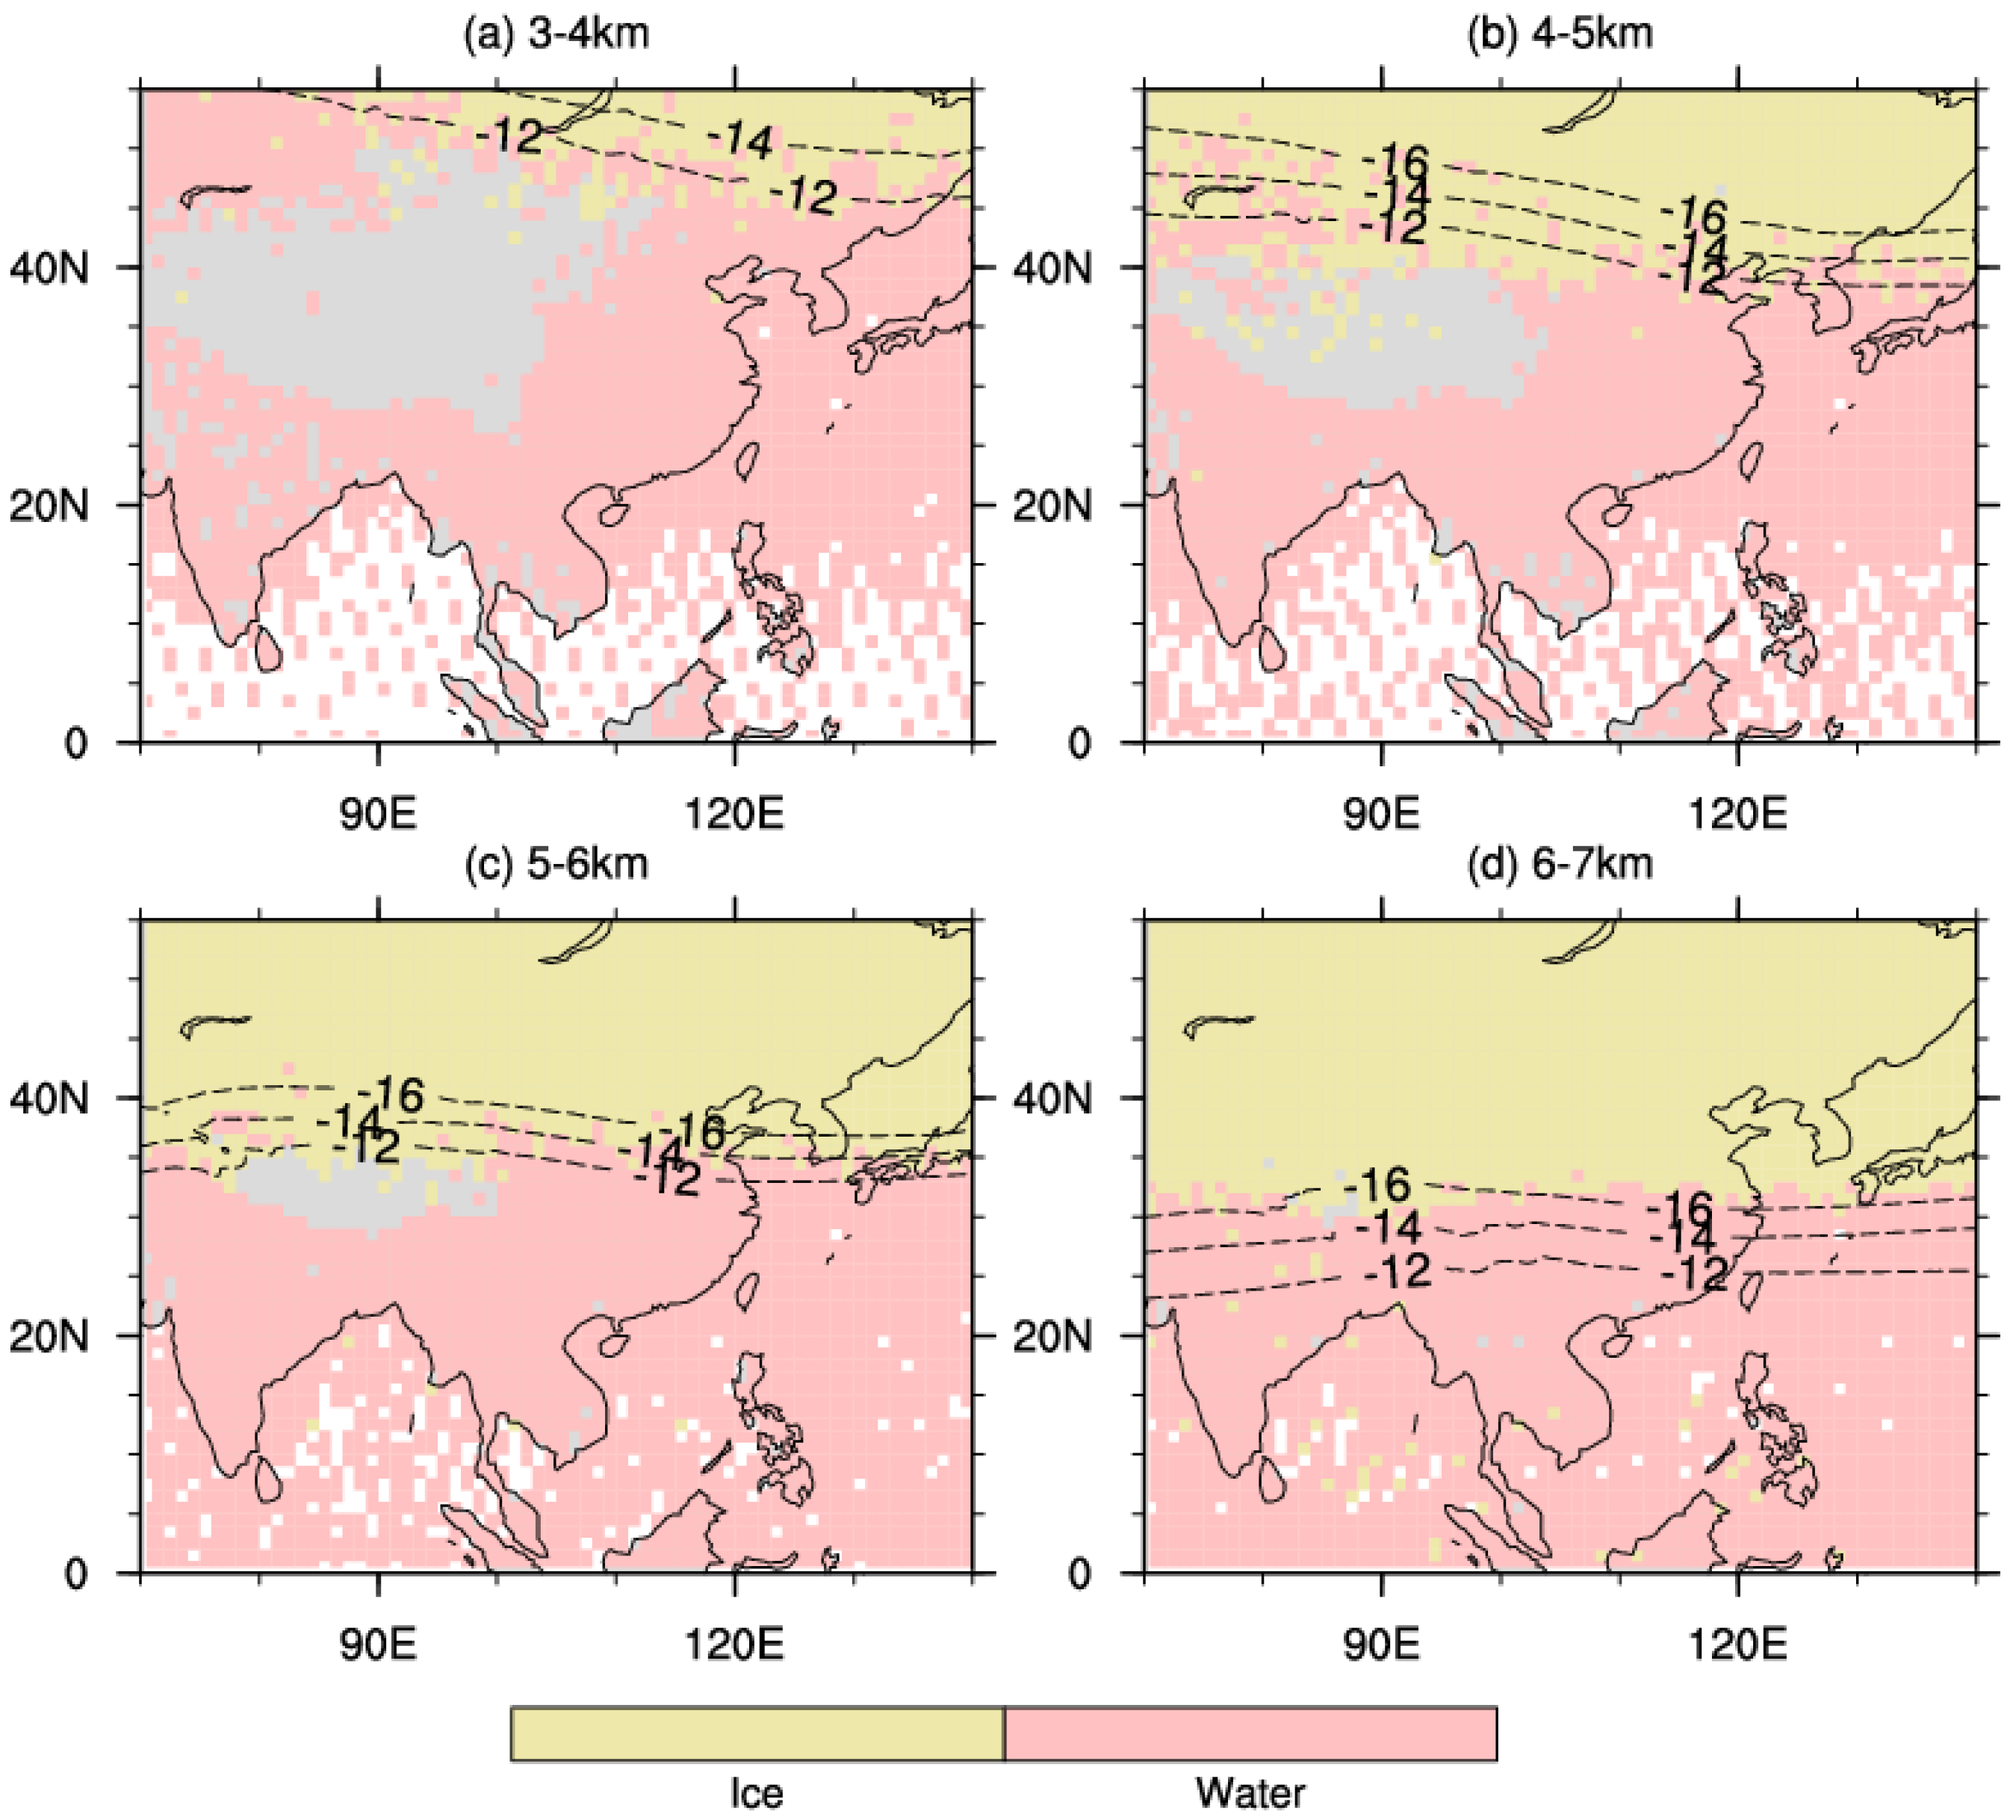
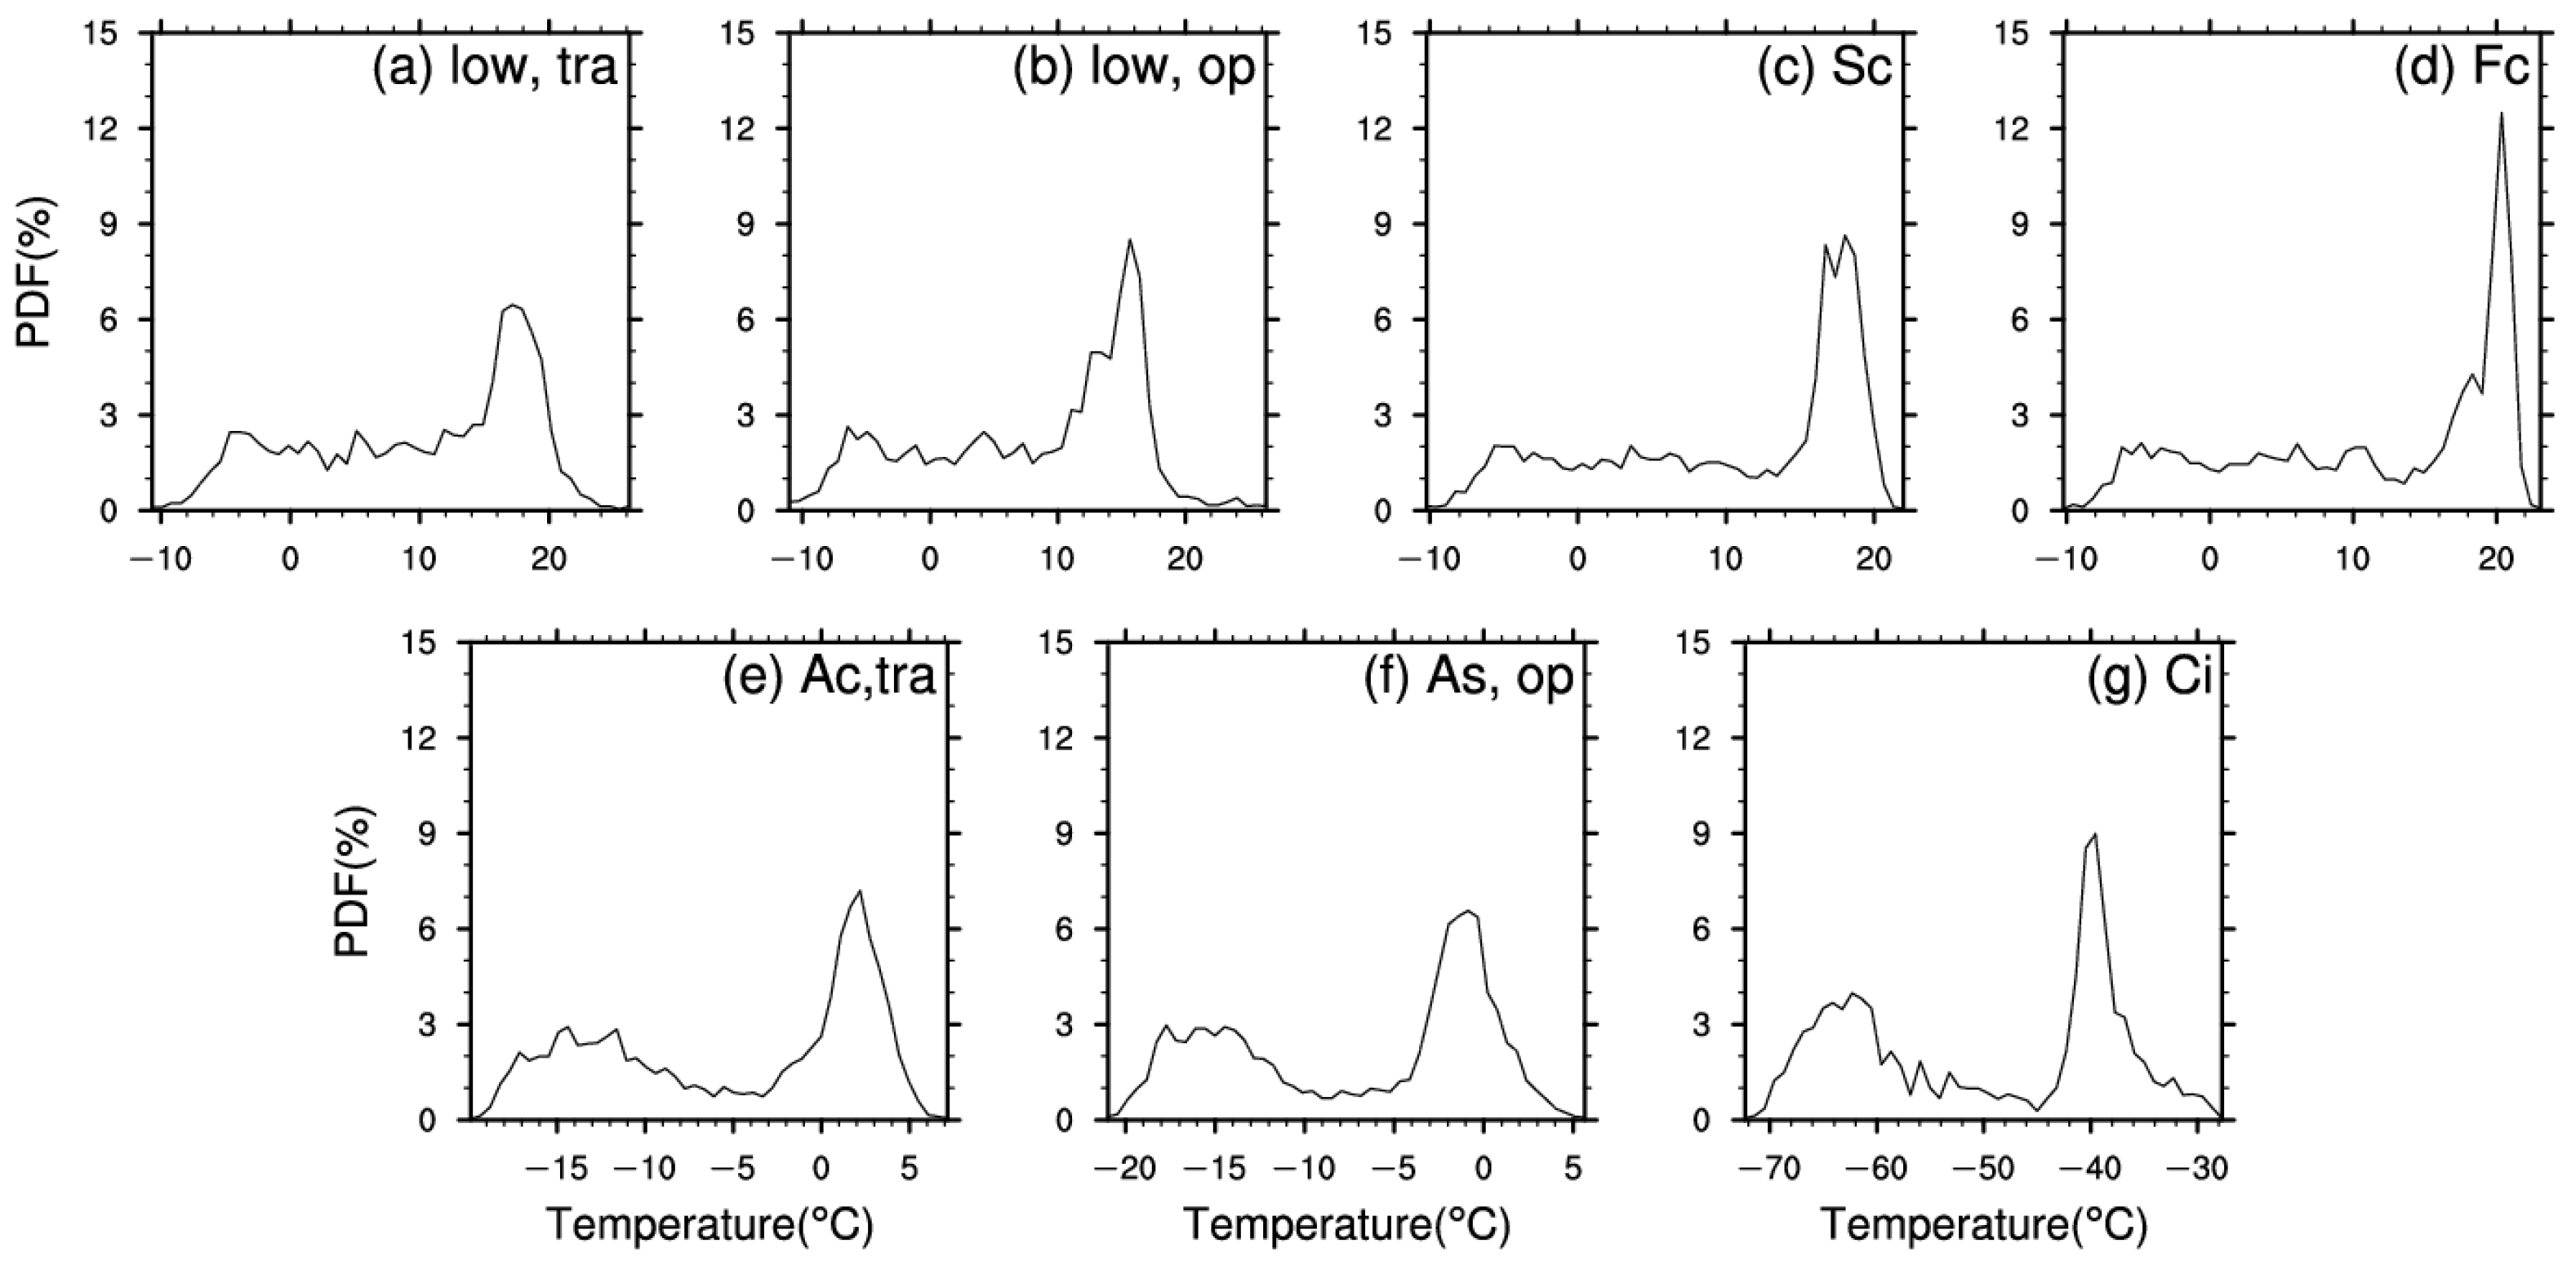
  • The coverage boundary of ice clouds and water clouds is very close to the position of −14 °C isotherm at the altitude of 3–7 km, which retreats southward as altitude increases. This relationship may be related to the mechanism of the water cloud transforming into a mixed-phase cloud with the INPs, and the −14 °C is likely the transition temperature. The bimodal structure of the temperature PDFs in the MPCs may correspond to the distribution modes that are accumulation mode and coarse mode of INPs with different diameters, while the bimodal structure of the ice cloud is related to its two formation mechanisms that are homogenous freezing and heterogeneous nucleation. The valley temperature suggests that both mechanisms of ice clouds forming are inactive at this temperature.
This paper lays a foundation for further research on the radiation effects of different clouds over China. At the same time, it also has certain indicative significance to the evolution process of the weather system associated with clouds. Microphysical features are an indispensable part of a deeper understanding of cloud climatology. Therefore, further studies would explore the influence of climate characteristics of the cloud radiation effect on the Earth-atmosphere system from the perspective of cloud microphysics and understand the formation mechanism of different phases of clouds through cloud temperature by numerical modeling and simulation in the future.

Author Contributions

Conceptualization, H.C. and Q.C.; Methodology, H.C.; Validation, H.C., Q.C. and Y.Y.; Formal analysis, H.C. and Y.Y.; Investigation, H.C. and Y.Y.; Data curation, Y.Y.; Writing—original draft preparation, Y.Y.; Writing—review and editing, H.C. and Y.Y.; Visualization, Y.Y.; Supervision, Q.C. All authors have read and agreed to the published version of the manuscript.

Funding

This study was supported by the National Key Research and Development Program of China (2021YFC3000902) and the National Natural Science Foundation of China (U20A2097, 42075087).

Data Availability Statement

Data sharing is not applicable.

Acknowledgments

NASA’s CALIPSO team is gratefully acknowledged for making the CALIOP cloud products publicly accessible and for their efforts to improve scene classification algorithms. All figures were created using the NCAR Command Language (NCL) (2019) (http://www.ncl.ucar.edu, accessed on 5 November 2022).

Conflicts of Interest

The authors declare that the research was conducted in the absence of any commercial or financial relationships that could be construed as a potential conflict of interest.

References

  1. Ramanathan, V.; Cess, R.D.; Harrison, E.F.; Minnis, P.; Barkstrom, B.R.; Ahmad, E.; Hartmann, D. Cloud-Radiative Forcing and Climate: Results from the Earth Radiation Budget Experiment. Science 1989, 243, 57–63. [Google Scholar] [CrossRef] [PubMed] [Green Version]
  2. Hartmann, D.L.; Ockert-Bell, M.E.; Michelsen, M.L. The effect of cloud type on Earth’s energy balance: Global analysis. J. Clim. 1992, 5, 1281–1304. [Google Scholar] [CrossRef]
  3. Matus, A.V.; L’Ecuyer, T.S. The role of cloud phase in Earth’s radiation budget. J. Geophys. Res. Atmos. 2017, 122, 2559–2578. [Google Scholar] [CrossRef]
  4. Wang, J.; Jian, B.; Wang, G.; Zhao, Y.; Li, Y.; Letu, H.; Zhang, M.; Li, J. Climatology of cloud phase, cloud radiative effects and precipitation properties over the Tibetan Plateau. Remote Sens. 2021, 13, 363. [Google Scholar] [CrossRef]
  5. Chen, T.; Rossow, W.; Zhang, Y. Radiative effects of cloud-type variations. J. Clim. 2000, 13, 264–286. [Google Scholar] [CrossRef]
  6. Stephens, G.L.; Webster, P.J. Clouds and climate: Sensitivity of simple systems. J. Atmos. Sci. 1981, 38, 235–247. [Google Scholar] [CrossRef]
  7. Hogan, R.J.; Behera, M.D.; O’Connor, E.J.; Illingworth, A.J. Estimate of the global distribution of stratiform supercooled liquid water clouds using the LITE lidar. Geophys. Res. Lett. 2004, 31, L05106. [Google Scholar] [CrossRef] [Green Version]
  8. Hong, Y.; Liu, G. The characteristics of ice cloud properties derived from CloudSat and CALIPSO measurements. J. Clim. 2015, 28, 3880–3900. [Google Scholar] [CrossRef]
  9. Pan, H.; Wang, M.; Kumar, K.; Zhang, J.; Meng, L. A Decadal Global Climatology of Ice Cloud Fraction with Their Microphysical and Optical Properties Inferred from the CALIPSO and Reanalysis Data. Remote Sens. 2020, 12, 3795. [Google Scholar] [CrossRef]
  10. Klein, S.; Hartmann, D.L. The Seasonal Cycle of Low Stratiform Clouds. J. Clim. 1993, 6, 1587–1606. [Google Scholar] [CrossRef]
  11. Wood, R.; Bretherton, C.S. On the relationship between stratiform low cloud cover and lower-tropospheric stability. J. Clim. 2006, 19, 6425–6432. [Google Scholar] [CrossRef]
  12. Wood, R.; Hartmann, D.L. Spatial variability of liquid water path in marine low cloud: The importance of mesoscale cellular convection. J. Clim. 2006, 19, 1748–1764. [Google Scholar] [CrossRef]
  13. Li, Y.; Gu, H. Relationship between middle stratiform clouds and large scale circulation over eastern China. Geophys. Res. Lett. 2006, 33, L09706. [Google Scholar] [CrossRef]
  14. Patnaude, R.; Diao, M.; Liu, X.; Chu, S. Effects of thermodynamics, dynamics and aerosols on cirrus clouds based on in situ observations and NCAR CAM6. Atmospheric Chem. Phys. 2021, 21, 1835–1859. [Google Scholar] [CrossRef]
  15. Barahona, D.; Nenes, A. Dynamical states of low temperature cirrus. Atmos. Chem. Phys. 2011, 11, 3757–3771. [Google Scholar] [CrossRef] [Green Version]
  16. Iwabuchi, H.; Ping, Y. Temperature dependence of ice optical constants: Implications for simulating the single-scattering properties of cold ice clouds. J. Quant. Spectrosc. Radiat. Transf. 2011, 112, 2520–2525. [Google Scholar] [CrossRef]
  17. Sunilkumar, S.V.; Parameswaran, K. Temperature dependence of tropical cirrus properties and radiative effects. J. Geophys. Res. Atmos. 2005, 110, D13205. [Google Scholar] [CrossRef]
  18. Platt, C.; Dilley, A.C. Remote sounding of high clouds IV. Observed temperature-variations in cirrus optical-properties. J. Atmos. Sci. 1981, 38, 1069–1082. [Google Scholar] [CrossRef]
  19. Platt, C.M.R.; Scott, J.C.; Dilley, A.C. Remote sounding of high clouds VI: Optical properties of mid latitude and tropical cirrus. J. Atmos. Sci. 1987, 44, 729–747. [Google Scholar] [CrossRef]
  20. Platt, C.M.R.; Young, S.; Manson, P.J.; Patterson, G.R.; Marsden, S.; Austin, R.T.; Churnside, J. The Optical Properties of Equatorial Cirrus from Observations in the ARM Pilot Radiation Observation Experiment. J. Atmos. Sci. 1998, 55, 1977–1996. [Google Scholar] [CrossRef]
  21. Platt, C.M.R.; Young, S.; Austin, R.T.; Patterson, G.R.; Mitchell, D.L.; Miller, S.D. LIRAD Observations of Tropical Cirrus Clouds in MCTEX. Part I: Optical Properties and Detection of Small Particles in Cold Cirrus. J. Atmos. Sci. 2002, 59, 3145–3162. [Google Scholar] [CrossRef]
  22. Noel, V.; Chepfer, H.; Ledanois, G.; Delaval, A.; Flamant, P.H. Classification of particle effective shape ratios in cirrus clouds based on the lidar depolarization ratio. Appl. Opt. 2002, 41, 4245–4257. [Google Scholar] [CrossRef] [PubMed]
  23. Wang, Z.Z.; Chi, R.L.; Bo, L.; Jun, Z. Depolarization properties of cirrus clouds from polarization lidar measurements over Hefei in spring. Chin. Opt. Lett. 2008, 6, 235–237. [Google Scholar] [CrossRef]
  24. Ha, K.-J.; Heo, K.-Y.; Lee, S.-S.; Yun, K.-S.; Jhun, J.-G. Variability in the East Asian Monsoon: A review. Meteorol. Appl. 2012, 19, 200–215. [Google Scholar] [CrossRef]
  25. Wu, G.; Zhang, Y. Tibetan Plateau forcing and the timing of the monsoon onset over south Asia and the South China Sea. Mon. Weather. Rev. 1998, 126, 913–927. [Google Scholar] [CrossRef]
  26. Tanaka, K.; Ishikawa, H.; Hayashi, T.; Tamagawa, I.; Ma, Y. Surface Energy Budget at Amdo on the Tibetan Plateau using GAME/Tibet IOP98 Data. J. Meteorol. Soc. Jpn. 2001, 79, 505–517. [Google Scholar] [CrossRef]
  27. Ueda, H.; Kamahori, H.; Yamazaki, N. Seasonal contrasting features of heat and moisture budgets between the eastern and western Tibetan plateau during the GAME IOP. J. Clim. 2003, 16, 2309–2324. [Google Scholar] [CrossRef]
  28. Duan, A.; Wu, G. Role of the Tibetan Plateau thermal forcing in the summer climate patterns over subtropical Asia. Clim. Dyn. 2005, 24, 793–807. [Google Scholar] [CrossRef]
  29. Min, M.; Wang, P.; Campbell, J.R.; Zong, X.; Li, Y. Midlatitude cirrus cloud radiative forcing over China. J. Geophys. Res. 2010, 115, D20210. [Google Scholar] [CrossRef] [Green Version]
  30. Yasunari, T.; Miwa, T. Convective Cloud Systems over the Tibetan Plateau and Their Impact on Meso-Scale Disturbances in the Meiyu/Baiu Frontal Zone. J. Meteorol. Soc. Jpn. Ser. II 2006, 84, 783–803. [Google Scholar] [CrossRef]
  31. Duan, A.; Wu, G. Change of cloud amount and the climate warming on the Tibetan Plateau. Geophys. Res. Lett. 2006, 33, 217–234. [Google Scholar] [CrossRef]
  32. Shang, H.; Letu, H.; Nakajima, T.; Wang, Z.; Ma, R.; Wang, T.; Lei, Y.; Ji, D.; Li, S.; Shi, J. Diurnal cycle and seasonal variation of cloud cover over the Tibetan Plateau as determined from Himawari-8 new-generation geostationary satellite data. Sci. Rep. 2018, 8, 1105. [Google Scholar] [CrossRef] [PubMed] [Green Version]
  33. Zhou, Q.; Zhang, Y.; Li, B.; Li, L.; Feng, J.; Jia, S.; Lv, S.; Tao, F.; Guo, J. Cloud-base and cloud-top heights determined from a ground-based cloud radar in Beijing, China. Atmospheric Environ. 2019, 201, 381–390. [Google Scholar] [CrossRef]
  34. Chen, J.; Wu, X.; Yin, Y.; Xiao, H. Characteristics of Heat Sources and Clouds over Eastern China and the Tibetan Plateau in Boreal Summer. J. Clim. 2015, 28, 7279–7296. [Google Scholar] [CrossRef]
  35. Rüthrich, F.; Thies, B.; Reudenbach, C.; Bendix, J. Cloud detection and analysis on the Tibetan Plateau using Meteosat and CloudSat. J. Geophys. Res. Atmos. 2013, 118, 10082–10099. [Google Scholar] [CrossRef]
  36. Sun, Y.; Dong, X.; Cui, W.; Zhou, Z.; Fu, Z.; Zhou, L.; Deng, Y.; Cui, C. Vertical Structures of Typical Meiyu Precipitation Events Retrieved from GPM-DPR. J. Geophys. Res. Atmos. 2019, 125, JD031466. [Google Scholar] [CrossRef] [Green Version]
  37. Lim, J.; Hong, S. Effects of bulk ice microphysics on the simulated monsoonal precipitation over east Asia. J. Geophys. Res. 2005, 110, D24201. [Google Scholar] [CrossRef] [Green Version]
  38. Stephens, G.L.; Vane, D.G.; Boain, R.J.; Mace, G.G.; Sassen, K.; Wang, Z.; Illingworth, A.J.; O’Connor, E.J.; Rossow, W.B.; Durden, S.L.; et al. The CloudSat mission and the A-train: A new dimension to space-based observations of clouds and precipitation. Bull. Am. Meteorol. Soc. 2002, 83, 1771–1790. [Google Scholar] [CrossRef] [Green Version]
  39. Wu, D.; Hu, Y.; McCormick, M.P.; Yan, F. Global cloud-layer distribution statistics from 1 year CALIPSO lidar observations. Int. J. Remote Sens. 2011, 32, 1269–1288. [Google Scholar] [CrossRef]
  40. Cai, H.; Feng, X.; Chen, Q.; Sun, Y.; Wu, Z.; Tie, X. Spatial and Temporal Features of the Frequency of Cloud Occurrence over China Based on CALIOP. Adv. Meteorol. 2017, 2017, 4548357. [Google Scholar] [CrossRef]
  41. Winker, D.M.; Hunt, W.H.; McGill, M.J. Initial performance assessment of CALIOP. Geophys. Res. Lett. 2007, 34, L19803. [Google Scholar] [CrossRef] [Green Version]
  42. McGill, M.J.; Vaughan, M.A.; Trepte, C.R.; Hart, W.D.; Hlavka, D.; Winker, D.M.; Kuehn, R. Airborne validation of spatial properties measured by the CALIPSO lidar. J. Geophys. Res. Atmos. 2007, 112, D20. [Google Scholar] [CrossRef] [Green Version]
  43. Mioche, G.; Josset, D.; Gayet, J.-F.; Pelon, J.; Garnier, A.; Minikin, A.; Schwarzenboeck, A. Validation of the CALIPSO-CALIOP extinction coefficients from in situ observations in midlatitude cirrus clouds during the CIRCLE-2 experiment. J. Geophys. Res. Atmos. 2010, 115, D00H25. [Google Scholar] [CrossRef] [Green Version]
  44. Pappalardo, G.; Wandinger, U.; Mona, L.; Hiebsch, A.; Mattis, I.; Amodeo, A.; Ansmann, A.; Seifert, P.; Linné, H.; Apituley, A.; et al. EARLINET correlative measurements for CALIPSO: First intercomparison results. J. Geophys. Res. Atmos. 2010, 115, D00H19. [Google Scholar] [CrossRef] [Green Version]
  45. Rogers, R.R.; Hostetler, C.A.; Hair, J.W.; Ferrare, R.A.; Liu, Z.; Obland, M.D.; Harper, D.B.; Cook, A.L.; Powell, K.A.; Vaughan, M.A.; et al. Assessment of the CALIPSO Lidar 532 nm attenuated backscatter calibration using the NASA LaRC airborne High Spectral Resolution Lidar. Atmos. Chem. Phys. 2011, 11, 1295–1311. [Google Scholar] [CrossRef] [Green Version]
  46. Yorks, J.E.; Hlavka, D.; Vaughan, M.A.; McGill, M.J.; Hart, W.D.; Rodier, S.; Kuehn, R. Airborne validation of cirrus cloud properties derived from CALIPSO lidar measurements: Spatial properties. J. Geophys. Res. Atmos. 2011, 116, D19207. [Google Scholar] [CrossRef]
  47. Liu, Z.; Omar, A.H.; Hu, Y.; Vaughan, M.; Winker, D.M. CALIOP Algorithm Theoretical Basis Document Part 3: Scene Classification Algorithms; NASA Langley Research Center: Hampton, VA, USA, 2005. [Google Scholar]
  48. Liu, Z.; Vaughan, M.; Winker, D.; Kittaka, C.; Getzewich, B.; Kuehn, R.; Omar, A.; Powell, K.; Trepte, C.; Hostetler, C. The CALIPSO Lidar Cloud and Aerosol Discrimination: Version 2 Algorithm and Initial Assessment of Performance. J. Atmos. Ocean. Technol. 2009, 26, 1198–1213. [Google Scholar] [CrossRef]
  49. Kim, S.-W.; Berthier, S.; Raut, J.-C.; Chazette, P.; Dulac, F.; Yoon, S.-C. Validation of aerosol and cloud layer structures from the space-borne lidar CALIOP using a ground-based lidar in Seoul, Korea. Atmos. Chem. Phys. 2008, 8, 3705–3720. [Google Scholar] [CrossRef] [Green Version]
  50. Haladay, T.; Stephens, G. Characteristics of tropical thin cirrus clouds deduced from joint CloudSat and CALIPSO observations. J. Geophys. Res. Atmos. 2009, 114, D00A25. [Google Scholar] [CrossRef] [Green Version]
  51. Sassen, K.; Cho, B.S. Subvisual thin cirrus lidar dataset for satellite verification and climatological research. J. Appl. Meteorol. 1992, 31, 1275–1285. [Google Scholar] [CrossRef]
  52. Hersbach, H.; Bell, B.; Berrisford, P.; Hirahara, S.; Horanyi, A.; Muñoz-Sabater, J.; Nicolas, J.; Peubey, C.; Radu, R.; Schepers, D.; et al. The ERA5 global reanalysis. Q. J. R. Meteorol. Soc. 2020, 146, 1999–2049. [Google Scholar] [CrossRef]
  53. Pan, Z.; Gong, W.; Mao, F.; Li, J.; Wang, W.; Li, C.; Min, Q. Macrophysical and optical properties of clouds over East Asia measured by CALIPSO. J. Geophys. Res. Atmos. 2015, 120, 11653–11668. [Google Scholar] [CrossRef] [Green Version]
  54. Chen, B.; Liu, X. Seasonal migration of cirrus clouds over the Asian monsoon regions and the Tibetan Plateau measured from MODIS /Terra. Geophys. Res. Lett. 2005, 32, L01804. [Google Scholar] [CrossRef] [Green Version]
  55. Wylie, D.P.; Menzel, W.P.; Woolf, H.M.; Strabala, K.I. Four Years of Global Cirrus Cloud Statistics Using HIRS. J. Clim. 1994, 7, 1972–1986. [Google Scholar] [CrossRef]
  56. Sassen, K.; Wang, Z.; Liu, D. Global distribution of cirrus clouds from CloudSat/Cloud-Aerosol Lidar and Infrared Pathfinder Satellite Observations (CALIPSO) measurements. J. Geophys. Res. 2008, 113, D00A12. [Google Scholar] [CrossRef]
  57. Kanji, Z.A.; Ladino, L.A.; Wex, H.; Boose, Y.; Burkert-Kohn, M.; Cziczo, D.J.; Kramer, M. Overview of ice nucleating particles. Meteorol. Monogr. 2017, 58, 1.1–1.33. [Google Scholar] [CrossRef] [Green Version]
  58. Carlsen, T.; David, R.O. Spaceborne evidence that ice-nucleating particles influence high-latitude cloud phase. Geophys. Res. Lett. 2022, 49, e2022GL098041. [Google Scholar] [CrossRef] [PubMed]
  59. Tareq, H.; Larisa, S.; Tuukka, P. Accumulation and coarse modes particle concentrations during dew formation and precipitation. Aerosol Air Qual. Res. 2018, 18, 2929–2938. [Google Scholar] [CrossRef] [Green Version]
  60. Zhang, Y.; Li, Z.; Zhang, Y.; Chen, Y.; Cuesta, J.; Ma, Y. Multi-peak accumulation and coarse modes observed from AERONET retrieved aerosol volume size distribution in Beijing. Meteorol. Atmos. Phys. 2016, 128, 537–544. [Google Scholar] [CrossRef]
  61. DeMott, P.J.; Prenni, A.J.; Liu, X.; Kreidenweis, S.M.; Petters, M.D.; Twohy, C.H.; Richardson, M.S.; Eidhammer, T.; Rogers, D.C. Predicting global atmospheric ice nuclei distributions and their impacts on climate. Proc. Natl. Acad. Sci. USA 2010, 107, 11217–11222. [Google Scholar] [CrossRef]
  62. Mason, R.H.; Si, M.; Chou, C.; Irish, V.E.; Dickie, R.; Elizondo, P.; Wong, R.; Brintnell, M.; Elsasser, M.; Lassar, W.M.; et al. Size-resolved measurements of ice-nucleating particles at six locations in North America and one in Europe. Atmos. Chem. Phys. 2016, 16, 1637–1651. [Google Scholar] [CrossRef] [Green Version]
  63. Keckhut, P.; Borchi, F.; Bekki, S.; Hauchecorne, A.; SiLaouina, M. Cirrus Classification at Midlatitude from Systematic Lidar Observations. J. Appl. Meteorol. Clim. 2006, 45, 249–258. [Google Scholar] [CrossRef]
  64. DeMott, P.J.; Cziczo, D.J.; Prenni, A.J. Measurements of the concentration and composition of nuclei for cirrus formation. Proc. Natl. Acad. Sci. USA 2003, 100, 14655–14660. [Google Scholar] [CrossRef] [PubMed] [Green Version]
  65. Kärcher, B.; Lohmann, U. A parameterization of cirrus cloud formation: Homogenous freezing of supercooled aerosols. J. Geophys. Res. 2002, 107, D2. [Google Scholar] [CrossRef]
  66. Kärcher, B.; Lohmann, U. A parameterization of cirrus cloud formation: Heterogeneous freezing. J. Geophys. Res. 2003, 108, 4402. [Google Scholar] [CrossRef] [Green Version]
  67. Gierens, K. On the transition between heterogeneous and homogeneous freezing. Atmos. Chem. Phys. 2003, 3, 437–446. [Google Scholar] [CrossRef] [Green Version]
  68. Murray, B.J.; Broadley, S.L.; Wilson, T.W.; Bull, S.J.; Wills, R.H.; Christenson, H.K. Kinetics of the homogeneous freezing of water. Phys. Chem. Chem. Phys. 2010, 12, 10380–10387. [Google Scholar] [CrossRef]
Figure 1. Zonal average sample size over China and its surrounding areas from June 2006 to June 2020. (a) Number of observation profiles. (b) Number of observed orbits.
Remotesensing 14 05601 g001
Figure 2. (a) Horizontal distribution of prevailing cloud types throughout the year. (b) The terrain of the East Asia continent.
Remotesensing 14 05601 g002
Figure 3. Horizontal distribution of cloud occurrence frequency: (a) low overcast (transparent), (b) low overcast (opaque), (c) stratocumulus, (d) low broken cumulus (transparent), (e) altocumulus (transparent), (f) altostratus (opaque), (g) cirrus and (h) deep convective cloud (unit: %).
Remotesensing 14 05601 g003
Figure 4. Distribution of prevailing cloud types in different seasons: (a) spring (MAM), (b) summer (JJA), (c) autumn (SON), and (d) winter (DJF).
Remotesensing 14 05601 g004
Figure 5. Percentage of cloud type per season (unit: %).
Remotesensing 14 05601 g005
Figure 6. Horizontal distribution of the prevailing cloud type at different altitude layers: (a) 0–1 km, (b) 1–2 km, (c) 2–3 km, (d) 3–4 km, (e) 4–5 km, (f) 5–6 km, (g) 6–7 km and (h) 7–8 km.
Remotesensing 14 05601 g006
Figure 7. Annual horizontal distribution of the prevailing cloud phase. The red solid line is the Qinghai–Tibet Plateau, the blue solid line is the Yangtze River, and the black thick solid line is the Qinling Mountain and Huaihe river.
Remotesensing 14 05601 g007
Figure 8. Horizontal distribution of cloud phase in various seasons: (a) spring (MAM), (b) summer (JJA), (c) autumn (SON), and (d) winter (DJF). The red solid line is the Qinghai–Tibet Plateau, the blue solid line is the Yangtze River, and the black thick solid line is the Qinling Mountain and Huaihe river.
Remotesensing 14 05601 g008
Figure 9. Prevailing cloud phases at different altitude layers: (a) 0–1 km, (b) 1–2 km, (c) 2–3 km, (d) 3–4 km, (e) 4–5 km, (f) 5–6 km, (g) 6–7 km and (h) 7–8 km.
Remotesensing 14 05601 g009
Figure 10. Prevailing cloud phase–temperature distribution at different altitude layers: (a) 3–4 km, (b) 4–5 km, (c) 5–6 km, and (d) 6–7 km. The shading is the prevailing cloud phase distribution, and the black dashed lines are contour lines from −12 °C to −16 °C.
Remotesensing 14 05601 g010
Figure 11. Probability density of temperature in the cloud: (a) low overcast (transparent), (b) low overcast (opaque), (c) stratocumulus, (d) low broken cumulus (transparent), (e) altocumulus (transparent), (f) altostratus (opaque) and (g) cirrus.
Remotesensing 14 05601 g011
Figure 12. Spatial distribution of temperature in the cloud: (a) low overcast (transparent), (b) low overcast (opaque), (c) stratocumulus, (d) low broken cumulus (transparent), (e) altocumulus (transparent), (f) altostratus (opaque) and (g) cirrus. The black thick solid line is the valley temperature, the blue shading is below the valley temperature, and the red shading is above the valley temperature. Unit: °C.
Remotesensing 14 05601 g012
Figure 13. Probability density of temperature in the cloud: (a) ice clouds and (b) water clouds.
Remotesensing 14 05601 g013
Figure 14. Spatial distribution of temperature in the cloud: (a) ice clouds and (b) water clouds. The black thick solid line is the valley temperature, the blue shading is below the valley temperature and the red shading is above the valley temperature. Unit: °C.
Remotesensing 14 05601 g014
Publisher’s Note: MDPI stays neutral with regard to jurisdictional claims in published maps and institutional affiliations.

