Article

Deep-Separation Guided Progressive Reconstruction Network for Semantic Segmentation of Remote Sensing Images

1
School of Information and Electronic Engineering, Zhejiang University of Science and Technology, Hangzhou 310023, China
2
College of Information Science and Electronic Engineering, Zhejiang University, Hangzhou 310027, China
*
Author to whom correspondence should be addressed.
Remote Sens. 2022, 14(21), 5510; https://doi.org/10.3390/rs14215510
Submission received: 15 September 2022 / Revised: 30 October 2022 / Accepted: 30 October 2022 / Published: 1 November 2022

Abstract

:
The success of deep learning and the segmentation of remote sensing images (RSIs) has improved semantic segmentation in recent years. However, existing RSI segmentation methods have two inherent problems: (1) detecting objects of various scales in RSIs of complex scenes is challenging, and (2) feature reconstruction for accurate segmentation is difficult. To solve these problems, we propose a deep-separation-guided progressive reconstruction network that achieves accurate RSI segmentation. First, we design a decoder comprising progressive reconstruction blocks capturing detailed features at various resolutions through multi-scale features obtained from various receptive fields to preserve accuracy during reconstruction. Subsequently, we propose a deep separation module that distinguishes various classes based on semantic features to use deep features to detect objects of different scales. Moreover, adjacent middle features are complemented during decoding to improve the segmentation performance. Extensive experimental results on two optical RSI datasets show that the proposed network outperforms 11 state-of-the-art methods.

1. Introduction

Semantic segmentation aims to semantically classify the pixels in an image [1]. In remote sensing, semantic segmentation is crucial in several applications, such as scene understanding [2], land cover classification [3], and urban planning [4]. Owing to the success of deep learning (DL) and the promising results obtained on multiple semantic segmentation benchmarks containing natural images [5,6,7], semantic segmentation of remote sensing images (RSIs) increasingly adopts DL approaches [8,9,10]. However, an RSI is substantially larger than a typical natural image for computer vision applications; it contains objects of different sizes and shows complex scenes. Moreover, during data acquisition, the tilted perspective of RSIs can lead to scale variations in objects captured at different distances [11,12], exacerbating problems related to multi-scale changes.
With the continuous development of DL, convolutional neural networks have ushered in a new era of computer vision. The full convolution was proposed by Long et al. [13] to replace a fully connected layer with a convolutional layer in a classification network. However, decoding relies on the deep semantic features obtained from upsampling to obtain an output prediction map. Accordingly, using U-shaped architectures, Ronneberger et al. [14] and Vijay et al. [15] proposed UNet and SegNet, respectively, which use upsampling and continuous convolutions to complete decoding; each layer splices features from the encoding stage. The method of supplementing the features extracted from the encoder to the decoder is also often used in the later semantic segmentation methods, enhancing the complementarity of features in a different phase. Inspired by the above methods, Jiang et al. [16] proposed RedNet in 2018 with the same decoding approach, obtaining intermediate prediction maps at each stage to supervise the network at different resolutions. Moreover, Chen et al. [17] used the splicing of deep semantic features with shallow features and upsampling for the prediction map. This study proposed the idea of atrous convolution to expand the receptive field in the convolution process. Meanwhile, Chen et al. [18] proposed the feature separation and aggregation models for fusing multimodal features and fully exploring the characteristics of different stages. However, the architecture of the decoder makes it simple to fully use the features extracted by the encoder. In addition, Yu et al. [19] used deep features from two encoder branches to construct prediction maps during decoding for fast inference and the real-time performance of the proposed method. Xu et al. [20] used an attention mechanism and multi-branch parallel architecture to build lightweight networks for real-time segmentation. Such structures helped obtain representations of objects at different scales. For the multimodal data, Zhou et al. [21] and Seichter et al. [22] used RGB and depth multimodal data to complete the semantic segmentation task of indoor scenes. The proposed network followed the encoder–decoder architecture combined with the last three high-level features of the encoder to construct the prediction map, which was simple in structure. However, this approach failed to make full use of shallow features. Some details need to be included in the refactoring process. Hu et al. [23] used five decoder blocks with the same encoding structure and applied upsampling to each block to restore the resolution of the prediction map. This is one of the most widely used architectures in semantic segmentation in recent years. Middle feature streams are deployed in multimodal data to deal with fused features, which can enhance the representation of multimodal features. In addition, researchers have widely favored multimodal data in different fields [24,25,26]. In particular, to handle quality variations across multimodality RSI datasets, Zheng et al. [27] use a DSM (Digital Surface Model) as auxiliary information to improve the segmentation performance of the model on single-modal data. Nevertheless, the method only applies self-attention to the deepest feature, and the structure of the decoder is relatively simple. Thus, it fails to detect the object in the complex scene. Similarly, Ma et al. [28] used powerful encoding features with a transformer to extract multimodality information. In this approach, the transformer is fully combined with CNN to deal with multi-scale features.
Most networks for tasks such as semantic segmentation have encoder–decoder architectures. Common encoders include VGG [29], ResNet [30] and, recently, the transformer [31]. However, the feature extraction ability of these encoders is limited to some extent. In particular, network performance improvements depend on how to handle the above features and, most importantly, how to reconstruct the features in the decoder. For developing decoders, different architectures have been devised; however, the bottom-up approach is typically used after feature extraction. A typical decoder is UNet [14], which is the basis for several subsequently developed networks. Various studies [32] have performed a fusion of features with different scales after extraction to improve feature reconstruction. In such methods, the decoder contains common convolutional and upsampling layers. Although its implementation is simple, this type of decoder lacks efficiency. Moreover, the features extracted by the encoder contain different levels of meaning at different resolutions. That is, current methods cannot take advantage of these features. How to reconstruct features efficiently and cooperate with each other is crucial in the design model.
To solve the abovementioned problems, we propose a deep-separation-guided progressive reconstruction network (DGPRNet) comprising a deep separation module (DSEM) for semantic segmentation of RSIs. In particular, to improve feature reconstruction, we design a progressive reconstruction block (PRB) based on atrous spatial pyramid pooling (ASPP) [33] with multiple convolutional layers combining various receptive fields for refactoring characteristics at each resolution. Unlike other methods based on upsampling to increase the resolution [34], the PRBs use deconvolution to adjust the resolution, increasing through each block until the input image is solved. Moreover, to enhance the forward guidance of deep semantic features to shallow layers, the proposed deep separation module (DSEM) processes semantic features such that pixels of the same class are clustered, whereas the separation between pixels from different classes is maximized. The prediction map is multi-supervised. Thus, the expression ability of deep semantic features is enhanced, and the PRB provides positive feedback.
The study’s contributions are as follows:
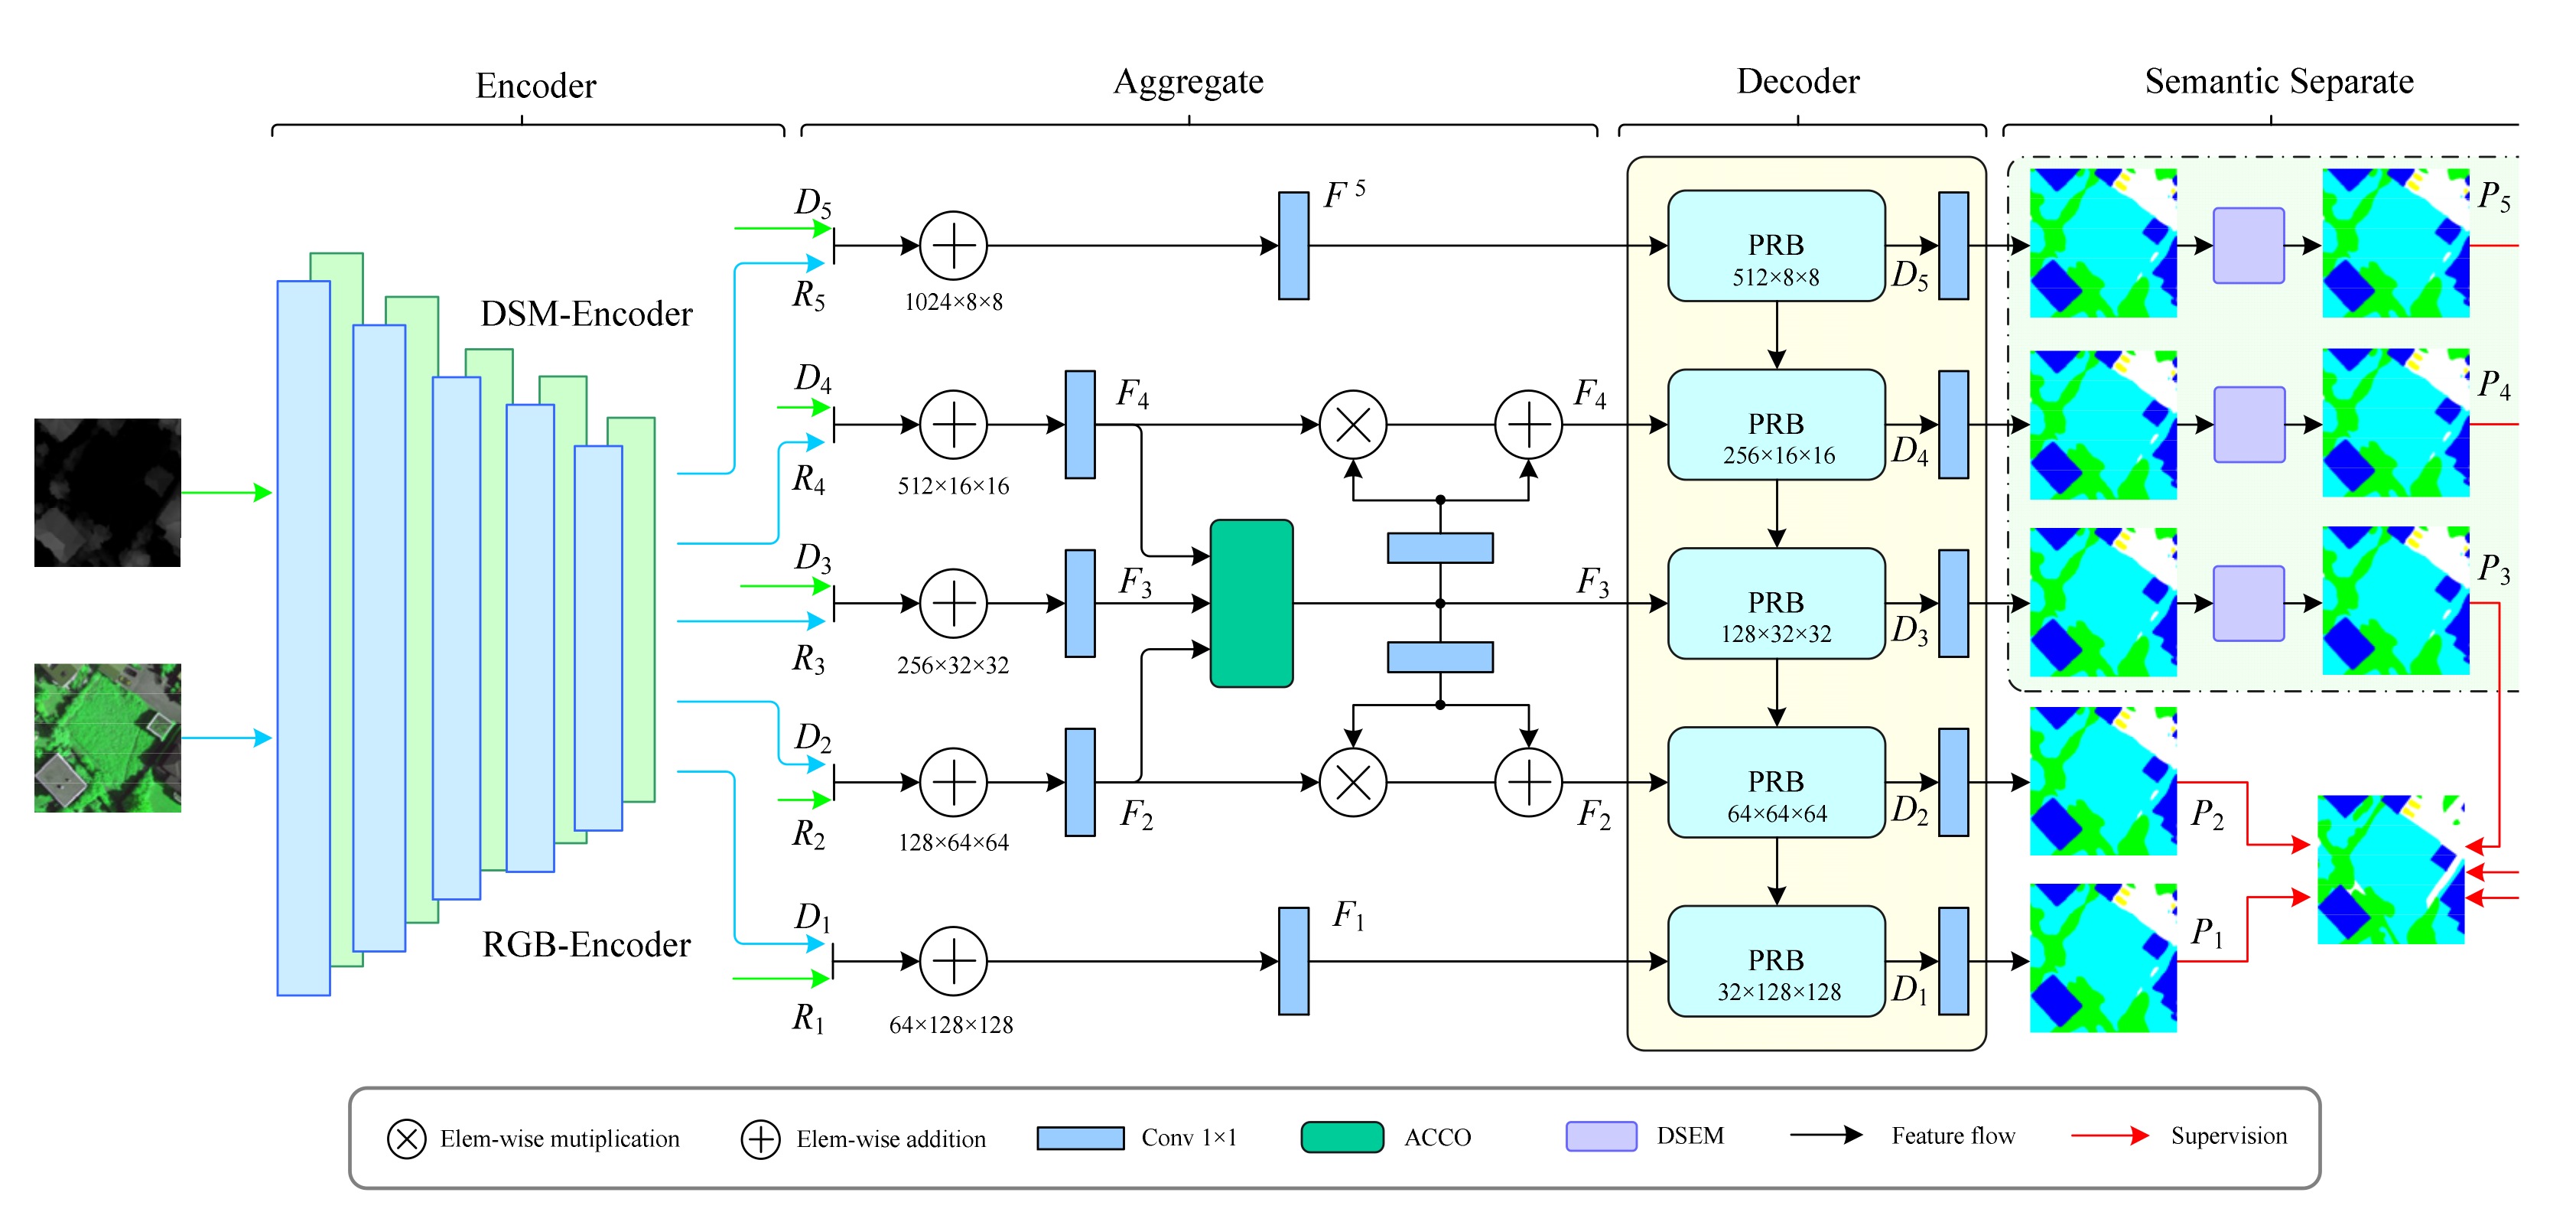
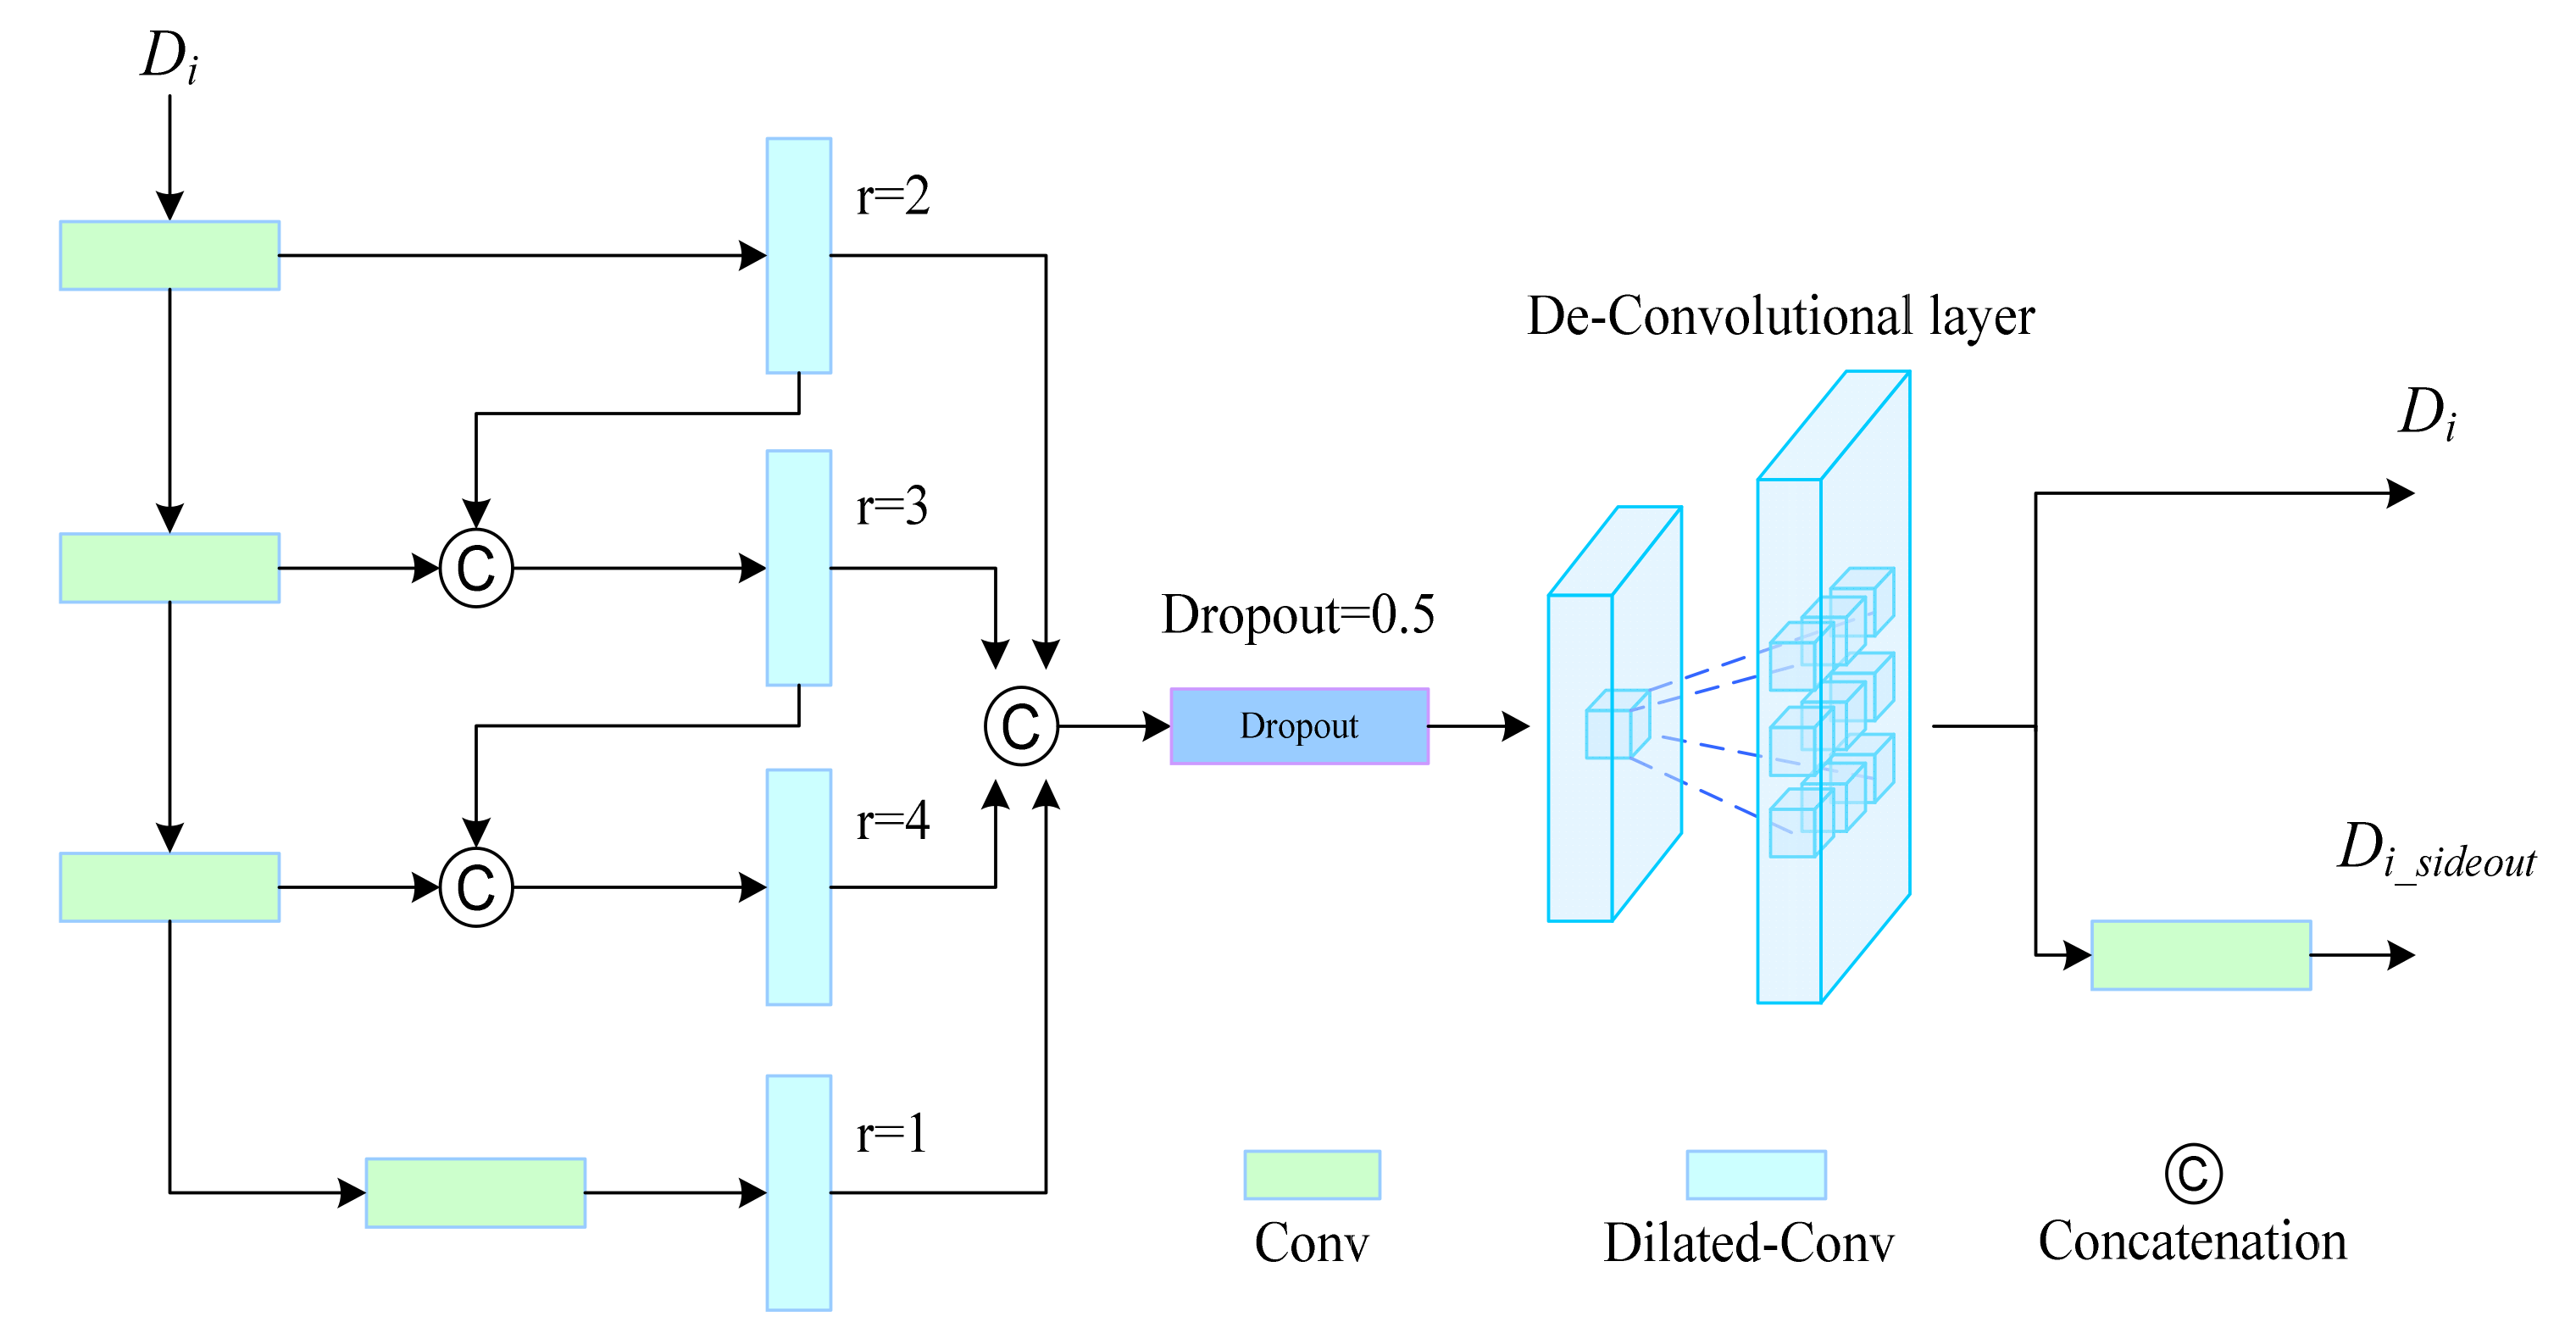
  • A PRB based on ASPP [33] was embedded in the decoder to strengthen the feature reconstruction and reduce the error in this process. Five features with different resolutions were processed serially using atrous convolution layers with different ratios, and the feature resolution was expanded by deconvolution to obtain the decoding output of each block.
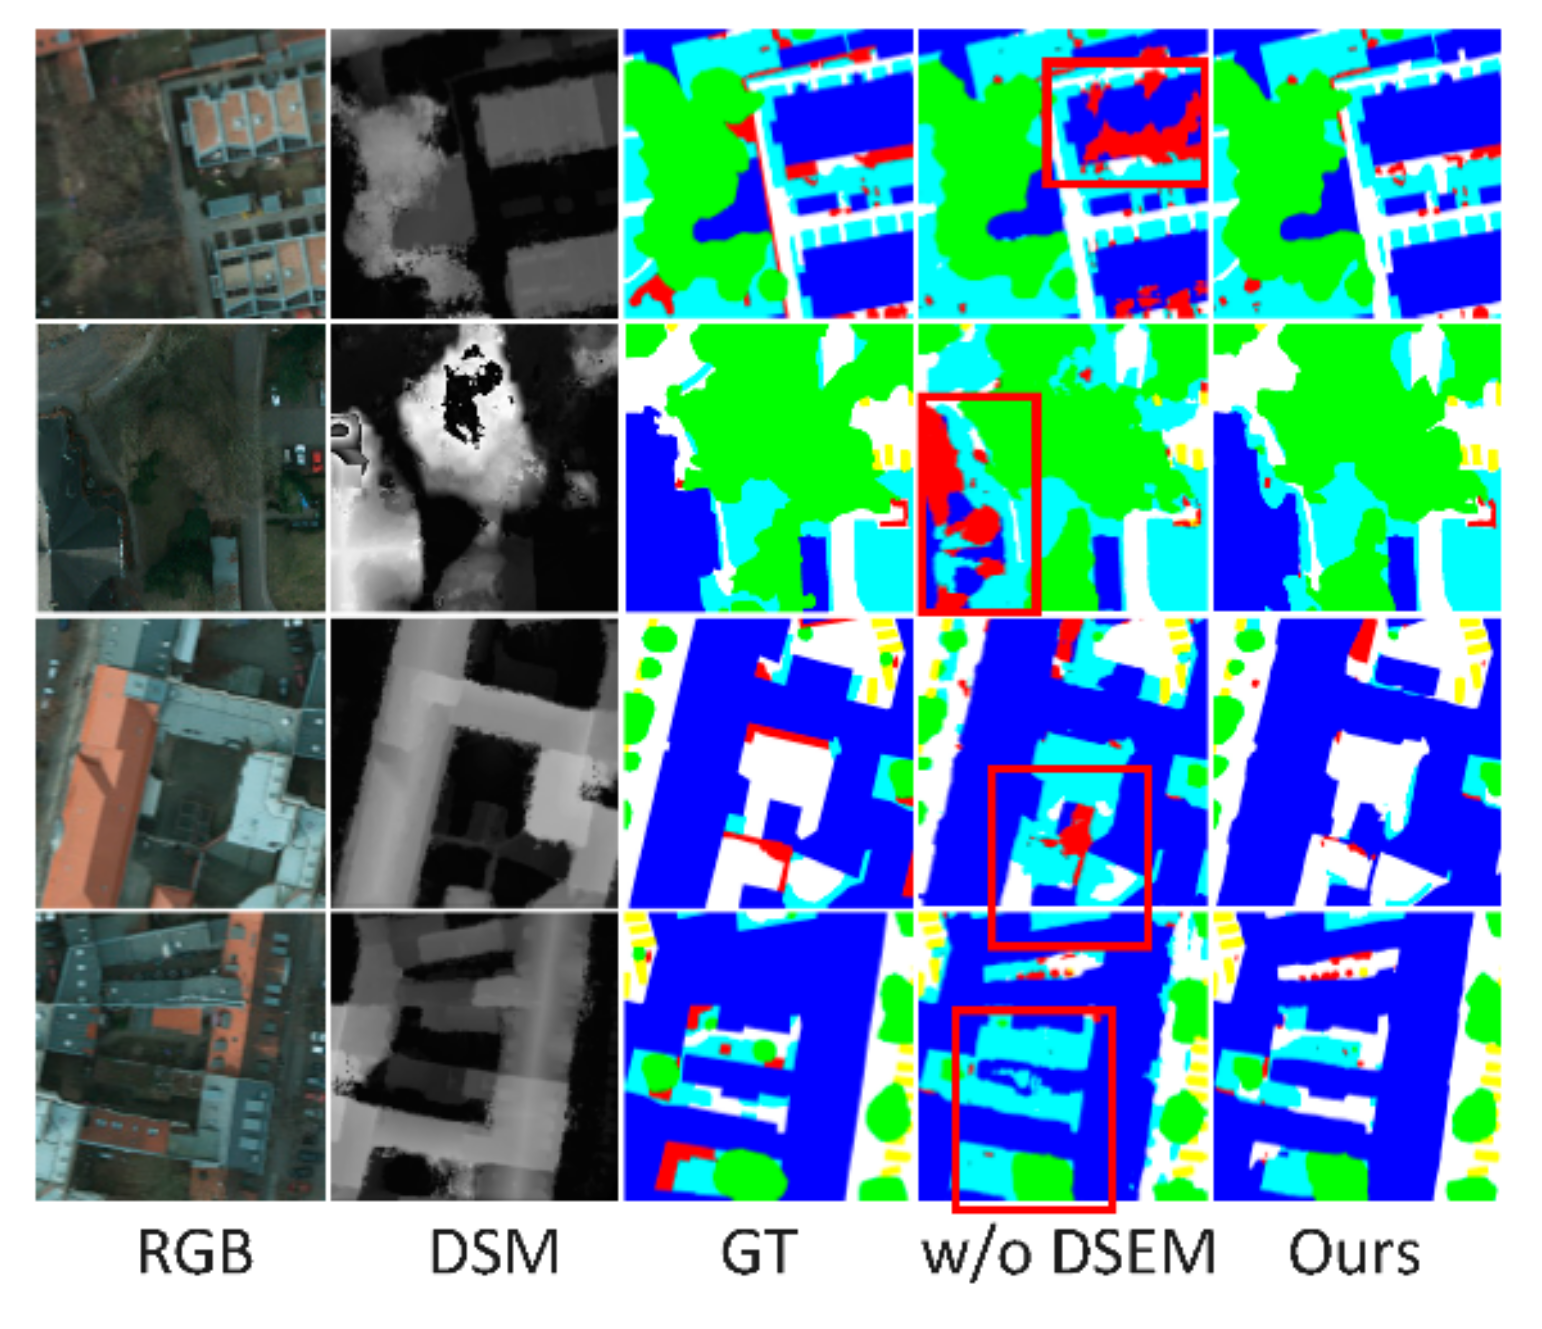
  • The proposed DSEM processed the last three semantic features from the decoder to emphasize semantic information to use deep semantic features. Intraclass separation was minimized, while interclass separation was maximized. Meanwhile, multi-supervision was applied to DGPRNet for segmentation, improving the reconstruction ability of each module.
  • Experiments on two RSI datasets showed that the proposed model outperforms 11 state-of-the-art methods, including current semantic segmentation methods.

2. Proposed DGPRNet

Figure 1 shows the architecture of the proposed DGPRNet. In particular, the architecture comprised symmetric ResNet-50 [30] backbones for feature extraction and the novel decoder consisting of PRBs and DSEM for processing semantic features. As seen in Figure 1, the DGPRNet adopts an encoder–decoder architecture. The two symmetric ResNet-50 backbones constituted the encoder processing input images by extracting features at five different resolutions from RGB (red–green–blue)/DSM (digital surface model) RSIs. According to the features extracted by the encoder, the adjacent modules from [35] were used between features F2, F3, and F4 for feature aggregation. During decoding, inspired by ASPP [33], we used the proposed PRBs to reconstruct and combine the features at various resolutions, and each PRB provided a prediction map at the corresponding resolution. The DSEM classified the last three deep semantic features. Finally, we obtained the prediction map from five scales.

2.1. Encoder

RGB and DSM images contained unreliable information and objects of different sizes due to the complexity of real scenes and the diversity of RSIs. In particular, feature extraction was essential in existing image semantic segmentation methods based on DL. We used ResNet-50 as the encoder to obtain five features with different resolutions, Ri and Di, i ∈ {1, 2, 3, 4, 5}, from the RGB and DSM images, respectively, and fused the features by simple pixel-wise addition [36,37,38,39], obtaining feature Fi. Shallow features contained details such as object boundaries, and deep features reflected semantic information such as the class and location of an object. RSIs contained various objects of different sizes. In particular, detecting these objects is crucial. Moreover, we used the module from [34] to aggregate multi-scale information. We retained the original information of the shallowest and deepest features and only used the features of the middle three resolutions to obtain the aggregated representation of adjacent features. The aggregated features were supplemented with features at the corresponding resolution. The encoder was formulated as follows:
F i = C o n v ( R i D i ) ,
F 3 = A C C O ( F 2 , F 3 , F 4 ) F 2 = F 2 C o n v ( F 3 ) C o n v ( F 3 ) F 4 = F 4 C o n v ( F 3 ) C o n v ( F 3 ) ,
where ⊕ denotes pixel-wise addition, ⊗ denotes pixel-wise multiplication, and Conv represents a convolutional layer with batch normalization and rectified linear unit activation. Subsequently, the aggregated representation of an object at different resolutions can be obtained. In this way, multi-scale objects can be accurately detected.

2.2. PRB

Universal networks work well on all datasets. Therefore, a critical problem in applying DL to computer vision is reconstructing the features extracted by the encoder according to the characteristics of a specific dataset, and finally providing an accurate prediction map. Therefore, we proposed the PRB (shown in Figure 2), where the encoder extracted features with different resolutions. Based on ASPP, we used dilated convolutions with different rates in series to enlarge the receptive field at each resolution. In each block, objects of different sizes and those with different dimensions were detected at different resolutions.
After the encoded features were obtained, the PRB reconstructed the features at each resolution. In [33], ASPP modules were deployed at the bottom of the network, acting on the deepest semantic features to expand the receptive field. However, the intended effect was limited. Based on ASPP, we expanded the receptive field in each layer during decoding to detect objects at different resolutions. Specifically, the PRB contained four convolutional layers with different dilation rates. Moreover, the features were serially transferred between convolutional layers. Then, they were concatenated in parallel for feature aggregation under different receptive fields. Moreover, upsampling enables us to increase the resolution of features [31]. Inspired by deconvolution, we merged upsampling and feature aggregation into one step, and a dropout layer was added to prevent overfitting. The PRB was formulated as follows:
D i = C a t ( F i , D i + 1 ) ,
D i , c 1 = C o n v ( D i ) D i , c 2 = C o n v ( D i , c 1 ) D i , c 3 = C o n v ( D i , c 2 ) ,
D i , d 2 = D C o n v ( D i , 2 ) D i , d 3 = D C o n v ( C a t ( D i , d 2 , D i , c 2 ) , 3 ) D i , d 4 = D C o n v ( C a t ( D i , d 3 , D i , c 3 ) , 4 ) ,
D i = D e C o n v ( D r o p o u t ( C a t ( D i , c 3 , D i , d 2 , D i , d 3 , D i , d 4 ) , 0.5 ) ) ,
where Cat, DConv, and DeConv denote concatenation, a dilated convolutional layer, and a deconvolutional layer, respectively, and i ∈ {1, 2, 3, 4, 5}, with Di+1 being omitted for i = 5 in Equation (3).

2.3. DSEM

Deep semantic features represent the mapping of an image onto a semantic space. Moreover, the feature representation of pixels belonging to a class in complex scenes showed high variability, and RSIs corresponded to complex scenes. Consequently, different objects might be classified into the same class in some cases. To increase the classification accuracy, we proposed the DSEM that modeled intraclass and interclass features to strengthen their distinguishability and reduce ambiguity. First, high-level semantic feature map Di, i ∈ {3, 4, 5} was processed by a 1 × 1 convolutional layer to obtain feature maps α, β, γRC×H×W. Then, the features were processed to obtain different expressions within and between classes. The DSEM was formulated as follows:
i n t r a = S o f t m a x ( R ( α ) × T ( R ( β ) ) ) × R ( γ ) i n t r a = F ( i n t r a ) + D i , ,
i n t e r = S o f t m a x ( T ( R ( D i ) ) × R ( D i ) ) i n t e r = F ( i n t e r ) × D i + D i , ,
P i = ( i n t e r + i n t r a ) D i ,
where R denotes a resizing function from RC×H×W to RC×HW, T is the transposition from RC×HW to RHW×C, F denotes the inverse mapping of R, and × denotes matrix multiplication.
The original semantic features were combined with the weights for intraclass and interclass features to obtain a deep separation prediction with higher resolution and more detailed feature classification performance while reducing feature redundancy. We applied the DSEM to features of the last three resolutions obtained from decoding. The network simultaneously performed prediction at five resolutions during training and supervised the network. Hence, the reconstruction ability during decoding was strengthened by integrating the DSEM.

2.4. Loss Function

We used binary cross-entropy as the loss function between the prediction map and the segmentation ground truth. The obtained prediction maps at five resolutions were resized to the dimension of the ground truth to calculate the loss. Given the five prediction maps, the binary cross-entropy loss function was defined as follows:
L o s s = i = 1 5 B C E ( P i , G T ) ,
where GT and P denote the ground truth and a prediction map, respectively. During testing, P1 is the segmentation result of DGPRNet.

3. Experiments and Results

3.1. Datasets and Performance Indicators

The Potsdam [40] and Vaihingen [41] RSI datasets were used in semantic segmentation experiments to verify the performance of the proposed DGPRNet. The Potsdam dataset contains 38 patches of 6000 × 6000 pixels, in our experiments, we considered 17 patches for training (2_10, 3_10, 3_11, 3_12, 4_11, 4_12, 5_10, 5_12, 6_8, 6_9, 6_10, 6_11, 6_12, 7_7, 7_9, 7_11, 7_12) and 7 patches for testing (2_11, 2_12, 4_10, 5_11, 6_7, 7_8, 7_10). Furthermore, the Vaihingen dataset comprised 33 images with pixels of 2494 × 2064. We split the 16 patches for training (1, 3, 5, 7, 13, 17, 21, 23, 26, 32, 37) and 5 patches for testing (11, 15, 28, 30, 34). For evaluation, we used the average pixel accuracy of each class and the average intersection over union as performance indicators. Moreover, the intersection over union was applied between the prediction and target regions to obtain the optimal segmentation weight. Therefore, the intersection over union was the main indicator for training and evaluating different methods on the two RSI datasets.

3.2. Implementation Details

The experimental platform was implemented in Ubuntu 20.04 using the PyTorch 1.9.1 environment, and the network was trained on a computer equipped with an NVIDIA Titan V graphics card and 12 GB of memory. Owing to the large size of the original RSIs, the patches of input RGB and DSM images were scaled to 256 × 256 pixels. Finally, we obtained 35,972 slices for training, 4032 slices for validation, and 252 slices for testing on Potsdam. Moreover, we obtained 17,656 slices for training, 412 slices for validation, and 111 slices for testing on Veihingen. The pretrained ResNet-50 was used as the backbone for feature extraction. Considering the dataset characteristics and training time, training proceeded over 300 epochs on the Vaihingen dataset and over 100 epochs on the Potsdam dataset. We used stochastic gradient descent with a momentum of 0.9, weight decay of 0.9, batch size of 10, and learning rate of 5 × 10⁻⁴ for optimization. Moreover, we used a poly strategy [42] to adjust the learning rate during training. The training process of the model on the two datasets took approximately 32 h, and the test time was 73 min and 6 min, respectively, on Potsdam and Vaihingen, including the model inference time and the concatenation from slices into high-resolution remote sensing images.

3.3. Comparison with State-of-the-Art Methods

3.3.1. Quantitative Evaluation

In particular, Table 1 and Table 2 list the performance indicators obtained by applying various methods on the two RSI semantic segmentation datasets. Table 3 summarizes the comparison results of all models in terms of flops and parameters, including the method based on Transformer [43]. The proposed DGPRNet outperformed the comparison methods on the Potsdam and Vaihingen datasets, and the indicators verified the high detection performance of the proposed method. Moreover, the DGPRNet detection of the class car on the two datasets was remarkable, confirming correct object detection in challenging scenes. Compared with existing methods, DGPRNet showed outstanding results in three classes, namely impervious surfaces, buildings, and cars, on the Vaihingen dataset. In addition, both mAcc and mIoU outperformed the best indicators in the comparisons. In particular, the IoU indicator of DGPRNet in the impervious surface and building outperformed the participating methods by 0.52% (SA-Gate) and 0.96% (ACNet). Especially for the class car, DGPRNet reached 92.30% and 84.84% in Acc and IoU indicators, which exceeded 8.03% and 6.77% compared with SA-Gate. In addition, the overall indicators mAcc and mIoU reached 90.43% and 82.36%, respectively, increasing by 1.81% and 1.69% compared to SA-Gate. Furthermore, on the Potsdam dataset, the DGPRNet outperformed the comparison methods in almost all classes except for low vegetation, tree, and clutter on the classification accuracy. Similarly, IoU in car and cluster reached 92.46% and 47.02%, respectively, compared with more than 2.03% and 3.48% for ACNet and Deeplabv3+. The accuracy on the class car exceeded HRCNet by 2.09% and reached 96.03%. In terms of overall performance, the proposed DGPRNet achieved mAcc of 85.69% and mIoU of 77.69%, increasing by 1.27% and 1.79% compared to the SA-Gate and RedNet, respectively. The improvement in the overall indicators of the proposed method in the small category can be explained as follows: by complementing each other at different resolutions, the aggregate representation information of a specific category at multiple scales can be obtained, greatly improving the accuracy and IoU on the small objects. Therefore, the improvement in this category is particularly significant.

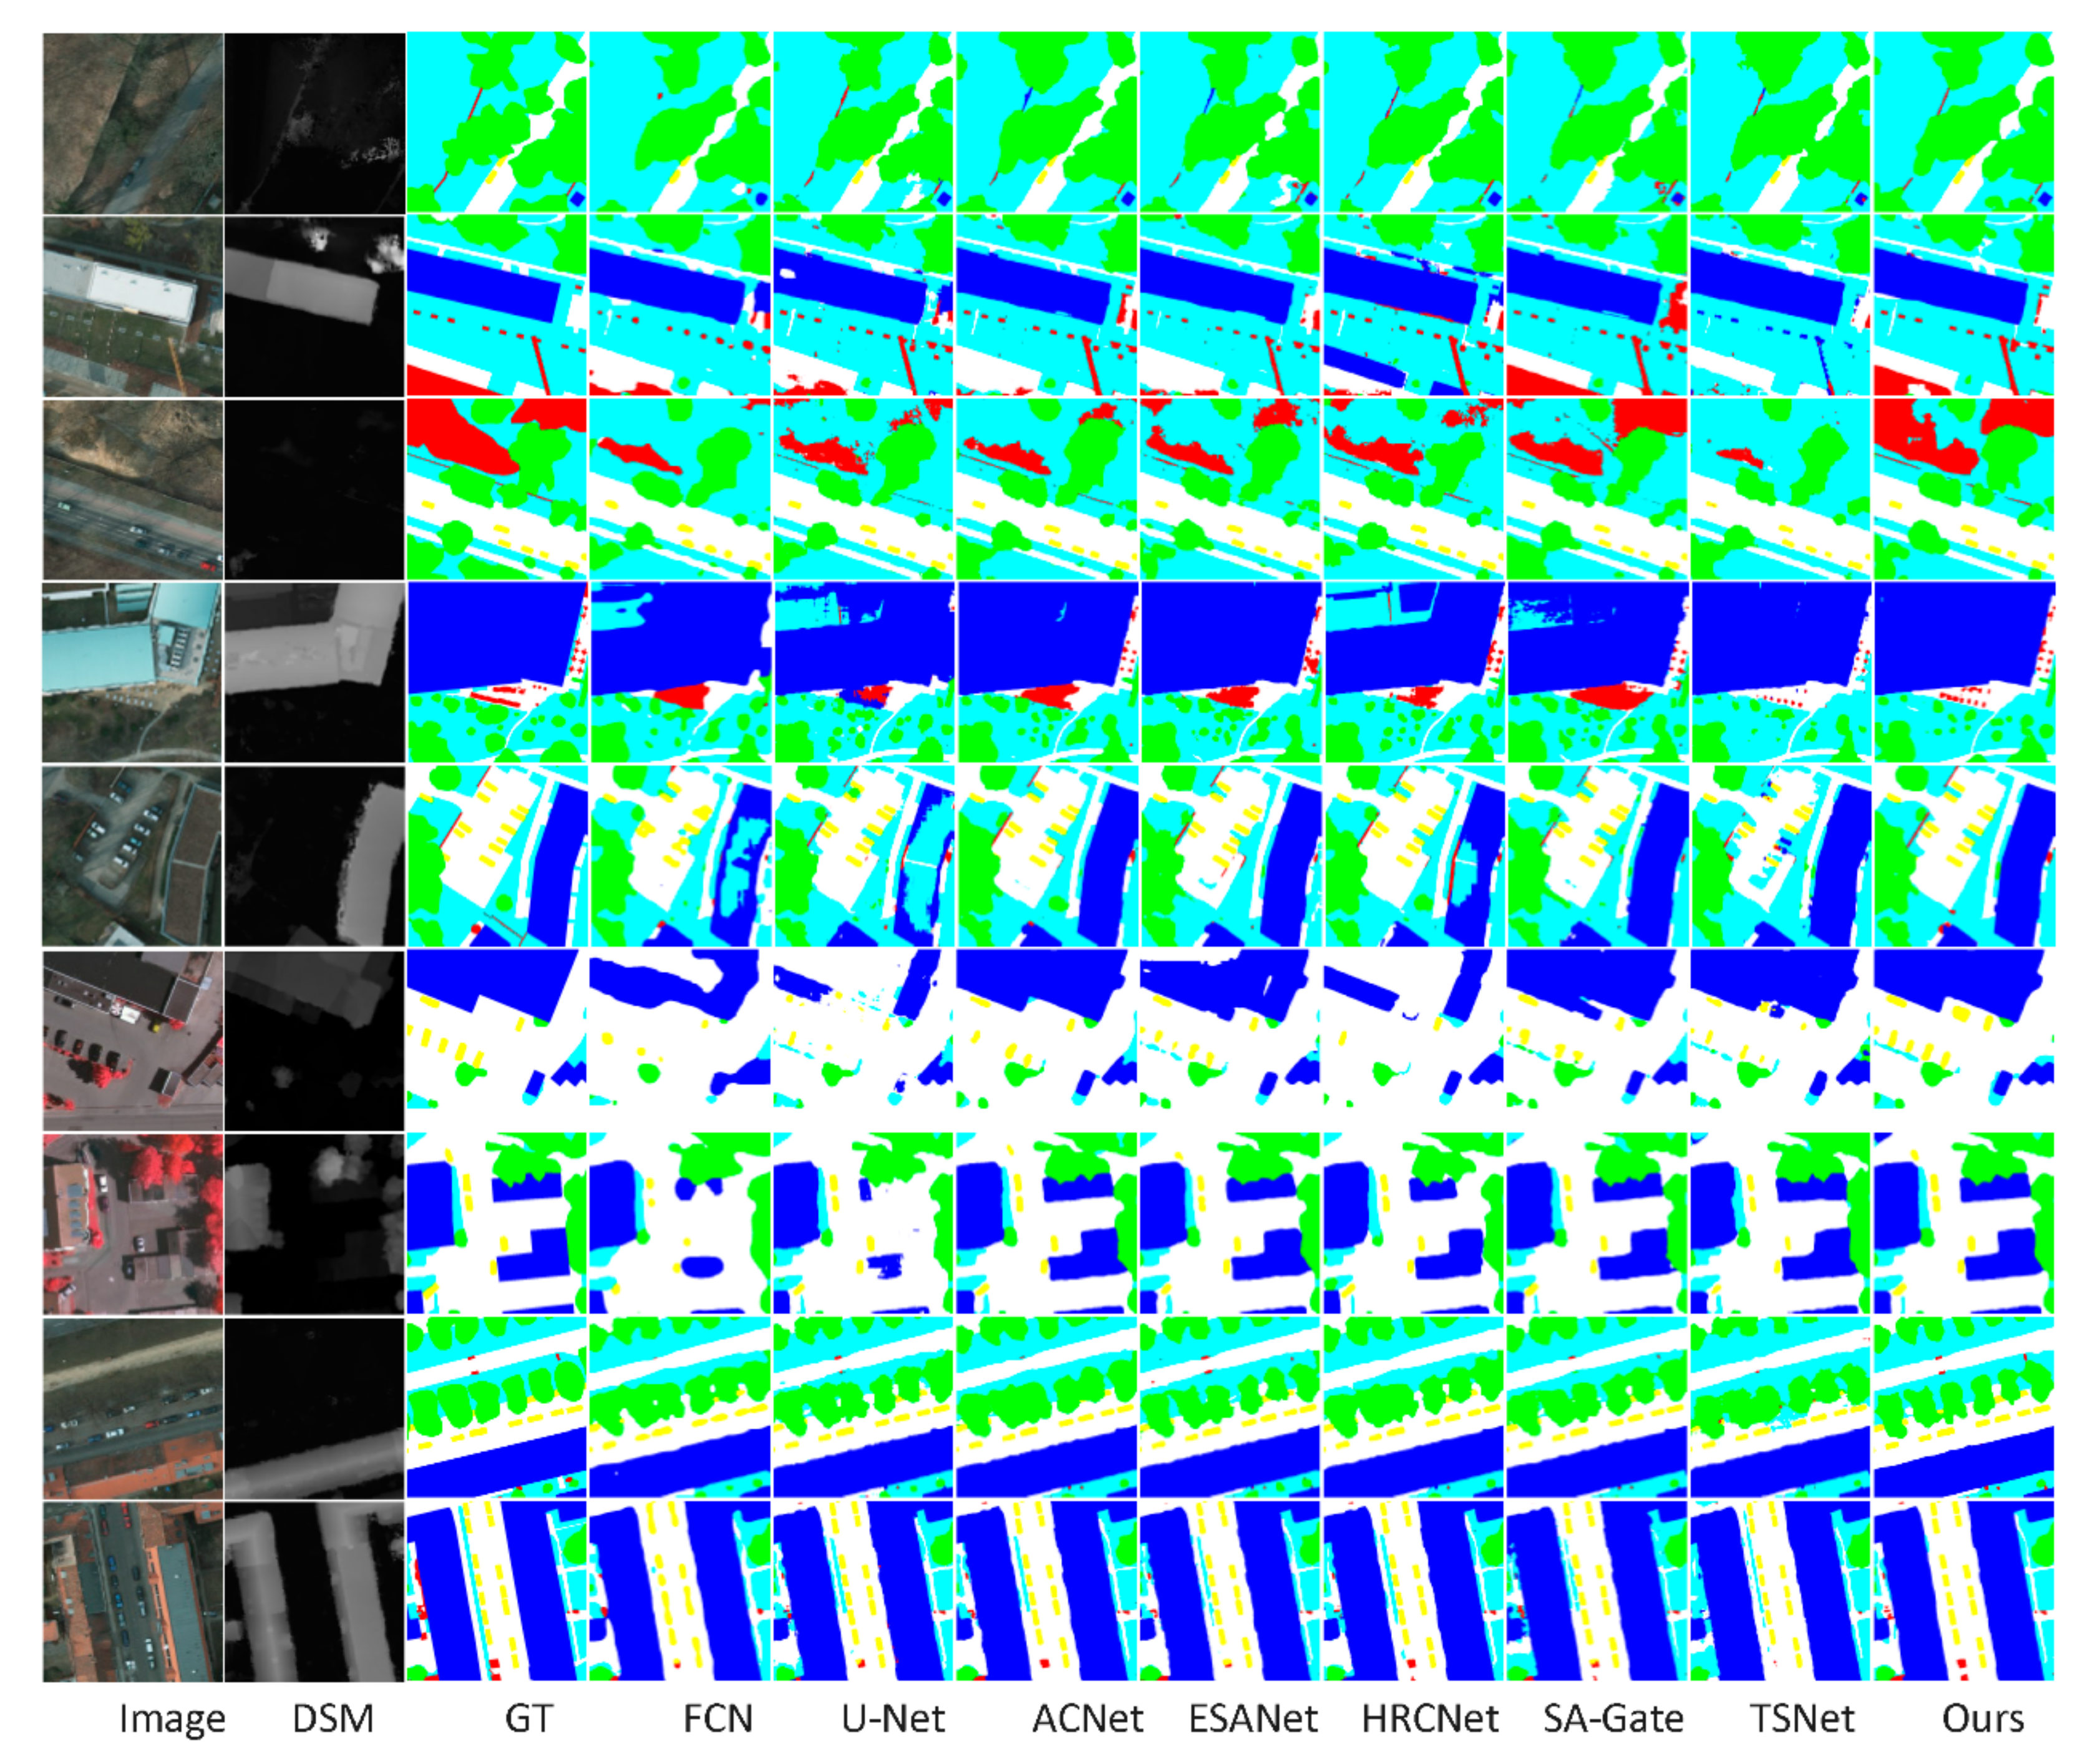
3.3.2. Qualitative Evaluation

Figure 3 shows the segmentation results obtained using DGPRNet and 11 state-of-the-art methods. Examples of multiple scenes were included, such as scenes with objects of different scales (clutter), small objects (car), large objects (building), low contrast with the background, and blurred boundaries. In general, the qualitative results show that DGPRNet has improved scene adaptability and reconstruction accuracy compared to similar methods. In the visual contrast result, the area marked by the red rectangle shows the place that differs the most. Some methods could not precisely locate the objects of clutter because the object was usually located in a complex scene with different sizes. As shown in the first to fifth lines of Figure 3, the clutter can be accurately located in many complex scenes compared with other models. As the classes with the largest proportion in the dataset, the detection results of the proposed method for buildings are accurate and the edges are smooth, as shown in the second, third, sixth, and seventh rows in Figure 3. Compared with other methods, there are fewer cases of incomplete detection. The key problem to be solved in this study is to accurately segment the small objects (car) in the dataset. As seen from the fifth to the ninth rows of Figure 3, the segmentation result of the class car is more precise than that of other models. The qualitative results showed that DGPRNet better adapted to different scenes and reconstructed features with higher accuracy than similar methods. Moreover, DGPRNet performed highly in various complex scenes and detected small objects and the object’s edges better than the other evaluated methods.

3.4. Ablation Study

To verify the effectiveness of the adopted modules, we conducted a comparative experiment on two datasets. Table 4 lists the comparison of the ablation indicators.

3.4.1. Effect of Modal DSM

The effectiveness of multimodal data was verified. In this regard, the DSM data were removed and represented as w/o DSM in Table 4. The ablation results show that the scores of the model in the single modal are slightly lower than those in the multimodal data. The results indicate that DSM modal data can indeed improve the performance of the model from another perspective.

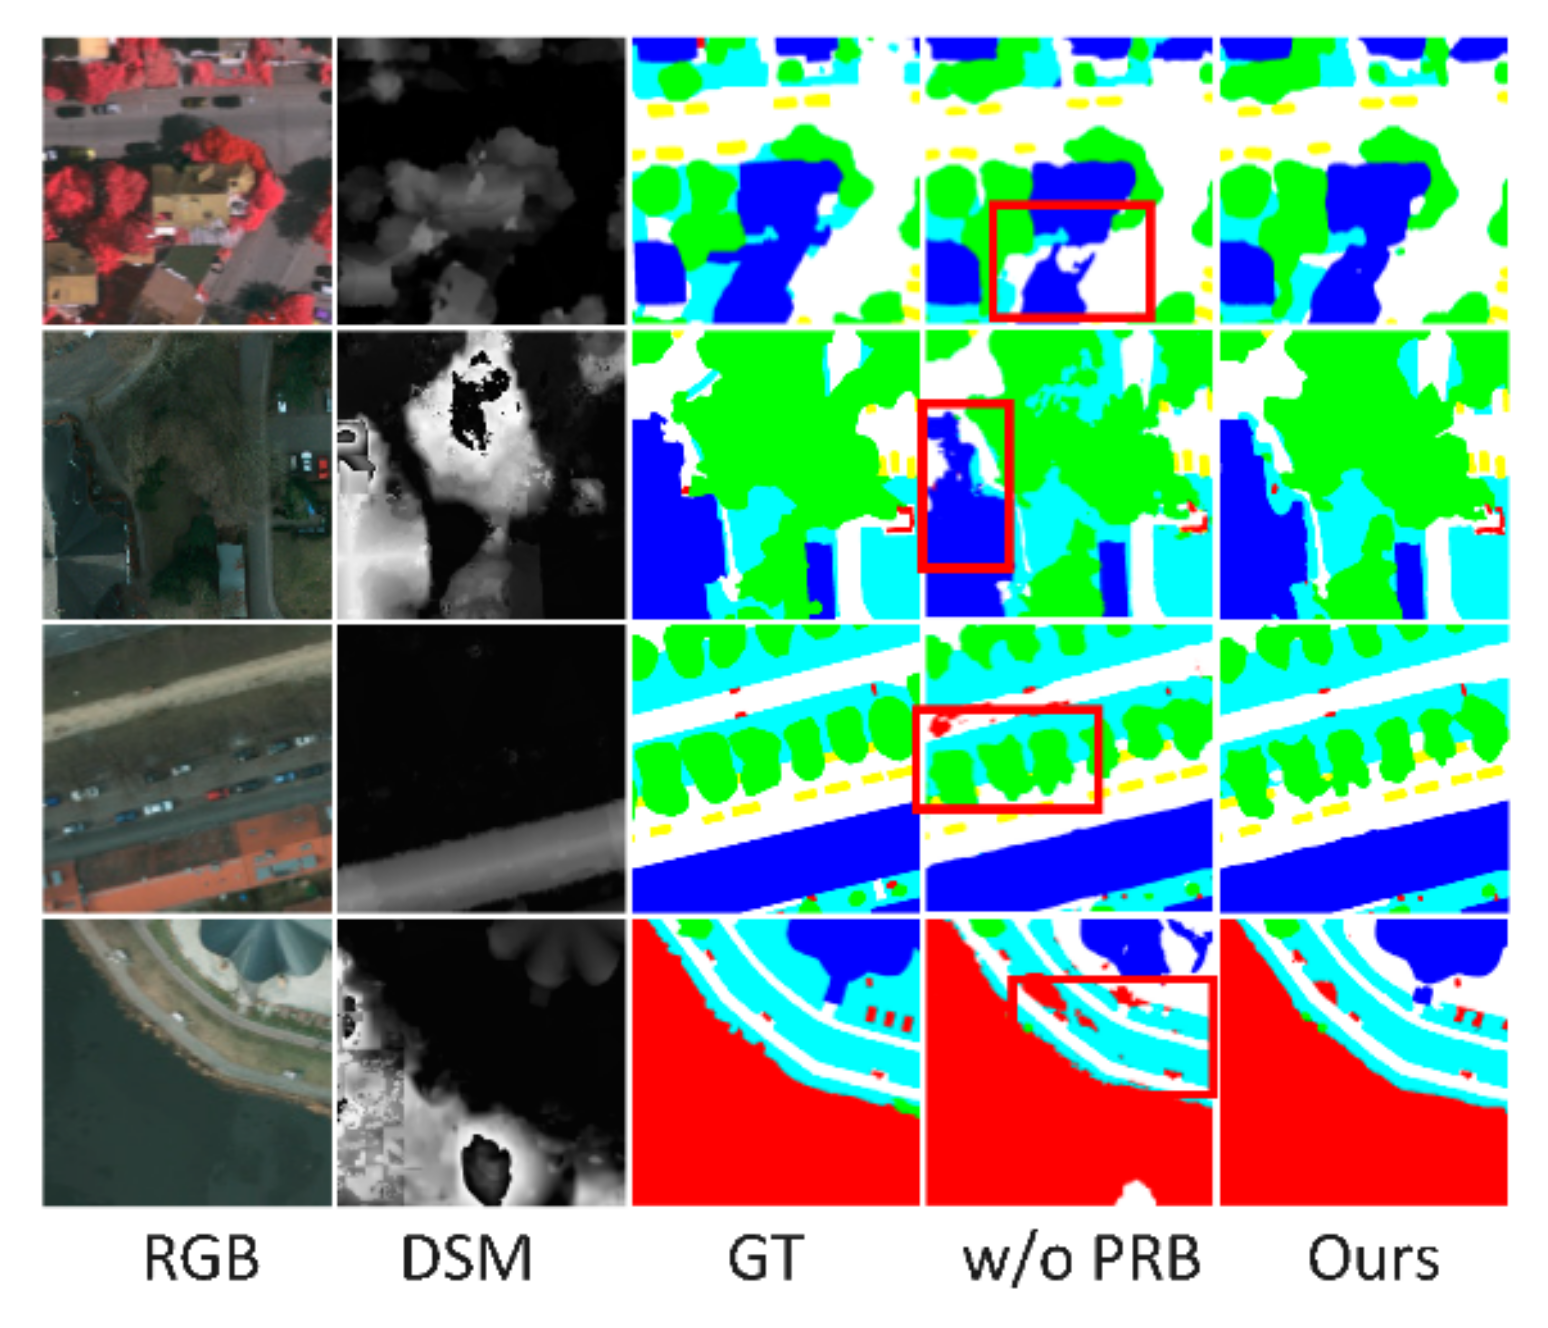
3.4.2. Effects of Module PRB

The w/o PRB indicates the scheme implemented without the PRB module. In the decoding part, we replaced the PRB module with the convolution block combined with 3 × 3 convolutional layers + BN + ReLU to verify the effectiveness of the PRB module. Figure 4 shows the prediction map. The scheme without the PRB module performed lower than the full model. For example, the detection area of the building in the first, second, and fourth rows is discontinuous. Furthermore, a clutterer was present with incorrect classification in the third and fourth rows. The above comparison diagram also verifies that the PRB module reduces the feature reconstruction error in the process of network decoding and plays a crucial role in network inference. Compared with the full model, the ablation indicators mAcc and mIoU of PRB decreased by 1.93% and 1.63% on the Vaihingen dataset and 1.15% and 2.23% on the Potsdam dataset, respectively. The above results demonstrate the importance of the PRB module from both qualitative and quantitative perspectives.

3.4.3. Effects of Module DSEM

Similarly, we verified the effectiveness of DSEM and the multi-supervision strategy. We removed the DSEM and multi-supervision strategy of the last three layers of semantic features and used the scheme w/o DSEM to represent it. The performance of the scheme w/o DSEM was low. As shown in Table 4, compared with the full model, the DSEM scheme decreased the two indicators by 3.29% and 3.52% in the Vaihingen dataset and 4.88% and 7.2% in the Potsdam dataset, respectively. Moreover, from the perspective of visualization, if no further exploration of the deep feature exists between classes, the first and second lines of Figure 5 are confused with building and clutter. Similarly, a category misclassification will be present in the third and fourth lines. Hence, we concluded that this module considerably facilitated the reconstruction ability of the network decoding layer. The module improved the specification effect on the deep semantic features and helped the decoding module enhance reconstruction under different resolutions.

4. Conclusions

This study proposed a novel network framework called DGPRNet for semantic segmentation of remote sensing images by exploring inter and intraclass relationships in deep features and decreasing feature reconstruction loss in the decoder. First, adjacent intermediate features were complemented before decoding to improve the expression of multi-scale features. Second, PRB was developed and deployed at five stages in the decoder to capture detailed features obtained from different receiving fields at multiple resolutions, reducing error and maintaining accuracy during reconstruction. Finally, the proposed DSEM distinguished and aggregated interclass and intraclass features based on semantic features to leverage deep features in detecting objects with different scales. Experimental results on two RSI datasets showed that DGPRNet outperformed 11 state-of-the-art methods.

Author Contributions

Conceptualization, J.M. and W.Z.; methodology, J.M., X.Q.; software, X.Q.; validation, L.Y.; writing—review and editing, W.Z., L.Y.; supervision, W.Z.; project administration, W.Z.; funding acquisition, X.Q. All authors have read and agreed to the published version of the manuscript.

Funding

This work was supported by National Natural Science Foundation of China (61502429, 61672337, 61972357); the Zhejiang Provincial Natural Science Foundation of China (LY18F020012, LY17F020011), and Zhejiang Key R & D Program (2019C03135).

Data Availability Statement

The code used and the datasets generated during the different steps of the analysis are available from the corresponding author on reasonable request.

Acknowledgments

The authors sincerely appreciate the helpful comments and constructive suggestions given by the academic editors and reviewers.

Conflicts of Interest

The authors declare no conflict of interest.

References

  1. Neupane, B.; Horanont, T.; Aryal, J. Deep learning-based semantic segmentation of urban features in satellite images: A review and meta-analysis. Remote Sens. 2021, 13, 808. [Google Scholar] [CrossRef]
  2. Zhou, W.; Liu, J.; Lei, J.; Hwang, J.-N.; Yu, L. GMNet: Graded-feature multilabel-Learning network for RGB-Thermal urban scene semantic segmentation. IEEE Trans. Image Process. 2021, 30, 7790–7802. [Google Scholar] [CrossRef]
  3. Chen, Z.; Li, D.; Fan, W.; Guan, H.; Wang, C.; Li, J. Self-attention in reconstruction bias U-Net for semantic segmentation of building rooftops in optical remote sensing images. Remote Sens. 2021, 13, 2524. [Google Scholar] [CrossRef]
  4. Wang, L.; Li, R.; Wang, D.; Duan, C.; Wang, T.; Meng, X. Transformer meets convolution: A bilateral awareness network for semantic segmentation of very fine resolution urban scene images. Remote Sens. 2021, 13, 3065. [Google Scholar] [CrossRef]
  5. Zhou, W.; Yang, E.; Lei, J.; Wan, J.; Yu, L. PGDENet: Progressive Guided Fusion and Depth Enhancement Network for RGB-D Indoor Scene Parsing. IEEE Trans. Multimed. 2022. [Google Scholar] [CrossRef]
  6. Zhou, W.; Liu, W.; Lei, J.; Luo, T.; Yu, L. Deep binocular fixation prediction using hierarchical multimodal fusion network. IEEE Trans. Cogn. Dev. Syst. 2021. [Google Scholar] [CrossRef]
  7. Wu, J.; Zhou, W.; Luo, T.; Yu, L.; Lei, J. Multiscale multilevel context and multimodal fusion for RGB-D salient object detection. Signal Process. 2021, 178, 107766. [Google Scholar] [CrossRef]
  8. Zhou, W.; Jin, J.; Lei, J.; Yu, L. CIMFNet: Cross-Layer Interaction and Multiscale Fusion Network for Semantic Segmentation of High-Resolution Remote Sensing Images. IEEE J. Sel. Top. Signal Process. 2022, 16, 666–676. [Google Scholar] [CrossRef]
  9. Liu, X.; Jiao, L.; Zhao, J.; Zhao, J.; Zhang, D.; Liu, F.; Tang, X. Deep multiple instance learning-based spatial–spectral classification for PAN and MS imagery. IEEE Trans. Geosci. Remote Sens. 2017, 56, 461–473. [Google Scholar] [CrossRef]
  10. Mou, L.; Hua, Y.; Zhu, X.X. A relation-augmented fully convolutional network for semantic segmentation in aerial scenes. In Proceedings of the IEEE/CVF Conference on Computer Vision and Pattern Recognition, Salt Lake City, UT, USA, 18–23 June 2018; pp. 12416–12425. [Google Scholar]
  11. Zhou, W.; Dong, S.; Lei, J.; Yu, L. MTANet: Multitask-Aware Network with Hierarchical Multimodal Fusion for RGB-T Urban Scene Understanding. IEEE Trans. Intell. Veh. 2022. [Google Scholar] [CrossRef]
  12. Zhou, W.; Guo, Q.; Lei, J.; Yu, L.; Hwang, J.-N. IRFR-Net: Interactive recursive feature-reshaping network for detecting salient objects in RGB-D images. IEEE Trans. Neural Netw. Learn. Syst. 2021. [Google Scholar] [CrossRef]
  13. Long, J.; Shelhamer, E.; Darrell, T. Fully convolutional networks for semantic segmentation. In Proceedings of the IEEE Conference on Computer Vision and Pattern Recognition, Boston, MA, USA, 7–12 June 2015; pp. 3431–3440. [Google Scholar]
  14. Ronneberger, O.; Fischer, P.; Brox, T. U-net: Convolutional networks for biomedical image segmentation. In Proceedings of the International Conference on Medical Image Computing and Computer-Assisted Intervention, Munich, Germany, 5–9 October 2015; pp. 234–241. [Google Scholar]
  15. Vijay, B.; Alex, K.; Roberto, C. SegNet: A Deep Convolutional Encoder-Decoder Architecture for Image Segmentation. IEEE Trans. Pattern Anal. Mach. Intell. 2017, 39, 2481–2495. [Google Scholar]
  16. Jiang, J.; Zheng, L.; Luo, F.; Zhang, Z. Rednet: Residual encoder-decoder network for indoor rgb-d semantic segmentation. arXiv 2018, arXiv:1806.01054. [Google Scholar]
  17. Chen, L.C.; Zhu, Y.; Papandreou, G.; Schroff, F.; Adam, H. Encoder-decoder with atrous separable convolution for semantic image segmentation. In Proceedings of the European Conference on Computer Vision, Munich, Germany, 8–14 September 2018; pp. 801–818. [Google Scholar]
  18. Chen, X.; Lin, K.Y.; Wang, J.; Wu, W.; Qian, C.; Li, H.; Zeng, G. Bi-directional cross-modality feature propagation with separation-and-aggregation gate for RGB-D semantic segmentation. In European Conference on Computer Vision; Springer: Cham, Switzerland, 2020; pp. 561–577. [Google Scholar]
  19. Yu, C.; Gao, C.; Wang, J.; Yu, G.; Shen, C.; Sang, N. Bisenet v2: Bilateral network with guided aggregation for real-time semantic segmentation. Int. J. Comput. Vis. 2021, 129, 3051–3068. [Google Scholar] [CrossRef]
  20. Xu, Z.; Zhang, W.; Zhang, T.; Li, J. HRCNet: High-resolution context extraction network for semantic segmentation of remote sensing images. Remote Sens. 2020, 13, 71. [Google Scholar] [CrossRef]
  21. Zhou, W.; Yuan, J.; Lei, J.; Luo, T. TSNet: Three-stream self-attention network for RGB-D indoor semantic segmentation. IEEE Intell. Syst. 2020, 36, 73–78. [Google Scholar] [CrossRef]
  22. Seichter, D.; Köhler, M.; Lewandowski, B.; Wengefeld, T.; Gross, H.M. Efficient rgb-d semantic segmentation for indoor scene analysis. In Proceedings of the IEEE International Conference on Robotics and Automation, Xi’an, China, 30 May–5 June 2021; pp. 13525–13531. [Google Scholar]
  23. Hu, X.; Yang, K.; Fei, L.; Wang, K. Acnet: Attention based network to exploit complementary features for rgbd semantic segmentation. In Proceedings of the IEEE International Conference on Image Processing, Taipei, Taiwan, 22–25 September 2019; pp. 1440–1444. [Google Scholar]
  24. Zhou, W.; Yu, L.; Zhou, Y.; Qiu, W.; Wu, M.; Luo, T. Local and global feature learning for blind quality evaluation of screen content and natural scene images. IEEE Trans. Image Process. 2018, 27, 2086–2095. [Google Scholar] [CrossRef]
  25. Zhou, W.; Yang, E.; Lei, J.; Yu, L. FRNet: Feature Reconstruction Network for RGB-D Indoor Scene Parsing. IEEE J. Sel. Top. Signal Process. 2022, 16, 677–687. [Google Scholar] [CrossRef]
  26. Zhou, W.; Lin, X.; Lei, J.; Yu, L.; Hwang, J.-N. MFFENet: Multiscale feature fusion and enhancement network for RGB–Thermal urban road scene parsing. IEEE Trans. Multimed. 2022, 24, 2526–2538. [Google Scholar] [CrossRef]
  27. Zheng, X.; Wu, X.; Huan, L.; He, W.; Zhang, H. A Gather-to-Guide Network for Remote Sensing Semantic Segmentation of RGB and Auxiliary Image. IEEE Trans. Geosci. Remote Sens. 2021, 60, 1–15. [Google Scholar] [CrossRef]
  28. Ma, X.; Zhang, X.; Pun, M.O. A Crossmodal Multiscale Fusion Network for Semantic Segmentation of Remote Sensing Data. IEEE J. Sel. Top. Appl. Earth Obs. Remote Sens. 2022, 15, 3463–3474. [Google Scholar] [CrossRef]
  29. Simonyan, K.; Zisserman, A. Very deep convolutional networks for large-scale image recognition. arXiv 2014, arXiv:1409.1556. [Google Scholar]
  30. He, K.; Zhang, X.; Ren, S.; Sun, J. Deep residual learning for image recognition. In Proceedings of the IEEE conference on Computer Vision and Pattern Recognition, Las Vegas, NE, USA, 27–30 June 2016; pp. 770–778. [Google Scholar]
  31. Zhou, W.; Liu, C.; Lei, J.; Yu, L.; Luo, T. HFNet: Hierarchical feedback network with multilevel atrous spatial pyramid pooling for RGB-D saliency detection. Neurocomputing 2022, 490, 347–357. [Google Scholar] [CrossRef]
  32. Zhou, W.; Lv, Y.; Lei, J.; Yu, L. Global and Local-Contrast Guides Content-Aware Fusion for RGB-D Saliency Prediction. IEEE Trans. Syst. Man Cybern. Syst. 2021, 51, 3641–3649. [Google Scholar] [CrossRef]
  33. He, K.; Zhang, X.; Ren, S.; Sun, J. Spatial pyramid pooling in deep convolutional networks for visual recognition. IEEE Trans. Pattern Anal. Mach. Intell. 2015, 37, 1904–1916. [Google Scholar] [CrossRef] [Green Version]
  34. Zhou, W.; Guo, Q.; Lei, J.; Yu, L.; Hwang, J.-N. ECFFNet: Effective and consistent feature fusion network for RGB-T salient object detection. IEEE Trans. Circuits Syst. Video Technol. 2022, 32, 1224–1235. [Google Scholar] [CrossRef]
  35. Li, G.; Liu, Z.; Zeng, D.; Lin, W.; Ling, H. Adjacent context coordination network for salient object detection in optical remote sensing images. IEEE Trans. Cybern. 2022. [Google Scholar] [CrossRef]
  36. Zhou, W.; Liu, C.; Lei, J.; Yu, L. RLLNet: A lightweight remaking learning network for saliency redetection on RGB-D images. Sci. China Inf. Sci. 2022, 65, 160107. [Google Scholar] [CrossRef]
  37. Gong, T.; Zhou, W.; Qian, X.; Lei, J.; Yu, L. Global contextually guided lightweight network for RGB-thermal urban scene understanding. Eng. Appl. Artif. Intell. 2023, 117, 105510. [Google Scholar] [CrossRef]
  38. Zhou, W.; Wu, J.; Lei, J.; Hwang, J.-N.; Yu, L. Salient object detection in stereoscopic 3D images using a deep convolutional residual autoencoder. IEEE Trans. Multimed. 2021, 23, 3388–3399. [Google Scholar] [CrossRef]
  39. Zhou, W.; Zhu, Y.; Lei, J.; Wan, J.; Yu, L. CCAFNet: Crossflow and cross-scale adaptive fusion network for detecting salient objects in RGB-D images. IEEE Trans. Multimed. 2022, 24, 2192–2204. [Google Scholar] [CrossRef]
  40. International Society for Photogrammetry and Remote Sensing. 2D Semantic Labeling Contest-Potsdam. Available online: https://www.isprs.org/education/benchmarks/UrbanSemLab/2d-sem-label-potsdam.aspx (accessed on 1 January 2020).
  41. International Society for Photogrammetry and Remote Sensing. 2D Semantic Labeling Contest-Vaihingen. Available online: https://www.isprs.org/education/benchmarks/UrbanSemLab/2d-sem-label-vaihingen.aspx (accessed on 1 January 2020).
  42. Chen, L.C.; Papandreou, G.; Kokkinos, I.; Murphy, K.; Yuille, A.L. Deeplab: Semantic image segmentation with deep convolutional nets, atrous convolution, and fully connected crfs. IEEE Trans. Pattern Anal. Mach. Intell. 2017, 40, 834–848. [Google Scholar] [CrossRef] [Green Version]
  43. Wang, L.; Li, R.; Duan, C.; Zhang, C.; Meng, X.; Fang, S. A novel transformer based semantic segmentation scheme for fine-resolution remote sensing images. IEEE Geosci. Remote Sens. Lett. 2022, 19, 1–5. [Google Scholar] [CrossRef]
Figure 1. Overall architecture of the proposed DGPRNet. The network includes four stages: encoding, feature aggregation, decoding, and semantic separation.
Remotesensing 14 05510 g001
Figure 2. Architecture of the proposed PRB.
Remotesensing 14 05510 g002
Figure 3. Comparison of segmentation results from different methods.
Remotesensing 14 05510 g003
Figure 4. Ablation performance comparisons with the effect of PRB.
Remotesensing 14 05510 g004
Figure 5. Ablation performance comparisons with the effect of DSEM.
Remotesensing 14 05510 g005
Table 1. Quantitative results of the proposed DGPRNet and 11 state-of-the-art methods on the Vaihingen dataset. The values in bold indicate the best scores in the evaluation matrix.
FCN-8S
[13]
U-Net
[14]
SegNet
[15]
DeepLabv3+
[17]
BiseNetV2
[19]
HRCNet
[20]
RedNet
[16]
ACNet
[23]
SA-Gate
[18]
TSNet
[21]
ESANet
[22]
DCSwin
[43]
Ours
Imp.surfAcc89.6691.6889.8890.0690.5691.6291.4991.9590.9987.9392.0991.4091.55
IoU79.7180.9080.9381.1180.9781.6084.6285.3485.7078.9885.1884.4586.22
BuildingAcc93.2289.8490.8887.0491.2491.7294.8195.4593.8595.8194.9395.2995.80
IoU86.8086.5086.5482.7086.6988.0191.0791.8291.7291.4791.1691.3092.78
Low veg.Acc75.8377.9778.6676.6574.6879.2478.6778.6484.9571.6275.7279.0281.27
IoU64.3365.9164.0764.4463.6667.3866.5966.8768.6857.0365.4866.2668.62
TreeAcc89.2291.3088.9688.6091.6690.5591.4191.2089.0694.2692.3589.8591.22
IoU75.5877.8675.9676.6476.5478.5878.2778.5579.1581.2677.6577.5479.34
CarAcc45.1275.8043.9342.5163.7570.6959.7783.1284.2767.6375.9281.5192.30
IoU40.1671.2243.1643.1061.8068.7356.0676.8178.0766.8670.1173.4784.84
mAcc78.6179.7578.4676.9782.3884.7683.2388.0788.6283.5486.2087.4190.43
mIoU69.3271.3470.1369.4973.9376.8675.3279.8880.6775.1277.9278.6082.36
Table 2. Quantitative results of the proposed DGPRNet and 11 state-of-the-art methods on the Potsdam dataset.
FCN-8S
[13]
U-Net
[14]
SegNet
[15]
DeepLabv3+
[17]
BiseNetV2
[19]
HRCNet
[20]
RedNet
[16]
ACNet
[23]
SA-Gate
[18]
TSNet
[21]
ESANet
[22]
DCSwin
[43]
Ours
Imp.surfAcc89.4790.0390.1891.5790.1290.0392.1991.3285.8485.2291.3891.6692.76
IoU79.7780.2780.4682.4980.5881.6882.8382.7480.6476.8582.9282.2883.33
BuildingAcc90.6988.7190.2191.7888.8890.8793.6193.8393.6591.8593.6992.9293.94
IoU83.6082.9284.1887.5983.7085.7590.1390.0688.5186.6589.8289.1291.26
Low veg.Acc85.1385.8285.8887.3687.6888.1787.0086.1686.4688.5287.1087.3187.12
IoU71.1271.6071.6373.6371.5573.1873.2273.5372.7167.9873.1674.4874.46
TreeAcc82.8684.0682.4985.4581.1182.0283.0086.0385.7078.7582.4884.4685.84
IoU71.2372.0570.6873.3271.5571.3271.7772.8772.8967.4970.8173.2373.80
CarAcc91.0293.8993.1593.8993.1493.9493.3693.7992.1878.2293.0896.3196.03
IoU81.5390.2489.7290.0489.1789.8290.0890.4389.3976.8588.5390.1292.46
ClutterAcc49.0550.3051.7653.8050.6656.7256.7454.5162.7037.4955.6856.0158.48
IoU36.4936.2637.2143.5436.3540.0343.5141.6540.5930.8543.3843.3747.02
mAcc78.6182.1382.2883.9781.9383.6384.3284.2784.4276.6883.9084.6185.69
mIoU69.3272.2272.3175.1071.8673.6375.2675.2174.1267.7874.7775.4377.05
Table 3. The comparison on flops and parameters in all methods.
Flops (GMac)Params (M)
FCN8s74.55134.29
UNet55.9326.36
SegNet18.353.56
DeepLabv3+32.4559.33
BiseNet3.233.63
HRCNet30.2862.71
RedNet21.1781.95
ACNet26.41116.6
SA-Gate41.23110.85
TSNet34.2741.8
ESANet10.1545.42
DCSwin34.4118.39
Ours55.39142.82
Table 4. Ablation study on the Vaihingen and Potsdam datasets.
Vaihingen Potsdam
mAccmIoUmAccmIoU
Baseline84.4976.6683.7274.79
W/o DSM89.6781.0784.8975.88
W/o PRB88.5080.7384.5474.82
W/o DSEM87.1478.8480.8169.85
Ours90.4382.3685.6977.05
Publisher’s Note: MDPI stays neutral with regard to jurisdictional claims in published maps and institutional affiliations.

