Abstract
Landslides pose a greater potential risk to the Sichuan-Tibet Transportation Project, and extensive landslide inventory and mapping are essential to prevent and control geological hazards along the Sichuan-Tibet Transportation Corridor (STTC). Recently proposed landslide detection methods mainly focused on new landslides with high vegetation. In addition, there are still challenges in automatic detection of old landslides using optical images. In this paper, two methods, namely mask region-based convolutional neural networks (Mask R-CNN) and transfer learning Mask R-CNN (TL-Mask R-CNN), are presented for detecting and segmenting new and old landslides, respectively. An optical remote sensing dataset for landslide recognition along the Sichuan-Tibet Transportation Corridor (LRSTTC) is constructed as an evaluation benchmark. Our experimental results show that the recall rate and F1-score of the proposed method for new landslide detection can reach 78.47% and 79.80%, respectively. Transfer learning is adopted to detect old landslides, and our experimental results show that evaluation indices can be further improved by about 10%. Furthermore, TL-Mask R-CNN has been applied to identify ice avalanches based on the characteristics of landslides. It appears that our proposed methods can detect and segment landslides effectively along the STTC with the constructed LRSTTC dataset, which is essential for studying and preventing landslide hazards in mountainous areas.
1. Introduction
Landslides are one of the major geological disasters in the world, which are usually caused by rainstorms, earthquakes, and human activities [1,2,3]. They result in significant damage to land and loss of natural resources, destruction of infrastructure, and even loss of human lives [4,5,6]. Landslides are extremely developed in the Qinghai-Tibet Plateau due to complex landforms and geological structures, bringing potential risks to the engineering construction and operation security of the Sichuan-Tibet Transportation Project [7,8]. Therefore, it is vital to investigate and detect landslide disasters in the Sichuan-Tibet Transportation Project.
The development of landslide detection methods has gone through two stages, human-centric approaches and compute-centric methods including pixel-based, object-oriented, and deep learning.
The traditional landslide survey methods are mainly human-centric approaches including field survey and visual interpretation [2]. Field investigation is time-consuming and difficult to be used in a large area. With the advance in satellite imagery, high-resolution (HR) images such as Sentinel-2 [9], WorldView [10], Gaofen-2 [11], and QuickBird [12], have been widely used in landslide interpretation. Visual interpretation is based on the characteristics of landslide hue, texture, and shapes in HR images [13,14]. It avoids dangerous field surveys but relies on expert experience. Overall, human-centric approaches provide reliable results but they are laborious and inefficient.
Pixel-based [15] and object-oriented approaches [16,17,18], combined with many machine learning methods including support vector machine (SVM) [19,20], random forest (RF) [21,22,23], and Markov random field [12,24], are proposed for automatic landslide detection in HR images. The pixel-based methods process images in pixels with machine learning, such as maximum likelihood [25,26] and K-nearest neighbor classification [27]. It is sensitive to noise and cannot use the spatial features of HR remote sensing images effectively. Object-oriented classification makes full use of the spatial, texture, and spectral information of images by taking adjacent pixels as objects to identify interesting elements [28]. However, object-oriented approaches are difficult to determine a reasonable segmentation scale for different regions, which affects the landslide extraction results.
Currently, deep learning has been gradually widely used in landslide detection [29,30], where convolutional neural networks (CNN) [31,32] and U-Net [33,34] are used a lot in landslide detection. Moreover, Long et al. [35] used deep belief networks (DBN) and convolutional deep belief networks (CDN) to monitor high-level landslides in the Jinsha River. Liu et al. [36] applied long short-term memory (LSTM) neural network, RF, and gated recursive unit to predict the slope displacement in the Three Gorges reservoir area. In addition, geological data were further employed in deep learning to extract landslides [37,38], such as terrestrial laser scanning (TLS) [39], digital elevation matrix (DTM) [40], and digital terrain model (DEM) [41,42,43]. Overall, deep learning can extract landslides with robust spatial and spectral features using the hierarchical learning framework [44]. Compared with human-centric, pixel-based, and object-oriented approaches, deep learning methods with more hidden layers and stronger feature extraction ability, have great potential for landslide identification across large regions.
The above automatic methods usually detect new landslides with high vegetation coverage, but rarely for other types such as ice avalanches [45,46,47], and the performance still needs to be improved. Furthermore, it is still a challenge to detect old landslides that are more concealable, compared with new landslides in HR images, which will cause secondary instability when the external environment changes (Figure 1). So it is necessary to detect old landslides rather than just new landslides in optical images. Although airborne light detection and ranging (LiDAR) can remove surface vegetation making old landslides easy to be detected effectively [48,49], it is too expensive to be applied to a large area. In addition, deep learning training process requires large amounts of data. However, to our best knowledge, the only publicly available remote sensing dataset for landslide detection is Bijie Landslide Dataset [50], which is not sufficient for automatic landslide detection in optical images.
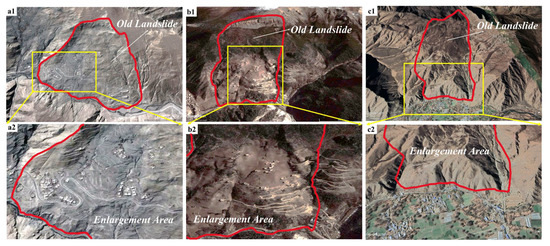
Figure 1.
Old landslides and Artificial buildings. (a1,a2) (29°07′28″ N, 92°03′37″ E), (b1,b2) (29°14′26″ N, 92°12′40″ E), and (c1,c2) (29°08′48″ N, 92°38′17″ E) represent different old landslides, in which (a2,b2,c2) show an enlargement area with artificial buildings.
To fulfill this gap, this study constructed an optical remote sensing dataset for Landslide Recognition along the Sichuan-Tibet Transportation Corridor (LRSTTC). Other than introducing mask region-based convolutional neural networks (Mask R-CNN) to detect new landslides with high vegetation coverage, we proposed a transfer learning Mask R-CNN (TL-Mask R-CNN) to detect old landslides and ice avalanches with distinctive features in optical images based on the characteristics of the new landslides, which only used a small amount of data to fine-tune the network parameters on a new task. The main contributions of this paper are as follows:
- (1)
- An optical remote sensing dataset along the Sichuan-Tibet Transportation Corridor (STTC) was constructed as a benchmark for landslide detection and segmentation, filling a relative need for available landslide identification datasets.
- (2)
- Transfer learning was applied to identify old landslides and ice avalanches based on the trained model for new landslides. Previous studies usually focused on the identification of landslides that have occurred recently, and there are few related studies on the automatic identification of old landslides and ice avalanches on the optical image.
- (3)
- Landslides along the STTC were detected and segmented using Mask R-CNN, and proposed TL-Mask R-CNN, which is a challenging task across different geological structures in such a huge area and has great significance in the operation of the Sichuan-Tibet Railway and people’s lives safety.
The remainder of this paper is organized as follows. The study areas and LRSTTC dataset are described in Section 2.1 and Section 2.2, respectively. Two methods are presented for new and old landslide detection and segmentation along the STTC in Section 2.3. The results and analysis are demonstrated in Section 3. The discussion and the conclusion are given in Section 4 and Section 5, respectively.
2. Materials and Methods
2.1. Study Area
The study area is along the STTC from Chengdu to Lhasa in the southwest of China, which is the most important channel connecting Sichuan Province and Tibet (Figure 2). Covered an area of 779,627.3 km2, the study area crosses three levels of terrain in China: Chengdu Plain, Hengduan Mountains, and Tibetan Plateau, with an altitude ranging from 72 m to 7388 m. Other than steep terrain, the area is affected by well-developed faults, high rainfall variability, and fragile ecosystems [51]. Hence, landslides happen frequently in this area, which affects the normal operation of the traffic lines seriously. Through visual interpretation by Google Earth, Sentinel 2, Landsat 8 imagery, and a long period of field investigation, 924 landslides were obtained and shown in Figure 2. These landslides ranged in size from 1232 m2 to 216,231,680 m2, with an average elevation of 3573 m, and most of them are located around rivers and railway lines.
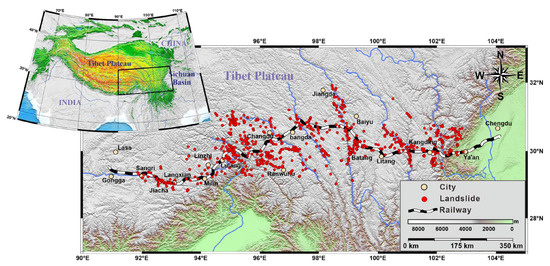
Figure 2.
Landslide Study Area of the Sichuan-Tibet Transportation Project.
2.2. Constructing LRSTTC Dataset
Given the strong demand for automated, efficient, and reliable landslide datasets for landslide recognition, early warning, risk assessment, and post-disaster recovery, we created LRSTTC dataset. It can be roughly divided into two types: new landslides and old landslides, based on the time of occurrence of these landslides and the spectral and texture characteristics of these landslides in the images [52,53,54,55].
- (1)
- New landslides: It is obvious to see the main scarp, body, and toe of these landslides that just occurred recently. There is a clear sliding surface, and the color of the landslide is obviously different from the surrounding features in Figure 3a1–a8.
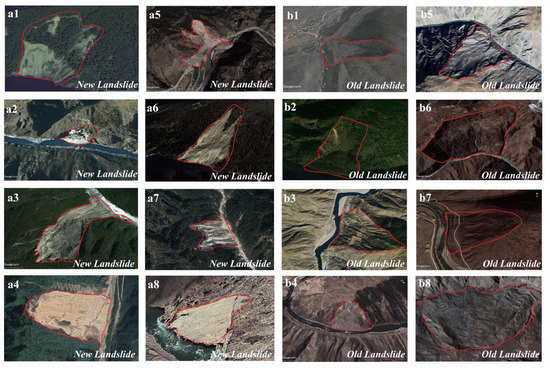 Figure 3. The landslide instances in the LRSTTC dataset. (a1–a8) are new landslides that just occurred recently; (b1–b8) are old landslides that occurred for a long time.
 - (2)
- Old landslides: These landslides occurred earlier. The color of the slide’s body is not significantly different from the surrounding features, and even vegetation has grown on some old landslides in Figure 3b2. However, the general shape of the landslide, the back wall of the landslide in Figure 3b5, and the deposits at the front of the landslide in Figure 3b4 can be still seen in the optical image. Some man-made buildings are located above these accumulations, posing huge hazards.
In this study, Google Earth images were used to generate the LRSTTC dataset with human visual interpretation. (1) New landslides often correspond to areas with obvious spatial and/or temporal changes in the textual and/or spectral features in optical images, and hence they can be easily identified from Google Earth images. (2) Old landslides often exhibit certain geomorphological features (e.g., scarps, flanks, cracks, and ridges) and they can be identified based on these geomorphological features [53]. Note that every single sample in the LRSTTC dataset was double checked by landslide experts and some landslides were even confirmed in the field (Figure 4).
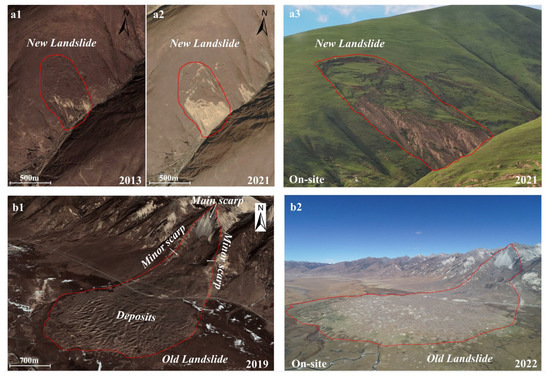
Figure 4.
Satellite optical image interpretation and on-site survey of landslides along the STTC: (a) (30°58′16″ N, 101°09′19″ E) and (b) (30°12′09″ N, 99°56′10″ E) represent a new landslide and an old landslide, respectively, in which (a1,a2,b1) are images obtained from Google Earth, (a3,b2) are images obtained from on-site survey.
According to the landslides drawn by expert visual interpretation and field investigation, the LRSTTC Dataset was made based on Google Earth image, which contains a total of 924 landslides including 740 new landslides and 184 old landslides samples. Every landslide sample contains landslide images, masks, and marked coordinate positions, which are stored in the josn file. At present, there are very few publicly datasets of geological disaster available for deep learning. The LRSTTC dataset provided by this experiment can be used for studying and evaluating corresponding methods for landslide classification, detection, and segmentation. In this paper, we mainly focus on detecting the new landslides and the old landslides with obvious features in the optical images.
2.3. Methods
2.3.1. Mask R-CNN for Landslide Detection and Segmentation along the STTC
Deep learning models are mainly divided into two-stage and one-stage methods for object detection. The performance of the two-stage frameworks, including region-based convolutional neural networks (R-CNN) [56], Fast R-CNN [57], and Faster R-CNN [58], has steadily increased. Based on Faster R-CNN, Mask R-CNN [59], the object mask is added as the third output for each ROI, which allows for instance segmentation. The proposed landslide recognition Mask R-CNN has five parts, feature extraction network, feature pyramid networks (FPN) [60], RPN, ROI alignment, and functional network as shown in Figure 5.

Figure 5.
The architecture of the Mask R-CNN for landslide recognition.
As the backbone of the feature extraction network, the residual neural network (ResNet) [61] is efficient in training deeper networks, due to its shortcut connection (Figure 6). In the shortcut connection, the input information x is directly added to the output, which protects the integrity of the information and avoids the disappearance or explosion of the gradient in deep network training. With bottom-up and top-down structure in FPN, higher-level features are passed down to complement the lower-level semantics so that high-resolution, strongly semantic features can be retrieved, facilitating the detection of small targets.
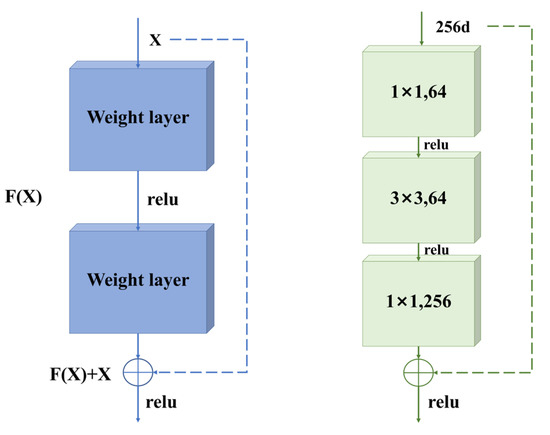
Figure 6.
The shortcut connection (left) and bottleneck of ResNet (right).
The RPN network is divided into two lines (Figure 7), where regional proposals are generated. The anchors are classified into positive and negative by softmax in the top branch of Figure 7, and the bounding box regression offset for the anchors is calculated to obtain the exact proposals in the bottom branch. In the proposal layer, the positive anchors and the corresponding border offsets are synthesized, and proposals that are too small or out of bounds are eliminated.
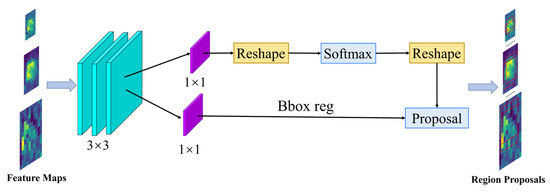
Figure 7.
The architecture of the RPN.
The ROI alignment addresses the misalignment caused by quantification. It uses bilinear interpolation and pooling to transform features into maps of the same size, which avoids errors caused by the rounding of the two coordinates quantization and improves the accuracy of coordinate frame regression (Figure 8).
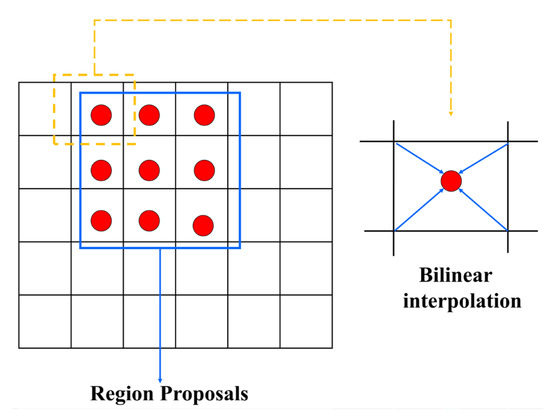
Figure 8.
Bilinear Interpolation.
The functional network consists of two parts. One is the backbone to extract features, and the other is the head network for classification, box regression, and mask prediction for each ROI. First, the ROI is input into the backbone and generated 7 × 7 × 1024 ROI features. Then, ROI features are sampled to 2048 channels, and they are input to the head including two-branch networks. One branch is for classification and regression, and the other one is for generating the corresponding masks. Therefore, the loss function of each ROI consists of classification, coordinate boxes, and masks, as is shown in Equations (1).
where represents the overall loss function value of the Mask R-CNN model. represents the total number of samples. represents the size of the feature layer. and represent the probability of anchor prediction to the target and background, respectively. represents the average binary cross-entropy loss. represents the logarithmic loss of and . represents the loss value of the bounding box regression. is a vector representing the offset predicted by the anchor during the training phase of the RPN, and is the actual offset.
2.3.2. Transfer Learning for Old Landslide Recognition along the STTC
Transfer Learning
Machine learning assumes that training data and test data are derived from a unified feature space, with the same distribution. However, the learning model has to be trained again with new data when the distribution of test data changes. Considering the fact that labeling data is expensive, it is difficult to use machine learning, especially supervised learning, for practical applications. Therefore, how to make full use of the previously annotated data and maintain model accuracy for the new task is a big challenge.
Transfer learning (TL) was first proposed in discriminability-based transfer (DBT) to solve the above problems [62]. It supposes that the target domain and source domain are different distributions, and the knowledge extracted from the target domain is applied to the source domain. In Equations (2)–(3), represents the source domain and represents the source domain.
where indicates that feature space, is the label of . indicates that target space, , represents the number of samples, , represents the current number of samples.
According to the form of knowledge transfer, transfer learning is divided into four categories, containing instance-based, feature-based, parameter-based, and relational-based [63]. Instance-based transfer learning means that part of the data in is reused by reweighting in . Feature-based transfer learning obtains the typical feature through the , encodes knowledge in the form of features, and transfers it from the to the target domain. Parameter-based transfer learning means if and follow a similarly prior distribution, partial parameter and model structure sharing is possible. Relational-based transfer learning assumes that the relationship between and is the same, knowledge is transferred between related domains.
TL- Mask R-CNN
The landslide samples we collected along the STTC are too small, but deep learning model training requires a large amount of data. Although old landslide samples are insufficient in , there is a large amount of new landslide data to be used in . TL emphasizes the transfer of knowledge between different but similar domains, tasks, and distributions. The new and old landslides have many similarities, for example, shapes in HR remote sensing images. But there still are differences between them. Compared with new landslides, the color of old landslides has a similar appearance to surrounding ground objects, and some old landslides even have grown vegetation. Considering the above factors, we combine TL and Mask R-CNN for old landslide detection and proposed the transfer learning-Mask R-CNN (TL- Mask R-CNN).
Firstly, the weights trained from new landslides were selected as the initial weights because they learn more similar features on the new landslides than the weights trained from the COCO dataset. Secondly, all the parameters are frozen except for the functional network, and only the functional network is trained for detection, classification, and segmentation (Figure 9), which reduces the number of training parameters effectively and preserves more common landslide characteristics in the trained model. The common features extracted from the new landslide are used for training effectively when the collected old landslide samples are insufficient in the STTC. Thirdly, shape features extracted from new landslides were added to the model training in the target domain because the new landslide, the old landslide, and the ice collapse have similar shapes. For example, landslides and ice avalanches slides have similar shapes, although they are composed of different materials. Finally, given the lack of sample data in the target domain, we carried out data enhancement, such as flip, rotation, scale, crop, translation, image brightness, and contrast changes.
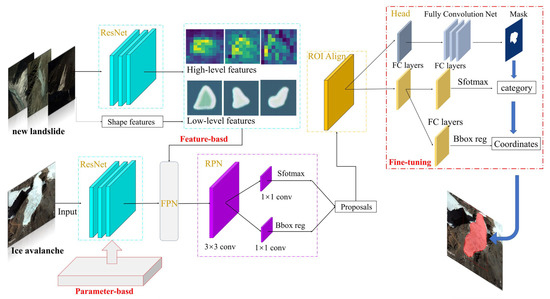
Figure 9.
Architecture of the TL- Mask R-CNN.
2.3.3. Experimental Environment
The hardware configuration in this study was as follows: Intel (R) Core (TM) I7-8700K CPU, running memory 64G, and NVIDIA RTX 2080Ti GPU. The deep learning frameworks were TensorFlow and PyTorch, and other software included PyCharm, VC++, Anaconda, and Python. During the image preprocessing of the experiment, the slice size was set to 512 × 512 and the label name was set as the landslide. The dataset was divided into training, validation, and test datasets according to the ratio of 8:1:1. The LRSTTC Dataset will be submitted at https://github.com/Jiang-CHD-YunNan/LRSTTC (accessed on 31 November 2022. In the experiment, the number of training epochs was 10, the iteration number for each epoch was 1000, and the initial learning rate was 0.001. The weight decay coefficient was 0.005, and the momentum factor was 0.9.
2.3.4. Evaluation Indices
The confusion matrix as the basic index intuitively counts the number of detection results, but it is difficult to accurately evaluate the quality of the model. Secondary evaluation indicators can be used for this purpose: Precision () and Recall () to further evaluate the proposed methods. is the probability of being correct in the target detection, and is the probability of correct detection in all positive samples. The above formulas are written as Equations (4)–(5):
where (True Positive) indicates that the actual sample is a positive sample and the prediction is a positive sample. (False Positive) indicates that the actual sample is negative, but the prediction is a positive sample. (False Negative) indicates that the actual sample is positive, but the prediction is a negative sample.
The recall rate tends to be low when the precision is high, while the precision tends to be low when the recall rate is high. Only in a relatively simple dataset, will the precision and recall rate be both high. To comprehensively measure the quality of the detection model, score can be used to evaluate the model, as is shown in Equations (6).
where represents the recall rate, and represents the accuracy rate.
In this paper, landslide shape segmentation is carried out at the same time as landslide detection. The mean pixel accuracy rate () and the mean intersection over union () are introduced to evaluate the segmentation results reasonably, as is shown in the Equations (7)–(8). is the ratio of the correct number of pixels for each prediction category to the total number of pixels, which reflects the accuracy of the segmentation model. is the average of the intersection and union ratio between each type of prediction result and the real mask.
where is the number of the predicted categories. represents the original category and the predicted category . represents the original category and the predicted category . represents the original category and the predicted category .
3. Results
3.1. New Landslide Detection Results
The Mask R-CNN backbone consists of resnet-50 and resnet-101. The effects of landslide extraction of two backbone networks were tested separately, and test results are shown in Figure 10 and Table 1. From Figure 10, it is seen that the Mask R-CNN can both identify the landslides and segment the shape of each landslide independently. And from Table 1, the overall performance of the model trained on the basis of the resnet-101 backbone is higher than the model trained on the basis of the resnet-50 backbone. In this paper, the resnet-101 was chosen as Mask R-CNN backbone for landslide detection and segmentation. The pixel accuracy of landslide segmentation is 87.71%, the reaches 77.94%, the precision of landslide detection is 81.18%, the recall rate reaches 78.47%, and the of the comprehensive index reached 0.79.
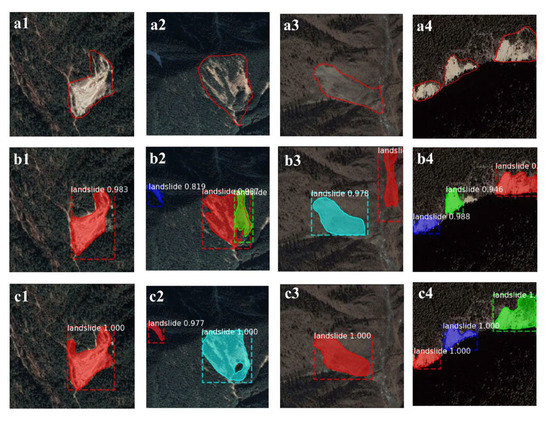
Figure 10.
New landslide detection and segmentation results using Mask R-CNN based on the different backbones. (a1–a4) represent different landslides: (a1) is a single intact landslide with vegetation cover; (a2) is a broken-shaped landslide with vegetation cover; (a3) is close to the surrounding ground features; (a4) is multiple landslides in an image. (b1–b4) are the results using resnet-50 as the detection backbone. (c1–c4) are the results using resnet-101 as the detection backbone.

Table 1.
New landslide detection results using Mask R-CNN with different backbones.
3.2. Old Landslide Detection Results
With geological movement and human activities, the landslide may occur again and cause great damage due to the instability of the surface accumulation body in the old landslide. The traditional detection method of old landslides mainly relies on the experience of experts, expensive LiDAR data, etc. TL-Mask R-CNN was presented to detect the old landslide with some visible features, and the results are shown in Figure 11 and Table 2.
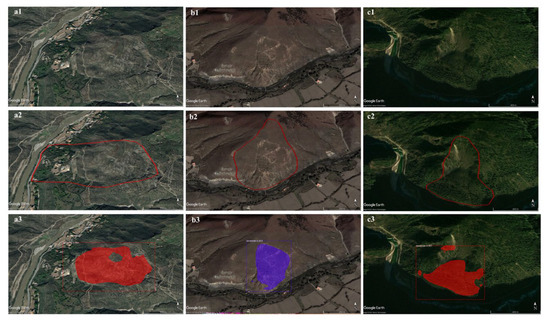
Figure 11.
Old landslides detection results. (a1–a3) represents different landslides, (b1–b3) are the results of expert visual interpretation, and (c1–c3) are the results of our model.
Table 2.
Evaluation of old landslide detection results.
From Figure 11a1–a3, it is difficult to identify old landslides manually without sufficient remote sensing interpretation experience. Many old landslides are hard to be distinguished from the surrounding ground objects because they occurred long time ago and are covered by heavy vegetation. From Figure 11c1–c3, it is clear that TL-Mask R-CNN can detect old landslides with some visible features, but the landslide boundaries are not precise. The reason is that manual drawing of landslide shapes during labeling is a systematic task that requires a comprehensive and integrated analysis of all geological conditions such as pore water, slope structure, location, nature of fractures, excavation, physical exploration, ground investigation, etc. Different data needs to be verified mutually and carefully before a reasonable landslide surface is drawn as labeled ground truth, not only the sliding part. So it is difficult to make an accurate segmentation of the landslide shape as Figure 11b2,c2. We compared the proposed TL-Mask R-CNN with typical semantic segmentation deep learning models including Deeplabv3+ [64], Unet [33], and Unet++ [65]. The experimental parameters were set as follows: epoch was 100, batch size was 4, and learning rate was 0.0001. The Adam (Adaptive Moment Estimation) function was used at the optimizer, and the images were clipped as 512 × 512 to input model training.
As is shown in Table 2, TL-Mask R-CNN performed the best for old landslide detection. All kinds of indicators showed an increase of 10% or more using the transfer learning method compared with the Mask R-CNN method. Actually, the scores of various indicators based on pixel statistics are hard to be improved because the landslide shapes were usually marked larger than the actual shapes of the sliding part. Another reason is that the Sichuan-Tibet Transportation Project crosses the first and second terrains of China, with a total length of more than 1500 km, and there are great differences in the shape, color, and texture of landslides among different geological areas, which increases the difficulty of landslide identification.
4. Discussion
4.1. Validation in the Ya’an-Kangding Section of the STTC
In this paper, landslides acquired in the field surveys along the STTC were used as training samples. However, the scope of artificial field investigation is limited. In order to further automatically detect the unknown landslides along the STTC and verify our proposed method, the verification experiment was carried out in the Ya‘an-Kangding section of the Sichuan-Tibet Transportation Project. The geographical location of this verification area is 29°12′ N to 30°00′ N latitude and 101°24′ E to 103°07′ E longitude, covering an area of 13,487.41 km2.
First, high-resolution images of the verification area were obtained from Google Earth and cropped to 684 images, with 1 m × 1 m spatial resolution. Then, we selected a small number of samples to fine-tune the trained model and carried out landslide detection in the verification area. A total of 588 landslides were automatically detected, in which 470 landslides were correct () and 137 landslides were incorrectly detected as a landslide (). What’s more, we found that 69 landslide models were not detected (). Finally, the precision and recall were calculated to be 79.9% and 87.2%, respectively. The detection results are shown in Figure 12.
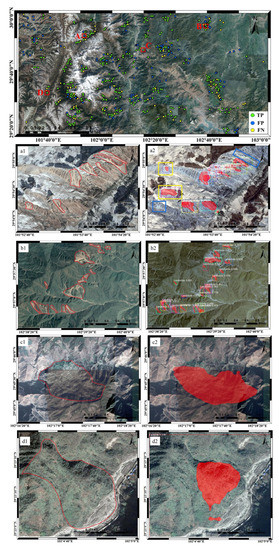
Figure 12.
The verification area landslides detection results. (a1,b1,c1,d1) represent the original image, (a2,b2,c2,d2) are the results of our model.
A and B are new landslides that have just occurred, which have a significant color difference with surrounding ground features. There is less vegetation in area A, where two landslides fail to be detected that framed with blue, and two ground objects were incorrectly detected that framed with yellow in Figure 12a2. In area B with high vegetation cover, all landslides were well detected automatically. Compared with new landslides, some old landslides were covered in vegetation, and they were hard to be recognized. In the verification area, TL- Mask R-CNN was applied to detect old landslides with obvious collapse areas or accumulation bodies in high-resolution images. It is seen from Figure 12c1, that the old landslide has obviously collapsed on the optical image in area C. Similarly, it is observed from Figure 12d1 that the old landslide has an obvious accumulation body. In Figure 12c2,d2, it is seen that our model detected the location of the old landslide, but it is difficult to segment the shape of old landslides accurately. To summarize, our model detects landslides with distinct features on optical images effectively.
4.2. Ice Avalanche Detection
To the best of our knowledge, there are almost no identification results of ice avalanches using deep learning in previous studies. A total of 103 ice avalanches have been found along part of the Sichuan-Tibet Transportation Project through visual interpretation and field investigation. Due to the small number of samples, we adopted TL-Mask R-CNN for training, which used the landslide model previously trained on the Sichuan-Tibet Transportation Project as the basic model and only used 80 samples to learn the head network. Part of the detection and segmentation results of ice avalanches are shown in Figure 13.
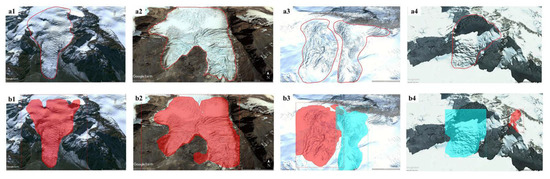
Figure 13.
Ice avalanche detection results. (a1–a3) represents different ice avalanches, and (b1–b4) are the results of our model.
4.3. Features of the TL-Mask R-CNN Method
In this paper, deep learning was used to detect landslides along the SSTC, which has positive implications for the safe construction and operation of the SSTC. Firstly, the LRSTTC dataset generated in this study has been made freely available for the public, which can significantly reduce the time of data collection and labeling for other researchers. There have been limited (if any) available geohazard datasets in this study area for deep learning. Secondly, the TL-Mask R-CNN method presented in this paper can be utilized to detect old landslides and ice avalanches with better performance than previously reported landslide detection methods (e.g., Mask R-CNN, Unet, Unet++, and Deeplabv3+). Given that new and old landslides have similar shapes, and landslides and ice avalanches can be seen as slides along slopes with different materials, it is feasible to use transfer learning to realize the detection of different geological. Thirdly, the TL-Mask R-CNN method is able to segment landslides one by one, which appears to be a big challenge for most of the previously published methods.
4.4. Limitations of the TL-Mask R-CNN Method
It should be pointed out that the TL-Mask R-CNN method has two major limitations at the moment.
- (1)
- Limited sample size: Deep learning always requires large sample sizes, but the sample size of the LRSTTC is still small. It is believed that the TL-Mask R-CNN method could perform even better with an increasing sample size of the LRSTTC dataset.
- (2)
- Model transferability: Geological and weather conditions vary a lot along the STTC, and the key influencing factors of landslides can be different from one place to another [66], which makes the transferability of the TL-Mask R-CNN method a challenge. To address this issue, it would be desirable, once again, to increase the sample size of the LRSTTC dataset.
5. Conclusions
The landslide hazards along the STTC bring great risk to its operational safety. This paper introduced a Mask R-CNN to extract the new landslides along the STTC. Furthermore, a TL-Mask R-CNN was proposed to recognize the small number of old landslide samples in the area along the STTC. In the case of small samples, we detected ice avalanches by using TL-Mask R-CNN considering that ice avalanches and landslides are both slides made of different matter. Due to the lack of an effective remote sensing image dataset for landslide detection, an image dataset LRSTTC in Sichuan and Tibet was constructed as an evaluation benchmark for visual interpretation and on-site investigation. The experimental results show that the pixel accuracies of the new and old landslide segmentation can reach 87.71% and 75.86%, respectively. To further detect the unknown landslide along the STTC, and verify the proposed method, we selected the section from Ya’an to Kangding of the Sichuan-Tibet Transportation Project for experiments and showed the effectiveness of the proposed method. Compared with previous studies, this paper presents a landslide identification dataset in the field of geological hazards where datasets are rare for deep learning, which significantly reduces the time and energy of sample collection and data labeling for related researchers. Furthermore, we have explored the automatic identification of old landslides and ice avalanches, to which there are relatively few approaches. The results of disaster identification will directly help with the construction of the Sichuan-Tibet Railway and reduce casualties.
Currently, our approach achieves the migration between three different types of geohazards including new landslides, old landslides, and ice avalanches. Our future research will study the transfer of knowledge in different regions and landscapes, exploring typical feature transfer under the diversity scenarios. How to find these effective features is a key underpinning to transferring learning. In addition, a reasonable combination of geological knowledge is also important rather than simply adding all kinds of geological data to train the model. We will also combine multi-source remote sensing data and geohydrological data to detect landslides and continuously update the LRSTTC dataset.
Author Contributions
Conceptualization, W.J., J.X. and Z.L. (Zhenhong Li); methodology, W.J. and J.X.; software, W.J.; validation, W.J.; formal analysis, W.J.; investigation, B.C. and C.Z.; data curation, W.J. and M.Z.; writing—original draft preparation, W.J.; writing—review and editing, J.X., Z.L. and W.J.; visualization, Z.L. (Zhenjiang Liu) and S.G.; supervision, Z.L. (Zhenhong Li); project administration, J.X., W.Z. and Z.L. (Zhenhong Li); funding acquisition, J.X. and Z.L. (Zhenhong Li); All authors have read and agreed to the published version of the manuscript.
Funding
This research was supported by the Major Program of the National Natural Science Foundation of China (41941019), the National Key Research and Development Program of China (2018YFC1504805), the National Natural Science Foundation of China (61806022, 41874005), the Fundamental Research Funds for the Central Universities (300102262202, 300102260301/087, 300102260404/087, 300102262902, 300102269103, 300102269304, and 300102269205), the State Key Laboratory of Geographic Information (SKLGIE2018-M-3-4).
Data Availability Statement
The LRSTTC Dataset will be submitted at https://github.com/Jiang-CHD-YunNan/LRSTTC.
Acknowledgments
We are very grateful to Google Earth for the image data and platform support provided by ArcGIS, GMT, and PlotNeuralNet. We also would like to express our gratitude to Tong Zhang, Zhijie Zhang, Jingwei Ma, Xinyu Dou, and Ligong Yang for labeling samples.
Conflicts of Interest
The authors declare no conflict of interest.
References
- Iverson, R.M. Landslide triggering by rain infiltration. Water Resour. Res. 2000, 36, 1897–1910. [Google Scholar] [CrossRef]
- Sato, H.P.; Hasegawa, H.; Fujiwara, S.; Tobita, M.; Koarai, M.; Une, H.; Iwahashi, J. Interpretation of landslide distribution triggered by the 2005 Northern Pakistan earthquake using SPOT 5 imagery. Landslides 2007, 4, 113–122. [Google Scholar] [CrossRef]
- Zhou, S.Y.; Gao, L.; Zhang, L.M. Predicting debris-flow clusters under extreme rainstorms: A case study on Hong Kong Island. Bull. Eng. Geol. Environ. 2019, 78, 5775–5794. [Google Scholar] [CrossRef]
- Wang, X.; Fan, X.; Xu, Q.; Du, P. Change detection-based co-seismic landslide mapping through extended morphological profiles and ensemble strategy. ISPRS J. Photogramm. Remote Sens. 2022, 187, 225–239. [Google Scholar] [CrossRef]
- Shao, X.; Xu, C.; Wang, P.; Li, L.; He, X.; Chen, Z.; Huang, Y.; Xu, X. Two public inventories of landslides induced by the 10 June 2022 Maerkang Earthquake swarm, China and ancient landslides in the affected area. Nat. Hazards Res. 2022. [Google Scholar] [CrossRef]
- Zhao, B.; Wang, Y.; Li, W.; Lu, H.; Li, Z. Evaluation of factors controlling the spatial and size distributions of landslides, 2021 Nippes earthquake, Haiti. Geomorphology 2022, 415, 108419. [Google Scholar] [CrossRef]
- Wu, R.; Zhang, Y.; Guo, C.; Yang, Z.; Tang, J.; Su, F. Landslide susceptibility assessment in mountainous area: A case study of Sichuan–Tibet railway, China. Environ. Earth Sci. 2020, 79, 157. [Google Scholar] [CrossRef]
- Hu, G.; Zhao, C.; Chen, N.; Chen, K.; Wang, T. Characteristics, mechanisms and prevention modes of debris flows in an arid seismically active region along the Sichuan–Tibet railway route, China: A case study of the Basu–Ranwu section, southeastern Tibet. Environ. Earth Sci. 2019, 78, 564. [Google Scholar] [CrossRef]
- Ghorbanzadeh, O.; Crivellari, A.; Ghamisi, P.; Shahabi, H.; Blaschke, T. A comprehensive transferability evaluation of U-Net and ResU-Net for landslide detection from Sentinel-2 data (case study areas from Taiwan, China, and Japan). Sci. Rep. 2021, 11, 14629. [Google Scholar] [CrossRef]
- Ma, H.R.; Cheng, X.; Chen, L.; Zhang, H.; Xiong, H. Automatic identification of shallow landslides based on worldview2 remote sensing images. J. Appl. Remote Sens. 2016, 10, 016008. [Google Scholar] [CrossRef]
- Tang, Y.; Wang, L.; Ma, G.; Jia, H.; Jin, X. Emergency monitoring of high-level landslide disasters in Jinsha River using domestic remote sensing satellites. Yaogan Xuebao J. Remote Sens. 2019, 23, 252–261. [Google Scholar]
- Lu, P.; Qin, Y.; Li, Z.; Mondini, A.C.; Casagli, N. Landslide mapping from multi-sensor data through improved change detection-based Markov random field. Remote Sens. Environ. 2019, 231, 111235. [Google Scholar] [CrossRef]
- Xu, C. Preparation of earthquake-triggered landslide inventory maps using remote sensing and GIS technologies: Principles and case studies. Geosci. Front. 2015, 6, 825–836. [Google Scholar] [CrossRef]
- Petschko, H.; Bell, R.; Glade, T. Effectiveness of visually analyzing LiDAR DTM derivatives for earth and debris slide inventory mapping for statistical susceptibility modeling. Landslides 2016, 13, 857–872. [Google Scholar] [CrossRef]
- Đurić, U.; Marjanović, M.; Radić, Z.; Abolmasov, B. Machine learning based landslide assessment of the Belgrade metropolitan area: Pixel resolution effects and a cross-scaling concept. Eng. Geol. 2019, 256, 23–38. [Google Scholar] [CrossRef]
- Lu, H.; Ma, L.; Fu, X.; Chao, L.; Wang, Z.; Tang, M.; Li, N. Landslides Information Extraction Using Object-Oriented Image Analysis Paradigm Based on Deep Learning and Transfer Learning. Remote Sens. 2020, 12, 752. [Google Scholar] [CrossRef]
- Bacha, A.S.; Van Der Werff, H.; Shafique, M.; Khan, H. Transferability of object-based image analysis approaches for landslide detection in the Himalaya Mountains of northern Pakistan. Int. J. Remote Sens. 2020, 41, 3390–3410. [Google Scholar] [CrossRef]
- Ju, Y.; Xu, Q.; Jin, S.; Li, W.; Su, Y.; Dong, X.; Guo, Q. Loess Landslide Detection Using Object Detection Algorithms in Northwest China. Remote Sens. 2022, 14, 1182. [Google Scholar] [CrossRef]
- Cao, Y.; Yin, K.; Zhou, C.; Ahmed, B. Establishment of Landslide Groundwater Level Prediction Model Based on GA-SVM and Influencing Factor Analysis. Sensors 2020, 20, 845. [Google Scholar] [CrossRef]
- Zhu, C.; Hu, G. Time Series Prediction of Landslide Displacement Using SVM Model: Application to Baishuihe Landslide in Three Gorges Reservoir Area, China. Appl. Mech. Mater. 2012, 239–240, 1413–1420. [Google Scholar] [CrossRef]
- Krkač, M.; Špoljarić, D.; Bernat, S.; Arbanas, S.M. Method for prediction of landslide movements based on random forests. Landslides 2017, 14, 947–960. [Google Scholar] [CrossRef]
- Stumpf, A.; Kerle, N. Object-oriented mapping of landslides using Random Forests. Remote Sens. Environ. 2011, 115, 2564–2577. [Google Scholar] [CrossRef]
- Zhang, K.; Wu, X.; Niu, R.; Yang, K.; Zhao, L. The assessment of landslide susceptibility mapping using random forest and decision tree methods in the Three Gorges Reservoir area, China. Environ. Earth Sci. 2017, 76, 405. [Google Scholar] [CrossRef]
- Li, Z.; Shi, W.; Lu, P.; Yan, L.; Wang, Q.; Miao, Z. Landslide mapping from aerial photographs using change detection-based Markov random field. Remote Sens. Environ. 2016, 187, 76–90. [Google Scholar] [CrossRef]
- Dempster, A.P.; Laird, N.M.; Rubin, D.B. Maximum likelihood from incomplete data via the EM algorithm. J. R. Stat. Soc. 1977, 39, 1–22. [Google Scholar]
- Xu, C. Automatic extraction of earthquake-triggered landslides based on maximum likelihood method and its validation. Chin. J. Geol. Hazard. Control 2013, 24, 19–25. [Google Scholar]
- Pradhan, B.; Jebur, M.N. Spatial prediction of landslide-prone areas through k-nearest neighbor algorithm and logistic regression model using high resolution airborne laser scanning data. In Laser Scanning Applications in Landslide Assessment; Pradhan, B., Ed.; Springer: Cham, Switzerland, 2017; pp. 151–165. ISBN 978-3-319-55341-2. [Google Scholar]
- Valiante, M.; Guida, D.; Seta, M.; Bozzano, F. A spatiotemporal object-oriented data model for landslides (LOOM). Landslides 2021, 18, 1231–1244. [Google Scholar] [CrossRef]
- Zhao, Z.; Zheng, P.; Xu, S.; Wu, X. Object Detection With Deep Learning: A Review. IEEE Trans. Neural Netw. Learn. Syst. 2019, 30, 3212–3232. [Google Scholar] [CrossRef]
- Zhang, L.P.; Zhang, L.F.; Du, B. Deep Learning for Remote Sensing Data: A Technical Tutorial on the State of the Art. IEEE Geosci. Remote Sens. Mag. 2016, 4, 22–40. [Google Scholar] [CrossRef]
- Mabu, S.; Nakayama, Y.; Kuremoto, T. Landslide Classification from Synthetic Aperture Radar Images Using Convolutional Neural Network with Multichannel Information. J. Signal Process. 2020, 24, 61–73. [Google Scholar] [CrossRef]
- Fukushima, K.; Miyake, S.; Ito, T. Neocognitron: A neural network model for a mechanism of visual pattern recognition. IEEE Trans. Syst. Man Cybern. 1983, 13, 826–834. [Google Scholar] [CrossRef]
- Ronneberger, O.; Fischer, P.; Brox, T. U-Net: Convolutional Networks for Biomedical Image Segmentation. In Medical Image Computing and Computer-Assisted Intervention–MICCAI 2015; Lecture Notes in Computer Science; Navab, N., Hornegger, J., Wells, W.M., Frangi, A., Eds.; Springer: Cham, Switzerland, 2015; Volume 9351, pp. 234–241. ISBN 978-3-319-24574-4. [Google Scholar]
- Liu, P.; Wei, Y.; Wang, Q.; Chen, Y.; Xie, J. Research on Post-Earthquake Landslide Extraction Algorithm Based on Improved U-Net Model. Remote Sens. 2020, 12, 894. [Google Scholar] [CrossRef]
- Long, L.; He, F.; Liu, H. The use of remote sensing satellite using deep learning in emergency monitoring of high-level landslides disaster in Jinsha River. J. Supercomput. 2021, 77, 8728–8744. [Google Scholar] [CrossRef]
- Liu, Z.; Guo, D.; Lacasse, S.; Li, J.; Yang, B.; Choi, J. Algorithms for intelligent prediction of landslide displacements. J. Zhejiang Univ. Sci. A 2020, 21, 412–429. [Google Scholar] [CrossRef]
- Pradhan, B.; Al-Zuhairi, M.; Nampak, H. Integration of LiDAR and QuickBird Data for Automatic Landslide Detection Using Object-Based Analysis and Random Forests. In Laser Scanning Applications in Landslide Assessment; Pradhan, B., Ed.; Springer: Cham, Switzerland, 2017; pp. 69–81. ISBN 978-3-319-55341-2. [Google Scholar]
- Yu, B.; Chen, F.; Xu, C. Landslide detection based on contour-based deep learning framework in case of national scale of Nepal in 2015. Comput. Geosci. 2019, 135, 104388. [Google Scholar] [CrossRef]
- Prokop, A.; Panholzer, H. Assessing the capability of terrestrial laser scanning for monitoring slow moving landslides. Nat. Hazards Earth Syst. Sci. 2009, 9, 1921–1928. [Google Scholar] [CrossRef]
- Chen, W.; Li, X.; Wang, Y.; Chen, G.; Liu, S. Forested landslide detection using LiDAR data and the random forest algorithm: A case study of the Three Gorges, China. Remote Sens. Environ. 2014, 152, 291–301. [Google Scholar] [CrossRef]
- Claessens, L.; Heuvelink, G.B.M.; Schoorl, J.M.; Veldkamp, A. DEM resolution effects on shallow landslide hazard and soil redistribution modelling. Earth Surf. Process. Landf. 2005, 30, 461–477. [Google Scholar] [CrossRef]
- Kawabata, D.; Bandibas, J. Landslide susceptibility mapping using geological data, a DEM from ASTER images and an Artificial Neural Network (ANN). Geomorphology 2009, 113, 97–109. [Google Scholar] [CrossRef]
- Barlow, J.; Martin, Y.E.; Franklin, S.E. Detecting translational landslide scars using segmentation of Landsat ETM+ and DEM data in the northern Cascade Mountains, British Columbia. Can. J. Remote Sens. 2003, 29, 510–517. [Google Scholar] [CrossRef]
- Zhang, P.; Xu, C.; Ma, S.; Shao, X.; Tian, Y.; Wen, B. Automatic Extraction of Seismic Landslides in Large Areas with Complex Environments Based on Deep Learning: An Example of the 2018 Iburi Earthquake, Japan. Remote Sens. 2020, 12, 3992. [Google Scholar] [CrossRef]
- Ma, Z.; Mei, G.; Piccialli, F. Machine learning for landslides prevention: A survey. Neural Comput. Appl. 2020, 33, 10881–10907. [Google Scholar] [CrossRef]
- Qin, S.; Guo, X.; Sun, J.; Qiao, S.; Zhang, L.; Yao, J.; Cheng, Q.; Zhang, Y. Landslide Detection from Open Satellite Imagery Using Distant Domain Transfer Learning. Remote Sens. 2021, 13, 3383. [Google Scholar] [CrossRef]
- Yu, B.; Chen, F.; Xu, C.; Wang, L.; Wang, N. Matrix SegNet: A Practical Deep Learning Framework for Landslide Mapping from Images of Different Areas with Different Spatial Resolutions. Remote Sens. 2021, 13, 3158. [Google Scholar] [CrossRef]
- Wiedenmann, J.; Rohn, J.; Moser, M. Using LIDAR and ground truth for landslide recognition and characterization of geotechnical and morphological parameters in sedimentary rocks, a case study in Northern Bavaria (Germany). J. Mt. Sci. 2017, 14, 1513–1525. [Google Scholar] [CrossRef]
- Gorsevski, P.V.; Brown, M.K.; Panter, K.; Onasch, C.M.; Simic, A.; Jeffrey, S. Landslide detection and susceptibility mapping using LiDAR and an artificial neural network approach: A case study in the Cuyahoga Valley National Park, Ohio. Landslides 2016, 13, 467–484. [Google Scholar] [CrossRef]
- Ji, S.; Yu, D.; Shen, C.; Li, W.; Xu, Q. Landslide detection from an open satellite imagery and digital elevation model dataset using attention boosted convolutional neural networks. Landslides 2020, 17, 1337–1352. [Google Scholar] [CrossRef]
- Chen, Z.; He, C.; Yang, W.; Guo, W.; Li, Z.; Xu, G. Impacts of geological conditions on instability causes and mechanical behavior of large-scale tunnels: A case study from the Sichuan–Tibet highway, China. Bull. Eng. Geol. Environ. 2020, 79, 3667–3688. [Google Scholar] [CrossRef]
- Yang, Z.; Han, L.; Zheng, X.; Li, W.; Feng, L.; Wang, Y.; Yang, Y. Landslide identification using remote sensing images and DEM based on convolutional neural network: A case study of loess landslide. Remote Sens. Nat. Resour. 2022, 34, 224–230. [Google Scholar]
- Chen, B.; Li, Z.; Zhang, C.; Ding, M.; Zhu, W.; Zhang, S.; Han, B.; Du, J.; Cao, Y.; Zhang, C.; et al. Wide Area Detection and Distribution Characteristics of Landslides along Sichuan Expressways. Remote Sens. 2022, 14, 3431. [Google Scholar] [CrossRef]
- Li, Z.; Zhang, C.; Chen, B.; Zhan, J.; Ding, M.; Lv, Y.; Li, X.; Peng, J. A Technical Framework of Landslide Prevention Based on Multi-Source Remote Sensing and Its Engineering Application. Earth Sci. 2022, 47, 1901–1916. [Google Scholar]
- Xu, Q.; Dong, X.; Li, W. Integrated Space-Air-Ground Early Detection, Monitoring and Warning System for Potential Catastrophic Geohazards. Geomat. Inf. Sci. Wuhan Univ. 2019, 44, 957–966. [Google Scholar]
- Girshick, R.; Donahue, J.; Darrell, T.; Malik, J. Rich Feature Hierarchies for Accurate Object Detection and Semantic Segmentation. In Proceedings of the IEEE Conference on Computer Vision and Pattern Recognition, Columbus, OH, USA, 23–18 June 2014; pp. 580–587. [Google Scholar]
- Girshick, R. Fast R-CNN. In Proceedings of the IEEE International Conference on Computer Vision (ICCV), Santiago, Chile, 7–13 December 2015; pp. 1440–1448. [Google Scholar]
- Ren, S.; He, K.; Girshick, R.; Sun, J. Faster R-CNN: Towards Real-Time Object Detection with Region Proposal Networks. IEEE Trans. Pattern Anal. Mach. Intell. 2017, 39, 1137–1149. [Google Scholar] [CrossRef] [PubMed]
- He, K.; Gkioxari, G.; Dollár, P.; Girshick, R. Mask R-CNN. IEEE Trans. Pattern Anal. Mach. Intell. 2020, 42, 386–397. [Google Scholar] [CrossRef] [PubMed]
- Lin, T.Y.; Dollár, P.; Girshick, R.; He, K.; Hariharan, B.; Belongie, S. Feature Pyramid Networks for Object Detection. In Proceedings of the IEEE International Conference on Computer Vision and Pattern Recognition, Honolulu, HI, USA, 26–29 July 2017; pp. 2117–2125. [Google Scholar]
- He, K.; Zhang, X.; Ren, S.; Sun, J. Deep Residual Learning for Image Recognition. In Proceedings of the IEEE Conference on Computer Vision and Pattern Recognition, Las Vegas, NV, USA, 27–29 July 2016; pp. 770–778. [Google Scholar]
- Pratt, L.Y. Discriminability-based transfer between neural networks. In Proceedings of the 5th International Conference on Neural Information Processing Systems, San Francisco, CA, USA, 30 November–3 December 1922; Morgan Kaufmann Publishers Inc.: Denver, CO, USA, 1992; pp. 204–211. [Google Scholar]
- Tan, C.; Sun, F.; Kong, T.; Zhang, W.; Yang, C.; Liu, C. A Survey on Deep Transfer Learning. In Artificial Neural Networks and Machine Learning–ICANN 2018; Lecture Notes in Computer Science; Kůrková, V., Manolopoulos, Y., Hammer, B., Iliadis, L., Maglogiannis, I., Eds.; Springer: Cham, Switzerland, 2018; Volume 11141, pp. 270–279. ISBN 978-3-030-01424-7. [Google Scholar]
- Chen, L.; Zhu, Y.; Papandreou, G.; Schroff, F.; Adam, H. Encoder-Decoder with Atrous Separable Convolution for Semantic Image Segmentation. In Proceedings of the Computer Vision–ECCV, Munich, Germany, 8–14 September 2018; p. 11211. [Google Scholar]
- Zhou, Z.; Rahman Siddiquee, M.M.; Tajbakhsh, N.; Liang, J. UNet++: A Nested U-Net Architecture for Medical Image Segmentation. In Proceedings of the 4th Deep Learning in Medical Image Analysis (DLMIA) Workshop, Granada, Spain, 20 September 2018; p. 11045. [Google Scholar]
- Cui, P.; Ge, Y.; Li, S.; Li, Z.; Xu, X.; Zhou, G.G.D.; Chen, H.; Wang, H.; Lei, Y.; Zhou, L.; et al. Scientific challenges in disaster risk reduction for the Sichuan–Tibet Railway. Eng. Geol. 2022, 309, 106837. [Google Scholar] [CrossRef]


Publisher’s Note: MDPI stays neutral with regard to jurisdictional claims in published maps and institutional affiliations. |
© 2022 by the authors. Licensee MDPI, Basel, Switzerland. This article is an open access article distributed under the terms and conditions of the Creative Commons Attribution (CC BY) license (https://creativecommons.org/licenses/by/4.0/).