Article

Numerical Modeling and Parameter Sensitivity Analysis for Understanding Scale-Dependent Topographic Effects Governing Anisotropic Reflectance Correction of Satellite Imagery

by
Michael P. Bishop
1,*,
Brennan W. Young
2 and
Jeffrey D. Colby
3
1
Department of Geography, Texas A&M University, College Station, TX 77843, USA
2
Department of Geology and Geophysics, Texas A&M University, College Station, TX 77843, USA
3
Department of Geography and Planning, Appalachian State University, Boone, NC 28608, USA
*
Author to whom correspondence should be addressed.
Remote Sens. 2022, 14(21), 5339; https://doi.org/10.3390/rs14215339
Submission received: 19 September 2022 / Revised: 18 October 2022 / Accepted: 21 October 2022 / Published: 25 October 2022
(This article belongs to the Section Environmental Remote Sensing)

Abstract

:
Anisotropic reflectance correction (ARC) of satellite imagery is required to remove multi-scale topographic effects in imagery. Commonly utilized ARC approaches have not effectively accounted for atmosphere-topographic coupling. Furthermore, it is not clear which topographic effects need to be formally accounted for. Consequently, we simulate the direct and diffuse-skylight irradiance components and formally account for multi-scale topographic effects. A sensitivity analysis was used to determine if characterization schemes can account for a collective treatment of effects, using our parameterization scheme as a basis for comparison. We found that commonly used assumptions could not account for topographic modulation in our simulations. We also found that the use of isotropic diffuse irradiance and a topographic shielding parameter also failed to characterize topographic modulation. Our results reveal that topographic effects govern irradiance variations in a synergistic way, and that issues of ARC need to be formally addressed given atmosphere-topography coupling. Collectively, our results suggest that empirical ARC methods cannot be used to effectively address topographic effects, given inadequate parameterization schemes. Characterizing and removing spectral variation from multispectral imagery will most likely require numerical modeling efforts. More research is warranted to develop/evaluate parameterization schemes that better characterize the anisotropic nature of atmosphere-topography coupling.

1. Introduction

Systematic trends and variability in atmospheric conditions are causing significant changes to the Earth’s climate, cryospheric, ecological, hydrological and geomorphological systems [1,2,3,4]. Mountain environments are very susceptible to rapid environmental change caused by the coupling of these changing systems, which also governs geohazard potential [5]. Unfortunately, due to practical and scientific issues, we do not fully understand the dynamic nature of climate forcing and coupled systems that governs mountain geodynamics and regulates environmental change [6,7]. We do know, however, that progress will require numerical modeling of key surface parameters and coupled systems, and quantitative and thematic information derived from remote-sensing observations.
Numerous surface processes are regulated by the surface irradiance, including evapotranspiration, surface temperature, and ablation. Given the paucity of suitable geospatial irradiance data at the local scale, numerical modeling efforts must be used to account for the scale dependent topgographic effects that govern radiation-transfer processes that dictate the magnitude and variability of surface irradiance. Furthermore, there are numerous parameterization schemes that can be used to simulate radiation-transfer parameters (RTP) and the irradiance components, although various parameterization schemes do not consistently make use of the same parameters and/or make specific assumptions (e.g., isotropic versus anisotropic; parameter insignificance, lack of formalization). It is important to note that many RTP are governed by multi-scale topographic effects that represent first-, second-, or high-order controls on the magnitude and variability of surface irradiance. Unfortunately, there is a paucity of research that evaluates variations in the magnitude of influence of various RTP on the magnitude and variance of irradiance components. Ultimately, it is essential that parameterization schemes can inherently account for the unique scale-dependencies and couplings associated with specific radiation-transfer processes and the radiation-transfer cascade (RTC).
In remote sensing, it is widely known that extracting accurate information from satellite imagery acquired over mountain terrain is notoriously difficult because of multi-scale topographic effects [8,9,10]. Anisotropic reflectance correction (ARC) is required, and the use of semi-empirical ARC methods have been routinely applied [9]. Bishop et al. [11] demonstrate and discuss the significant limiting issues associated with these empirical approaches, as parameterization schemes do not account for important RTP or the scale dependencies associated with various processes of the RTC. Other investigators have also recognized this and have developed and evaluated new parameterization schemes in at attempt to better account for cast shadows, diffuse-skylight irradiance, the Bidirectional Reflectance Distribution Function (BRDF), and the adjacent-terrain irradiance (e.g., [12,13]). Unfortunately, we do not adequately understand and know with certainty which RTP must be accounted for in ARC parameterization schemes to effectively remove multi-scale topographic effects and atmosphere-topography coupling from multispectral imagery, given geographical variations in the topographic complexity that governs a particular mountain environment.
The objective of this research is therefore to more formally characterize multi-scale topographic effects and evaluate various RTP that regulate the magnitude and spatial variation in surface irradiance. Our sensitivity analysis of control parameters should provide insights into which topographic effects may be important to account for in ARC parameterization schemes. We conduct our research over the Nanga Parbat Massif of northern Pakistan, that exhibits extreme topographic complexity in terms of local and mesoscale topographic properties and land cover conditions. More specifically, our research objectives are to:
  • Simulate the direct irradiance and conduct a sensitivity analysis based upon the inclusion/exclusion of numerous RTP that are assumed to be significant/insignificant. We evaluate solar geometry, atmospheric attenuation, local topography, and cast shadows, where parameterization schemes are compared based upon different assumptions and parameter dependencies.
  • Simulate the diffuse-skylight irradiance and conduct a sensitivity analysis based upon the inclusion/exclusion of numerous RTP that are assumed to be significant/insignificant. We evaluate the isotropic versus anisotropic assumption, the influence of secondary ground reflectance, local topography, and meso-scale relief, where parameterization schemes are compared based upon assumptions and parameter dependencies.
This research addresses a fundamental issue in ARC where the synergistic influence of topographic effects associated with the RTC have not been effectively characterized and evaluated. Consequently, our results should provide new insights into the nature of scale dependencies, atmosphere-topographic coupling and RTP that should be considered in ARC parameterization schemes.
It is important to realize that the inherent complexity associated with addressing such a large number of RTP, and the need to develop and evaluate new parameterization schemes, dictates that we limit the scope of this investigation. The nature of this research is multi-faceted and we do not address issues associated with the temporal dimension, the BRDF, simulating the entire RTC, or sensor-system modulation of topographic effects. Nor is it the objective of this research to evaluate ARC methods or to develop new ARC methods. Rather, this research attempts to serve as a foundational basis for better understanding topographic effects of the dominant irradiance components and their potential for characterization in ARC methods.

2. Background

The surface irradiance (E) is strongly controlled by multi-scale topographic effects [14] and they partially regulate the the magnitude and spatial distribution of numerous surface processes. These processes govern landscape erosion and deposition dynamics, thereby altering topographic properties which then modulate the magnitude of surface irradiance, in complex radiation-topography-process feedbacks and system couplings that govern mountain geodynamics [15,16]. Therefore, radiation, precipitation, topographic and tectonic forcings can facilitate rapid environmental change in mountain environments. Consequently, the magnitude and partitioning of irradiance components and associated scale dependencies needs to be better investigated given the inherent limitations associated with using regional and/or global climate models [7].
The partitioning of these components with respect to their contribution to E are generally thought to systematically decrease in significance, although the spatio-temporal scale dependencies related to RT processes and various atmosphere-topography couplings have not been adequately accounted for. It is well known that:
E ( λ ) = E b ( λ ) + E d ( λ ) + E t ( λ ) ,
where E b is the direct irradiance from the solar beam, E d is the diffuse-skylight irradiance due to atmospheric scattering, E t is the adjacent-terrain irradiance, and λ is wavelength. Many Earth-science studies do not adequately account for these components at local scales many RT parameters are not formalized at the appropriate scale and do not account for important topographic effects [7]. Similarly, remote-sensing investigations involving empirical ARC methods involving the use of a scaling factor for topographic correction do not usually account for numerous topographic effects that govern Eb, Ed and Et, as the focus is on accounting for local topographic variations associated with Eb (e.g., [9,17,18,19,20]). Consequently, research involving the development and evaluation of new RTP schemes for these methods is sorely needed.

2.1. Direct Irradiance

The direct irradiance is the dominant irradiance component that is governed by orbital dynamics, atmospheric-topography interactions, and local and meso-scale topographic effects. It is computed as:
E b ( λ ) = E 0 ( λ ) T ( λ ) ( cos i ) S ,
where E 0 is the exoatmospheric irradiance, T is the total downward atmospheric transmittance that accounts for atmospheric attenuation, cos i is the cosine of the incidence angle (i) that accounts for solar and terrain geometry relationships that governs terrain self shadowing, and S is the shadow coefficient (0.0–1.0) that should account for cast shadow regions caused by the meso-scale relief structure of the terrain. It should be noted that direct shadowing is accounted for by the factor S.
Remote-sensing investigations involving empirical ARC approaches, that are based upon the use of a scaling factor, do not usually account for the orbital dynamics that govern temporal changes in the Earth-Sun distance and variations in the solar zenith angle spatially (i.e., small-angle approximation; [11]). Similarly, many atmospheric processes may not be considered such as optical-depth variations, atmospheric refraction, and absorption and scattering of radiation for various atmospheric constituents, that represent an atmosphere-topography coupling effect. Such topographic effects must be accounted for, although we do not know with certainty the significance of various effects given environmental variations [11].
Most ARC methods utilize the cos i parameter, as variations in local topographic conditions can vary significantly, and this parameter is strongly correlated with surface reflectance variations in imagery. Nevertheless, the solar zenith angle at the center of a scene is most typically utilized to compute this parameter, although the solar geometry changes for every pixel across the scene, and it is not known with any certainty how the variance structure might be different given a relatively large scene, although we intuitively know that irradiance variation should increase as the size of the geographic area increases.
Ray tracing can be used to characterize cast shadows and investigators typically assume a point-source of light from the sun. Most ARC parameterization schemes do not account for cast shadows, although researchers are beginning to demonstrate its significance for accounting for irradiance and spectral variation in imagery (e.g., [10,21]). Unfortunately, the point-source assumption is inadequate to account for irradiance variations in the penumbra region, and numerical models and ARC methods need to account for such variations generated by the solar disk, as the umbra does not receive any E b ( S = 0.0 ), while the penumbra region receives irradiance ( S > 0.0 ; S = 0.0–1.0; [16,21]).To our knowledge, investigators have not evaluated the difference between these two formalizations for cast shadows, and whether the RTP should be used to account for meso-scale topographic effects. Collectively, these RTP are modulated by location, time and topography, and their significance for accurately estimating E b needs to be evaluated.

2.2. Diffuse-Skylight Irradiance

Atmospheric scattering will produce hemispherical anisotropic irradiance [22,23,24]. A two-stream approximation model that is widely utilized for computing the skylight irradiance for a horizontal surface ( E d h ) assumes that:
E d h ( λ ) = E d r ( λ ) + E d a ( λ ) + E d g ( λ ) ,
where E d r is the Rayleigh scattering component, E d a is the aerosol scattering component, and E d g is the ground/sky backscattering component caused by multiple interactions between the ground surface and the atmosphere [23,25,26]. One can account for single scattering or a multiple-scattering Rayleigh atmosphere. The single-scattering albedo is required to account for aerosol scattering which is a function of both wavelength and humidity. Aerosol type and models such as rural, urban, maritime or tropospheric can also be accounted for using parameterization schemes or recent radiation-transfer models including MODTRAN and DISORT [25]. Finally, the ground backscatter component can be modeled by accounting for the zonal ground reflectance from the direct irradiance, the reflectance from the diffuse irradiance, and the overall sky reflectance [25].
Equation (3) does not account for anisotropic skylight irradiance or local and terrain-shielding topographic effects. To represent these factors, E d must be computed for every pixel to account for scale-dependencies at each location on the landscape. We provide a computation solution such that:
E d ( λ ) = ϕ i = 0 2 π θ i = 0 π / 2 L θ i , ϕ i cos I S t ( θ i , ϕ i ) d θ d ϕ ,
where L is the downward radiance from incident directions θ i and ϕ i , θ i and ϕ i are the zenith and azimuth angles of the incident energy from the hemisphere, I is the incidence angle of the direction defined by hemisphere and terrain geometry (similar to the computation of cos i ), and S t is a binary terrain-shielding coefficient which is 0.0 given terrain shielding, or 1.0 at relative high hemispherical zenith angles.
The E d component is generally not accounted for in ARC investigations, and proxy parameters may be utilized to ineffectively represent it (e.g., [18,20]). It has been accounted for by some investigators (e.g., [27,28,29]), although they utilize a parameterization scheme that makes use of Equation (3) and the skyview coefficient, which attempts to represent hemispherical topographic shielding. Local topographic effects and the anisotropic nature of the hemispherical irradiance distribution are not usually accounted for.
The anisotropic nature of E d has been the largest source of error associated with estimating this component, as it is governed by circumsolar brightening due to forward scattering of aerosols, and horizontal brightening due to multiple Rayleigh scattering [22,24,25]. An exact computation is computationally expensive given that E d is wavelength dependent, and the hemispherical anisotropic coupling of irradiance and local and meso-scale topographic shielding must be accounted for. Sensitivity analysis associated with using various parameterization schemes and combinations of RTP is sorely needed to provide insights into the use of this parameter for investigating topographic effects.

2.3. Adjacent-Terrain Irradiance

The aforementioned irradiance components and surface BRDF interact with the surrounding terrain geometry to generate E t . Numerous researchers have indicated that it should be accounted for in mountains due to snow, glaciers, vegetation and extreme relief over short distances [14,23]. It is an extremely complicated parameter to compute, as it is governed by atmospheric attenuation and numerous multi-scale topographic effects and surface anisotropic reflectance conditions. A first-order approximation to E t was formulated by Proy et al. [23], assuming Lambertian reflectance and is still used in investigations that attempt to account for E t . Nevertheless, it is rarely accounted for in empirical ARC studies.
It can be computed as:
L θ i e , ϕ i e , θ v e , ϕ v e , λ = ρ b r d f θ i e , ϕ i e , θ v e , ϕ v e , λ E ( θ i e , ϕ i e , λ ) ,
E t ( λ ) = ϕ i = 0 2 π θ i = 0 π L θ i e , ϕ i e , θ v e , ϕ v e , λ T t ( θ v , λ ) cos I t S b d θ d ϕ ,
where the superscript e represents the effective zenith and azimuth angles that account for the influence of the terrain slope and slope azimuth angles on the incident ( θ i e , ϕ i e ) and viewing geometry ( θ v e , ϕ v e ) of the surface BRDF compared to a horizontal surface. L represents the surface reflected radiance coming from the effective incident direction, ρ b r d f is the surface BRDF, ϕ i is the hemispherical incident azimuth angle, θ i is the incident vertical hemispherical zenith angle to account for terrain radiance above and below a pixel location, T t is the atmospheric transmittance given the optical depth of the atmosphere due to relief and propagation zenith angle through the atmosphere ( θ v ) between two locations, cos I t represents the terrain incidence angle given the influence of the local terrain geometry in relation to the incident directional geometry, and S b represents the blockage of the adjacent-terrain reflectance between two points that occurs when crests and/or ridge altitudes extend above the altitude of the 3-D trajectory connecting two points. Potential terrain blockage is direction and distance dependent and is different from the terrain shielding effects of S t . It is generally thought that the computation of E t should account for the terrain conditions extending out to approximately 5 km from each pixel location [23], although the scale dependency of contributing terrain varies with the complexity of the topography and relief, and most likely is highly variable across the landscape. Assessing the scale dependencies for each pixel location has not been adequately investigated. Another complicating factor is that each pixel exhibits a unique BRDF, as topography and varying land cover structure and biophysical properties govern the BRDF [11,30]. Consequently, accurate estimates of the magnitude and the spatial distibution of E t need to be assessed in the field and through numerical modeling efforts.
Most empirical ARC investigations do not adequately account for Et, as they assume Lambertian reflectance, insignificant atmospheric attenuation, and may not account for anisotropic topographic effects. Such assumptions are not valid in many mountain environments, as steep slopes and highly variable biophysical properties caused by high-magnitude surface processes, create anisotropic reflectance conditions and extreme relief [17,31,32]. Furthermore, topographic effects on the surface BRDF are not fully understood, although we know that the viewing geometry can change for every pixel given variations in terrain slope and slope-azimuth angles [13,26,33]. Furthermore, accurately estimating E t requires accurate characterization of the anisotropic irradiance conditions of E b and E t which govern the anisotropic nature of the BRDF. The problem represents the issue of the “chicken or the egg”, as E t is dependent upon knowing the BRDF, but the BRDF is governed by irradiance components, as partially described in Equation (5a). More research regarding assessment of the significance of these RTP are needed to determine the most important parameters to be included in ARC methods or models.

3. Study Area

We simulate a first-order approximation of E t and E d over the Nanga Parbat massif, in northern Pakistan (see study area figure in Bishop et al. [11]). This geographic region is excellent for evaluating multi-scale topographic effects on the irradiance components, as it exhibits the full range of topographic properties due to atmosphere, surface process and tectonic interactions that are responsible for high magnitude erosion, uplift and relief production [34,35,36]. We specifically simulate irradiance over a 60 × 60 km area around Nanga Parbat to account for relief structure, meso-scale topographic shielding and surface conditions.
The study area has been extensively described in terms of climate, topographic, land cover, landforms, and geological conditions. Landscape conditions are spatially complex and dictate anisotropic reflectance conditions. Unfortunately, surface irradiance conditions are not well known for this area, as the multi-scale topographic effects have not been adequately accounted for. For excellent study area details see Shroder and Bishop [34], Zeitler et al. [35], Bishop et al. [36], Schneider et al. [37], Owen et al. [38].

4. Materials and Methods

4.1. Data

The ASTER Global Digital Elevation Model Version 3 (ASTER GDEM; [39]) was utilized to represent the topography and account for various multi-scale topographic effects governing surface irradiance components. Other data used for simulating E b and E d include spectra and constants from published work. Mean Exo-atmospheric irradiance values, atmospheric absorption coefficients for atmospheric constituents, and atmospheric scattering coefficients from Gueymard [25] were used in simulating atmospheric conditions and irradiant components.
We simulated surface reflectance based on the spatial structure of generalized land cover conditions. We used Landsat 8 OLI imagery captured in 2018 on 4 August (path 149, rows 35–36) and 9 September (path 150, rows 35–36), minimizing cloud cover and temporal differences between scenes. To assist in classification efforts, we computed the normalized difference vegetation index (NDVI), the normalized difference snow index (NDSI), modified normalized difference water index (mNDWI) as:
N D V I = N I R R e d N I R + R e d ,
N D S I = G r e e n N I R G r e e n + N I R ,
m N D W I = G r e e n S W I R G r e e n + S W I R ,
where G r e e n , R e d , N I R and S W I R represent the green, red, near-infrared and shortwave-infrared region of the spectrum using appropriate Landsat 8 spectral bands.
We chose four basic land-cover classes for our analysis:
  • Snow, where NDSI  > 0.75 and altitude > 3000 m.
  • Vegetation, where there was no snow and NDVI  > 0.1 .
  • Water, where there was neither snow nor vegetation and NDSI  > 0.79 .
  • Rock and sediment in the remaining space.
To achieve a more homogeneous result, we removed all solitary water pixels and iteratively applied a majority filter to the snow and vegetation classification maps until no reclassifications occurred. We then simulated surface reflectance (i.e., assuming Lambertian reflectance) for these classes using the same linear spectral-mixing method and spectral libraries as Bishop et al. [11].

4.2. Numerical Modeling

4.2.1. Orbital Dynamics

Earth-Sun orbital parameters control the magnitude of the exoatmospheric irradiance ( E 0 ), therefore, we account for eccentricity (e), obliquity ( ϵ ) and other parameters such as the longitude of perhelion [40]. We used Berger [40] amplitudes, rates and phases of trigonometric expansions to predict these orbital parameters to compute the Earth-Sun distance ( d e s ), the distance-correction factor ( f r ) and solar geometry, such that:
E 0 ( λ ) = E ¯ 0 ( λ ) f r cos θ s ,
where E ¯ 0 represents the solar irradiance spectra from Gueymard [25] at 1 AU and θ s is the solar zenith angle.
Orbital parameters are also required to compute the spatial variation in the solar geometry such that:
δ = arcsin sin ϵ sin λ l ,
where δ is the solar declination, and λ l is the true longitude of the Earth relative to the vernal equinox. The solar zenith angle and solar azimuth angle ϕ s vary for each pixel and govern a multitude of parameters. The geocentric solar zenith angle is:
cos θ s g = sin φ sin δ cos φ cos δ cos H ,
where φ is latitude, and H is the hour angle of the sun. We modified this angle using a parallax correction. Parallax correction accounts for the radius of the Earth at a particular latitude, the height relative to the ellipsoid, and the distance from the sun. Atmospheric refraction also modulates θ s and we evaluated several refraction algorithms given that there are numerous parameterization schemes that account for different parameters (Table 1). Specifically, we evaluated the t a n 5 formula, as presented in Corbard et al. [41], and the parameterization scheme of United Kingdom Hydrographic Office [42], and compared refraction estimates to measured data and full integration results produced by Corbard et al. [41]. In our simulations, we used the t a n 5 formula, as it produced better results at higher observed zenith angles.
The solar azimuth angle for each pixel was computed as:
ϕ s = π atan2 ( Y s , X s ) ,
where the sine and cosine components are computed as:
Y s = cos δ sin H cos α s
and
X s = sin α s sin φ sin δ cos α s cos φ .
where α s is the solar elevation angle. The solar azimuth angle was then corrected for grid convergence which is a function of latitude and the longitude of a pixel location with respect to the central meridian of the projection used (i.e., Transverse Mercator).

4.2.2. Atmospheric Transmittance

We compute the downward total transmittance ( T ) based upon primary atmospheric constituents and processes. These include Rayleigh scattering transmittance ( T r ), aerosol scattering transmittance ( T a ) using a rural clear-sky aerosol model, and atmospheric absorption transmittance of water ( T w ), ozone ( T o ) and primary gases ( T g ). The parameterization scheme for ozone was based upon Bird and Riordan [43], while all the others were based upon Gueymard [25]. The atmospheric parameters used in these parameterization schemes to simulate atmospheric transmittance and compute irradiance components are based upon the U.S. standard atmospheric model for our location (Table 2). Finally, the total downward atmospheric transmittance was computed as:
T ( λ ) = T r ( λ ) T a ( λ ) T g ( λ ) T o ( λ ) T w ( λ ) .
For more details regarding atmosphere transmittance parameters, see Bishop et al. [11].

4.2.3. Direct Irradiance

We computed E b using Equation (2). We do not formally define the first three parameters, as they have already been defined or are widely know and described in the literature (e.g., cos i ). We focus here on the cast shadow parameter, as most studies utilize the solar point-source assumption and ray tracing to compute a binary coefficient (e.g., [44,45,46]). This approach generates an estimate of the distribution of cast shadows, but it spatially over-estimates the distribution and fails to accurately characterize the magnitude of E b in the cast shadow region, as the penumbra region of the cast shadow is not accounted for.
Cast shadows are governed by the size of the solar disk in relation to the Earth-Sun distance. More specifically, the solar angular width ( α ( t ) , [radians]) in relation to topographic relief, will govern the overall length of a cast shadow in the direction of ϕ s . It can be computed as:
α ( t ) = 2 tan 1 2 R n 2 d e s ( t ) ,
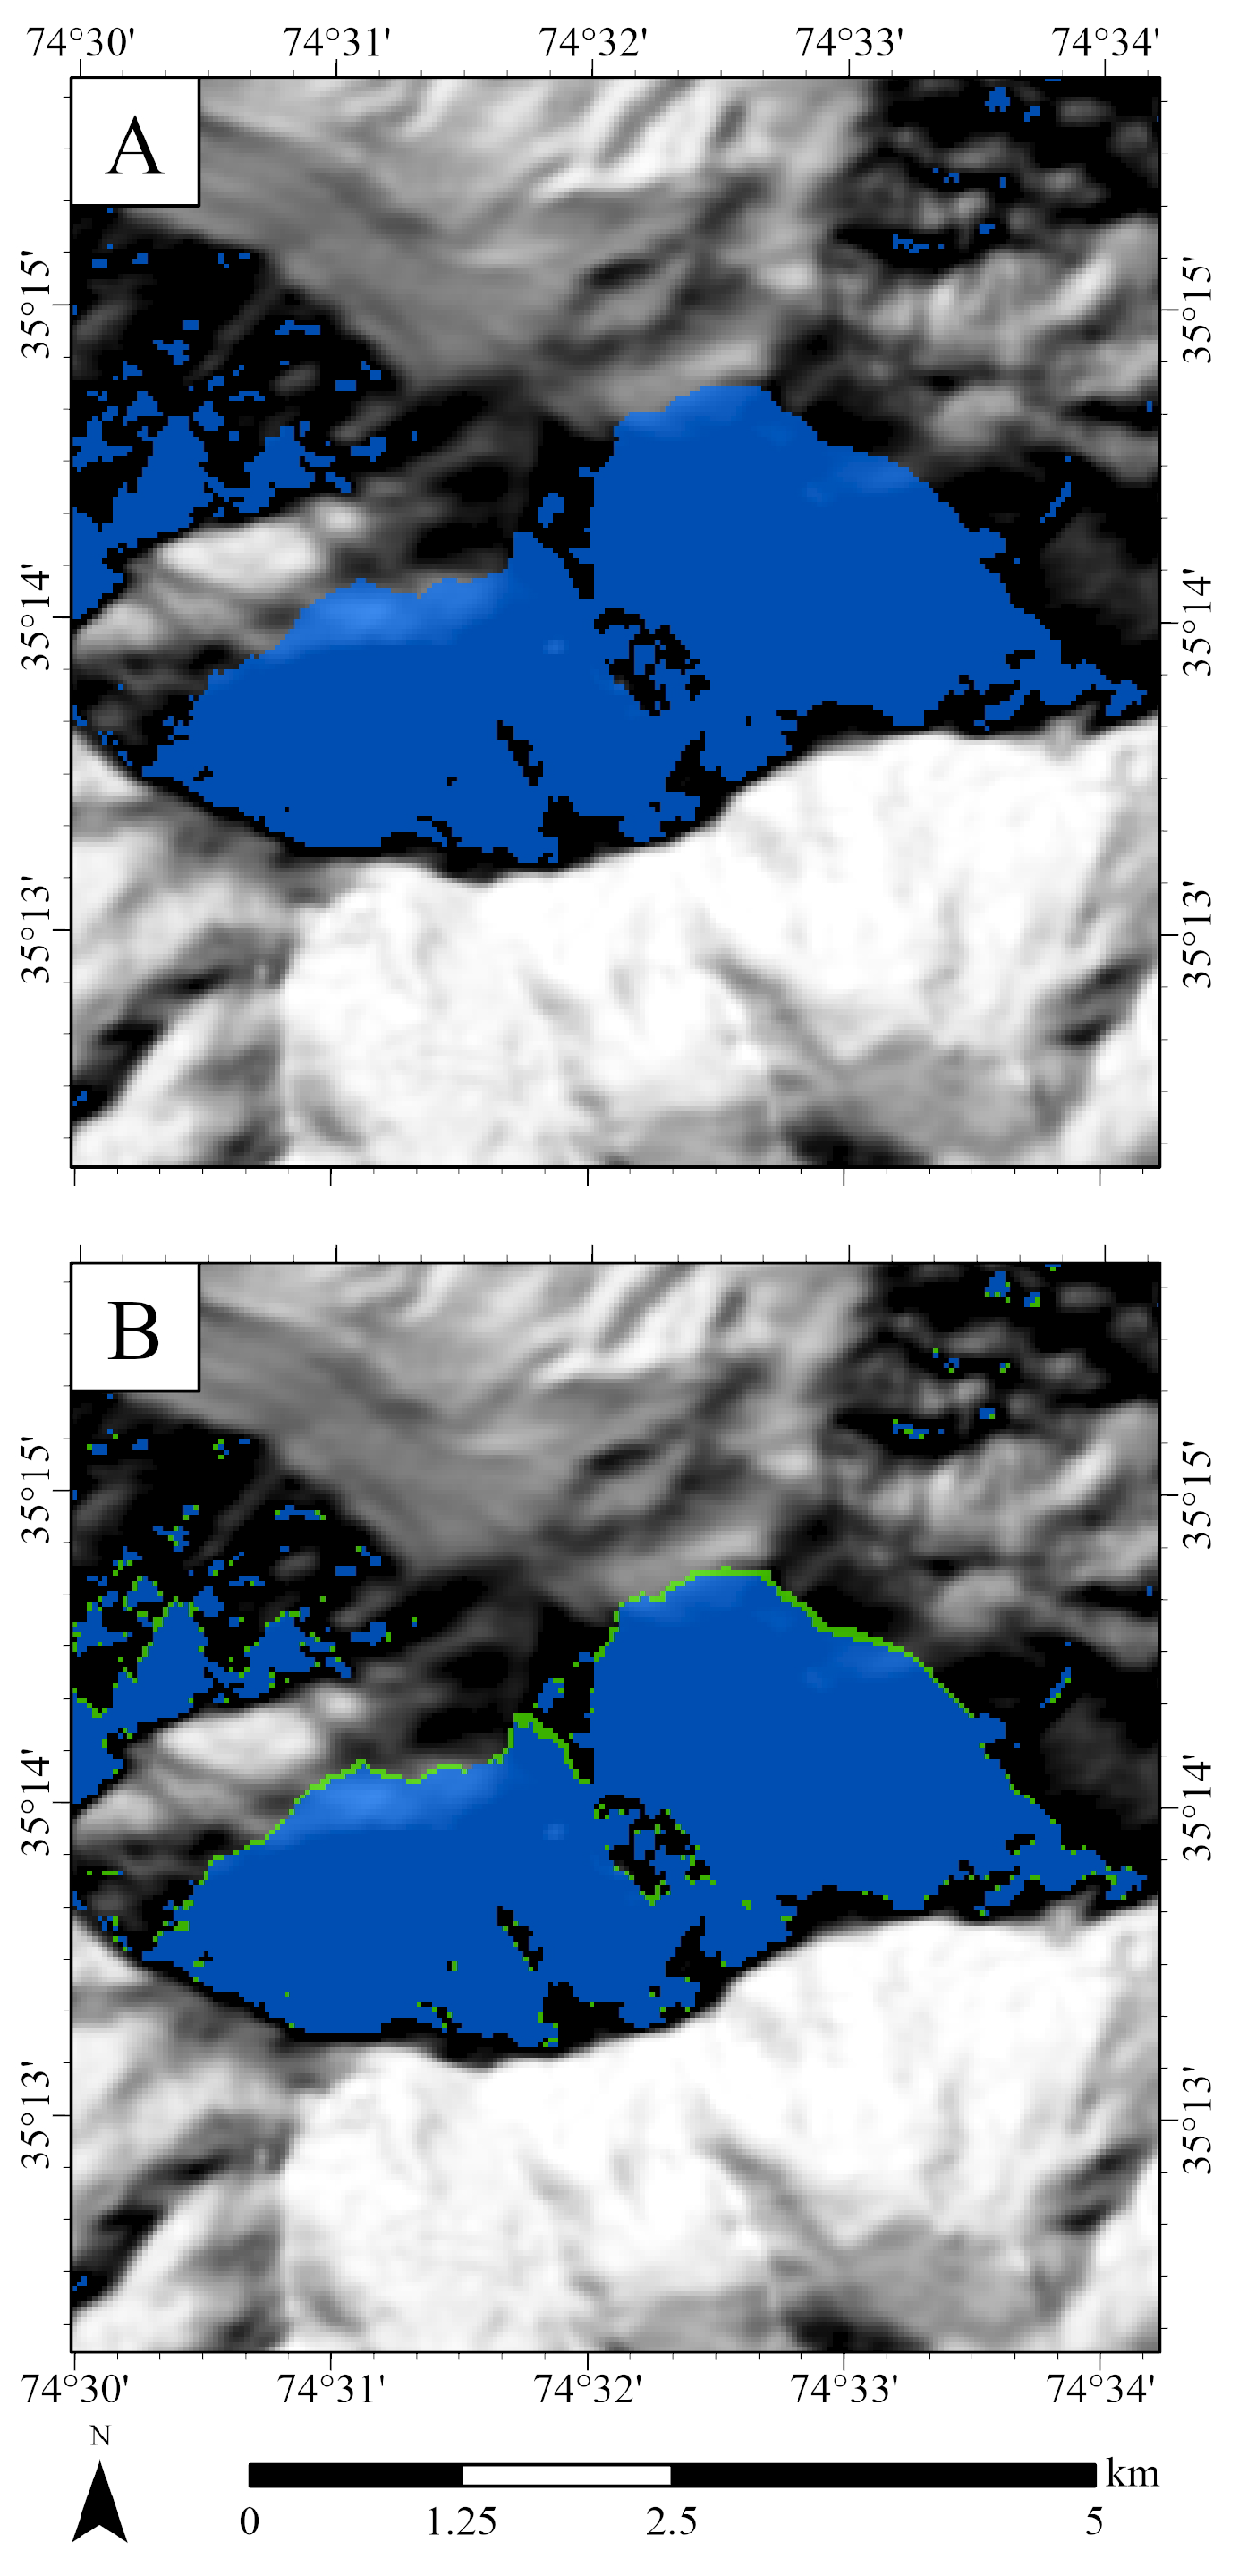
where R n is the nominal solar radius ( R n = 695,700 km, [47]) and d e s is the Earth-Sun distance (1AU = 149,597,870.7 km) that is a function of time (t). Given the aforementioned values, the solar angular width is 0.53290 ° . This angle and other cast shadow parameters are depicted in Figure 1. The shadow parameters include the length of the penumbra ( L p , [m]) and the maximum potential planimetric length from the point of shielding for the umbra ( L u , [m]) and the entire cast-shadow region ( L s , [m]). They can be computed as [21]:
θ 1 = θ s α 2 ,
θ 2 = θ s + α 2 ,
L u = Z r tan ( θ 1 ) ,
L p = R z 1 tan α s α 2 1 tan α s + α 2 ,
L s = Z r tan ( θ 2 ) .
Finally, the fraction of E b that is incident on the landscape in the penumbra region can be computed as:
S = 0.0 , x < = L u , 1.0 , x > = L s , x L u L p , x > L u a n d x < L s .
The umbra is the region over the landscape where E b is totally obstructed by the topography. Conversely, the penumbra region receives a fraction of E b because a portion of the solar disk is obstructed by the topography. As depicted in Figure 1, the umbra region would exhibit shadow coefficients of 0.0, while the penumbra region would exit a gradient of coefficient values ranging from 0.0–1.0, depending upon the positional distance within this zone. Consequently, cast shadows also include irradiance from E b [21]. To our knowledge, this characterization of cast shadows has not been evaluated compared to a point-source characterization and the degree to which this RTP may influence ARC.

4.2.4. Diffuse-Skylight Irradiance

We computed E d using a variety of parameterization schemes. Given that E d h from Equation (3) represents the isotropic background diffuse irradiance component for numerous parameterization schemes, we compute the governing equations for the components of E d h such that [25,43]:
E d r ( λ ) = F r E ¯ 0 ( λ ) f r ( 1.0 T r 0.9 ) T a a ( λ ) T g ( λ ) T o ( λ ) T w ( λ ) cos θ s ,
E d a ( λ ) = F a E ¯ 0 ( λ ) f r ( 1.0 T a s ( λ ) ) T r ( λ ) T g ( λ ) T o ( λ ) T w ( λ ) T a a ( λ ) cos θ s ,
E d g ( λ ) = ( E b n ( λ ) + E d r ( λ ) + E d a ( λ ) ) ρ s k y ( λ ) ρ g ( λ ) ( 1.0 ρ s k y ( λ ) ρ g ( λ ) ) ,
where F r is the downward fraction of scattered radiation for a single scattering atmosphere, T a a is the transmittance of the aerosol absorption process, F a is the downward fraction of scattered flux, T a s is the transmittance for aerosol scattering, E b n is the direct normal irradiance, ρ s k y is the sky reflectance and ρ g is the ground reflectance averaged over a radius of 5 km.
A commonly used parameterization scheme for estimating this component that attempts to account for topographic shielding ( E d t ), involves the calculation of the skyview-factor coefficient ( V s k y ) such that:
V s k y = ϕ = 0.0 360 cos 2 θ m a x ( ϕ , d ) Δ ϕ 360 ,
E d t ( λ ) = E d h ( λ ) V s k y ,
where ϕ represents the hemispherical (i.e., skydome) azimuth angle, θ m a x represents the maximum horizon angle in the direction of ϕ and over a distance of d. This scheme assumes isotropic irradiance conditions and does not account for local topographic effects. We used a distance of 20 km around each pixel and used a ϕ interval of 5 ° to compute the coefficient. In this way, we can compare this parameterization scheme to a more comprehensive parameterization scheme (Equation (4)) that better accounts for topographic effects.
We also wanted to examine a widely used anisotropic diffuse parameterization scheme ( E d p by Perez et al. [48]) that has been evaluated in the literature (e.g., [49,50]). It is computed as:
E d p ( λ ) = E d h ( 1 F 1 ) 1 + cos θ t 2 + F 1 a 1 a 2 + F 2 sin θ t ,
where E d h represents the isotropic background, a 1 / a 2 is the solid angle for the circumsolar region, F 1 is the horizontal brightness, and F 2 is the circumsolar coefficient, where isotropic conditions represent F 1 = F 2 = 1.0 . This scheme accounts for circumsolar and horizon scattering as well as local topographic conditions. It does not, however, formally account for hemispherical terrain shielding, although an approximation term ( 1 + cos θ t 2 ) is used to represent this meso-scale topographic effect.
Our final and more comprehensive parameterization scheme for E d that we compute is based upon Equation (4). Specifically, we perform sky luminance modeling as described in Perez et al. [24], to estimate the anisotropic nature of the diffuse irradiance and account for horizon scattering and circumsolar scattering. We assume clear-sky conditions and specifically utilize the CIE clear-sky formulation [51] to compute the hemispherical sky illuminance. We then generate normalized luminance value for all the elements of the sky dome, and use the Perez et al. [24] diffuse luminous efficacy model to convert values to irradiance. We then integrate over the entire skydome accounting for local topographic effects that are characterized by skydome and terrain gemometry, and limit the integration based upon the θ m a x angle for a particular hemispherical azimuth direction, thereby accounting for hemispherical topographic shielding. In this way, we formally account for anisotropy and the scale dependent nature of topographic shielding.

4.3. Sensitivity Analysis

For each irradiance component, we conducted a numerical sensitivity analysis to determine if a particular RTP, or a different parameterization scheme, significantly governs the magnitude and variance structure of a particular irradiance component compared to a more comprehensive parameterization scheme that is deemed to be more accurate (i.e., accounts for more topographic effects). This was done to identify significant RTP that may need to be accounted for in ARC methods or models. Furthermore, we simulated results for 3 different spectral wavelengths based upon the central spectral bandwidth wavelength of the Landsat 8 Operational Land Imager sensor (i.e., λ 1 = 0.56141 μ m, λ 2 = 0.65459 μ m, λ 3 = 0.86467 μ m).
It is important to note that we evaluate three specific wavelengths and characterize specific atmosphere-topography couplings. Spectral integration would have generalized our results, and our focus is to evaluate parameterization schemes to see how well they can characterize topographic effects. It is well known that the spatial, spectral and radiometric resolution of sensor systems will modulate the magnitude of the recorded sensor signal from the radiation-transfer cascade (RTC), such that environmental information (i.e., topographic variations) will be modified, based upon RTP dominance in relation to the degree of generalization cause by various resolutions, which alters spectral variation in images. We do not yet have enough knowledge about how sensor system characteristics and spectral integration will influence topographic variation in imagery, so we did not want to complicate the problem of generalizing our results over a portion of the spectrum. We primarily focus on terrain-irradiance variations and we do not compare irradiance images to spectral imagery.
For all irradiance components, we included or excluded specific RTP into our simulations and analyses that represent a series of control parameter scenarios, so that we can examine statistics and compare control parameter scenarios to a more comprehensive parameterization scheme over the Nanga Parbat Massif. Specifically, we compute the minimum, maximum, mean and standard deviation for the control scenarios, and then compare results using the root-mean-squared error metric, the globally computed structural similarity index (SSI) [52], Students t-test analysis for unequal variances, and an F-Test to determine the significance of a parameter with respect to the irradiance component. See Table 3 for simulation and scenario descriptions.
It should be noted that the purpose of this study is to evaluate a limited number of key variables that represent topographic effects, and those that could be significant in terms of improving parameterization schemes of ARC methods that make use of a scaling factor to remove topographic effects in satellite imagery. In fact, our choice of variables is related to the assumptions that are frequently associated with utilizing empirical ARC methods and the choice of possible parameterization schemes that could be attempted in further research. In this way, our evaluation may provide insights into possible improvements for modifying empirical ARC parameterization schemes by including or excluding variables. The use of evaluating specific RTP parameters/sub-parameters based upon a Monte-Carlo simulation approach is far beyond the scope of our work, and this approach would dictate that a far greater number of variables would have to be evaluated, due to parameter function dependencies.

5. Results

5.1. Direct Irradiance

A sample of cast shadow simulation results based on the solar point-source assumption for the upper region of the Diamir Basin are presented in Figure 2A. Figure 2B depicts a shadow distribution based upon using the solar disk to estimate the umbra and penumbra regions. The umbra region in the upper panel (A) is greater in length compared to the umbra region in the lower panel (B), although the spatial distributions are relatively similar. This is caused by θ 1 being less of an angle compared to θ s , as α / 2.0 must be taken into consideration when accounting for the partial blockage of the sun. The penumbra region borders the extent of the umbra region, and various locations on the landscape within the general umbra region can also exhibit modulated irradiance due to relief conditions. The parameterization schemes dictates that changes in the Earth-Sun distance, solar geometry and relief can increase the length of the penumbra, thereby increasing the influence of this parameter on irradiance variability, and therefore spectral variability in imagery. Given the extreme relief at Nanga Parbat, we might expect this RTP to be significant in terms of governing the magnitude and variance structure of direct irradiance in various locations on the landscape.
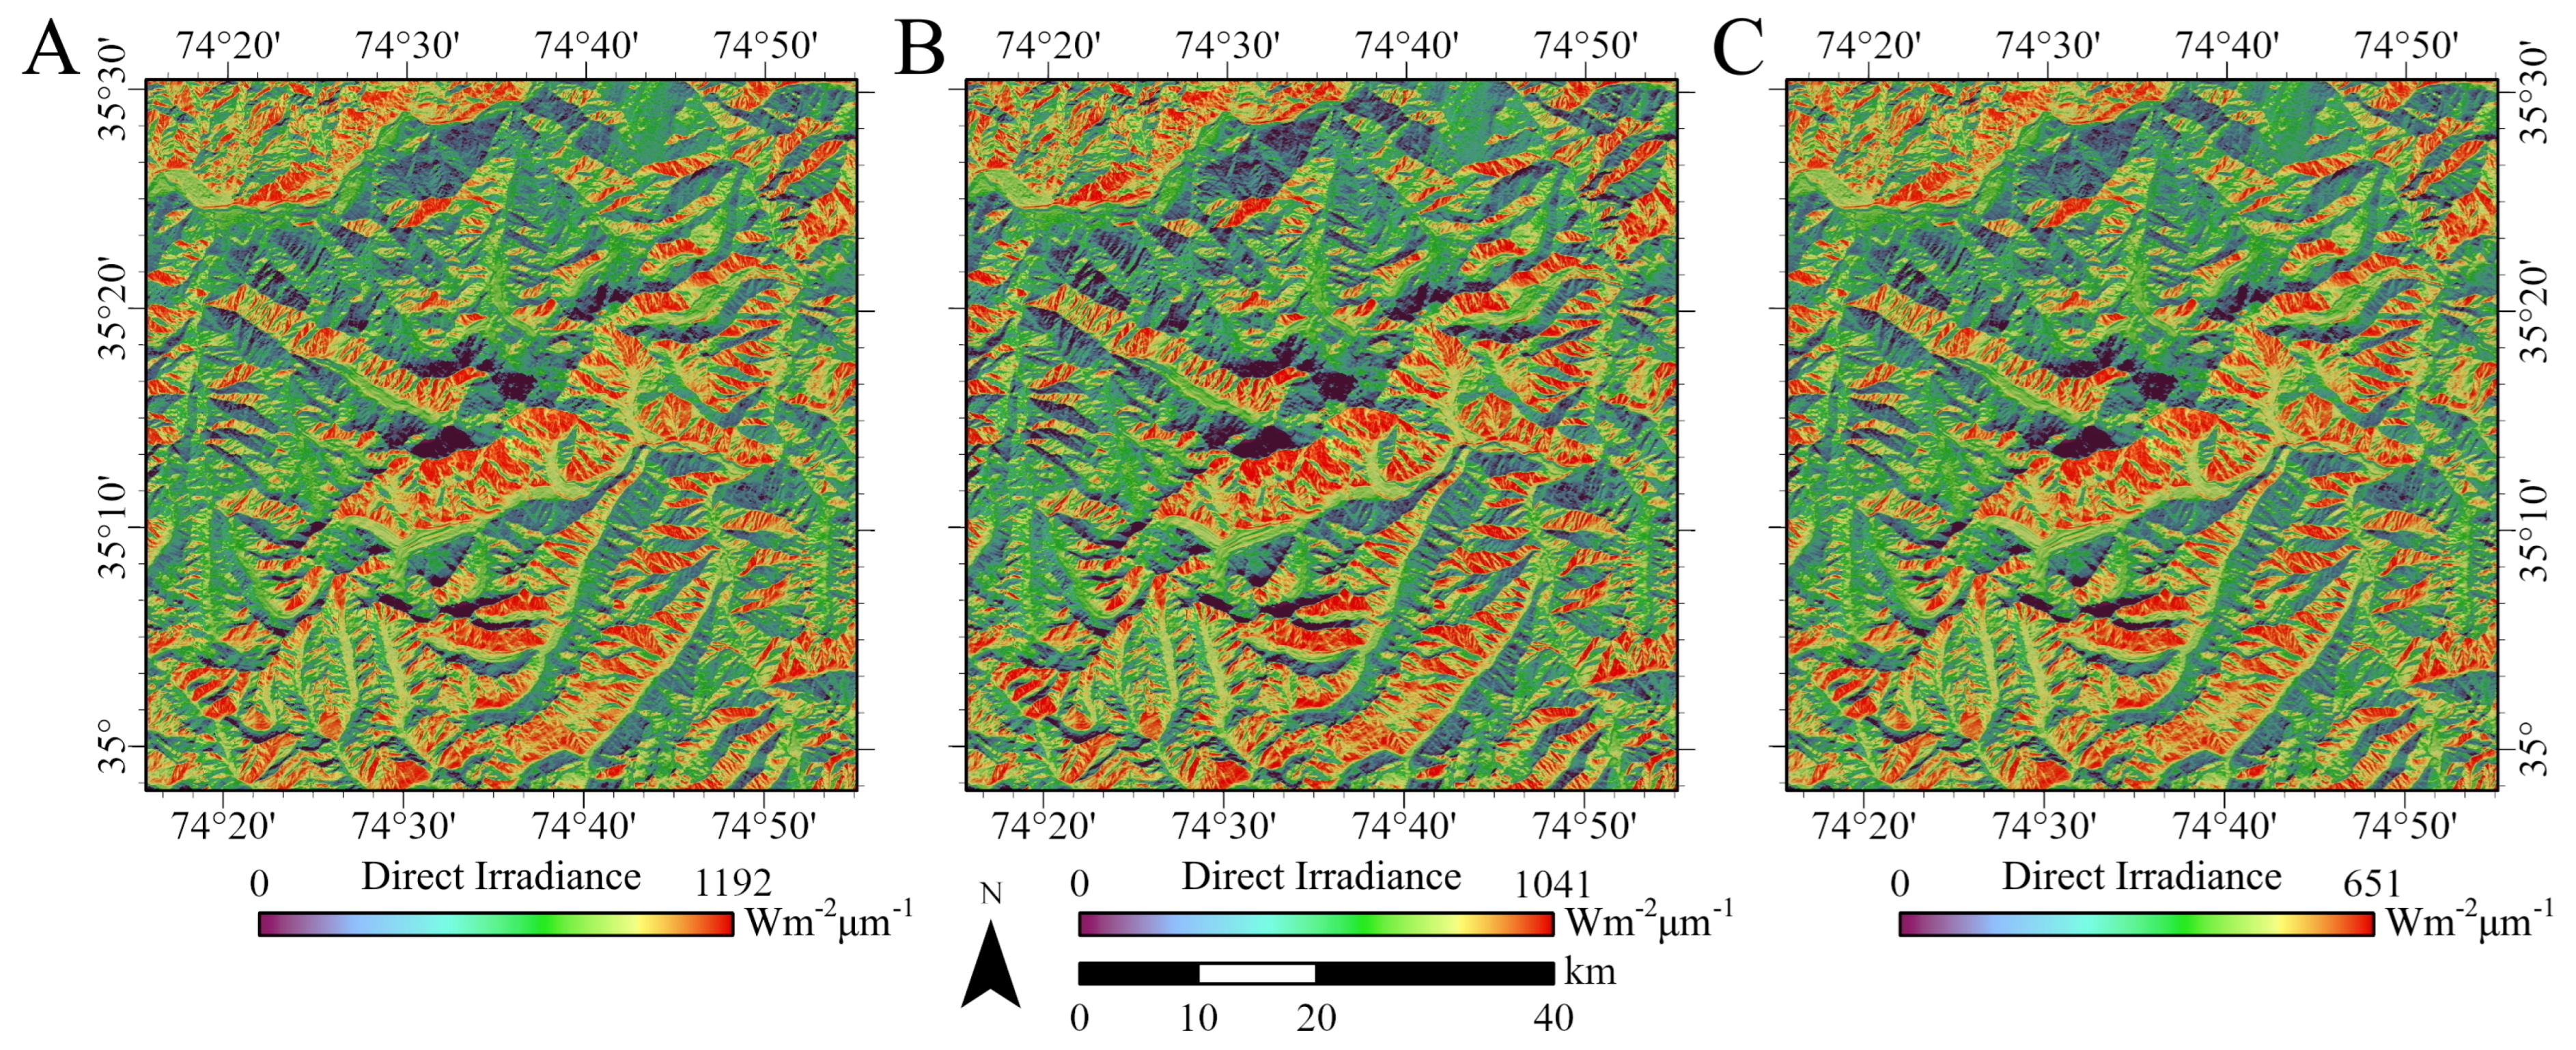
Direct irradiance simulation results are presented in Figure 3 and Table 4. As we would expect, local topographic conditions and cast shadows cause significant spatial variations in E b for the green region of the electromagnetic spectrum caused by the coupling of atmosphere-topography modulation. The magnitude and variance of E b for the red and near-infrared regions of the spectrum decrease given a systematic decrease in exoatmospheric irradiance and increase in atmospheric transmittance. These magnitude and spatial patterns are characterized in the E b statistics, where there is a systematic decrease in the mean and standard deviation for each region of the spectrum. These simulation results are consistent with results generated from Bishop et al. [11], although improved parameterization schemes are used in this study.
Sensitivity analysis results of our direct irradiance simulations clearly demonstrate that all topographic effects that we have simulated govern the magnitude and spatial variability of irradiance in a significant way, irrespective of wavelength (Table 4). Specifically, we see relatively high RMSE values that indicate that specific topographic effects, if not accounted for, make a difference in the magnitude of irradiance and that specific parameterization schemes do not account for the collective topographic effects. There is clearly a wavelength dependence, such that RMSE values are much larger at shorter wavelengths, strongly suggesting that coupled atmospheric-topographic effects are the cause. This is also demonstrated by the decrease in the variability of irradiance with increasing wavelength (see σ values).
These results are also supported by the structural similarity index (SSI) that accounts for magnitude, global variability and correlation structure. We should expect an SSI value of one if the mean, variance and correction structure are identical. Clearly, SSI values indicate that there are magnitude, variance and correlation structure differences. The statistical significance of these differences can be ascertained by our inferential statistical results. We found that all inferential tests using the t-statistic and F-ratio were significant at the p = 0.00001 level for all regions of the spectrum, indicating that the magnitude and variance structure of direct irradiance is significantly different when RTP are not accounted for, or when different parameterization schemes are used. Collectively, these results clearly suggest that RTP that are generally thought not to be significant in terms of accounting for topographic effects may need to be accounted for, as one parameter can partially govern a multitude of other parameters considering the RTC.
Our statistical results (Table 4) also provide insights into which RTP are most important. As we would expect, local topographic effects (i.e., cos i ) are very significant, as solar and terrain geometry strongly governs irradiance and reflectance. This simulation and control scenario exhibited the highest and lowest RMSE and SSI values, respectively, irrespective of wavelength. Total atmospheric transmittance was also found to be important with relatively high RMSE values, while the third most important RTP appears to be cast shadows (solar disk parameterization scheme), while ARC methods make use of cos i , they generally do not account for the topographic effects that govern atmospheric transmittance or cast shadows (umbra and penumbra).

5.2. Diffuse-Skylight Irradiance

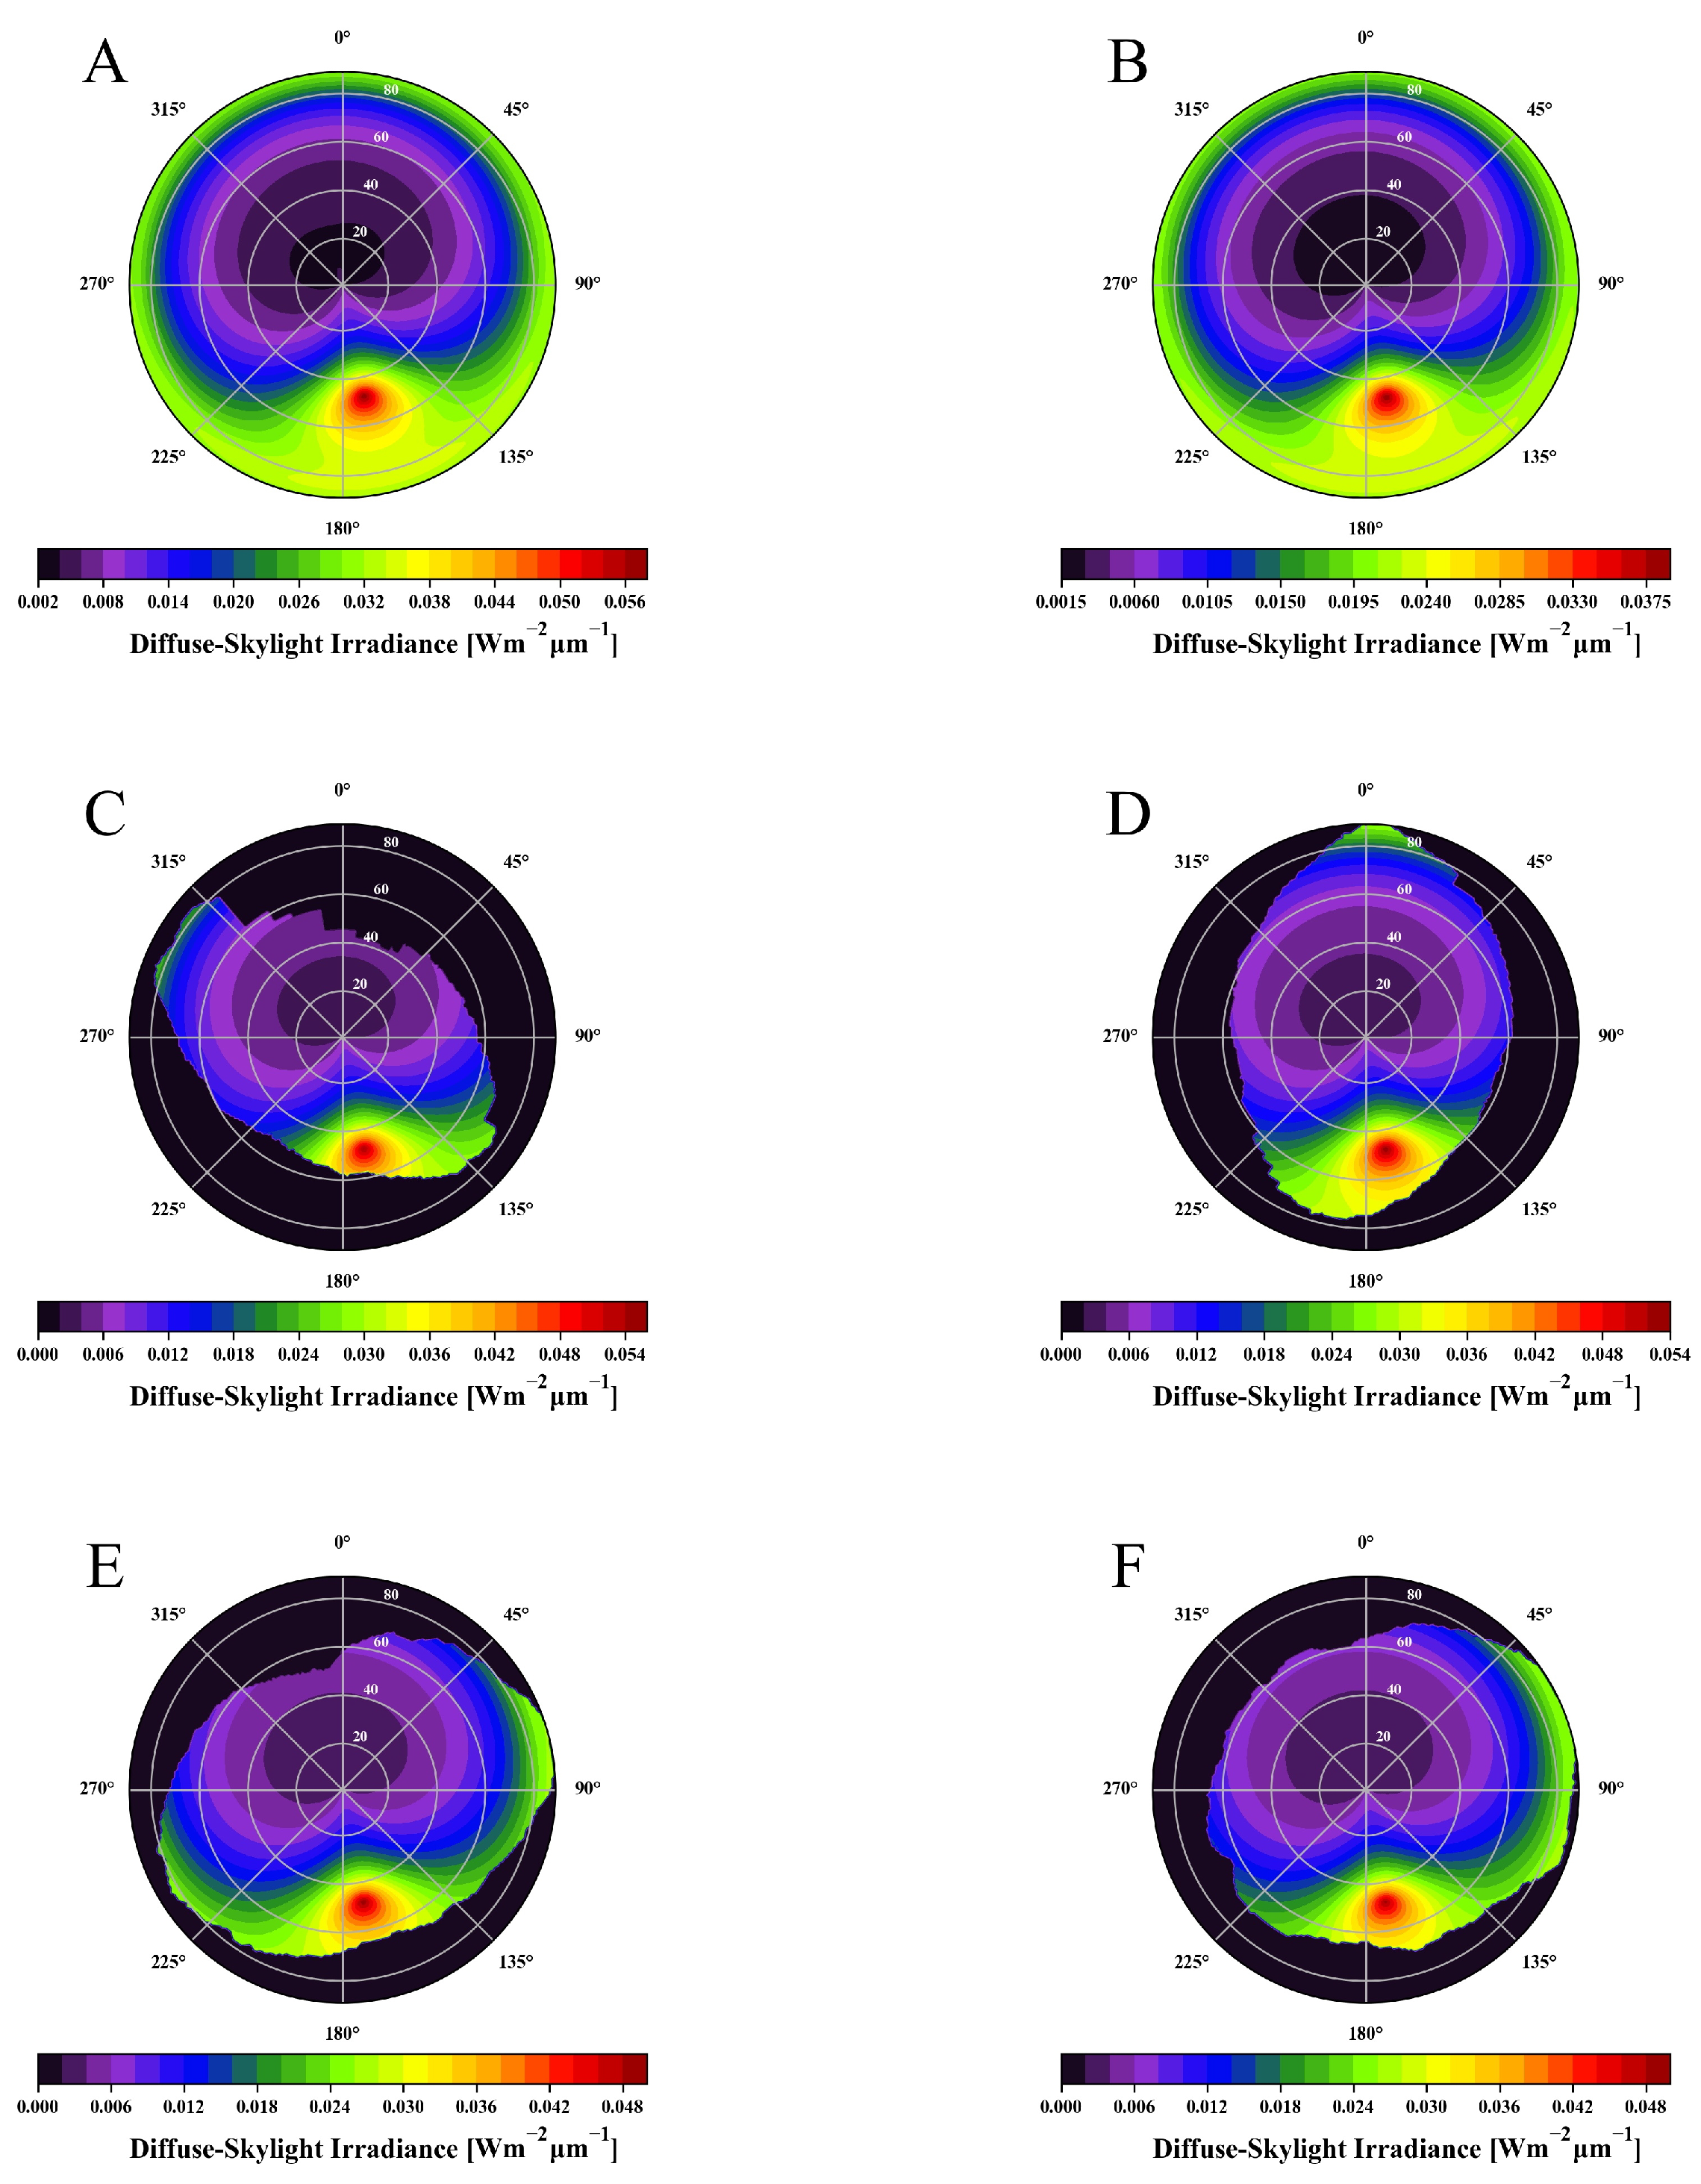
Simulation results demonstrate the anisotropic nature of E d over the sky dome and the anisotropic nature of topographic shielding (Figure 4). Panels A and B depict the entire sky dome and do not account for local or meso-scale topographic shielding.
The circumsolar irradiance zone governed by the solar geometry and the increase in scattering near the horizon are clearly depicted. The magnitude of E d is regulated by altitude, as lower altitude locations are associated with an increase in atmospheric mass that facilitates more atmospheric scattering. Panels A and B represent the lowest and highest altitudes over the Nanga Parbat Massif, with E d values of 446.895 and 301.155 W m 2 μ m 1 , respectively. Local and meso-scale topographic effects would significantly decrease these magnitudes if they were taken into consideration, as topographic effects are highly location dependent.
Panels C-F in Figure 4 demonstrate the anisotropic scale-dependent nature of topographic shielding. Local topographic effects were not accounted for in these simulations. We sampled locations in V-shaped and U-shape valleys to demonstrate meso-scale topographic effects. Panels C and D are located in the Diamir and Rakoit valleys, respectively, where rapid river incision and tectonic uplift produce well defined V-shaped valleys that have a strong terrain orientation. The orientation direction is a NW-SW trend for the Diamir Valley and a N-S trend for the Rakoit valley. The hemispherical relief structure in these basins clearly restricts the area of the skydome that contributes to E d . Panels E and F are located in the Rupal and Sachen valleys, respectively, where glaciation and glacierization have produced well-defined U-Shaped valleys. The relief structure also produces a terrain directional trend of NE-SW for the Rupal Valley and less of a directional trend for the Sachen Valley. Similarly, the hemispherical relief structure in these basins clearly restricts the area of the skydome that contributes to E d .
It is important to note that the anisotropic nature of the topographic shielding is relatively unique for each of our simulated sample locations, and this demonstrates that this topographic effect is highly variable over the landscape, such that each location has a relatively unique contributive skydome that is regulated by location (i.e., 3D position) in relation to the anisotropic relief structure of the topography. The relief structure is also highly variable across the landscape and strongly controlled by climate, surface processes and tectonics, which governs the orientation fabric of the topography. Consequently, E d is highly variable over the landscape, even though its magnitude may be less than E b .
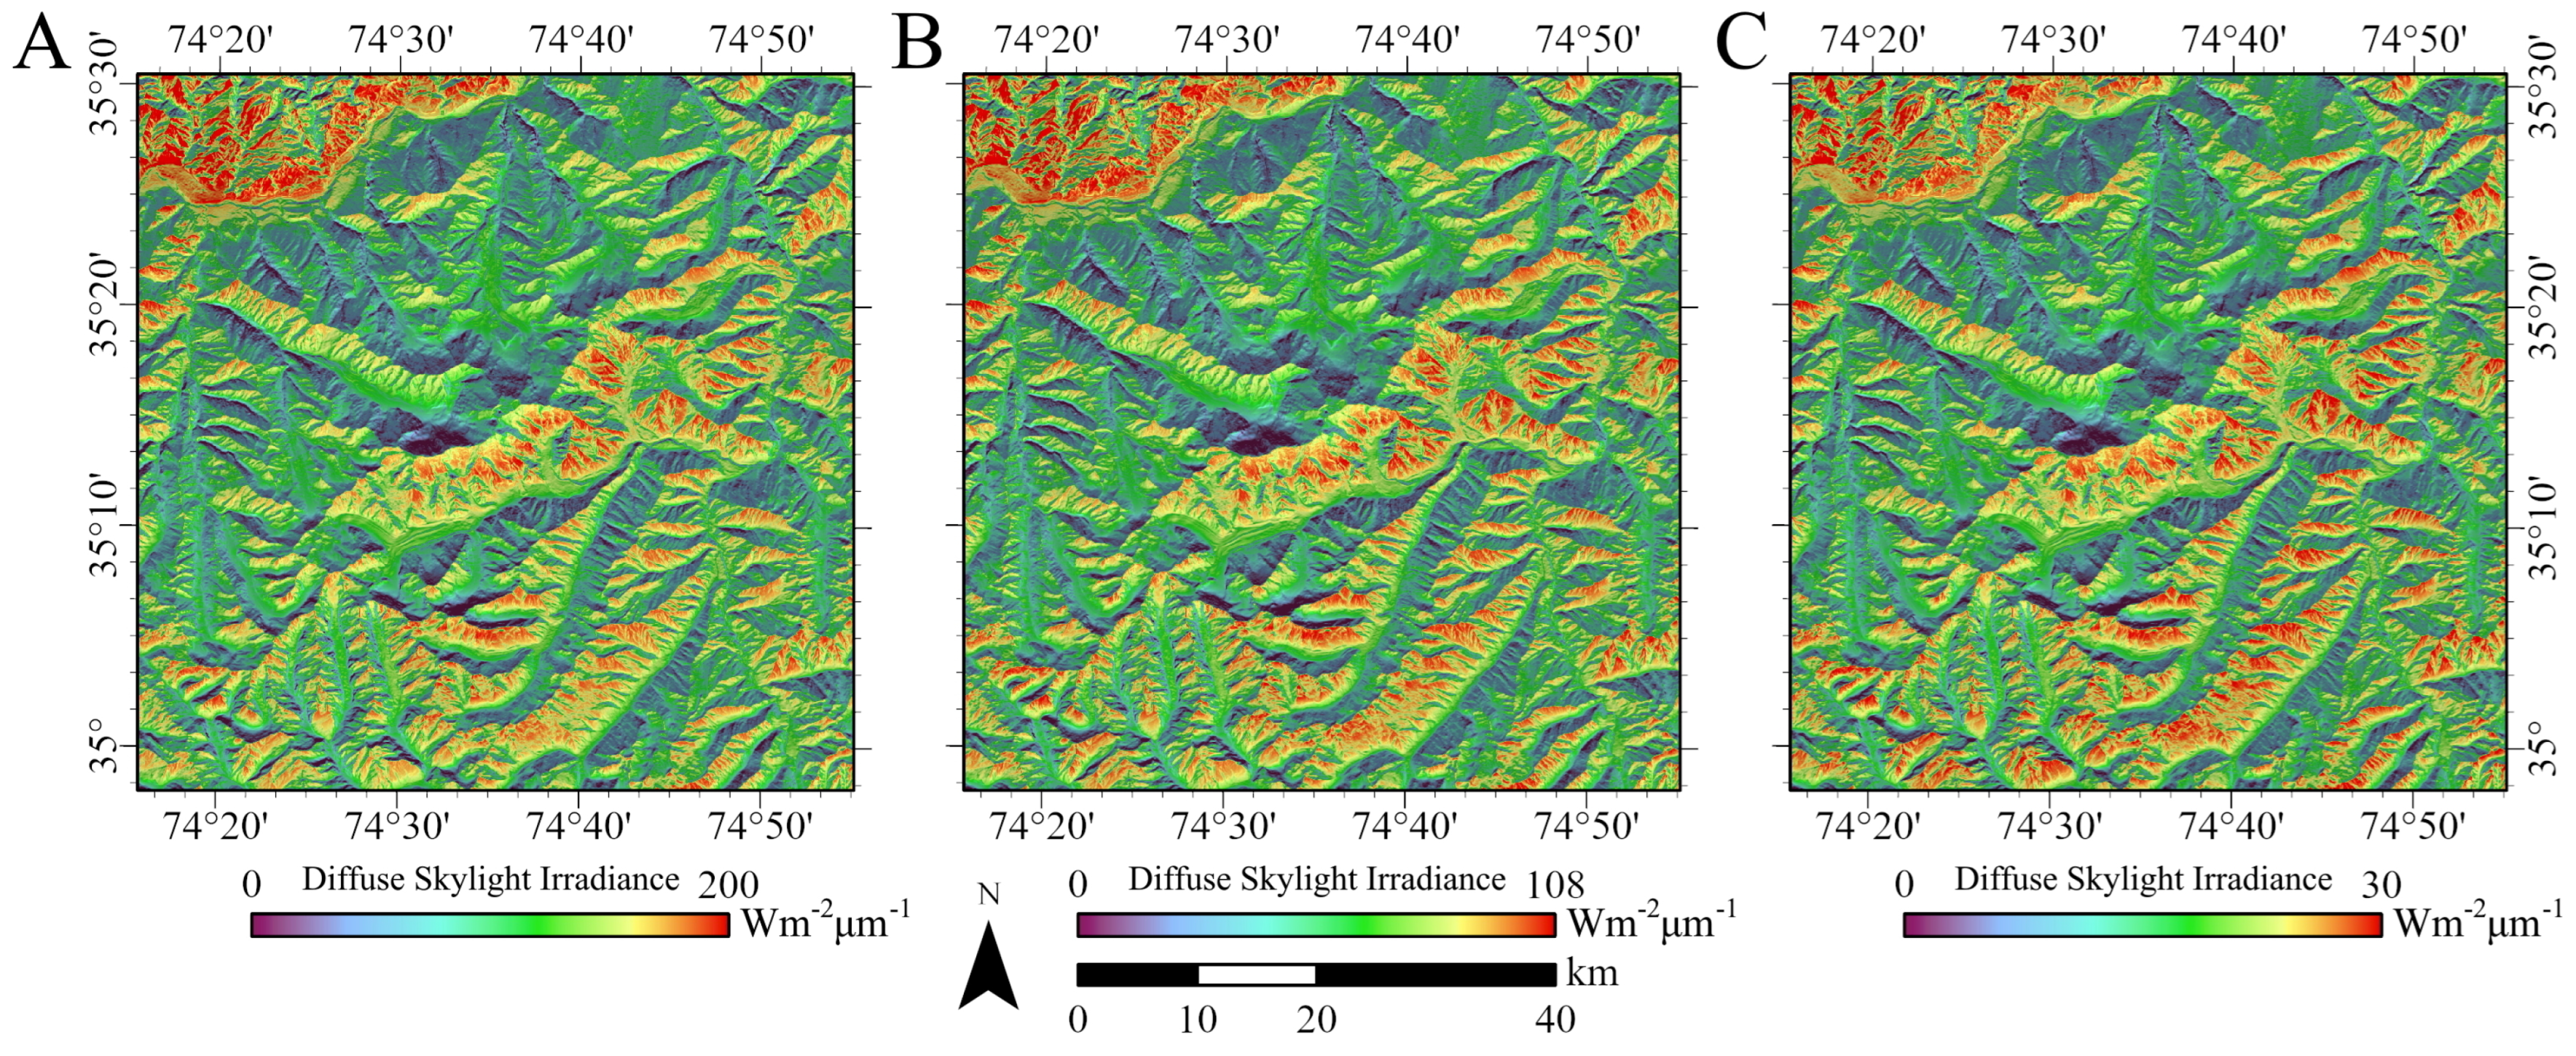
Diffuse-skylight irradiance simulation results over Nanga Parbat are presented in Figure 5 and Table 5. As expected, the mean magnitude of E d decreases with increasing wavelength due to a decrease in atmospheric scattering. Simulated E d values exhibit considerable spatial variability caused by anisotropic diffuse irradiance, coupled with local and mesoscale topographic variations. Consequently, we note that the magnitude, variance and spatial distribution patterns of our E d simulations do not similarly correspond to E d estimates generated from other parameterization schemes that assume isotropic conditions, and those that do not formally account for local and mesoscale topographic effects.
Our simulation results depict relatively high diffuse irradiance conditions on the southeastern slopes caused by relatively high circumsolar irradiance that is governed by the location and time of the simulation. Conversely, we see relatively low diffuse irradiance on the north side of Nanga Parbat, as diffuse irradiance is relatively low from the skydome geometry that faces the northwestern facing slopes. This is perhaps best depicted in the Indus valley, as the north-northwestern side of the valley (demarcated by the Indus River) exhibits relatively high irradiance, and the south-southeaster side of the valley exhibits relatively low irradiance. Such dramatic variation in irradiance over relatively short distances is also caused by local terrain geometry and topographic shielding where skydome irradiance is significantly modulated by these topographic effects. Furthermore, the significant relief within the region causes altitudinal variations in E d given an increase or decrease in atmospheric mass and therefore atmospheric scattering. These variations can be seen along the knife-edge Nanga Parbat ridge in the center of the scene.
Sensitivity analysis results of diffuse-skylight irradiance simulations clearly demonstrate that excluding a RTP and/or using a parameterization scheme that does not formally account for topographic effects, does not accurately characterize the magnitude and spatial variability of irradiance, irrespective of wavelength (Table 5). Specifically, we see that RMSE values are relatively high for control parameters, where we would expect a RMSE = 0.0 if anisotropy and multi-scale topographic effects were accounted for. We found that excluding the E a and cos I control parameters produced the highest RMSE values, irrespective of wavelength. This indicates the importance of the atmospheric aerosol scattering component and the coupled influence of anisotropic irradiance and local topographic effects. There is clearly a wavelength dependence, such that RMSE values are much larger at shorter wavelengths, strongly suggesting that significance of coupled atmosphere-topographic effects. This is also demonstrated by the decrease in the variability of E d with increasing wavelength (see σ values).
These results are also supported by the SSI values that accounts for magnitude, global variability and correlation structure. We should expect a SSI value of one if the mean, variance and correlation structure are identical. Clearly, all SSI values for control parameters are less than one, which indicates that all excluded RTP and included parameterization schemes exhibit differences in their magnitude, variance and correlation structure when compared to our base E d simulation, irrespective of wavelength. For excluded RTP, SSI values are lowest for the E a and cos I control parameters.
The significance of these differences can be ascertained by our inferential statistical results. We found that all inferential tests using the t-statistic and F- ratio were significant at the p = 0.0001 level for all wavelengths, indicating that the magnitude and variance structure of E d is significantly different when important RTP are not accounted for, or when different parameterization schemes are used. Collectively, these results clearly suggest that RTP that are generally thought not to be significant, or those topographic effects that are not generally considered (e.g., variation in solar geometry, secondary ground-atmosphere scattering, local topography, hemispherical shielding) may need to be accounted for, as one parameter can effect other parameters considering the RTC.
Our statistical results (Table 5) also provide insights into parameterization schemes that are frequently used by the Earth Science and remote sensing communities. As we might expect, the assumption of isotropic diffuse conditions, should not be used to characterize this irradiance component. The lowest SSI value was associated with E d h for all wavelengths. Coupled atmospheric-topographic effects are not effectively accounted for in this parameterization scheme. Consequently, researchers have also utilized the skyview factor to attempt to account for topographic shielding. Our results show, however, that this approach is not adequate, as SSI values for E d t are extremely low, irrespective of wavelength. Clearly, a topographic-shielding summary coefficient cannot represent the coupling of anisotropic irradiance and shielding conditions, as well as the coupling of anisotropic irradiance and local terrain conditions. Finally, we also note that a popular anisotropic diffuse irradiance scheme ( E d p ) produces significantly different results because it cannot formally account for topographic shielding and uses a proxy parameter.

6. Discussion

6.1. Direct Irradiance

It is widely known that topographic effects govern the direct irradiance that causes significant spectral variability in satellite imagery acquired over mountain environments. Our simulations demonstrate high spatial variability in E b that is governed by terrain variations in altitude, relief, slope and slope azimuth. In other mountain environments, the nature of terrain complexity will be different and irradiance magnitudes and spatial patterns will vary depending upon the magnitude and variability of these terrain properties. Researchers have been attempting to address this component for over 40 years, although they have not formally addressed topographic effects other than cos i .
Our findings strongly suggest that other RTP that govern the RTC should be taken into consideration to account for spectral variation in imagery. Specifically, we found that a variety of topographic effects are significant and that they should be formalized in ARC parameterization schemes to better account for variations in E b . This is important, as researchers assume that the spatial variability in solar geometry, atmospheric refraction, parallax correction, atmospheric attenuation, and a generalized treatment of cast shadow do not independently govern significant variation in irradiance. Our sensitivity analysis demonstrates that they can, given the topographic conditions at Nanga Parbat. Furthermore, it is important to note that for cast shadows, the length of the penumbra region can be extended, as a function of time and relief, which can further increase E b variability compared to our static time simulation.
Specifically, the sub-parameters of T , and S a should be utilized. They are not accounted for in common ARC methods and are generally not utilized in modeling efforts because of the need for more complex modeling of atmospheric transmittance and the computational complexity associated with representing the umbra and penumbra regions. Clearly, given that the transmittance and cast-shadow parameters are coefficients, they could be integrated into a ARC parameterization scheme to account for the relative coupling of atmosphere-topographic effects, and the spatial and temporal dependencies associated with cast shadows. In this way, the relative variability in E b could be more comprehensively accounted for.

6.2. Diffuse-Skylight Irradiance

The application of commonly utilized ARC methods can result in overcorrection, which is thought to be the result of not accounting for the E d component [53,54]. This has prompted numerous investigators to develop new parameterization schemes in an attempt to address irradiance variability. Common approaches make use of a C parameter that was formally introduced as the C-Correction method [18]. As Bishop et al. [11] noted, however, a constant global parameter that is based upon empirical regression analysis cannot represent the irradiance variations caused by coupled atmospheric-topographic effects that includes local and meso-scale topographic variation. In essence, none of the commonly utilized ARC methods that are based upon scaling formally account for the E d component. This is problematic, as our results clearly demonstrate that E d can be highly variable over the landscape given significant variation governed by the nature of anisotropy associated with atmosphere-topography coupling.
Researchers have tried to compensate for this by utilizing other E d parameterization schemes in numerical modeling efforts, based upon assumptions of isotropy and proxy parameters to account for multi-scale topographic effects. Many researchers utilize the representation of E d h for a horizontal surface to represent this irradiance component, although our results demonstrate that the isotropic assumption cannot adequately characterize the anisotropic nature of this component coupled with multi-scale topographic effects. Attempts to compensate for this make use of a topographic-shielding coefficient (i.e., skyview factor), although we demonstrate that one coefficient cannot adequately account for the coupling of diffuse-irradiance anisotropy, local topography and shielding anisotropy. Consequently, all E d h related parameters could not account for the magnitude and spatial variability of our base E d parameterization scheme which accounts for this coupling. Even the popular parameterization scheme of Perez et al. [48] could not account for the coupling, as local topographic information is utilized to account for meso-scale topographic effects.
Our results also revealed the importance of local ( cos I ) and mesoscale ( S t ) topographic effects that are required to adequately characterize atmosphere-topography coupling. The use of proxy topographic parameters to represent anisotropic topographic conditions should not be used. Unfortunately, full computational solutions are required to account for atmosphere-topography anisotropy.
This irradiance component can be integrated into modeling parameterization schemes designed to reduce topographic effects in imagery. The computational complexity involving integration suggest that it may be difficult to characterize this component in a relative way for incorporation into common ARC methods that make use of scaling coefficients, but it is clear that empirical regression analysis of imagery and the use of constant RTP cannot adequately account for atmosphere-topography coupling. Numerical modeling approaches to ARC are most likely required to account for anisotropy and scale dependencies associated with E d and E t .

6.3. Anisotropic Reflectance Correction

ARC represents a radiometric calibration approach that is required to remove topographic effects from multispectral imagery [11]. Researchers are still investigating common ARC methods that use scaling coefficients to accurately estimate surface radiance/reflectance, although the parameterization schemes do not account for a multitude of RTP that characterize surface irradiance and other topographic effects. Richter [8] and others have indicated that atmosphere-topography coupling needed to be accounted for, and our results demonstrate the need to account for other E b sub-parameters and the anisotropic nature of atmosphere-topography coupling associated with E d . It is also unclear the degree to which the E t component will have on image spectral variability, although we speculate that the variance in E t may be relatively high given the scale-dependent coupling of terrain and land cover conditions. Finally, we also speculate that the topographic effects governing the BRDF can cause significant variation in surface reflectance, as the anisotropic nature of E d , E t and land cover structure govern the BRDF. Common ARC methods do not fully account for surface irradiance and the BRDF. Furthermore, scaling methods result in under and/or over correction of surface radiance values that can increase or decrease (i.e., information compression) spectral variation in imagery.
The issue of information compression when using common ARC methods warrants additional research. Image information content is the result of the RTC, where the atmosphere and topographic effects govern irradiance and surface reflection, which is further modified by the atmosphere and sensor, such that a composite signal is recorded. Accurate scaling of the magnitude of surface reflectance in an upward or downward direction dictates that the collective topographic effects that govern lower or higher surface reflectance be accounted for. As previously indicated, ARC methods do not account for the collective topographic effects, given inappropriate parameterization schemes. Accounting for this from a spatial perspective, and assuming similar surface reflectance conditions, differential or anomalous scaling may result in an increase in spectral variation between a pixel and its local neighbors, as the magnitude of the scaling factors did not accurately account for the collective topographic differences between two locations. Conversely, assuming differences in surface reflection conditions, inaccurate scaling at different locations can cause a decrease in spectral variation, as the combination of over and under correction or various magnitudes of under or over correction can decrease spectral variation.
Ultimately, the scaling magnitude for a particular location needs to be based upon the collective topographic effects at that location and the differences between locations. ARC parameterization schemes cannot account for such differences, thereby resulting in problematic reflectance magnitudes and spatial patterns. Overcorrection is easy to identify when anomalous reflectance values exist, however, small/moderate magnitudes of spectral expansion and spectral compression may not be readily apparent from a visual interpretation perspective, and such conditions represent ARC errors. Investigators may incorrectly interpret spectral compression as removal of topographic effects, although it is not clear what topographic effects have been removed or remain (unseen), or if the compression represents a loss of surface reflectance information. More research involving the mapping of spectral expansion and compression locations is warranted, along with the development of new ARC parameterization schemes that account for more topographic effects, as revealed in this study.
Utilizing parameters that represent the relative influence of topographic effects is possible for the direct irradiance component related to atmospheric attenuation, local topographic effects and cast shadows. ARC parameterization schemes could be modified, but would need to be carefully evaluated. Using relative parameters to account for the complexities associated with representing E d and E t are more difficult, as they represent integrations of coupled conditions involving landcover, topography and atmosphere. Furthermore, accurate ARC will require accounting for the BRDF, and there is a strong interdependence between the BRDF and E t , as the BRDF must be known to accurately compute E t , as it is highly scale dependent. Similarly, the BRDF is governed by surface irradiance anisotropy. Consequently, we suggest that numerical modeling approaches may be more effective for addressing the issues associated with ARC, and that the common ARC methods involving scaling, have very limited potential to account for the collective topographic effects, as diagnostics and accuracy assessment for these methods can be highly subjective.
The primary advantage of numerical modeling for ARC is that a multitude of topographic effects can be reasonably simulated to generate irradiance components and anisotropic estimates of the irradiance related to the BRDF. This can assist in simulating more accurate BRDF’s when combined with using empirical BRDF models that are calibrated with satellite imagery. Furthermore, numerical modeling also enables accounting for variations in atmospheric constituents which governs atmosphere-topography coupling. Common ARC scaling methods do not account for such complexities of the RTC.
Simulated imagery of surface reflectance can also be compared to topographically-corrected imagery. In theory, if the collective topographic effects have been correctly accounted for, there should not be any significant correlation between irradiance/synthetic images and corrected imagery, and the magnitudes of surface radiance from the synthetic image should be nearly identical to the corrected imagery. In practice, this is notoriously difficult to accomplish for the follow reasons: (1) ARC scaling methods can result in information compression reducing surface radiance variation, resulting in no correlation between corrected imagery and topographic effects; (2) Different environments exhibit varying degrees of topographic complexity and variation which results in the number and significance of RT parameters that must be accounted for in models to assess topographic effects-ARC methods effectively only account for one RT sub-parameter (i.e., cos i), and most models do not account for anisotropic irradiance parameters and/or the BRDF; (3) Model parameterization schemes may not effectively account for topographic effects, and different parameterization schemes may produce a different variance structure, as simplifications and generalizations are often assumed to accurately characterize topographic effects for a specific RT parameter. Ultimately, comprehensive ARC models need to be developed that take into consideration sensor spatial, spectral and radiometric resolutions, that can govern the nature of topographic effects recorded by imaging sensor systems. More research on sensor modulation of environmental information is sorely needed.

7. Conclusions

Anisotropic reflectance correction of satellite imagery is required to remove the collective multi-scale topographic effects that govern the anisotropic nature of atmosphere-topography coupling of the radiation-transfer cascade in mountain environments. Commonly utilized ARC methods are still being investigated to effectively remove topographic effects, although ARC parameterization schemes and those from numerical modeling efforts have not fully accounted for a variety of topographic effects related to the dominant irradiance components, given the computational complexity associated with spatial analysis and coupled integration of radiation-transfer parameters. Furthermore, it is not clear which topographic effects need to be accounted for, given the variability in locational topographic complexity, and the cumulative synthesis that one topographic effect can have on other topographic effects.
Consequently, we developed radiative-transfer parameterization schemes that account for a more comprehensive treatment of multi-scale topographic effects that govern the direct and diffuse-skylight irradiance components. We then conducted a parameter sensitivity analysis to determine if specific topographic effects or other parameterization schemes can account for the collective topographic effects, using our parameterization scheme as a basis for comparison. We specifically tested many RT parameters that have not been used in commonly used ARC methods, and those that have been used to addressed the limitations associated with ARC in numerical modeling efforts.
As expected, we found that the typical assumptions associated with ARC related to the direct irradiance component, such as the small-angle approximation, atmospheric attenuation and refraction, and solar point-source approximation for characterizing cast shadows, all make a difference in accounting for topographic effects in our simulations. When they were not more accurately accounted for, simulation results could not account for the collective topographic effects and generated statistically different results in terms of irradiance magnitude and variability. Although the cos i parameter is widely utilized in ARC, our simulations and analysis strongly suggest that coupled atmosphere-topographic effects should also be taken into consideration in high relief environments, as well as the variability in the irradiance in the penumbra region of cast shadows. Given that the length of a cast shadow is dependent upon the Earth-Sun distance and relief structure variability, the influence of this parameter can vary temporally.
We also found that the common assumptions of isotropic diffuse-skylight irradiance and the use of a topographic shielding coefficient to represent anisotropic topographic effects could not account for the collective topographic effects in our simulations. We also found this to be true with the Perez anisotropic irradiance parameterization scheme, as it utilizes local topographic conditions as a proxy to mesoscale anisotropic topographic effects. Local topographic conditions were also found to be important in characterizing the collective coupling of atmosphere-topography anisotropy. Although this irradiance component is not adequately accounted for in common ARC methods and numerical modeling efforts, our simulations and analysis strongly suggest that it should be accounted for, as its variability can be relatively high in mountain environments with moderate to high relief, and as it partially governs the anisotropic nature and topographic effects on the BRDF, which also governs spectral variability.
Our results reveal that a multitude of topographic effects govern surface irradiance variations in a synergistic way, and that assumptions, approximations and issues of ARC need to be formally addressed given atmosphere-topography coupling. Collectively, our simulations and analysis strongly suggest that empirical ARC methods that are based upon scaling cannot be used to address the problem of anisotropy and multi-scale topographic effects in mountain environments, given inadequate parameterization schemes. Characterizing and removing radiation-transfer parameter variance components from multispectral imagery will most likely require radiation-transfer modeling efforts. More research is warranted on developing and evaluating new parameterization schemes that more accurately characterize the anisotropic and scale-dependent nature of topographic effects on the surface irradiance and the BRDF. More research investigating the adjacent-terrain irradiance is also warranted in an attempt to understand the influence of this parameter on spectral variability, and in an attempt to better characterize the anisotropic nature of the BRDF. The next phase of our research will be to evaluate the scale-dependencies of the adjacent-terrain irradiance and the topographic effects of surface irradiance variability governing the anisotropic nature of the BRDF.

Author Contributions

Conceptualization, M.P.B. and J.D.C.; methodology, M.P.B., B.W.Y. and J.D.C.; software, M.P.B. and B.W.Y.; writing—original draft preparation, M.P.B., B.W.Y. and J.D.C.; visualization, M.P.B. and B.W.Y.; supervision, M.P.B. All authors have read and agreed to the published version of the manuscript.

Funding

This research received no external funding.

Institutional Review Board Statement

Not applicable.

Informed Consent Statement

Not applicable.

Data Availability Statement

Not applicable.

Acknowledgments

We thank Nathan Timm for generating key figures.

Conflicts of Interest

The authors declare no conflict of interest.

Appendix A. Mathematical Symbol Notation

Table A1. Mathematical symbols used in radiation-transfer cascade calculations.
SymbolUnitsDescription
α [radians]Solar angular width.
α s [radians]Solar elevation angle.
δ [radians]Solar declination.
ϵ dimensionlessObliquity of Earth’s orbit about the Sun.
λ [ μ m]Wavelength of light.
λ l [radians]True longitude of the Earth relative to the vernal equinox.
ϕ [radians]Azimuth angle.
ϕ i [radians]Azimuth angle of hemispherical incident energy.
ϕ s [radians]Solar azimuth angle.
ϕ i e [radians]Effective slope-azimuth angle incident energy accounting for topographic correction.
ϕ v e [radians]Effective slope-azimuth viewing angle accounting for topographic correction.
ρ [kg m 3 ]Density of dry air.
ρ b r d f dimensionlessSurface BRDF.
ρ g dimensionlessGround reflectance averaged over a 5 km radius.
ρ s k y dimensionlessSky reflectance.
θ m a x [radians]Maximum relief angle to the horizon.
θ i [radians]Zenith angle of hemispherical incident energy.
θ s [radians]Solar zenith angle.
θ s , C [radians]Solar zenith angle at scene center.
θ 1 [radians]Near-angle of cast-shadow for extent of umbra.
θ 2 [radians]Far-angle of cast-shadow for extent of penumbra.
θ m a x [radians]Maximum horizon angle.
θ t [radians]Terrain slope angle.
θ v [radians]Viewing zenith angle.
θ i e [radians]Effective zenith angle of incident energy accounting for topographic correction.
θ v e [radians]Effective viewing zenith angle accounting for topographic correction.
θ s g [radians]Geocentric solar zenith angle.
φ [radians]Latitude.
a 1 / a 2 [sr]Solid angle for circumsolar region.
d[km]Distance.
d e s [km]Earth-Sun distance.
E[W m 2 μ m 1 ]Surface irradiance.
E 0 [W m 2 μ m 1 ]Exoatmospheric irradiance.
E ¯ 0 [W m 2 μ m 1 ]Solar irradiance at 1 AU.
E a [W m 2 μ m 1 ]Aerosol scattering irradiance component.
E b [W m 2 μ m 1 ]Direct-beam irradiance from the Sun.
E b n [W m 2 μ m 1 ]Direct normal irradiance.
E d [W m 2 μ m 1 ]Diffuse-skylight irradiance.
E d h [W m 2 μ m 1 ]Diffuse-skylight irradiance for a horizontal surface.
E d p [W m 2 μ m 1 ]Anisotropic diffuse-skylight irradiance.
E d t [W m 2 μ m 1 ]Diffuse-skylight irradiance.
E d g [W m 2 μ m 1 ]Ground/sky backscattering irradiance component.
E d r [W m 2 μ m 1 ]Irradiance due to Rayleigh scattering.
E t [W m 2 μ m 1 ]Adjacent-terrain irradiance.
f r dimensionlessEarth-Sun distance-correction factor.
F 1 dimensionlessHorizontal brightness.
F 2 dimensionlessCircumsolar coefficient.
F a dimensionlessDownward scattered flux.
F r dimensionlessDownward fraction of scattered radiation.
g[m s 2 ]Acceleration due to gravity.
H[radians]Hour angle of the Sun.
i[radians]Solar-terrain incidence angle.
I[radians]Hemispherical incidence angle.
I t [radians]Adjacent terrain incidence angle.
L[W m 2 sr 1 μ m 1 ]Incident surface-reflected radiance.
L [W m 2 sr 1 μ m 1 ]Hemispherical downward diffuse radiance.
L p [m]Length of the penumbra.
L u [m]Length of the umbra.
p[mb]Atmospheric pressure.
R n [km]The nominal solar radius.
R H dimensionlessRelative humidity.
SdimensionlessCoefficient for cast shadows, fraction of E b incident on the landscape.
S b dimensionlessCoefficient for terrain blockage for E t .
S t dimensionlessCoefficient for terrain shielding for E d .
T[K]Temperature.
T a dimensionlessTransmittance due to aerosol scattering.
T a s dimensionlessTransmittance due to aerosol scattering.
T a a dimensionlessTransmittance due to aerosol absorption.
T g dimensionlessTransmittance due to primary gas absorption.
T o dimensionlessTransmittance due to ozone absorption.
T r dimensionlessTransmittance due to Rayleigh scattering.
T w dimensionlessTransmittance due to water vapor absorption.
T dimensionlessTotal downward transmittance.
T t dimensionlessTotal atmospheric transmittance due to terrain relief.
V s k y dimensionlessSkyview-factor coefficient.
X s dimensionlessLongitude-component scalar of the solar azimuth angle.
Y s dimensionlessLatitude-component scalar of the solar azimuth angle.

References

  1. Thomas, Z.A. Using natural archives to detect climate and environmental tipping points in the Earth System. Quat. Sci. Rev. 2016, 152, 60–71. [Google Scholar] [CrossRef]
  2. Harrison, S.; Mighall, T.; Stainforth, D.A.; Allen, P.; Macklin, M.; Anderson, E.; Knight, J.; Mauquoy, D.; Passmore, D.; Rea, B.; et al. Uncertainty in geomorphological responses to climate change. Climactic Chang. 2019, 156, 69–86. [Google Scholar] [CrossRef] [Green Version]
  3. Malhi, Y.; Franklin, J.; Seddon, N.; Solan, M.; Turner, M.G.; Field, C.B.; Knowlton, N. Climate change and ecosystems: Threats, opportunities and solutions. Phil. Trans. R. Soc. B 2019, 375, 1794. [Google Scholar] [CrossRef] [PubMed] [Green Version]
  4. Lohmann, J.; Castellana, D.; Ditlevsen, P.D.; Dijkstra, H.A. Abrupt climate change as a rate-dependent cascading tipping point. Earth Syst. Dyn. 2021, 12, 819–2021. [Google Scholar] [CrossRef]
  5. Liu, J.; Wu, Y.; Gao, X. Increase in occurrence of large glacier-related landslides in the high mountains of Asia. Sci. Rep. 2021, 11, 1635. [Google Scholar] [CrossRef] [PubMed]
  6. Bishop, M.P.; Dobreva, I.D. Geomorphometry and Mountain Geodynamics: Issues of Scale and Complexity. In Integrating Scale in Remote Sensing and GIS; Remote Sensing Applications; Quattrochi, D., Wentz, E.A., Lam, N.S., Emerson, C.W., Eds.; CRC Press: New York, NY, USA, 2017; Chapter 7; pp. 189–228. [Google Scholar]
  7. Bush, A.B.G.; Bishop, M.P.; Huo, D.; Chi, Z.; Tiwari, U. Issues in Climate Analysis and Modeling for Understanding Mountain Erosion Dynamics. In Technology-Driven Geomorphology: Geospatial Data Science, 2nd ed.; Treatise in Geomorphology; Bishop, M.P., Giardino, J.R., Eds.; Elsevier Publishing Inc.: New York, NY, USA, 2022; Volume 1. [Google Scholar] [CrossRef]
  8. Richter, R. Correction of satellite imagery over mountainous terrain. Appl. Opt. 1998, 37, 4004–4015. [Google Scholar] [CrossRef]
  9. Chi, H.; Yan, K.; Yang, K.; Du, S.; Li, H.; Qi, J.; Wei, Z. Evaualtion of topographic correction models based upon 3-D Radiative Transfer Simulation. IEEE Geosci. Remote Sens. Lett. 2021, 19, 3110907. [Google Scholar] [CrossRef]
  10. Jasrotia, A.S.; Kour, R.; Singh, K.K. Effect of Shadow on Atmospheric and Topographic Processed NDSI Values in Chenab Basin, western Himalayas. Cold Reg. Sci. Technol. 2022, 199, 103561. [Google Scholar] [CrossRef]
  11. Bishop, M.P.; Young, B.W.; Colby, J.D.; Furfaro, R.; Chi, Z. Theoretical Evaluation of Anisotropic Reflectance Correction Approaches for Addressing Multi-Scale Topographic Effects on the Radiation Transfer Cascade in Mountain Environments. Remote Sens. 2019, 11, 2728. [Google Scholar] [CrossRef]
  12. Vartiainen, E. A new Approach to Estimating the Diffuse Irradiance on Inclined Surfaces. Renew. Energy 2000, 20, 45–64. [Google Scholar] [CrossRef]
  13. Jia, W.; Pang, Y.; Tortini, R.; Schläpfer, D.; Li, Z.; Roujean, J.L. A Kernel-Driven BRDF Approach to Correct Airborne Hyperspectral Imagery over Forested Areas with Rugged Topography. Remote Sens. 2020, 12, 432. [Google Scholar] [CrossRef] [Green Version]
  14. Chu, Q.; Yan, G.; Qi, J.; Mu, X.; Li, L.; Tong, Y.; Zhou, Y.; Liu, Y.; Xie, D.; Wild, M. Quantitative Analysis of Terrain Reflected Solar Radiation in Snow-Covered Mountains: A Case Study in Southeastern Tibetan Plateau. J. Geophys. Res. Atmos. 2021, 126, e2020JD034294. [Google Scholar] [CrossRef]
  15. Bishop, M.P.; Bush, A.B.G.; Copland, L.; Kamp, U.; Owen, L.A.; Seong, Y.B.; Shroder, J.F., Jr. Climate Change and Mountain Topographic Evolution in the Central Karakoram, Pakistan. Ann. Assoc. Am. Geogr. 2010, 100, 772–793. [Google Scholar] [CrossRef]
  16. Huo, D.; Bishop, M.P.; Young, B.; Chi, Z. Modeling the Feedbacks between Surface Ablation and Morphological Variations on Debris-Covered Baltoro Glacier in the central Karakoram. Geomorphology 2021, 389, 107840. [Google Scholar] [CrossRef]
  17. Smith, J.A.; Lin, T.L.; Ranson, K.J. The Lambertian Assumption and LANDSAT Data. Photogramm. Eng. Remote Sens. 1980, 46, 1183–1189. [Google Scholar]
  18. Teillet, P.M.; Guindon, B.; Goodenough, D.G. On the Slope-Aspect Correction of Multispectral Scanner Data. Can. J. Remote Sens. 1982, 8, 84–106. [Google Scholar] [CrossRef] [Green Version]
  19. Gu, D.; Gillespie, A. Topographic Normalization of Landsat TM Images of Forest Based on Subpixel Sun–Canopy–Sensor Geometry. Remote Sens. Environ. 1998, 64, 166–175. [Google Scholar] [CrossRef]
  20. Soenen, S.A.; Peddle, D.R.; Coburn, C.A. SCS+C: A modified Sun-canopy-sensor topographic correction in forested terrain. IEEE Trans. Geosci. Remote Sens. 2005, 43, 2148–2159. [Google Scholar] [CrossRef]
  21. Cameron, M.; Kumar, L. Diffuse Skylight as a Surrogate for Shadow Detection in High-Resolution Imagery Acquired Under Clear Sky Conditions. Remote Sens. 2018, 10, 1185. [Google Scholar] [CrossRef] [Green Version]
  22. Perez, R.; Stewart, R.; Arbogast, C.; Seals, R.; Scott, J. An anisotropic hourly diffuse radiation model for sloping surfaces: Description, performance validation, site dependency evaluation. Sol. Energy 1986, 36, 481–497. [Google Scholar] [CrossRef]
  23. Proy, C.; Tanré, D.; Deschamps, P.Y. Evaluation of topographic effects in remotely sensed data. Remote Sens. Environ. 1989, 30, 21–32. [Google Scholar] [CrossRef]
  24. Perez, R.; Ineichen, P.; Seals, R.; Michalsky, J.; Stewart, R. Modeling daylight availability and irradiance components from direct and global irradiance. Sol. Energy 1990, 44, 271–289. [Google Scholar] [CrossRef] [Green Version]
  25. Gueymard, C. SMARTS2, a Simple Model of the Atmospheric Radiative Transfer of Sunshine: Algorithms and Performance Assessment; Florida Solar Energy Center: Cocoa, FL, USA, 1995. [Google Scholar]
  26. Zhang, Y.; Li, X.; Wen, J.; Liu, Q.; Yan, G. Improved Topographic Normalization for Landsat TM Images by Introducing the MODIS Surface BRDF. Remote Sens. 2015, 7, 6558–6575. [Google Scholar] [CrossRef] [Green Version]
  27. Dozier, J.; Frew, J. Rapic Calculation of Terrain Parameters for Radiation from Digital Elevation Models. IEEE Trans. Geosci. Remote Sens. 1990, 28, 963–969. [Google Scholar] [CrossRef]
  28. Shepard, J.D.; Dymond, J.R. COrrecting Satellite Imagery for the Variance of Reflectance and Illumination with Topography. Int. J. Remote Sens. 2003, 24, 3503–3514. [Google Scholar] [CrossRef]
  29. Hung, H.; Gong, P.; Clinton, N.; Hui, F. Reduction in Atmospheric and Topographic Effect on Landsat TM Data for Forect CLassification. Int. J. Remote Sens. 2008, 29, 5623–5642. [Google Scholar] [CrossRef]
  30. Wen, J.; Liu, Q.; Xiao, Q.; Liu, Q.; You, D.; Hao, D.; Wu, S.; Lin, X. Characterizing Land Surface Anisotropic Reflectance over Rugged Terrain: A Review of Concepts and Recent Developments. Remote Sens. 2018, 10, 370. [Google Scholar] [CrossRef] [Green Version]
  31. Colby, J.D. Topographic normalization in rugged terrain. Photogramm. Eng. Remote Sens. 1991, 57, 531–537. [Google Scholar]
  32. Bishop, M.P.; Colby, J.D. Topographic normalization of multispectral satellite imagery. In Encyclopedia of Snow, Ice and Glaciers; Springer: Dordrecht, The Netherlands, 2011; pp. 1187–1196. [Google Scholar] [CrossRef]
  33. Li, F.; Jupp, D.L.B.; Thankappan, M.; Lymburner, L.; Mueller, N.; Lewis, A.; Held, A. A physics-based atmospheric and BRDF correction for Landsat data over mountainous terrain. Remote Sens. Environ. 2012, 124, 756–770. [Google Scholar] [CrossRef]
  34. Shroder, J.F., Jr.; Bishop, M.P. Unroofing of the Nanga Parbat Himalaya. In Tectonics of the Nanga Parbat Syntaxis and the Western Himalaya; Number 170 in Special Publication; Khan, M.A., Treloar, P.J., Searle, M.P., Jan, M.Q., Eds.; The Geological Society of London: London, UK, 2000; pp. 163–179. [Google Scholar]
  35. Zeitler, P.K.; Koons, P.O.; Bishop, M.P.; Chamberlain, C.P.; Craw, D.; Edwards, M.A.; Hamidullah, S.; Jan, M.Q.; Khan, M.A.; Khattak, M.U.K.; et al. Crustal Reworking at Nanga Parbat, Pakistan: Metamorphic Consequences of Thermal-Mechanical Coupling Facilitated by Erosion. Tectonics 2001, 20, 712–728. [Google Scholar] [CrossRef]
  36. Bishop, M.P.; Shroder, J.F., Jr.; Bonk, R.; Olsenholler, J. Geomorphic Change in High Mountains: A Western Himalayan Perspective. Glob. Planet. Chang. 2002, 32, 311–329. [Google Scholar] [CrossRef]
  37. Schneider, D.A.; Edwards, M.A.; Kidd, W.S.F.; Asif Khan, M.; Seeber, L.; Zeitler, P.K. Tectonics of Nanga Parbat, western Himalaya: Synkinematic plutonism within the doubly vergent shear zones of a crustal-scale pop-up structure. Geology 1999, 27, 999–1002. [Google Scholar] [CrossRef]
  38. Owen, L.A.; Scott, C.H.; Derbyshire, E. The Quaternary glacial history of Nanga Parbat. Quat. Int. 2000, 65–66, 63–79. [Google Scholar] [CrossRef] [Green Version]
  39. NASA/METI/AIST/Japan Spacesystems; U.S./Japan ASTER Science Team. ASTER GDEM Version 2; Data Set. NASA EOSDIS Land Processes DAAC: Sioux Falls, SD, USA, 2009. [CrossRef]
  40. Berger, A. Long-Term Variations of Daily Insolation and Quaternary Climatic Changes. J. Atmos. Sci. 1978, 35, 2362–2367. [Google Scholar] [CrossRef]
  41. Corbard, T.; Ikhlef, R.; Morand, F.; Meftah, M.; Renaud, C. On the importance of astronomical refraction for modern solar astrometric measurements. Mon. Not. R. Astron. Soc. 2018, 483, 3865–3877. [Google Scholar] [CrossRef]
  42. United Kingdom Hydrographic Office. The Astronomical Almanac for the Year 2013; United Kingdom Hydrographic Office: Taunton, UK; United States Government Printing Office: Washington, DC, USA, 2012.
  43. Bird, R.E.; Riordan, C. Simple Solar Spectral Model for Direct and Diffuse Irradiance on Horizontal and Tilted Planes at the Earth’s Surface for Cloudless Atmospheres. J. Clim. Appl. Meteorol. 1986, 25, 87–97. [Google Scholar] [CrossRef]
  44. Dozier, J.; Bruno, J.; Downey, P. A faster solution to the horizon problem. Comput. Geosci. 1981, 7, 145–151. [Google Scholar] [CrossRef]
  45. Rossi, R.E.; Dungan, J.L.; Beck, L.R. Kriging in the shadows: Geostatistical interpolation for remote sensing. Remote Sens. Environ. 1994, 49, 32–40. [Google Scholar] [CrossRef]
  46. Giles, P.T. Remote sensing and cast shadows in mountainous terrain. Photogramm. Eng. Remote Sens. 2001, 67, 833–839. [Google Scholar]
  47. Meftah, M.; Corbard, T.; Hauchecorne, A.; Morand, F.; Ikhlef, R.; Chauvineau, B.; Renaud, C.; Sarkissian, A.; Damé, L. Solar radius determined from PICARD/SODISM observations and extremely weak wavelength dependence in the visible and the near-infrared. Astron. Astrophys. 2018, 616, A64. [Google Scholar] [CrossRef]
  48. Perez, R.; Seals, R.; Ineichen, P.; Stewart, R.; Menicucci, D. A New Simplified Version of the Perez DIffuse Irradiance MOdel for Tilted Surfaces. Sol. Energy 1987, 39, 221–231. [Google Scholar] [CrossRef] [Green Version]
  49. Maleki, S.A.M.; Hizam, H.; Gomes, C. Estimation of Hourly, Daily and Monthly Global Solar Radiation on Inclined Surfaces: Models Re-Visited. Energies 2017, 10, 134. [Google Scholar] [CrossRef] [Green Version]
  50. Tian, Z.; Perers, B.; Furbo, S.; Fan, J.; Deng, J.; Dragsted, J. A Comprehensive Approach for Modelling Horizontal Diffuse Radiation, Direct Normal Irradiance and Total Tilted Solar Radiation Based on Global Radiation under Danish Climate Conditions. Energies 2018, 11, 1315. [Google Scholar] [CrossRef] [Green Version]
  51. Darlu, S.; Kittler, R. CIE Gneral sky standard Defining Luminaance Distributions. In Proceedings of the Canadian Conference on Building Energy, Montreal, QC, Canada, 12–13 September 2002; pp. 1–8. [Google Scholar]
  52. Wang, Z.; Bovik, A.C.; Sheikh, H.R.; Simoncelli, E.P. Image quality assessment: From error measurement to structural similarity. IEEE Trans. Image Process. 2004, 13, 600–612. [Google Scholar] [CrossRef] [PubMed] [Green Version]
  53. Pimple, U.; Sitthi, A.; Simonetti, D.; Pungkul, S.; Leadprathom, K.; Chidthaisong, A. Topographic Correction of Landsat TM-5 and Landsat OLI-8 Imagery to Improve Performance of Forest CLassification in the Mountainous Terrain of Northeast Thailand. Sustainability 2017, 9, 258. [Google Scholar] [CrossRef] [Green Version]
  54. Fan, W.; Li, J.; Liu, Q.; Zhang, Q.; Yin, G.; Li, A.; Zeng, Y.; Xu, B.; Xu, X.; Zhou, G.; et al. Topographic Correction of Forest Image Data Based on the Canopy Reflectance Model for Sloping Terrains in Multiple Forward Mode. Remote Sens. 2018, 10, 717. [Google Scholar] [CrossRef]
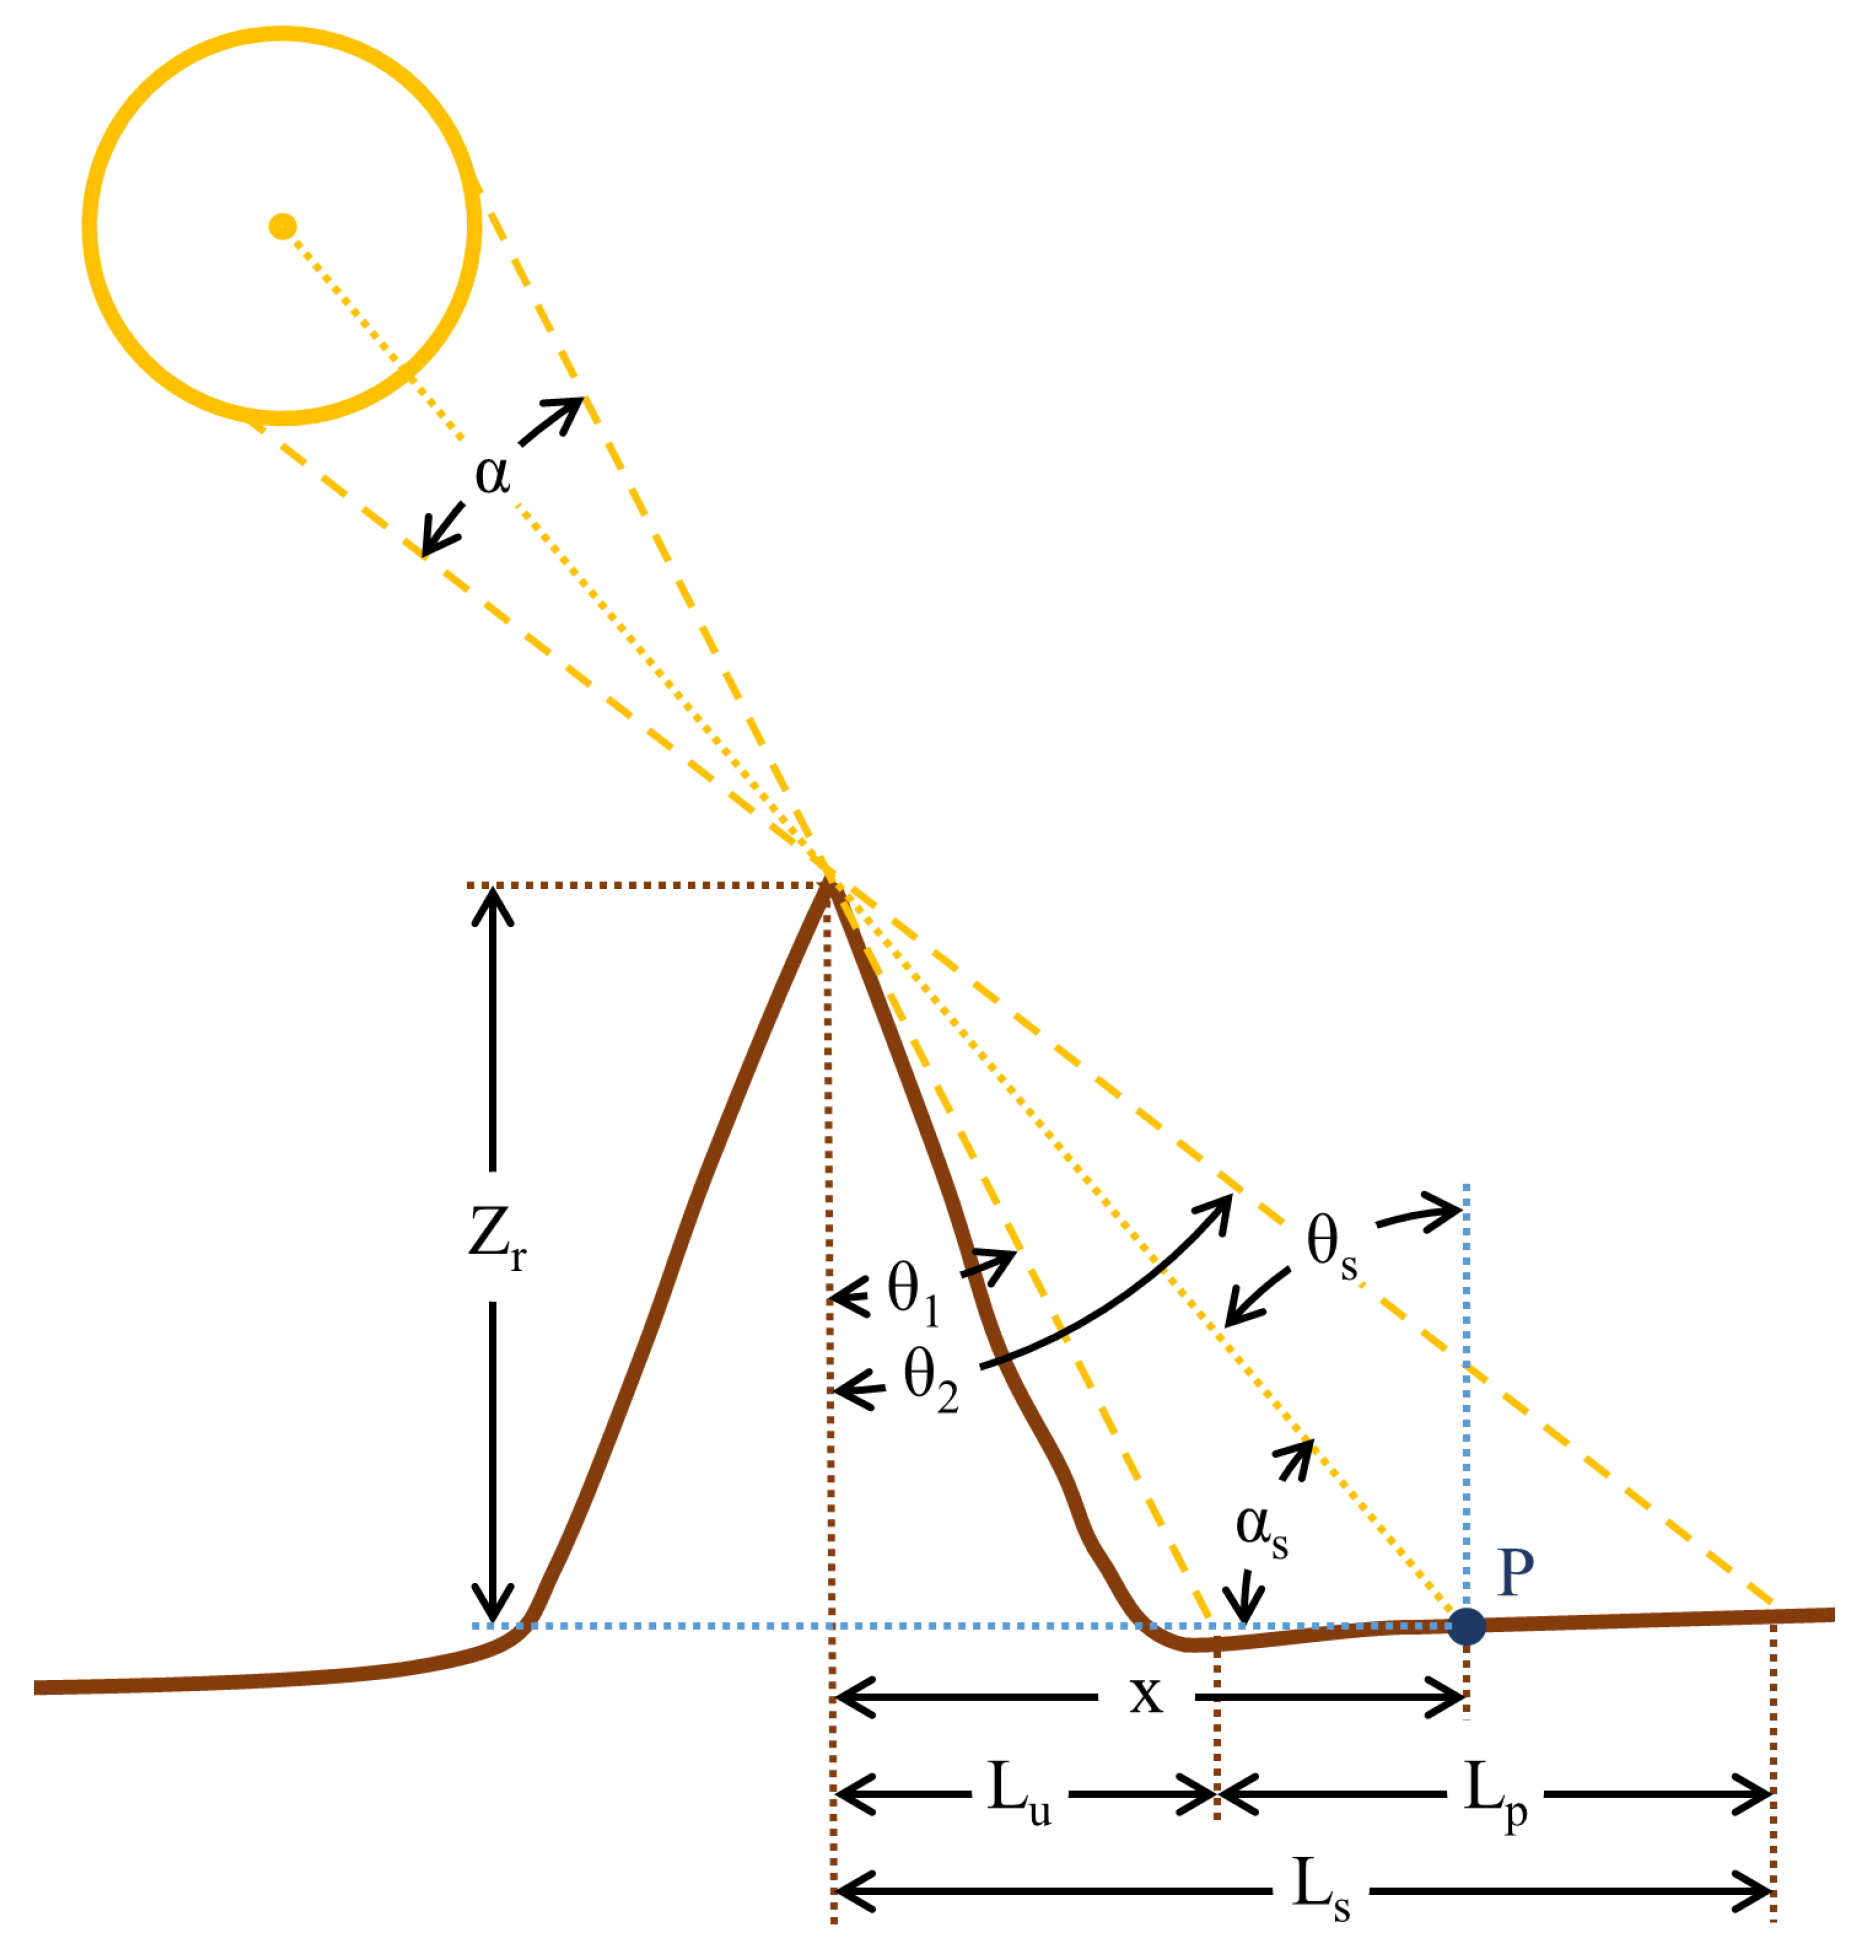
Figure 1. Cast shadow diagram depicting geometry parameters used to simulate the umbra and the penumbra regions of a cast shadow.
Remotesensing 14 05339 g001
Figure 2. Cast shadow simulation results depicting two parameterization schemes in the upper region of the Diamir Basin on the northwestern side of Nanga Parbat on 15 September 2022 at 10:00 a.m. (A). Cast shadow depiction based upon the solar point-source assumption. Cast shadows are depicted in blue over the cos i image that depicts terrain self-shadowing. (B). Cast shadow accounting for the solar disk and differentiation of the umbra (blue) and penumbra (green) regions of the cast shadow. Cast shadows are depicted over the cos i image that depicts terrain self-shadowing.
Remotesensing 14 05339 g002
Figure 3. Direct irradiance simulation results over the Nanga Parbat Massif on 15 September 2022 at 10:00 a.m. (A). The green portion of the electromagnetic spectrum ( λ = 0.56141 μ m). (B). The red portion of the electromagnetic spectrum ( λ = 0.65459 μ m). (C). The near-infrared portion of the electromagnetic spectrum ( λ = 0.86467 μ m). The direct irradiance is superimposed over cos i using 50-percent transparency.
Remotesensing 14 05339 g003
Figure 4. Simulated anisotropic diffuse-skylight irradiance ( E d ; λ = 0.56141 μ m) over the Nanga Parbat Massif. Simulations do not account for local topographic conditions. (A). E d in the Indus Valley ( φ = 35 ° 25 21 . 288808 ; λ l = 74 ° 15 28 . 975978 ; Integrated E d = 446.8952 W m 2 μ m 1 ). Simulation does not account for topographic shielding. (B). E d at the top of Nanga Parbat ( φ = 35 ° 14 17 . 959960 ; λ l = 74 ° 35 21 . 994192 ; Integrated E d = 301.1555 W m 2 μ m 1 ). Simulation does not account for topographic shielding. (C). E d in the Diamir Valley ( φ = 35 ° 19 29 . 8059 ; λ l = 74 ° 21 17 . 9631 ). Simulation over a V-shaped valley. (D). E d in the Raikot valley ( φ = 35 ° 26 20 . 658178 ; λ l = 74 ° 35 58 . 803448 ). Simulation over a V-Shaped valley. (E). E d in the Rupal Valley ( φ = 35 ° 11 17 . 921638 ; λ l = 74 ° 35 58 . 483795 ). Simulation over a U-shaped valley. (F). E d in the Sachen Valley ( φ = 35 ° 19 41 . 854361 ; λ l = 74 ° 44 45 . 984769 ). Simulation over a U-Shaped valley. All simulations were computed with an average ground reflectance value of 0.75.
Remotesensing 14 05339 g004
Figure 5. Diffuse-skylight irradiance simulation results over the Nanga Parbat Massif on 15 September 2022 at 10:00 a.m. (A). The green portion of the electromagnetic spectrum ( λ = 0.56141 μ m). (B). The red portion of the electromagnetic spectrum ( λ = 0.65459 μ m). (C). The near-infrared portion of the electromagnetic spectrum ( λ = 0.86467 μ m). The irradiance is superimposed over cos i using 50-percent transparency.
Remotesensing 14 05339 g005
Table 1. Atmospheric refraction in arcseconds as a function of observed zenith angles for different approximations of the refraction integral ( F I ) at Calern Observatory. Results are based upon a standard atmosphere model for λ = 782.2 nm, T = 15 °C, p = 875 hPa, R H = 50 %, ϕ = 43 ° 45 7 , and h = 1323 m, where λ represents wavelength, T is temperature, p is pressure, R H is relative humidity, φ is latitude and h is altitude. Data based upon Corbard et al. [41]. t a n 5 represents the truncation of the expansion in the odd power-of-tangent refraction model that accounts for topographic, atmospheric and wavelength parameters, and A A represents the refraction formulation in United Kingdom Hydrographic Office [42] that only accounts for temperature and pressure. The parameters γ 1 and γ 2 represent t a n 5 F I and A A F I , respectively.
θ s tan 5 δ 1 AA δ 2 FI
108.617−0.0018.7700.1528.618
3028.205−0.00328.7160.50828.208
5058.145−0.00559.2741.12458.150
70133.087−0.007137.0944.000133.094
80267.6630.252271.2243.813267.411
85512.14717.971503.3939.217494.176
Table 2. Vertical profiles and effective pathlengths for the U.S Standard Atmosphere at latitude 35 ° 14 17.904126 . Parameters in the table represent altitude (z), temperature (T), pressure (p), density of dry air ( ρ ), gravitational acceleration (g), relative humidity ( R H ), oxygen (O 2 ), carbon dioxide (CO 2 ), precipitable water (H 2 O), and ozone (O 3 ). The latitude location represents the center of the study area scene.
Atmosphere Vertical ProfilesAtmospheric Effective Pathlengths
zTp ρ g RH O 2 CO 2 H 2 O 3
[km][K][mb][kg m 3 ][m s 2 ][%][km][km][cm][atm-cm]
0288.201013.251.22509.800655.04.92924.86551.42200.3434
1281.71898.841.11179.797550.13.94903.77250.8625
2275.23795.151.00669.794446.73.14762.90820.5231
3268.77701.410.90939.791344.52.49562.22830.3173
4262.31616.850.81949.788343.41.96761.69650.1924
5255.85540.780.73659.785243.61.54221.28290.1167
6249.39472.510.66029.782145.11.20140.96330.0708
7242.93411.420.59019.779148.10.92990.71800.0429
8236.48356.920.52599.776053.00.71490.53100.0260
9230.07308.430.46719.772960.40.54560.38960.0158
Table 3. Simulation and control scenario (SS) descriptions for generating estimates of irradiance components. Control parameters ( P c ) for a scenario were included ( i ) or excluded ( x ) for comparison to a more fully comprehensive parameterization scheme.
SS P c Description
E b
S1S1 θ s , C i Solar zenith angle only at scene center.
S1S2 P x Parallax correction omitted.
S1S3 R x Atmospheric refraction correction omitted.
S1S4 P x , R x Parallax and refraction corrections omitted.
S1S5 T , x Total downward Atmospheric transmittance term omitted.
S1S6 ( cos i ) x Cosine of the incidence angle omitted.
S1S7 S a x Cast shadows using solar disk omitted.
S1S8 S p i Cast shadows using point-source assumption.
S1S9 E b Base for comparisons using Equation (2).
E d
S2S1 E d r x Skylight irradiance of Rayleigh component omitted.
S2S2 E d a x Skylight irradiance of aerosol component omitted.
S2S3 E d g x Skylight irradiance of ground scattering component omitted.
S2S4 E d h i Isotropic skylight irradiance computed as on a horizontal surface.
S2S5 E d t i Isotropic skylight irradiance using shielding coefficient.
S2S6 E d p i Perez skylight irradiance model.
S2S7 ( cos I ) x Local topographic effects omitted.
S2S8 S t x Meso-scale topographic shielding omitted.
S2S9 E d Base for comparisons using Equation (4).
Table 4. Simulation and control scenario (SS) statistical results for direct irradiance. Control parameters ( P c ) for a scenario were included ( i ) or excluded ( x ) for comparison to a more fully comprehensive parameterization scheme ( E b ). Statistical parameter symbols include the minimum irradiance ( M i n , [W m 2 μ m 1 ]), maximum irradiance ( M a x , [W m 2 μ m 1 ]), mean irradiance ( μ ¯ , [W m 2 μ m 1 ], standard deviation ( σ ), root-mean-squared error (RMSE, [W m 2 μ m 1 ]), structural similarity Index (SSI), t-statistic (t), and the variance ratio (F). Control parameters symbols are defined in the methodology and symbol notation table in Appendix A (Table 3 and Table A1). All inferential tests using the t-statistic and F-ratio were significant at the p = 0.0001 level for all regions of the spectrum, indicating that the magnitude and variance structure of direct irradiance is significantly different when parameters characterizing topographic effects are not accounted for, or when a different parameterization scheme is used.
SS P c Min Max μ ¯ σ RMSESSItF
λ = 0.56141 [ μ m]
S1S1 θ s , C i 0.001102.29681.00283.7055.460.99243.851.16
S1S2 P x 0.001109.92680.99283.8955.050.99243.831.15
S1S3 R x 0.001109.85680.72283.9755.270.99245.091.15
S1S4 P x , R x 0.001109.86680.74283.9655.250.99244.991.15
S1S5 T , x 0.001363.54837.55349.15114.570.97−456.170.76
S1S6 ( cos i ) x 0.001110.231075.77167.42447.930.11−1976.823.32
S1S7 S a x 0.001109.92683.35279.2260.080.98234.301.19
S1S8 S p i 0.001109.92680.99283.8855.140.99243.831.15
S1S9 E b 0.001192.28731.80305.080.001.000.001.00
λ = 0.65459 [ μ m]
S1S1 θ s , C i 0.00993.76613.96255.7728.430.99139.081.09
S1S2 P x 0.001000.20613.94255.9327.860.99139.111.09
S1S3 R x 0.001000.16613.71256.0128.040.99140.321.08
S1S4 P x , R x 0.001000.16613.73256.0028.020.99140.221.08
S1S5 T , x 0.001135.56697.52290.7862.690.99−293.350.84
S1S6 ( cos i ) x 0.001000.46969.86150.94415.180.11−2155.283.12
S1S7 S a x 0.001000.19616.07251.7335.310.99128.621.12
S1S8 S p i 0.001000.19613.94255.9228.000.99139.101.09
S1S9 E b 0.001041.86639.65266.660.001.000.001.00
λ = 0.86467 [ μ m]
S1S1 θ s , C i 0.00639.14394.87164.506.460.9942.851.03
S1S2 P x 0.00642.97394.86164.605.450.9942.941.03
S1S3 R x 0.00642.96394.72164.655.560.9944.101.03
S1S4 P x , R x 0.00642.96394.73164.655.550.9944.001.03
S1S5 T , x 0.00671.43412.43171.9313.580.99−104.710.94
S1S6 ( cos i ) x 0.00643.13623.7797.07273.960.10−2321.122.95
S1S7 S a x 0.00642.97396.23161.8914.990.9931.511.06
S1S8 S p i 0.00642.97394.86164.595.730.9942.921.03
S1S9 E b 0.00651.13399.89166.700.001.000.001.00
Table 5. Simulation and control scenario (SS) statistical results for diffuse-skylight irradiance. Control parameters ( P c ) for a scenario were included ( i ) or excluded ( x ) for comparison to a more fully comprehensive parameterization scheme (diffuse-skylight irradiance in bold). Statistical parameter symbols include the minimum irradiance ( M i n , [W m 2 μ m 1 ]), maximum irradiance ( M a x , [W m 2 μ m 1 ]), mean irradiance ( μ ¯ , [W m 2 μ m 1 ], standard deviation ( σ ), root-mean-squared error ( RMSE , [W m 2 μ m 1 ]), structural similarity Index ( SSI ), t-statistic (t), and the variance ratio (F). Control parameters symbols are defined in the methodology and symbol notation table in Appendix A (Table 3 and Table A1). All inferential tests using the t-statistic and F-ratio were significant at the p = 0.0001 level for all regions of the spectrum, indicating that the magnitude and variance structure of diffuse irradiance is significantly different when parameters characterizing topographic effects are not accounted for, or when a different parameterization scheme is used.
SS P c Min Max μ ¯ σ RMSESSItF
λ = 0.56141 μ m
S2S1 E d r x 19.24144.8999.5619.1437.490.84142268.841.85
S2S2 E d a x 10.6797.8458.1611.9279.480.36655454.764.77
S2S3 E d g x 22.07166.54114.6721.9522.040.94831264.841.40
S2S4 E d h i 142.41190.18165.367.5339.420.0031−2153.7511.95
S2S5 E d t i 41.37180.06138.2112.0924.120.1184−140.604.63
S2S6 E d p i 100.99245.08172.2726.3338.040.7567−1949.390.98
S2S7 ( cos I ) x 38.07339.38218.0332.3583.970.5219−3942.420.65
S2S8 S t x 72.39222.37154.9626.1621.700.8197−1017.370.99
S2S9 E d 25.99199.78136.2026.010.001.00000.001.00
λ = 0.65459 μ m
S2S1 E d r x 11.0882.4657.3311.0017.380.89021894.181.66
S2S2 E d a x 4.9946.1727.345.6347.850.27696162.256.33
S2S3 E d g x 12.3692.0263.9612.2210.590.96281106.971.34
S2S4 E d h 79.03101.5890.213.5321.490.0010−2177.1816.09
S2S5 E d t 22.7196.3275.416.4213.160.1179−140.344.86
S2S6 E d p 57.46135.2295.8114.4922.570.7335−2121.240.96
S2S7 ( cos I ) x 20.82185.75118.9917.7145.850.5206−3939.700.64
S2S8 S t x 39.63118.8184.5414.1211.800.8200−1022.001.01
S2S9 E d 14.21108.1974.3214.170.001.00000.001.00
λ = 0.86467 μ m
2S1 E d r x 3.3824.5217.333.323.500.95241322.801.42
S2S2 E d a x 1.049.525.611.1815.410.19157329.2111.31
S2S3 E d g x 3.6026.5218.553.542.240.9839827.401.25
S2S4 E d h 22.5727.6425.170.805.990.0001−2194.1524.30
S2S5 E d t 6.3826.3621.051.763.680.1378−139.415.05
S2S6 E d p 16.8038.0327.254.096.810.7103−2285.810.94
S2S7 ( cos I ) x 5.8851.8733.224.9912.810.5261−3919.380.63
S2S8 S t x 11.0532.3223.593.903.280.8214−1024.321.03
S2S9 E d 4.0129.7520.743.960.001.00000.001.00
Publisher’s Note: MDPI stays neutral with regard to jurisdictional claims in published maps and institutional affiliations.