Technical Note

Plant and Animal Species Recognition Based on Dynamic Vision Transformer Architecture

School of Computer and Communication Engineering, University of Science and Technology Beijing, Beijing 100083, China
*
Author to whom correspondence should be addressed.
Remote Sens. 2022, 14(20), 5242; https://doi.org/10.3390/rs14205242
Submission received: 17 September 2022 / Revised: 16 October 2022 / Accepted: 18 October 2022 / Published: 20 October 2022
(This article belongs to the Special Issue Remote Sensing Applications in Vegetation Classification)

Abstract

:
Automatic prediction of the plant and animal species most likely to be observed at a given geo-location is useful for many scenarios related to biodiversity management and conservation. However, the sparseness of aerial images results in small discrepancies in the image appearance of different species categories. In this paper, we propose a novel Dynamic Vision Transformer (DViT) architecture to reduce the effect of small image discrepancies for plant and animal species recognition by aerial image and geo-location environment information. We extract the latent representation by sampling a subset of patches with low attention weights in the transformer encoder model with a learnable mask token for multimodal aerial images. At the same time, the geo-location environment information is added to the process of extracting the latent representation from aerial images and fused with the token with high attention weights to improve the distinguishability of representation by the dynamic attention fusion model. The proposed DViT method is evaluated on the GeoLifeCLEF 2021 and 2022 datasets, achieving state-of-the-art performance. The experimental results show that fusing the aerial image and multimodal geo-location environment information contributes to plant and animal species recognition.

Graphical Abstract

1. Introduction

With the development of computer vision, pattern recognition, and deep learning, plant and animal species recognition technologies [1,2,3,4,5,6] based on aerial images also have been constantly improving, and are being applied in various fields. In the tasks of understanding the geographical distribution of plant and animal species and protecting species diversity, it is of positive significance to identify species and their surrounding environmental characteristics through aerial images.
In contrast to traditional image classification [7,8,9,10,11,12], the discrepancies between aerial images of different plant and animal species categories are small, which is a typical Fine-Grained Visual Categorization (FGVC) task; also, the proportion of plant and animal pixels is relatively small in the global image due to the sparsity of aerial images. Therefore, in the plant and animal species recognition task based on aerial images, even though the aerial images have both RGB and near-infrared (NIR) modal data, it is almost difficult to distinguish species classes if we rely on image information alone. Currently, the optimization of species recognition by introducing additional information has become a hot research topic. Currently, common additional information includes the geographic and temporal information of the image capturing [13,14,15,16,17], and studies have shown that geographic and temporal information can improve the accuracy of FGVC in BirdSnap [18], PlantCLEF [19], FungiCLEF [20], YFCC100M [21], iNaturalist [22,23,24], and GeoLifeCLEF [25] datasets.
However, most of the current research approaches extract potential embedding of images by Convolutional Neural Networks (CNN) and finally classify the concatenation of location, date, and image embedding for species identification [15,26,27,28]. Alternatively, feature summation [13], multiplication [14,29], and dynamic projecting [17] are used to fuse image embedding and location–date features. Although these methods have achieved excellent results, most of these methods only consider the fusion of image and location–date features in a single dimension. While dynamically projecting approaches construct high-dimensional interactions between multimodal representations, mapping similar image features to different locations in the feature space suggests accurate classification accuracy. However, this is also a fusion method after feature extraction from different modal data; also, these methods only consider the enhancement of image features by location–date multimodal embedding of images without considering the influence of the surrounding environment features, which is, of course, related to the common fine-grained image classification dataset.
To further exploit the potential impact of additional information, we propose to incorporate it into the process of extracting image latent embedding while introducing additional information into the fusion of the extracted multimodal features. Due to the similarity in image appearance, the distinguishability of the images’ latent features extracted by the network model is insufficient if the image classes are the same. Especially, when the locations of the aerial images are close to each other, it is still difficult for the existing multimodal fusion methods to distinguish species classes. However, when extracting image embedding by the CNN model, it is again difficult for us to interact with the additional information during the image feature-extraction process. With the widespread use of Visual Transformer (ViT) [30] in the image field [31,32,33,34,35,36,37,38,39], its unique learning approach makes it possible to introduce additional information into the extraction process of image potential embedding. In this paper, we propose a Dynamic Vision Transformer (DViT) architecture to dynamically enhance the latent representation of image embedding by additional environmental information of the location.
Specifically, in the potential embedding extraction of aerial images, the multimodal aerial images of the RGB and NIR are input into the transformer encoder model with the Learnable Mask Token (LMT), respectively. The mask token has learned the attention weight. Then, we mask the low-weight patches to extract the latent representations of the local regions with high attention weights. At the same time, the location environment embedding by multi-layer perceptron (MLP) is added to the process of extracting the latent representation and fused with the token with high attention weights to improve the distinguishability of the aerial images’ latent representation by the dynamic attention fusion (DAF) model. Finally, the enhanced latent representations by additional location environment embedding of RGB and NIR images are fused for multimodal species recognition. We evaluated DViT on the GeoLifeCLEF 2021 and 2022 datasets, achieving state-of-the-art performance.
In summary, this paper attempts to propose a DViT model combining multimodal aerial images and location environment information to reduce the effect of small image discrepancies for multimodal species recognition. The main contributions of this paper are summarized as follows:
  • This paper analyzed the impact of additional location environment information for fine-grained image classification on multimodal species recognition.
  • This paper is the first study that combines a visual transformer with the LMT and DAF and proposes a DViT architecture, which utilizes the multimodal aerial remote sensing image and location environment information to reduce the effect of small image discrepancies.
  • Our approach consistently achieved state-of-the-art (SOTA) results on multiple datasets compared to existing published works, especially with top-30 error rates of 0.7297 and 0.6567 for the GeoLifeCLEF 2021 and 2022 private test sets, respectively.
The remainder of this paper is organized as follows: Section 2 provides a brief review of the related research on species recognition; Section 3 provides a complete introduction to the proposed algorithm; Section 4 shows the datasets, details, and results of the experiment; and, finally, Section 5 presents the conclusions of this research method.

2. Related Work

In this section, we review existing works on species recognition based on FGVC tasks that only deal with images based on CNN. Then, we introduce the development of the ViT model to species recognition. Finally, we summarize multimodal species recognition works that incorporate additional information. This section provides an overview of the relevance of the different methods.

2.1. Image Species Recognition Based on CNN

In image-based species recognition, there are two main types of species recognition: one is species recognition based on ordinary optical images [40,41,42,43,44], and the other is species recognition based on remote sensing images [45,46,47,48,49]. The current research mainly focuses on the species recognition of ordinary optical images; however, both species recognition from optical images and species recognition from aerial images are important. Since there is very little difference between species classes, the current image-based species recognition all belongs to FGVC tasks. To improve the performance of image-based species recognition, the existing works are mainly divided into the following aspects. First, end-to-end learning [50,51,52,53,54,55] is used to extract the global features of images with more robustness. Second, it is shown that recognition performance can be improved by locating discriminative regions of interest in an image and then extracting local minutiae features of interest [56,57,58,59,60,61,62]. Third, additional research extracts more discriminative image representations by contrast learning [63,64,65,66,67].

2.2. Image Species Recognition Based on ViT

With the widespread use of ViT in the image field, the ViT model patched the image and input these patches into the multi-head self-attention (MSA) model to obtain image embedding for classification. The MSA can focus on the weights of local regions of the image, enabling the model to extract local fine features. Researchers have started to introduce ViT to fine-grained image classification tasks [68,69,70,71,72]. He et al. [72] proposed a transformer-based framework, TransFG, which improves the classification performance by accurately and efficiently selecting image blocks with high differentiation by attention weights. Liu et al. [71] proposed a transformer architecture with a peak suppression module and knowledge guidance module. The model learns the most discriminative image local features to enhance the information utilization of the ignored regions by the attention model. Cai et al. [68] proposed a ViT with adaptive attention. The model consists of two main components: attention-weakening and attention-enhancement modules, which improve the performance of key features while capturing more feature information.

2.3. Multimodal Species Recognition

In species recognition, in addition to improving classification performance through models, much of the existing work is now beginning to focus on the extraction of additional information on model performance. The construction of multimodal datasets, such as BirdSnap [18], PlantCLEF [19], FungiCLEF [20], YFCC100M [21], iNaturalist [22,23,24], and GeoLifeCLEF [25], provides more possibilities to improve classification performance. These datasets usually include information such as images, locations, and dates of species. The GeoLifeCLEF also includes more multifaceted metadata, such as land cover, altitude, bioclimatic, pedologic, etc. These multimodal data provide more opportunities to improve classification performance [73,74,75,76,77]. Current research on multimodal species recognition performs multimodal feature fusion by feature concatenation, summation, multiplication, and dynamic weighting.
Kevin et al. [15] used multimodal information for the first time in the FGVC task. They used concatenated image representation extracted by CNN and location representation extracted by multi-layer perceptron (MLP) for classification. Chu et al. [13] proposed a Geo-Aware Network that fuses image representation with geo-location representation in a summation manner. The classification performance is then enhanced by a series of post-processing models. Oisin et al. [14] use geo-location and temporal representation extracted by MLP as effective spatio-temporal prior knowledge to fuse with image representation by multiplication. Terry et al. [29] performed species recognition by multiplying image representation and metadata representation. Yang et al. [17] proposed a Dynamic MLP model to enhance classification performance by projecting multimodal features to image features through dynamic mapping. A summary of the multimodal fusion methods is shown in Table 1.
Although these methods have achieved excellent results by fusing multimodal information, all these methods extract features of different modalities by models before fusion. In contrast, our framework introduces multimodal information into the image feature-extraction process to improve the distinguishability of potential representations of aerial images.

3. Methodology

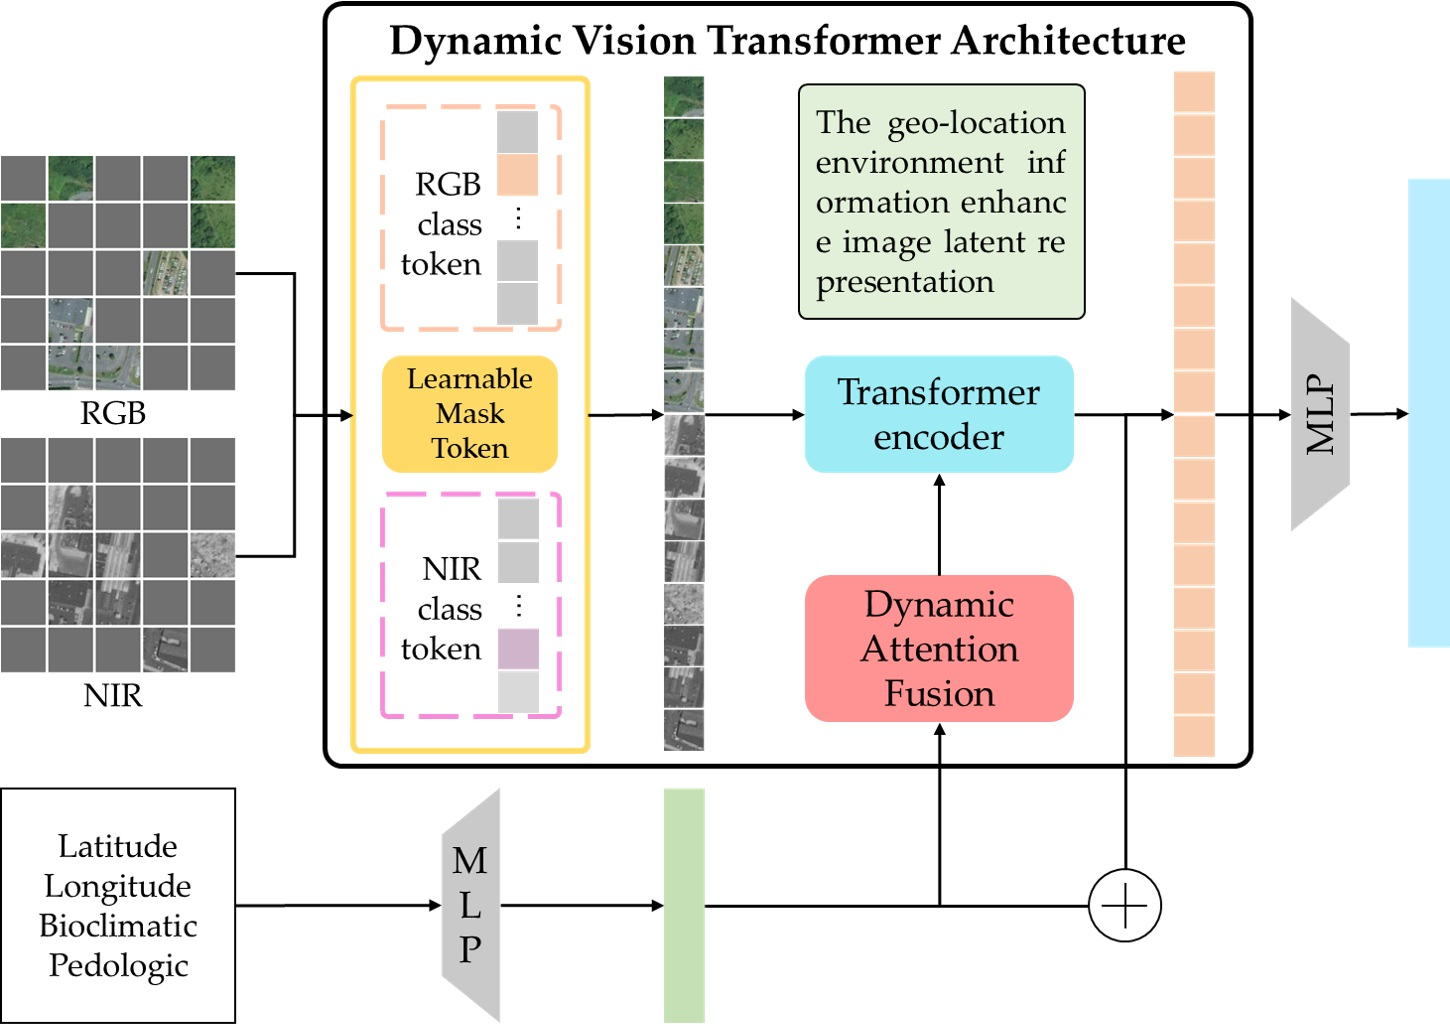
In this section, we introduce a multimodal fusion framework for species recognition by aerial images and location environment information. The framework contains an RGB image path, an NIR image path, and a location environment path, taking as input the aerial images and the multimodal location environment information, respectively. First, the aerial image embedding is extracted by vision transformers with the LMT module, while the multimodal location environment embedding is derived by the MLP backbone network. Then the geo-location environment information is added to the process of extracting the latent representation. Finally, the DAF module adaptively performs projection location environmental embedding of the latent representations of aerial images to produce final species predictions.

3.1. Framework

The complete network structure we designed is shown in Figure 1. The aerial images used the Dynamic Transformer Encoder model to extract visual embedding, and the location environment embedding is extracted by the MLP block. Then, different from previous embedding fusion works, the DAF is used to enhance the ability of the image patch embedding. We dynamically project multimodal location environment embedding into the image tokens to enhance the image representation.
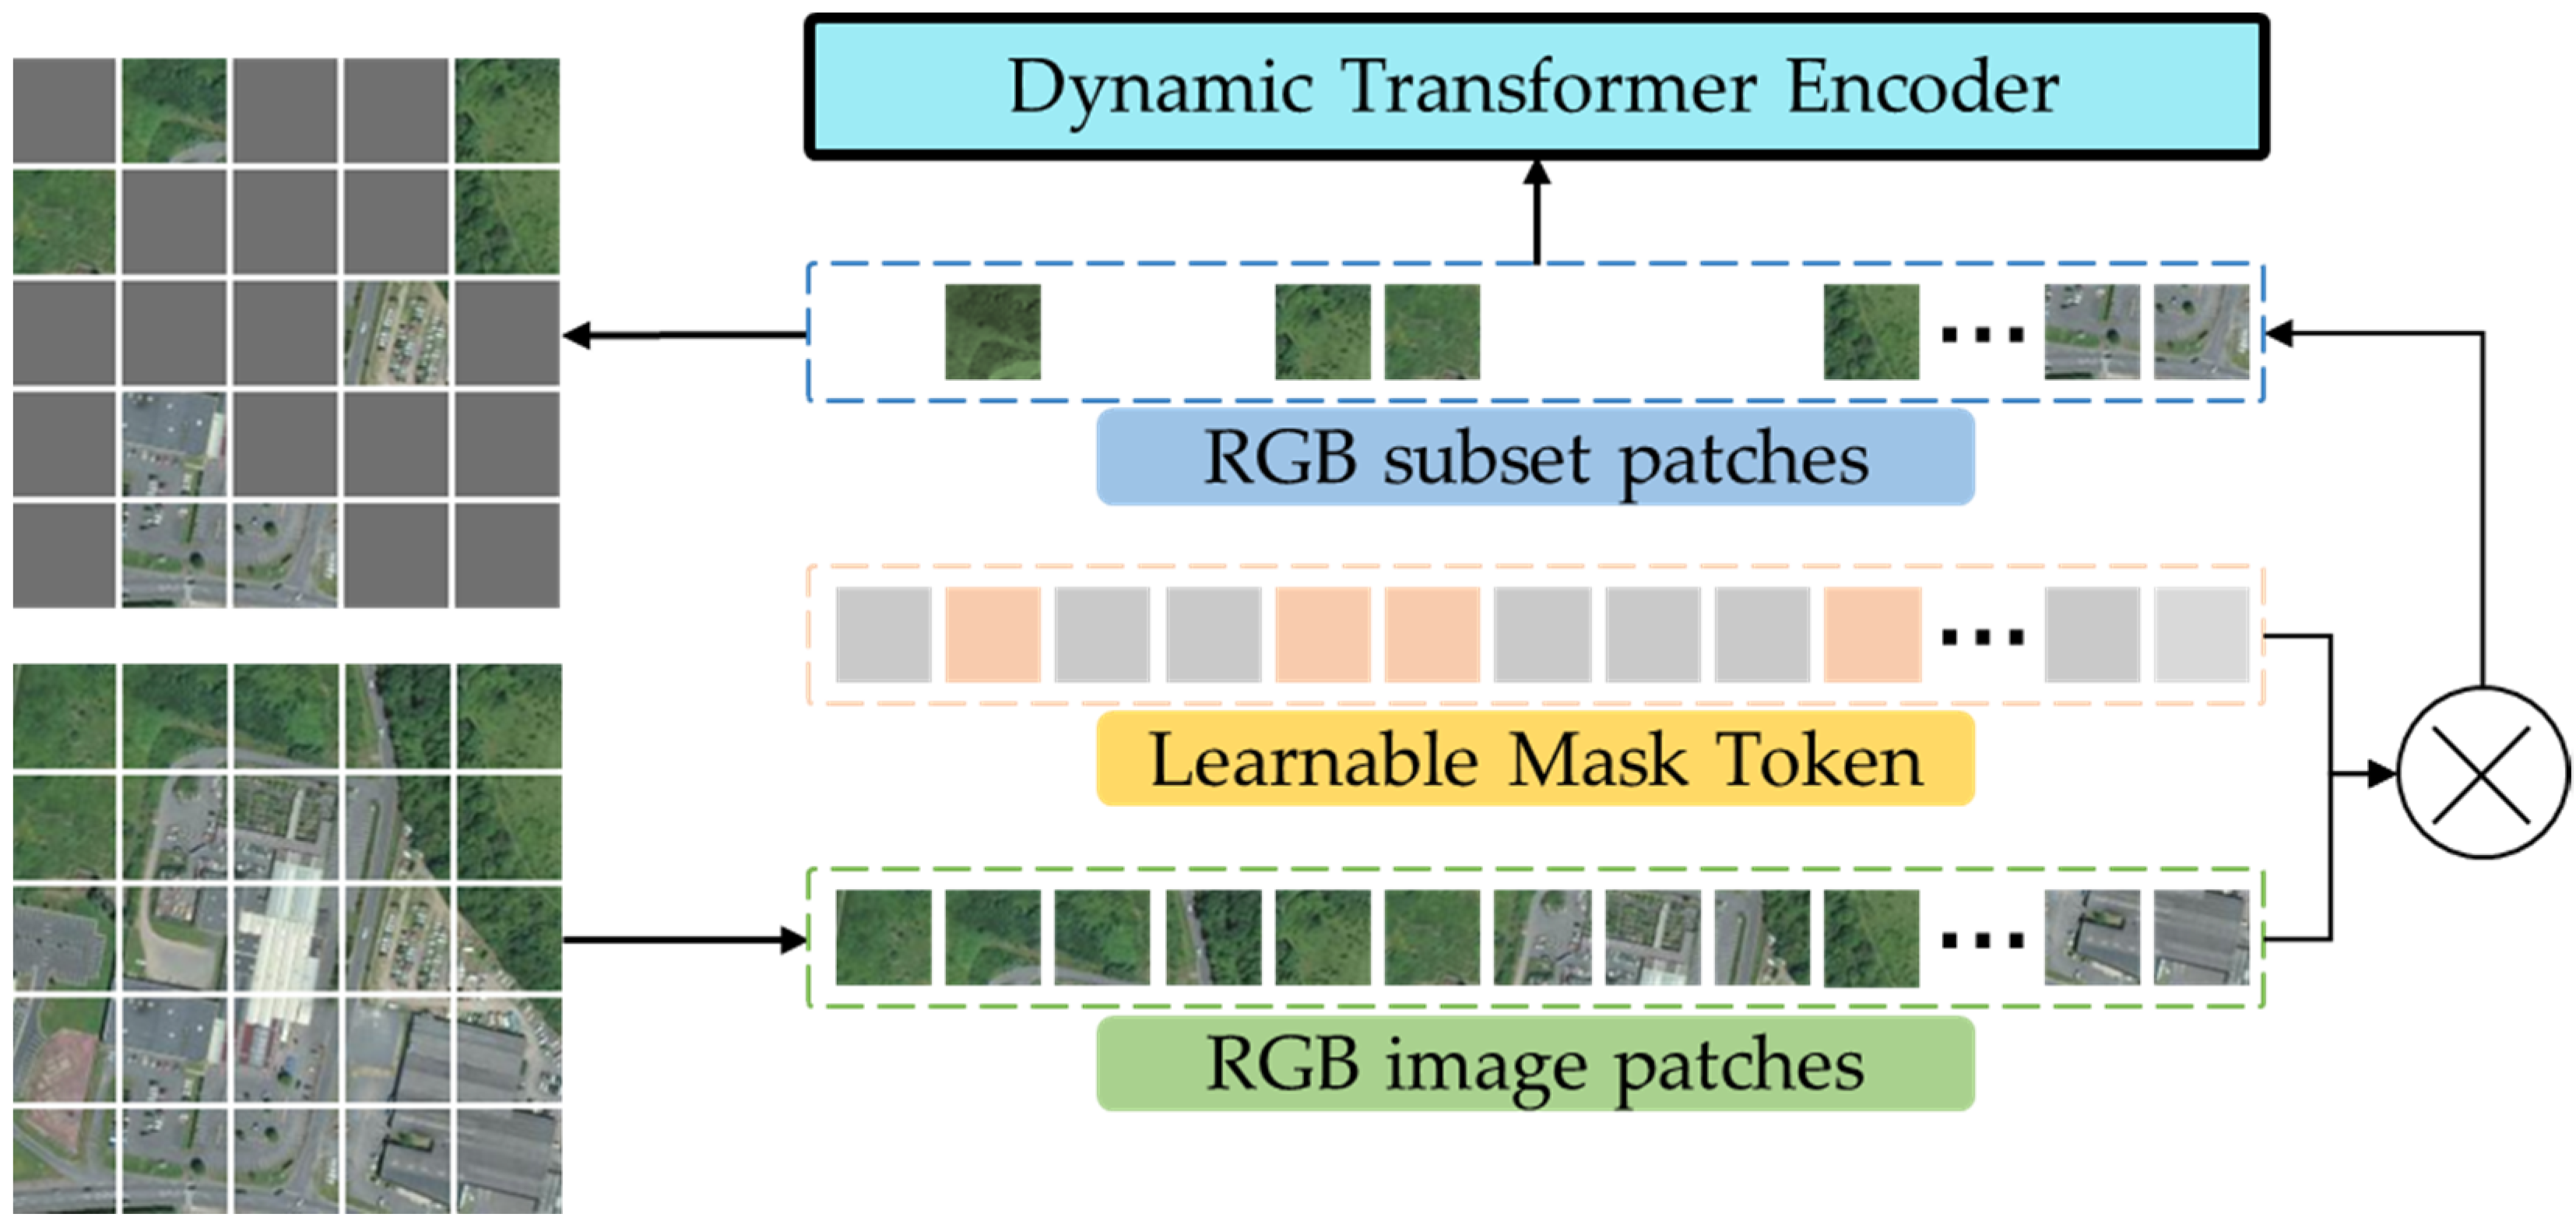
Following ViT, given the input aerial images, we first divide these aerial images into regular non-overlapping patches. However, the sparsity of the aerial image information creates small discrepancies between different categories of plant and animal species. If the patches are directly input to the transformer encoder, it will bring information redundancy. Therefore, the Masked Autoencoders (MAE) [35] model uses random sampling with a high masking ratio to remove a high percentage of patches to eliminate redundancy. Although, random sampling can construct efficient feature representations with highly sparse inputs compared to block-wise sampling and grid-wise sampling. However, the uncertainty of random sampling may remove some patches with high representation power. Therefore, we use the LMT to sample a subset of patches for RGB and NIR aerial images, respectively. We remove patches with low impact on species recognition by the LMT. We simply refer to this as “learnable sampling”. A detailed introduction to the LMT model can be found in Section 3.2.
Specifically, given the input aerial images, we can obtain this embedding without a mask token through the transformer encoder with the LMT model, following each modal image path. Simultaneously, the multimodal location environment path accepts latitude, longitude, bioclimatic, and pedologic data as input. This environment information is added to the process of extracting the latent embedding and fused with the token with high attention weights to improve the distinguishability of the latent embedding of aerial images. Then, the multimodal features are obtained through the MLP backbone network. After the multimodal images and location environment features are obtained, they are fused via the DAF model. In the DAF network, we fused the multimodal localization environment features with aerial image tokens through the multiplication method. The multimodal fusion latent representation z m is obtained via a map of the environment features in each image token to enhance the aerial image representations in the MLP backbone network. We also concatenated the class token of the multimodal aerial image to further enhance the multimodal fusion latent representation for species recognition.

3.2. Learnable Mask Token

The sparsity of aerial image information creates small discrepancies between different categories of species; thus, how to efficiently extract the distinguishing local area embedding for species recognition is the focus of research. Therefore, this paper proposes the LMT (LMT) to sample a subset of patches on aerial images in a learnable way and extract a latent representation of local regions with distinguishability. The patch tokens of the RGB and NIR multimodal image are learned by LMT in the visual transformer model. Then the patch tokens with high weights on RGB and NIR modalities are input into the transformer encoder to extract the latent representation of the multimodal images.
In this section, we first describe the elementary implementation of the transformer encoder model with the LMT. Specifically, given the input aerial images, we divided them into regular non-overlapping patches, x p . Then, these patches were input into LMT to sample a subset of patches to remove patches with low representability. The model architecture of LMP is shown in Figure 2.
The LMP model is a fully connected layer in which the input is a one-hot encoder vector of the same length as the image patches. The output of LMP is sorted to remove those corresponding images with low weights, which is specifically expressed as
x s = x p × w l m t , { w k = 1 , r a n k ( w l m t ) × 0.25 w k = 0 , r a n k ( w l m t ) × 0.75 , k = [ 0 , , p 1 ] ,
where x s is the patches without masks, w l m t is the parameter of the LMT model, and w k is the mask token projection of binarization corresponding to each image patch. These image patches with high weights were mapped to a high-dimensional embedding and fused to the positional embedding.
For multimodal embedding of RGB and NIR images, we added the LMT as a class token to generate a new embedding. At the same time, we fused the multimodal location environment embedding with multimodal image embedding to improve the distinguishing ability. The new embedding is as follows:
z 0 = [ z 0 _ r g b ; z 0 _ n i r ] ,
z 0 _ m = [ x c l a s s _ m ; x s _ m 1 E ; z s _ m 2 E ; ; z s _ m N E ] + E p o s _ m , m [ r g b ,   n i r ] ,
x c l a s s _ m = r a n k ( w l m t _ m ) 0.25 ,
where N is the length of patches through the LMT, x c l a s s _ m is the top 25% sorted by the learned mask token, E R ( P 2 · C ) × D is the multimodal image patches embedding by convolution mapped, and E p o s R ( N + 1 ) × D is the positional embedding.
In a different MAE model, we do not randomly remove image patches but remove low-weight image patches through the LMT, and after each backpropagation, we arrange the learned mask tokens in the order of deletion token. Finally, the low-weight mask token is selected again for deletion. This reciprocates until the optimal high-weight region is selected for species identification.
Based on this, we use the LMT to sample a subset of patches for RGB and NIR images, respectively. We replaced random sampling with the LMT model; we simply refer to this as “learnable sampling”. The learnable way of the mask token largely eliminates redundancy by removing a high percentage of patches.

3.3. Dynamic Attention Fusion Model

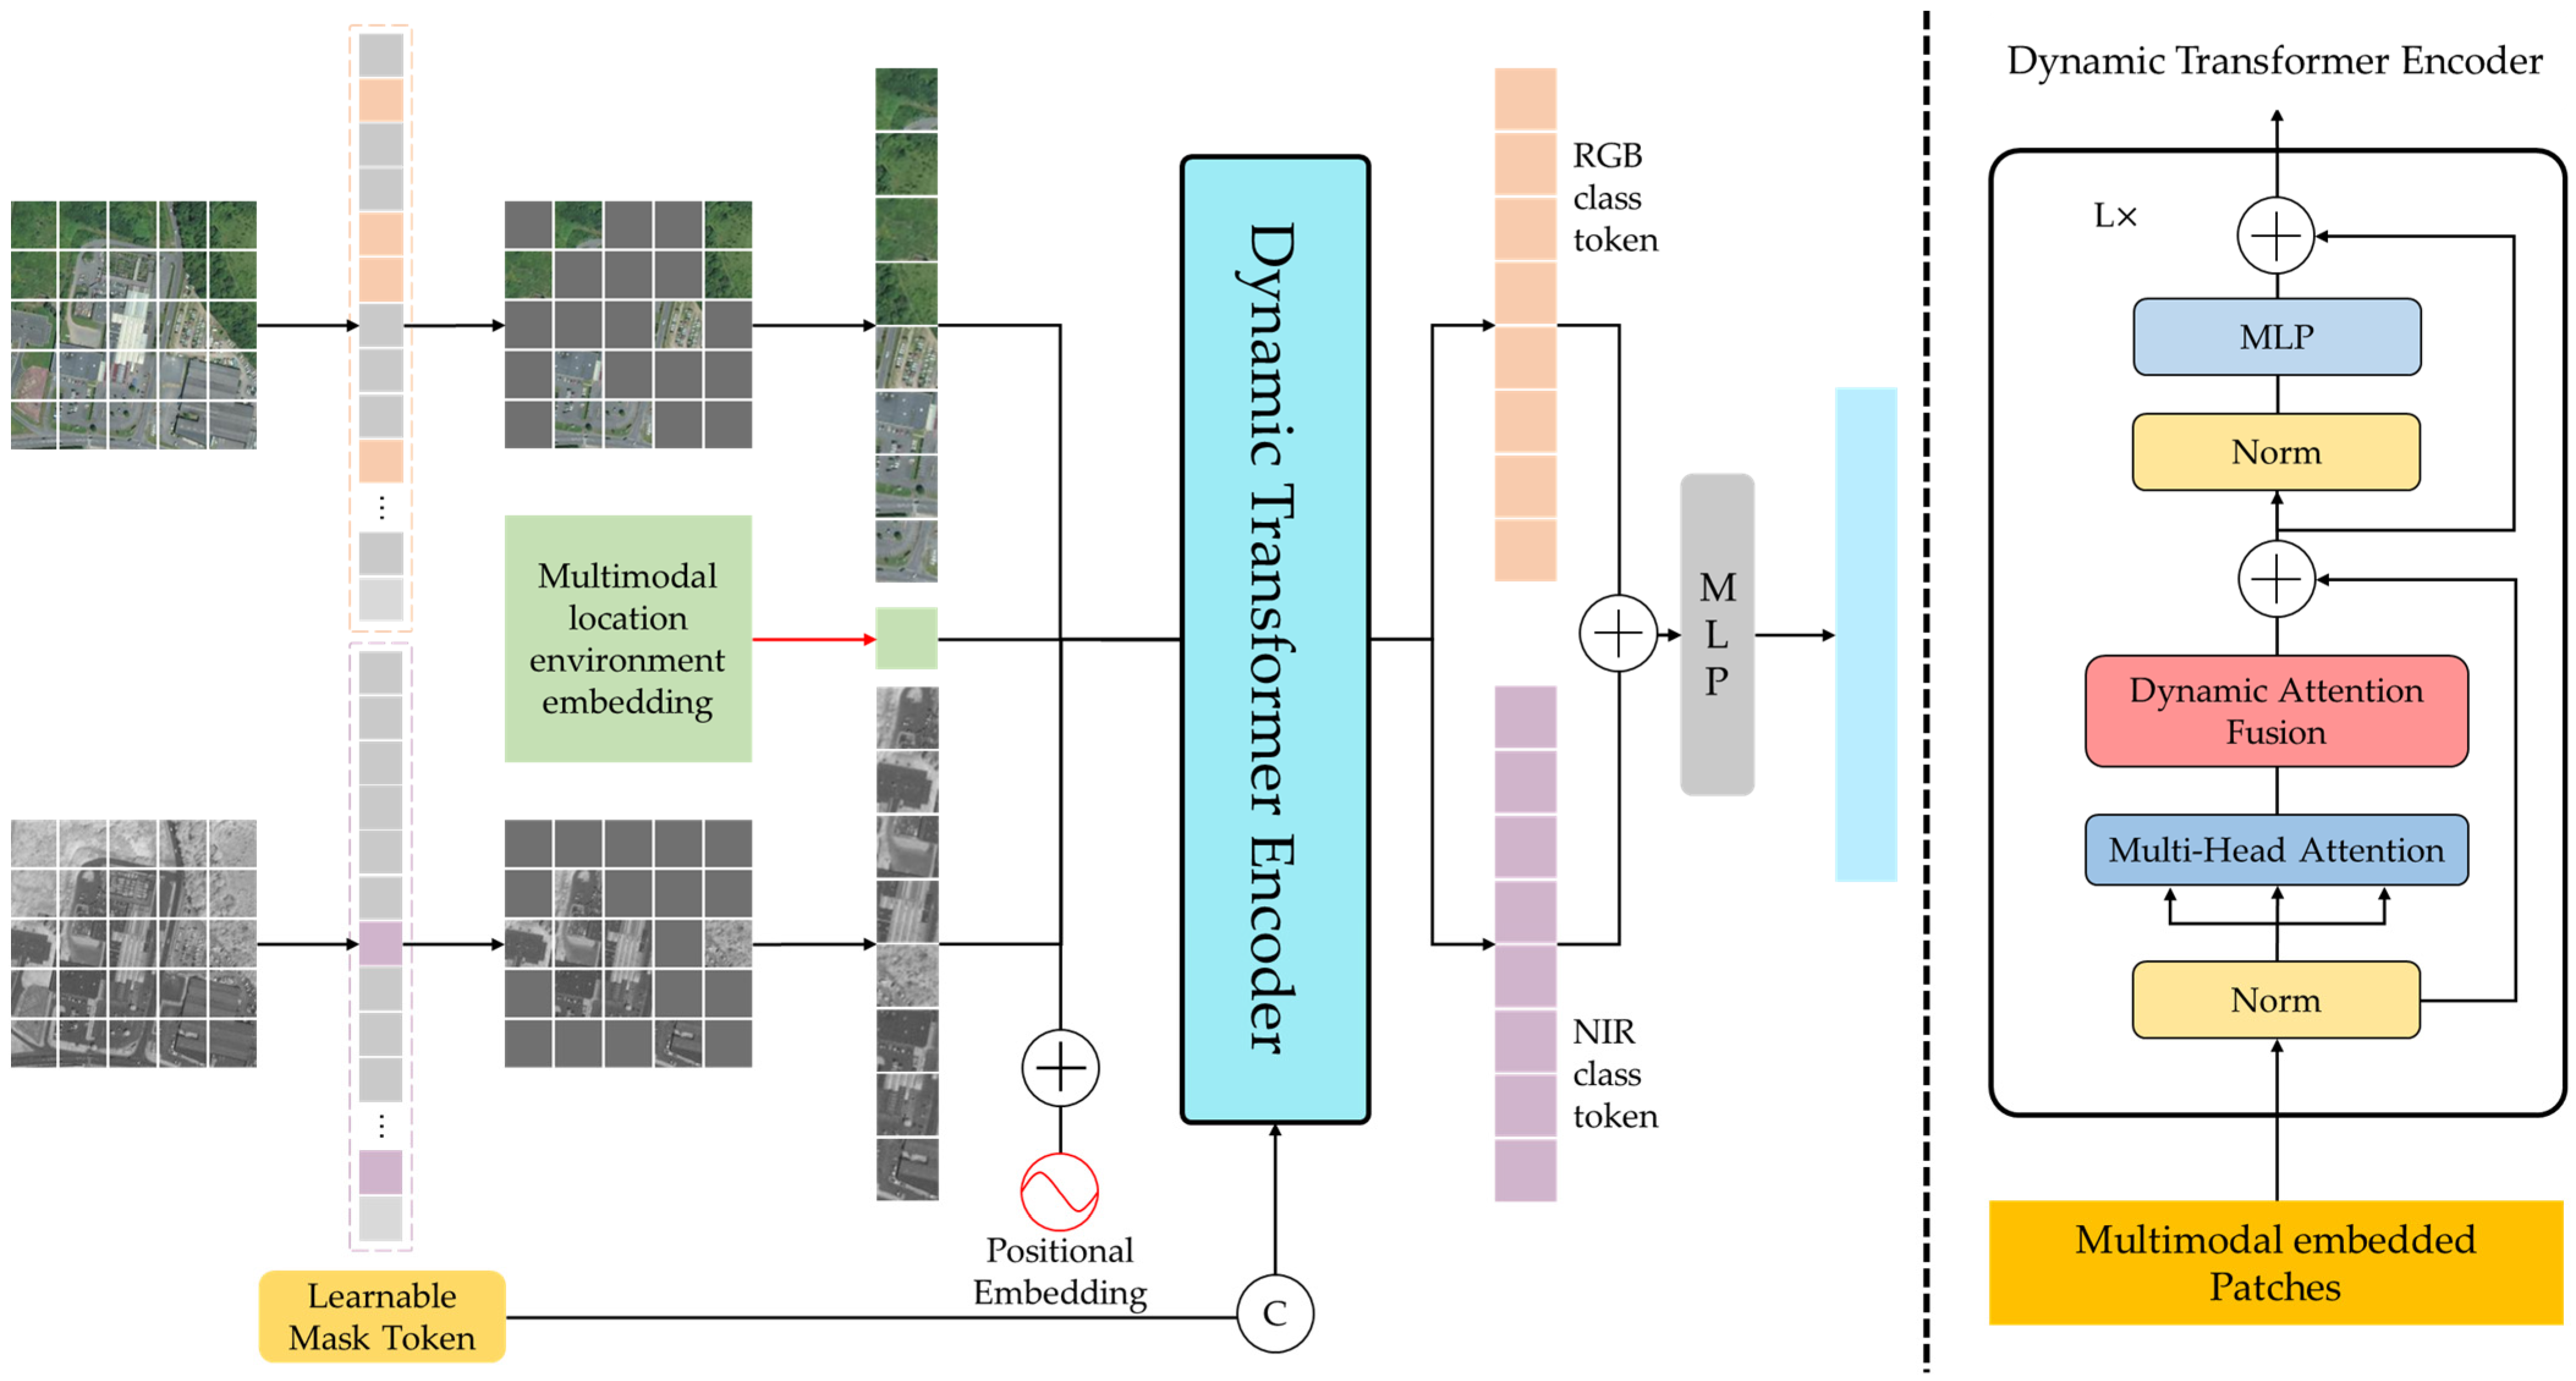
The added class token is used to learn the attention weight of each patch before inputting multimodal image paths into the transformer encoder model. The impact of the high-dimensional features of each patch on species recognition is attended to through the attention weights, in which we represent the positional relationship of each patch with the LMT. The transformer encoder module contains L layers of MSA, DAF, and MLP blocks.
In this section, we first describe the elementary implementation of our proposed dynamic attention fusion (DAF-A) model and its improved variant DAF-B. Inspired by dynamic filters [17,78,79,80], we propose a DAF model that introduces multimodal location environmental embedding, z e , into the visual transformer encoder adaptively to enhance the distinguishability of aerial image representations. In Figure 3 on the left, we show a single unit of DAF-A, the most concise implementation of DAF-A. The classification process is as follows:
z l = M S A ( L N ( z l 1 ) ) + z l 1 , l 1 , , L ,
z l = DAF ( L N ( z l ) ) + z l , l 1 , , L ,
z l = M L P ( L N ( z l ) ) + z l , l 1 , , L ,
M S A = S o f t m a x ( Q K T d k ) V ,
DAF = R e s h a p e ( L N ( z e ) ) × z l ,
p = S o f t m a x ( z L 0 ) ,
where Q , K , and V are the query, key, and value of the M S A model, z e is the patch of multimodal location environment, R e s h a p e ( ) reformulates a 1-d feature into a 2-d matrix, L N ( ) denotes the fully connected layer, z L 0 is the class token concatenation of the RGB and NIR image, and p is the prediction result of the model.
Finally, z L 0 are replaced by the corresponding positions in the LMT, and the patches with high weights are extracted again for the next iteration. Aerial image embedding and multimodal location environment embedding have the potential to complement each other. Therefore, we concatenated image embedding and multimodal location environment embedding in DAF-B, which is an extended version of DAF-A, and then dynamically mapped them to the image embedding.
DAF B = R e s h a p e ( L N ( [ z e , z i ] ) ) × z l ,
z i = P o o l ( z l ) ,
In the DViT model training process, we used focal loss to reduce the impact of category imbalance. The loss function is defined as follows:
l f o c a l = α t ( 1 p t ) r l o g ( p t ) ,
where α t and r are hyperparameters, α t is the balance factor, and γ is to adjust the rate at which the weight of simple samples is reduced. To verify the ability of multimodal location environment information to enhance the distinguishability of image features, we verified the robustness of the model using RGB, NIR, and RGB+NIR, and the experimental results are shown in table in Section 4.3.

4. Experiments

This section, we will introduce the detailed analysis of the experiment, including datasets, performance metrics, experimental details results, and ablation experiment analysis. In addition, the ablation experimental analysis is conducted to better illustrate the effectiveness of the DViT architecture.

4.1. Dataset

We conducted experiments on a species dataset with additional location environment information (GeoLifeCLEF 2021, 2022). GeoLifeCLEF 2021 and 2022 are part of the LifeCLEF 2021 and 2022 evaluation campaigns, respectively, as well as part of the Eighth Workshop on Fine-Grained Visual Categorization (FGVC8) on CVPR 2021 and FGVC9 on CVPR 2022.
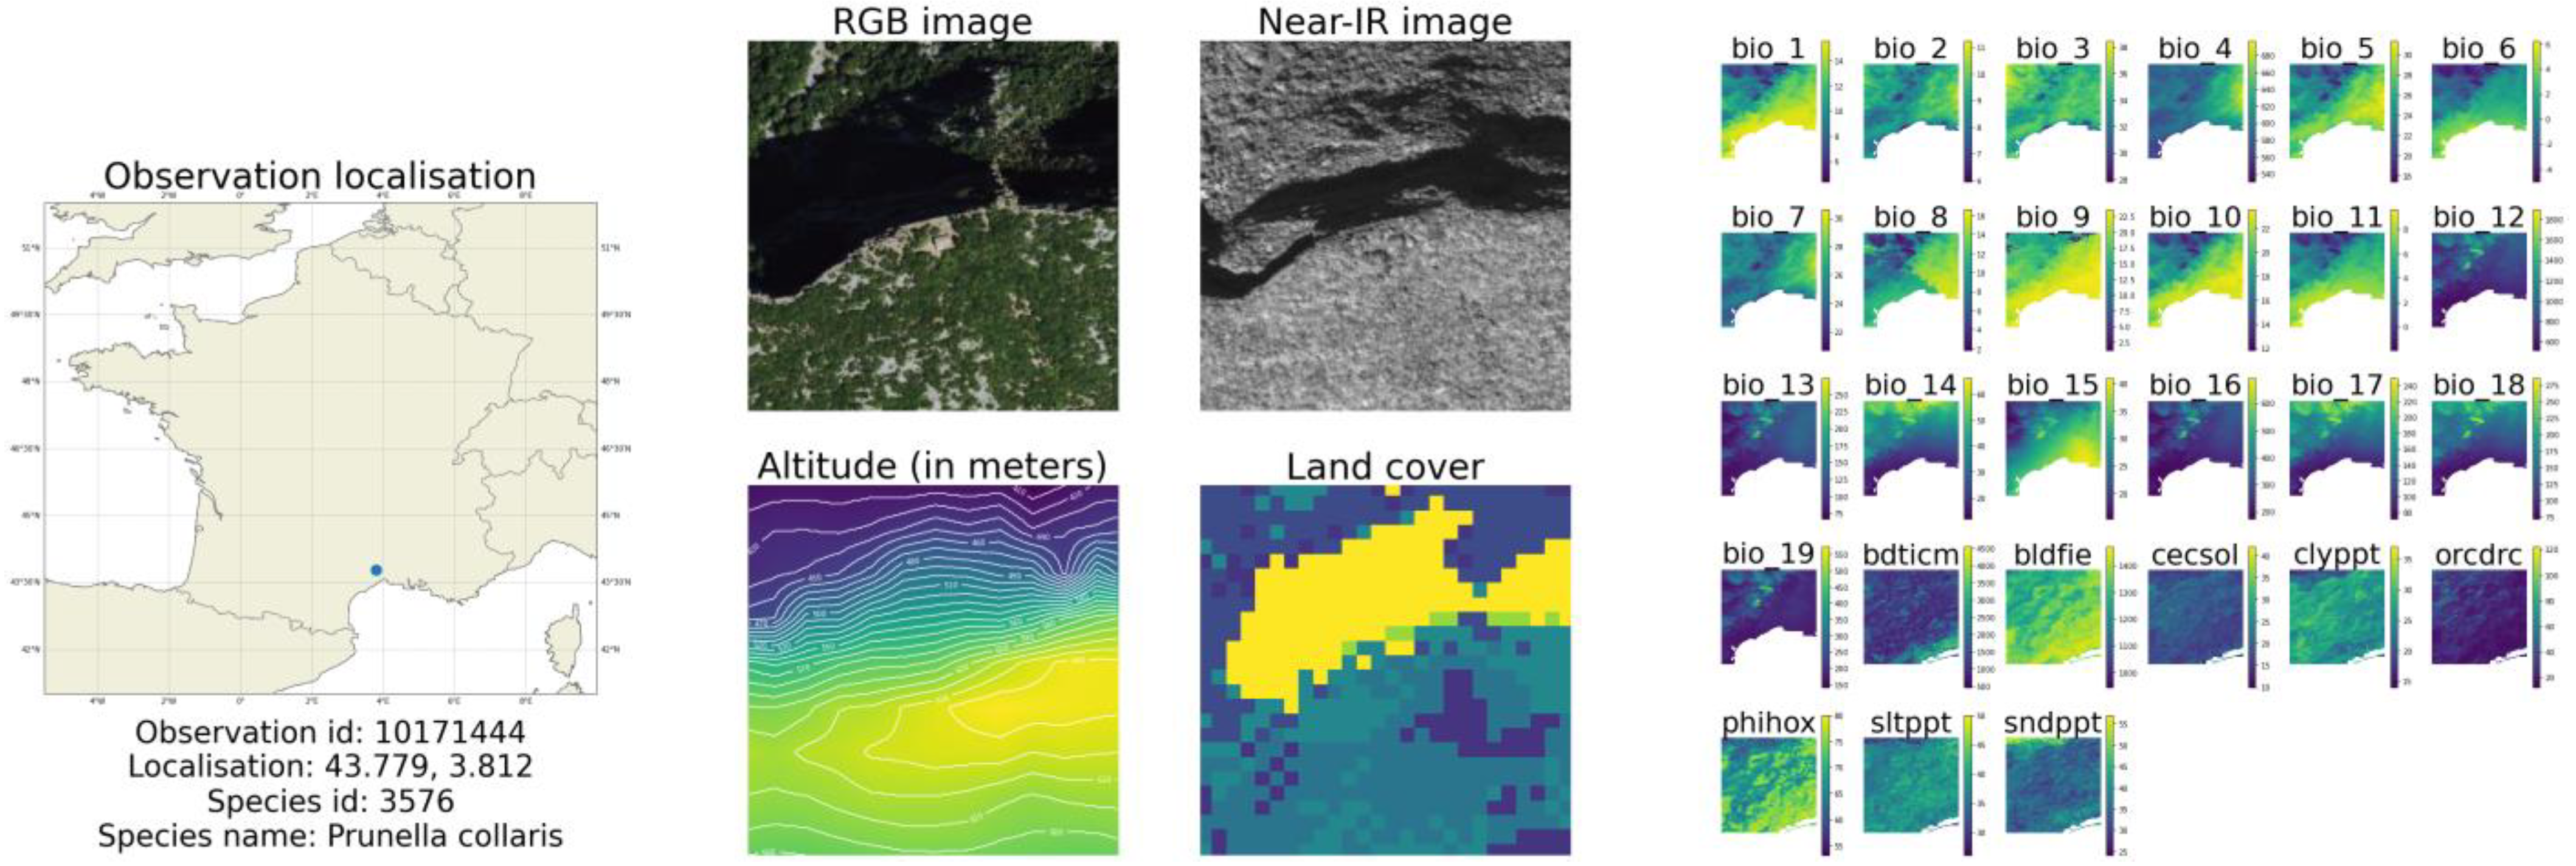
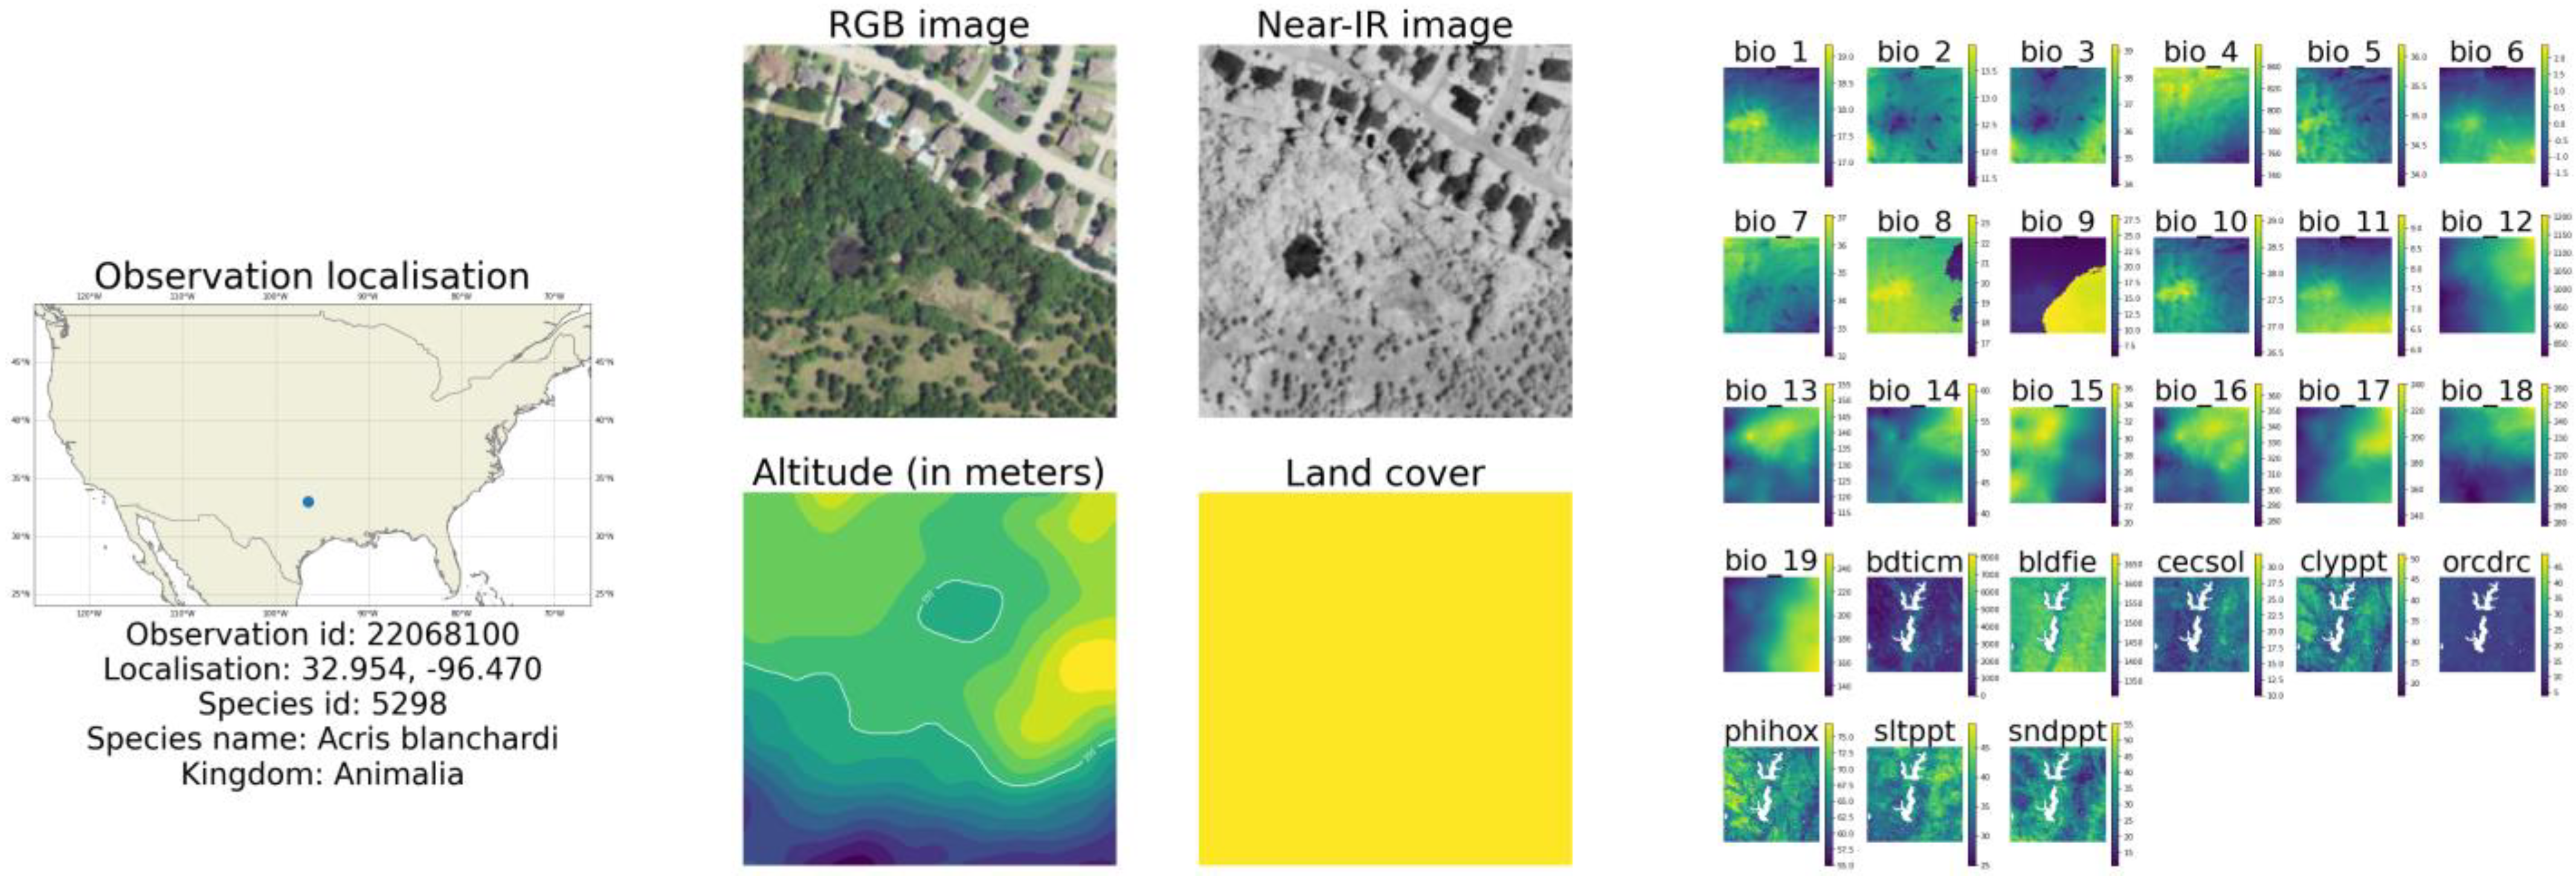
The observation data in GeoLifeCLEF 2021 and 2022 are given latitude and longitude coordinates, the remote sensing imagery in RGB and NIR, and the cover and altitude data of the surrounding environment within 256 m × 256 m, which is 1 m per pixel in these data. In addition, bioclimatic and pedologic data corresponding to each observational data sample is also given, as extracted, preprocessed environmental variable features. The observation data of the location [43.779, 3.812] in GeoLifeCLEF 2021 and [32.957, −96.470] in GeoLifeCLEF 2022 are shown in Figure 4 and Figure 5.
Due to the sparseness of the land cover and altitude data, only RGB and NIR images in the dataset were used in the training process of the DViT model. Additional information selected regarded species location and preprocessed environmental embedding. The sample statistics of species number, train, validation, and test of GeoLifeCLEF 2021 and 2022 are shown in Table 2.
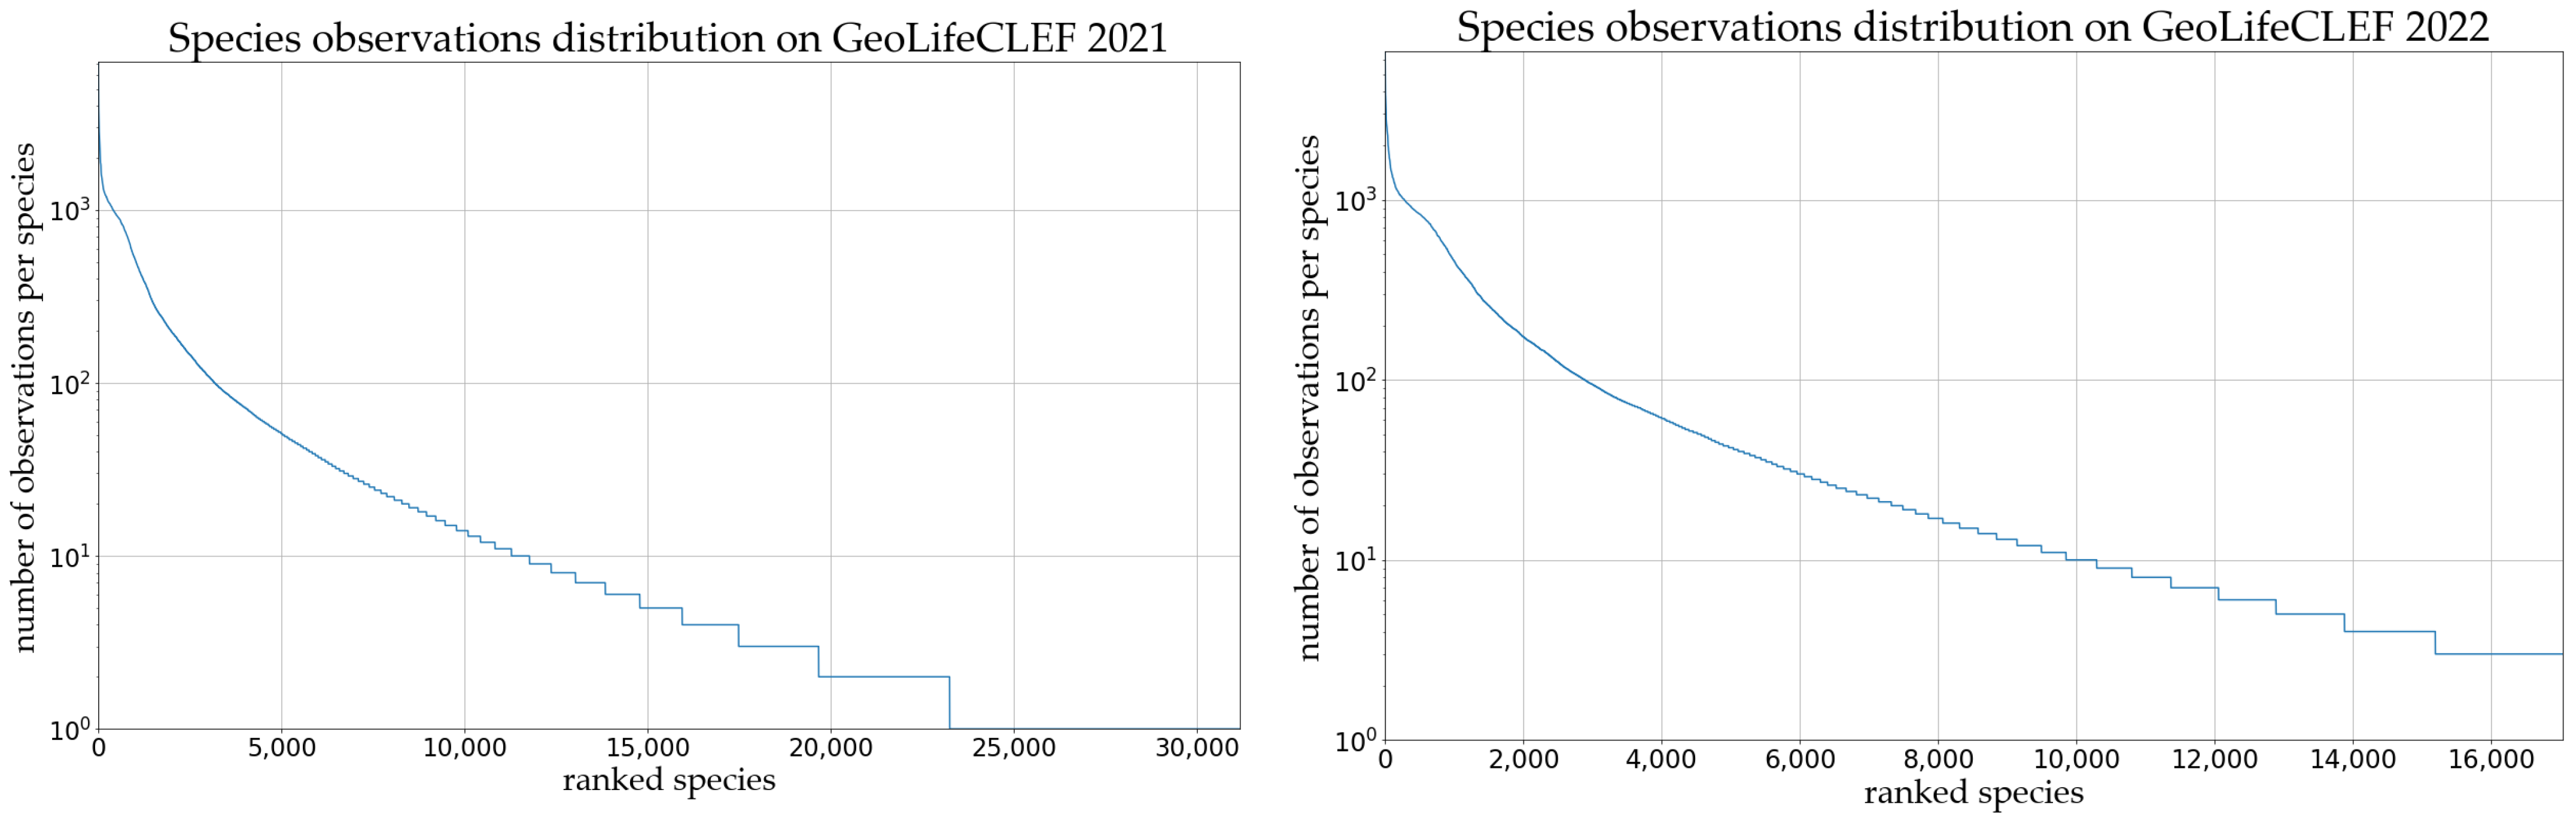
Due to the category imbalance of the species recognition dataset, the visualization of species observation distribution in the two datasets is shown in Figure 6. It can be seen that the long-tailed distributions problem of the GeoLifeCLEF 2021 dataset is more obvious. This dataset includes 31,179 observed species and only species category labels are given. The 17,037 observed species in the GeoLifeCLEF 2022 removed species categories with a small sample from GeoLifeCLEF 2021; this includes 9080 plants and 7957 animals. The species, genus, family, and kingdom category labels are also given for each observed data sample.

4.2. Implementation Details and Performance Metrics

We iteratively update the parameters of the RGB and NIR paths of DViT on the MAE pre-training model, to accelerate the model convergence during the training process. During the training process, we applied random cropping, random rotation, random vertical and horizontal flips, and 5–10% brightness and contrast adjustment to perform data augmentation on the image dataset. We applied center cropping to the image as a data-augmentation operation during the inference. Meanwhile, we trained with the Stochastic Gradient Descent (SGD) algorithm with momentum for DViT model optimization with an effective batch size of 512 on the 800 epochs. The learning rate was set to 0.0024 and the learning rate decayed to 0.95. The proposed model was trained and predicted using PyTorch on the GeForce RTX A6000 platform.
In the experiment, we used the top-30 error rate in the two public multimodal species recognition datasets (GeoLifeCLEF 2021 and 2022) to validate the performance of the DViT model. The top-30 error rate is expressed as follows:
T o p 30   e r r o r   r a t e = 1 N i = 1 N e i ,   w h e r e       e i = { 1 i f   k { 1 , , 30 } , y ^ i , k y i 0 o t h e r w i s e ,
where y i is the ground-truth label of observation i . For each observation i , it provides 30 candidate labels y ^ i , 1 , y ^ i , 2 , , y ^ i , 30 to compute the top-30 error rate.

4.3. Ablation Experiment Analysis

Mask Sampling Strategies: We first examined the impact of mask sampling strategies on DViT architecture performance. The experimental results are shown in Table 3. Specifically, we compared the impact of four mask sampling strategies: learnable sampling (our default), random sampling, lock-wise sampling, and grid-wise sampling. Random sampling is a large-scale random removal of small image blocks, lock-wise sampling removes large random blocks, and grid-wise sampling keeps one of every four patches.
The experiments are conducted based on the ViT backbone of the GeoLifeCLEF 2022 dataset. The experimental results show that learnable sampling reduces the error rate of recognition compared to random sampling strategies. We believe that the strategies of learnable sampling can better extract the local region of interest representation with high differentiation. In the MAE model, the random sampling strategies have been shown to achieve better results than lock-wise sampling and grid-wise sampling. In this paper, we also show that random sampling strategies can achieve good results in multimodal species identification.
Comparison of Backbone: We trained different ViT backbones based on learnable mask strategies of the GeoLifeCLEF 2022 dataset, achieving a very competitive top-30 error rate of 0.6594. Furthermore, comparing ViT-Huge to ViT-Base and ViT Large, it was seen that the larger-scale backbone model achieves more competitive results. The experimental results are shown in Table 4.
Comparison of Structures: We compared DAF-A and DAF-B (Figure 3) based on the ViT backbone and learnable sampling strategies with GeoLifeCLEF 2022. The results are shown in Table 5. The experimental results show that DAF-B can obtain better experimental results by fusing the embedding of aerial images and multimodal location environment embedding.

4.4. Comparisons with State-of-the-Arts

Our model was compared with five multimodal fusion schemes. We performed the implementation under a unified backbone for a fair comparison. In the ConcatNet [15] model, the species class was predicted by concatenating the image latent feature representation extracted from the VIT model of the backbone network with the features of multimodal location information. In PriorsNet [14], GeoNet [13], EnsembleNet [29], and Dynamic MLP [17], we similarly combined the original method embedding in the original method with the same replacement to ensure the fairness of the experiments. The experimental results—the top-30 error rates for classification of DViT and other methods using the GeoLifeCLEF dataset for species identification—are shown in Table 6.
For our proposed DViT model, the backbone structure adopts the ViT [30] model and the LMT for aerial images to sample a subset of patches, and fused the patches’ subsets of RGB, NIR, and multimodal location environmental embedding into the transformer encode model to obtain the final classification results.
In the GeoLifeCLEF 2021 dataset, the top-30 recognition error rates of the proposed DViT on the private test set are lower than those of the baseline method using only aerial images (ResNet, DenseNet, and VIT), by 0.0371, 0.0241, and 0.0319, respectively. Compared with the Dynamic MLP, which is the optimal fusion model of aerial images and multimodal location environment embedding, it is lower by 0.0074, 0.0099, and 0.0057, respectively. The DViT proposed also achieves SOTA recognition performance in the GeoLifeCLEF 2022 dataset.
Because the test results of GeoLifeCLEF 2021 and 2022 were submitted to Kaggle to obtain the top-30 error rate, the accuracy, precision, and recall metrics could not be obtained. Therefore, we further evaluated the DViT model with the RGB and NIR fusion (ResNet 50, DenseNet 161, ViT-Huge) and multimodal fusion Dynamic MLP in the validation set. The results are shown in Table 7 and Table 8.

4.5. Limitation and Discussion

The proposed DViT model improves the discrimination of image features by dynamically fusing aerial image embedding and geo-location environment information, achieving state-of-the-art performance in plant and animal species recognition. However, this method still has three limitations. First, for each aerial image and set of environmental information of each observed species, there may be other plants and animals. In this situation, the local image region of observed species may be removed through LMT to reduce recognition performance. Second, the influence of the positional relationship between MSA and DAF in the DViT model was not considered, which is also one of the main issues to be considered in future studies. Finally, the training of DViT starts with the pre-trained model of MAE, which may affect feature extraction from aerial images. In future research, unsupervised learning can be introduced for feature extraction of aerial images to increase the robustness of image embedding to improve the performance of species recognition.

5. Conclusions

In this paper, we propose a DViT model to reduce the effect of small image discrepancies for multimodal species recognition by combining aerial image and location environment information. Our method used the LMT to sample a subset of patches with high attention weights to reduce the complexity of the aerial image representation extraction calculation. The multimodal location environment information is added to the process of extracting the latent representation to improve the distinguishability of images’ latent representation using the DAF module. This study is the first to introduce multimodal location environment information to the visual transformer model for plant and animal species recognition. The many experiments conducted using the GeoLifeCLEF 2021 and 2022 datasets were validated with our analysis, which showed that the DViT achieved SOTA recognition performance.

Author Contributions

Conceptualization, H.P. and L.X.; methodology, H.P.; software, H.P.; validation, H.P.; formal analysis, H.P. and L.X.; investigation, H.P. and L.X.; resources, Z.W. and L.X.; data curation, H.P.; writing—original draft preparation, H.P. and L.X.; visualization, L.X.; funding acquisition, L.X. All authors have read and agreed to the published version of the manuscript.

Funding

This research was funded by the National Key R&D Program of China, grant number 2018YFC2001700; Beijing Natural Science Foundation, grant number L192005.

Data Availability Statement

Publicly available GeoLifeCLEF 2021, and 2022 datasets were analyzed in this study. The GeoLifeCLEF 2021 dataset can be found here: https://www.kaggle.com/competitions/geolifeclef-2021/data, accessed on 10 March 2021. The GeoLifeCLEF 2022 dataset can be found here: https://www.kaggle.com/competitions/geolifeclef-2022-lifeclef-2022-fgvc9/data, accessed on 9 March 2022.

Conflicts of Interest

The authors declare no conflict of interest.

References

  1. Bisen, D. Deep convolutional neural network based plant species recognition through features of leaf. Multimed. Tools Appl. 2021, 80, 6443–6456. [Google Scholar] [CrossRef]
  2. Chen, G.; Han, T.X.; He, Z.; Kays, R.; Forrester, T. Deep convolutional neural network based species recognition for wild animal monitoring. In Proceedings of the IEEE/CVF International Conference on Image Processing, IEEE, Paris, France, 27–30 October 2014; pp. 858–862. [Google Scholar]
  3. Kong, J.; Wang, H.; Wang, X.; Jin, X.; Fang, X.; Lin, S. Multi-stream hybrid architecture based on cross-level fusion strategy for fine-grained crop species recognition in precision agriculture. Comput. Electron. Agric. 2021, 185, 106134. [Google Scholar] [CrossRef]
  4. Laso, F.J.; Benítez, F.L.; Rivas-Torres, G.; Sampedro, C.; Arce-Nazario, J. Land cover classification of complex agroecosystems in the non-protected highlands of the Galapagos Islands. Remote Sens. 2019, 12, 65. [Google Scholar] [CrossRef] [Green Version]
  5. Yan, S.; Jing, L.; Wang, H. A new individual tree species recognition method based on a convolutional neural network and high-spatial resolution remote sensing imagery. Remote Sens. 2021, 13, 479. [Google Scholar] [CrossRef]
  6. Zhang, S.; Huang, W.; Huang, Y.-A.; Zhang, C. Plant species recognition methods using leaf image: Overview. Neurocomputing 2020, 408, 246–272. [Google Scholar] [CrossRef]
  7. Xie, S.; Girshick, R.; Dollár, P.; Tu, Z.; He, K. Aggregated residual transformations for deep neural networks. In Proceedings of the IEEE/CVF Conference on Computer Vision and Pattern Recognition, Honolulu, HI, USA, 21–26 July 2017; pp. 1492–1500. [Google Scholar]
  8. Li, X.; Wang, W.; Hu, X.; Yang, J. Selective kernel networks. In Proceedings of the IEEE/CVF Conference on Computer Vision and Pattern Recognition, Long Beach, CA, USA, 16–20 June 2019; pp. 510–519. [Google Scholar]
  9. Zhang, H.; Wu, C.; Zhang, Z.; Zhu, Y.; Lin, H.; Zhang, Z.; Sun, Y.; He, T.; Mueller, J.; Manmatha, R. Resnest: Split-attention networks. In Proceedings of the IEEE/CVF Conference on Computer Vision and Pattern Recognition, New Orleans, LA, USA, 19–24 June 2022; pp. 2736–2746. [Google Scholar]
  10. Huang, G.; Liu, Z.; Van Der Maaten, L.; Weinberger, K.Q. Densely connected convolutional networks. In Proceedings of the IEEE/CVF Conference on Computer Vision and Pattern Recognition, Honolulu, HI, USA, 21–26 July 2017; pp. 4700–4708. [Google Scholar]
  11. Hu, J.; Shen, L.; Sun, G. Squeeze-and-excitation networks. In Proceedings of the IEEE/CVF Conference on Computer Vision and Pattern Recognition, Salt Lake City, UT, USA, 18–22 June 2018; pp. 7132–7141. [Google Scholar]
  12. He, K.; Zhang, X.; Ren, S.; Sun, J. Deep residual learning for image recognition. In Proceedings of the IEEE/CVF Conference on Computer Vision and Pattern Recognition, Las Vegas, NV, USA, 20 June–1 July 2016; pp. 770–778. [Google Scholar]
  13. Chu, G.; Potetz, B.; Wang, W.; Howard, A.; Song, Y.; Brucher, F.; Leung, T.; Adam, H. Geo-aware networks for fine-grained recognition. In Proceedings of the IEEE/CVF International Conference on Computer Vision Workshops, Seoul, Korea, 27 October–2 November 2019; pp. 247–254. [Google Scholar]
  14. Mac Aodha, O.; Cole, E.; Perona, P. Presence-only geographical priors for fine-grained image classification. In Proceedings of the IEEE/CVF International Conference on Computer Vision, Seoul, Korea, 27 October–2 November 2019; pp. 9596–9606. [Google Scholar]
  15. Tang, K.; Paluri, M.; Fei-Fei, L.; Fergus, R.; Bourdev, L. Improving image classification with location context. In Proceedings of the IEEE/CVF International Conference on Computer Vision, Santiago, Chile, 11–18 December 2015; pp. 1008–1016. [Google Scholar]
  16. Wittich, H.C.; Seeland, M.; Wäldchen, J.; Rzanny, M.; Mäder, P. Recommending plant taxa for supporting on-site species identification. BMC Bioinform. 2018, 19, 1–17. [Google Scholar] [CrossRef] [PubMed] [Green Version]
  17. Yang, L.; Li, X.; Song, R.; Zhao, B.; Tao, J.; Zhou, S.; Liang, J.; Yang, J. Dynamic MLP for Fine-Grained Image Classification by Leveraging Geographical and Temporal Information. In Proceedings of the IEEE/CVF Conference on Computer Vision and Pattern Recognition, New Orleans, LA, USA, 19–24 June 2022; pp. 10945–10954. [Google Scholar]
  18. Berg, T.; Liu, J.; Woo Lee, S.; Alexander, M.L.; Jacobs, D.W.; Belhumeur, P.N. Birdsnap: Large-scale fine-grained visual categorization of birds. In Proceedings of the IEEE/CVF Conference on Computer Vision and Pattern Recognition, Columbus, OH, USA, 23–28 June 2014; pp. 2011–2018. [Google Scholar]
  19. Goëau, H.; Bonnet, P.; Joly, A. Plant identification in an open-world (lifeclef 2016). In Proceedings of the CLEF: Conference and Labs of the Evaluation Forum, Évora, Portugal, 5–8 September 2016; pp. 428–439. [Google Scholar]
  20. Picek, L.; Šulc, M.; Matas, J.; Jeppesen, T.S.; Heilmann-Clausen, J.; Læssøe, T.; Frøslev, T. Danish fungi 2020-not just another image recognition dataset. In Proceedings of the IEEE/CVF Winter Conference on Applications of Computer Vision, Waikoloa, HI, USA, 4–8 January 2022; pp. 1525–1535. [Google Scholar]
  21. Thomee, B.; Shamma, D.A.; Friedland, G.; Elizalde, B.; Ni, K.; Poland, D.; Borth, D.; Li, L.-J. YFCC100M: The new data in multimedia research. Commun. ACM 2016, 59, 64–73. [Google Scholar] [CrossRef] [Green Version]
  22. Van Horn, G.; Cole, E.; Beery, S.; Wilber, K.; Belongie, S.; Mac Aodha, O. Benchmarking representation learning for natural world image collections. In Proceedings of the IEEE/CVF Conference on Computer Vision and Pattern Recognition, Vitural, 19–25 June 2021; pp. 12884–12893. [Google Scholar]
  23. Van Horn, G.; Mac Aodha, O.; Song, Y.; Cui, Y.; Sun, C.; Shepard, A.; Adam, H.; Perona, P.; Belongie, S. The iNaturalist Species Classification and Detection Dataset-Supplementary Material. Reptilia 2017, 32, 1–3. [Google Scholar]
  24. Van Horn, G.; Mac Aodha, O.; Song, Y.; Cui, Y.; Sun, C.; Shepard, A.; Adam, H.; Perona, P.; Belongie, S. The iNaturalist species classification and detection dataset. In Proceedings of the IEEE/CVF Conference on Computer Vision and Pattern Recognition, Salt Lake City, UT, USA, 18–22 June 2018; pp. 8769–8778. [Google Scholar]
  25. Cole, E.; Deneu, B.; Lorieul, T.; Servajean, M.; Botella, C.; Morris, D.; Jojic, N.; Bonnet, P.; Joly, A. The geolifeclef 2020 dataset. arXiv 2020, arXiv:2004.04192. [Google Scholar]
  26. Mai, G.; Janowicz, K.; Yan, B.; Zhu, R.; Cai, L.; Lao, N. Multi-scale representation learning for spatial feature distributions using grid cells. arXiv 2020, arXiv:2003.00824. [Google Scholar]
  27. Minetto, R.; Segundo, M.P.; Sarkar, S. Hydra: An ensemble of convolutional neural networks for geospatial land classification. IEEE Trans. Geosci. Remote Sens. 2019, 57, 6530–6541. [Google Scholar] [CrossRef] [Green Version]
  28. Salem, T.; Workman, S.; Jacobs, N. Learning a dynamic map of visual appearance. In Proceedings of the IEEE/CVF Conference on Computer Vision and Pattern Recognition, Vitural, 14–19 June 2020; pp. 12435–12444. [Google Scholar]
  29. Terry, J.C.D.; Roy, H.E.; August, T.A. Thinking like a naturalist: Enhancing computer vision of citizen science images by harnessing contextual data. Methods Ecol. Evol. 2020, 11, 303–315. [Google Scholar] [CrossRef] [Green Version]
  30. Dosovitskiy, A.; Beyer, L.; Kolesnikov, A.; Weissenborn, D.; Zhai, X.; Unterthiner, T.; Dehghani, M.; Minderer, M.; Heigold, G.; Gelly, S. An Image is Worth 16x16 Words: Transformers for Image Recognition at Scale. In Proceedings of the International Conference on Learning Representations, Addis Ababa, Ethiopia, 26 April–1 May 2020. [Google Scholar]
  31. Carion, N.; Massa, F.; Synnaeve, G.; Usunier, N.; Kirillov, A.; Zagoruyko, S. End-to-end object detection with transformers. In Proceedings of the European Conference on Computer Vision, Glasgow, UK, 23–28 August 2020; Springer: Berlin/Heidelberg, Germany, 2020; pp. 213–229. [Google Scholar]
  32. Wang, Y.; Huang, R.; Song, S.; Huang, Z.; Huang, G. Not All Images are Worth 16x16 Words: Dynamic Transformers for Efficient Image Recognition. In Proceedings of the Neural Information Processing Systems, Vitural, 6–14 December 2021. [Google Scholar]
  33. Zheng, S.; Lu, J.; Zhao, H.; Zhu, X.; Luo, Z.; Wang, Y.; Fu, Y.; Feng, J.; Xiang, T.; Torr, P.H. Rethinking semantic segmentation from a sequence-to-sequence perspective with transformers. In Proceedings of the IEEE/CVF Conference on Computer Vision and Pattern Recognition, Vitural, 19–25 June 2021; pp. 6881–6890. [Google Scholar]
  34. Bao, H.; Dong, L.; Wei, F. Beit: Bert pre-training of image transformers. arXiv 2021, arXiv:2106.08254. [Google Scholar]
  35. He, K.; Chen, X.; Xie, S.; Li, Y.; Dollár, P.; Girshick, R. Masked autoencoders are scalable vision learners. In Proceedings of the IEEE/CVF Conference on Computer Vision and Pattern Recognition, New Orleans, LA, USA, 19–24 June 2022; pp. 16000–16009. [Google Scholar]
  36. Jiang, Y.; Chang, S.; Wang, Z. Transgan: Two pure transformers can make one strong gan, and that can scale up. In Proceedings of the Advances in Neural Information Processing Systems, Virtual, 6–14 December 2021; Volume 34, pp. 14745–14758. [Google Scholar]
  37. Lee, K.; Chang, H.; Jiang, L.; Zhang, H.; Tu, Z.; Liu, C. Vitgan: Training gans with vision transformers. arXiv 2021, arXiv:2107.04589. [Google Scholar]
  38. Nash, C.; Menick, J.; Dieleman, S.; Battaglia, P.W. Generating images with sparse representations. arXiv 2021, arXiv:2103.03841. [Google Scholar]
  39. Parmar, N.; Vaswani, A.; Uszkoreit, J.; Kaiser, L.; Shazeer, N.; Ku, A.; Tran, D. Image transformer. In Proceedings of the International Conference on Machine Learning, PMLR, Stockholmsmässan, Stockholm, Sweden, 10–15 July 2018; pp. 4055–4064. [Google Scholar]
  40. Huang, Y.-P.; Basanta, H. Bird image retrieval and recognition using a deep learning platform. IEEE Access 2019, 7, 66980–66989. [Google Scholar] [CrossRef]
  41. Ma, H.; Yang, J.; Chen, X.; Jiang, X.; Su, Y.; Qiao, S.; Zhong, G. Deep convolutional neural network: A novel approach for the detection of Aspergillus fungi via stereomicroscopy. J. Microbiol. 2021, 59, 563–572. [Google Scholar] [CrossRef]
  42. Kumar, M.; Gupta, S.; Gao, X.-Z.; Singh, A. Plant species recognition using morphological features and adaptive boosting methodology. IEEE Access 2019, 7, 163912–163918. [Google Scholar] [CrossRef]
  43. Chang, D.; Ding, Y.; Xie, J.; Bhunia, A.K.; Li, X.; Ma, Z.; Wu, M.; Guo, J.; Song, Y.-Z. The devil is in the channels: Mutual-channel loss for fine-grained image classification. IEEE Trans. Image Process. 2020, 29, 4683–4695. [Google Scholar] [CrossRef] [PubMed] [Green Version]
  44. Huang, S.; Wang, X.; Tao, D. Snapmix: Semantically proportional mixing for augmenting fine-grained data. In Proceedings of the AAAI Conference on Artificial Intelligence, Vitural, 22 February–1 March 2021; pp. 1628–1636. [Google Scholar]
  45. Zhang, X.; Lv, Y.; Yao, L.; Xiong, W.; Fu, C. A new benchmark and an attribute-guided multilevel feature representation network for fine-grained ship classification in optical remote sensing images. IEEE J. Sel. Top. Appl. Earth Obs. Remote Sens. 2020, 13, 1271–1285. [Google Scholar] [CrossRef]
  46. Gao, T.; Gao, Z.; Sun, B.; Qin, P.; Li, Y.; Yan, Z. An Integrated Method for Estimating Forest-Canopy Closure Based on UAV LiDAR Data. Remote Sens. 2022, 14, 4317. [Google Scholar] [CrossRef]
  47. Di, Y.; Jiang, Z.; Zhang, H. A public dataset for fine-grained ship classification in optical remote sensing images. Remote Sens. 2021, 13, 747. [Google Scholar] [CrossRef]
  48. Zhang, L.; Fan, Y.; Yan, R.; Shao, Y.; Wang, G.; Wu, J. Fine-Grained Tidal Flat Waterbody Extraction Method (FYOLOv3) for High-Resolution Remote Sensing Images. Remote Sens. 2021, 13, 2594. [Google Scholar] [CrossRef]
  49. Zhang, Y.; Li, Q.; Huang, H.; Wu, W.; Du, X.; Wang, H. The combined use of remote sensing and social sensing data in fine-grained urban land use mapping: A case study in Beijing, China. Remote Sens. 2017, 9, 865. [Google Scholar] [CrossRef] [Green Version]
  50. Tsutsui, S.; Fu, Y.; Crandall, D. Meta-reinforced synthetic data for one-shot fine-grained visual recognition. In Proceedings of the Advances in Neural Information Processing Systems, Vancouver, BC, Canada, 8–14 December 2019; Volume 32. [Google Scholar]
  51. Zheng, H.; Fu, J.; Zha, Z.-J.; Luo, J. Learning deep bilinear transformation for fine-grained image representation. In Proceedings of the Advances in Neural Information Processing Systems, Vancouver, BC, Canada, 8–14 December 2019; Volume 32. [Google Scholar]
  52. Wei, X.-S.; Luo, J.-H.; Wu, J.; Zhou, Z.-H. Selective convolutional descriptor aggregation for fine-grained image retrieval. IEEE Trans. Image Process. 2017, 26, 2868–2881. [Google Scholar] [CrossRef] [Green Version]
  53. Chen, B.; Deng, W.; Hu, J. Mixed high-order attention network for person re-identification. In Proceedings of the IEEE/CVF International Conference on Computer Vision, Seoul, Korea, 27 October–2 November 2019; pp. 371–381. [Google Scholar]
  54. Lin, T.-Y.; RoyChowdhury, A.; Maji, S. Bilinear CNN models for fine-grained visual recognition. In Proceedings of the IEEE/CVF International Conference on Computer Vision, Santiago, Chile, 11–18 December 2015; pp. 1449–1457. [Google Scholar]
  55. Simon, M.; Rodner, E. Neural activation constellations: Unsupervised part model discovery with convolutional networks. In Proceedings of the IEEE/CVF International Conference on Computer Vision, Santiago, Chile, 11–18 December 2015; pp. 1143–1151. [Google Scholar]
  56. Branson, S.; Van Horn, G.; Belongie, S.; Perona, P. Bird species categorization using pose normalized deep convolutional nets. arXiv 2014, arXiv:1406.2952. [Google Scholar]
  57. Sun, M.; Yuan, Y.; Zhou, F.; Ding, E. Multi-attention multi-class constraint for fine-grained image recognition. In Proceedings of the European Conference on Computer Vision, Munich, Germany, 8–14 September 2018; pp. 805–821. [Google Scholar]
  58. Zhang, N.; Donahue, J.; Girshick, R.; Darrell, T. Part-based R-CNNs for fine-grained category detection. In Proceedings of the European conference on computer vision, Zurich, Switzerland, 6–12 September 2014; Springer: Berlin/Heidelberg, Germany, 2014; pp. 834–849. [Google Scholar]
  59. Branson, S.; Beijbom, O.; Belongie, S. Efficient large-scale structured learning. In Proceedings of the IEEE/CVF Conference on Computer Vision and Pattern Recognition, Portland, OR, USA, 23–28 June 2013; pp. 1806–1813. [Google Scholar]
  60. Fu, J.; Zheng, H.; Mei, T. Look closer to see better: Recurrent attention convolutional neural network for fine-grained image recognition. In Proceedings of the IEEE/CVF Conference on Computer Vision and Pattern Recognition, Honolulu, HI, USA, 21–26 July 2017; pp. 4438–4446. [Google Scholar]
  61. Xiao, T.; Xu, Y.; Yang, K.; Zhang, J.; Peng, Y.; Zhang, Z. The application of two-level attention models in deep convolutional neural network for fine-grained image classification. In Proceedings of the IEEE/CVF Conference on Computer Vision and Pattern Recognition, Boston, MA, USA, 7–12 June 2015; pp. 842–850. [Google Scholar]
  62. Wei, X.-S.; Xie, C.-W.; Wu, J.; Shen, C. Mask-CNN: Localizing parts and selecting descriptors for fine-grained bird species categorization. Pattern Recognit. 2018, 76, 704–714. [Google Scholar] [CrossRef]
  63. Gao, Y.; Han, X.; Wang, X.; Huang, W.; Scott, M. Channel interaction networks for fine-grained image categorization. In Proceedings of the AAAI Conference on Artificial Intelligence, New York, NY, USA, 7–12 February 2020; pp. 10818–10825. [Google Scholar]
  64. Liu, F.; Liu, Z.; Liu, Z. Attentive Contrast Learning Network for Fine-Grained Classification. In Proceedings of the Chinese Conference on Pattern Recognition and Computer Vision, Zhuhai, China, 19–21 December 2021; Springer: Berlin/Heidelberg, Germany, 2021; pp. 92–104. [Google Scholar]
  65. Akata, Z.; Reed, S.; Walter, D.; Lee, H.; Schiele, B. Evaluation of output embeddings for fine-grained image classification. In Proceedings of the IEEE/CVF Conference on Computer Vision and Pattern Recognition, Boston, MA, USA, 7–12 June 2015; pp. 2927–2936. [Google Scholar]
  66. Bukchin, G.; Schwartz, E.; Saenko, K.; Shahar, O.; Feris, R.; Giryes, R.; Karlinsky, L. Fine-grained angular contrastive learning with coarse labels. In Proceedings of the IEEE/CVF Conference on Computer Vision and Pattern Recognition, Vitural, 19–25 June 2021; pp. 8730–8740. [Google Scholar]
  67. Conde, M.V.; Turgutlu, K. CLIP-Art: Contrastive pre-training for fine-grained art classification. In Proceedings of the IEEE/CVF Conference on Computer Vision and Pattern Recognition, Vitural, 19–25 June 2021; pp. 3956–3960. [Google Scholar]
  68. Cai, C.; Zhang, T.; Weng, Z.; Feng, C.; Wang, Y. A Transformer Architecture with Adaptive Attention for Fine-Grained Visual Classification. In Proceedings of the International Conference on Computer and Communications, IEEE, Chengdu, China, 10–13 December 2021; pp. 863–867. [Google Scholar]
  69. Huang, Z.; Du, J.X.; Zhang, H.B. A Multi-Stage Vision Transformer for Fine-grained Image Classification. In Proceedings of the International Conference on Information Technology in Medicine and Education, IEEE, Wuyishan, China, 19–21 November 2021; pp. 191–195. [Google Scholar]
  70. Wang, J.; Yu, X.; Gao, Y. Feature fusion vision transformer for fine-grained visual categorization. arXiv 2021, arXiv:2107.02341. [Google Scholar]
  71. Liu, X.; Wang, L.; Han, X. Transformer with peak suppression and knowledge guidance for fine-grained image recognition. Neurocomputing 2022, 492, 137–149. [Google Scholar] [CrossRef]
  72. He, J.; Chen, J.-N.; Liu, S.; Kortylewski, A.; Yang, C.; Bai, Y.; Wang, C. Transfg: A transformer architecture for fine-grained recognition. In Proceedings of the AAAI Conference on Artificial Intelligence, Vitural, 22 February–1 March 2022; pp. 852–860. [Google Scholar]
  73. Joly, A.; Goëau, H.; Kahl, S.; Deneu, B.; Servajean, M.; Cole, E.; Picek, L.; Ruiz de Castañeda, R.; Bolon, I.; Durso, A. Overview of lifeclef 2020: A system-oriented evaluation of automated species identification and species distribution prediction. In Proceedings of the International Conference of the Cross-Language Evaluation Forum for European Languages, Thessaloniki, Greece, 22–25 September 2020; Springer: Berlin/Heidelberg, Germany, 2020; pp. 342–363. [Google Scholar]
  74. Lorieul, T.; Cole, E.; Deneu, B.; Servajean, M.; Joly, A. Overview of GeoLifeCLEF 2022: Predicting species presence from multi-modal remote sensing, bioclimatic and pedologic data. In Proceedings of the Working Notes of CLEF 2022-Conference and Labs of the Evaluation Forum, Bologna, Italy, 5–8 September 2022. [Google Scholar]
  75. Botella, C.; Bonnet, P.; Munoz, F.; Monestiez, P.P.; Joly, A. Overview of GeoLifeCLEF 2018: Location-based species recommendation. In Proceedings of the Working Notes of CLEF 2018-Conference and Labs of the Evaluation Forum, CEUR-WS, Avignon, France, 10–14 September 2018. [Google Scholar]
  76. Botella, C.; Servajean, M.; Bonnet, P.; Joly, A. Overview of GeoLifeCLEF 2019: Plant species prediction using environment and animal occurrences. In Proceedings of the Working Notes of CLEF 2019-Conference and Labs of the Evaluation Forum, Lugano, Switzerland, 9–12 September 2019. [Google Scholar]
  77. Lorieul, T.; Cole, E.; Deneu, B.; Servajean, M.; Bonnet, P.; Joly, A. Overview of GeoLifeCLEF 2021: Predicting species distribution from 2 million remote sensing images. In Proceedings of the Working Notes of CLEF 2021-Conference and Labs of the Evaluation Forum, Bucharest, Romania, 21–24 September 2021; pp. 1451–1462. [Google Scholar]
  78. Jia, X.; De Brabandere, B.; Tuytelaars, T.; Gool, L.V. Dynamic filter networks. In Proceedings of the Advances in Neural Information Processing Systems, Barcelona, Spain, 5–10 December 2016; Volume 29. [Google Scholar]
  79. Yang, B.; Bender, G.; Le, Q.V.; Ngiam, J. Condconv: Conditionally parameterized convolutions for efficient inference. In Proceedings of the Advances in Neural Information Processing Systems, Vancouver, BC, Canada, 8–14 December 2019; Volume 32. [Google Scholar]
  80. Sun, P.; Zhang, R.; Jiang, Y.; Kong, T.; Xu, C.; Zhan, W.; Tomizuka, M.; Li, L.; Yuan, Z.; Wang, C. Sparse r-cnn: End-to-end object detection with learnable proposals. In Proceedings of the IEEE/CVF Conference on Computer Vision and Pattern Recognition, Vitural, 19–25 June 2021; pp. 14454–14463. [Google Scholar]
Figure 1. The architecture of our proposed DViT. The RGB and NIR image is input into the LMT module to sample a subset of patches to remove patches with low representability. Then, the multimodal geo-location environment embedding is fused with multimodal image patches to enhance the distinguishability of the image latent representation by the dynamic transformer encoder module. Finally, the enhanced multimodal image representation is used for species recognition.
Remotesensing 14 05242 g001
Figure 2. The architecture of the LMP model in the RGB image path. The RGB image is divided into regular non-overlapping patches, x p , and these patches are input into LMT to sample a subset of patches, x s .
Remotesensing 14 05242 g002
Figure 3. Comparisons between the two versions of the DAF model. DAF-A is the basic version and DAF-B is the concatenated image embedding and multimodal location environment embedding.
Remotesensing 14 05242 g003
Figure 4. The observation data of the location [43.779, 3.812] in GeoLifeCLEF 2021.
Remotesensing 14 05242 g004
Figure 5. The observation data of the location [32.957, −96.470] in GeoLifeCLEF 2022.
Remotesensing 14 05242 g005
Figure 6. The species observation distribution of the GeoLifeCLEF 2021 and 2022 datasets.
Remotesensing 14 05242 g006
Table 1. The summary of multimodal fusion methods for species recognition.
MethodsInputMethodAdvantagesDrawbacks
ConcatNetImage, Longitude, LatitudeConcatThe prior knowledge of the location and environmental information can help improve species recognition performanceEmbedding redundancy
GeoNetImage, Longitude, LatitudeAddThese methods do not consider the correlation between image and location context information
PriorsNetImage, Longitude, Latitude, DateMultiply
EnsembleNetImage, Longitude, Latitude, Date, Weather, Habitat, Recorder
Dynamic MLPImage, Longitude, Latitude, DateDynamic projectingThe location environment information dynamic enhancement of the image embeddingThe method does not consider the effect of metadata on the distinguishability of image local embedding
Table 2. The sample statistics of GeoLifeCLEF 2021 and 2022.
GeoLifeCLEF 2021GeoLifeCLEF 2022
PlantaeN/A9080
AnimaliaN/A7957
Species31,17917,037
Train1,833,2721,587,395
Validation45,44640,080
Test42,40536,421
Table 3. Comparisons with previous results for mask sampling strategies based on the ViT backbone of GeoLifeCLEF 2022.
Mask Sampling StrategiesPublicPrivate
Block0.68240.6972
Grid0.67380.6785
Random0.66260.6647
Learnable0.65940.6567
Table 4. Comparisons with previous results for the backbone of GeoLifeCLEF 2022. The ViT models are B/16, L/16, and H/14.
DAFPublicPrivate
ViT-B/160.69460.6946
ViT-L/160.67420.6742
ViT-H/140.65940.6567
Table 5. Comparisons between different DAF models. RGB”, “NIR”, and “L-E” indicate the input feature type for the RGB path, NIR path, and multimodal location environment path.
DAFRGBNIRL-EPublicPrivate
ViT 0.69540.6938
ViT 0.71060.7135
ViT 0.69240.6893
DAF-A 0.68160.6842
DAF-A 0.66870.6719
DAF-A0.66030.6594
DAF-B 0.67540.6719
DAF-B 0.66450.6623
DAF-B0.65940.6567
Table 6. The top-30 error rate with image-only and multimodal fusion models using the GeoLifeCLEF 2021 and 2022 public dataset (left) and private dataset (left).
BackboneMethodsGeoLifeCLEF 2021GeoLifeCLEF 2022
PublicPrivatePublicPrivate
ResNetRGB0.75670.76830.72580.7325
NIR0.77430.77940.73540.7468
RGB+NIR0.75280.76680.73380.7334
ConcatNet [15]0.75740.75830.73160.7310
PriorsNet [14]0.75690.75140.73030.7283
GeoNet [13]0.74510.74470.72850.7258
EnsembleNet [29]0.74170.74030.72510.7196
Dynamic MLP [17]0.73990.73710.70390.6974
DenseNetRGB0.75630.75470.68890.6807
NIR0.75830.75560.70240.7124
RGB+NIR0.75240.75380.68240.6810
ConcatNet [15]0.74050.74960.68790.6775
PriorsNet [14]0.74300.74040.68760.6791
GeoNet [13]0.74790.74610.68670.6759
EnsembleNet [29]0.74650.74230.68030.6673
Dynamic MLP [17]0.73600.73960.67230.6658
ViTRGB0.79370.79500.78870.7889
NIR0.79680.78900.78930.7913
RGB+NIR 0.78450.76160.75840.7507
ConcatNet [15]0.77260.77540.73980.7334
PriorsNet [14]0.76050.76270.72910.7225
GeoNet [13]0.75980.75460.71760.7107
EnsembleNet [29]0.74270.74470.68010.6810
Dynamic MLP [17]0.73200.73540.66810.6689
DViT (ours)0.72780.72970.65940.6567
Table 7. For the validation set: the top-1 accuracy, top-30 accuracy, precision, and recall metrics comparison of the DViT with the image-only and multimodal fusion Dynamic MLP using GeoLifeCLEF 2021.
MethodsParamsAcc@1Acc@30PrecisionRecall
ResNet on RGB+NIR58 M3.7826.310.01000.0054
ResNet on Dynamic MLP64 M4.1628.560.01240.0079
DenseNet on RGB+NIR82 M3.8826.380.01110.0053
DenseNet on Dynamic MLP86 M4.2929.350.01320.0086
ViT on RGB+NIR640 M3.2724.610.00740.0048
ViT on Dynamic MLP642 M4.3628.920.01290.0074
DViT (ours)163 M4.6330.820.01430.0096
Table 8. For the validation set: the top-1 accuracy, top-30 accuracy, precision, and recall metrics comparison of the DViT with the image-only and multimodal fusion Dynamic MLP using GeoLifeCLEF 2022.
MethodsParamsAcc@1Acc@30PrecisionRecall
ResNet on RGB+NIR58 M4.2328.440.01270.0057
ResNet on Dynamic MLP64 M4.4831.940.01430.0072
DenseNet on RGB+NIR82 M5.0634.720.01540.0084
DenseNet on Dynamic MLP86 M5.4735.640.01780.0111
ViT on RGB+NIR640 M3.7226.310.00990.0052
ViT on Dynamic MLP642 M5.7536.810.02160.0132
DViT (ours)163 M5.9837.560.02340.0141
Publisher’s Note: MDPI stays neutral with regard to jurisdictional claims in published maps and institutional affiliations.

