Abstract
Banana (and plantain, Musa spp.), in sub-Saharan Africa (SSA), is predominantly grown as a mixed crop by smallholder farmers in backyards and small farmlands, typically ranging from 0.2 ha to 3 ha. The crop is affected by several pests and diseases, including the invasive banana bunchy top virus (BBTV, genus Babuvirus), which is emerging as a major threat to banana production in SSA. The BBTV outbreak in West Africa was first recorded in the Benin Republic in 2010 and has spread to the adjoining territories of Nigeria and Togo. Regular surveillance, conducted as part of the containment efforts, requires the identification of banana fields for disease assessment. However, small and fragmented production spread across large areas poses complications for identifying all banana farms using conventional field survey methods, which is also time-consuming and expensive. In this study, we developed a remote sensing approach and machine learning (ML) models that can be used to identify banana fields for targeted BBTV surveillance. We used medium-resolution synthetic aperture radar (SAR), Sentinel 2A satellite imagery, and high-resolution RGB and multispectral aerial imagery from an unmanned aerial vehicle (UAV) to develop an operational banana mapping framework by combining the UAV, SAR, and Sentinel 2A data with the Support Vector Machine (SVM) and Random Forest (RF) machine learning algorithms. The ML algorithms performed comparatively well in classifying the land cover, with a mean overall accuracy (OA) of about 93% and a Kappa coefficient (KC) of 0.89 for the UAV data. The model using fused SAR and Sentinel 2A data gave an OA of 90% and KC of 0.86. The user accuracy (UA) and producer accuracy (PA) for the banana class were 83% and 78%, respectively. The BBTV surveillance teams used the banana mapping framework to identify banana fields in the BBTV-affected southwest Ogun state of Nigeria, which helped in detecting 17 sites with BBTV infection. These findings suggest that the prediction of banana and other crops in the heterogeneous smallholder farming systems is feasible, with the precision necessary to guide BBTV surveillance in large areas in SSA.
1. Introduction
Banana (and plantain, Musa spp.) is an important staple food for nearly 100 million people and supports rural livelihoods and food security in sub-Saharan Africa (SSA) [1]. The crop is predominantly grown as a semi-perennial mixed crop along field boundaries and backyards by smallholder farmers whose farmland holdings typically range from 0.2 ha to 3 ha [2]. The FAO estimate suggests that the crop is cultivated across 6.7 million hectares of land in SSA, representing 59.7% of the total global banana and plantain production area [3]. However, due to the low productivity of this 6.7 t/ha, the total annual production of 48.5 million tonnes accounts for 29.8% of the global output [3]. Cultivation under subsistence farming conditions, low soil fertility, and pests and diseases have contributed to this low productivity.
Out of many diseases affecting banana production, the bunchy top disease caused by the banana bunchy top virus (BBTV, genus Babuvirus) has emerged as a major constraint on banana production in SSA [4]. Within the past decade, BBTV spread has been reported in at least six countries, with an outbreak in West Africa first reported in Benin in 2011 [5], in 2012 in Nigeria [6], and in 2018 in Togo [7]. Recently, BBTV has spread to East Africa, mainly Uganda [8] and Tanzania [9], indicating the further expansion of the virus across the continent. The required ground-level scouting and extensive surveillance required to identify BBTV-infected banana stands across a large area is a tall order due to the fragmented nature of the plantations, including in backyards, unmanaged habitats, abandoned plantations, and the fact that many farms are difficult to access due to a lack of roads. BBTV surveillance, under such conditions, requires local individuals to guide the survey teams to the banana fields. However, this approach has not only proven to be difficult and time-consuming, but it is also often marked by the unintentional omission of several banana farms, with implications for the representativeness of the incidence mapping and full remediation of the disease within the target geography. This suggests a critical need for alternative and reliable approaches to rapidly map banana lands in order to support efficient BBTV surveillance, such as the use of high-resolution satellite imagery and unmanned aerial vehicles (UAVs) for the mapping of banana fields prior to disease scouting.
Satellite imagery has been used extensively in combination with machine learning (ML) models to map vegetation and crop types on the local and regional scales [10,11,12,13]. For instance, MODIS satellite data are available at a spatial resolution of 250 m and well suited for regional-scale mapping. However, Landsat and Sentinel 1 and Sentinel 2 data possess an intermediate resolution (10–30 m) and have been widely used for landscape mapping [13,14]. Commercial satellite technologies, such as IKONOS, QuickBird, and WorldView multispectral imagery, have been successfully utilized for more detailed crop mapping in precision agriculture [15,16].
The successful application of remote sensing products depends on the data characteristics and the type of analytics applied. There are diverse ML techniques, comprising conventional models, such as Random Forest (RF), Support Vector Machine (SVM), decision trees (DT), and k-nearest neighbors (KNN), as well as deep learning and neural networks models, such as convolution neural network (CNN) and multi-layer neural network (MLP). ML algorithms accept various input predictor data, without assumptions about the data distribution, in order to classify land cover types in remotely sensed imageries [1,17]. RF and SVM are the two most common models that have been applied for cropland mapping in various contexts due to their ability to handle high-dimensional spectral data for crop and landcover classification [18,19,20,21].
Several studies have applied ML combined with satellite and drone imagery when classifying crops [22,23]. For instance, ML algorithms and Sentinel 2A data were used to identify crops such as soybean, rice, and maize in the Jilin Province of China, with a high classification accuracy of >90% [20]. Multispectral Sentinel 2A data were used to classify crop types and accurately distinguish between crops on the landscape scale in India [24]. Airborne orthophotos, combined with object-based image analysis, were used to detect banana plants in order to aid in the BBTV eradication program in Australia [25]. A deep learning model algorithm was developed in order to train drone imagery acquired in the smallholder system of Rwanda to identify maize, beans, and bananas [26]. A combination of UAV and other optical satellite imagery were used to detect bananas for banana disease surveillance in Benin and the Democratic Republic of Congo (DRC) [27]. Recently, UAV-based multispectral data were used for the automated detection of individual banana plants in monocultures in Australia [12].
Although these studies have demonstrated the utility of employing UAV and satellite imagery data to map crops, limitations associated with the spatial resolution persist, especially in the case of smallholders’ patchy farm sizes in heterogeneous landscapes [28]. In the banana-growing areas of West Africa, the operational use of optical satellite imagery is limited by cloudy weather conditions, which degrade the quality of the images [29,30]. Persistent cloud cover during the cropping season prevents the acquisition of useable optical imagery that captures the crop phenology for accurate mapping. On the other hand, the utility of synthetic aperture radar (SAR) is unlimited throughout the crop cycle. SAR imagery shows potential because it is not affected by weather and clouds and can discriminate between crop structural and geometric features. Many studies have demonstrated an improved classification accuracy by integrating SAR imagery with optical data [30,31]. Yet, limited knowledge exists regarding the potential value of combining this technique with UAV-derived and Sentinel 2 imageries for land cover classification in complex smallholder farming systems.
Therefore, this study was conducted in order to develop an operational banana mapping framework by combining UAV, SAR, and Sentinel 2 imagery with RF and SVM analytics to identify bananas in heterogenous smallholder farming systems in SSA and to use the maps to guide rapid and efficient BBTV surveillance in SSA.
2. Materials and Methods
2.1. Study Area
This research was carried out in an area of about 32,500 ha in four local government areas (LGA) of Ogun State, Nigeria, where BBTV occurrence was first recognized in 2012 [6] (Figure 1). The main trees and common arable crops cultivated in the region include cocoa, oil palm, oranges, maize, cassava, banana/plantain, cowpea, and vegetables. Farmers predominantly practice intercropping or mixed cropping, and monocropping is rare. The land in this area includes evergreen lowland forest and deciduous woodland, with pockets of agricultural land. The topography varies from nearly flat to moderately high slopes with a mean elevation of about 60 m above sea level (masl) and a mean gradient of 16%. The major soil types in this area are Lixisols, Nitisols, and Fluvisols [32]. The site is characterized by a sub-humid tropical climate with a mean annual rainfall of about 1200–1300 mm, an annual mean temperature ranging from 31.2 to 32.0 °C at the maximum, and a minimum temperature of 22.3 to 23.1 °C. The rain starts around March and continues until the end of October [33].
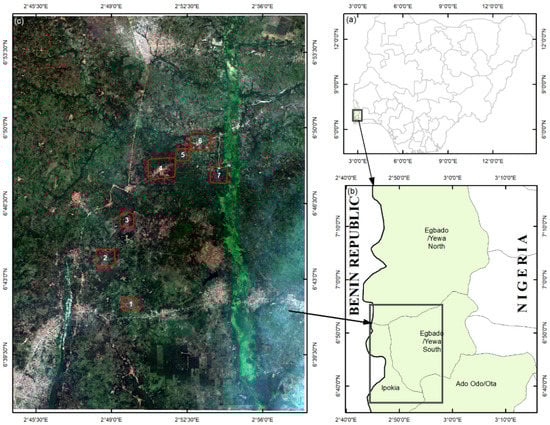
Figure 1.
(a) Geographic location of the study area in Nigeria. (b) Map of four local government areas (LGAs) affected by the banana bunchy top virus (BBTV) in the Ogun state, Nigeria, where the area used for banana and BBTV assessment is indicated by a black rectangle. (c) Natural color composite of the Sentinel 2A map of the study area with markings of the seven UAV flight sites (red outlines). (1) Okoeye, (2), Olujere, (3) Erimi, (4) Olokuta, (5) Ipaja Road, (6) Ipaja Town, and (7) Igbeji.
2.2. UAV Data Acquisition
A senseFly eBee X fixed-wing UAV (Sensefly, Cheseaux-Lausanne, Switzerland) was used to acquire ultra-high-resolution images of the seven geographic sites (Figure 1c). The UAV has a 116 cm wingspan weighing between 1.1 to 1.4 kg, fitted with a Parrot Sequoia RGB and multispectral camera combined with four radiometric self-calibrating sensors (green: 530–570 nm, red: 640–680 nm, red edge: 730–740 nm, and near-infrared: 770–810 nm), an integrated irradiance sensor (sunshine sensor) to synchronize the irradiance values with the onboard GPS, an inertial measurement unit (IMU), and a magnetometer. The ancillary real-time kinematic (RTK) positioning satellite navigation tool was activated to enhance the precision of the position data derived from the satellite positioning systems during each UAV flight. The RTK activation achieved an accuracy of about 3 cm without ground control points (GCPs). Preliminary surveys were conducted in August 2020 and identified seven UAV flight mission sites based on the banana cultivation diversity and intensity (Table 1). Subsequent flight missions were conducted between 9–12 December 2020, which coincided with the end of the rainy season, when the fields contained the most arable crops that were mature for harvest. Of the seven UAV flight areas, the largest was the Olokuta site (390 ha) and the smallest was Ipaja Road (117 ha) (Table 1).

Table 1.
Details of the UAV flight sites, land area covered, and images collected during flight missions.
Flight parameters similar to those described in Böhler et al. [34] were adopted, with lateral and longitudinal overlaps set at 60% and 80%, respectively, to ensure optimal UAV image overlap. The resolution per pixel ranged from 10 cm to 15 cm, while the flight altitude ranged from 74.3 m/AED to 106.1 m/AED. The same standard protocol was used for all the flight missions, and we took images of the physical radiometric targets before each flight. The eMotion software version 3.16 (Sensefly, Cheseaux-Lausanne, Switzerland) was used for the flight planning and mission control. The UAV flew to pre-determined waypoints according to flight plans pre-programmed using the eMotion software (AgEagle Aerial Systems Inc., Wichita, KS, USA). The total area covered by the drone flight missions for the seven sites was about 1450 ha, and about 44,030 multispectral and RGB images were acquired during the various flight missions (Table 1).
2.3. UAV Image and Ancillary Data Processing
All images collected during UAV flight missions were processed using the eMotion flight data manager. The optimized images were further processed using photogrammetric imagery processing software, Pix4D Mapper (Pix4D SA, Lausanne, Switzerland), for the image geo-tagging and correction of terrain and platform distortions. The irradiance values obtained from the sunshine sensor were used to generate orthomosaics of the reflectance data [16]. The reflectance bands produced were mosaiced at a spatial resolution of 12 cm. A similar procedure was used to create ortho-rectified RGB mosaic images at a 2.5 to 3.5 cm spatial resolution. The digital terrain model (DTM) and digital surface model (DSM) were produced as ancillary data based on the structure of the motion point cloud (SfM) by the Pix4D Mapper (Pix4D S.A., Prilly, Switzerland). The difference between the DSM and DTM was used to obtain the height raster of the above-ground object, which was used to discriminate between objects such as trees, buildings, and crops [35].
2.4. Sentinel 1 Image and Preprocessing
The eight C-band data (wavelength ~6 cm), formatted as interferometric wide (IW)-swath single and dual polarization images acquired in all light and weather conditions by the European Space Agency Copernicus program Sentinel 1 SAR satellites 1A and 1B between June and December 2020, were downloaded from the source website (https://scihub.copernicus.eu/dhus/#/home (accessed on 25 March 2021)), and the ground range detected (GRD) products, level-1C images, were used (Table 2). We selected eight corresponding SAR images of the study site of the banana-growing area at an incidence angle (0) of about 30.9–46 and processed each image using the Sentinel Application Platform (SNAP) software version 8. First, we conducted the precise orbit determination (POD) using the orbit file and then conducted the terrain correction using a subset of the image within the extent of the study area. After removing the thermal noise, radiometric calibration, geometric correction, and speckle filtering were performed [30,36]. The final image was converted from linear to dB (logarithmic) format and exported to Geotiff format for further analysis.
Table 2.
Details of Sentinel 1, SAR, and Sentinel 2A data acquired between June and December 2020.
2.5. Sentinel 2 Image and Preprocessing
The Sentinel 2A (S2A) images accessed were captured on 26 December 2020, as this was the closest cloud-free temporal match with the UAV data obtained from 9–12 December 2020. Sentinel 2A (S2A) is one of the two polar-orbiting satellites in the same sun-synchronous orbit, phased at 180° to each other. The S2A has 13 spectral bands at different spatial resolutions (10, 20, and 60 m) (Table 2). Ten bands were used for the subsequent analysis, excluding bands 1, 9, and 10 for aerosol, water vapor, and cloud monitoring. Using the Sen2Cor toolbox in SNAP, we performed an atmospheric correction and used resampled bands to obtain a 10 m/pixel resolution using the bilinear interpolation method.
2.6. Processing of Vegetation Indices
Vegetation indices (VIs) are crucial in image analysis for crop identification and land cover classification [34,35,36]. VIs provides additional information from original spectral reflectance bands to discriminate better vegetative and land cover types, including landcover characteristics such as soil brightness, crop stress, water content, and crop chlorophyll [37,38]. We generated thirty VIs from the original spectral reflectance bands to identify vegetation and landcover classifications such as soil brightness, crop stress, water content, and crop chlorophyll [35,36]. Due to the limited spectral characteristics of the UAV data, only eleven UAV-based VIs were computed (marked with asterisks in Supplementary Table S1). We used the function spectral indices from the RStoolbox package within R software (Vienna, Austria) to calculate all the Vis [39,40].
2.7. Image Classification
The image classification was implemented based on the integration of various features and data fusion. We assessed the performance of the ML classification models with regard to the spectral bands, vegetation indices, and a combination of bands and indices derived from the UAV, S2A, and SAR data (Table 3). The numbers of predictor variables used for the different datasets for modeling purposes are shown in Table 3.
Table 3.
List of parameters used for the image classification.
Geotagged photos were collected as reference field data during the UAV flight missions. In addition, the on-screen digitization of the UAV RGB mosaics was performed with ArcGIS 10.7 software (ESRI, Redlands, CA, USA) [41] to obtain training polygons for different crop and landcover classes. Training sample polygons for each UAV flight site were obtained for seven landcover and crop type classes, including banana, cassava, maize, forest, grassland, buildings, and bare ground/dirt road. The crop type and landcover classifications were performed using the caret tool [42] within the R software [43]. The ground truth data were split 70:30 into training and testing datasets using the createDataPartition function of the caret package.
2.8. Machine Learning Algorithms
Two commonly employed ML algorithms, RF and SVM, were explored for the banana and landcover classification in the target area using the UAV, Sentinel 2, and SAR data. The banana mapping workflow is shown in Figure 2.
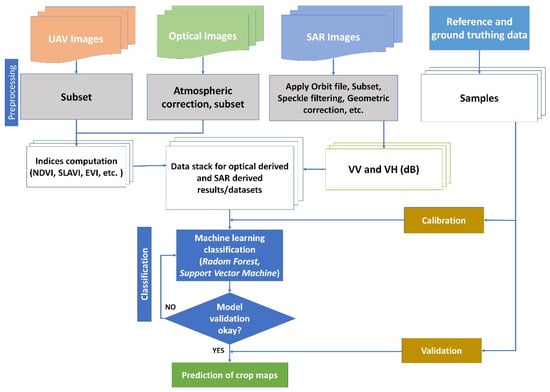
Figure 2.
Workflow of unmanned aerial vehicle (UAV), synthetic aperture radar (SAR), and Sentinel 2 data processing for banana mapping.
2.8.1. Random Forest Classifier
The RF classification algorithm forms predictions by training several decision trees in parallel through bagging [44], a process of stepwise bootstrapping followed by aggregation [45]. The R caret package was systematically used by comparing different algorithms to implement various ML methods. RF has two major parameters, namely mtry (the number of variables randomly sampled at each split) and ntree (the number of trees to grow), which are tuned to obtain an accurate model. Parameter tuning was executed in order to optimize the RF model performance within the R caret package. The parameter tuning involved a 10-fold cross-validation and was repeated thrice for each model. In addition, the ranger package was used for the RF model. Parameter tuning was used to optimize the mtry, while the ntree was held as constant at 500, and the minimum node size was 1. The optimal mtry was achieved with the best accuracy and varied according to the number of input variables.
2.8.2. Support Vector Machine Classifier
SVM is a machine learning method based on the learning theory of statistics, where decision boundaries accounting for the maximum separation between features are established. For a two-feature problem, the margin or separation equates to the sum distances to the hyperplane from the closest points of the two features [46]. The points closest to the decision boundary are called support vectors. SVM works seamlessly for linearly separable classes. However, the kernel concept is introduced for non-linear cases. The kernel transforms the classes into a higher dimension to enhance the linear separability [46,47].
The SVM comprises four commonly employed kernel types: the radial basis function (RBF) and the linear, polynomial, and sigmoid functions. This study used the Gaussian radial basis kernel function within the R caret package. Two parameters, the cost (C) and gamma (γ), were tuned using a 10-fold cross-validation and repeated three times to select the best model.
2.9. Accuracy Assessment
We employed the Confusion Matrix function in the caret package to assess the performance of the models. The procedure generated the overall accuracy (OA), producer accuracy (PA), user accuracy (UA), and kappa coefficient (KC) required to evaluate the model performance and accuracy of the resulting maps. Descriptions of OA and KC are written in the equations presented below:
where TP and TN are the samples predicted as true positives and true negatives, FN and FP are false negatives and false positives, and Pr is the probability of chance agreement.
The Wilcoxon rank-sum test, a nonparametric alternative two-sample t-test, was performed to compare the RF and SVM models across all datasets [48]. The Wilcoxon signed-rank test with continuity correction was carried out using the R software. In addition, the Kruskal–Wallis rank sum test, a pairwise comparison used to identify the significant pairings among the accuracies of the different datasets, was performed [49].
Variable importance to identify significant features contributing to the models’ performance was computed using the Boruta package in the R software [50]. This procedure enwraps the RF algorithm and iteratively eliminates the elements considered statistically insignificant for the classification of the model performance [51]. Several studies have shown that the Boruta package as one of the most accurate feature selection methods [52,53].
2.10. Evaluation of the Banana Land Cover Maps for BBTV Surveillance
The utility of the banana land cover map generated by the model established in the study was assessed for the purpose of BBTV surveillance. The GPS coordinates of the plantations evaluated in 2019 and 2020 were mapped in the landcover map to identify the occurrence of banana fields in the vicinity of disease-affected plantations for the BBTV assessment. A survey team identified about 40 plantations for BBTV assessment by visually examining the plants for typical BBTV symptoms in August 2021. The data collected were used to map the virus-affected and unaffected plantations.
3. Results
3.1. UAV Classification Performance across Locations and Datasets with the Two ML Models
The classification performance parameters of the four UAV datasets, namely UAV-B, UAV-VI, UAV-BVI, and BVI-H, were compared across four UAV flight missions using the RF and SVM models (Table 4 and Table 5). The overall accuracies (OAs) exceeded 89% (mean = 93%) for the datasets that included the height for both classifiers. The Kappa coefficients (KC) were equally high, with a mean of 0.89 and range between 0.85 and 0.93 for the datasets that included the vegetation height. However, when height was excluded from the input features of the two ML models, the changes in the OA values were substantial. Overall, the OA values decreased from 8% to about 20% for the BVI-H dataset across all the locations compared to the other UAV-derived datasets. The location appeared to impact the performance of the models as well. For instance, the KC values for the RF classifier declined from 0.87 to 0.69 at Olokuta and 0.91 to 0.75 at Igbeji (comparing UAV-BVI to BVI-H) (Table 4). We observed a similar declining trend in the OA and KC values using the SVM algorithm at all locations for the datasets in which height was excluded.
Table 4.
Performance of the Random Forest (RF) and Support Vector Machine (SVM) models applied to UAV datasets in four sites in Nigeria.
Table 5.
UAV user accuracy (UA) and producer accuracy (PA) for Random Forest (RF) and Support Vector Machine (SVM) model performance.
3.2. Class-Specific Classification Performance for the UAV Datasets Using the Two ML Models
Using the BVI dataset for the crop classes (banana, cassava, and maize), we obtained moderately high UA values, which ranged from 77.4 to 83.3% for the RF model and from 54.1 to 74.7% for the SVM at the Olokuta site (Table 5). The range of the UA values at Ipaja Town showed a moderately accurate prediction, as it varied from 69.3 to 91.8% using the RF classifier and from 52.8 to 91.4 for the SVM. Furthermore, the PA values across the crop classes exhibited a similar pattern using the two classifiers for the BVI dataset. UA and PA values obtained for the banana crop were consistently higher than 69% for the RF classifier, outperforming the SVM classifier. Using the complete dataset (BVI), maize was the most accurately classified among the three crops, followed by cassava.
For bananas, the exclusion of the canopy height (BVI-H) decreased UA values obtained from the RF model from 77.4 to 49.1% at Olokuta and 69.3 to 14.1% at Ipaja Town. Similarly, without BVI-H, the UA values obtained for the SVM classifier also declined from 74.7 to 35.4% at Olokuta and from 52.8% to 6.6% at Ipaja Town. Similar decreases were noted in the cassava class across all the reference locations. The inclusion of the UAV-estimated vegetation height data considerably improved the crop type classification in the study area.
The two ML models performed well in predicting the three non-crop classes (buildings, forests, and bare ground/roads), with UA and PA values always higher than 95% based on the BVI dataset. Among the non-crop classes, grassland was the most difficult to classify. The UA and PA values ranged between 53.5% and 71.7% at Olokuta for the BVI dataset and declined further after excluding the vegetation height (BVI-H). The spectral profile of the UAV multispectral reflectance bands extracted for the major landcover types is presented in Supplementary Figure S2.
3.3. UAV RF and SVM Confusion Matrices by Crop Type and Other Land Use Types
The classification performance according to the class categories for the Olokuta site was representative of the other sites. Therefore, only the confusion matrix for this site is presented here (Table 6). For the crop classes (banana, cassava, and maize), misclassifications were uncommon with respect to the building and bare ground/road classes. However, the RF and SVM models often misclassified the forest class as bananas. This was not a surprise, considering that the cultivation of bananas often takes place under or near forest canopies with other tree crops, such as oil palm, citrus, cocoa, and evergreen deciduous tree species. The prediction maps generated by the RF and SVM classifiers are comparable (Figure 3). The relative intensity of the banana presence per location corresponds to the ground-level observations during the field mission. Both the RF and SVM classifiers predicted a similar areal range of bananas at all sites. For the Igbeji site, the RF estimated the banana land area as 44.74 ha, while SVM estimated it as 43.18 ha. At Ipaja Town, the RF estimated an area of 11.49 ha for the banana class, while SVM estimated 11.06 ha (Table 7; Figure 3).
Table 6.
Confusion matrices of RF and SVM for the complete UAV dataset at the Olokuta site in Nigeria.
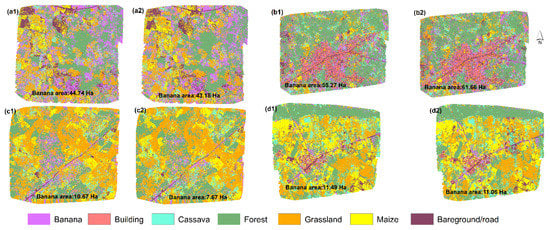
Figure 3.
Model prediction maps for (a) Igbeji, (b) Olokuta, (c) Ipaja Road, and (d) Ipaja Town using Random Forest (1) and Support Vector Machine (2) at four UAV flight sites. The predicted banana crop area (ha) is indicated on the maps.
Table 7.
Estimated banana area (ha) based on UAV and Sentinel 2 + SAR data.
3.4. Random Forest and Support Vector Machine Classification Performance for Different Sentinel 2A and SAR Datasets
Compared to the classification results achieved with the Sentinel 2A and SAR datasets, the S2BVI-SAR dataset performed best, with OA values of 89.8% and 89.0% for the RF and SVM, respectively (Table 8). This is followed by the classification performance based on the S2B datasets, with 88 and 86% OA values for the RF and SVM, respectively. Although the Kruskal–Wallis test suggested that the OA values were significantly different between the five Sentinel 1 and 2 datasets (p value < 0.00424), the observed significance was mainly due to OA differences between S2BVI-SAR and SAR. The RF classification algorithm generally outperformed the SVM for the five datasets with respect to the OA and KC, and the differences were significant according to the Wilcoxon signed-rank test (p value < 0.005761). The lowest prediction performance was observed when only the SAR dataset was processed as an input to the ML models. Overall, the S2BVI-SAR dataset generated the best classification performance (OA = 89.8).
Table 8.
User accuracy (UA) and producer accuracy (PA) of the Sentinel 2A and SAR integrated dataset experiments.
The classification accuracies per class varied, with UA values ranging from 100% for the water class to 55.7% for bananas. Using the S2BVI-SAR dataset, the banana class was the most accurately predicted among the three crop classes, with UA values of 83 and 74% and PA values of 77.7% and 72.8% for the RF and SVM classifiers, respectively. The cassava class under this dataset configuration was the second most successfully classified crop type. The SAR dataset generated low classification performance metrics. Specifically, the SVM classified the banana class poorly, as the UA decreased from 74% to 28% and the PA from 72% to 49%, relative to the accuracy achieved using the S2BVI-SAR dataset. The performance was better with the RF classifier, as the UA value decreased from 83% to 64.3%. Similar to the results of the UAV data, the confusion matrix (Supplementary Table S2) shows that the banana was confused with the forest class. The spectral profiles of the Sentinel 2A multispectral reflectance bands for the major landcover types are presented in Supplementary Figure S3.
Our models accurately delineated roads, bare ground, water, and built-up areas on the maps. Using the two maps (Figure 4), clusters of banana farms were identified around the northeastern and southeastern parts of the study region. Banana plantations were frequently detected as being concentrated around built-up areas, in correlation with our field-observed knowledge, as backyard banana farming was common in the study area. The estimated banana area predicted by the RF model was 2210 ha, slightly lower than the 2262 ha predicted by the SVM classifier for the entire study area of 32,500 ha (Figure 4). Maize and cassava were the two most essential arable crops in the study area and were scattered throughout the study sites. Both models performed accurately in the discrimination of crop and landcover types in the study area based on the visual inspection of both predicted maps. To illustrate the mapping accuracy, we conducted a comparison of the predictions of RF and SVM using the UAV and combined Sentinel 2A and SAR data in the Olokuta site, where banana production is high compared to the other sites, assessed using UAV (Figure 5).
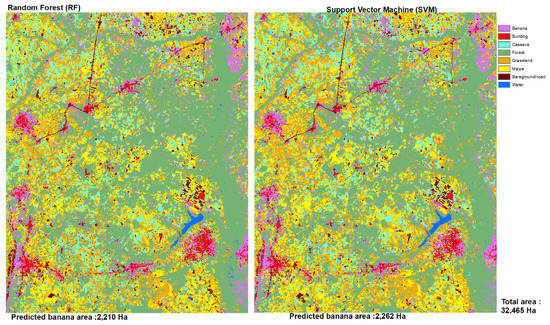
Figure 4.
Prediction maps of the combination of the optical and SAR datasets by Radom Forest (left) and Support Vector Machine (right) models in the Idologun region, Ogun state in Nigeria.
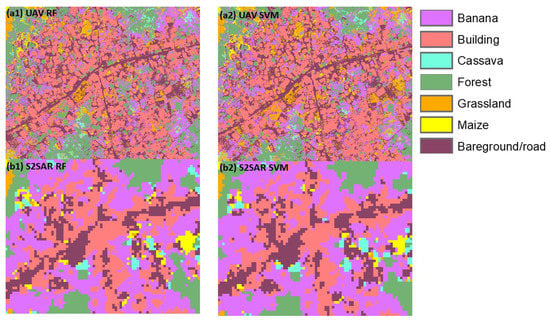
Figure 5.
Comparison of the predictions of the Random Forest (RF) and Support Vector Machine (SVM) models for the UAV and Sentinel 2A data, fused with SAR data, in a high-density banana production site (Olokuta, Nigeria).
3.5. Use of a Banana Predictor Map for BBTV Surveys
The GPS coordinates of the locations of the banana farms investigated for BBTV occurrence between 2019 and 2020 were mapped onto the predicted map, developed by combining the optical and SAR datasets using the banana mapping workflow established in this study (Figure 6). The predicted map revealed several banana fields in the landscape, many of which were not investigated for BBTV during the previous surveys. Surveys conducted in about 40 new sites selected using the banana predicted map (marked with black circles in Figure 6) in August 2021 revealed BBTV occurrence in 17 new sites (Table 9). This case illustrates the benefits of the predicted map for the rational planning of surveillance locations, including the identification of sites in the vicinity of the disease with the greatest need for the implementation of containment measures.
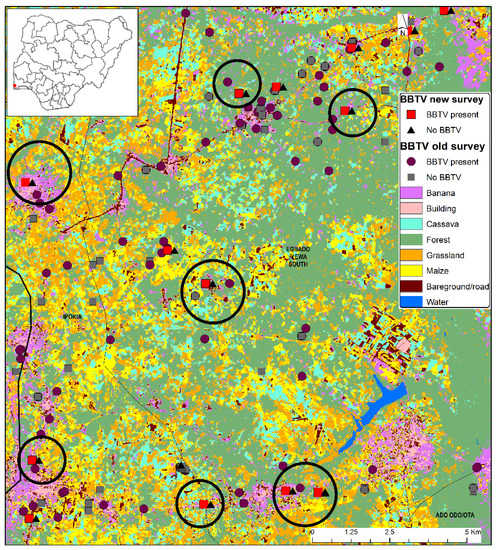
Figure 6.
Prediction of banana and other land cover types on the sites of BBTV occurrence in the Idologun region in Nigeria. New survey areas for BBTV surveillance identified using the banana mapping framework developed in this study are shown in black circles.
Table 9.
Summary of banana field sites surveyed for the occurrence of BBTV in the Idologun region of Ogun State, Nigeria.
The ML models established in this study were inadequate for identifying BBTV-infected shoots using UAV or satellite imagery due to insignificant differences in the spectral profiles. The BBTV symptoms constitute the severe shortening of the pseudostem and petioles and narrowing of the leaf lamina, with pale yellow margins (Figure 7). The infected shoots often coexist with a mix of asymptomatic or moderately symptomatic shoots, which are shrouded by the canopy of tall-growing shoots and escape ready detection by satellite and drone imagery (Figure 8). However, images of the symptomatic plants on the ground level clearly expose the symptomatic plants (Figure 7). However, capturing images from the ground angle is impossible with the UAV flight path used in the study. Therefore, we limited our efforts to the accurate identification of the banana plants and use of crop maps to guide the disease surveillance.
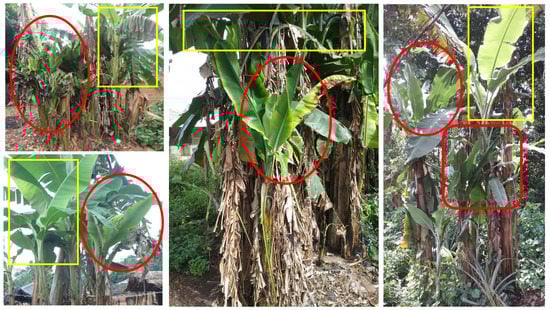
Figure 7.
A few examples of banana bunchy top virus (BBTV)-infected banana mats in the farmers’ fields and backyards in the study area, captured in December 2020. Pseudostems with typical BBTV symptoms are indicated in red circles, and asymptomatic/uninfected banana shoots are indicated in yellow rectangles. BBTV-symptomatic plants are severely stunted, with narrow leaf lamina, and resemble suckers (young side shoots emerging from the pseudostem base). Images were taken manually using a 12-megapixel RGB camera from the ground level.
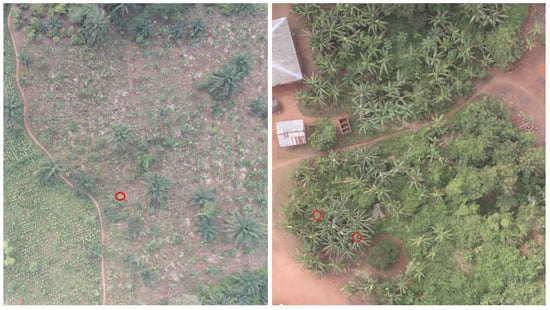
Figure 8.
UAV RGB images of banana fields captured at an altitude of ~100 m during UAV flight missions in December 2020 in the Olokuta site in the Idologun region of Ogun State, Nigeria. The BBTV-infected plants were identified based on the ground survey in December 2020. The locations of BBTV-infected plants are shown with red circles.
3.6. Feature Importance of the Predictor Variables
The ranking of the predictor variables of RF (Supplementary Figure S1a–d) shows that the dual polarization image acquired in November (NOV-VH) was the best predictor of the crop types and landcover in the study area, followed by the images obtained in August (AUG-VV and AUG-VH). The RED band was the most influential predictor when Sentinel 2A bands were processed as the input data for the RF model (Supplementary Figure S1b). The shortwave infrared bands (SWIR1 (1.55–1.75 µm) and SWIR2 (2.08–2.35 µm) were the second-best predictive indicators for the crop type and landcover mapping of the study area. Following these were the GREEN and REDEDGE1 bands. Unexpectedly, the BLUE band ranked higher than the remaining two REDEDGE bands, probably due to water bodies in the study area.
Supplementary Figure S1c presents the importance scores of the vegetation indices derived from the Sentinel 2A optical data as the input to the RF model. The two most significant features in classifying the landcover types in the study area were the two shortwave-based vegetation indices, the normalized burn ratio index (NBRI) and normalized difference water index 2 (NDWI2). The third most important indicator was the modified chlorophyll absorption ratio index (MCARI), based on red, red-edge, and green bands. This result was not unexpected, since the red, green, and red-edge bands held the top ranks among the influential sentinel 2A bands. Closely following the first three ranks, the subsequent two vegetation indices substantially contributing to the model predictions were the soil-adjusted total vegetation index (SATVI) and the specific leaf area vegetation index (SLAVI). Both are similarly related to the shortwave and red bands. Firstly, these results demonstrate the significance of the two shortwave infrared bands (SWIR1 and SWIR2) included in the Sentinel 2A satellite. Secondly, the red band played a critical role in the model performance in the study area. Consequently, these bands’ importance featured prominently in their indices. Finally, the normalized difference vegetation index (NDVI) was moderately beneficial to the land use and crop type classification in the study area.
Importance ranks among the UAV-data-derived features are shown in Supplementary Figure S1d. The vegetation height was the most significant layer that influenced the crop type prediction performance in the study area by a wide margin. Following this were the REDEDGE, NIR, and GREEN bands, in that order of importance. The most influential vegetation index, MCARI, derived from the REDEDGE, green and red bands, ranked fifth among the key predictive indicators. Surprisingly, the popular NDVI was not among the top ten crop type and land cover predictors in this study, as it ranked 12th. Recently, authors have noted the superior significance of the other spectral indices compared to the traditionally known NDVI [26,54].
4. Discussion
Banana is a crop of social and economic importance in SSA. However, its production is adversely affected by many emerging pests and pathogens, such as BBTV, banana bacterial wilt, and fusarium tropical race 4. Timely and accurate surveillance is needed to prevent the spread of these emerging diseases in Africa. However, this requires a methodological workflow that can be used to identify and detect banana plantations in heterogeneous smallholder farming systems for targeted surveillance, risk prediction, and modeling. In this study, we explored UAV data and other satellite products, such as Sentinel 2A and SAR, to predict the location of banana crops, leveraging the ML classifier models.
4.1. Banana Detection with UAV Data Using RF and SVM Models
The multispectral UAV data classification showed that banana can be mapped accurately using ML models and other land cover classes, such as buildings, cassava, forests, grassland, maize, and bare ground/roads. The classification outputs are reliable and useable, notwithstanding the different combinations of UAV data (including the vegetation indices, spectral bands, and crop heights derived from the UAV, DSM, and DTM). For instance, the mean, with the inclusion of the vegetation height, was 93% for both classifiers, while the KC was around 0.89. These results are consistent with previous research findings [26], which reported a high mean accuracy (86%) when identifying crop classes with deep neural networks and transfer learning using UAV-based imagery acquired in smallholder agricultural lands in Rwanda. Similarly, a high OA value (97%) was reported after applying the ML models combined with UAV and other satellite imagery products to detect banana plants under mixed, complex African landscapes [27]. Additionally, the convolutional neural network (CNN) technique was used to detect bananas in Thailand, with accuracies ranging from 75.8 to 96.4 [55]. Deep learning methods were used to extract apple tree crowns with UAV data, with 91 and 94% accuracies [56]. The accuracies obtained in our study are comparable to those of these studies. For instance, the OAs of the different variants of the UAV data varied from 89 to 95% for both RF and SVM, whereas the integration of Sentinel 2A and SAR resulted in the OAs of 89.8 and 89.0 for RF and SVM, respectively.
Our findings suggest that any of the datasets could be utilized to achieve accurate UAV-based predictions of banana and other crop types in the diverse smallholder farming system in the study area. However, the processing times increased significantly as the number of bands increased for the model training and the prediction of very-high-spatial-resolution (10–15 cm) UAV data. Using the minimum dataset of UAV-B (four layers of UAV data and height) would likely be more efficient for the operational use of UAV data for banana plant detection compared to the UAV-VI (15 layers of spectral indices and canopy heights) or the combination of both spectral bands and VI (19 bands). However, ML models with only spectral bands and indices, without height data, failed to produce a reliable accuracy, as the OA and KC reduced significantly. The mean OA across the four sites decreased from around 93% to 78%, and the KC values likewise declined from 0.89 to about 0.64 when the vegetation height was excluded from the input features for the RF and SVM classifiers. Furthermore, the performance of the two models showed no remarkable differences between the three datasets that incorporated height measurements, suggesting that using UAV multispectral bands and vegetation indices separately or in combination does not improve the classification accuracies, as demonstrated in this study. However, the integration of the height measurement into the UAV multispectral imagery significantly enhanced the performance of the two classifiers.
Most of the previous studies that have used UAV-derived data for crop or land use classification have focused on spectral and vegetation indices, with little or no emphasis on the canopy height data. However, this study found that canopy height data from UAV, DSM, and DTM proved remarkably significant in improving the classification accuracy. Similar observations were reported in previous reports on the use of height and coverage indicators for crop growth monitoring [16,57]. Kedia et al. [54] reported that incorporating the UAV-derived canopy height feature considerably increased the OA from 80 to 93% while mapping invasive vegetation species in arid regions of the USA. There is a noticeable variation in the canopy height of bananas compared to other crops and landcover categories in the study area. Such contrasts can influence the reflectance signals from the canopy, with pronounced discriminating features that can complement the color spectra of the vegetation. This supports the notion that structural features and spectral profiles are essential for banana detection and rapid mapping.
This study’s feature importance ranking shows that the most widespread vegetation index (NDVI) was not a critical discriminator of the crop and landcover types. This is likely due to the saturation of the red spectral band when the vegetation classes are in the peak green period during the cropping season [58]. Therefore, the other spectral indices, such as MCARI, SAVI, and GNDVI, based on a combination of green, red-edge, and red spectral bands, were better predictors of the landcover classification.
4.2. Crop Type and Landcover Classification with Sentinel 2A and SAR Data
We successfully utilized the different spectral and vegetation indices of Sentinel 1 and 2 data to detect and classify bananas in heterogenous agro-ecological landscapes. By isolating the shortwave infrared, red, and green bands as critical spectral features for the crop classification in the study area, we narrowed down the relevant indices (such as the NBRI, SLAVI, SATVI, and NDWI2) for the prediction of crop/land cover classes. Several studies have highlighted the efficacy of the shortwave infrared bands in landcover discrimination [59]. SWIR-based indices are sensitive to vegetation structures and can highlight substantial dynamic changes [60]. Although all the S2A bands and indices tested were applicable to the classification of crops in the study, the NIR and associated indices were among the least important indicators.
The potential of high-resolution UAV-RGB aerial images for simultaneous banana localization and disease classification, with an accuracy of 90 to 99%, was demonstrated in Benin, and DR Congo [27], which shows the feasibility of remote sensing approaches to disease detection in the field. However, the model developed was insufficient for identifying banana plantations with BBTV-symptomatic shoots using the UAV and SAR data. The canopy cover of healthy banana plants or weeds and wild plants often shroud the severely stunted BBTV-infected shoots, leading to an insufficient resolution for infected plant detection based on aerial imagery. The detection infected plants using UAV or SAR imagery may be possible in monoculture plantations due to the better exposure of symptomatic plants. However, we could not test this hypothesis due to the lack of monoculture farms with BBTV infection in the study area.
The best overall classification accuracy of the banana crops in this large area was achieved using optical Sentinel 2A and SAR data. A similar approach was used to classify winter wheat in southern China, with a 98% accuracy [51]. Regarding the model performance, the classification metrics of the RF classifiers were slightly better than those of SVM. This could be associated with the model’s capacity to generate multiple paths with different variables (as tree ensembles) to optimize the prediction and discrimination within and between classes [52]. The application of these tools and integration of S2A and SAR datasets provide a promising outlook for the monitoring of the banana production area in order to target relevant areas for banana disease surveillance on a regional or national scale. The banana mapping model developed aided in the selection of survey sites and guided the surveillance efforts for the early detection and eradication of BBTV in Togo [7], as well as the subsequent surveillance design used to verify that other banana production regions were free of BBTV.
5. Conclusions
In this study, we developed a mapping framework for banana detection in a smallholder complex system using UAV, Sentinel 2A, and SAR data. UAV images were used to create spectral orthomosaics and develop a digital surface model, a digital terrain model, and a canopy height model. From the UAV spectral features, we derived a suite of vegetation indices and developed the RF and SVM models with or without the canopy height in order to distinguish between banana, cassava, maize, and other landcover types. The RF and SVM models with vegetation height features performed with an average OA of 93%, while the model without the canopy height exhibited a much lower OA of 78%. From this observation, we conclude that structural height features are essential for crop delineation using the UAV-based predictors.
We used Sentinel 2A optical and SAR data to improve banana detection on a regional scale. We computed several vegetation indices and developed various RF and SVM models from the suite of resulting datasets. The SAR data alone resulted in a classification accuracy of around 76%, compared to the 90% accuracy achieved by integrating the optical and SAR data. These findings suggest that the prediction of banana, along with other crops, in mixed, complex smallholder systems is feasible, with a reasonable level of precision necessary to guide targeted BBTV surveillance. Further studies are necessary in order to improve the model capacity, so as to differentiate between BBTV symptomatic and asymptomatic plantations.
Supplementary Materials
The following supporting information can be downloaded at: https://www.mdpi.com/article/10.3390/rs14205206/s1. Refs. [61,62,63,64,65,66,67,68,69,70,71,72,73,74,75,76,77,78,79,80,81,82] are cited in the Supplementary Materials file.
Author Contributions
Conceptualization, methodology and investigation, T.R.A. and P.L.K.; software, data curation, and analysis T.R.A., J.A., O.P.D. and P.L.K.; original draft preparation, review, and editing, T.R.A., J.A. and P.L.K.; project administration and funding acquisition, P.L.K. All authors have read and agreed to the published version of the manuscript.
Funding
This work was supported by the CGIAR Research Program on Roots, Tubers, and Banana (CRP-RTB) and the CGIAR Plant Health Initiative, supported by the CGIAR Trust Fund Donors and the University of Queensland Project on “BBTV mitigation: Community Management in Nigeria and Screening Wild Banana Progenitors for Resistance (OPP1130226)”, funded by the Bill & Melinda Gates Foundation (BMGF).
Data Availability Statement
Not applicable.
Acknowledgments
The authors thank Oviasuyi Taiwo of the Virology Unit of IITA, Ibadan, Nigeria, for his assistance with the drone flying missions in the field. The authors gratefully acknowledge the University of Queensland and the Bill & Melinda Gates Foundation for supporting the open-access fees through BMGF grant No. OPP1130226. We thank the anonymous reviewers for their insightful comments and suggestions that helped us to clarify the manuscript.
Conflicts of Interest
The authors declare no conflict of interest.
References
- Brown, A.; Tumuhimbise, R.; Amah, D.; Uwimana, B.; Nyine, M.; Mduma, H.; Talengera, D.; Karamura, D.; Kuriba, J.; Swennen, R. Bananas and Plantains (Musa Spp.). In Genetic Improvement of Tropical Crops; Springer: Cham, Switzerland, 2017; pp. 219–240. [Google Scholar] [CrossRef]
- UNPD. Household: Size and Composition 2018—Countries. Available online: https://population.un.org/household/#/countries/840 (accessed on 25 July 2022).
- FAO. FAOSTAT. Available online: https://www.fao.org/faostat/en/#data/ (accessed on 25 July 2022).
- Kumar, P.L.; Selvarajan, R.; Iskra-Caruana, M.L.; Chabannes, M.; Hanna, R. Biology, Etiology, and Control of Virus Diseases of Banana and Plantain. In Advances in Virus Research; Elsevier: Amsterdam, The Netherlands, 2015; Volume 91, pp. 229–269. [Google Scholar] [CrossRef]
- Lokossou, B.; Gnanvossou, D.; Ayodeji, O.; Akplogan, F.; Safiore, A.; Migan, D.Z.; Pefoura, A.M.; Hanna, R.; Kumar, P.L. Occurrence of Banana Bunchy Top Virus in Banana and Plantain (Musa Spp.) in Benin. New Dis. Rep. 2012, 25, 13. [Google Scholar] [CrossRef]
- Adegbola, R.O.; Ayodeji, O.; Awosusi, O.O.; Atiri, G.I.; Kumar, P.L. First Report of Banana Bunchy Top Virus in Banana and Plantain (Musa Spp.) in Nigeria. Plant Dis. 2013, 97, 290. [Google Scholar] [CrossRef] [PubMed]
- Kolombia, Y.; Oviasuyi, T.; AYISAH, K.D.; Ale Gonh-Goh, A.; Atsu, T.; Oresanya, A.; Ogunsanya, P.; Alabi, T.; Kumar, P.L. First Report of Banana Bunchy Top Virus in Banana (Musa Spp.) and Its Eradication in Togo. Plant Dis. 2021, 105, 3312. [Google Scholar] [CrossRef] [PubMed]
- Ocimati, W.; Tazuba, A.F.; Tushemereirwe, W.K.; Tugume, J.; Omondi, B.A.; Acema, D.; Were, E.; Onyilo, F.; Ssekamate, A.M.; Namanya, P.; et al. First Report of Banana Bunchy Top Disease Caused by Banana Bunchy Top Virus in Uganda. New Dis. Rep. 2021, 44, e12052. [Google Scholar] [CrossRef]
- Shimwela, M.M.; Mahuku, G.; Mbanzibwa, D.R.; Mkamilo, G.; Mark, D.; Mosha, H.I.; Pallangyyo, B.; Fihavango, M.; Oresanya, A.; Ogunsanya, P.; et al. First Report of Banana Bunchy Top Virus in Banana and Plantain (Musa Spp.) in Tanzania. Plant Dis. 2022, 106, 1312. [Google Scholar] [CrossRef]
- Pu, R.; Landry, S. Remote Sensing of Environment A Comparative Analysis of High Spatial Resolution IKONOS and WorldView-2 Imagery for Mapping Urban Tree Species. Remote Sens. Environ. 2012, 124, 516–533. [Google Scholar] [CrossRef]
- Hossain, M.D.; Chen, D. Segmentation for Object-Based Image Analysis (OBIA): A Review of Algorithms and Challenges from Remote Sensing Perspective. ISPRS J. Photogramm. Remote Sens. 2019, 150, 115–134. [Google Scholar] [CrossRef]
- Aeberli, A.; Johansen, K.; Robson, A.; Lamb, D.W.; Phinn, S. Detection of Banana Plants Using Multi-Temporal Multispectral UAV Imagery. Remote Sens. 2021, 13, 2123. [Google Scholar] [CrossRef]
- Karydas, C.; Dimic, G.; Filchev, L.; Chabalala, Y.; Adam, E.; Adem Ali, K. Machine Learning Classification of Fused Sentinel-1 and Sentinel-2 Image Data towards Mapping Fruit Plantations in Highly Heterogenous Landscapes. Remote Sens. 2022, 14, 2621. [Google Scholar] [CrossRef]
- TaTariq, A.; Yan, J.; Gagnon, A.S.; Khan, M.R.; Mumtaz, F. Mapping of Cropland, Cropping Patterns and Crop Types by Combining Optical Remote Sensing Images with Decision Tree Classifier and Random Forest. Geo-Spat. Inf. Sci. 2022. [Google Scholar] [CrossRef]
- Mei, W.; Wang, H.; Fouhey, D.; Zhou, W.; Hinks, I.; Gray, J.M.; van Berkel, D.; Jain, M. Using Deep Learning and Very-High-Resolution Imagery to Map Smallholder Field Boundaries. Remote Sens. 2022, 14, 3046. [Google Scholar] [CrossRef]
- Maimaitijiang, M.; Sagan, V.; Sidike, P.; Daloye, A.M.; Erkbol, H.; Fritschi, F.B. Crop Monitoring Using Satellite/UAV Data Fusion and Machine Learning. Remote Sens. 2020, 12, 1357. [Google Scholar] [CrossRef]
- Maxwell, A.E.; Warner, T.A.; Fang, F. Implementation of Machine-Learning Classification in Remote Sensing: An Applied Review. Int. J. Remote Sens. 2018, 39, 2784–2817. [Google Scholar] [CrossRef]
- Rodriguez-Galiano, V.F.; Ghimire, B.; Rogan, J.; Chica-Olmo, M.; Rigol-Sanchez, J.P. An Assessment of the Effectiveness of a Random Forest Classifier for Land-Cover Classification. ISPRS J. Photogramm. Remote Sens. 2012, 67, 93–104. [Google Scholar] [CrossRef]
- Saini, R.; Ghosh, S.K. Crop Classification on Singled Dates Sentinel-2 Imagery Using Random Forest and Support Vector Machine. Int. Arch. Photogramm. Remote Sens. Spat. Inf. Sci. 2018, XLII–5, 20–23. [Google Scholar]
- Feng, S.; Zhao, J.; Liu, T.; Zhang, H.; Zhang, Z.; Guo, X. Crop Type Identification and Mapping Using Machine Learning Algorithms and Sentinel-2 Time Series Data. IEEE J. Sel. Top. Appl. Earth Obs. Remote Sens. 2019, 12, 3295–3306. [Google Scholar] [CrossRef]
- Sun, C.; Bian, Y.; Zhou, T.; Pan, J. Using of Multi-Source and Multi-Temporal Remote Sensing Data Improves Crop-Type Mapping in the Subtropical Agriculture Region. Sensors 2019, 19, 2401. [Google Scholar] [CrossRef]
- Al-Najjar, H.A.H.; Kalantar, B.; Pradhan, B.; Saeidi, V.; Halin, A.A.; Ueda, N.; Mansor, S. Land Cover Classification from Fused DSM and UAV Images Using Convolutional Neural Networks. Remote Sens. 2019, 11, 1461. [Google Scholar] [CrossRef]
- Iqbal, N.; Mumtaz, R.; Shafi, U.; Zaidi, S.M.H. Gray Level Co-Occurrence Matrix (GLCM) Texture Based Crop Classification Using Low Altitude Remote Sensing Platforms. PeerJ Comput. Sci. 2021, 7, e536. [Google Scholar] [CrossRef]
- Gumma, M.K.; Tummala, K.; Dixit, S.; Collivignarelli, F.; Holecz, F.; Kolli, R.N.; Whitbread, A.M. Crop Type Identification and Spatial Mapping Using Sentinel-2 Satellite Data with Focus on Field-Level Information. Geocarto Int. 2020, 37, 1833–1849. [Google Scholar] [CrossRef]
- Johansen, K.; Sohlbach, M.; Sullivan, B.; Stringer, S.; Peasley, D.; Phinn, S. Mapping Banana Plants from High Spatial Resolution Orthophotos to Facilitate Plant Health Assessment. Remote Sens. 2014, 6, 8261–8286. [Google Scholar] [CrossRef]
- Chew, R.; Rineer, J.; Beach, R.; O’neil, M.; Ujeneza, N.; Lapidus, D.; Miano, T.; Hegarty-Craver, M.; Polly, J.; Temple, D.S. Deep Neural Networks and Transfer Learning for Food Crop Identification in UAV Images. Drones 2020, 4, 7. [Google Scholar] [CrossRef]
- Selvaraj, G.M.; Vergara, A.; Montenegro, F.; Alonso Ruiz, H.; Safari, N.; Raymaekers, D.; Ocimati, W.; Ntamwira, J.; Tits, L.; Omondi, A.B.; et al. Detection of Banana Plants and Their Major Diseases through Aerial Images and Machine Learning Methods: A Case Study in DR Congo and Republic of Benin. ISPRS J. Photogramm. Remote Sens. 2020, 169, 110–124. [Google Scholar] [CrossRef]
- Hall, O.; Dahlin, S.; Marstorp, H.; Bustos, M.F.A.; Öborn, I.; Jirström, M. Classification of Maize in Complex Smallholder Farming Systems Using UAV Imagery. Drones 2018, 2, 22. [Google Scholar] [CrossRef]
- Eberhardt, I.D.R.; Schultz, B.; Rizzi, R.; Sanches, I.D.A.; Formaggio, A.R.; Atzberger, C.; Mello, M.P.; Immitzer, M.; Trabaquini, K.; Foschiera, W.; et al. Cloud Cover Assessment for Operational Crop Monitoring Systems in Tropical Areas. Remote Sens. 2016, 8, 219. [Google Scholar] [CrossRef]
- Abubakar, G.A.; Wang, K.; Shahtahamssebi, A.; Xue, X.; Belete, M.; Gudo, A.J.A.; Shuka, K.A.M.; Gan, M. Mapping Maize Fields by Using Multi-Temporal Sentinel-1A and Sentinel-2A Images in Makarfi, Northern Nigeria, Africa. Sustainability 2020, 12, 2539. [Google Scholar] [CrossRef]
- Blaes, X.; Vanhalle, L.; Defourny, P. Efficiency of Crop Identification Based on Optical and SAR Image Time Series. Remote Sens. Environ. 2005, 96, 352–365. [Google Scholar] [CrossRef]
- Batjes, N.H. Overview of Procedures and Standards in Use at ISRIC WDC-Soils. ISRIC-World Soil information, Wageningen, The Netherlands. 2017. Available online: https://www.isric.org/sites/default/files/isric_report_2017_01doi.pdf (accessed on 3 March 2022).
- Fick, S.E.; Hijmans, R.J. WorldClim 2: New 1-Km Spatial Resolution Climate Surfaces for Global Land Areas. Int. J. Climatol. 2017, 37, 4302–4315. [Google Scholar] [CrossRef]
- Böhler, J.E.; Schaepman, M.E.; Kneubühler, M. Crop Classification in a Heterogeneous Arable Landscape Using Uncalibrated UAV Data. Remote Sens. 2018, 10, 1282. [Google Scholar] [CrossRef]
- Kucharczyk, M.; Hay, G.J.; Ghaffarian, S.; Hugenholtz, C.H. Geographic Object-Based Image Analysis: A Primer and Future Directions. Remote Sens. 2020, 12, 2012. [Google Scholar] [CrossRef]
- Lee, J.; Pottier, E. Polarimetric Radar Imaging: From Basics to Applications; Vienna, Austria. 2017, pp. 1–398. Available online: https://www.taylorfrancis.com/books/mono/10.1201/9781420054989/polarimetric-radar-imaging-jong-sen-lee-eric-pottier (accessed on 12 February 2022).
- Yeom, J.; Jung, J.; Chang, A.; Ashapure, A.; Maeda, M.; Maeda, A.; Landivar, J. Comparison of Vegetation Indices Derived from UAV Data for Differentiation of Tillage Effects in Agriculture. Remote Sens. 2019, 11, 1548. [Google Scholar] [CrossRef]
- Sonobe, R.; Yamaya, Y.; Tani, H.; Wang, X.; Kobayashi, N.; Mochizuki, K. Crop Classification from Sentinel-2-Derived Vegetation Indices Using Ensemble Learning. J. Appl. Remote Sens. 2018, 12, 026019. [Google Scholar] [CrossRef]
- Leutner, B.; Horning, N.; Schwalb-Willmann, J.; Hijmans, R.J. Tools for Remote Sensing Data Analysis-Package ‘RStoolbox’; CRAN; R-Project: Vienna, Austria, 2019. [Google Scholar]
- Suab, S.A.; Avtar, R. Unmanned Aerial Vehicle System (UAVS) Applications in Forestry and Plantation Operations: Experiences in Sabah and Sarawak, Malaysian Borneo. In Unmanned Aerial Vehicle: Applications in Agriculture and Environment; Avtar, R., Watanabe, T., Eds.; Springer: Cham, Switzerland, 2020. [Google Scholar] [CrossRef]
- ESRI. ArcGIS Desktop: Release 10.7.1; Environmental Systems Research Institute: Redlands, CA, USA, 2019. [Google Scholar]
- Kuhn, M.; Wing, J.; Weston, S.; Williams, A.; Keefer, C.; Engelhardt, A.; Cooper, T.C.; Mayer, Z.; Kenkel, B.; Benesty, M.; et al. Package ‘Caret’—Classification and Regression Training version 6.0-93 2022. Available online: https://cran.r-project.org/web/packages/caret/caret.pdf (accessed on 12 February 2022).
- R Core Team. R: A Language and Environment for Statistical Computing; R Foundation for Statistical Computing: Vienna, Austria, 2020. [Google Scholar]
- Misra, S.; Li, H. Noninvasive Fracture Characterization Based on the Classification of Sonic Wave Travel Times. In Machine Learning for Subsurface Characterization; Elsevier: Amsterdam, The Netherlands, 2019; pp. 243–287. [Google Scholar] [CrossRef]
- Breiman, L. Random Forests. Mach. Learn. 2001, 45, 5–32. [Google Scholar] [CrossRef]
- Pal, M.; Mather, P.M. Support Vector Machines for Classification in Remote Sensing. Int. J. Remote Sens. 2005, 26, 1007–1011. [Google Scholar] [CrossRef]
- Duke, O.P.; Alabi, T.; Neeti, N.; Adewopo, J. Comparison of UAV and SAR Performance for Crop Type Classification Using Machine Learning Algorithms: A Case Study of Humid Forest Ecology Experimental Research Site of West Africa. Int. J. Remote Sens. 2022, 43, 4259–4286. [Google Scholar] [CrossRef]
- Haynes, W. Wilcoxon Rank Sum Test. In Encyclopedia of Systems Biology; Springer: New York, NY, USA, 2013; pp. 2354–2355. [Google Scholar] [CrossRef]
- Kruskal-Wallis Test. The Concise Encyclopedia of Statistics; Springer: New York, NY, USA, 2008; pp. 288–290. [Google Scholar] [CrossRef]
- Kursa, M.B.; Rudnicki, W.R. Package ‘Boruta’-Wrapper Algorithm for All Relevant Feature Selection 2022. Available online: https://cran.r-project.org/web/packages/Boruta/Boruta.pdf (accessed on 12 February 2022).
- Kursa, M.B.; Rudnicki, W.R. Feature Selection with the Boruta Package. J. Stat. Softw. 2010, 36, 1–13. [Google Scholar] [CrossRef]
- Sanchez-Pinto, L.N.; Venable, L.R.; Fahrenbach, J.; Churpek, M.M. Comparison of Variable Selection Methods for Clinical Predictive Modeling. Int. J. Med. Inform. 2018, 116, 10–17. [Google Scholar] [CrossRef]
- Speiser, J.L.; Miller, M.E.; Tooze, J.; Ip, E. A Comparison of Random Forest Variable Selection Methods for Classification Prediction Modeling. Expert Syst. Appl. 2019, 134, 93–101. [Google Scholar] [CrossRef]
- Kedia, A.C.; Kapos, B.; Liao, S.; Draper, J.; Eddinger, J.; Updike, C.; Frazier, A.E. An Integrated Spectral–Structural Workflow for Invasive Vegetation Mapping in an Arid Region Using Drones. Drones 2021, 5, 19. [Google Scholar] [CrossRef]
- Neupane, B.; Horanont, T.; Hung, N.D. Deep Learning Based Banana Plant Detection and Counting Using High-Resolution Red-Green-Blue (RGB) Images Collected from Unmanned Aerial Vehicle (UAV). PLoS ONE 2019, 14, e0223906. [Google Scholar] [CrossRef]
- Wu, J.; Yang, G.; Yang, H.; Zhu, Y.; Li, Z.; Lei, L.; Zhao, C. Extracting Apple Tree Crown Information from Remote Imagery Using Deep Learning. Comput. Electron. Agric. 2020, 174, 105504. [Google Scholar] [CrossRef]
- Alabi, T.R.; Abebe, A.T.; Chigeza, G.; Fowobaje, K.R. Estimation of Soybean Grain Yield from Multispectral High-Resolution UAV Data with Machine Learning Models in West Africa. Remote Sens. Appl. 2022, 27, 100782. [Google Scholar] [CrossRef]
- Gitelson, A.A. Wide Dynamic Range Vegetation Index for Remote Quantification of Biophysical Characteristics of Vegetation. J. Plant Physiol. 2004, 161, 165–173. [Google Scholar] [CrossRef]
- Boonprong, S.; Cao, C.; Chen, W.; Bao, S. Random Forest Variable Importance Spectral Indices Scheme for Burnt Forest Recovery Monitoring-Multilevel RF-VIMP. Remote Sens. 2018, 10, 807. [Google Scholar] [CrossRef]
- Nioti, F.; Xystrakis, F.; Koutsias, N.; Dimopoulos, P. A Remote Sensing and GIS Approach to Study the Long-Term Vegetation Recovery of a Fire-Affected Pine Forest in Southern Greece. Remote Sens. 2015, 7, 7712–7731. [Google Scholar] [CrossRef]
- Gitelson, A.A.; Gritz, Y.; Merzlyak, M.N. Relationships between Leaf Chlorophyll Content and Spectral Reflectance and Algorithms for Non-Destructive Chlorophyll Assessment in Higher Plant Leaves. J. Plant Physiol. 2003, 160, 271–282. [Google Scholar] [CrossRef] [PubMed]
- Perry, C.R.; Lautenschlager, L.F. Functional Equivalence of Spectral Vegetation Indices [Species, Leaf Area, Stress, Biomass, Multispectral Scanner Measurements, Landsat, Remote Sensing]. Available online: https://agris.fao.org/agris-search/search.do?recordID=US19850043085 (accessed on 16 August 2021).
- Richardson, A.J.; Weigand, C. Distinguishing Vegetation from Soil Background Information. Photogrammetric Eng. Remote Sens. 1977, 43, 1541–1552. [Google Scholar]
- Huete, A.; Justice, C. Modis Vegetation Index (MOD13) Algorithm Theoretical Basis Document. Available online: https://modis.gsfc.nasa.gov/data/atbd/atbd_mod13.pdf (accessed on 12 February 2022).
- Pinty, B.; Verstraete, M.M. GEMI: A Non-Linear Index to Monitor Global Vegetation from Satellites. Vegetation 1992, 101, 15–20. [Google Scholar] [CrossRef]
- Gitelson, A.A.; Viña, A.; Ciganda, V.; Rundquist, D.C.; Arkebauer, T.J. Remote Estimation of Canopy Chlorophyll Content in Crops. Geophys. Res. Lett. 2005, 32, L08403. [Google Scholar] [CrossRef]
- Gitelson, A.A.; Merzlyak, M.N. Remote Sensing of Chlorophyll Concentration in Higher Plant Leaves. Adv. Space Res. 1998, 22, 689–692. [Google Scholar] [CrossRef]
- Daughtry, C.S.T.; Walthall, C.L.; Kim, M.S.; De Colstoun, E.B.; McMurtrey, J.E. Estimating Corn Leaf Chlorophyll Concentration from Leaf and Canopy Reflectance. Remote Sens. Environ. 2000, 74, 229–239. [Google Scholar] [CrossRef]
- Xu, H. Modification of Normalised Difference Water Index (NDWI) to Enhance Open Water Features in Remotely Sensed Imagery. Int. J. Remote Sens. 2007, 27, 3025–3033. [Google Scholar] [CrossRef]
- Qi, J.; Chehbouni, A.; Huete, A.R.; Kerr, Y.H.; Sorooshian, S. A Modified Soil Adjusted Vegetation Index. Remote Sens. Environ. 1994, 48, 119–126. [Google Scholar] [CrossRef]
- García, M.J.L.; Caselles, V. Mapping Burns and Natural Reforestation Using Thematic Mapper Data. Geocarto Int. 2008, 6, 31–37. [Google Scholar] [CrossRef]
- Barnes, E.M.; Clarke, T.R.; Richards, S.E.; Colaizzi, P.D.; Haberland, J.; Kostrzewski, M.; Waller, P.; Choi, C.; Riley, E.; Thompson, T.; et al. Coincident Detection of Crop Water Stress, Nitrogen Status and Canopy Density Using Ground Based Multispectral Data. In Proceedings of the Fifth International Conference on Precision Agriculture, Bloomington, MN, USA, 16–19 July 2000. [Google Scholar]
- Rouse, J.W.; Hass, R.H.; Schell, J.A.; Deering, D.W. Monitoring Vegetation Systems in the Great Plains with ERTS. NASA. Goddard Space Flight Center 3d ERTS-1 Symp., Vol. 1, Sect. A Jan 1. 1974. Available online: https://ntrs.nasa.gov/api/citations/19740022614/downloads/19740022614.pdf (accessed on 16 August 2021).
- McFeeters, S.K. The Use of the Normalized Difference Water Index (NDWI) in the Delineation of Open Water Features. Int. J. Remote Sens. 2007, 17, 1425–1432. [Google Scholar] [CrossRef]
- Gao, B.C. NDWI—A Normalized Difference Water Index for Remote Sensing of Vegetation Liquid Water from Space. Remote Sens. Environ. 1996, 58, 257–266. [Google Scholar] [CrossRef]
- Baret, F.; Guyot, G. Potentials and Limits of Vegetation Indices for LAI and APAR Assessment. Remote Sens. Environ. 1991, 35, 161–173. [Google Scholar] [CrossRef]
- Marsett, R.C.; Qi, J.; Heilman, P.; Biedenbender, S.H.; Watson, M.C.; Amer, S.; Weltz, M.; Goodrich, D.; Marsett, R. Remote Sensing for Grassland Management in the Arid Southwest. Rangel. Ecol. Manag. 2006, 59, 530–540. [Google Scholar] [CrossRef]
- Huete, A.R. A Soil-Adjusted Vegetation Index (SAVI). Remote Sens. Environ. 1988, 25, 295–309. [Google Scholar] [CrossRef]
- Lymburner, L.; Beggs, P.J.; Jacobson, C.R. Estimation of Canopy-Average Surface-Specific Leaf Area Using Landsat TM Data. Photogramm. Eng. Remote Sens. 2000, 66, 183–191. [Google Scholar]
- Birth, G.S.; McVey, G.R. Measuring the Color of Growing Turf with a Reflectance Spectrophotometer1. Agron. J. 1968, 60, 640–643. [Google Scholar] [CrossRef]
- Thiam, A.K. Geographic Information Systems and Remote Sensing Methods for Assessing and Monitoring Land Degradation in the Sahel: The Case of Southern Mauritania. Ph.D. Thesis, Clark University, Worcester, MA, USA, 1997. [Google Scholar]
- Deering, D.W.; Rouse, J.W.; Haas, R.H.; Schell, J.A. Measuring “Forage Production” of Grazing Units from Landsat MSS Data. In Proceedings of the 10th International Symposium on Remote Sensing of Environment, Ann Arbor, MI, USA, 6 October 1975; pp. 1169–1178. [Google Scholar]
Publisher’s Note: MDPI stays neutral with regard to jurisdictional claims in published maps and institutional affiliations. |
© 2022 by the authors. Licensee MDPI, Basel, Switzerland. This article is an open access article distributed under the terms and conditions of the Creative Commons Attribution (CC BY) license (https://creativecommons.org/licenses/by/4.0/).