Abstract
Understanding the spatial variability in highly heterogeneous natural environments such as savannas and river corridors is an important issue in characterizing and modeling energy fluxes, particularly for evapotranspiration (ET) estimates. Currently, remote-sensing-based surface energy balance (SEB) models are applied widely and routinely in agricultural settings to obtain ET information on an operational basis for use in water resources management. However, the application of these models in natural environments is challenging due to spatial heterogeneity in vegetation cover and complexity in the number of vegetation species existing within a biome. In this research effort, small unmanned aerial systems (sUAS) data were used to study the influence of land surface spatial heterogeneity on the modeling of ET using the Two-Source Energy Balance (TSEB) model. The study area is the San Rafael River corridor in Utah, which is a part of the Upper Colorado River Basin that is characterized by arid conditions and variations in soil moisture status and the type and height of vegetation. First, a spatial variability analysis was performed using a discrete wavelet transform (DWT) to identify a representative spatial resolution/model grid size for adequately solving energy balance components to derive ET. The results indicated a maximum wavelet energy between 6.4 m and 12.8 m for the river corridor area, while the non-river corridor area, which is characterized by different surface types and random vegetation, does not show a peak value. Next, to evaluate the effect of spatial resolution on latent heat flux (LE) estimation using the TSEB model, spatial scales of 6 m and 15 m instead of 6.4 m and 12.8 m, respectively, were used to simplify the derivation of model inputs. The results indicated small differences in the LE values between 6 m and 15 m resolutions, with a slight decrease in detail at 15 m due to losses in spatial variability. Lastly, the instantaneous (hourly) LE was extrapolated/upscaled to daily ET values using the incoming solar radiation (Rs) method. The results indicated that willow and cottonwood have the highest ET rates, followed by grass/shrubs and treated tamarisk. Although most of the treated tamarisk vegetation is in dead/dry condition, the green vegetation growing underneath resulted in a magnitude value of ET.
1. Introduction
Evapotranspiration (ET) is of paramount importance for terrestrial water balance as it represents the second largest component after precipitation, and it links climate, hydrology, and ecosystem processes that couple water and energy budgets [1]. Spatial ET information has been shown to play a critical part in monitoring the spatial and temporal variation of agricultural drought on monthly and annual scales [2] to improve water resource planning and management. Accurate ET estimation is necessary, particularly in drought-stricken areas, for monitoring the impacts on the natural environment. Direct measurements of ET using ground instrumentation such as eddy covariance (EC) or lysimeters only work appropriately for homogenous surfaces and are limited to small sampling areas [3]. At large scales, such as watersheds or biomes, these methods are difficult to employ due to the complexity of hydrometeorological processes [4]. Challenges associated with natural ecosystem scales usually arise from spatial heterogeneity in soils and vegetation species, in addition to other biophysical processes that affect the surface–atmosphere exchanges of water and energy [5]. Therefore, to understand the spatial heterogeneity of the landscape for accurate estimation of surface energy fluxes, particularly latent heat flux (LE) or evapotranspiration (ET), advanced techniques are needed. To address these needs, the scientific community has developed land surface models, mathematical representations of land–atmosphere exchange, to quantify surface energy and water balance, which drive climatic and earth system processes [6]. These models are helpful tools that can provide vital information to track ecosystem responses to dynamic changes in climate and environmental components [7,8].
Simple and complex land surface and hydrological models [9] have been applied to estimate ET in heterogeneous environments [10]. Currently, remote-sensing-based energy balance models are widely and routinely applied to produce spatial ET information on an operational basis for use in water resources management [11]. These models use thermal infrared (TIR) data as a boundary condition and solve LE as a residual component of the surface energy balance (SEB) [12]. Generally, two types of SEB models are applied, both of which use optical and TIR remote sensing information to calculate ET through the radiation and energy balance equations. The first is the One-Source Energy Balance (OSEB) model, which treats the canopy-substrate surface as a single layer [13]. The second is the dual source, such as the Two-Source Energy Balance (TSEB) model [14], which partitions the energy fluxes between canopy and soil/substrate [15]. The TSEB model was originally developed for homogenous partial vegetation cover, and then the framework was upgraded to accommodate the effects of heterogeneous partial vegetation, as opposed to the OSEB models [16,17]. However, both model types tend to show greater uncertainty in cases of heterogeneous landscapes and/or natural environments [18,19]. From an operational perspective, identifying individual fields and other small hydrological features in a heterogeneous environment requires a more advanced technology that can provide high-resolution data in a timely manner. Satellite remote sensing can provide radiometric surface temperature and optical observations at a spatial scale of 10 to 103 m2; however, satellite measurements are affected by various landscape features and require semi-empirical algorithms to convert radiances to physical quantities for SEB modeling [20]. Although satellite data fusion has improved the information, the presence of clouds during satellite overpass can limit its operational application [20]. The development of small unmanned aerial systems (sUAS) with novel instrumentations and lightweight sensors has made high multispectral resolution possible without the previously mentioned limitations. Additionally, these systems are “flexible in timing” [3].
Remote sensing offers access to a wide range of spatial information, but the high spatial resolution is also recognized as a challenging issue for energy flux modeling, particularly for ET estimates. According to Brunsell and Gillies (2003) [21], spatial scaling becomes more complicated in heterogeneous landscapes. Considering the spatial variability of surface and environmental properties such as canopy height, vegetation cover, and land surface temperature (LST), the spatial resolution of remote sensing products should have a significant impact on the adequacy and accuracy of ET estimates. Previous studies assessing the effects of different satellite sensors on ET estimation found discrepancies among the various spatial scales [22,23]. To a large extent, this is a function of the scale of variability in land cover relative to the resolution of the pixel information [24,25]. Therefore, analyses to evaluate the effects of spatial scale on surface properties and states that affect surface energy balance (SEB) modeling for different heterogeneous landscapes are required [26].
In natural environments that are characterized by a heterogeneous natural ecosystem and low precipitation, such as the San Rafael River corridor in Utah, the major component of the water balance is vegetation transpiration (T) and soil evaporation (E) or the combined evapotranspiration (ET). This location also exhibits significant high spatial variability in ET information due to several factors that include soil moisture availability, groundwater depth, leaf area, topography, land surface temperature and vegetation species [27]. Moreover, the San Rafael River corridor is dominated by treated tamarisk, which increases the complexity of the ecosystem’s water use and poses additional difficulties beyond the previously mentioned challenges due to the high variability of this vegetation in space and time.
The presence of treated tamarisk and other riparian vegetation in the river corridor changes the river hydraulics by increasing the channel roughness, which can result in slower water flow and increased flood frequency. Efforts are underway to restore habitats by removing tamarisk in the river corridor to foster a more ecologically acceptable state, which may also have an impact on the evapotranspiration rate [28]. These efforts target mechanical whole-tree removal on riverbanks lined with mature trees to encourage lateral scour and channel widening within channelized sections. A tracked excavator with a grapple attachment removes the tamarisk at or below the soil surface. This method has proven effective in removing the tamarisk root system and minimizing re-sprouting in subsequent years. Tamarisk removal is conducted in the winter months to reduce upland soil disturbance and avoid impacts to migratory birds. After removal, tamarisk is stacked and left to dry for later burning or is left onsite to provide brush pile habitat. Areas disturbed during mechanical treatment and newly opened areas are seeded in the autumn following removal.
According to a 2011 study by Neale et al. [27] conducted over the Mojave River, California, to estimate ET using high-resolution airborne multispectral imagery, tamarisk and cottonwood plants had the highest ET rate compared with other vegetation species. Furthermore, although a vast amount of information is available on water use by different types of riparian species, plant physiological processes and sources of available water that control water use are still disputed and poorly understood [27]. Hence, further insights into the amount of available water used in such heterogeneous systems would benefit natural and water resource managers and decision-makers. In this research effort, the topics investigated include (a) determining which spatial resolution(s)/scale(s) are most appropriate to represent the two ecosystems (river corridor and surrounding arid vegetation) for ET estimation, (b) examining the effects of different spatial resolutions for TSEB inputs on the magnitude and spatial variation in LE, and (c) calculating the daily ET of vegetation species using the incoming solar radiation (Rs) method.
2. Methodology
Figure 1 illustrates the research methodology used for this study. First, the spatial domain/model grid size to represent the San Rafael River corridor was identified using discrete wavelet transform (DWT) analyses and sUAS NDVI information. Next, we derived the input data required by the TSEB model to calculate energy fluxes, mainly LE. Finally, the daily ET was calculated for each vegetation type using the Rs method.
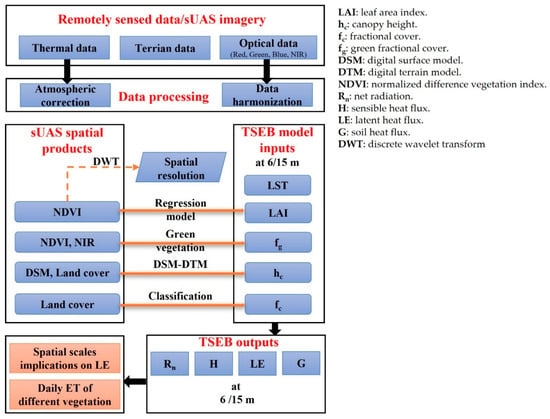
Figure 1.
Flowchart of the methodology followed in this study.
2.1. Site Description
The study location is the San Rafael River corridor located in east central Utah (38°46′31″ N, 110°06′17″ W), as shown in Figure 2. The San Rafael River drains approximately 4500 km2 in south central Utah, including the northern Swell, which makes up part of the San Rafael Swell, a giant dome-shaped anticline. The river originates from the merging of three tributaries: Huntington Creek, Cottonwood Creek, and Ferron Creek. The San Rafael is one of the most over-allocated rivers in the State of Utah, with some 360 dams and 800 surface points of diversion. The underlying geology within the region consists of sandstone, shale, and limestone, which are consistently eroded by infrequent but powerful flash floods. In recent times, fragmentation, dewatering, non-native species, and channelization have heavily impacted the river. The combination of altered hydrology, reductions in the magnitude and duration of snowmelt floods, and vegetation colonization has led to a narrowing and confinement of the river into a single-thread channel with steep banks, a low width-to-depth ratio, and a loss of habitat complexity [29]. Dewatering in this drainage is sometimes so severe that it results in a complete lack of flow for up to two months during the summer period [30]. The main riparian vegetation species in the San Rafael River corridor are treated tamarisk, willow, cottonwood, and grass/shrubs. The treatment of tamarisk involves spraying all sides of the canopy stems from the soil surface to a height of 12–18 inches using oil-soluble forms of triclopyr (Garlon 4 Ultra) herbicide and an approved oil (i.e., JBL Oil Plus). Willows are abundant along the river, and treated tamarisk are generally set back from the channel edge and dominate the floodplain. Multiple age classes of cottonwood exist on the lower floodplain surface, while grass and shrubs are scattered across the landscape.
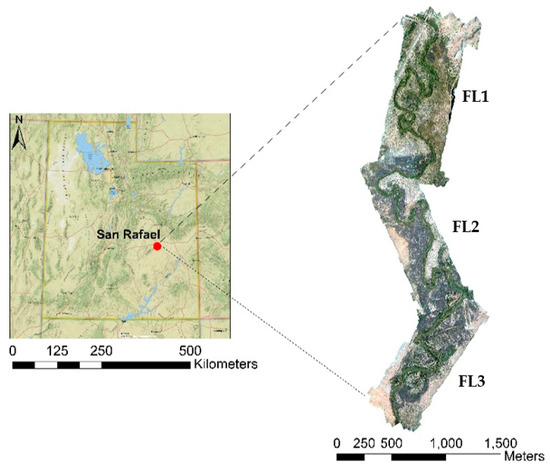
Figure 2.
Layout of a section of the San Rafael River corridor area of study.
The analyses in this study rely on multiple flight campaigns implemented by the AggieAir sUAS Program at Utah State University (https://uwrl.usu.edu/aggieair/ (accessed on 9 November 2021)). Remote sensing data with multispectral images have been acquired through many sUAS campaigns over different seasons (see Table 1) to improve our understanding of the effect of land surface phenology on water fluxes (e.g., transpiration and evaporation) between land surface and atmosphere. Optical data, including red, green, blue, and near infrared bands, were acquired at 2.5 cm spatial resolution. Thermal data were acquired at 15 cm during the same flights at 400 ft elevation using a microbolometer camera. Each individual scene was mosaicked to generate a calibrated image (reflectance and temperature) covering the study area. The micrometeorological data were obtained from a weather station installed in the field during the flight dates. The technical specifications of the weather station used for this study are illustrated in Table 2. In this study, wind and temperature data obtained from the weather station (~2 m height) were extrapolated to 20 m above ground level (agl) to address the tall tree (mainly cottonwood) heights. For the calculation of adjusted wind speed at 20 m agl, a logarithmic wind speed profile was used as shown in Equation (1), while the air temperature was reduced using the adiabatic lapse rate (ca. 6 K/1 km)
where is the wind speed at 2 m agl (m/s), measures the wind speed at specific height (m/s), and z is the height of measurement agl (m).

Table 1.
Dates and times (launch and landing) of AggieAir flights at the San Rafael River corridor.

Table 2.
The technical specifications of the weather station used for this study.
2.2. Characterizing the Spatial Heterogeneity Using Wavelet Analysis
The availability of different remote sensing platforms (satellites, manned aircrafts, and sUAS) with various spatial resolutions allows for assessment of the spatial heterogeneity in the landscape using vegetation indices such as NDVI [31]. While sUAS provides spatial information at a fine scale (i.e., plant scale), SEB models need to have adequate spatial resolution/model grid sizes that are associated with the model parameterizations in deriving energy fluxes, particularly given challenges associated with accurately representing heterogeneous domains. For example, agricultural fields such as vineyards and orchards have an organized plant pattern with uniform vegetation row spacing, making it easy to identify the dominant scale based on the distance between plant rows. In contrast, specifying the representative spatial resolution/model grid size in natural environments is more difficult as the perennial vegetation is more randomly spaced and largely clumped, creating significant gaps of bare soil with annuals emerging when water is available.
In this study, we used the discrete wavelet transform (DWT) (https://pywavelets.readthedocs.io/en/latest/ (accessed on 21 December 2021)) along with sUAS NDVI data to characterize the spatial heterogeneity over the San Rafael River corridor, a heterogeneous natural environment. Wavelet analysis has been introduced successfully in different applications over the last two decades, particularly in signal processing and computational statistics [32]. In ecological/ecosystem applications, a few studies have addressed wavelet analysis [33]. The earliest study, conducted by Bradshaw and Spies (1992) [34], aimed to characterize forest canopy structure along a transect. Another application of the wavelet analysis sought to identify the dominant resolution/model grid size (e.g., Murwira and Skidmore 2010) [35] by decomposing the 2D image into different scales for detecting the spatial pattern at each scale [36].
Wavelet energy [37] was used to characterize the spatial variability in the San Rafael River corridor by quantifying the intensity and the dominant resolution/model grid size of spatial heterogeneity in NDVI images from different dates (see Table 1). The calculation of wavelet energy begins with a wavelet transform, a linear filter that can be described by two functions: the scaling/smoothing function (also referred to as the father wavelet) and the detail function (or mother wavelet). These two functions are used to decompose the image to multiple wavelet transform coefficients to evaluate the degree of similarity between the wavelet template and the image structure/pattern. The Haar DWT was used for its ability to detect boundary, edges, and abrupt discontinuity in the data such as changes and gaps in the vegetation cover [34]. At each level of decomposition, the wavelet transform produces two types of coefficients, “smooth” and “detail”, at successive bases (), as shown in Figure 3. Smoothing coefficients represent an averaged version of the original data, whereas detail coefficients describe the deviances from the average value in horizontal (h), vertical (v) and diagonal (d) directions. A high absolute value of the coefficients represents a good match between the wavelet and the image data (e.g., a change in vegetation cover), while small or zero values represent a poor match. Given an image, , the wavelet approximations, , are calculated as a sum of the smooth and detail coefficients at different bases.
where is the smooth coefficients and is the directional detail coefficients.

Figure 3.
Schematic diagram of DWT for 2D image.
The wavelet energy is calculated as the sum of squares of the coefficients at a level of decomposition, , divided by the sum of squares all of the coefficients in . The formula that describes the wavelet energy is shown in Equation (3).
where is the detail wavelet coefficient at level j and position (x,y), E is the total wavelet energy calculated as the sum of squares of the coefficients in , and is the number of coefficients at level j. High energy values represents the presence of larger coefficients and therefore identify dominant patterns at a given spatial resolution/model grid size.
2.3. Image Classification
Coarse resolution imagery, such as Landsat at 30 m or SPOT at 20 m, may not be enough to capture the spatial heterogeneity in a natural environment [38]. However, the recent development of sUAS remote sensing technology with spatial resolutions of 10 cm or less allows for the capture of spatial variability in the riparian vegetation in locations such as the San Rafael River corridor. In this study, multispectral images from several flight campaigns acquired by AggieAir sUAS were classified to identify and map the features/classes of interest in riparian scenes using supervised classification, in which the spectral signatures/training samples from the image are extracted by specifying the known or visibly distinct features. Training samples were extracted from the images using ArcGIS 10.7 and then used to classify the entire map into several features, including willow, water, treated tamarisk, bare ground, developed/road, grass/shrubs, and cottonwood. Flight images show distinct spectral variations between different vegetation types, mostly willow (dense with green tones), treated tamarisk (represented by a dark brown color), and cottonwood (large green leaves and thick foliage).
2.4. ET Estimation Using the Two-Source Energy Balance (TSEB) Model
2.4.1. Model Overview
The TSEB model (https://github.com/hectornieto/pyTSEB (accessed on 21 December 2021)) was developed originally by Norman et al. (1995) [14] to calculate energy fluxes, mainly the latent heat flux (LE). TSEB considers the combined emissions from vegetation and soil to compose the total temperature emitted by the surface, weighted based on the fractional cover as described in Equation (4)
where is the vegetation fractional cover observed by the TIR sensor at specific angle . Tc and Ts are the canopy and soil temperature (Kelvin), respectively. is the directional radiometric surface temperature. As the temperature is separated into soil and canopy temperatures (Ts and Tc), the energy balance is decoupled into two layers and can be described in the following equations
where is net radiation, LE is latent heat flux, H is sensible heat flux, and G is the soil heat flux. All flux units are expressed in W/m2, and subscripts c and s represent the canopy and soil components, respectively. Radiative transfer and absorption through canopy are simulated using an extinction coefficient approach, which is a function of the amount of canopy foliage (i.e., LAI) and canopy architecture (i.e., XLAD) along with the incident solar angle. In the radiative transfer model, the incoming shortwave radiation is separated into direct and diffused radiation, along with separation between visible and near-infrared (VIS-NIR) spectral ranges due to drastic changes in reflectivity and transmissivity between canopy and soil features. TSEB simulated the longwave (LW) radiation transfer model similarly without considering a diffusion from the TIR region.
When estimating the sensible heat flux for soil and canopy (Hs and Hc), both layers are assumed to interact with each other and with the atmosphere using their respective temperatures along with a series of soil-vegetation resistive schemes (following an analogy with Ohm’s law)
where is the sensible heat flux (W/m2); is the air density (kg/m3); is the heat capacity of the air at constant pressure (J/kg/ K); TA is the air temperature (Kelvin); Tc and Ts are canopy and soil temperature (Kelvin), respectively; and TAC is the temperature of the canopy-air space (Kelvin) calculated from the component temperature of each source (Tc and Ts) along with aerodynamic resistances, , and , as described mathematically in Equation (10).
where is the aerodynamic resistance to heat transfer based on the Monin–Obukhov similarity theory, rx is the boundary layer resistance of the canopy leaves, and rs is the aerodynamic resistance to heat transport in the boundary layer above the soil layer. All resistances are expressed in (s/m). More details about the TSEB model and updates/revisions to algorithms can be found in Kustas et al. (1999), Kustas et al. (1999), and Nieto et al. (2019) [39,40,41], and the details of radiation formulations can be found in Campbell and Norman (1998) [42].
2.4.2. Retrieving the Biophysical TSEB Inputs
The TSEB model requires vegetation biophysical properties as inputs. In natural environments such as the San Rafael River corridor, deriving the spatial information of biophysical parameters is challenging due to spatial heterogeneity in the vegetation species, terrain formation, and environmental characteristics.
- (a)
- Fractional cover (fc)
In the TSEB model, fractional cover (fc) is used as a proxy for canopy clumpiness, which is defined as the nadir-looking fraction of vegetation (both green and standing dead vegetation elements) per unit ground. Together with total LAI, fc mainly affects how irradiance is effectively intercepted by the vegetation and/or transmitted through the background/soil. To calculate the fc in this study, the high-resolution RGB image was first classified into multiple features/classes, then fc was estimated as the portion of vegetation (green and standing dead) within the spatial domain/model grid size.
- (b)
- Green ground cover (fg)
Green ground cover (fg) is defined as the fraction of leaves or vegetation elements that could actively transpire. It represents the fraction of LAI that is actually green and hence mainly contributing to latent heat flux, while the rest of the dead vegetation elements (1 − fg) are mainly contributing to sensible heat flux. For the June and July flights, NDVI was used to separate vegetation pixels (classified previously for the fc calculation) to calculate the proportion of green and dead elements at different spatial resolutions (6 m and 15 m), whereas the NIR band was used for October flights as most vegetation is in a dry and/or dead condition.
- (c)
- Canopy height (hc)
Generating hc maps for the San Rafael River corridor was challenging due to the high variation in the land surface topography. Canopy height (hc) was calculated as the difference between the digital surface model (DSM) and the digital terrain model (DTM). The DSM was obtained from sUAS flights at different dates, while the DTM, which represents the ground elevation, was generated by selecting the elevation of pure bare soil pixels and then creating a DTM map covering the study area using an interpolation model (Kriging).
- (d)
- Leaf Area Index (LAI)
LAI is an important state variable in ecosystem modeling as it influences the energy fluxes between the land surface and atmosphere. Estimating spatial distribution of LAI is challenging in heterogeneous natural environments with a variety of vegetation types, such as the San Rafael River corridor. In this study, the ground-based LAI measurements were collected using a LiCOR plant canopy analyzer at multiple locations. Due to the variability within the canopy as shown in Figure 4, the LAI was placed near the bottom of the canopy at each location and was moved to different spots (4–6) at the base of the canopy to provide a representative sample. For each measurement, a 45° view cap was placed over the lens, restricting the view to an eighth of a hemisphere.
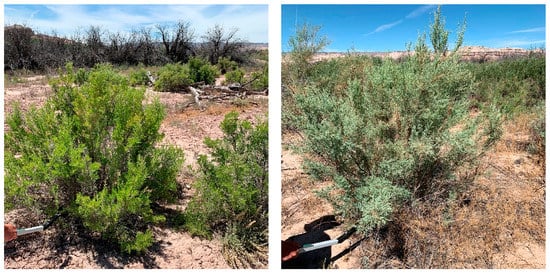
Figure 4.
Example of in situ LAI measurements taken in the San Rafael River.
This ecosystem is more spatially complicated than many studies using LAI and NDVI relationships. A simple equation from the literature did not work for this ecosystem. As a result, we developed our own procedure to find the relationships for this complex surface. LAI was estimated as a point measurement for individual canopy (LAIshrub). The primary goal was to have the LAI value represent the spatial domain/model grid size (including bare ground and vegetation), and this was calculated as LAI = fc × fg × LAIshrub [43]. Next, a regression model (exponential equation) between LAI and the vegetation indices, particularly NDVI, was used to derive spatial maps of LAI in the June and July flights (see Figure 5). However, using the regression model for October flights resulted in a weak correlation due to senescent condition with low LAI values. For the October flights, a specific LAI value was used for each vegetation type based on in situ measurements.
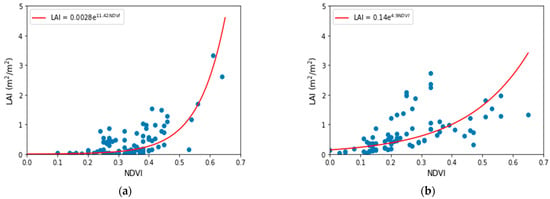
Figure 5.
LAI-NDVI relationship for the flights on (a) 19 June 2019 and (b) 22 July 2019.
2.5. Daily ET Estimation
The instantaneous (hourly) latent heat flux (LE) was obtained using the TSEB model and then extrapolated/upscaled to daily ET (ETd) values using the incoming solar radiation (Rs), which is the method recommended for use in complex canopy environments [44]. Moreover, a study conducted by Cammalleri et al. (2014) [45] indicated that the Rs approach is best for extrapolating the instantaneous ET to daily values in grassland and woody savanna. Rs is defined as the ratio of latent heat flux (LE) to incoming solar radiation (Rs) as a reference variable. The Rs approach is presented in Equation (11) as follows:
where ETd is the daily ET (mm/day), LE is the instantaneous latent heat flux (W/m2), is the daily solar radiation (MJ/m2/day), is the instantaneous solar radiation (W/m2), is the water density (kg/m3), is the latent heat of vaporization for water (MJ/kg), and c is a factor equal to 1000 to convert meters to millimeters.
3. Results and Discussion
3.1. Land Cover/Land Use Classification
The sUAS images, in conjunction with ground-based observations, were used to discriminate riparian vegetation classes in the San Rafael River corridor. The results of the land cover/land use classification are summarized into seven categories: water, developed (Road), bare ground, treated tamarisk, cottonwood, willow, and grass/shrubs. The distribution of the vegetation has distinct patterns across the San Rafael floodway. Dense vegetation stands of treated tamarisk (non-native) represent the second dominant riparian plant species in the study area. Willows/phragmites (also called common reed) were identified along the river and dominate the river channel margin, occupying the riparian berm that extends laterally to a width of 2 to 10 m. Some cottonwood trees are scattered across the floodplain. Most of the cottonwood trees are designated within the old age class, with height varying between 8 and 12 m above ground level (agl). Swaths of grass and desert shrubs are observed along the dry riverside, and other areas are dominated by sand dunes.
Figure 6 shows the proportion of the different plants mapped across the San Rafael River corridor. The results indicate that grass/shrubs are widespread throughout the entire study area, representing nearly 37%. Treated tamarisk is the second dominant vegetation species, which represents 23% of the study area. In contrast, the classified map shows the percentage of cottonwood and willow to be relatively small compared with the other vegetation species, accounting for 2% and 3% of total area, respectively. Of the remaining three land cover/land use classes, bare ground constitutes nearly 31%, and water constitutes 3%, while the developed (Road) class is far less prevalent across the study area, accounting for 1%.
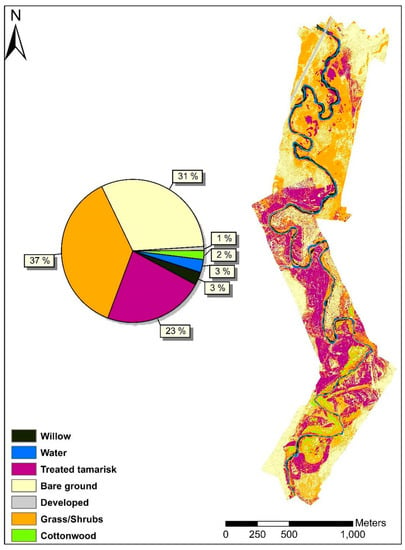
Figure 6.
Vegetation classification map of the San Rafael River corridor.
3.2. Spatial Heterogeneity Using Wavelet Analysis
Understanding the role of landscape heterogeneity is essential for identifying the representative spatial resolution/model grid size to estimate surface fluxes, mainly LE. In this study, NDVI, as one of the most common vegetation indices, was used to investigate spatial heterogeneity in the San Rafael River corridor. As shown in Figure 7, high spatial variability was observed in the NDVI due to high landscape heterogeneity within the different features/classes, including water, vegetation, and bare soil. Other environmental factors that could increase the NDVI spatial variability are the variation in soil properties (such as soil salinity) and/or soil moisture [46]. High NDVI values correspond to green vegetation, particularly along the river corridor, whereas bare soil and standing dead vegetation are characterized by low NDVI. For example, the NDVI increases dramatically in cottonwood and high-density vegetation such as willow/phragmites with values above 0.75. Sparse vegetation such as grass/shrubs result in moderate values of NDVI ranging between 0.4 and 0.7. In cases of soil and dead and/or dry vegetation, NDVI is less than 0.35. Negative values of NDVI correspond to the waterbody.
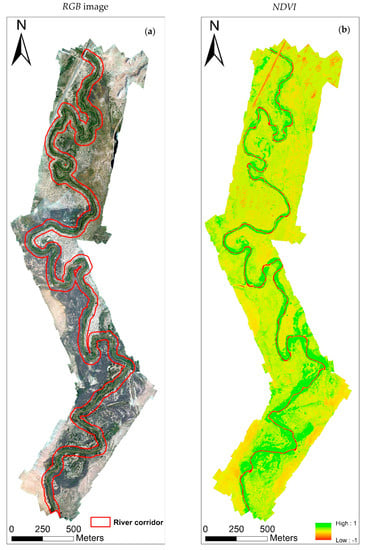
Figure 7.
Layout of river corridor (dense vegetation along the riverbank) and non-river corridor area (surrounding arid vegetation) for wavelet analysis; (a) represents the RGB image, while (b) represents the NDVI image.
Figure 8 shows the wavelet energy of NDVI for two different features, the river corridor and the remaining area surrounding the river corridor (non-river corridor). Each plot describes the change in the wavelet energy (%) in the various directions (horizontal, vertical, diagonal) corresponding to multiple spatial resolutions/model grid sizes. The comparison of the wavelet energy curves for the two features shows that they have completely different shapes for all flights (June, July, and October). For the area adjacent to the river (river corridor), wavelet energy resembles a concave down shape with highest values of energy appearing in the vertical (north-south) direction, medium in the horizontal (east-west) direction, and lowest in the diagonal (northeast-southwest and northwest-southeast) direction. Based on Figure 8, the vertical and horizontal curves show the presence of two dominant scales of spatial heterogeneity depicted by two wavelet energy maxima ranging between 6.4 and 12.8 m for all sUAS flights. The wavelet energy values at 6.4 m and 12.8 m spatial resolutions are relatively close, with a slight increase at 12.8 m. However, in the diagonal orientation, the wavelet energy values are very low, with the wavelet-based dominant scale peaking at 12.8 m. In the non-river corridor area, the wavelet energy curves in the various directions (vertical, horizonal, and diagonal) flatten out without the presence of a dominant spatial resolution/scale, with one exception. FL1 on 19 June 2019, shows a high wavelet energy value present at very low spatial resolution, which may occur as a result of different vegetation patterns and types existing in that area.
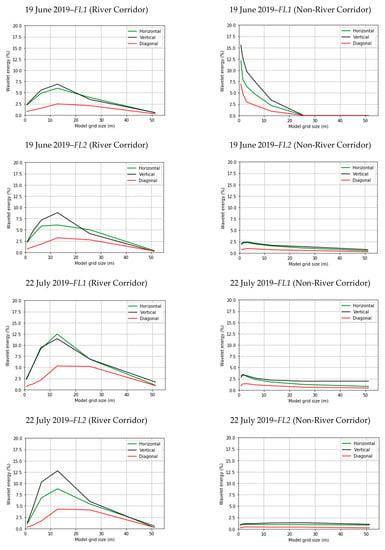
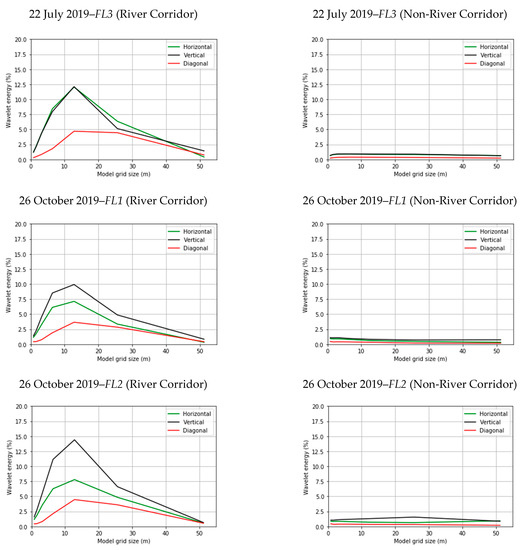
Figure 8.
Wavelet energy at multiple spatial domains for different flights.
The different wavelet energy curves between the river corridor and the remaining area (non-river corridor) are caused mainly by the fact that green vegetation is present along the river, while the surrounding area is characterized by different surface types (soil, standing dead vegetation, shrubs, or others). The NDVI of the canopy has a much higher value than any surface type, which causes a larger variation and more wavelet energy. However, for the second feature (non-river corridor), which is characterized by scattered shrubs and canopies, the wavelet energy is very low with a flat curve. This indicates that considerable wavelet energy is present at all spatial resolutions/model grid sizes. One explanation for the flat shape in the wavelet energy curve across the different flights could be the low variation in the NDVI values of dead plants and soil. Even the shrubs present within the domain do not seem to have a significant influence on the general trend of the wavelet energy curve due to the large distances between them.
3.3. Retrieving the Biophysical Parameters
Figure 9 shows an example of each biophysical parameter (fc, fg, LAI, and hc) used for the TSEB model. The fc parameter was calculated using the percentage of vegetative pixels (stand dead and green) within each contextual spatial domain/resolution and ranged between 0 and 1 for the sUAS flight in July 2019. As shown in Figure 9a, the highest fc values were observed along the river corridor, which is dominated by green vegetation. The comparison of the fc maps at the two spatial resolutions (6 m and 15 m) shows a non-significant difference, with a slight decrease at 15 m due to the loss in spatial variability.
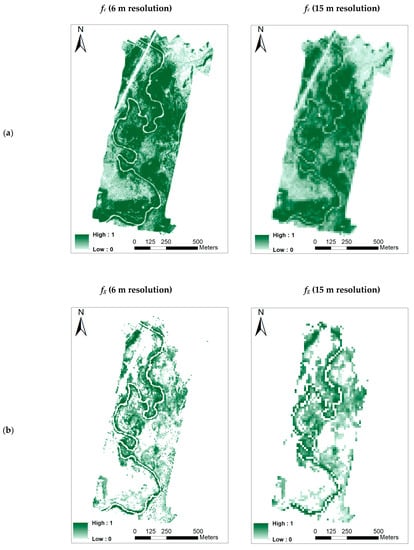
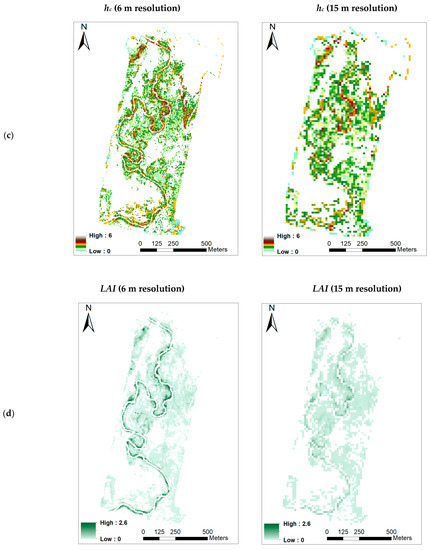
Figure 9.
An example of the spatial maps for biophysical parameters at 6 m and 15 m resolutions for FL1 (22 July 2019). (a) fractional cover (fc), (b) green fractional cover (fg), (c) canopy height (hc), (d) leaf area index (LAI).
Green fractional cover (fg) was calculated as the percentage of green vegetation only. NDVI threshold values were used to distinguish between the dead and green vegetation for the sUAS flights in June and July, whereas the NIR band was used for the October flight because most vegetation is in a dry condition at that time. Figure 9b illustrates the ranges of fg, which are between 0 and 1 for the sUAS FL1 on 22 July 2019. The highest fg values were observed along the river corridor, whereas the lowest values are present in the treated tamarisk patches, which are in a dead/dry condition. Comparing the fg values between the 6 m and 15 m spatial scales revealed a slight difference caused by aggregation issues.
Canopy height (hc) maps were generated based on the differences between the DSM and DTM. Overall, hc values showed high spatial variability due to the number of vegetation types (treated tamarisk, cottonwood, willow, grass/shrubs) that exist in the study area. The highest hc values correspond to cottonwood, varying between 8 and 12 m, whereas the lowest hc values were observed in grass/shrubs, ranging between 0.2 and 0.5 m, depending on the vegetation development stage. Figure 10 shows an example of canopy height calculation. The DSM profile represents the elevation of canopy above mean sea level (amsl) at 25 cm spatial resolution, whereas the hc profile represents canopy height derived at a 1 m spatial domain. A comparison of the two profiles indicates similarities in the shapes of both curves.
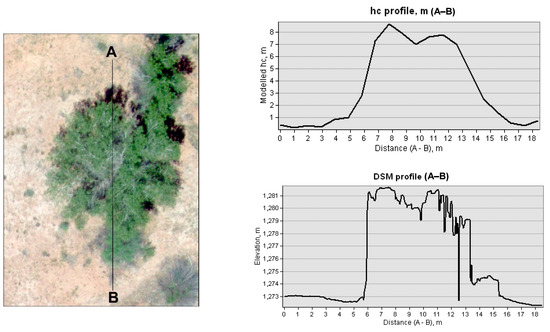
Figure 10.
An example of DEM and hc profiles in the study site.
LAI calculation was challenging in this study because of the landscape complexity in the San Rafael River corridor. Figure 9d shows an example of the LAI maps at different resolutions for sUAS FL1 on 22 July 2019. The highest LAI values were observed in willow and cottonwood, whereas the lowest values were in grass/shrubs. Comparing the LAI maps at the two scales, the values at 15 m spatial resolution are lower due to the mix of different vegetation types within the spatial domain/resolution. Wu et al. (2016) [47] found that LAI scaling is influenced not only by the spatial heterogeneity of NDVI but also by the nonlinearity model used for retrieving LAI. The study also found that the logarithmic regression model results in overestimation in LAI values, whereas the exponential regression function leads to underestimation of LAI values within the heterogeneous spatial domain. For this study, we found reasonable agreement between the NDVI and ground LAI measurements using the exponential equation as explained in the methodology section.
3.4. Spatial Scale Implications on LE
The TSEB model was applied at two selected spatial resolutions/model grid sizes, 6 m and 15 m, both of which are considered suitable to represent the San Rafael River corridor domain according to the wavelet analysis (see Section 3.2). To represent differences in roughness for the vegetation types within the two model grid sizes/spatial domains (6 m and 15 m), different canopy heights were weighted by their fractional cover. To evaluate the influence of the two resolutions on LE energy fluxes using the sUAS information, an example of the LE map along with other statistics, including the frequency curve, spatial mean, and standard deviation, were calculated and presented in Table 3 and Figure 11. Overall, the results indicate low statistical discrepancies in the LE values at the two different scales, 6 m and 15 m, for the multiple sUAS flights. The statistics (spatial mean () and standard deviation ()) of the two resolutions are close, with a slight decrease at 15 m due to losses in spatial variability. For example, the spatial mean LE value for FL1 on 22 July 2019 was 126 W/m2 at 6 m resolution/model grid size but decreased to 122 W/m2 at 15 m resolution. Similarly, the standard deviation decreases slightly from 68 W/m2 at 6 m resolution to 64 W/m2 at 15 m resolution. Figure 12 shows the frequency curves of LE at 6 m and 15 m spatial resolutions/model grid sizes for the area covered by each flight (FL1, FL2, and FL3). The plots demonstrate different trends due to different vegetation patterns and types that dominate each flight. For example, grass and shrubs dominate in FL1, whereas treated tamarisk is widespread in FL2 and FL3. Moreover, the frequency histogram in Figure 12 indicates a non-significant change between the two curves at the two different scales for each single flight. This behavior aligns with the results obtained from the spatial mean and standard deviation. One explanation for the similarities in LE values could be that both resolutions are able to capture the heterogeneity in the study site domain.

Table 3.
Spatial resolution effect on LE estimation.
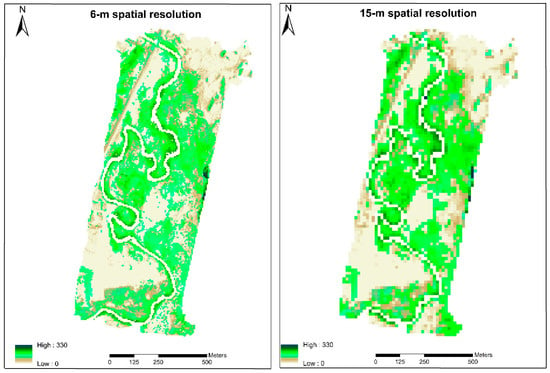
Figure 11.
Example of modeled instantaneous LE (W/m2) at 6 m and 15 m resolutions for 22 July 2019 at 10:05 am.
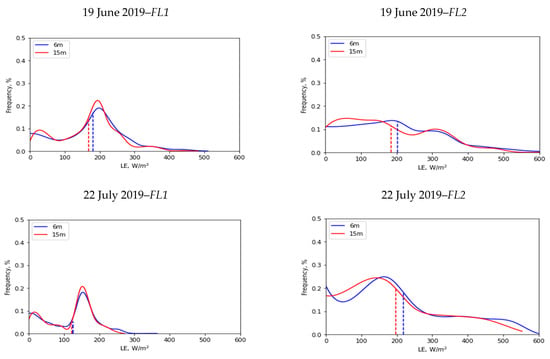
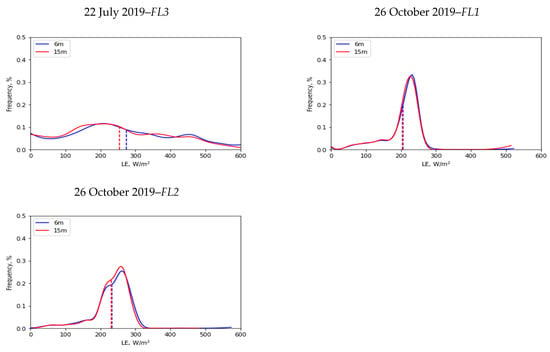
Figure 12.
Frequency curves of instantaneous LE (W/m2) for all sUAS flights at 6 m and 15 m. Note: blue dashed line represents the spatial mean of LE at 6 m resolution, red represents the 15 m resolution.
Figure 11 shows an example of modeled instantaneous LE (W/m2) at 6 m and 15 m resolutions for FL1 on 22 July 2019. The maps show high spatial variability in LE values, varying between 0 W/m2 and 330 W/m2. A similar trend in spatial variances has been observed for other LE maps at different dates and times. Many factors related to soil moisture and differences in vegetation species and vegetation cover could potentially cause these variations in LE. High LE values correspond to the vegetation along the river corridor due to the presence of dense patches that reach full green ground cover. This is true for all of the vegetation along the riverbank.
3.5. Daily ET Calculation for Vegetation Types
To evaluate the difference in daily ET for each vegetation type on the different dates (19 June 2019; 22 July 2019; 26 October 2019), spatial mean (µ) and standard deviation (σ) were calculated as shown in Table 4, while LE variability is illustrated through boxplots in Figure 13. Overall, the results indicate only a small difference in the spatial mean of ETd between 19 June 2019 and 22 July 2019, with a significant decrease in standard deviation. For example, the mean daily ET value for cottonwood on 19 June 2019 and 22 July 2019 was 4.9 mm/day and 5 mm/day, respectively, and then decreased to 2.7 mm/day on 26 October 2019. Similarly, willow daily ET was 5 mm/day and 4.9 mm/day, respectively, for 19 June and 22 July and then decreased to 2.6 mm/day on 26 October. The low values of ET on 26 October across different vegetation types are due to the dry condition of vegetation observed on that date. The exception is the treated tamarisk, which is in a dry/dead condition across all of the different dates.

Table 4.
Average daily ET estimation for different vegetation types on different dates for the study area.
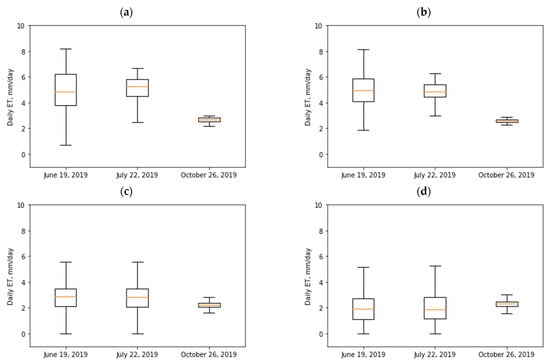
Figure 13.
Daily ET estimation for each vegetation type on different sUAS flight dates in the study area. (a) Cottonwood. (b) Willow. (c) Grass/shrubs. (d) Treated tamarisk.
As shown in Figure 14, the highest ET was observed in willow, which dominates the river corridor, and cottonwood. According to Neale et al. (2011) [27], cottonwood has the highest ET among the vegetation types studied (saltcedar/tamarisk, mesophyte, arundo, mesquite, conifer, and desert scrub). In contrast, the lowest ET in this study was observed in treated tamarisk, which represents the second largest vegetation area after grass/shrubs, with an average value of nearly 2.1 mm/day. Although the treated tamarisk is in dead and/or dry condition across different dates, green vegetation growing underneath contributed to a magnitude value of ET for tamarisk as shown in Figure 15. Generally, the estimation of actual water use in tamarisk is complicated as it varies from one location to another and is strongly influenced by the measurement period [48] due to several factors related to plant size, water quality and salinity, and depth to groundwater. The average ET rate of grass/shrubs was found to be between 2.2 mm/day and 2.8 mm/day across the different dates. These results are similar to Neale et al. (2011) [27], which showed daily ET ranging between 2 mm/day and 3.3 mm/day. The large ET rate estimated for grass/shrubs corresponds to the vegetation along the river corridor (see Figure 14).
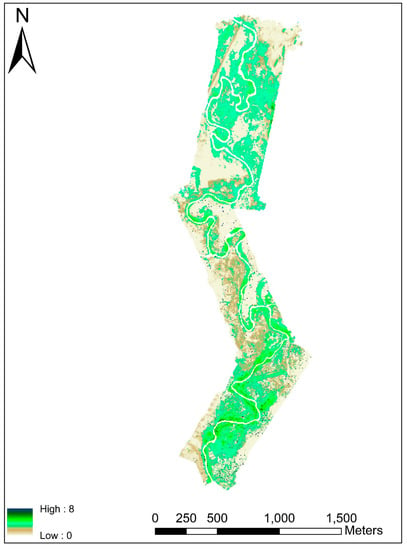
Figure 14.
An example of modeled daily ET for 22 July 2019.
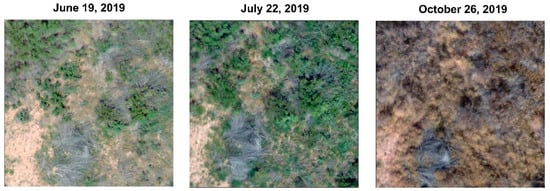
Figure 15.
Example of RGB sUAS image from each flight date (June, July, and October).
4. Conclusions
Spatial resolution/scale is one of the challenges related to ET estimation, particularly in heterogeneous natural environments such as the San Rafael River corridor, which has a wide range of vegetation types and other ground features. The objective of this study was to characterize the spatial heterogeneity in a natural environment to evaluate its impact on ET estimation using the TSEB model and high-resolution data acquired by sUAS. Retrieving the biophysical parameters (LAI, fc, fg, and hc) required as inputs to the TSEB model constitutes a challenging issue in this study due to landscape heterogeneity. The discrete wavelet transform (DWT) was used along with sUAS NDVI to identify the suitable spatial resolution to represent the study area. Wavelet analysis was considered for two different features from multiple sUAS flights: the river corridor and the remaining area (non-river corridor) that surrounds the river corridor. Multiple plots were used to describe the changes in wavelet energy (%) in the different directions (horizontal, vertical, and diagonal) corresponding to different spatial resolutions. The results showed that the maximum wavelet energy is between 6.4 m and 12.8 m for the river corridor area, while the non-river corridor area, which is characterized by different surface types and random vegetation, does not show a peak value. One explanation for the flat shape in the wavelet energy in the non-river corridor area is the low variation in NDVI values for the dead/dry vegetation and soil.
Secondly, to evaluate the effect of spatial resolution on LE estimation using the TSEB model, spatial scales of 6 m and 15 m instead of 6.4 m and 12.8 m, respectively, were used to simplify the derivation of model inputs. Multiple statistical measures (frequency curve, spatial mean, standard deviation) were used to assess the effect of spatial resolutions. The results indicated low statistical differences in the LE values at the two different scales, 6 m and 15 m, for the multiple sUAS flights. Furthermore, the results showed that the high spatial variability in LE values within each single flight was due to many environmental factors, including soil moisture, different vegetation types, and fractional cover.
Lastly, to estimate the water use for each vegetation type in the study area, the instantaneous (hourly) latent heat flux (LE) obtained from the TSEB model was extrapolated to a daily scale using the Rs method. The highest ET was observed in willow, which dominates the river corridor, as well as cottonwood, followed by grass/shrubs and treated tamarisk. Although most of the treated tamarisk vegetation was in dead/dry condition, the green vegetation growing underneath resulted in a magnitude value of ET.
The DWT approach was shown to be highly effective at identifying and quantifying the spatial heterogeneity of a river corridor with continuously varying landscape properties such as natural vegetation cover/pattern. This study is an initial step toward a continued effort to explore and improve TSEB inputs for better ET estimates in such heterogeneous natural environments. Future research should consider more than one study site to investigate the effectiveness of using the DWT technique to identify the dominant scale. This should also include ground-based energy flux measurements such as from an eddy covariance (EC) tower to further validate the results obtained from the TSEB model.
Author Contributions
Conceptualization, A.N.; formal analysis, A.N.; methodology, A.N.; project administration, D.K., I.G. and A.T.-R.; resources, C.C.; software, H.N. and A.N.; supervision, A.T.-R., W.K., M.M. and L.H.; visualization, A.N., D.S.; writing— original draft, A.N.; writing—review and editing, A.T.-R., W.K. and L.H. All authors have read and agreed to the published version of the manuscript.
Funding
We would like to acknowledge and express our gratitude to Utah Division of Wildlife Resources [Grant No. 202421], which provided the funding for this research.
Conflicts of Interest
The authors declare no conflict of interest.
References
- Glenn, E.P.; Huete, A.R.; Nagler, P.L.; Hirschboeck, K.K.; Brown, P. Integrating Remote Sensing and Ground Methods to Estimate Evapotranspiration. Crit. Rev. Plant Sci. 2007, 26, 139–168. [Google Scholar] [CrossRef]
- González-Dugo, M.P.; Chen, X.; Andreu, A.; Carpintero, E.; Gómez-Giraldez, P.J.; Carrara, A.; Su, Z. Long-Term Water Stress and Drought Monitoring of Mediterranean Oak Savanna Vegetation Using Thermal Remote Sensing. Hydrol. Earth Syst. Sci. 2021, 25, 755–768. [Google Scholar] [CrossRef]
- Nassar, A.; Torres-Rua, A.; Kustas, W.; Nieto, H.; McKee, M.; Hipps, L.; Stevens, D.; Alfieri, J.; Prueger, J.; Alsina, M.M.; et al. Influence of Model Grid Size on the Estimation of Surface Fluxes Using the Two Source Energy Balance Model and sUAS Imagery in Vineyards. Remote Sens. 2020, 12, 342. [Google Scholar] [CrossRef] [PubMed] [Green Version]
- Saadi, S.; Boulet, G.; Bahir, M.; Brut, A.; Delogu, É.; Fanise, P.; Mougenot, B.; Simonneaux, V.; Chabaane, Z.L. Assessment of Actual Evapotranspiration over a Semiarid Heterogeneous Land Surface by Means of Coupled Low-Resolution Remote Sensing Data with an Energy Balance Model: Comparison to Extra-Large Aperture Scintillometer Measurements. Hydrol. Earth Syst. Sci. 2018, 22, 2187–2209. [Google Scholar] [CrossRef] [Green Version]
- Giorgi, F.; Avissar, R. Representation of Heterogeneity Effects in Earth System Modeling: Experience from Land Surface Modeling. Rev. Geophys. 1997, 35, 413–437. [Google Scholar] [CrossRef]
- Bonan, G.B.; Doney, S.C. Climate, Ecosystems, and Planetary Futures: The Challenge to Predict Life in Earth System Models. Science 2018, 359, eaam8328. [Google Scholar] [CrossRef] [Green Version]
- Krinner, G.; Viovy, N.; de Noblet-Ducoudré, N.; Ogée, J.; Polcher, J.; Friedlingstein, P.; Ciais, P.; Sitch, S.; Colin Prentice, I. A Dynamic Global Vegetation Model for Studies of the Coupled Atmosphere-Biosphere System. Glob. Biogeochem. Cycles 2005, 19. [Google Scholar] [CrossRef]
- Richardson, A.D.; Keenan, T.F.; Migliavacca, M.; Ryu, Y.; Sonnentag, O.; Toomey, M. Climate Change, Phenology, and Phenological Control of Vegetation Feedbacks to the Climate System. Agric. For. Meteorol. 2013, 169, 156–173. [Google Scholar] [CrossRef]
- Guzinski, R.; Nieto, H.; Stisen, S.; Fensholt, R. Inter-Comparison of Energy Balance and Hydrological Models for Land Surface Energy Flux Estimation over a Whole River Catchment. Hydrol. Earth Syst. Sci. 2015, 19, 2017–2036. [Google Scholar] [CrossRef] [Green Version]
- Kite, G.; Droogers, P. Comparing Evapotranspiration Estimates from Satellites, Hydrological Models and Field Data. J. Hydrol. 2000, 229, 3–18. [Google Scholar] [CrossRef]
- Kjaersgaard, J.; Allen, R.; Irmak, A. Improved Methods for Estimating Monthly and Growing Season ET Using METRIC Applied to Moderate Resolution Satellite Imagery. Hydrol. Processes 2011, 25, 4028–4036. [Google Scholar] [CrossRef]
- Kustas, W.P. Estimates of Evapotranspiration with a One- and Two-Layer Model of Heat Transfer over Partial Canopy Cover. J. Appl. Meteorol. 1990, 29, 704–715. [Google Scholar] [CrossRef]
- Acharya, B.; Sharma, V. Comparison of Satellite Driven Surface Energy Balance Models in Estimating Crop Evapotranspiration in Semi-Arid to Arid Inter-Mountain Region. Remote Sens. 2021, 13, 1822. [Google Scholar] [CrossRef]
- Norman, J.M.; Kustas, W.P.; Humes, K.S. Source Approach for Estimating Soil and Vegetation Energy Fluxes in Observations of Directional Radiometric Surface Temperature. Agric. For. Meteorol. 1995, 77, 263–293. [Google Scholar] [CrossRef]
- Gao, R.; Torres-Rua, A.F.; Nassar, A.; Alfieri, J.; Aboutalebi, M.; Hipps, L.; Ortiz, N.B.; Mcelrone, A.J.; Coopmans, C.; Kustas, W.; et al. Evapotranspiration Partitioning Assessment Using a Machine-Learning-Based Leaf Area Index and the Two-Source Energy Balance Model with sUAV Information. In Autonomous Air and Ground Sensing Systems for Agricultural Optimization and Phenotyping VI; International Society for Optics and Photonics: San Diego, CA, USA, 2021; (This Conference Conducted in USA). [Google Scholar]
- Gonzalez-Dugo, M.P.; Neale, C.M.U.; Mateos, L.; Kustas, W.P.; Prueger, J.H.; Anderson, M.C.; Li, F. A Comparison of Operational Remote Sensing-Based Models for Estimating Crop Evapotranspiration. Agric. For. Meteorol. 2009, 149, 1843–1853. [Google Scholar] [CrossRef]
- Timmermans, W.J.; Kustas, W.P.; Anderson, M.C.; French, A.N. An Intercomparison of the Surface Energy Balance Algorithm for Land (SEBAL) and the Two-Source Energy Balance (TSEB) Modeling Schemes. Remote Sens. Environ. 2007, 108, 369–384. [Google Scholar] [CrossRef]
- Cleugh, H.A.; Leuning, R.; Mu, Q.; Running, S.W. Regional Evaporation Estimates from Flux Tower and MODIS Satellite Data. Remote Sens. Environ. 2007, 106, 285–304. [Google Scholar] [CrossRef]
- Jung, M.; Henkel, K.; Herold, M.; Churkina, G. Exploiting Synergies of Global Land Cover Products for Carbon Cycle Modeling. Remote Sens. Environ. 2006, 101, 534–553. [Google Scholar] [CrossRef]
- Kustas, W.P.; Norman, J.M. Use of Remote Sensing for Evapotranspiration Monitoring over Land Surfaces. Hydrol. Sci. J. 1996, 41, 495–516. [Google Scholar] [CrossRef]
- Brunsell, N.A.; Gillies, R.R. Scale Issues in Land–atmosphere Interactions: Implications for Remote Sensing of the Surface Energy Balance. Agric. For. Meteorol. 2003, 117, 203–221. [Google Scholar] [CrossRef]
- Hong, S.-H.; Hendrickx, J.M.H.; Borchers, B. Down-Scaling of SEBAL Derived Evapotranspiration Maps from MODIS (250 M) to Landsat (30 M) Scales. Int. J. Remote Sens. 2011, 32, 6457–6477. [Google Scholar] [CrossRef]
- Sharma, V.; Kilic, A.; Irmak, S. Impact of Scale/resolution on Evapotranspiration from Landsat and MODIS Images. Water Resour. Res. 2016, 52, 1800–1819. [Google Scholar] [CrossRef] [Green Version]
- Anderson, M.C.; Norman, J.M.; Mecikalski, J.R.; Torn, R.D.; Kustas, W.P.; Basara, J.B. A Multiscale Remote Sensing Model for Disaggregating Regional Fluxes to Micrometeorological Scales. J. Hydrometeorol. 2004, 5, 343–363. [Google Scholar] [CrossRef]
- Li, F.; Kustas, W.P.; Anderson, M.C.; Prueger, J.H.; Scott, R.L. Effect of Remote Sensing Spatial Resolution on Interpreting Tower-Based Flux Observations. Remote Sens. Environ. 2008, 112, 337–349. [Google Scholar] [CrossRef]
- Kustas, W. Evaluating the Effects of Subpixel Heterogeneity on Pixel Average Fluxes. Remote Sens. Environ. 2000, 74, 327–342. [Google Scholar] [CrossRef]
- Neale, C.M.U.; Geli, H.; Taghvaeian, S.; Masih, A.; Pack, R.T.; Simms, R.D.; Baker, M.; Milliken, J.A.; O’Meara, S.; Witherall, A.J. Estimating Evapotranspiration of Riparian Vegetation Using High Resolution Multispectral, Thermal Infrared and Lidar Data. In Remote Sensing for Agriculture, Ecosystems, and Hydrology XIII; International Society for Optics and Photonics: San Diego, CA, USA, 2011; (This conference conducted in USA). [Google Scholar]
- Keller, D.L.; Laub, B.G.; Birdsey, P.; Dean, D.J. Effects of Flooding and Tamarisk Removal on Habitat for Sensitive Fish Species in the San Rafael River, Utah: Implications for Fish Habitat Enhancement and Future Restoration Efforts. Environ. Manag. 2014, 54, 465–478. [Google Scholar] [CrossRef]
- Fortney, S.T. A Century of Geomorphic Change of the San Rafael River and Implications for River Rehabilitation. Utah State University, 2015. Available online: https://digitalcommons.usu.edu/etd/4363 (accessed on 25 June 2021).
- Budy, P. Habitat Needs, Movement Patterns, and Vital Rates of Endemic Utah Fishes in a Tributary to the Green River, Utah. 2009. Available online: https://digitalcommons.usu.edu/wats_facpub/870 (accessed on 25 June 2021).
- Seto, K.C.; Fleishman, E.; Fay, J.P.; Betrus, C.J. Linking Spatial Patterns of Bird and Butterfly Species Richness with Landsat TM Derived NDVI. Int. J. Remote Sens. 2004, 25, 4309–4324. [Google Scholar] [CrossRef]
- Morettin, P.A. From Fourier to Wavelet Analysis of Time Series. In COMPSTAT; Physica-Verlag HD: Herdelberg, Germany, 1996; pp. 111–122. [Google Scholar]
- Csillag, F.; Kabos, S. Wavelets, Boundaries, and the Spatial Analysis of Landscape Pattern. Écoscience 2002, 9, 177–190. [Google Scholar] [CrossRef]
- Bradshaw, G.A.; Spies, T.A. Characterizing Canopy Gap Structure in Forests Using Wavelet Analysis. J. Ecol. 1992, 80, 205. [Google Scholar] [CrossRef]
- Murwira, A.; Skidmore, A.K. Comparing Direct Image and Wavelet Transform-Based Approaches to Analysing Remote Sensing Imagery for Predicting Wildlife Distribution. Int. J. Remote Sens. 2010, 31, 6425–6440. [Google Scholar] [CrossRef]
- Cazelles, B.; Chavez, M.; Berteaux, D.; Ménard, F.; Vik, J.O.; Jenouvrier, S.; Stenseth, N.C. Wavelet Analysis of Ecological Time Series. Oecologia 2008, 156, 287–304. [Google Scholar] [CrossRef]
- Bruce, A.; Gao, H.-Y. Applied Wavelet Analysis with S-PLUS; Springer: Berlin/Heidelberg, Germany, 1996; ISBN 9780387947143. [Google Scholar]
- Neale, C.M.U. Classification and Mapping of Riparian Systems Using Airborne Multispectral Videography. Restor. Ecol. 2008, 5, 103–112. [Google Scholar] [CrossRef]
- Kustas, W.P.; Norman, J.M. Evaluation of Soil and Vegetation Heat Flux Predictions Using a Simple Two-Source Model with Radiometric Temperatures for Partial Canopy Cover. Agric. For. Meteorol. 1999, 94, 13–29. [Google Scholar] [CrossRef]
- Kustas, W.P.; Norman, J.M. Reply to Comments about the Basic Equations of Dual-Source Vegetation–atmosphere Transfer Models. Agric. For. Meteorol. 1999, 94, 275–278. [Google Scholar] [CrossRef]
- Nieto, H.; Kustas, W.P.; Alfieri, J.G.; Gao, F.; Hipps, L.E.; Los, S.; Prueger, J.H.; McKee, L.G.; Anderson, M.C. Impact of Different within-Canopy Wind Attenuation Formulations on Modelling Sensible Heat Flux Using TSEB. Irrig. Sci. 2019, 37, 315–331. [Google Scholar] [CrossRef]
- Campbell, G.S.; Norman, J.M. An Introduction to Environmental Biophysics; Springer Science and Business Media: New York, NY, USA, 1998. [Google Scholar]
- White, M.A.; Asner, G.P.; Nemani, R.R.; Privette, J.L.; Running, S.W. Measuring Fractional Cover and Leaf Area Index in Arid Ecosystems. Remote Sens. Environ. 2000, 74, 45–57. [Google Scholar] [CrossRef]
- Nassar, A.; Torres-Rua, A.; Kustas, W.; Alfieri, J.; Hipps, L.; Prueger, J.; Nieto, H.; Alsina, M.M.; White, W.; McKee, L.; et al. Assessing Daily Evapotranspiration Methodologies from One-Time-of-Day sUAS and EC Information in the GRAPEX Project. Remote Sens. 2021, 13, 2887. [Google Scholar] [CrossRef] [PubMed]
- Cammalleri, C.; Anderson, M.C.; Kustas, W.P. Upscaling of Evapotranspiration Fluxes from Instantaneous to Daytime Scales for Thermal Remote Sensing Applications. Hydrol. Earth Syst. Sci. 2014, 18, 1885–1894. [Google Scholar] [CrossRef] [Green Version]
- Garrigues, S.; Allard, D.; Baret, F.; Weiss, M. Quantifying Spatial Heterogeneity at the Landscape Scale Using Variogram Models. Remote Sens. Environ. 2006, 103, 81–96. [Google Scholar] [CrossRef]
- Wu, L.; Qin, Q.; Liu, X.; Ren, H.; Wang, J.; Zheng, X.; Ye, X.; Sun, Y. Spatial Up-Scaling Correction for Leaf Area Index Based on the Fractal Theory. Remote Sens. 2016, 8, 197. [Google Scholar] [CrossRef] [Green Version]
- Cleverly, J.R.; Dahm, C.N.; Thibault, J.R.; Gilroy, D.J.; Allred Coonrod, J.E. Seasonal Estimates of Actual Evapo-Transpiration from Tamarix Ramosissima Stands Using Three-Dimensional Eddy Covariance. J. Arid Environ. 2002, 52, 181–197. [Google Scholar] [CrossRef] [Green Version]
Publisher’s Note: MDPI stays neutral with regard to jurisdictional claims in published maps and institutional affiliations. |
© 2022 by the authors. Licensee MDPI, Basel, Switzerland. This article is an open access article distributed under the terms and conditions of the Creative Commons Attribution (CC BY) license (https://creativecommons.org/licenses/by/4.0/).