
Integration of Surface Reflectance and Aerosol Retrieval Algorithms for Multi-Resolution Aerosol Optical Depth Retrievals over Urban Areas

 ,
,  ,
,  ,
,  ,
,  , ,
, ,  , , and
Abstract
:1. Introduction
2. Dataset
2.1. Satellite Data
2.2. AERONET Data
3. Research Methods
3.1. Description of the SEMARA Approach
- = the top-of-atmosphere (TOA) reflectance, which is a function of measured spectral radiance (LTOA), solar zenith angle, earth-sun distance (d) in the astronomical unit, and mean solar exoatmospheric radiation (ESUN).
- = Rayleigh reflectance in the absence of aerosols.
- = wavelength.
- = atmospheric transmittance on the sun-surface path (downward).
- = same as but in an aerosol-free atmosphere.
- = atmospheric transmittance on the surface-sensor path (upward).
- = same as but in an aerosol-free atmosphere.
- = SREM estimated surface reflectance.
- = atmospheric backscattering ratio to account for multiple reflections between the surface and atmosphere.
- = same as but in an aerosol-free atmosphere.
- = cosine of the solar zenith angle.
- = cosine of the sensor zenith angle.
- = aerosol phase function.
- = single scattering albedo.
- = SARA AOD.
- = wavelength in µm
- = Rayleigh optical depth
- = solar zenith angle
- = sensor zenith angle
- = relative azimuth angle
3.2. Methods Used for Statistical Analysis
- = mean of X (AERONET) variable, and
- = mean of Y (SEMARA) variable.
4. Results and Discussion
4.1. Validation of SEMARA AOD Retrievals
4.2. SEMARA Performance for Different Aerosol Loadings
4.3. SEMARA Performance over Different Land Cover Types
5. Conclusions
Author Contributions
Funding
Institutional Review Board Statement
Informed Consent Statement
Data Availability Statement
Acknowledgments
Conflicts of Interest
References
- De Leeuw, G.; Holzer-Popp, T.; Bevan, S.; Davies, W.H.; Descloitres, J.; Grainger, R.G.; Griesfeller, J.; Heckel, A.; Kinne, S.; Klüser, L.; et al. Evaluation of seven European aerosol optical depth retrieval algorithms for climate analysis. Remote Sens. Environ. 2015, 162, 295–315. [Google Scholar] [CrossRef] [Green Version]
- Kokhanovsky, A.A.; de Leeuw, G. Satellite Aerosol Remote Sensing over Land; Springer: Berlin/Heidelberg, Germany, 2009. [Google Scholar] [CrossRef]
- Kaufman, Y.J.; Tanré, D.; Boucher, O. A satellite view of aerosols in the climate system. Nature 2002, 419, 215–223. [Google Scholar] [CrossRef] [PubMed]
- Cheung, H.-C.; Wang, T.; Baumann, K.; Guo, H. Influence of regional pollution outflow on the concentrations of fine particulate matter and visibility in the coastal area of southern China. Atmos. Environ. 2005, 39, 6463–6474. [Google Scholar] [CrossRef]
- Pope, C.A.; Ezzati, M.; Dockery, D.W. Fine-particulate air pollution and life expectancy in the United States. N. Engl. J. Med. 2009, 360, 376–386. [Google Scholar] [CrossRef] [PubMed] [Green Version]
- Holben, B.N.; Eck, T.F.; Slutsker, I.; Tanré, D.; Buis, J.P.; Setzer, A.; Vermote, E.; Reagan, J.A.; Kaufman, Y.J.; Nakajima, T.; et al. AERONET—A Federated Instrument Network and Data Archive for Aerosol Characterization. Remote Sens. Environ. 1998, 66, 1–16. [Google Scholar] [CrossRef]
- Levy, R.C.; Munchak, L.A.; Mattoo, S.; Patadia, F.; Remer, L.A.; Holz, R.E. Towards a long-term global aerosol optical depth record: Applying a consistent aerosol retrieval algorithm to MODIS and VIIRS-observed reflectance. Atmos. Meas. Tech. 2015, 8, 4083–4110. [Google Scholar] [CrossRef] [Green Version]
- Remer, L.A.; Mattoo, S.; Levy, R.C.; Munchak, L.A. MODIS 3 km aerosol product: Algorithm and global perspective. Atmos. Meas. Tech. 2013, 6, 1829–1844. [Google Scholar] [CrossRef] [Green Version]
- Levy, R.C.; Mattoo, S.; Munchak, L.A.; Remer, L.A.; Sayer, A.M.; Patadia, F.; Hsu, N.C. The Collection 6 MODIS aerosol products over land and ocean. Atmos. Meas. Tech. 2013, 6, 2989–3034. [Google Scholar] [CrossRef] [Green Version]
- Bilal, M.; Mhawish, A.; Nichol, J.E.; Qiu, Z.; Nazeer, M.; Ali, M.A.; de Leeuw, G.; Levy, R.C.; Wang, Y.; Chen, Y.; et al. Air pollution scenario over Pakistan: Characterization and ranking of extremely polluted cities using long-term concentrations of aerosols and trace gases. Remote Sens. Environ. 2021, 264, 112617. [Google Scholar] [CrossRef]
- Bilal, M.; Nazeer, M.; Nichol, J.E. Validation of MODIS and VIIRS derived aerosol optical depth over complex coastal waters. Atmos. Res. 2017, 186, 43–50. [Google Scholar] [CrossRef]
- Nichol, J.; Bilal, M. Validation of MODIS 3 km Resolution Aerosol Optical Depth Retrievals Over Asia. Remote Sens. 2016, 8, 328. [Google Scholar] [CrossRef] [Green Version]
- Sayer, A.M.; Munchak, L.A.; Hsu, N.C.; Levy, R.C.; Bettenhausen, C.; Jeong, M.J. MODIS Collection 6 aerosol products: Comparison between Aqua’s e-Deep Blue, Dark Target, and “merged” data sets, and usage recommendations. J. Geophys. Res. Atmos. 2014, 119, 13965–13989. [Google Scholar] [CrossRef]
- Hsu, N.C.; Jeong, M.-J.; Bettenhausen, C.; Sayer, A.M.; Hansell, R.; Seftor, C.S.; Huang, J.; Tsay, S.-C. Enhanced Deep Blue aerosol retrieval algorithm: The second generation. J. Geophys. Res. Atmos. 2013, 118, 9296–9315. [Google Scholar] [CrossRef]
- Jackson, J.M.; Liu, H.; Laszlo, I.; Kondragunta, S.; Remer, L.A.; Huang, J.; Huang, H.-C. Suomi-NPP VIIRS aerosol algorithms and data products. J. Geophys. Res. Atmos. 2013, 118, 12673–12689. [Google Scholar] [CrossRef]
- Witek, M.L.; Garay, M.J.; Diner, D.J.; Bull, M.A.; Seidel, F.C.; Nastan, A.M.; Hansen, E.G. Introducing the MISR level 2 near real-time aerosol product. Atmos. Meas. Tech. 2021, 14, 5577–5591. [Google Scholar] [CrossRef]
- Mhawish, A.; Sorek-Hamer, M.; Chatfield, R.; Banerjee, T.; Bilal, M.; Kumar, M.; Sarangi, C.; Franklin, M.; Chau, K.; Garay, M.; et al. Aerosol characteristics from earth observation systems: A comprehensive investigation over South Asia (2000–2019). Remote Sens. Environ. 2021, 259, 112410. [Google Scholar] [CrossRef]
- Mhawish, A.; Banerjee, T.; Sorek-Hamer, M.; Lyapustin, A.; Broday, D.M.; Chatfield, R. Comparison and evaluation of MODIS Multi-angle Implementation of Atmospheric Correction (MAIAC) aerosol product over South Asia. Remote Sens. Environ. 2019, 224, 12–28. [Google Scholar] [CrossRef]
- Bilal, M.; Nazeer, M.; Nichol, J.E.; Bleiweiss, M.P.; Qiu, Z.; Jäkel, E.; Campbell, J.R.; Atique, L.; Huang, X.; Lolli, S. A Simplified and Robust Surface Reflectance Estimation Method (SREM) for Use over Diverse Land Surfaces Using Multi-Sensor Data. Remote Sens. 2019, 11, 1344. [Google Scholar] [CrossRef] [Green Version]
- Nazeer, M.; Ilori, C.O.; Bilal, M.; Nichol, J.E.; Wu, W.; Qiu, Z.; Gayene, B.K. Evaluation of atmospheric correction methods for low to high resolutions satellite remote sensing data. Atmos. Res. 2021, 249, 105308. [Google Scholar] [CrossRef]
- Vermote, E.F.; Kotchenova, S. Atmospheric correction for the monitoring of land surfaces. J. Geophys. Res. Atmos. 2008, 113, D23S90. [Google Scholar] [CrossRef]
- Kotchenova, S.Y.; Vermote, E.F.; Levy, R.; Lyapustin, A. Radiative transfer codes for atmospheric correction and aerosol retrieval: Intercomparison study. Appl. Opt. 2008, 47, 2215. [Google Scholar] [CrossRef] [Green Version]
- Kotchenova, S.Y.; Vermote, E.F.; Matarrese, R.; Frank, J.; Klemm, J. Validation of a vector version of the 6S radiative transfer code for atmospheric correction of satellite data. Part I: Path radiance. Appl. Opt. 2006, 45, 6762–6774. [Google Scholar] [CrossRef] [PubMed] [Green Version]
- Bilal, M.; Nichol, J.E.; Bleiweiss, M.P.; Dubois, D. A Simplified high resolution MODIS Aerosol Retrieval Algorithm (SARA) for use over mixed surfaces. Remote Sens. Environ. 2013, 136, 135–145. [Google Scholar] [CrossRef]
- Bilal, M.; Nichol, J.E.; Chan, P.W. Validation and accuracy assessment of a Simplified Aerosol Retrieval Algorithm (SARA) over Beijing under low and high aerosol loadings and dust storms. Remote Sens. Environ. 2014, 153, 50–60. [Google Scholar] [CrossRef]
- Bilal, M.; Nichol, J.E. Evaluation of MODIS aerosol retrieval algorithms over the Beijing-Tianjin-Hebei region during low to very high pollution events. J. Geophys. Res. Atmos. 2015, 120, 7941–7957. [Google Scholar] [CrossRef] [Green Version]
- Bilal, M.; Nichol, J.; Spak, S. A New Approach for Estimation of Fine Particulate Concentrations Using Satellite Aerosol Optical Depth and Binning of Meteorological Variables. Aerosol Air Qual. Res. 2017, 11, 356–367. [Google Scholar] [CrossRef] [Green Version]
- Sun, L.; Wei, J.; Bilal, M.; Tian, X.; Jia, C.; Guo, Y.; Mi, X. Aerosol optical depth retrieval over bright areas using Landsat 8 OLI images. Remote Sens. 2016, 8, 23. [Google Scholar] [CrossRef] [Green Version]
- Wong, M.S.; Nichol, J.E.; Lee, K.H. An operational MODIS aerosol retrieval algorithm at high spatial resolution, and its application over a complex urban region. Atmos. Res. 2011, 99, 579–589. [Google Scholar] [CrossRef]
- Li, C.; Lau, A.K.-H.; Chu, D.A. Retrieval, validation, and application of the 1-km aerosol optical depth from MODIS measurements over Hong Kong. IEEE Trans. Geosci. Remote Sens. 2005, 43, 2650–2658. [Google Scholar] [CrossRef]
- Bilal, M.; Qiu, Z. Aerosol Retrievals Over Bright Urban Surfaces Using Landsat 8 Images. In Proceedings of the IGARSS 2018–2018 IEEE International Geoscience and Remote Sensing Symposium, Valencia, Spain, 22–27 July 2018; pp. 7560–7563. [Google Scholar]
- Holben, N.; Tanr, D.; Smirnov, A.; Eck, T.F.; Slutsker, I.; Newcomb, W.W.; Schafer, J.S.; Chatenet, B.; Lavenu, F.; Kaufman, J.; et al. An emerging ground-based aerosol climatology: Aerosol optical depth from AERONET. J. Geophys. Res. Atmos. 2001, 106, 12067–12097. [Google Scholar] [CrossRef]
- Tanre, D.; Herman, M.; Deschamps, P.Y.; de Leffe, A. Atmospheric modeling for space measurements of ground reflectances, including bidirectional properties. Appl. Opt. 1979, 18, 3587–3594. [Google Scholar] [CrossRef] [PubMed]
- Liu, C.-H.; Liu, G.-R. Aerosol Optical Depth Retrieval For Spot HRV Images. J. Mar. Sci. Technol. 2009, 17, 300–305. [Google Scholar] [CrossRef]
- LISE. OLCI Level 2: Rayleigh Correction Over Land (S3-L2-SD-03-C15-LISE-ATBD). Available online: https://sentinels.copernicus.eu/documents/247904/349589/OLCI_L2_Rayleigh_Correction_Land.pdf (accessed on 17 October 2018).
- Hansen, J.E.; Travis, L.D. Light scattering in planetary atmospheres. Space Sci. Rev. 1974, 16, 527–610. [Google Scholar] [CrossRef]
- Harper, W.V. Reduced Major Axis Regression. In Wiley StatsRef: Statistics Reference Online; Wiley Online Library: Hoboken, NJ, USA, 2016. [Google Scholar] [CrossRef]
- Remer, L.a.; Kaufman, Y.J.; Tanré, D.; Mattoo, S.; Chu, D.a.; Martins, J.V.; Li, R.-R.; Ichoku, C.; Levy, R.C.; Kleidman, R.G.; et al. The MODIS Aerosol Algorithm, Products, and Validation. J. Atmos. Sci. 2005, 62, 947–973. [Google Scholar] [CrossRef] [Green Version]
- Sayer, A.M.; Govaerts, Y.; Kolmonen, P.; Lipponen, A.; Luffarelli, M.; Mielonen, T.; Patadia, F.; Popp, T.; Povey, A.C.; Stebel, K.; et al. A review and framework for the evaluation of pixel-level uncertainty estimates in satellite aerosol remote sensing. Atmos. Meas. Tech. 2020, 13, 373–404. [Google Scholar] [CrossRef] [Green Version]
- Gupta, P.; Levy, R.C.; Mattoo, S.; Remer, L.A.; Munchak, L.A. A surface reflectance scheme for retrieving aerosol optical depth over urbansurfaces in MODIS Dark Target retrieval algorithm. Atmos. Meas. Tech. 2016, 9, 3293–3308. [Google Scholar] [CrossRef] [Green Version]
- Munchak, L.A.; Levy, R.C.; Mattoo, S.; Remer, L.A.; Holben, B.N.; Schafer, J.S.; Hostetler, C.A.; Ferrare, R.A. MODIS 3 km aerosol product: Applications over land in an urban/suburban region. Atmos. Meas. Tech. 2013, 6, 1747–1759. [Google Scholar] [CrossRef] [Green Version]
- Bilal, M.; Qiu, Z.; Campbell, J.R.; Spak, S.; Shen, X.; Nazeer, M. A New MODIS C6 Dark Target and Deep Blue Merged Aerosol Product on a 3 km Spatial Grid. Remote Sens. 2018, 10, 463. [Google Scholar] [CrossRef] [Green Version]
- Bilal, M.; Nazeer, M.; Nichol, J.E.; Qiu, Z.; Wang, L.; Bleiweiss, M.P.; Shen, X.; Campbell, J.R.; Lolli, S. Evaluation of Terra-MODIS C6 and C6.1 Aerosol Products against Beijing, XiangHe, and Xinglong AERONET Sites in China during 2004–2014. Remote Sens. 2019, 11, 486. [Google Scholar] [CrossRef] [Green Version]
- Bilal, M.; Qiu, Z.; Nichol, J.E.; Mhawish, A.; Ali, M.A.; Khedher, K.M.; de Leeuw, G.; Yu, W.; Tiwari, P.; Nazeer, M.; et al. Uncertainty in Aqua-MODIS Aerosol Retrieval Algorithms During COVID-19 Lockdown. IEEE Geosci. Remote Sens. Lett. 2021, 1–5. [Google Scholar] [CrossRef]
- Mhawish, A.; Banerjee, T.; Broday, D.M.; Misra, A.; Tripathi, S.N. Evaluation of MODIS Collection 6 aerosol retrieval algorithms over Indo-Gangetic Plain: Implications of aerosols types and mass loading. Remote Sens. Environ. 2017, 201, 297–313. [Google Scholar] [CrossRef]
- Bilal, M.; Nazeer, M.; Qiu, Z.; Ding, X.; Wei, J. Global Validation of MODIS C6 and C6.1 Merged Aerosol Products over Diverse Vegetated Surfaces. Remote Sens. 2018, 10, 475. [Google Scholar] [CrossRef] [Green Version]
- Bilal, M.; Nichol, J.; Wang, L. New customized methods for improvement of the MODIS C6 Dark Target and Deep Blue merged aerosol product. Remote Sens. Environ. 2017, 197, 115–124. [Google Scholar] [CrossRef]


| AERONET Site | Longitude | Latitude | Altitude (m) | Time Period | |
|---|---|---|---|---|---|
| Level 2.0 | Level 1.5 | ||||
| Beijing | 116.381° | 39.977° | 92 | 2013–2017 | 2018–2021 |
| Beijing_CAMS | 116.317° | 39.933° | 106 | 2013–2017 | 2018–2021 |
| Beijing_RADI | 116.379° | 40.005° | 59 | - | 2013–2021 |
| AOD Level | N | aEE% | bEE% | wEE% | RMSE | RMB% |
|---|---|---|---|---|---|---|
| AOD ≤ 0.2 | 325 | 9.85 | 2.15 | 88.00 | 0.05 | 2.50 |
| 0.2 < AOD ≤ 0.4 | 110 | 10.91 | 0.91 | 88.18 | 0.07 | 4.96 |
| AOD > 0.4 | 183 | 4.37 | 1.64 | 93.99 | 0.13 | 0.32 |
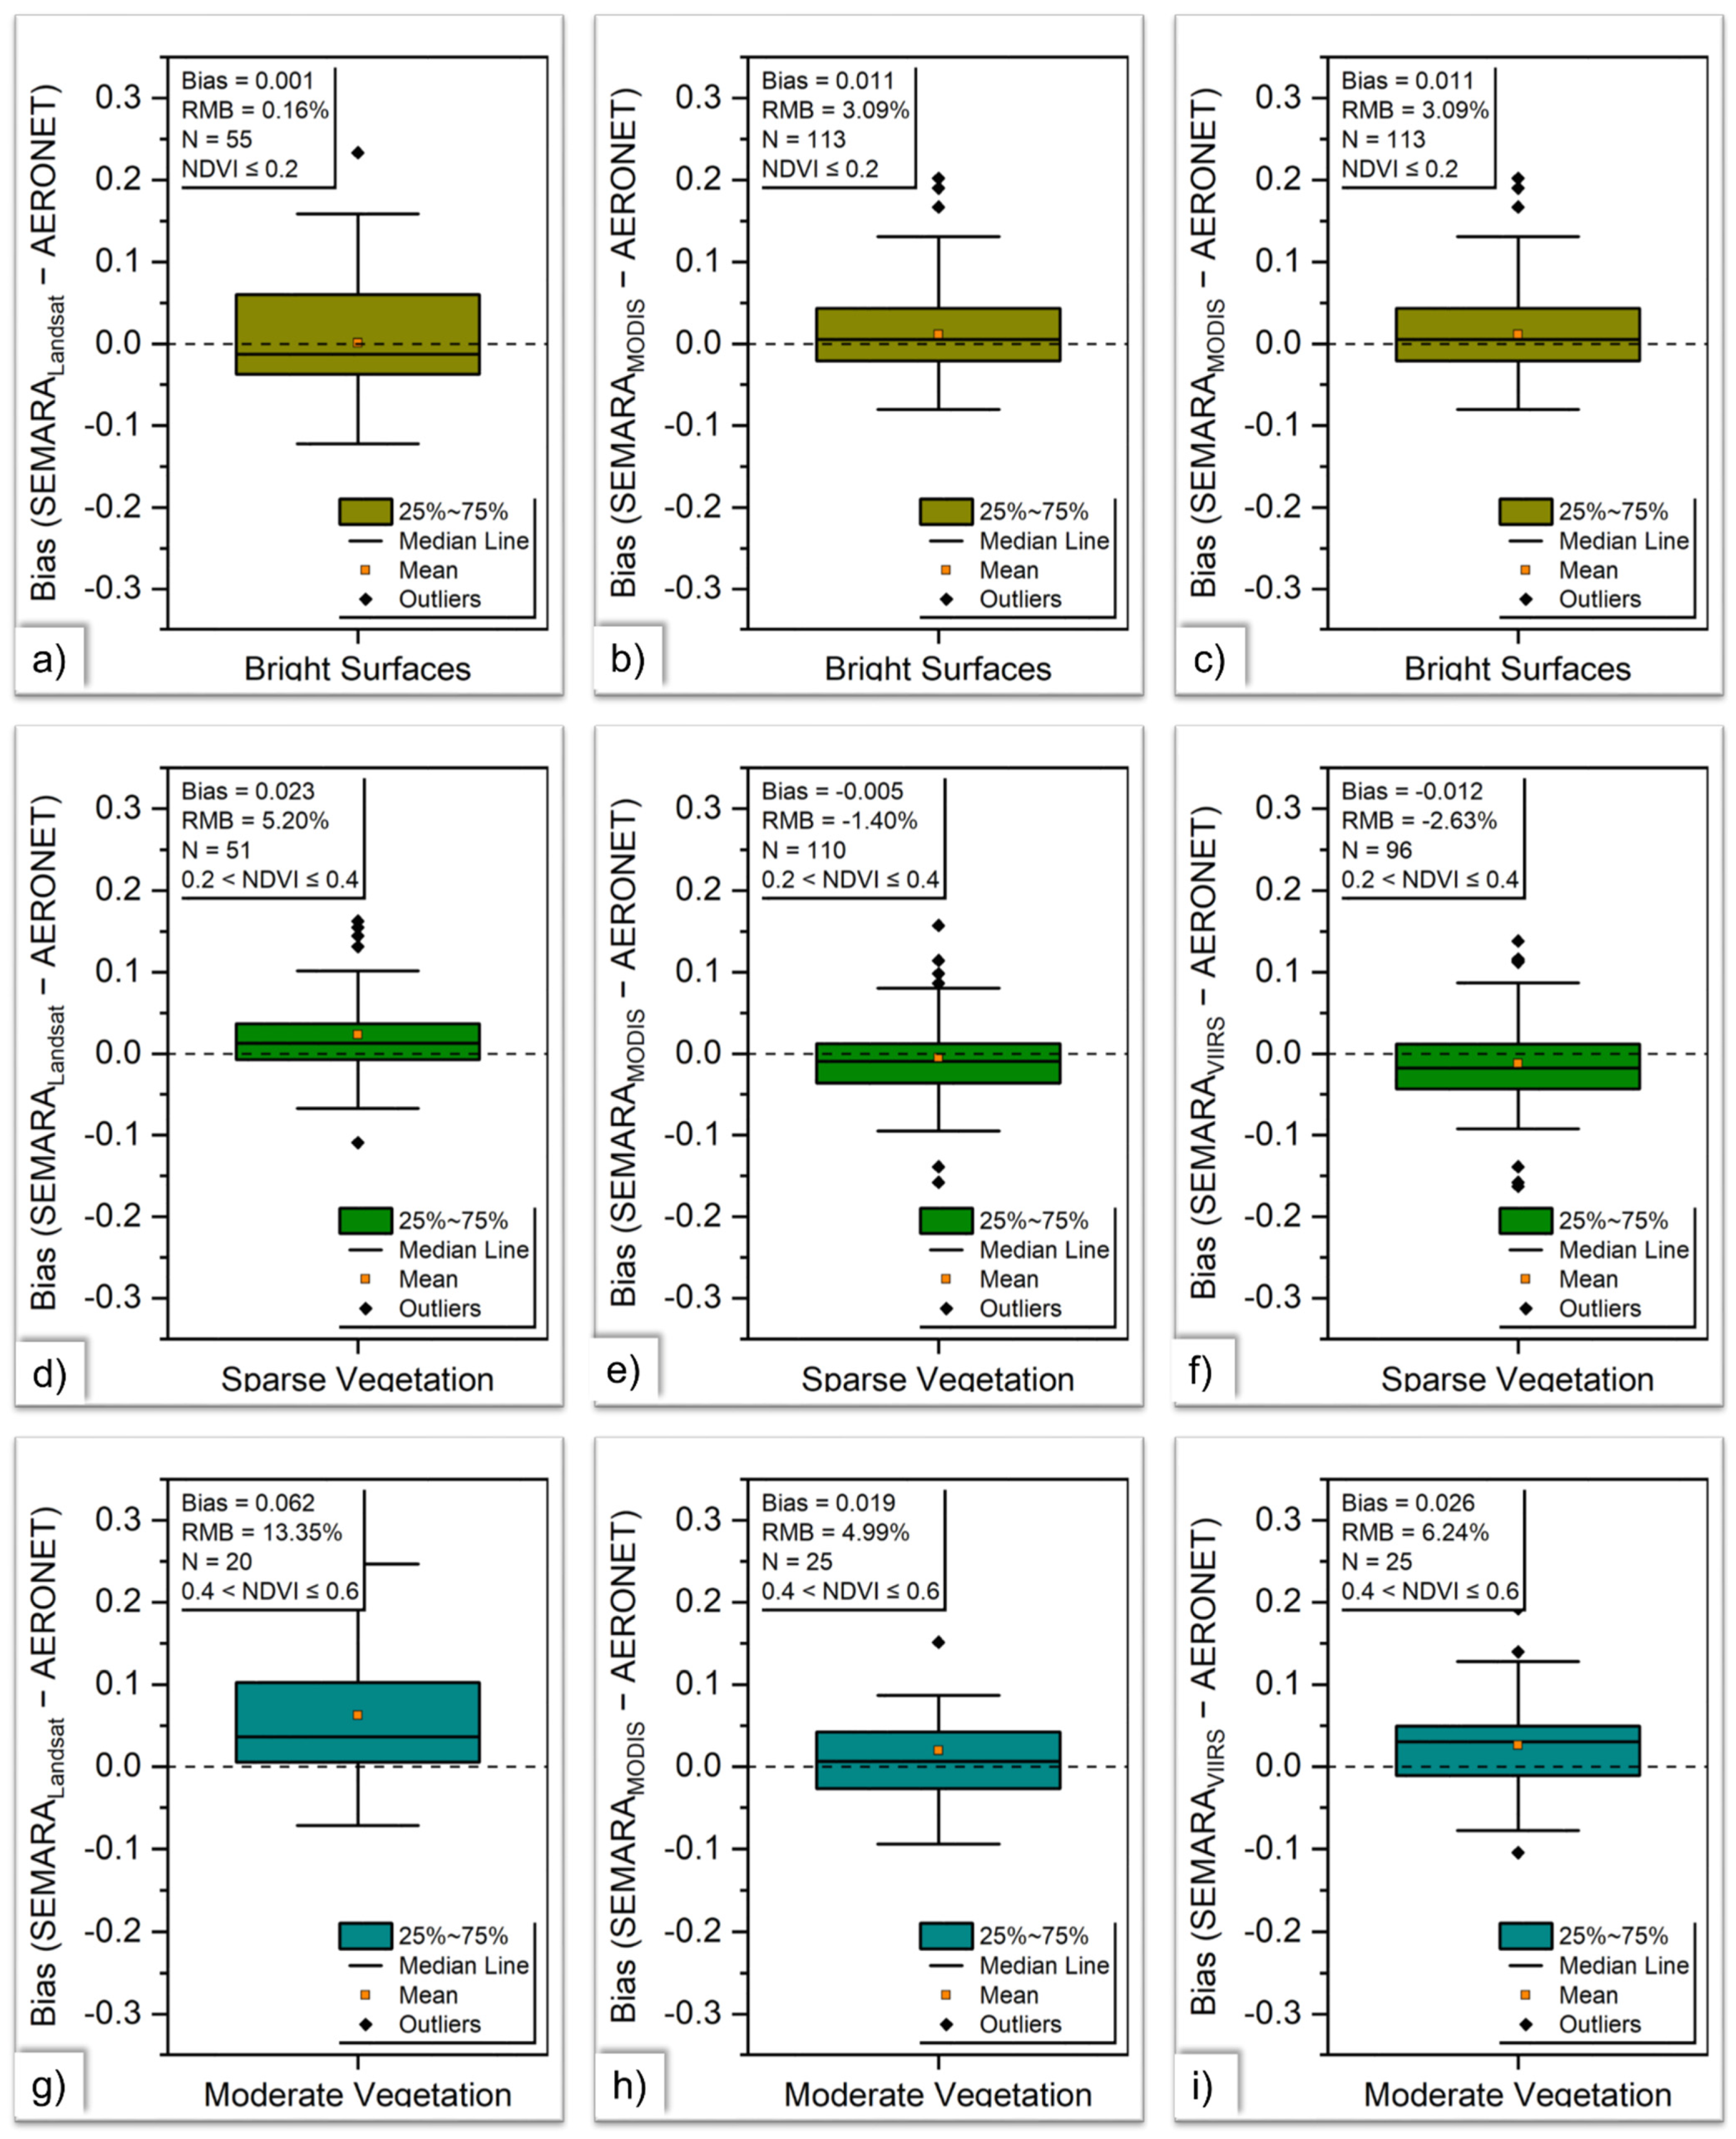
| Land Cover Type | NDVI | Sensor | N | aEE% | bEE% | wEE% | RMSE | RMB% |
|---|---|---|---|---|---|---|---|---|
| Bright Surfaces | NDVI ≤ 0.2 | Landsat 8 | 55 | 16.36 | - | 83.64 | 0.087 | 0.16 |
| MODIS | 113 | 10.62 | 0.88 | 88.50 | 0.116 | 3.09 | ||
| VIIRS | 121 | 8.26 | 2.48 | 89.26 | 0.097 | −0.04 | ||
| All | 289 | 10.73 | 1.38 | 87.89 | 0.100 | 1.27 | ||
| Sparse Vegetation | 0.2 < NDVI ≤ 0.4 | Landsat 8 | 51 | 7.84 | - | 92.16 | 0.058 | 5.20 |
| MODIS | 110 | 3.64 | 2.72 | 93.64 | 0.059 | −1.40 | ||
| VIIRS | 96 | 5.20 | 4.17 | 90.63 | 0.067 | −2.63 | ||
| All | 257 | 5.06 | 2.72 | 92.22 | 0.060 | −0.54 | ||
| Moderate Vegetation | 0.4 < NDVI ≤ 0.6 | Landsat 8 | 20 | 25.00 | - | 75.00 | 0.106 | 13.35 |
| MODIS | 25 | 4.00 | - | 96.00 | 0.070 | 4.99 | ||
| VIIRS | 27 | 7.41 | - | 92.59 | 0.067 | 6.24 | ||
| All | 72 | 11.11 | - | 88.89 | 0.08 | 7.44 |
Publisher’s Note: MDPI stays neutral with regard to jurisdictional claims in published maps and institutional affiliations. |
© 2022 by the authors. Licensee MDPI, Basel, Switzerland. This article is an open access article distributed under the terms and conditions of the Creative Commons Attribution (CC BY) license (https://creativecommons.org/licenses/by/4.0/).
Share and Cite
Bilal, M.; Mhawish, A.; Ali, M.A.; Nichol, J.E.; Leeuw, G.d.; Khedher, K.M.; Mazhar, U.; Qiu, Z.; Bleiweiss, M.P.; Nazeer, M. Integration of Surface Reflectance and Aerosol Retrieval Algorithms for Multi-Resolution Aerosol Optical Depth Retrievals over Urban Areas. Remote Sens. 2022, 14, 373. https://doi.org/10.3390/rs14020373
Bilal M, Mhawish A, Ali MA, Nichol JE, Leeuw Gd, Khedher KM, Mazhar U, Qiu Z, Bleiweiss MP, Nazeer M. Integration of Surface Reflectance and Aerosol Retrieval Algorithms for Multi-Resolution Aerosol Optical Depth Retrievals over Urban Areas. Remote Sensing. 2022; 14(2):373. https://doi.org/10.3390/rs14020373
Chicago/Turabian StyleBilal, Muhammad, Alaa Mhawish, Md. Arfan Ali, Janet E. Nichol, Gerrit de Leeuw, Khaled Mohamed Khedher, Usman Mazhar, Zhongfeng Qiu, Max P. Bleiweiss, and Majid Nazeer. 2022. "Integration of Surface Reflectance and Aerosol Retrieval Algorithms for Multi-Resolution Aerosol Optical Depth Retrievals over Urban Areas" Remote Sensing 14, no. 2: 373. https://doi.org/10.3390/rs14020373
APA StyleBilal, M., Mhawish, A., Ali, M. A., Nichol, J. E., Leeuw, G. d., Khedher, K. M., Mazhar, U., Qiu, Z., Bleiweiss, M. P., & Nazeer, M. (2022). Integration of Surface Reflectance and Aerosol Retrieval Algorithms for Multi-Resolution Aerosol Optical Depth Retrievals over Urban Areas. Remote Sensing, 14(2), 373. https://doi.org/10.3390/rs14020373