
Remote Sensing and Machine Learning Tools to Support Wetland Monitoring: A Meta-Analysis of Three Decades of Research

 ,
,  ,
, 
Abstract
1. Introduction
- Which ML method is best suited to monitor wetlands surface cover and adjacent areas and provide the best result from RS imagery? To what extent are the commonly applied ML approaches valid?
- How have the ML models varied over the last decades?
- What are the key factors in ML model selection for wetland studies? Are there any specific problems that are being solved preferentially by a specific algorithm?
- How important is optical imagery compared to SAR (synthetic aperture radar) data? What is the contribution of clear-sky observations from SAR imagery relative to optical imagery?
- Is multi-sensor (multi-source dataset) integration more accurate for wetland area delineation than a single sensor?
- What are the individual and combined contributions of SAR and optical data to wetland monitoring?
- What are the common satellite sensor types utilized for wetland studies?
- What are the common RS image features utilized for wetland studies?
- What are recommended steps for future wetland studies and management?
2. Methods
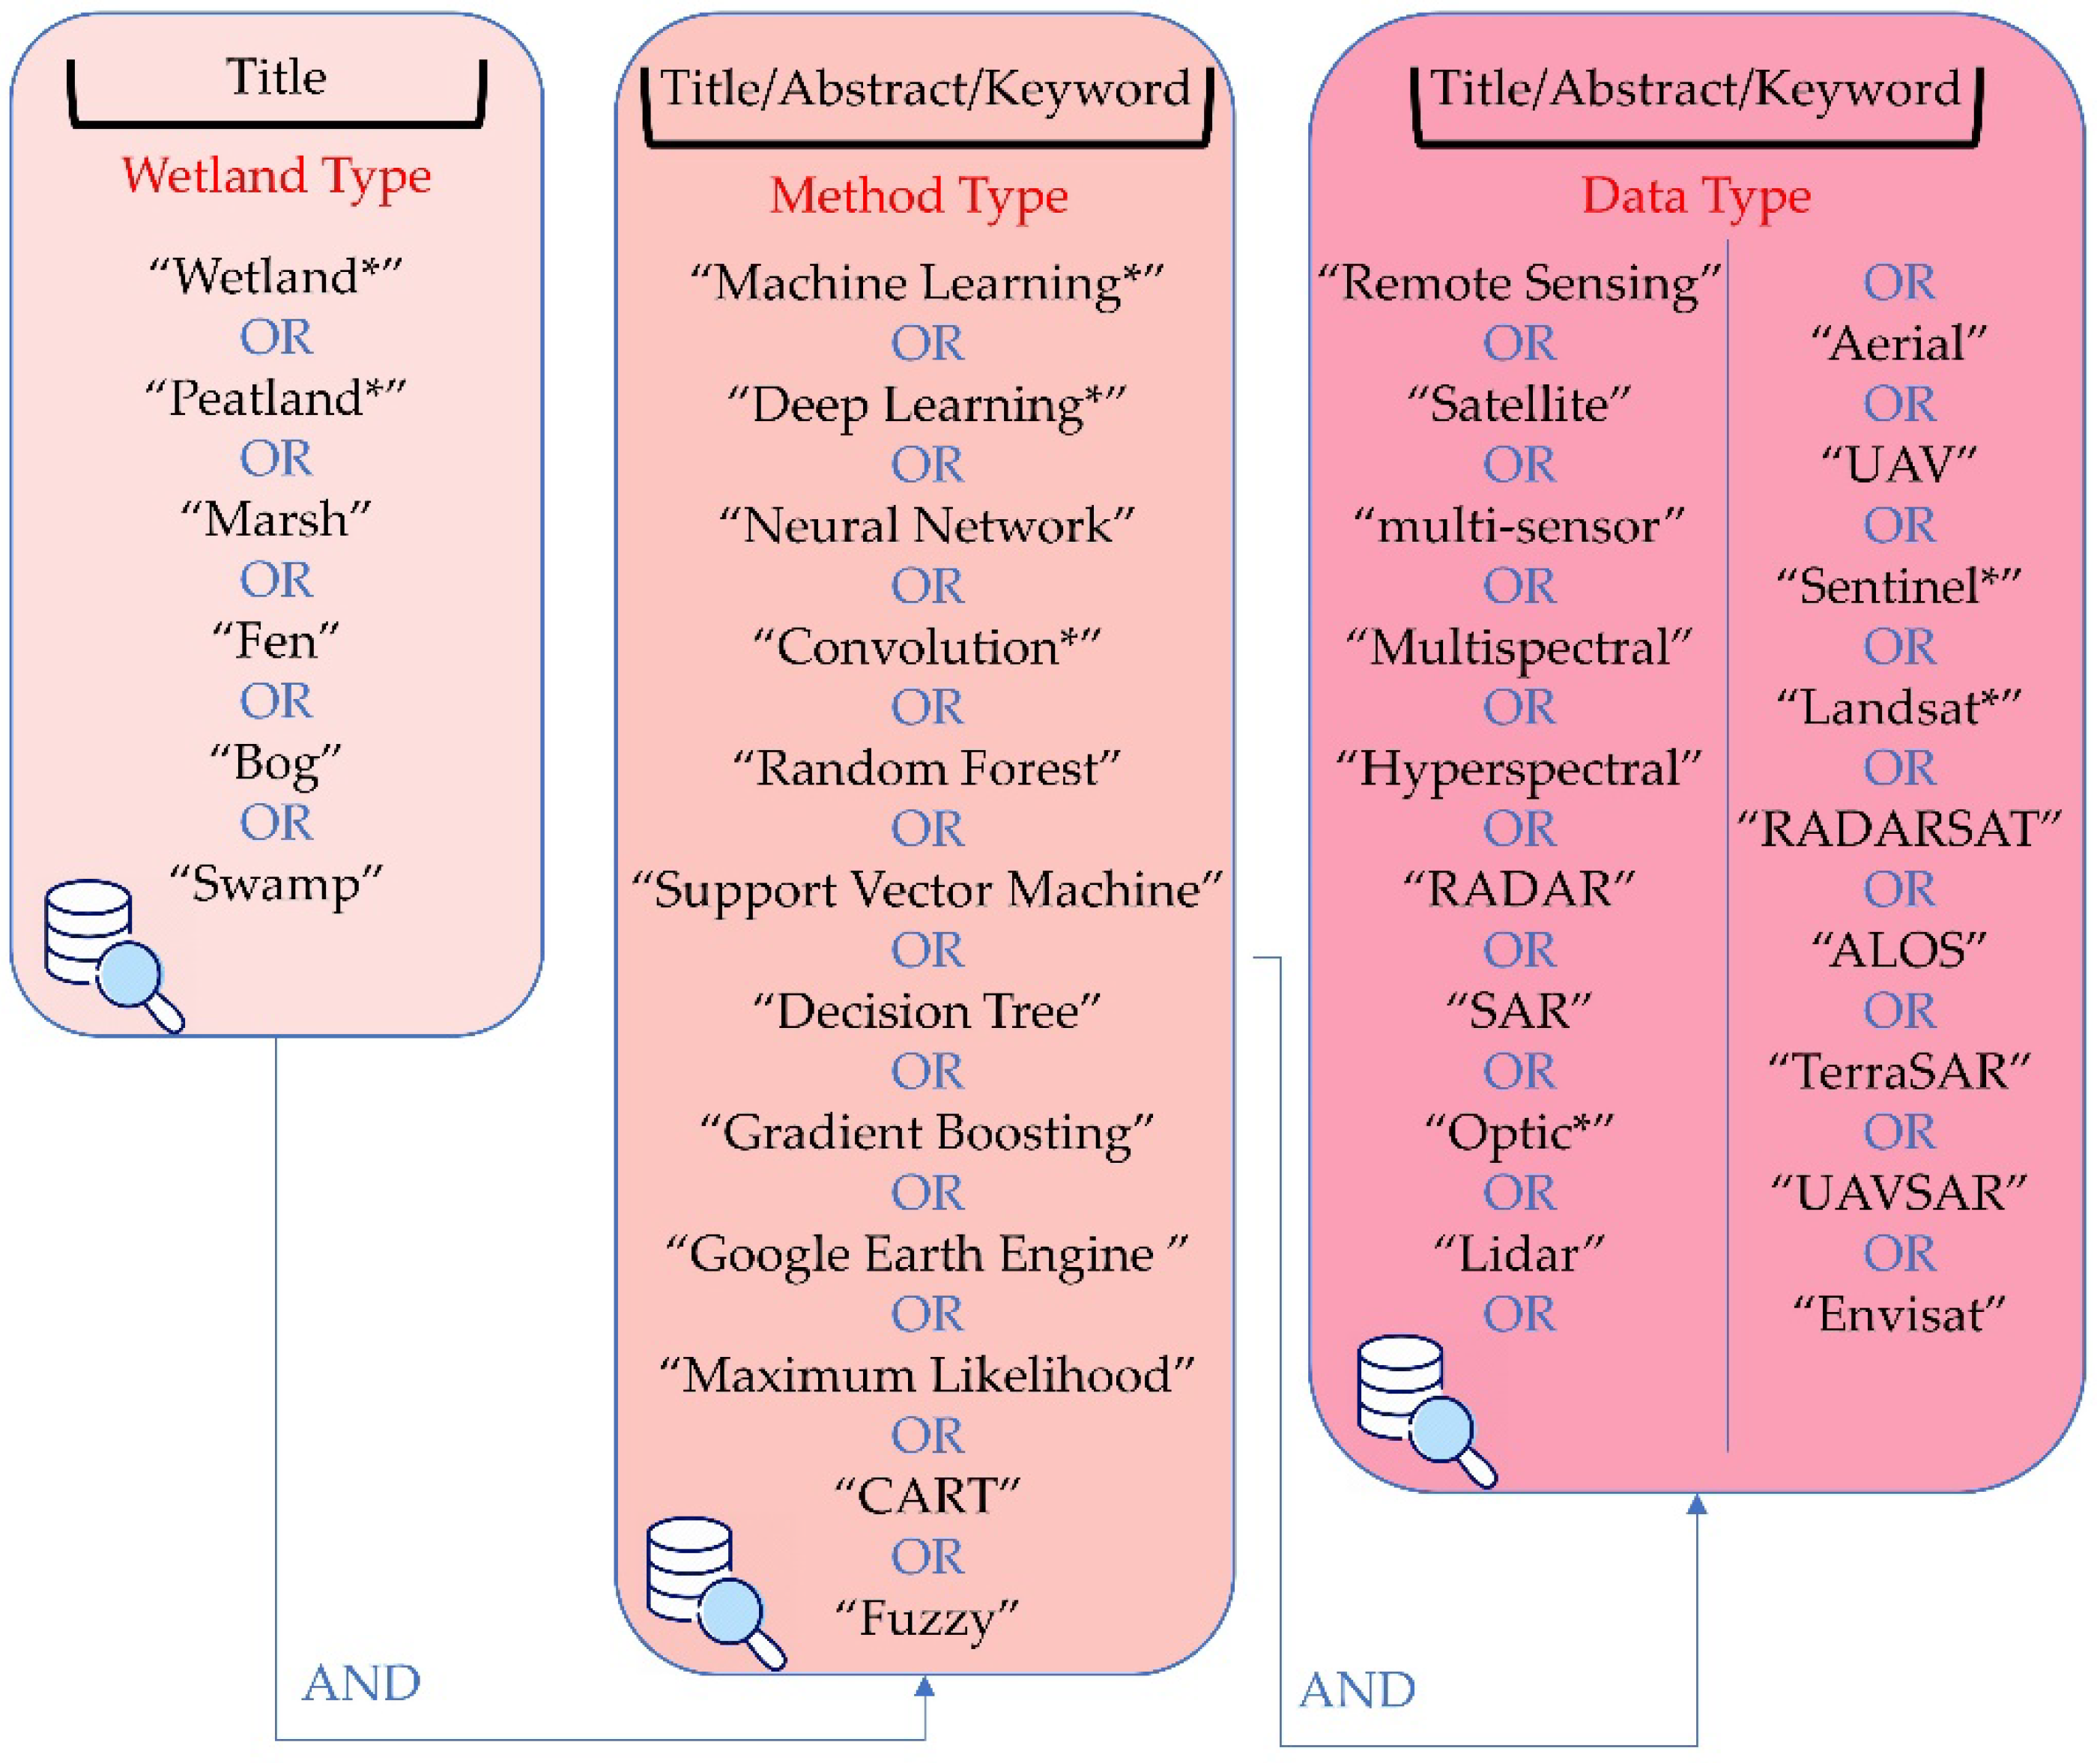
2.1. Bibliographic Base and Search Query Definition
2.2. Extracted Attributes from the Screened Records
3. Results and Discussion
3.1. General Characteristics of Wetland Publications
3.1.1. Scientific Productions Trend
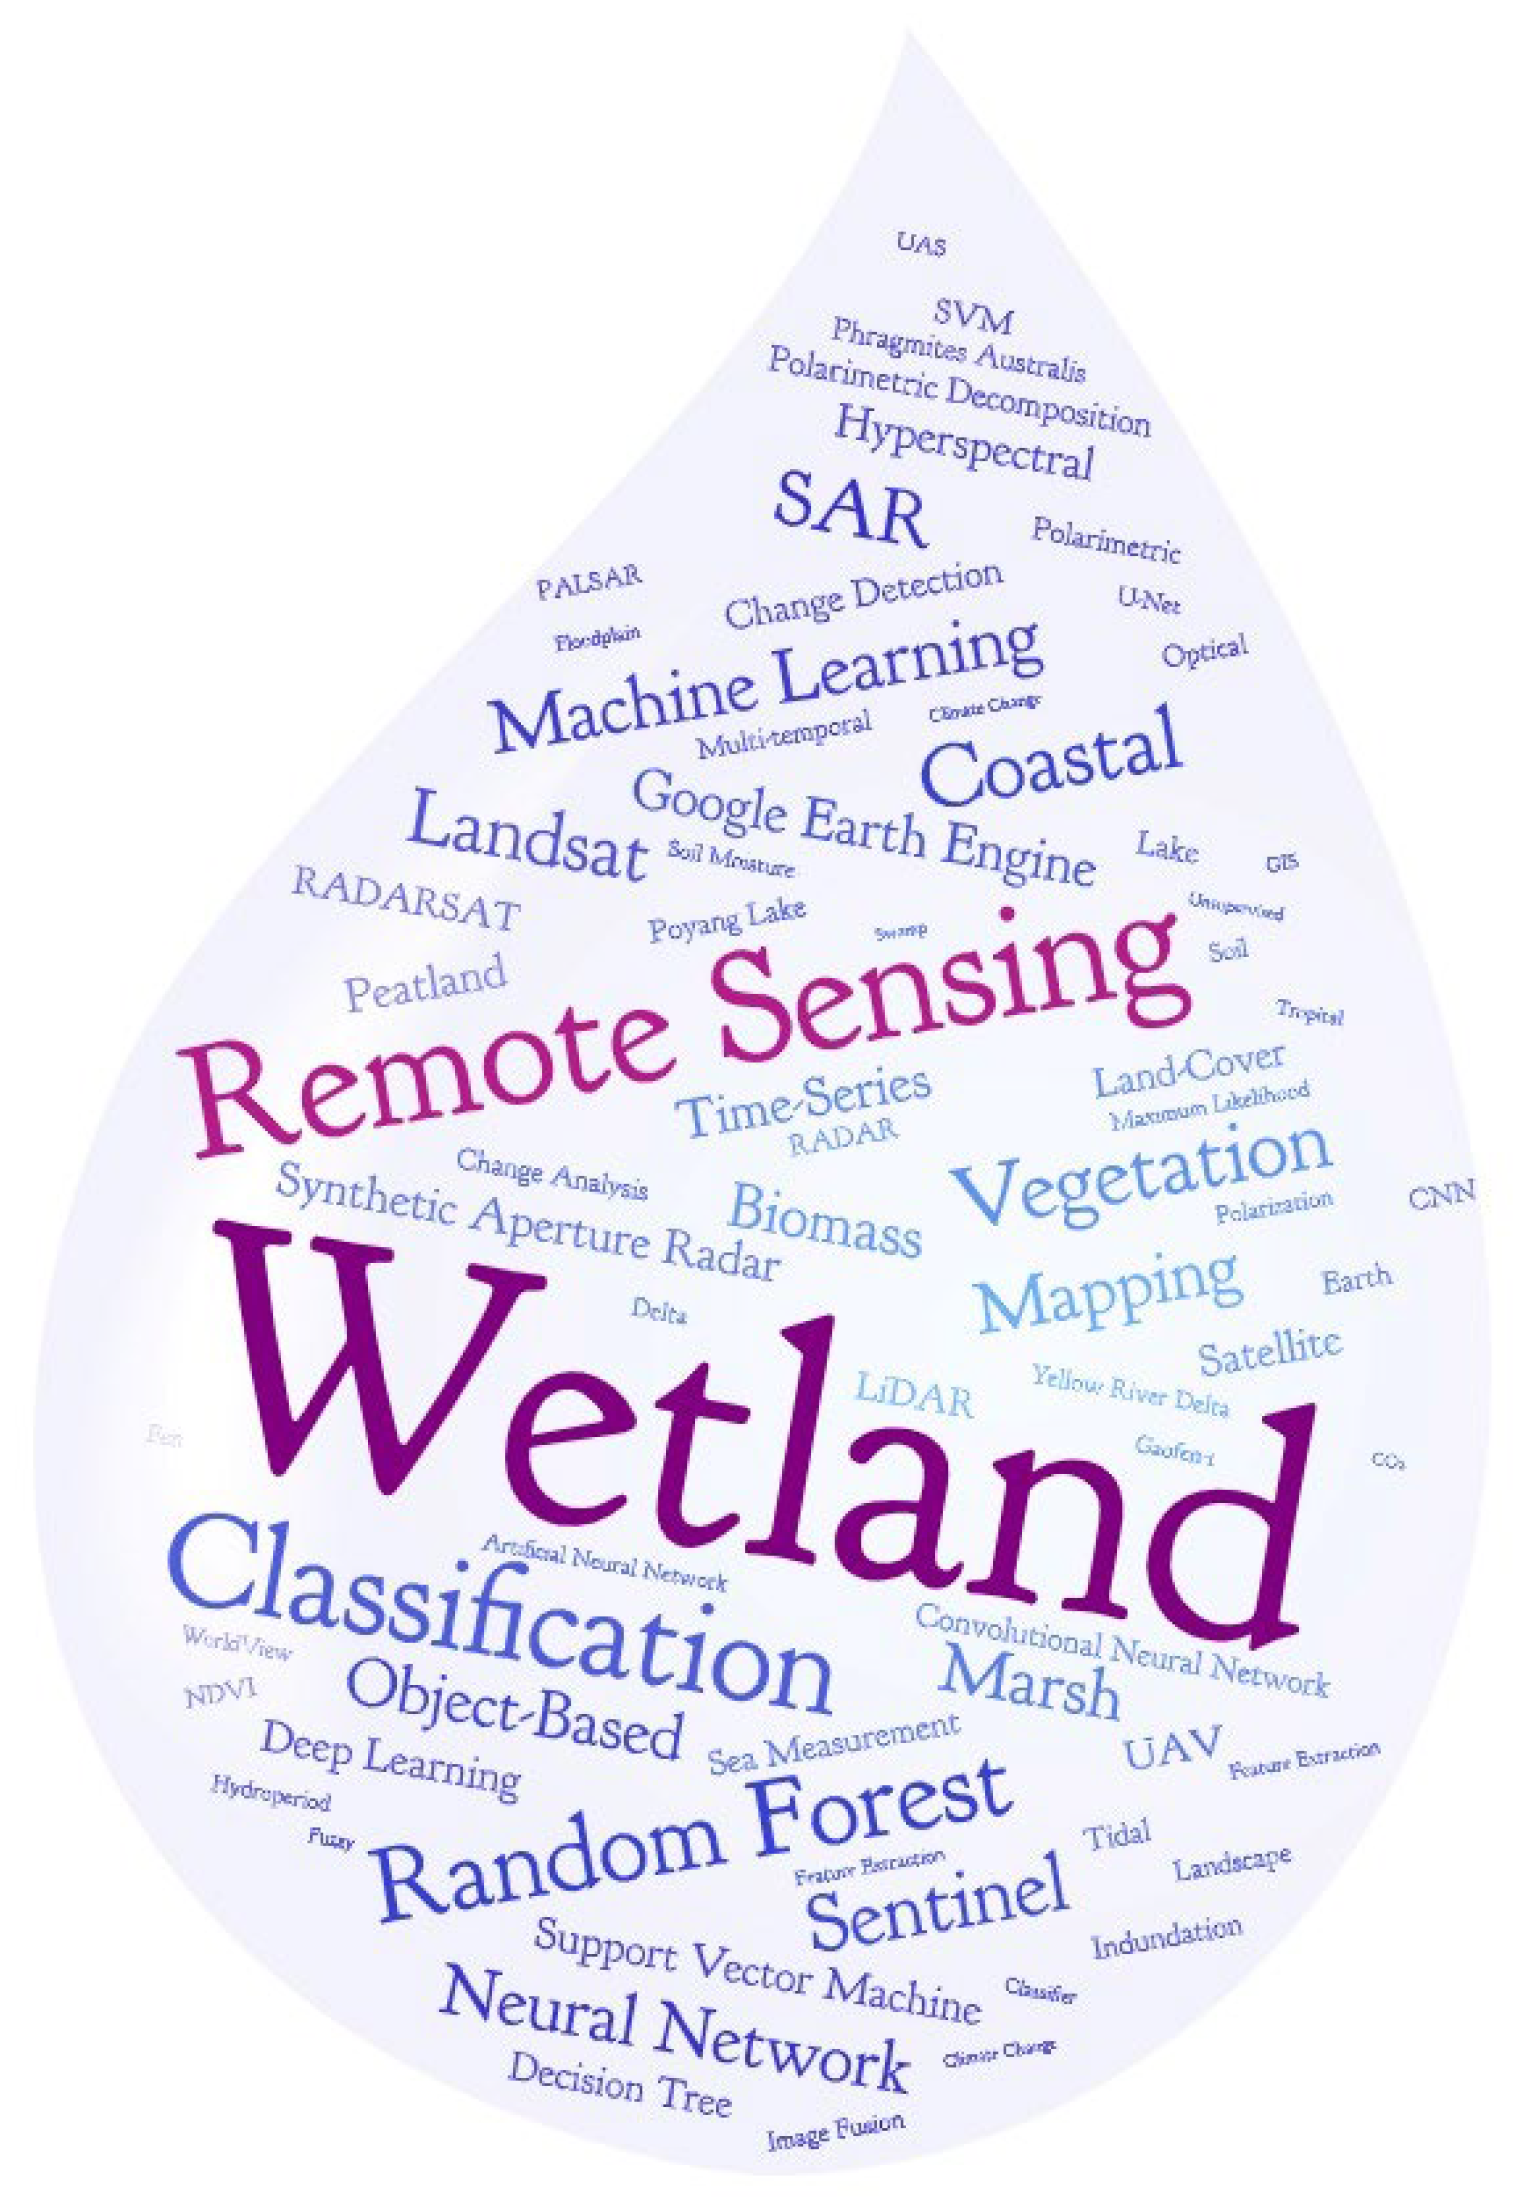
3.1.2. Keyword Frequency Analysis
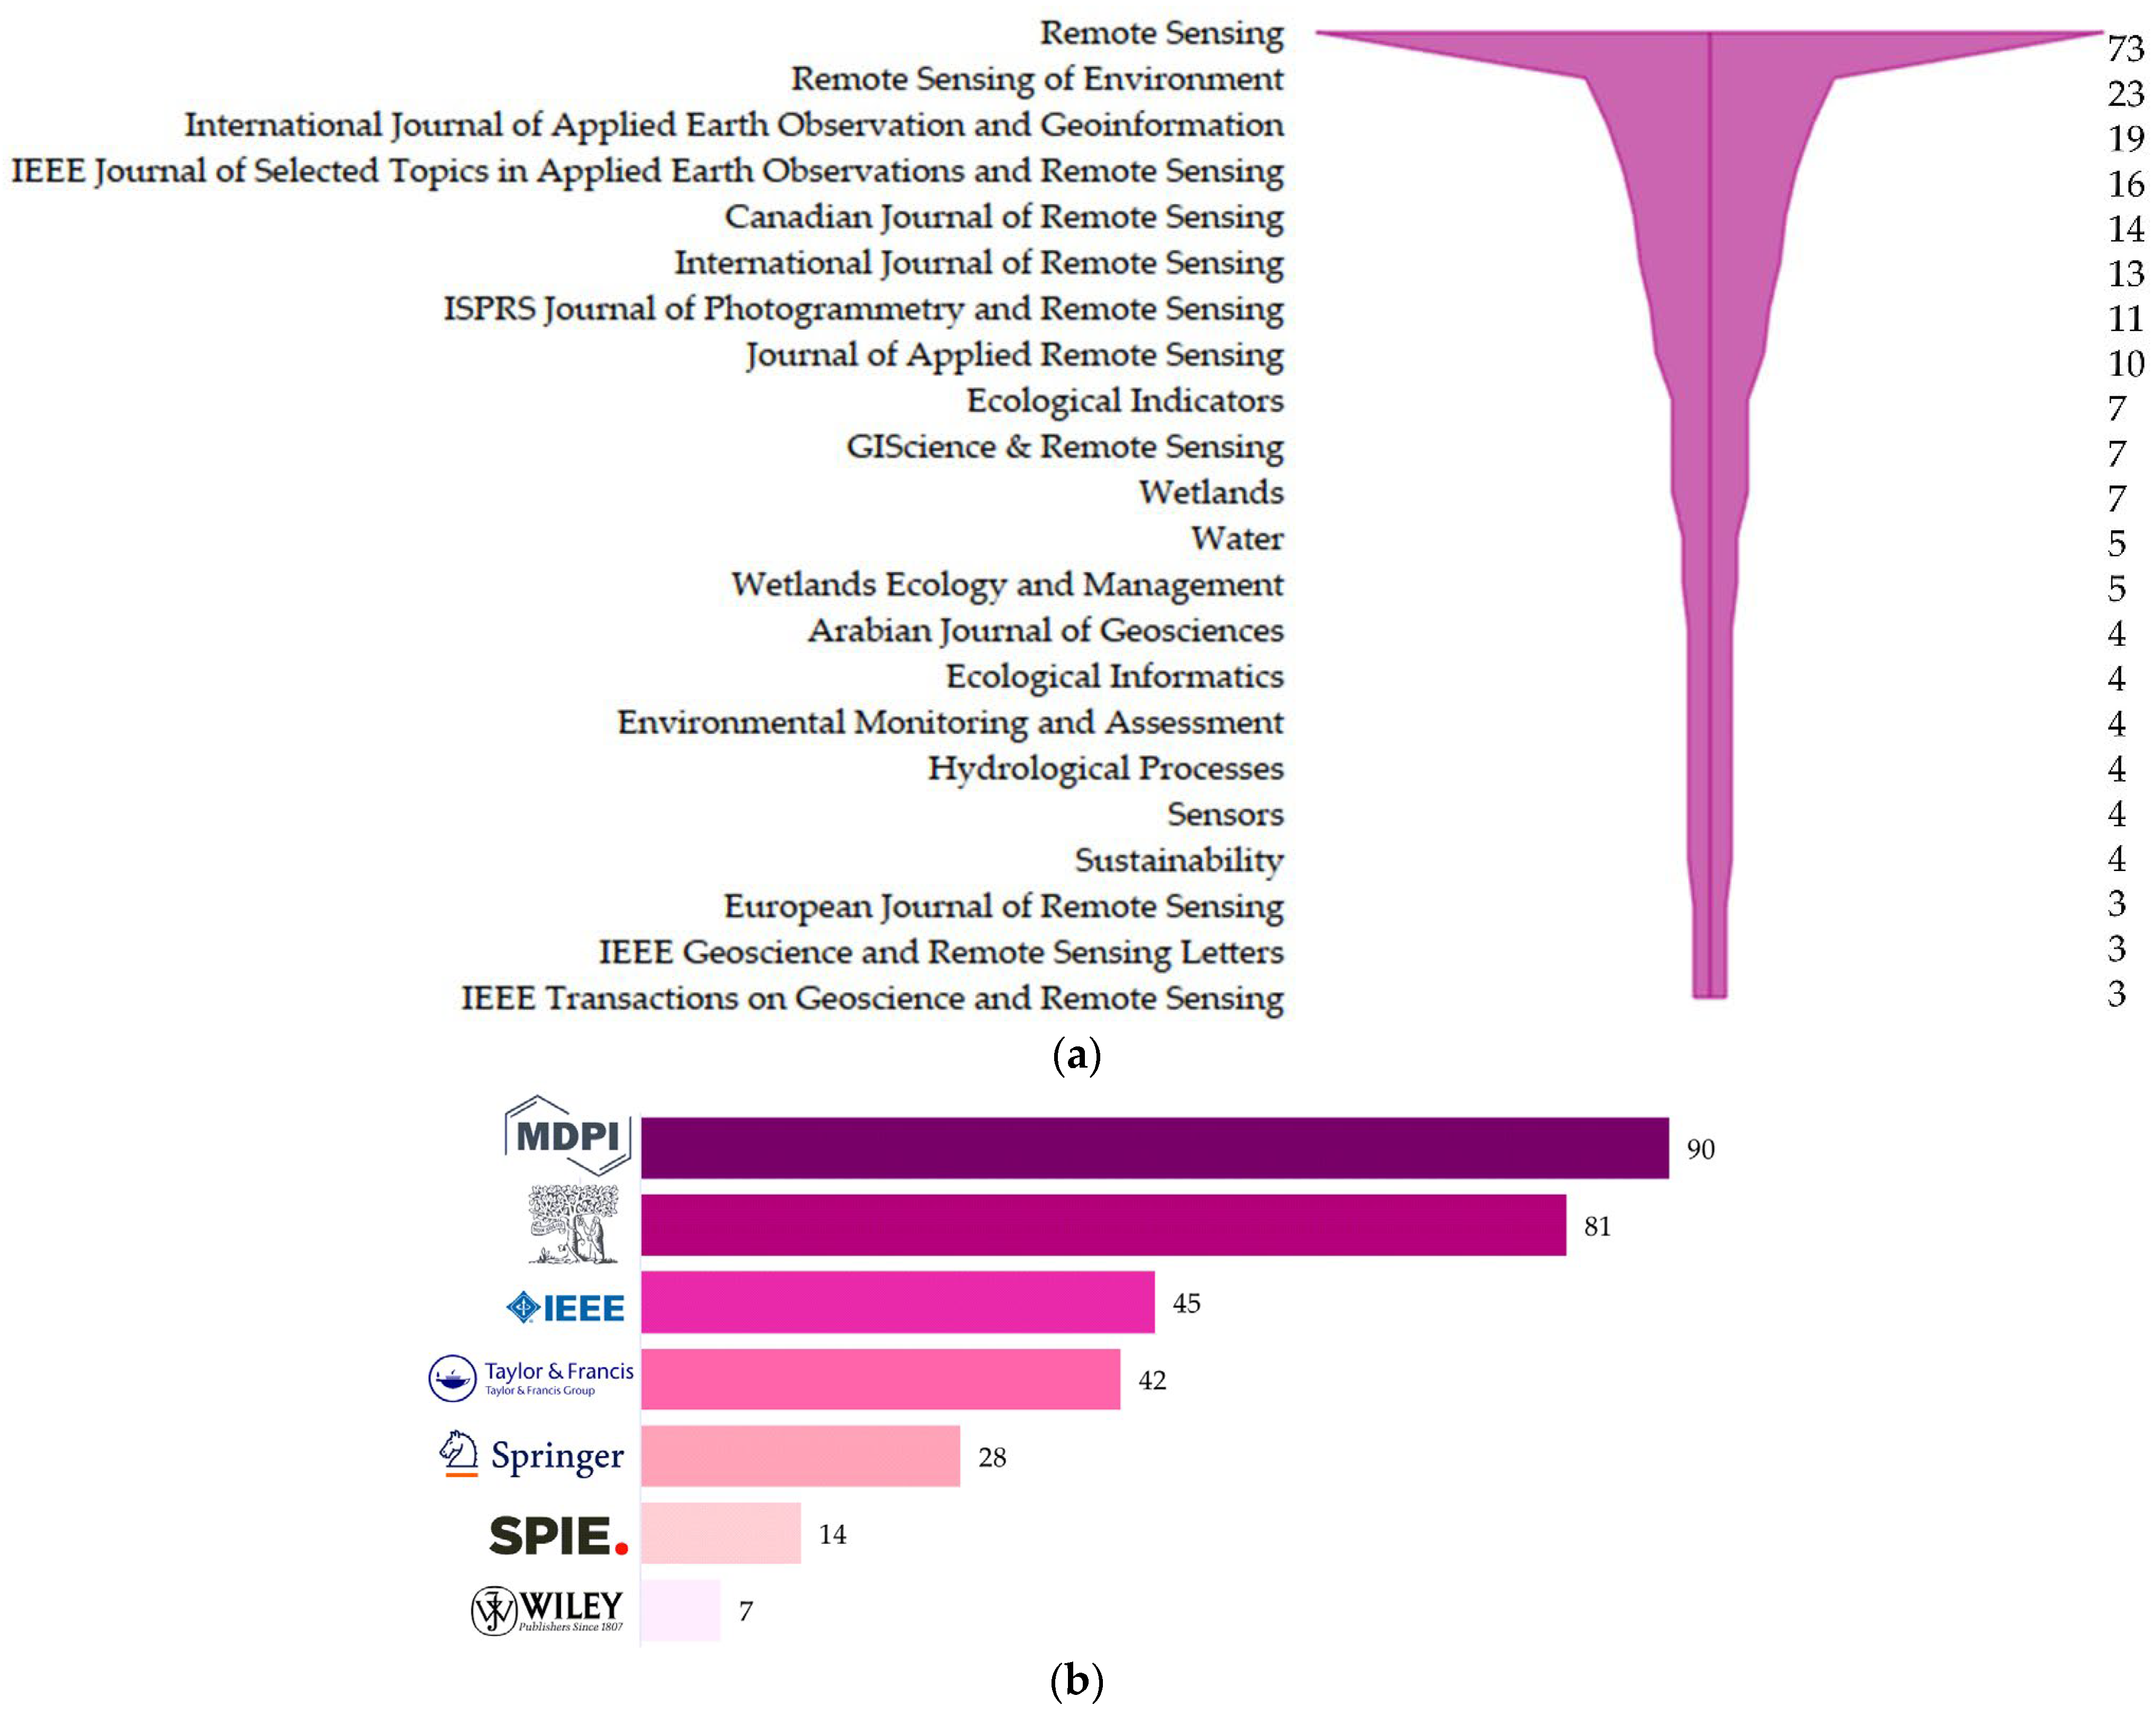
3.1.3. Journal and Conference Analysis
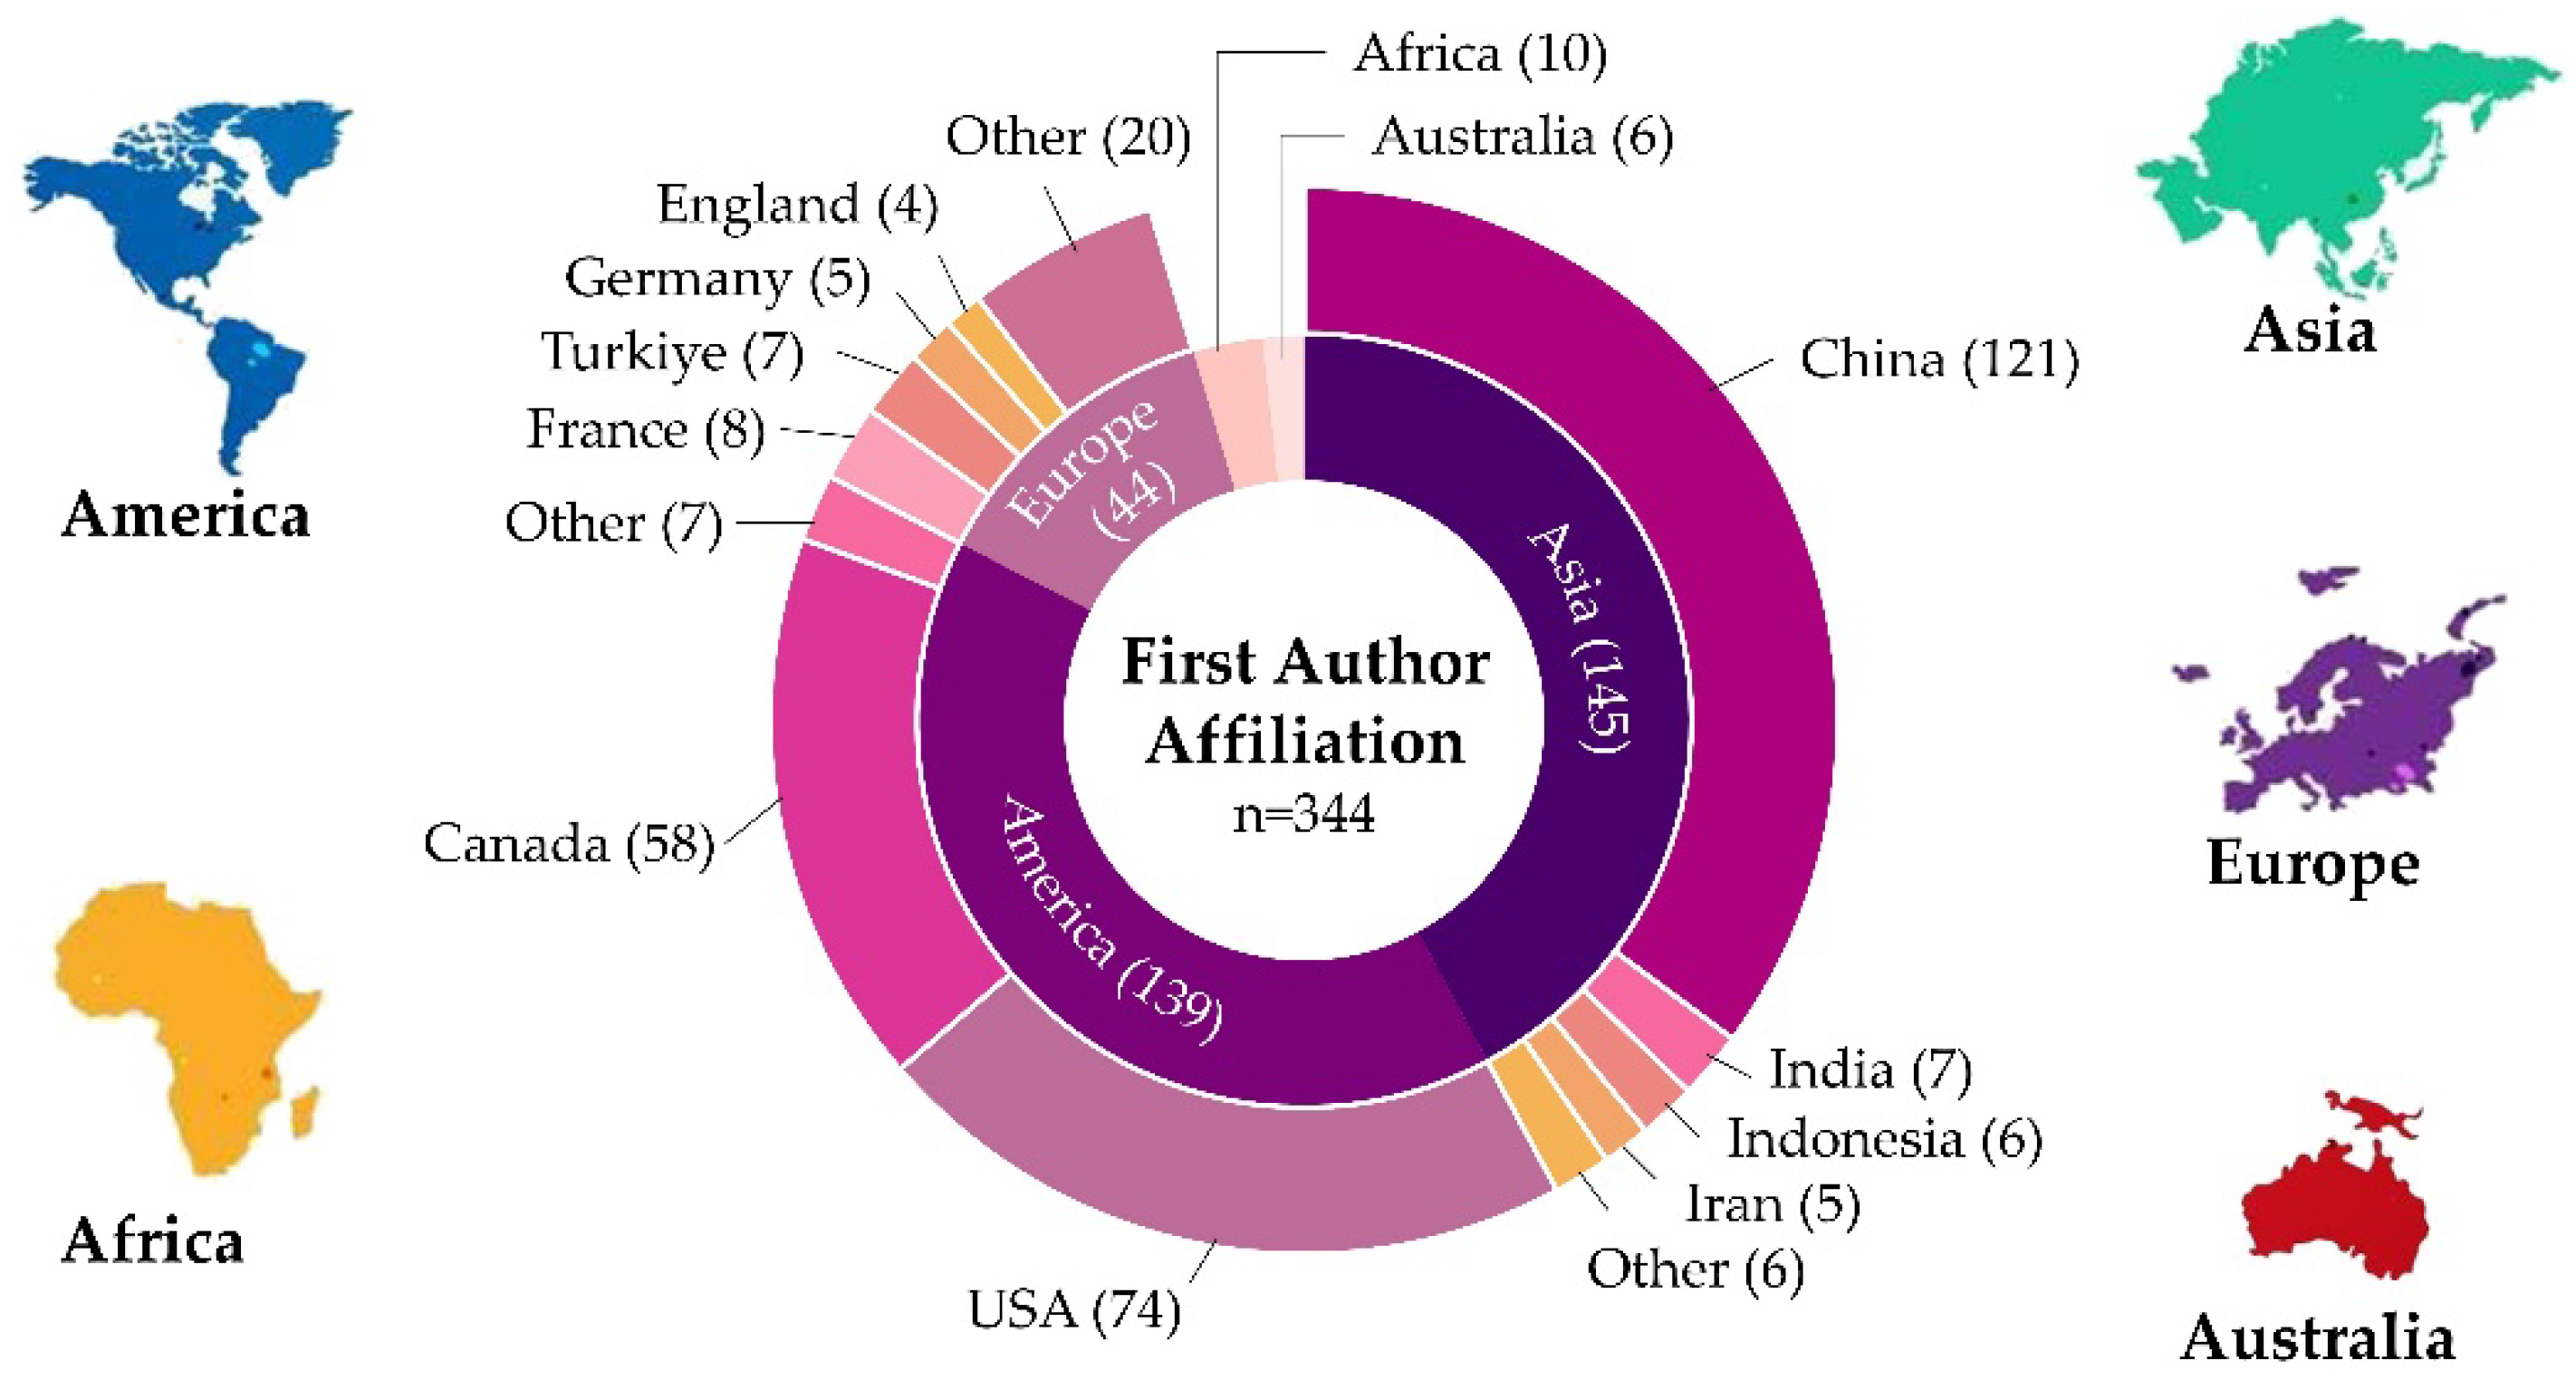
3.1.4. First Author Affiliation Analysis
3.1.5. Citation Analysis
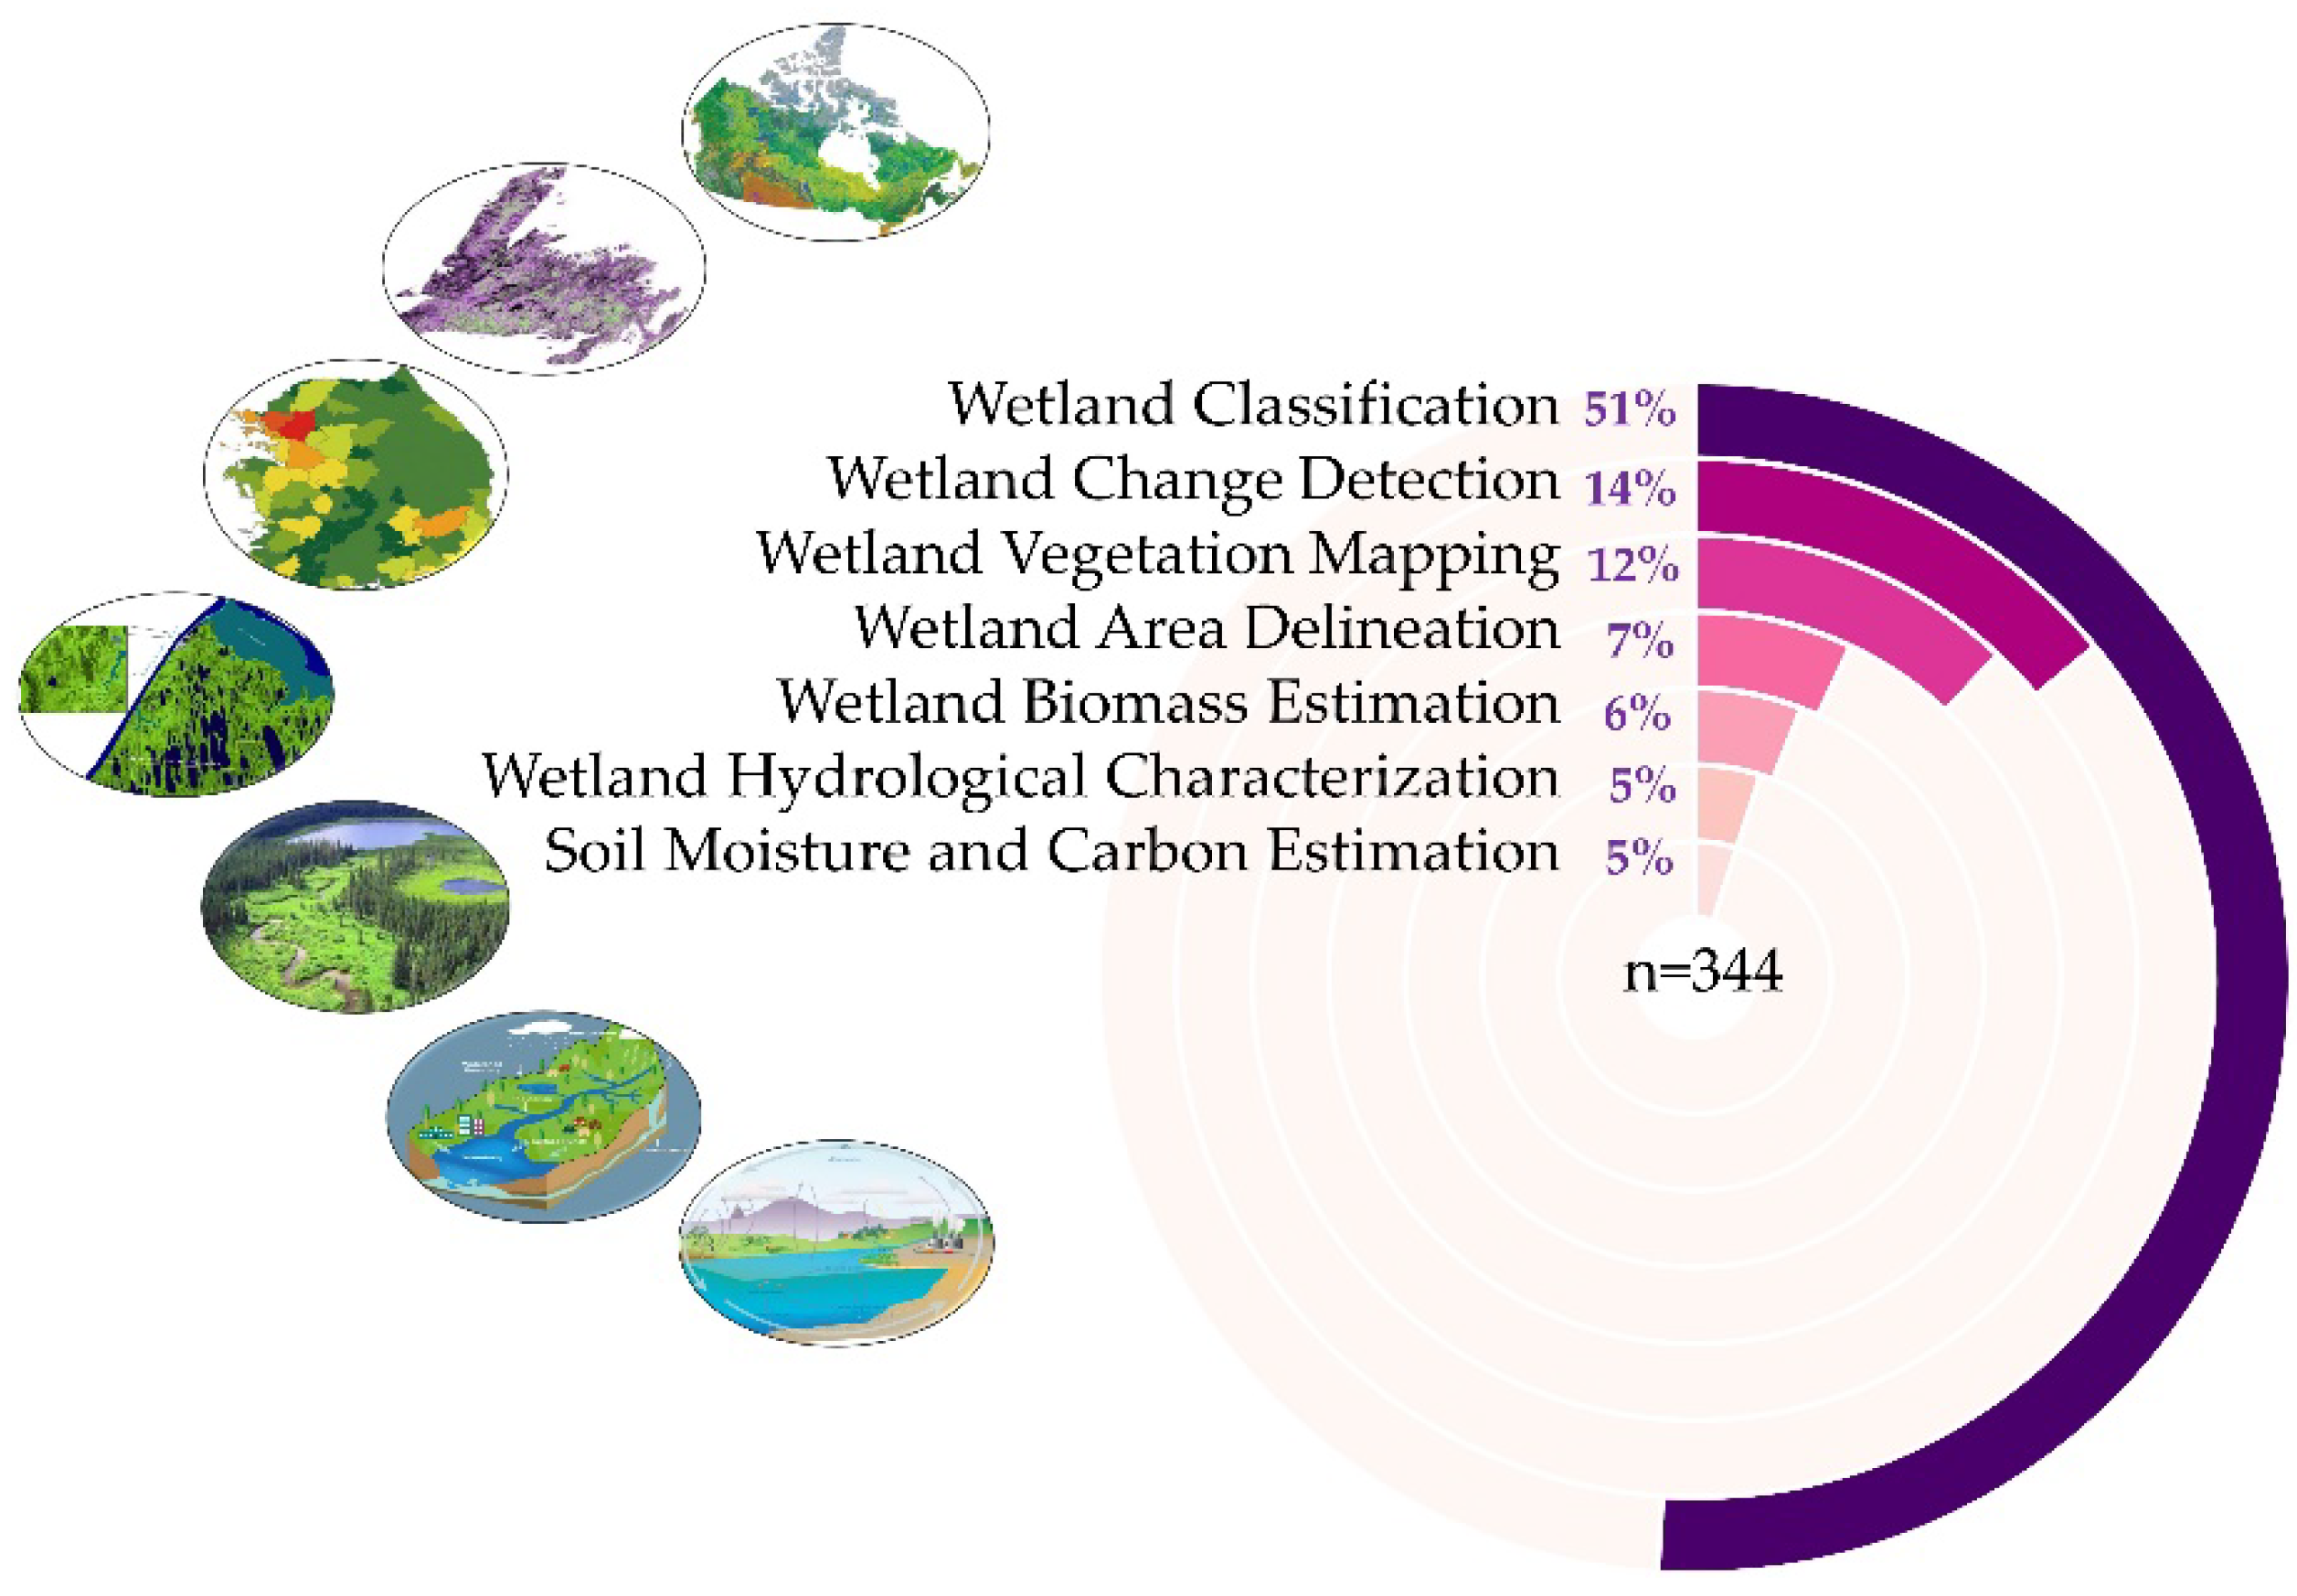
3.2. Study Focus and Applications
3.2.1. Classification
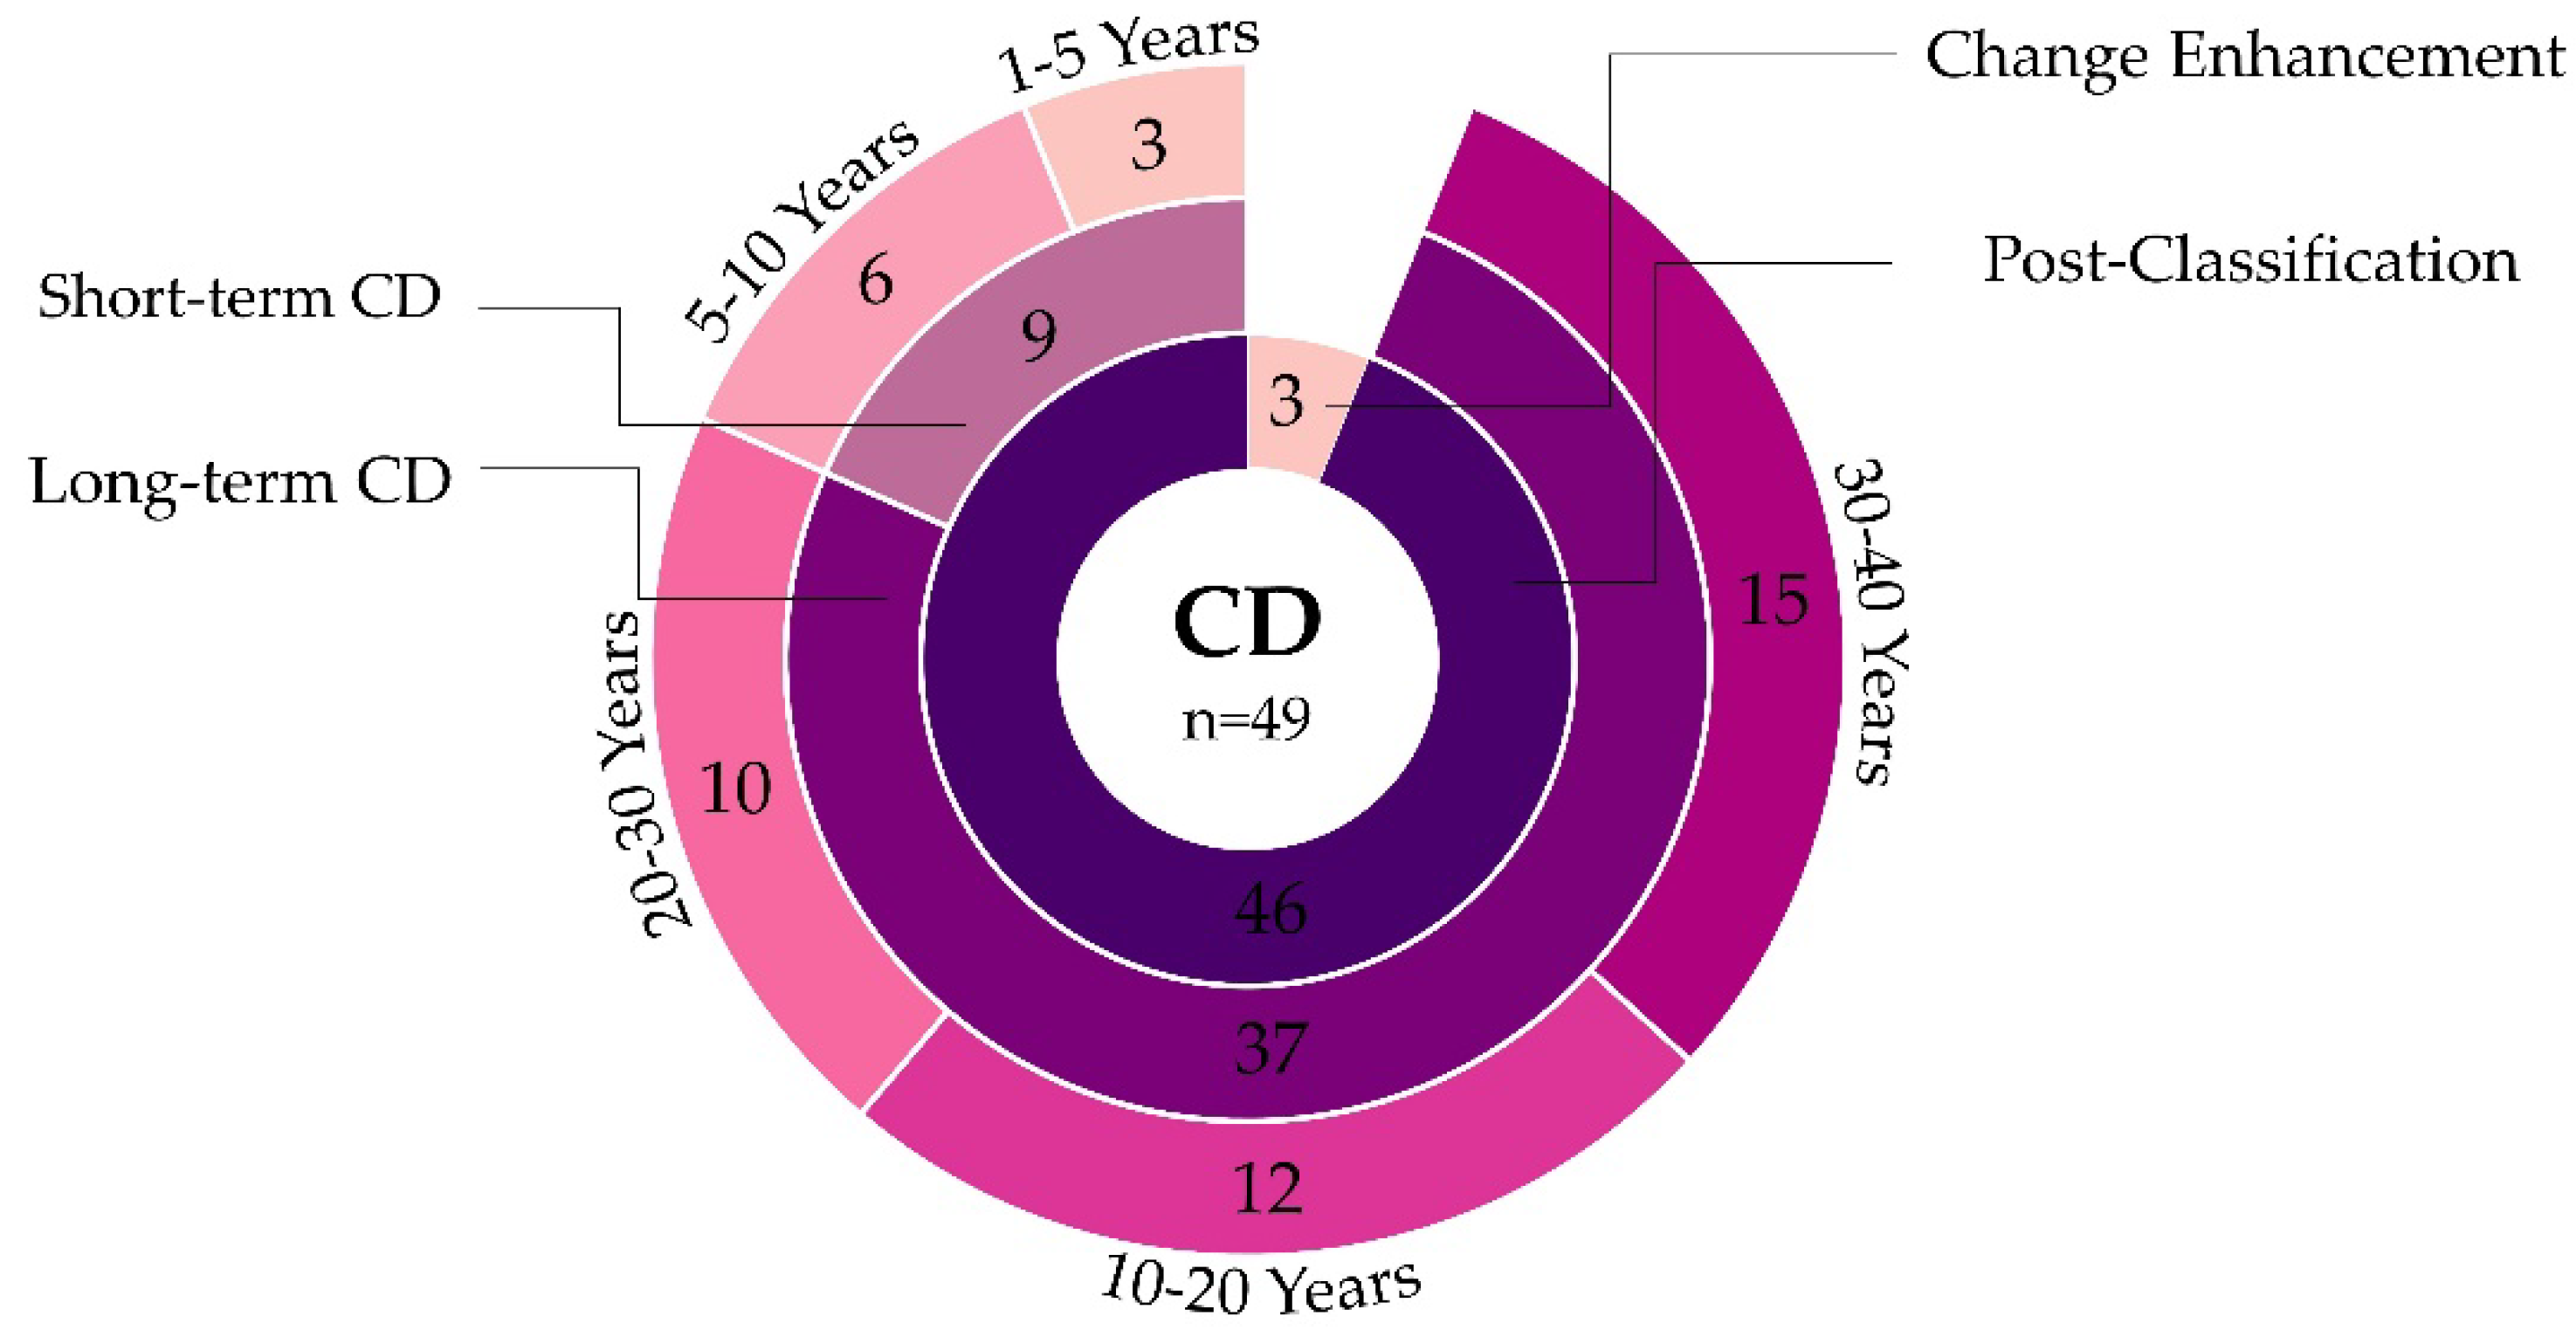
3.2.2. Change Detection
3.3. Case Study Analysis
3.4. RS Data Used in Wetland Studies
3.4.1. Data Type
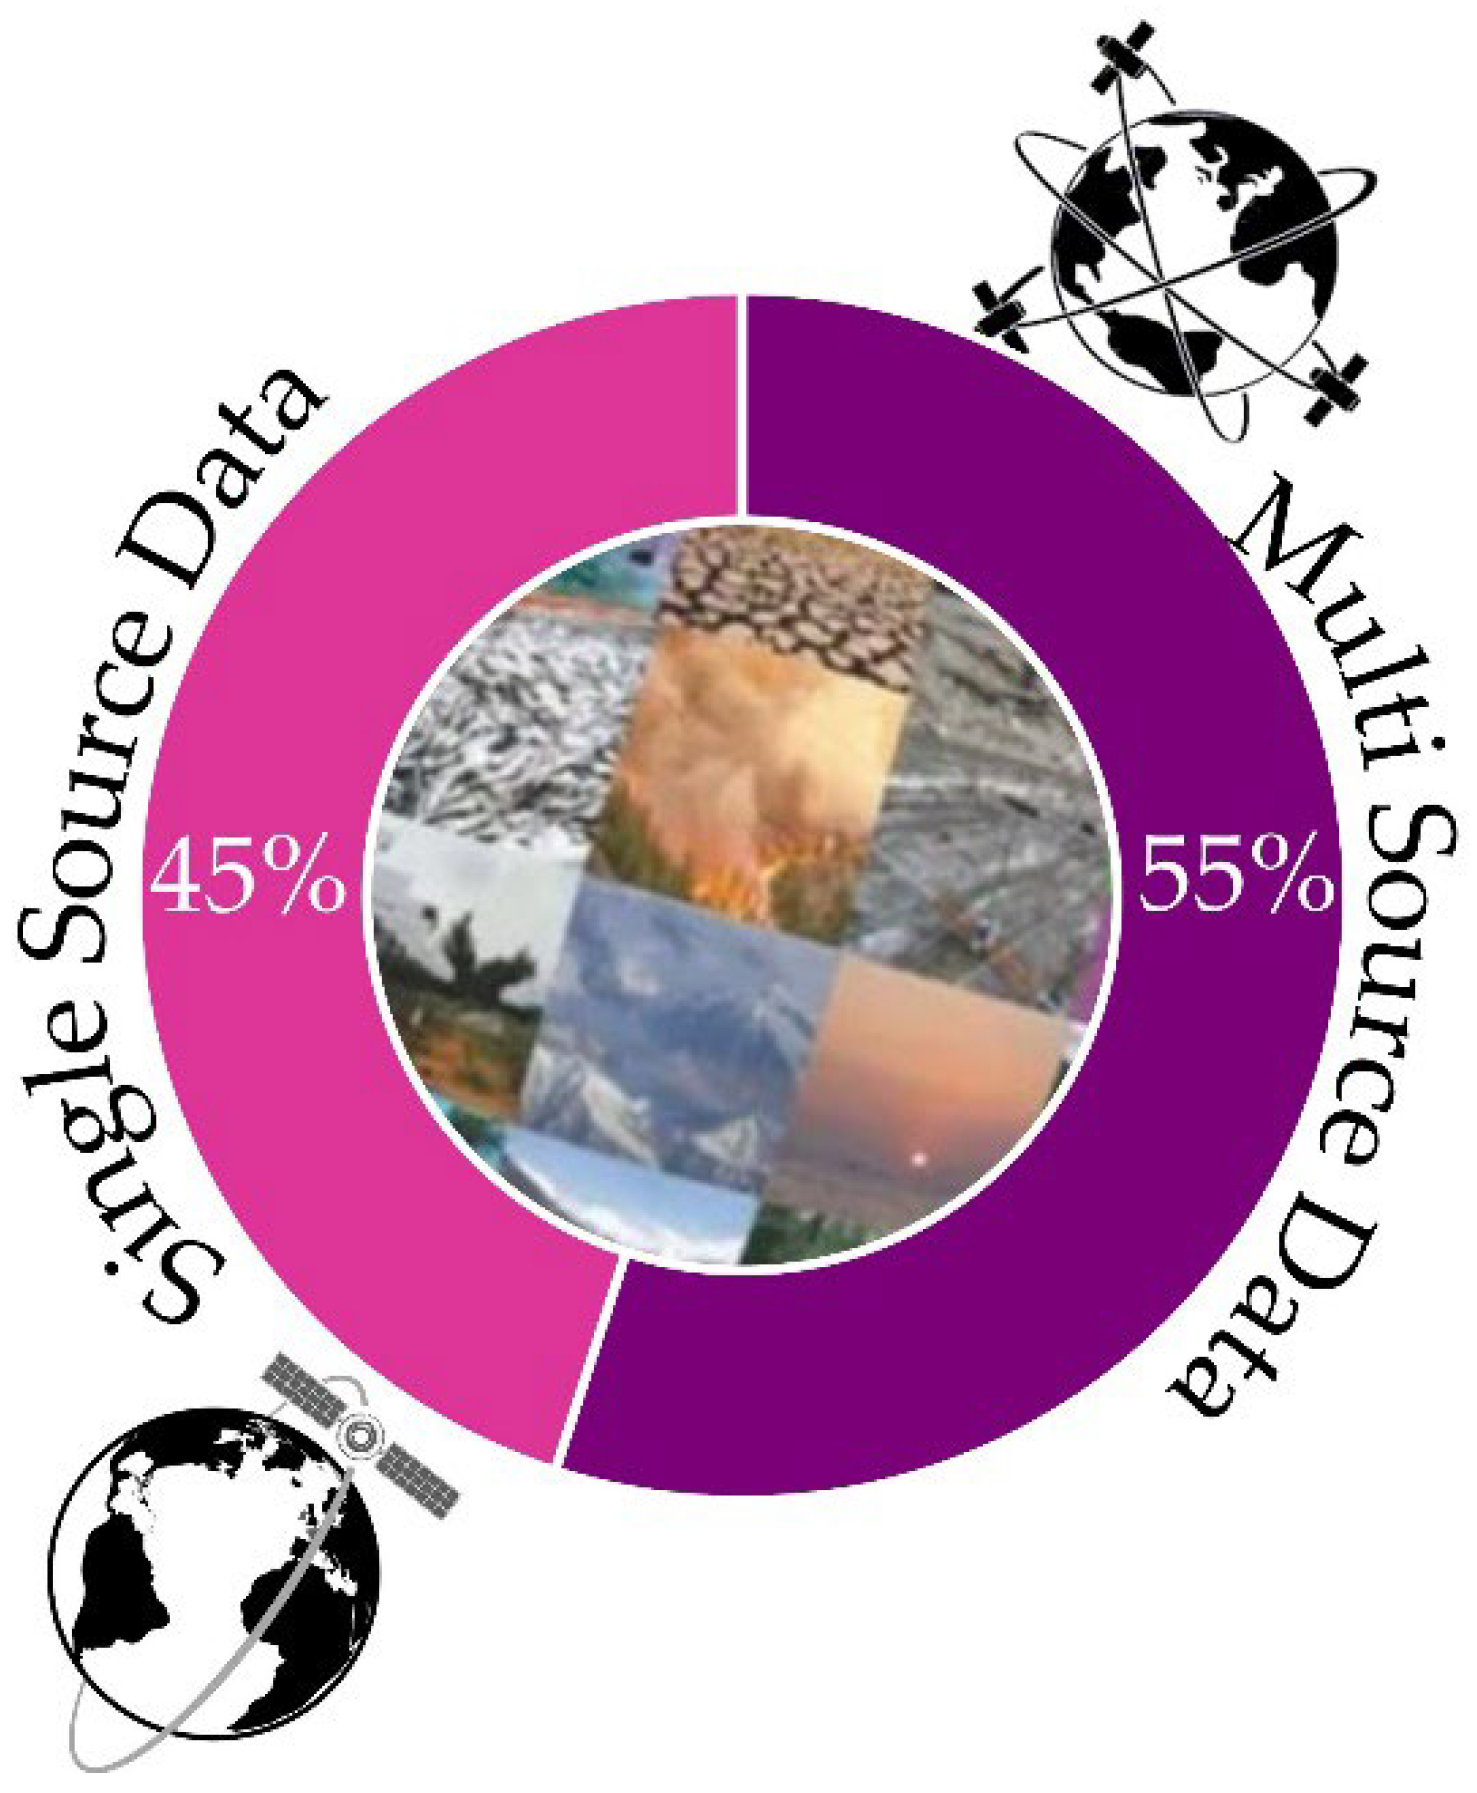
3.4.2. Single-Source Versus Multi-Source Data
3.4.3. Sensor Type
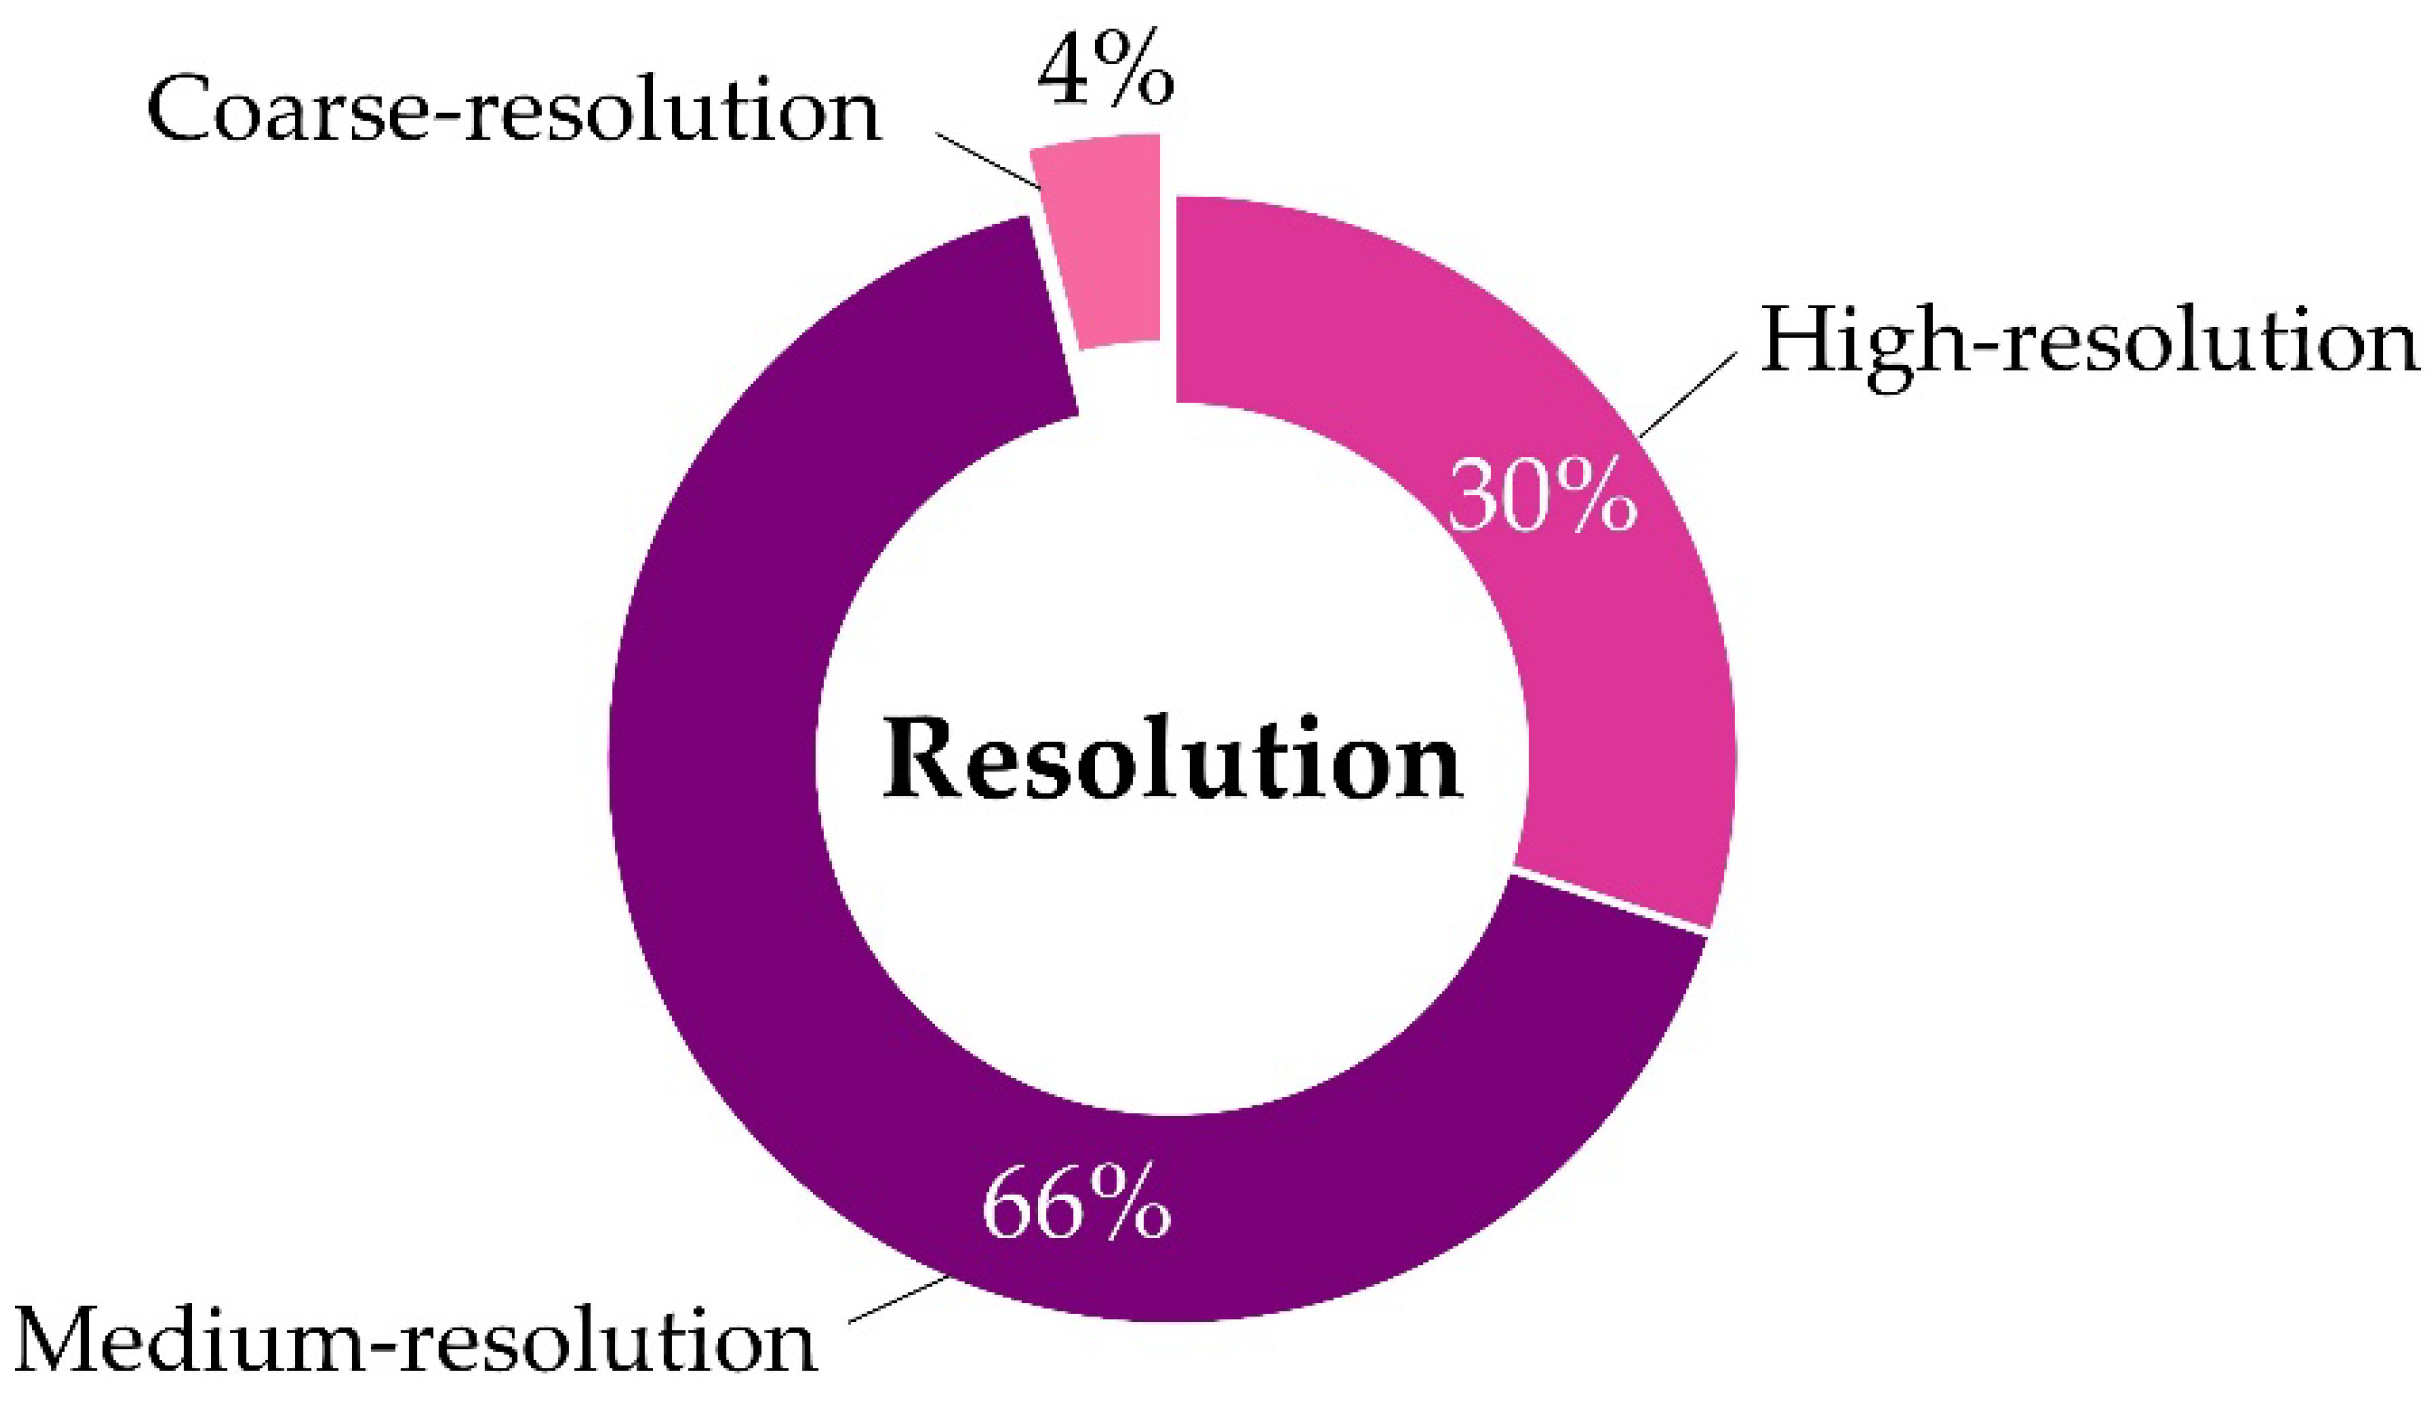
3.4.4. Data Type Resolution
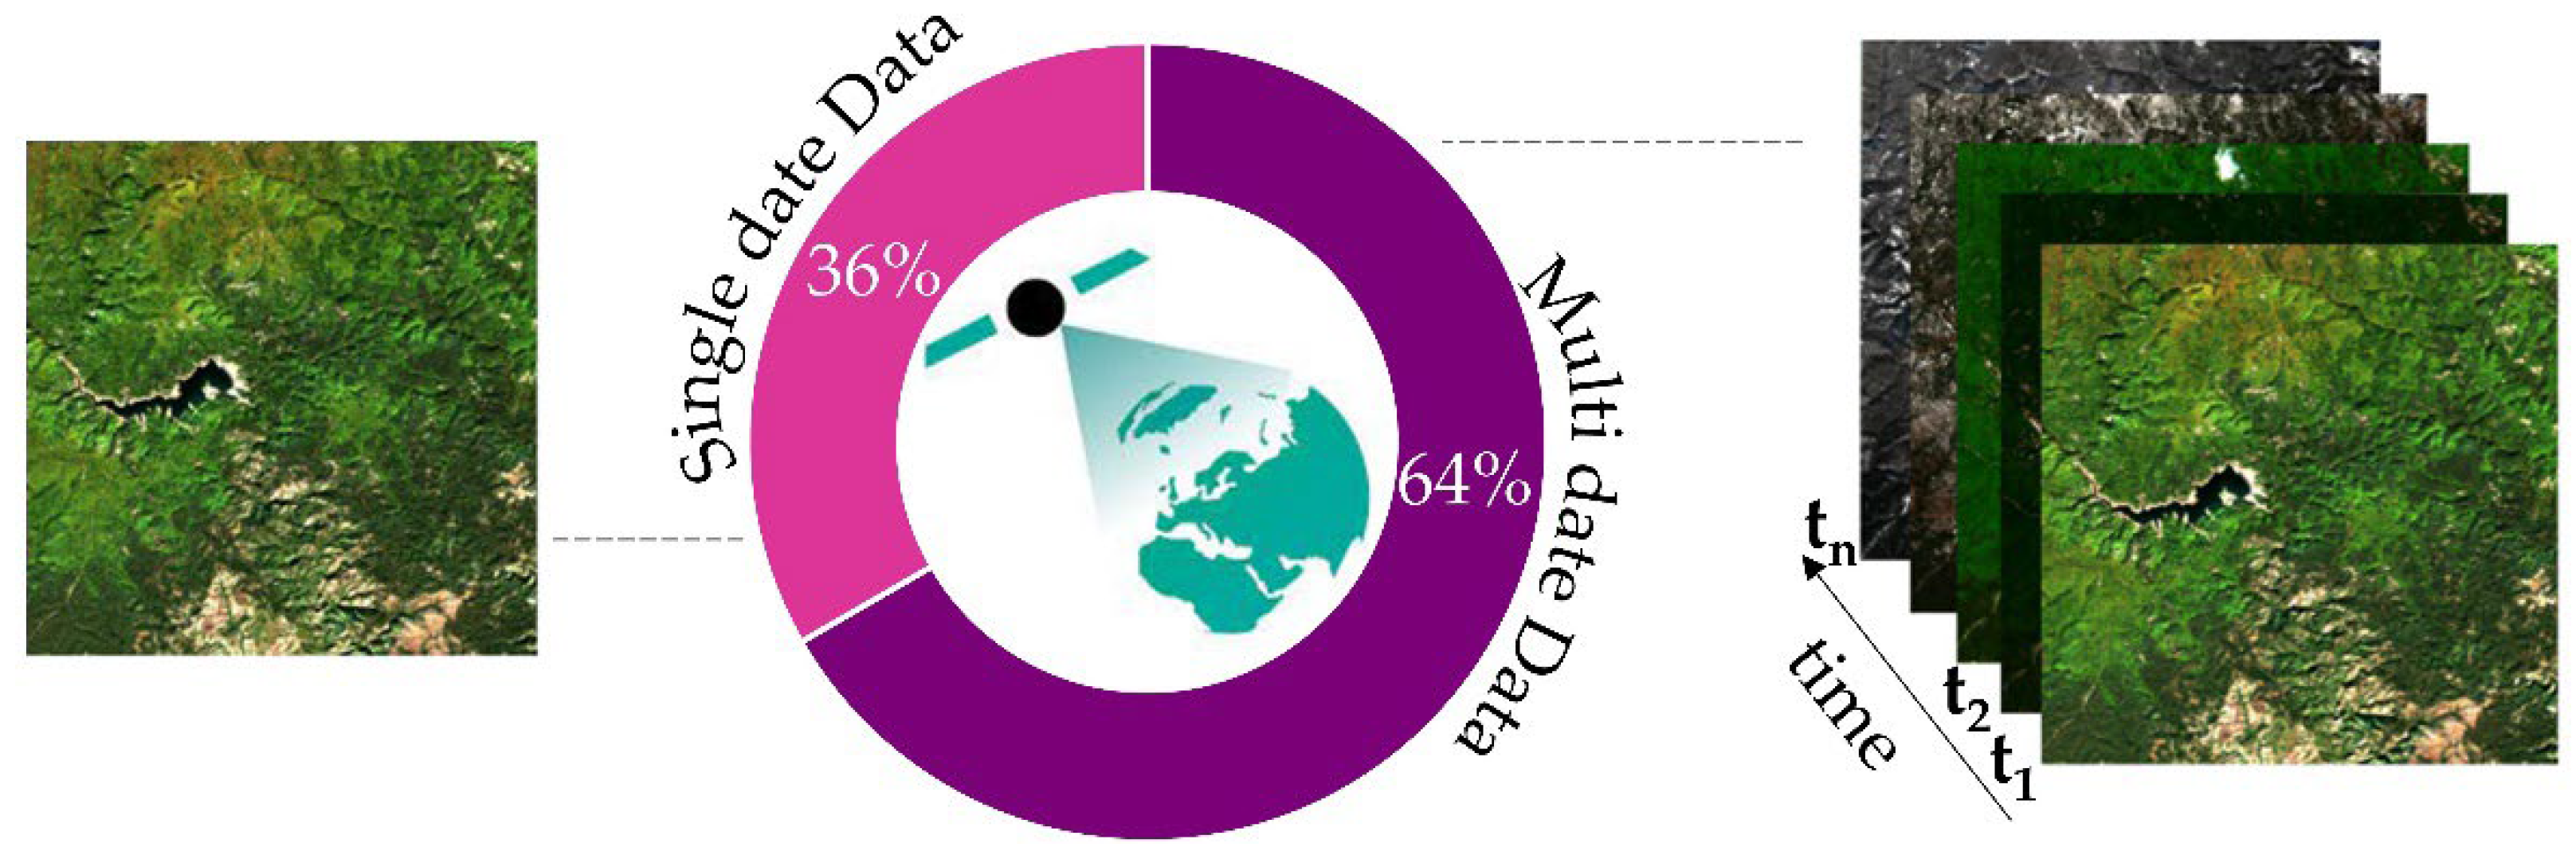
3.4.5. Single Date Versus Multi-Date
3.5. Methodology Analysis
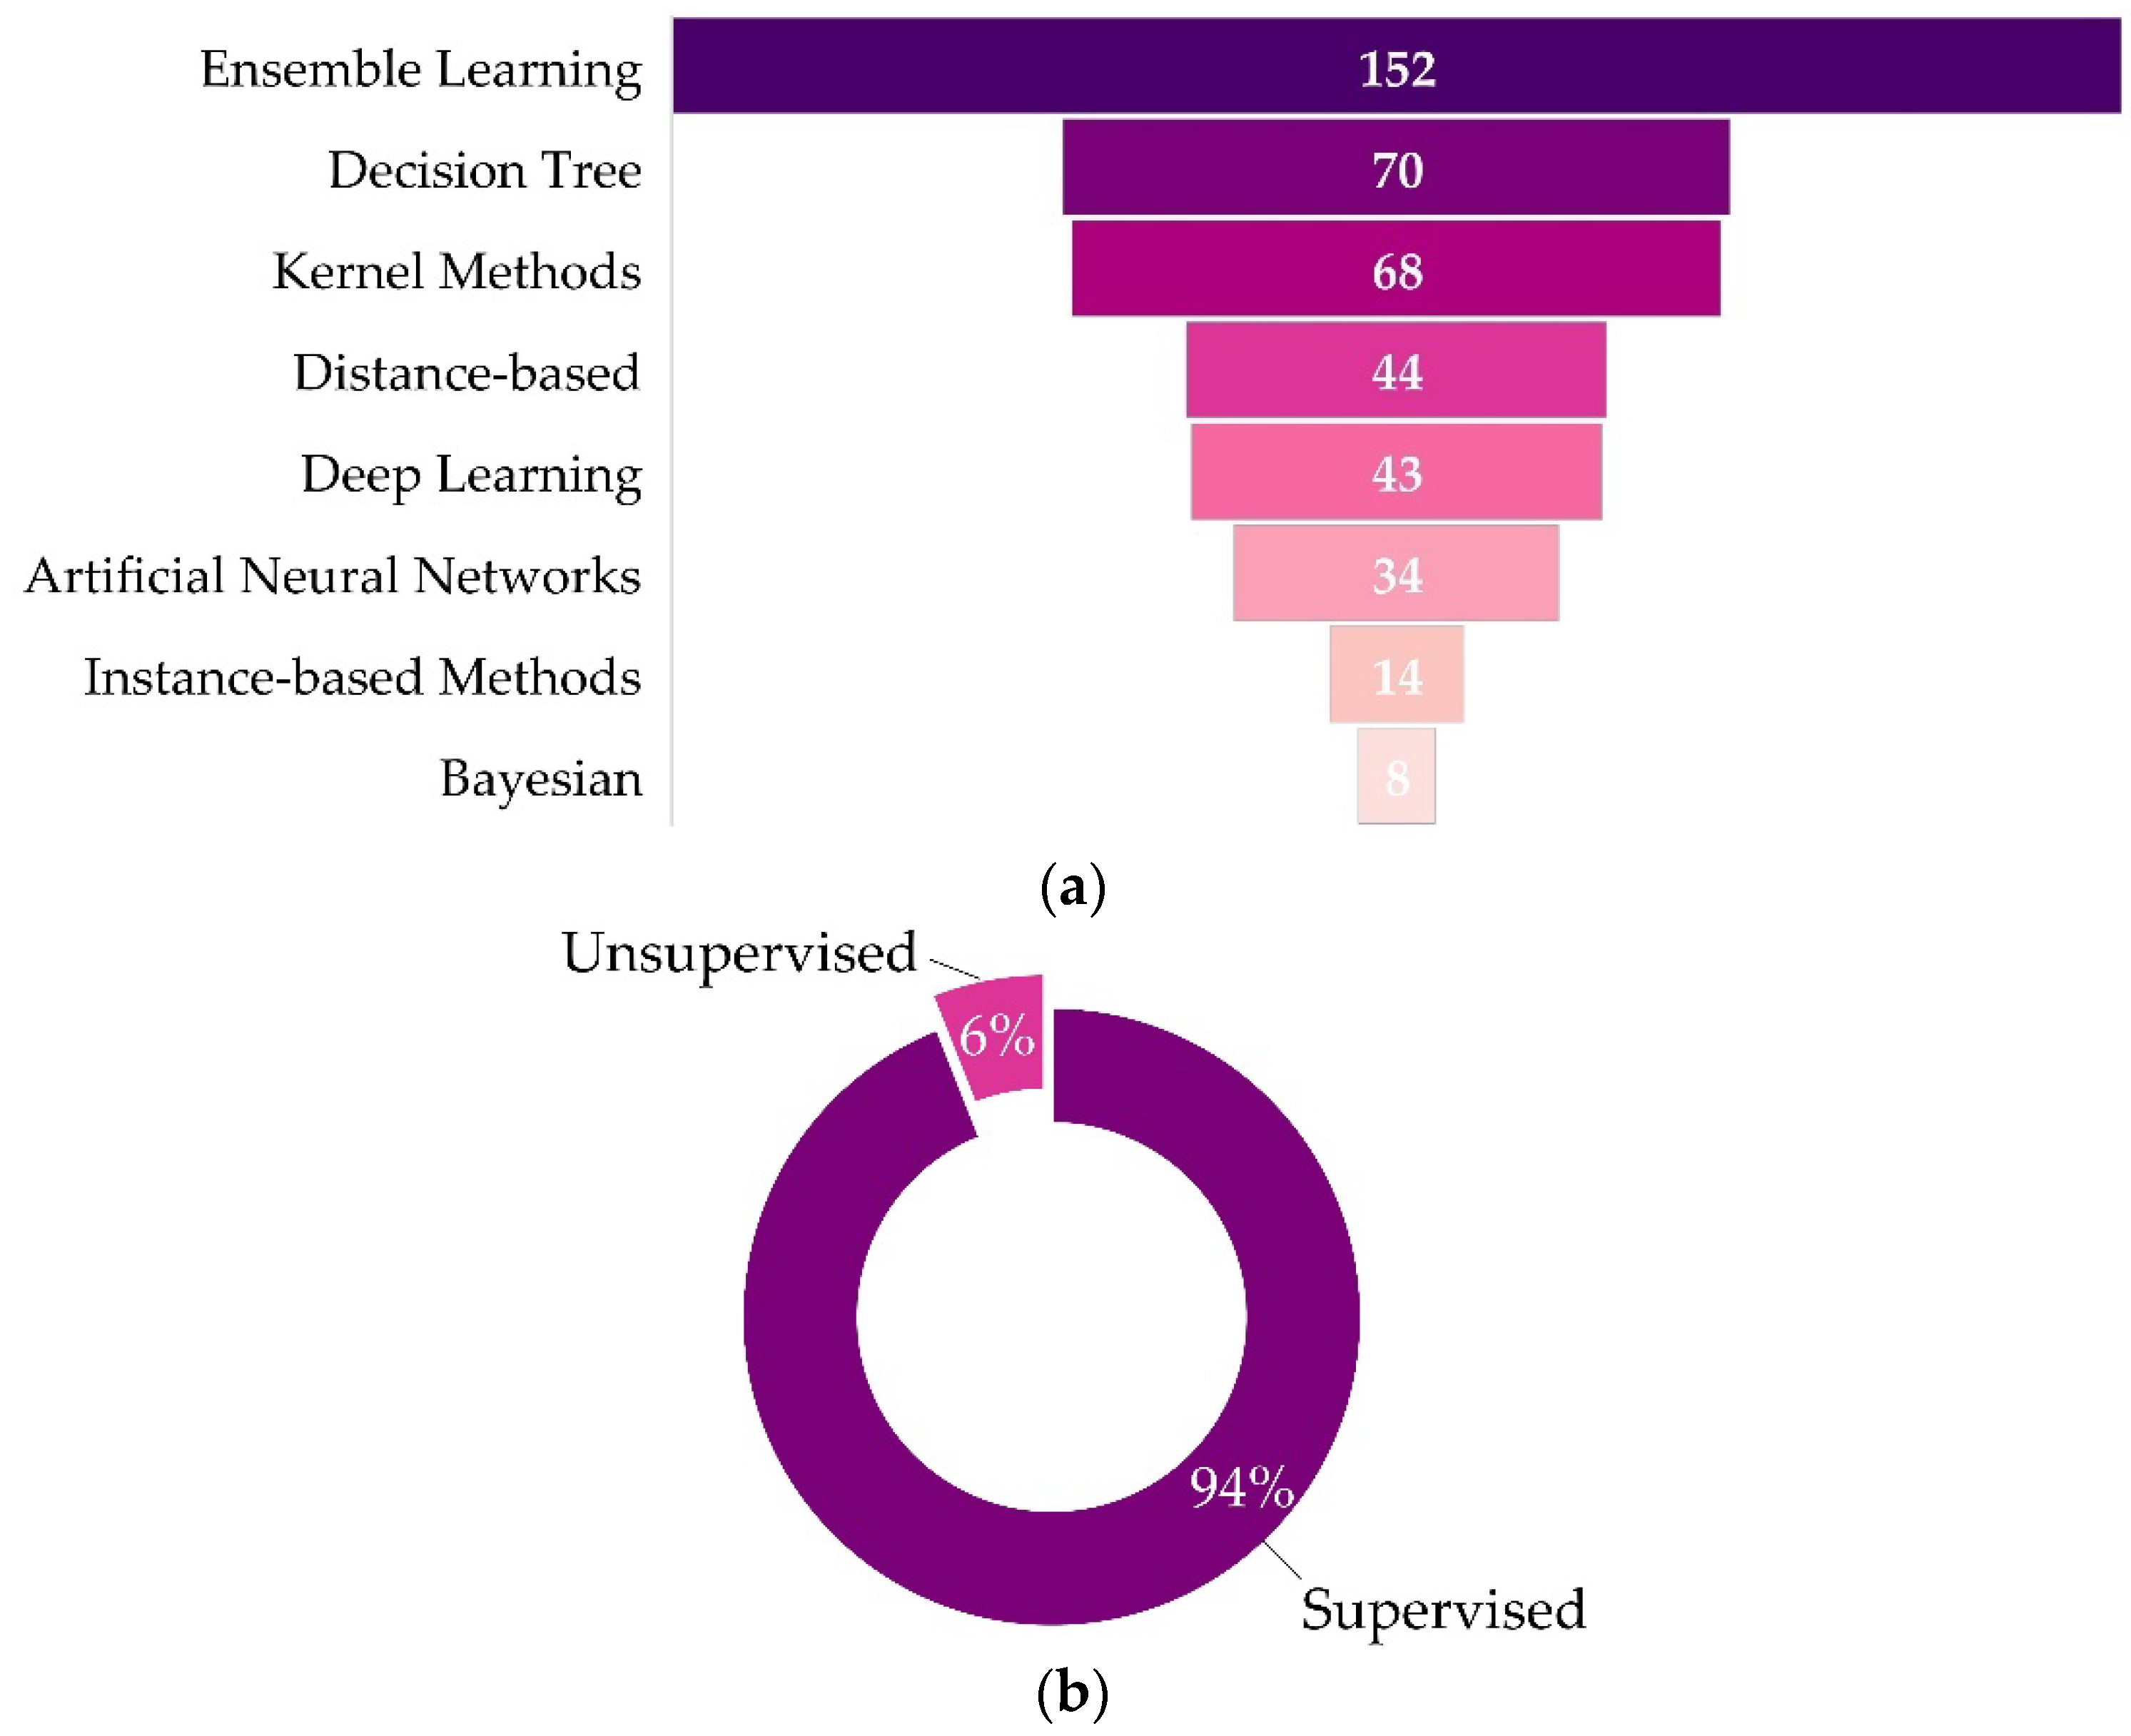
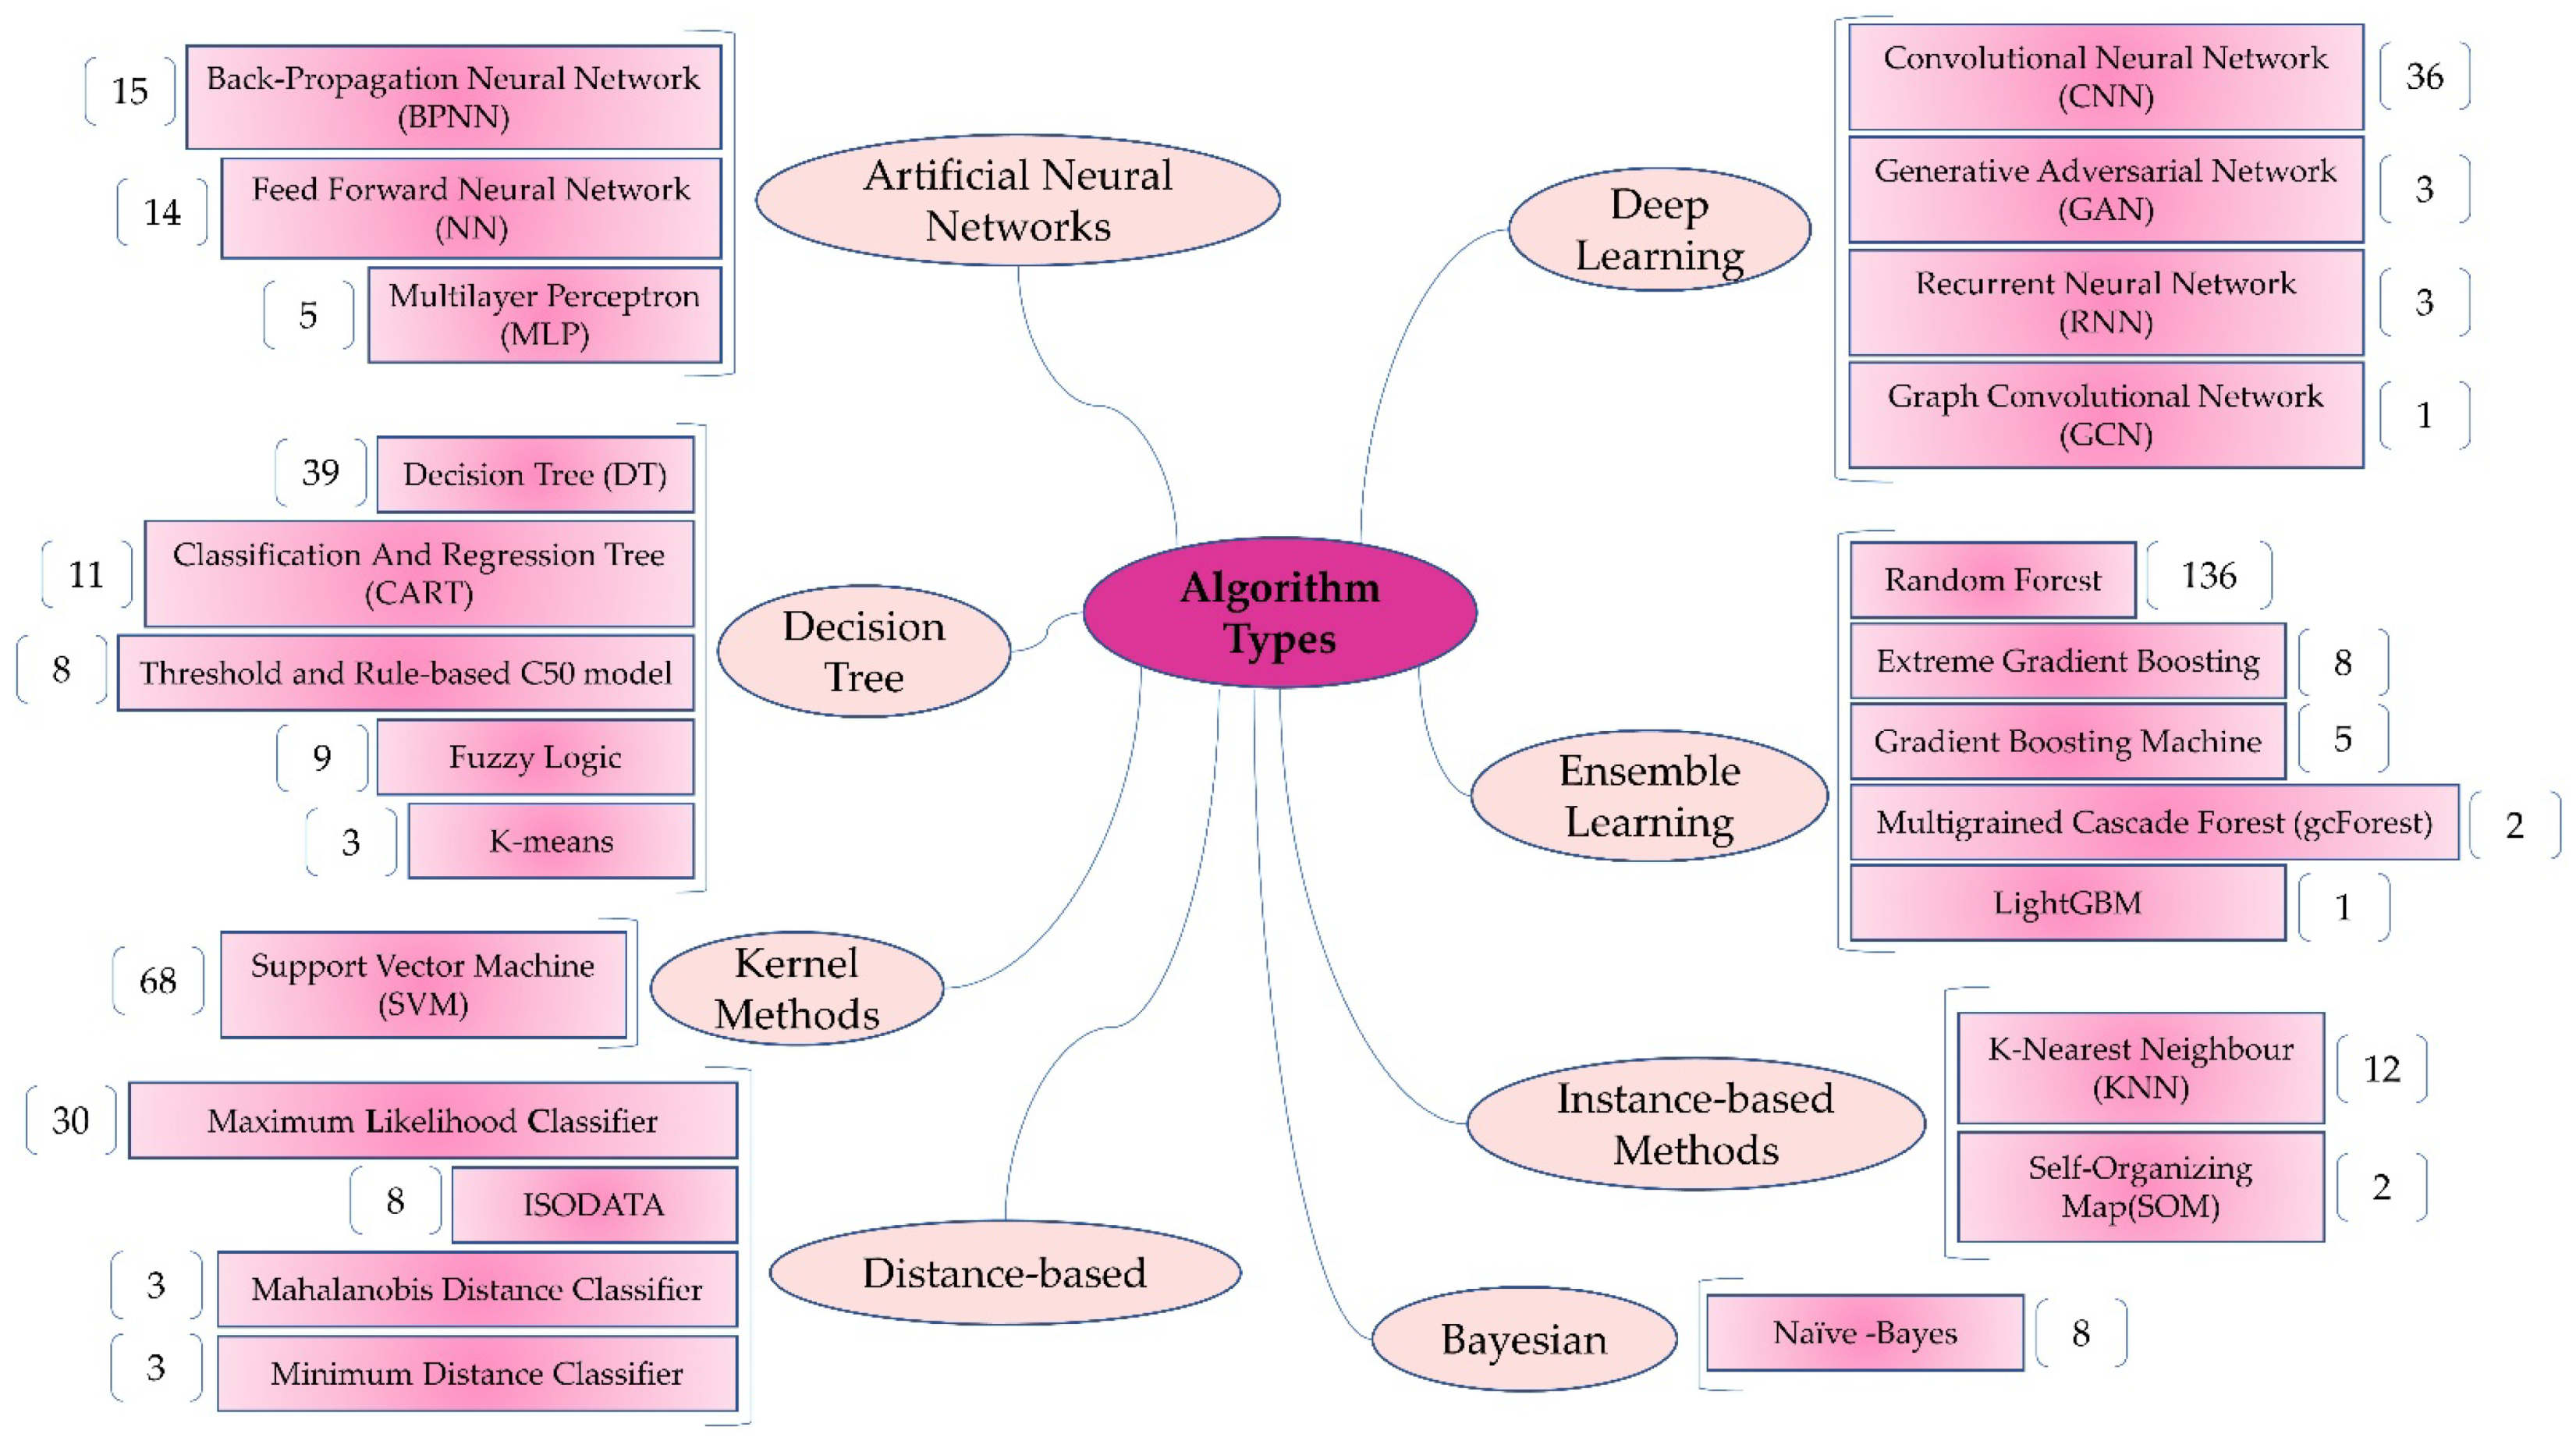
3.5.1. ML Classifier Categories
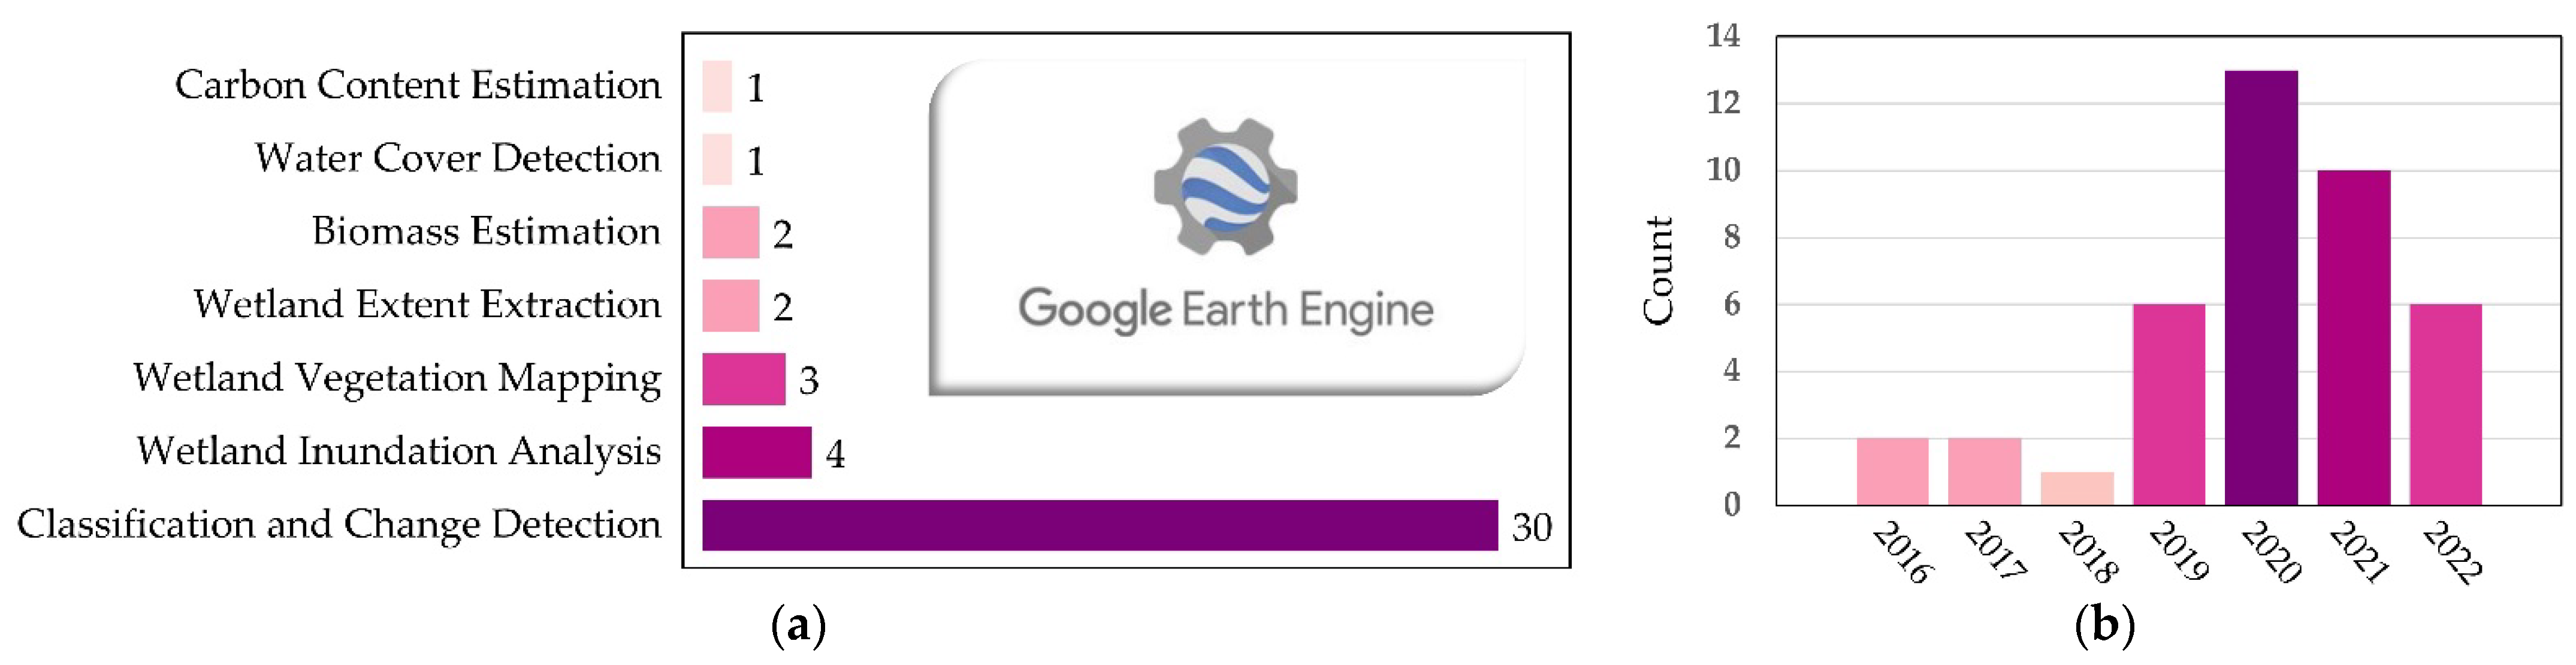
3.5.2. Google Earth Engine (GEE)
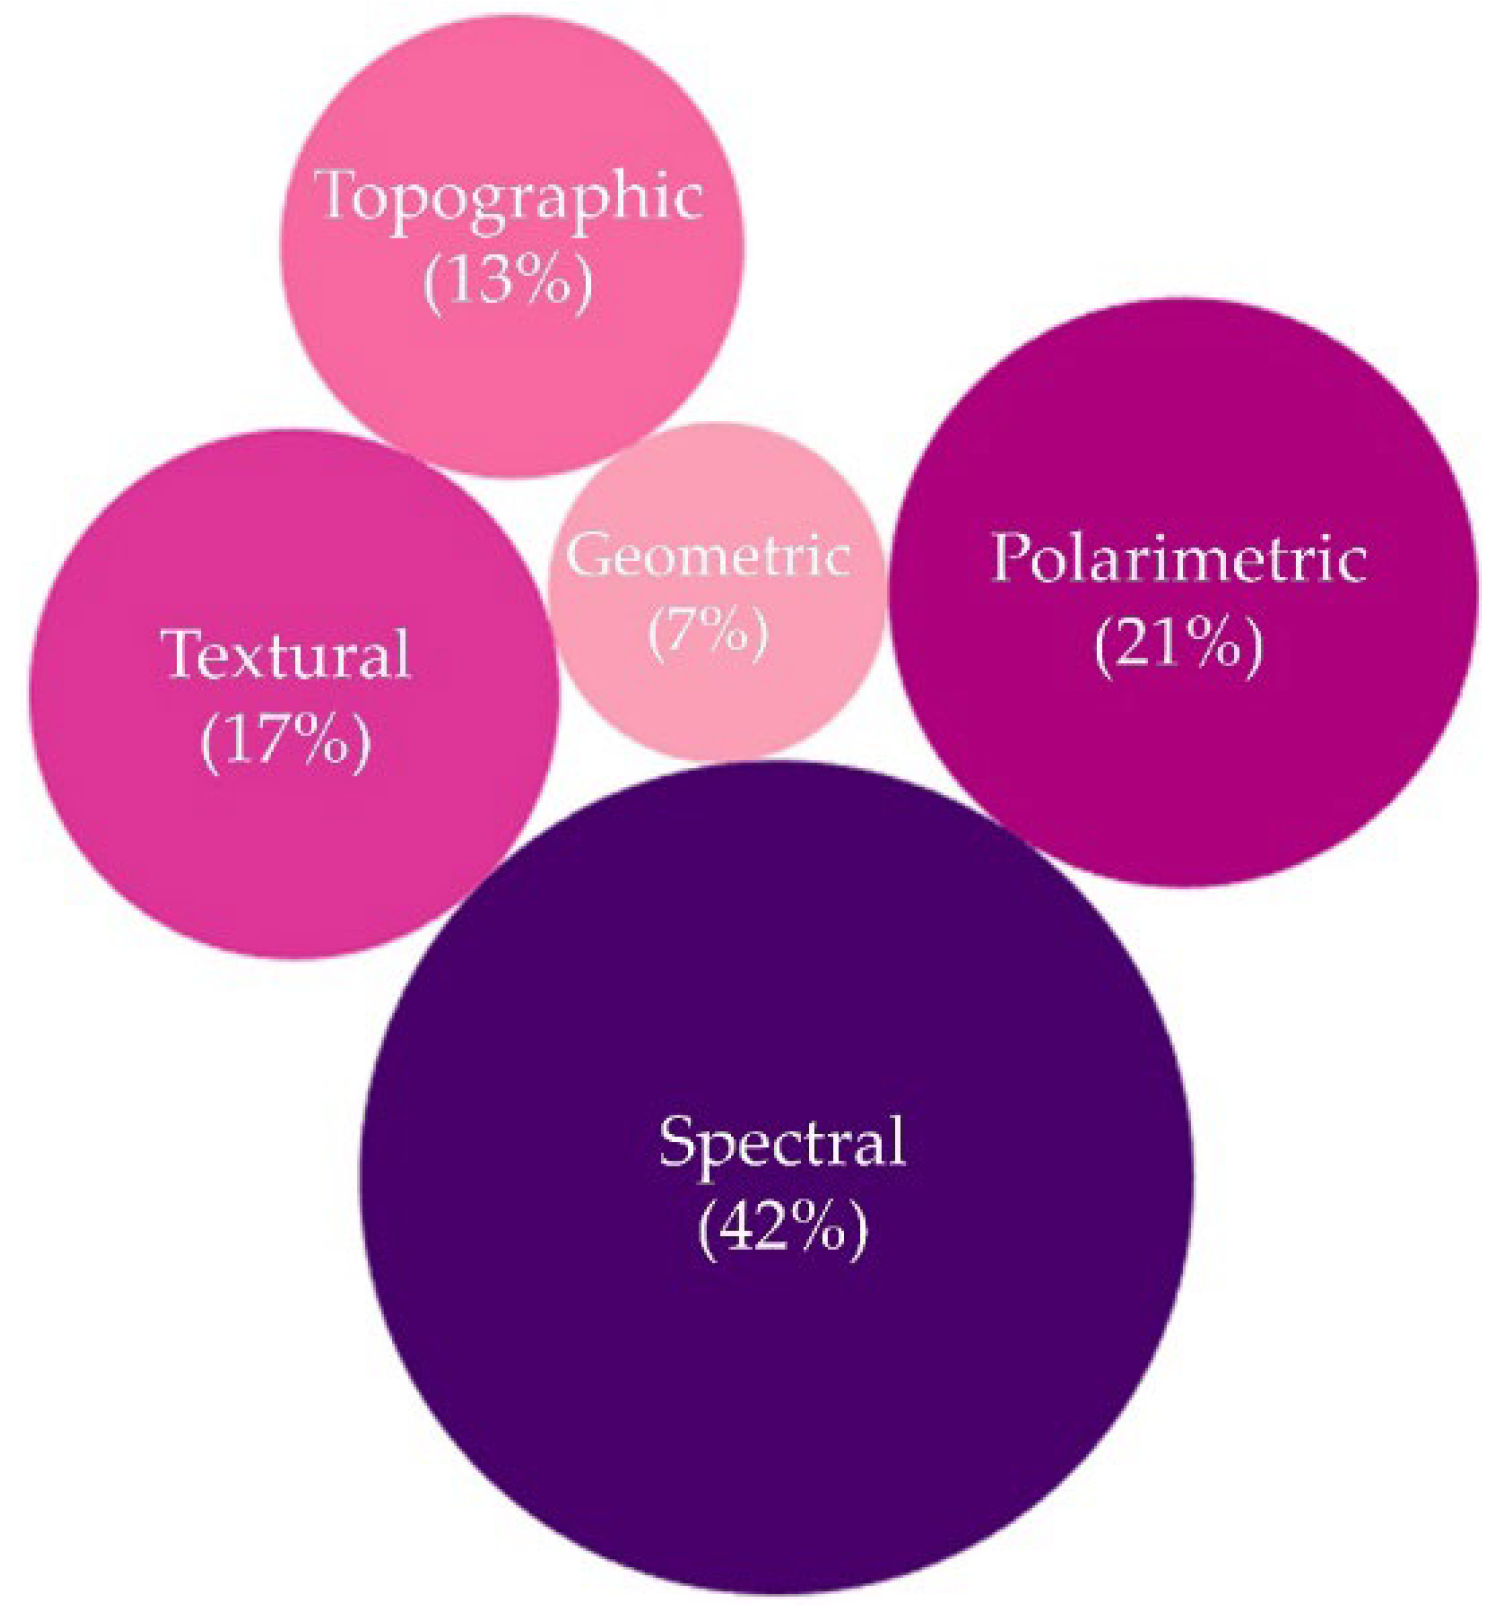
3.6. Feature Selection and Derivation
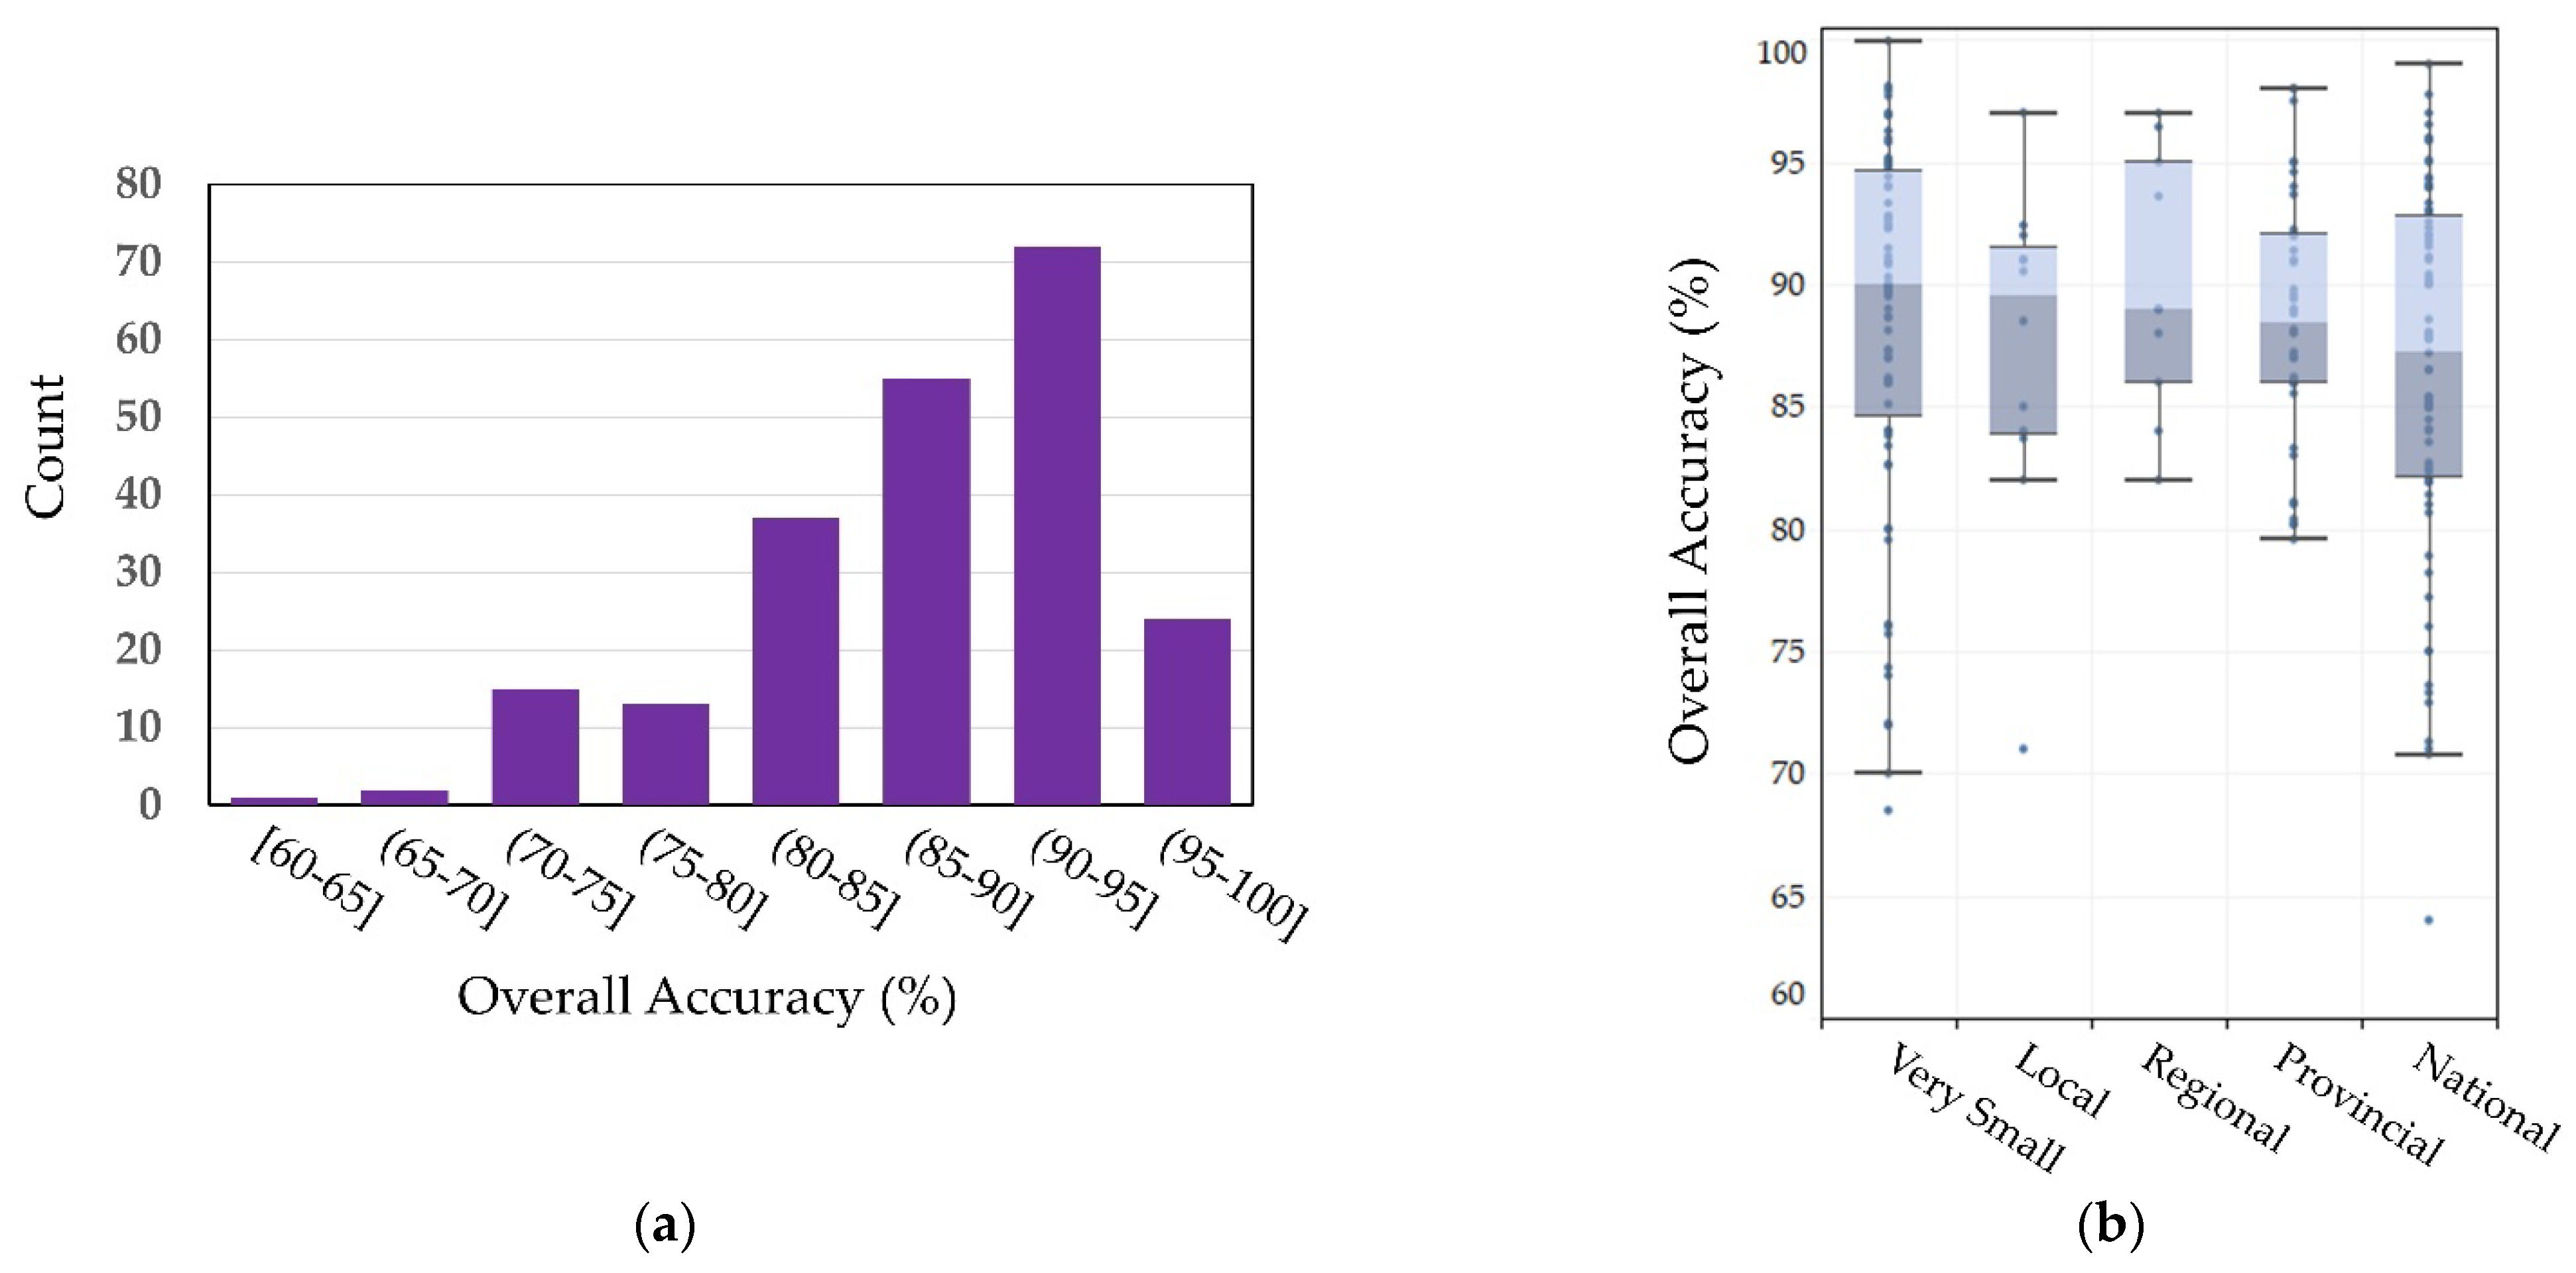
3.7. Accuracy Assessment
3.8. Preprocessing and Processing Tools
4. Future Perspective
- (1)
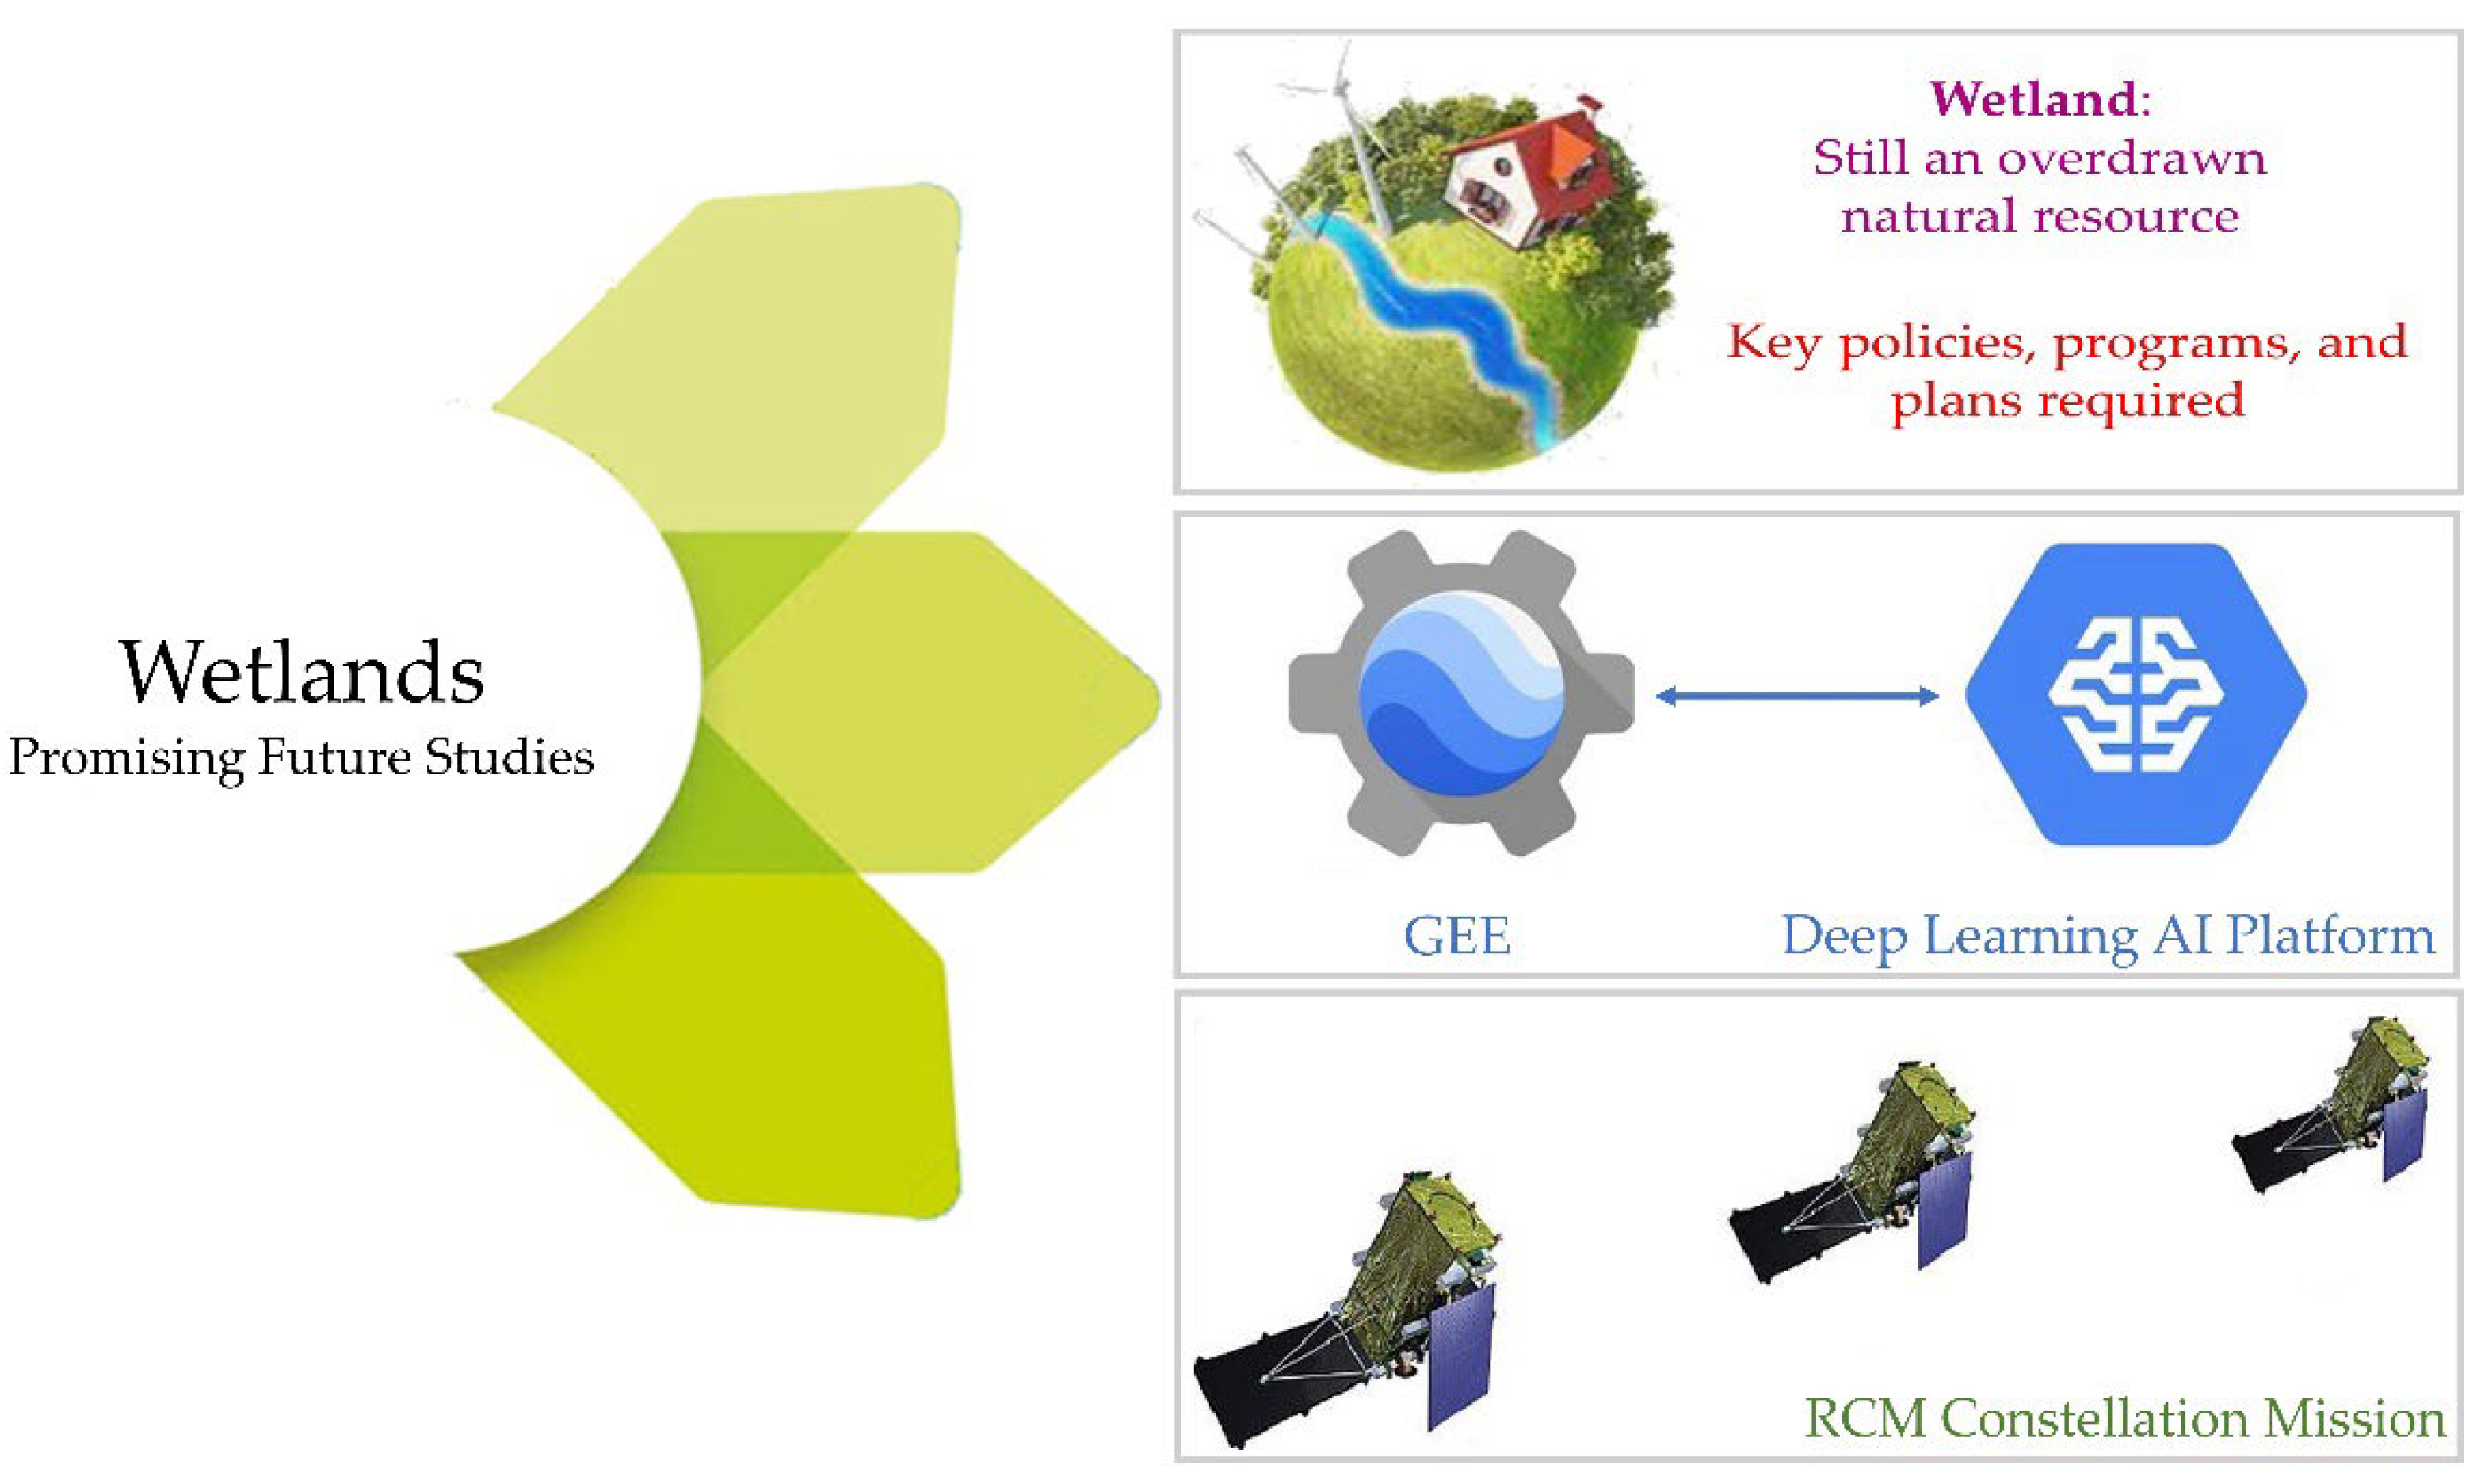
- Wetland sustainability policy: wetlands are at risk, and those around agricultural land or near urban areas have suffered huge losses with extended cultivation and urbanization. This indicates that upgrades and reinforcements of existing legislation, policies, programs, and strategic ecosystem plans are seriously required to protect and preserve wetlands habitat. Land use decisions are mostly influenced by agricultural policies and urban planners. On the one hand, agricultural policies try to act as an economic stimulus (economic gain trumps) for crop production and cultivation expansion, which constitutes an encroachment on wetland areas. On the other hand, with the expansion of urbanization around wetlands, many people now live in and around wetlands and rely on their resources for their livelihoods. Moreover, wetlands near urban centers are under increasing developmental pressure for residential purposes. Accordingly, educating the community about the importance and benefits of wetlands and encouraging volunteer monitoring programs are perhaps the best ways to protect them. Indeed, developing community advocacy that is persistent, watchful, and active to empower communities to be more active stewards of wetlands would be wise to preserve wetlands. Doing so could minimize the adverse/negative effects of agricultural activities and urban expansion on neighboring and adjacent wetlands. As a consequence, decisions by local communities are critical to the successful sustainable management of wetlands.
- (2)
- The use of state-of-the-art DL models combined with GEE has the potential to make substantial progress toward wetland status monitoring, which has remained undocumented in the literature. Utilizing such a system would allow a large area of wetlands, whether globally or nationally, to be studied for automatic and efficient monitoring, thereby minimizing human involvement in data processing and enhancing the accuracy of monitoring results. Therefore, intelligent monitoring and assessment of wetland status are essential for wetland management and strategy formulation.
- (3)
- Based on Figure 19c, SAR images show high potential for wetland monitoring. The recent deployment of SAR systems in RS, such as in the RADARSAT Constellation Mission (RCM), has resulted in a number of new applications [188]. This mission is a continuation of RADARSAT-1 and RADARSAT-2 and is conducted by the Canadian Space Agency (CSA) under the RADARSAT project. It offers a variety of imaging modes from 100 m low resolution to high 3 m resolution [188,189]. As noted before, the primary advantage of SAR is that it provides repeatable data acquisition while being relatively unaffected by atmospheric effects, making it a reliable data acquisition technology. In the ongoing efforts to inventory wetlands and monitor their changes, RCM is expected to provide an essential source of C-band SAR data. Although the RCM is a Canadian commercial mission, given the high number of papers affiliated with Canadian researchers, it is somewhat strange that the RCM compact polarimetry data have not yet attracted the interest of wetland researchers. This is partly due to the lack of a suitable standard coverage, but one has been added by the CSA to improve the availability of suitable data. This study highly recommends the employment of promising new technologies and data for future wetland inventory and monitoring, including the upcoming NISAR mission.
5. Conclusions
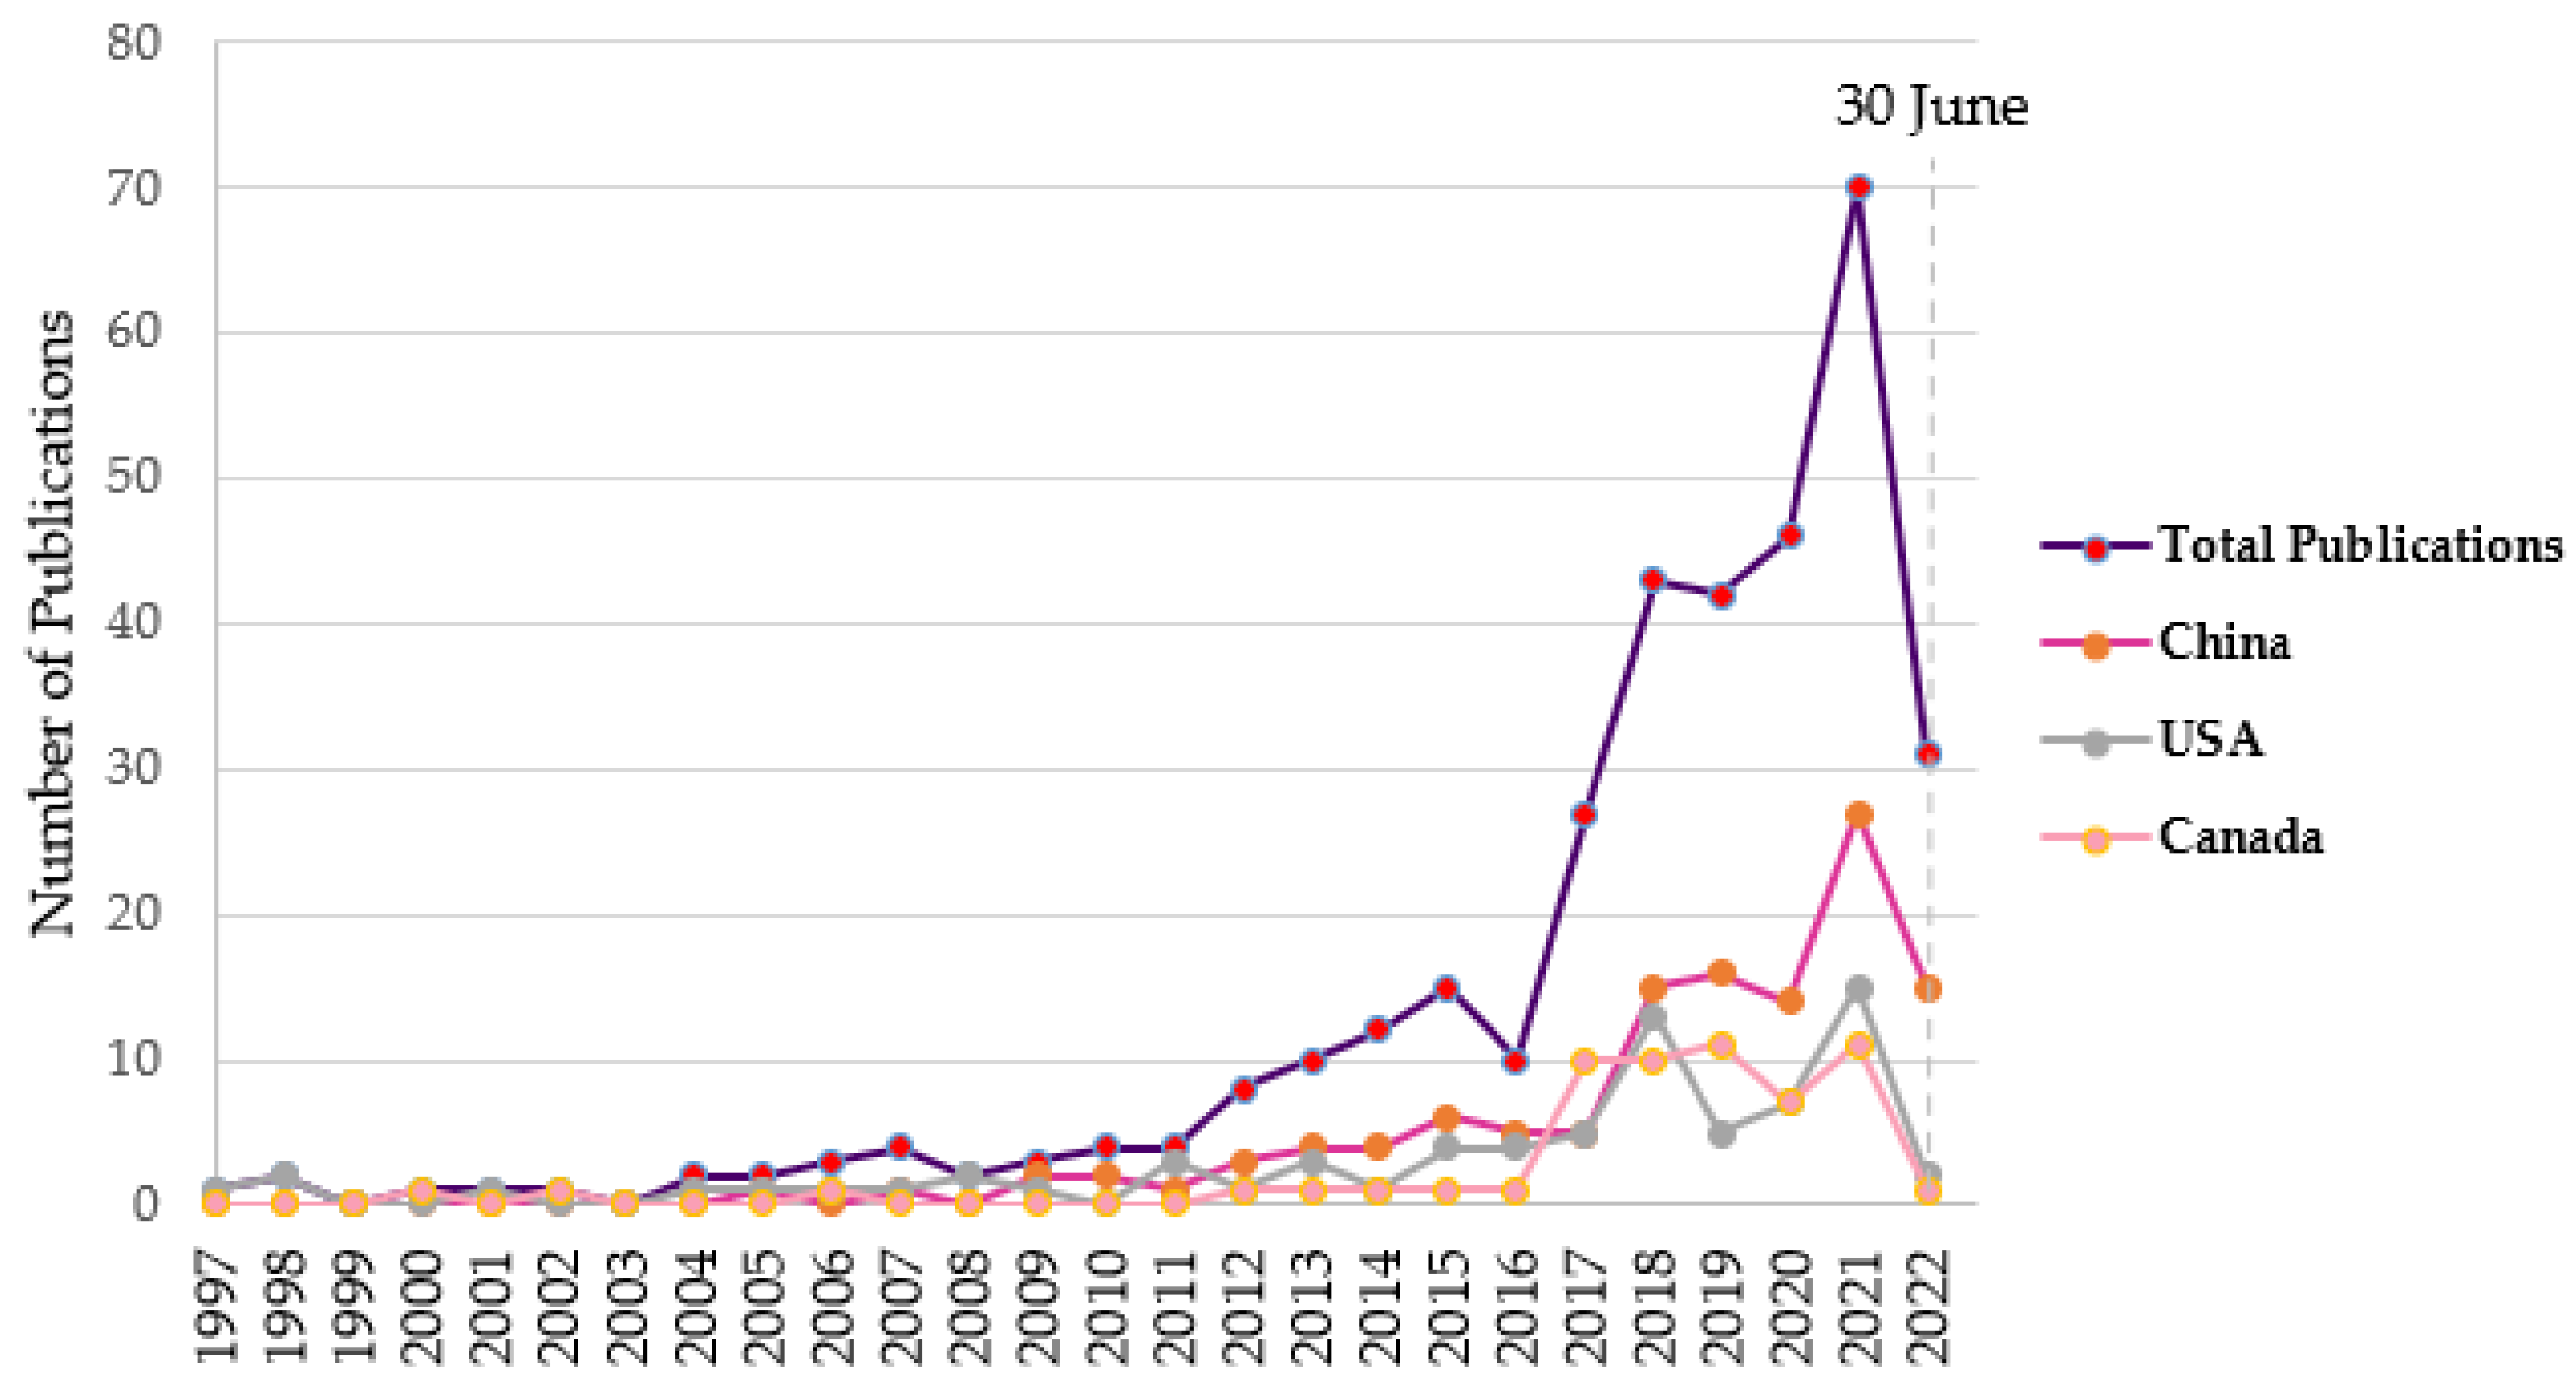
- A total of 88 journals have published the papers summarized in the present meta-analysis (with a share of 89%). The papers from the IGARSS conference, as well as a few from other international conference proceedings, were also included. About 67% of these publications were published between 2018 and 2022.
- More than half (51%) of the reviewed publications investigated wetlands from the perspective of classifying wetland zones, while 14% analyzed the changes within the wetlands. Wetland vegetation mapping and wetland extent recognition are in third and fourth places, with a share of 12% and 7% among all reviewed papers.
- Over 70% of the research studies have been conducted in China, the USA, and Canada, illustrating the need for wider international efforts to be undertaken in other countries in order to have consistent monitoring of wetlands across the globe. Over the past few years, the number of wetland studies has increased. In light of the increase in quality RS data availability, the launch of new RS platforms, as well as increased computing capabilities, and the growing interest in wetlands as part of climate change research, it is likely that this trend will continue.
- Slightly more than three-quarters of the studies have been conducted at areas with very small and local scales, whereas a few national-scale research papers have been published. More large-scale (e.g., continental-scale) studies are likely to be conducted as the number of satellites continues to increase and data become more widely available. The very recent ability of GEE to apply DL models has also opened up new possibilities for large-scale wetland classification research.
- The largest number of studies have been conducted on optical sensors using the Landsat archive (with 201 studies) and Sentinel-2 (with 54 studies), while SAR-based studies mostly employed data from Sentinel-1 (with 45 studies) and RADARSAT-2 (with 31 studies) missions. This is likely partially due to the relatively long history of these datasets and low/no cost availability.
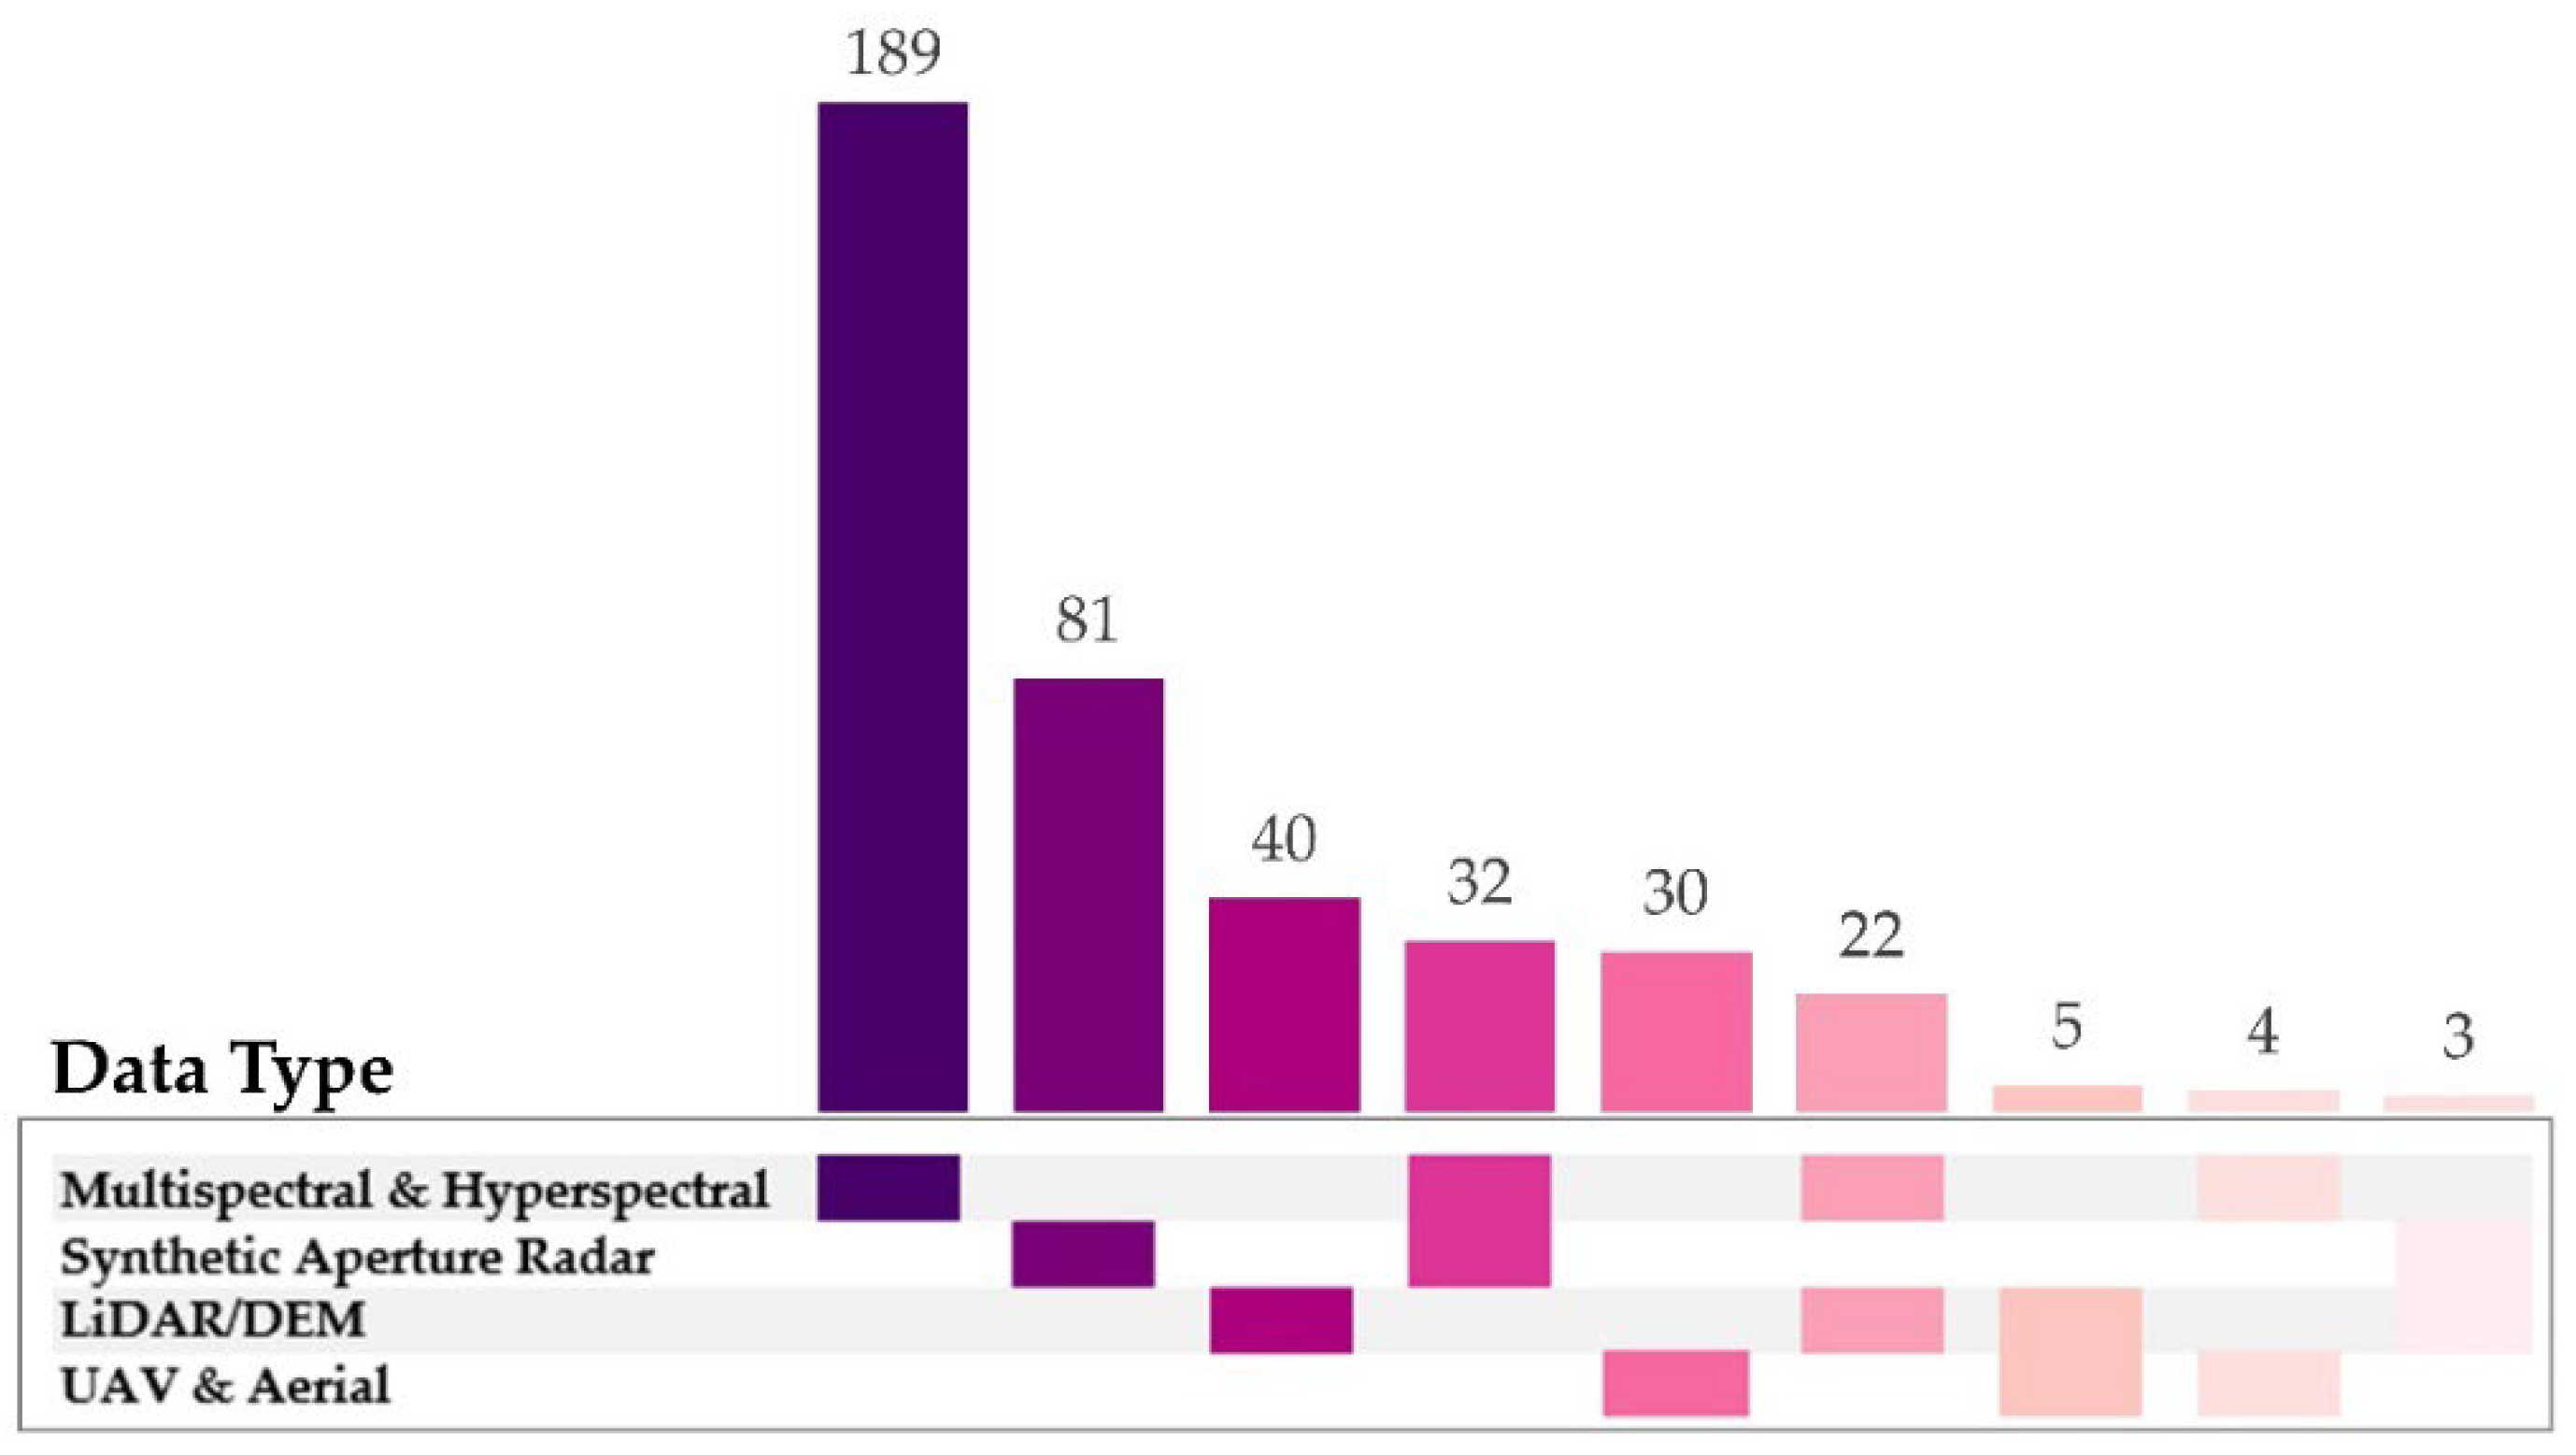
- Reviewed studies indicated that optical images had most often been used in the wetland monitoring tasks with 247 studies, followed by SAR datasets with 116 studies. A fusion of data types, including optical and SAR data, increases overall accuracy compared to each data type separately.
- A review of the published literature from the methodological viewpoint found that 152 studies adopted ensemble learning methods, 70 employed DT-based methods, and 68 utilized kernel-based methods. Further, among different classification approaches, CNN as a DL model, as well as RF as a ML model are the most successful classifiers for wetland mapping.
- As expected, spatial resolution was highly correlated with the overall accuracy of the wetland classification. This shows that wetland mapping may be improved by high/medium resolution RS imagery, at least until some minimum resolution threshold is reached.
- In comparison to pixel-based and unsupervised methods, object-based and supervised methods were mostly preferred for mapping and delineating wetlands owing to their simplicity and higher accuracy. On a national or continental scale, however, employing object-based analysis can be challenging.
Author Contributions
Funding
Data Availability Statement
Acknowledgments
Conflicts of Interest
Abbreviations
| RS | Remote sensing |
| ML | Machine learning |
| DL | Deep learning |
| CNN | Convolutional neural network |
| CD | Change detection |
| RF | Random forest |
| DT | Decision tree |
| SVM | Support vector machine |
| GEE | Google Earth Engine |
| CSA | Canadian Space Agency |
| RCM | RADARSAT Constellation Mission |
| LULC | Land use and land cover |
| SAR | synthetic aperture radar |
References
- Paul, S.; Pal, S. Predicting Wetland Area and Water Depth of Ganges Moribund Deltaic Parts of India. Remote Sens. Appl. Soc. Environ. 2020, 19, 100338. [Google Scholar] [CrossRef]
- Berhane, T.M.; Lane, C.R.; Wu, Q.; Autrey, B.C.; Anenkhonov, O.A.; Chepinoga, V.V.; Liu, H. Decision-Tree, Rule-Based, and Random Forest Classification of High-Resolution Multispectral Imagery for Wetland Mapping and Inventory. Remote Sens. 2018, 10, 580. [Google Scholar] [CrossRef]
- Mohammadimanesh, F.; Salehi, B.; Mahdianpari, M.; Motagh, M.; Brisco, B. An Efficient Feature Optimization for Wetland Mapping by Synergistic Use of SAR Intensity, Interferometry, and Polarimetry Data. Int. J. Appl. Earth Obs. Geoinf. 2018, 73, 450–462. [Google Scholar] [CrossRef]
- Mitra, S.; Wassmann, R.; Vlek, P.L.G. An Appraisal of Global Wetland Area and Its Organic Carbon Stock. Curr. Sci. 2005, 88, 25–35. [Google Scholar]
- Meng, X.; Zhang, S.; Zang, S. Lake Wetland Classification Based on an SVM-CNN Composite Classifier and High-Resolution Images Using Wudalianchi as an Example. J. Coast. Res. 2019, 93, 153–162. [Google Scholar] [CrossRef]
- Mahdianpari, M.; Jafarzadeh, H.; Granger, J.E.; Mohammadimanesh, F.; Brisco, B.; Salehi, B.; Homayouni, S.; Weng, Q. Monitoring of 30 Years Wetland Changes in Newfoundland, Canada. In Proceedings of the 2021 IEEE International Geoscience and Remote Sensing Symposium IGARSS, Brussels, Belgium, 11–16 July 2021; pp. 88–91. [Google Scholar]
- Mahdianpari, M.; Jafarzadeh, H.; Granger, J.E.; Mohammadimanesh, F.; Brisco, B.; Salehi, B.; Homayouni, S.; Weng, Q. A Large-Scale Change Monitoring of Wetlands Using Time Series Landsat Imagery on Google Earth Engine: A Case Study in Newfoundland. GIScience Remote Sens. 2020, 57, 1102–1124. [Google Scholar] [CrossRef]
- Cui, L.; Zuo, X.; Dou, Z.; Huang, Y.; Zhao, X.; Zhai, X.; Lei, Y.; Li, J.; Pan, X.; Li, W. Plant Identification of Beijing Hanshiqiao Wetland Based on Hyperspectral Data. Spectrosc. Lett. 2021, 54, 381–394. [Google Scholar] [CrossRef]
- Ghosh, S.; Dinda, S.; Chatterjee, N.D.; Das, K. Analyzing Risk Factors for Shrinkage and Transformation of East Kolkata Wetland, India. Spat. Inf. Res. 2018, 26, 661–677. [Google Scholar] [CrossRef]
- Guo, H.; Cai, Y.; Yang, Z.; Zhu, Z.; Ouyang, Y. Dynamic Simulation of Coastal Wetlands for Guangdong-Hong Kong-Macao Greater Bay Area Based on Multi-Temporal Landsat Images and FLUS Model. Ecol. Indic. 2021, 125, 107559. [Google Scholar] [CrossRef]
- Mahdavi, S.; Salehi, B.; Granger, J.; Amani, M.; Brisco, B.; Huang, W. Remote Sensing for Wetland Classification: A Comprehensive Review. GIScience Remote Sens. 2018, 55, 623–658. [Google Scholar] [CrossRef]
- Guo, M.; Li, J.; Sheng, C.; Xu, J.; Wu, L. A Review of Wetland Remote Sensing. Sensors 2017, 17, 777. [Google Scholar] [CrossRef] [PubMed]
- Mahdianpari, M.; Granger, J.E.; Mohammadimanesh, F.; Salehi, B.; Brisco, B.; Homayouni, S.; Gill, E.; Huberty, B.; Lang, M. Meta-Analysis of Wetland Classification Using Remote Sensing: A Systematic Review of a 40-Year Trend in North America. Remote Sens. 2020, 12, 1882. [Google Scholar] [CrossRef]
- Dang, K.B.; Nguyen, M.H.; Nguyen, D.A.; Phan, T.T.H.; Giang, T.L.; Pham, H.H.; Nguyen, T.N.; Tran, T.T.V.; Bui, D.T. Coastal Wetland Classification with Deep U-Net Convolutional Networks and Sentinel-2 Imagery: A Case Study at the Tien Yen Estuary of Vietnam. Remote Sens. 2020, 12, 3270. [Google Scholar] [CrossRef]
- Romshoo, S.A.; Rashid, I. Assessing the Impacts of Changing Land Cover and Climate on Hokersar Wetland in Indian Himalayas. Arab. J. Geosci. 2014, 7, 143–160. [Google Scholar] [CrossRef]
- Davranche, A.; Lefebvre, G.; Poulin, B. Wetland Monitoring Using Classification Trees and SPOT-5 Seasonal Time Series. Remote Sens. Environ. 2010, 114, 552–562. [Google Scholar] [CrossRef]
- Rebelo, L.-M.; Finlayson, C.M.; Nagabhatla, N. Remote Sensing and GIS for Wetland Inventory, Mapping and Change Analysis. J. Environ. Manag. 2009, 90, 2144–2153. [Google Scholar] [CrossRef]
- Felton, B.R.; O’Neil, G.L.; Robertson, M.-M.; Fitch, G.M.; Goodall, J.L. Using Random Forest Classification and Nationally Available Geospatial Data to Screen for Wetlands over Large Geographic Regions. Water 2019, 11, 1158. [Google Scholar] [CrossRef]
- Wu, Q.; Lane, C.R.; Li, X.; Zhao, K.; Zhou, Y.; Clinton, N.; DeVries, B.; Golden, H.E.; Lang, M.W. Integrating LiDAR Data and Multi-Temporal Aerial Imagery to Map Wetland Inundation Dynamics Using Google Earth Engine. Remote Sens. Environ. 2019, 228, 1–13. [Google Scholar] [CrossRef]
- Berhane, T.M.; Lane, C.R.; Wu, Q.; Anenkhonov, O.A.; Chepinoga, V.V.; Autrey, B.C.; Liu, H. Comparing Pixel- and Object-Based Approaches in Effectively Classifying Wetland-Dominated Landscapes. Remote Sens. 2018, 10, 46. [Google Scholar] [CrossRef]
- Jafarzadeh, H.; Mahdianpari, M.; Gill, E.W. Wet-GC: A Novel Multimodel Graph Convolutional Approach for Wetland Classification Using Sentinel-1 and 2 Imagery with Limited Training Samples. IEEE J. Sel. Top. Appl. Earth Obs. Remote Sens. 2022, 15, 5303–5316. [Google Scholar] [CrossRef]
- Hird, J.N.; DeLancey, E.R.; McDermid, G.J.; Kariyeva, J. Google Earth Engine, Open-Access Satellite Data, and Machine Learning in Support of Large-Area Probabilistic Wetland Mapping. Remote Sens. 2017, 9, 1315. [Google Scholar] [CrossRef]
- DeLancey, E.R.; Kariyeva, J.; Cranston, J.; Brisco, B. Monitoring Hydro Temporal Variability in Alberta, Canada with Multi-Temporal Sentinel-1 SAR Data. Can. J. Remote Sens. 2018, 44, 1–10. [Google Scholar] [CrossRef]
- DeLancey, E.R.; Kariyeva, J.; Bried, J.T.; Hird, J.N. Large-Scale Probabilistic Identification of Boreal Peatlands Using Google Earth Engine, Open-Access Satellite Data, and Machine Learning. PLoS ONE 2019, 14, e0218165. [Google Scholar] [CrossRef] [PubMed]
- Wang, C.; Jia, M.; Chen, N.; Wang, W. Long-Term Surface Water Dynamics Analysis Based on Landsat Imagery and the Google Earth Engine Platform: A Case Study in the Middle Yangtze River Basin. Remote Sens. 2018, 10, 1635. [Google Scholar] [CrossRef]
- Gorelick, N.; Hancher, M.; Dixon, M.; Ilyushchenko, S.; Thau, D.; Moore, R. Google Earth Engine: Planetary-Scale Geospatial Analysis for Everyone. Remote Sens. Environ. 2017, 202, 18–27. [Google Scholar] [CrossRef]
- Czapiewski, S.; Szumińska, D. An Overview of Remote Sensing Data Applications in Peatland Research Based on Works from the Period 2010–2021. Land 2022, 11, 24. [Google Scholar] [CrossRef]
- Mirmazloumi, S.M.; Moghimi, A.; Ranjgar, B.; Mohseni, F.; Ghorbanian, A.; Ahmadi, S.A.; Amani, M.; Brisco, B. Status and Trends of Wetland Studies in Canada Using Remote Sensing Technology with a Focus on Wetland Classification: A Bibliographic Analysis. Remote Sens. 2021, 13, 4025. [Google Scholar] [CrossRef]
- Montgomery, J.; Mahoney, C.; Brisco, B.; Boychuk, L.; Cobbaert, D.; Hopkinson, C. Remote Sensing of Wetlands in the Prairie Pothole Region of North America. Remote Sens. 2021, 13, 3878. [Google Scholar] [CrossRef]
- Gxokwe, S.; Dube, T.; Mazvimavi, D. Multispectral Remote Sensing of Wetlands in Semi-Arid and Arid Areas: A Review on Applications, Challenges and Possible Future Research Directions. Remote Sens. 2020, 12, 4190. [Google Scholar] [CrossRef]
- Adeli, S.; Salehi, B.; Mahdianpari, M.; Quackenbush, L.J.; Brisco, B.; Tamiminia, H.; Shaw, S. Wetland Monitoring Using SAR Data: A Meta-Analysis and Comprehensive Review. Remote Sens. 2020, 12, 2190. [Google Scholar] [CrossRef]
- Chasmer, L.; Mahoney, C.; Millard, K.; Nelson, K.; Peters, D.; Merchant, M.; Hopkinson, C.; Brisco, B.; Niemann, O.; Montgomery, J.; et al. Remote Sensing of Boreal Wetlands 2: Methods for Evaluating Boreal Wetland Ecosystem State and Drivers of Change. Remote Sens. 2020, 12, 1321. [Google Scholar] [CrossRef]
- Chasmer, L.; Cobbaert, D.; Mahoney, C.; Millard, K.; Peters, D.; Devito, K.; Brisco, B.; Hopkinson, C.; Merchant, M.; Montgomery, J.; et al. Remote Sensing of Boreal Wetlands 1: Data Use for Policy and Management. Remote Sens. 2020, 12, 1320. [Google Scholar] [CrossRef]
- Minasny, B.; Berglund, Ö.; Connolly, J.; Hedley, C.; de Vries, F.; Gimona, A.; Kempen, B.; Kidd, D.; Lilja, H.; Malone, B.; et al. Digital Mapping of Peatlands—A Critical Review. Earth-Sci. Rev. 2019, 196, 102870. [Google Scholar] [CrossRef]
- Moher, D.; Liberati, A.; Tetzlaff, J.; Altman, D.G. Preferred Reporting Items for Systematic Reviews and Meta-Analyses: The PRISMA Statement. Ann. Intern. Med. 2009, 151, 264–269. [Google Scholar] [CrossRef] [PubMed]
- Jafarzadeh, H.; Mahdianpari, M.; Homayouni, S.; Mohammadimanesh, F.; Dabboor, M. Oil Spill Detection from Synthetic Aperture Radar Earth Observations: A Meta-Analysis and Comprehensive Review. GIScience Remote Sens. 2021, 58, 1022–1051. [Google Scholar] [CrossRef]
- Millard, K.; Richardson, M. On the Importance of Training Data Sample Selection in Random Forest Image Classification: A Case Study in Peatland Ecosystem Mapping. Remote Sens. 2015, 7, 8489–8515. [Google Scholar] [CrossRef]
- Dronova, I.; Gong, P.; Wang, L. Object-Based Analysis and Change Detection of Major Wetland Cover Types and Their Classification Uncertainty during the Low Water Period at Poyang Lake, China. Remote Sens. Environ. 2011, 115, 3220–3236. [Google Scholar] [CrossRef]
- Bwangoy, J.-R.B.; Hansen, M.C.; Roy, D.P.; Grandi, G.D.; Justice, C.O. Wetland Mapping in the Congo Basin Using Optical and Radar Remotely Sensed Data and Derived Topographical Indices. Remote Sens. Environ. 2010, 114, 73–86. [Google Scholar] [CrossRef]
- Baker, C.; Lawrence, R.; Montagne, C.; Patten, D. Mapping Wetlands and Riparian Areas Using Landsat ETM+ Imagery and Decision-Tree-Based Models. Wetlands 2006, 26, 465. [Google Scholar] [CrossRef]
- Mahdianpari, M.; Salehi, B.; Mohammadimanesh, F.; Motagh, M. Random Forest Wetland Classification Using ALOS-2 L-Band, RADARSAT-2 C-Band, and TerraSAR-X Imagery. ISPRS J. Photogramm. Remote Sens. 2017, 130, 13–31. [Google Scholar] [CrossRef]
- Han, X.; Chen, X.; Feng, L. Four Decades of Winter Wetland Changes in Poyang Lake Based on Landsat Observations between 1973 and 2013. Remote Sens. Environ. 2015, 156, 426–437. [Google Scholar] [CrossRef]
- van Beijma, S.; Comber, A.; Lamb, A. Random Forest Classification of Salt Marsh Vegetation Habitats Using Quad-Polarimetric Airborne SAR, Elevation and Optical RS Data. Remote Sens. Environ. 2014, 149, 118–129. [Google Scholar] [CrossRef]
- Liu, T.; Abd-Elrahman, A.; Morton, J.; Victor, L. Wilhelm Comparing Fully Convolutional Networks, Random Forest, Support Vector Machine, and Patch-Based Deep Convolutional Neural Networks for Object-Based Wetland Mapping Using Images from Small Unmanned Aircraft System. GIScience Remote Sens. 2018, 55, 243–264. [Google Scholar] [CrossRef]
- Corcoran, J.M.; Knight, J.F.; Gallant, A.L. Influence of Multi-Source and Multi-Temporal Remotely Sensed and Ancillary Data on the Accuracy of Random Forest Classification of Wetlands in Northern Minnesota. Remote Sens. 2013, 5, 3212–3238. [Google Scholar] [CrossRef]
- Mahdianpari, M.; Salehi, B.; Mohammadimanesh, F.; Homayouni, S.; Gill, E. The First Wetland Inventory Map of Newfoundland at a Spatial Resolution of 10 m Using Sentinel-1 and Sentinel-2 Data on the Google Earth Engine Cloud Computing Platform. Remote Sens. 2019, 11, 43. [Google Scholar] [CrossRef]
- Lin, Y.; Yu, J.; Cai, J.; Sneeuw, N.; Li, F. Spatio-Temporal Analysis of Wetland Changes Using a Kernel Extreme Learning Machine Approach. Remote Sens. 2018, 10, 1129. [Google Scholar] [CrossRef]
- Munishi, S.; Jewitt, G. Degradation of Kilombero Valley Ramsar Wetlands in Tanzania. Phys. Chem. Earth Parts A/B/C 2019, 112, 216–227. [Google Scholar] [CrossRef]
- Basu, T.; Das, A.; Pham, Q.B.; Al-Ansari, N.; Linh, N.T.T.; Lagerwall, G. Development of an Integrated Peri-Urban Wetland Degradation Assessment Approach for the Chatra Wetland in Eastern India. Sci. Rep. 2021, 11, 4470. [Google Scholar] [CrossRef]
- Chatziantoniou, A.; Psomiadis, E.; Petropoulos, G.P. Co-Orbital Sentinel 1 and 2 for LULC Mapping with Emphasis on Wetlands in a Mediterranean Setting Based on Machine Learning. Remote Sens. 2017, 9, 1259. [Google Scholar] [CrossRef]
- Slagter, B.; Tsendbazar, N.-E.; Vollrath, A.; Reiche, J. Mapping Wetland Characteristics Using Temporally Dense Sentinel-1 and Sentinel-2 Data: A Case Study in the St. Lucia Wetlands, South Africa. Int. J. Appl. Earth Obs. Geoinf. 2020, 86, 102009. [Google Scholar] [CrossRef]
- Yirsaw, E.; Wu, W.; Shi, X.; Temesgen, H.; Bekele, B. Land Use/Land Cover Change Modeling and the Prediction of Subsequent Changes in Ecosystem Service Values in a Coastal Area of China, the Su-Xi-Chang Region. Sustainability 2017, 9, 1204. [Google Scholar] [CrossRef]
- Hu, X.; Zhang, P.; Zhang, Q.; Wang, J. Improving Wetland Cover Classification Using Artificial Neural Networks with Ensemble Techniques. GIScience Remote Sens. 2021, 58, 603–623. [Google Scholar] [CrossRef]
- Kumar, L.; Sinha, P. Mapping Salt-Marsh Land-Cover Vegetation Using High-Spatial and Hyperspectral Satellite Data to Assist Wetland Inventory. GIScience Remote Sens. 2014, 51, 483–497. [Google Scholar] [CrossRef]
- Zhang, A.; Sun, G.; Ma, P.; Jia, X.; Ren, J.; Huang, H.; Zhang, X. Coastal Wetland Mapping with Sentinel-2 MSI Imagery Based on Gravitational Optimized Multilayer Perceptron and Morphological Attribute Profiles. Remote Sens. 2019, 11, 952. [Google Scholar] [CrossRef]
- Cheng, G.; Xie, X.; Han, J.; Guo, L.; Xia, G.-S. Remote Sensing Image Scene Classification Meets Deep Learning: Challenges, Methods, Benchmarks, and Opportunities. IEEE J. Sel. Top. Appl. Earth Obs. Remote Sens. 2020, 13, 3735–3756. [Google Scholar] [CrossRef]
- Turner, B.L.; Lambin, E.; Reenberg, A. The Emergence of Land Change Science for Global Environmental Change and Sustainability. Proc. Natl. Acad. Sci. USA 2007, 104, 20666. [Google Scholar] [CrossRef] [PubMed]
- Hussain, M.; Chen, D.; Cheng, A.; Wei, H.; Stanley, D. Change Detection from Remotely Sensed Images: From Pixel-Based to Object-Based Approaches. ISPRS J. Photogramm. Remote Sens. 2013, 80, 91–106. [Google Scholar] [CrossRef]
- Singh, A. Review Article Digital Change Detection Techniques Using Remotely-Sensed Data. Int. J. Remote Sens. 1989, 10, 989–1003. [Google Scholar] [CrossRef]
- Hu, T.; Liu, J.; Zheng, G.; Li, Y.; Xie, B. Quantitative Assessment of Urban Wetland Dynamics Using High Spatial Resolution Satellite Imagery between 2000 and 2013. Sci. Rep. 2018, 8, 7409. [Google Scholar] [CrossRef]
- Zhou, H.; Jiang, H.; Zhou, G.; Song, X.; Yu, S.; Chang, J.; Liu, S.; Jiang, Z.; Jiang, B. Monitoring the Change of Urban Wetland Using High Spatial Resolution Remote Sensing Data. Int. J. Remote Sens. 2010, 31, 1717–1731. [Google Scholar] [CrossRef]
- Yuan, F.; Sawaya, K.E.; Loeffelholz, B.C.; Bauer, M.E. Land Cover Classification and Change Analysis of the Twin Cities (Minnesota) Metropolitan Area by Multitemporal Landsat Remote Sensing. Remote Sens. Environ. 2005, 98, 317–328. [Google Scholar] [CrossRef]
- Lu, D.; Mausel, P.; Brondízio, E.; Moran, E. Change Detection Techniques. Int. J. Remote Sens. 2004, 25, 2365–2401. [Google Scholar] [CrossRef]
- Zhao, L.; Yang, J.; Li, P.; Zhang, L. Seasonal Inundation Monitoring and Vegetation Pattern Mapping of the Erguna Floodplain by Means of a RADARSAT-2 Fully Polarimetric Time Series. Remote Sens. Environ. 2014, 152, 426–440. [Google Scholar] [CrossRef]
- Boueshagh, M.; Hasanlou, M. Estimating Water Level in the Urmia Lake Using Satellite Data: A Machine Learning Approach. ISPRS -Int. Arch. Photogramm. Remote Sens. Spat. Inf. Sci. 2019, 4218, 219–226. [Google Scholar] [CrossRef]
- Na, X.; Zang, S.; Liu, L.; Li, M. Wetland Mapping in the Zhalong National Natural Reserve, China, Using Optical and Radar Imagery and Topographical Data. J. Appl. Remote Sens. 2013, 7, 073554. [Google Scholar] [CrossRef]
- Brown, E.; Aitkenhead, M.; Wright, R.; Aalders, I.H. Mapping and Classification of Peatland on the Isle of Lewis Using Landsat ETM+. Scott. Geogr. J. 2007, 123, 173–192. [Google Scholar] [CrossRef]
- Su, H.; Yao, W.; Wu, Z.; Zheng, P.; Du, Q. Kernel Low-Rank Representation with Elastic Net for China Coastal Wetland Land Cover Classification Using GF-5 Hyperspectral Imagery. ISPRS J. Photogramm. Remote Sens. 2021, 171, 238–252. [Google Scholar] [CrossRef]
- Zhang, X.; Xu, J.; Chen, Y.; Xu, K.; Wang, D. Coastal Wetland Classification with GF-3 Polarimetric SAR Imagery by Using Object-Oriented Random Forest Algorithm. Sensors 2021, 21, 3395. [Google Scholar] [CrossRef]
- Lang, M.W.; Kasischke, E.S. Using C-Band Synthetic Aperture Radar Data to Monitor Forested Wetland Hydrology in Maryland’s Coastal Plain, USA. IEEE Trans. Geosci. Remote Sens. 2008, 46, 535–546. [Google Scholar] [CrossRef]
- Rodrigues, S.W.P.; Souza-Filho, P.W.M. Use of Multi-Sensor Data to Identify and Map Tropical Coastal Wetlands in the Amazon of Northern Brazil. Wetlands 2011, 31, 11–23. [Google Scholar] [CrossRef]
- Merchant, M.A.; Adams, J.R.; Berg, A.A.; Baltzer, J.L.; Quinton, W.L.; Chasmer, L.E. Contributions of C-Band SAR Data and Polarimetric Decompositions to Subarctic Boreal Peatland Mapping. IEEE J. Sel. Top. Appl. Earth Obs. Remote Sens. 2017, 10, 1467–1482. [Google Scholar] [CrossRef]
- White, L.; Millard, K.; Banks, S.; Richardson, M.; Pasher, J.; Duffe, J. Moving to the RADARSAT Constellation Mission: Comparing Synthesized Compact Polarimetry and Dual Polarimetry Data with Fully Polarimetric RADARSAT-2 Data for Image Classification of Peatlands. Remote Sens. 2017, 9, 573. [Google Scholar] [CrossRef]
- White, L.; Brisco, B.; Dabboor, M.; Schmitt, A.; Pratt, A. A Collection of SAR Methodologies for Monitoring Wetlands. Remote Sens. 2015, 7, 7615–7645. [Google Scholar] [CrossRef]
- Chasmer, L.; Hopkinson, C.; Veness, T.; Quinton, W.; Baltzer, J. A Decision-Tree Classification for Low-Lying Complex Land Cover Types within the Zone of Discontinuous Permafrost. Remote Sens. Environ. 2014, 143, 73–84. [Google Scholar] [CrossRef]
- Jafarzadeh, H.; Mahdianpari, M.; Gill, E. Meta-Learning for Wetland Classification Using a Combination of Sentinel-1 and Sentinel-2 Imagery. ISPRS Ann. Photogramm. Remote Sens. Spat. Inf. Sci. 2022, V-3–2022, 47–52. [Google Scholar] [CrossRef]
- Hosseiny, B.; Mahdianpari, M.; Brisco, B.; Mohammadimanesh, F.; Salehi, B. WetNet: A Spatial–Temporal Ensemble Deep Learning Model for Wetland Classification Using Sentinel-1 and Sentinel-2. IEEE Trans. Geosci. Remote Sens. 2022, 60, 1–14. [Google Scholar] [CrossRef]
- Millard, K.; Richardson, M. Wetland Mapping with LiDAR Derivatives, SAR Polarimetric Decompositions, and LiDAR–SAR Fusion Using a Random Forest Classifier. Can. J. Remote Sens. 2013, 39, 290–307. [Google Scholar] [CrossRef]
- Rapinel, S.; Bouzillé, J.-B.; Oszwald, J.; Bonis, A. Use of Bi-Seasonal Landsat-8 Imagery for Mapping Marshland Plant Community Combinations at the Regional Scale. Wetlands 2015, 35, 1043–1054. [Google Scholar] [CrossRef]
- Kaplan, G.; Avdan, U. Monthly Analysis of Wetlands Dynamics Using Remote Sensing Data. ISPRS Int. J. Geo-Inf. 2018, 7, 411. [Google Scholar] [CrossRef]
- Muñoz, D.F.; Muñoz, P.; Alipour, A.; Moftakhari, H.; Moradkhani, H.; Mortazavi, B. Fusing Multisource Data to Estimate the Effects of Urbanization, Sea Level Rise, and Hurricane Impacts on Long-Term Wetland Change Dynamics. IEEE J. Sel. Top. Appl. Earth Obs. Remote Sens. 2021, 14, 1768–1782. [Google Scholar] [CrossRef]
- Judah, A.; Hu, B. The Integration of Multi-Source Remotely-Sensed Data in Support of the Classification of Wetlands. Remote Sens. 2019, 11, 1537. [Google Scholar] [CrossRef]
- Rapinel, S.; Hubert-Moy, L.; Clément, B. Combined Use of LiDAR Data and Multispectral Earth Observation Imagery for Wetland Habitat Mapping. Int. J. Appl. Earth Obs. Geoinf. 2015, 37, 56–64. [Google Scholar] [CrossRef]
- Jahncke, R.; Leblon, B.; Bush, P.; LaRocque, A. Mapping Wetlands in Nova Scotia with Multi-Beam RADARSAT-2 Polarimetric SAR, Optical Satellite Imagery, and Lidar Data. Int. J. Appl. Earth Obs. Geoinf. 2018, 68, 139–156. [Google Scholar] [CrossRef]
- Gilmore, M.S.; Wilson, E.H.; Barrett, N.; Civco, D.L.; Prisloe, S.; Hurd, J.D.; Chadwick, C. Integrating Multi-Temporal Spectral and Structural Information to Map Wetland Vegetation in a Lower Connecticut River Tidal Marsh. Remote Sens. Environ. 2008, 112, 4048–4060. [Google Scholar] [CrossRef]
- Araya-López, R.A.; Lopatin, J.; Fassnacht, F.E.; Hernández, H.J. Monitoring Andean High Altitude Wetlands in Central Chile with Seasonal Optical Data: A Comparison between Worldview-2 and Sentinel-2 Imagery. ISPRS J. Photogramm. Remote Sens. 2018, 145, 213–224. [Google Scholar] [CrossRef]
- Cao, M.; Liu, G.; Zhang, X. An Object-Oriented Approach to Map Wetland Vegetation:A Case Study of Yellow River Delta. In Proceedings of the 2007 IEEE International Geoscience and Remote Sensing Symposium, Barcelona, Spain, 23–27 July 2007; pp. 4585–4587. [Google Scholar]
- Mallick, J.; Talukdar, S.; Shahfahad; Pal, S.; Rahman, A. A Novel Classifier for Improving Wetland Mapping by Integrating Image Fusion Techniques and Ensemble Machine Learning Classifiers. Ecol. Inform. 2021, 65, 101426. [Google Scholar] [CrossRef]
- Hakdaoui, S.; Emran, A.; Pradhan, B.; Lee, C.-W.; Nguemhe Fils, S.C. A Collaborative Change Detection Approach on Multi-Sensor Spatial Imagery for Desert Wetland Monitoring after a Flash Flood in Southern Morocco. Remote Sens. 2019, 11, 1042. [Google Scholar] [CrossRef]
- Pan, H. A Feature Sequence-Based 3D Convolutional Method for Wetland Classification from Multispectral Images. Remote Sens. Lett. 2020, 11, 837–846. [Google Scholar] [CrossRef]
- Tahsin, S.; Medeiros, S.C.; Singh, A. Consistent Long-Term Monthly Coastal Wetland Vegetation Monitoring Using a Virtual Satellite Constellation. Remote Sens. 2021, 13, 438. [Google Scholar] [CrossRef]
- Berberoglu, S.; Yilmaz, K.T.; Özkan, C. Mapping and Monitoring of Coastal Wetlands of Çukurova Delta in the Eastern Mediterranean Region. Biodivers. Conserv. 2004, 13, 615–633. [Google Scholar] [CrossRef]
- Pouliot, D.; Latifovic, R.; Pasher, J.; Duffe, J. Assessment of Convolution Neural Networks for Wetland Mapping with Landsat in the Central Canadian Boreal Forest Region. Remote Sens. 2019, 11, 772. [Google Scholar] [CrossRef]
- Gxokwe, S.; Dube, T.; Mazvimavi, D. Leveraging Google Earth Engine Platform to Characterize and Map Small Seasonal Wetlands in the Semi-Arid Environments of South Africa. Sci. Total Environ. 2022, 803, 150139. [Google Scholar] [CrossRef] [PubMed]
- Gao, Y.; Li, W.; Zhang, M.; Wang, J.; Sun, W.; Tao, R.; Du, Q. Hyperspectral and Multispectral Classification for Coastal Wetland Using Depthwise Feature Interaction Network. IEEE Trans. Geosci. Remote Sens. 2022, 60, 1–15. [Google Scholar] [CrossRef]
- DeLancey, E.R.; Simms, J.F.; Mahdianpari, M.; Brisco, B.; Mahoney, C.; Kariyeva, J. Comparing Deep Learning and Shallow Learning for Large-Scale Wetland Classification in Alberta, Canada. Remote Sens. 2020, 12, 2. [Google Scholar] [CrossRef]
- Sahour, H.; Kemink, K.M.; O’Connell, J. Integrating SAR and Optical Remote Sensing for Conservation-Targeted Wetlands Mapping. Remote Sens. 2022, 14, 159. [Google Scholar] [CrossRef]
- Wen, L.; Hughes, M. Coastal Wetland Mapping Using Ensemble Learning Algorithms: A Comparative Study of Bagging, Boosting and Stacking Techniques. Remote Sens. 2020, 12, 1683. [Google Scholar] [CrossRef]
- Mahdianpari, M.; Brisco, B.; Granger, E.; Mohammadimanesh, F.; Salehi, B.; Banks, S.; Homayouni, S.; Bourgeau-Chavez, L.; Weng, Q. The Second Generation Canadian Wetland Inventory Map at 10 Meters Resolution Using Google Earth Engine. Can. J. Remote Sens. 2020, 46, 360–375. [Google Scholar] [CrossRef]
- Frohn, R.C.; Autrey, B.C.; Lane, C.R.; Reif, M. Segmentation and Object-Oriented Classification of Wetlands in a Karst Florida Landscape Using Multi-Season Landsat-7 ETM+ Imagery. Int. J. Remote Sens. 2011, 32, 1471–1489. [Google Scholar] [CrossRef]
- Doyle, C.; Beach, T.; Luzzadder-Beach, S. Tropical Forest and Wetland Losses and the Role of Protected Areas in Northwestern Belize, Revealed from Landsat and Machine Learning. Remote Sens. 2021, 13, 379. [Google Scholar] [CrossRef]
- Ehsani, A.H.; Shakeryari, M. Monitoring of Wetland Changes Affected by Drought Using Four Landsat Satellite Data and Fuzzy ARTMAP Classification Method (Case Study Hamoun Wetland, Iran). Arab. J. Geosci. 2021, 14, 1363. [Google Scholar] [CrossRef]
- Liu, Y.; Jin, R.; Zhu, W. Conversion of Natural Wetland to Farmland in the Tumen River Basin: Human and Environmental Factors. Remote Sens. 2021, 13, 3498. [Google Scholar] [CrossRef]
- Mahdianpari, M.; Rezaee, M.; Zhang, Y.; Salehi, B. Wetland Classification Using Deep Convolutional Neural Network. In Proceedings of the IGARSS 2018—2018 IEEE International Geoscience and Remote Sensing Symposium, Valencia, Spain, 22–27 July 2018; pp. 9249–9252. [Google Scholar]
- Rezaee, M.; Mahdianpari, M.; Zhang, Y.; Salehi, B. Deep Convolutional Neural Network for Complex Wetland Classification Using Optical Remote Sensing Imagery. IEEE J. Sel. Top. Appl. Earth Obs. Remote Sens. 2018, 11, 3030–3039. [Google Scholar] [CrossRef]
- Mahdianpari, M.; Salehi, B.; Mohammadimanesh, F.; Brisco, B.; Mahdavi, S.; Amani, M.; Granger, J.E. Fisher Linear Discriminant Analysis of Coherency Matrix for Wetland Classification Using PolSAR Imagery. Remote Sens. Environ. 2018, 206, 300–317. [Google Scholar] [CrossRef]
- Jiang, J.; Li, A.; Deng, W.; Bian, J. Construction of a New Classifier Integrated Multiple Sources and Multi-Temporal Remote Sensing Data for Wetlands. Procedia Environ. Sci. 2010, 2, 302–314. [Google Scholar] [CrossRef][Green Version]
- Zarei, M.; Tazeh, M.; Moosavi, V.; Kalantari, S. Investigating the Capability of Thermal-Moisture Indices Extracted from MODIS Data in Classification and Trend in Wetlands. J. Indian Soc. Remote Sens. 2021, 49, 2583–2596. [Google Scholar] [CrossRef]
- Chen, L.; Jin, Z.; Michishita, R.; Cai, J.; Yue, T.; Chen, B.; Xu, B. Dynamic Monitoring of Wetland Cover Changes Using Time-Series Remote Sensing Imagery. Ecol. Inform. 2014, 24, 17–26. [Google Scholar] [CrossRef]
- Tana, G.; Letu, H.; Cheng, Z.; Tateishi, R. Wetlands Mapping in North America by Decision Rule Classification Using MODIS and Ancillary Data. IEEE J. Sel. Top. Appl. Earth Obs. Remote Sens. 2013, 6, 2391–2401. [Google Scholar] [CrossRef]
- Jing, L.; Zhou, Y.; Zeng, Q.; Liu, S.; Lei, G.; Lu, C.; Wen, L. Exploring Wetland Dynamics in Large River Floodplain Systems with Unsupervised Machine Learning: A Case Study of the Dongting Lake, China. Remote Sens. 2020, 12, 2995. [Google Scholar] [CrossRef]
- Rupasinghe, P.A.; Chow-Fraser, P. Mapping Phragmites Cover Using WorldView 2/3 and Sentinel 2 Images at Lake Erie Wetlands, Canada. Biol. Invasions 2021, 23, 1231–1247. [Google Scholar] [CrossRef]
- Kumar, L.; Sinha, P.; Taylor, S. Improving Image Classification in a Complex Wetland Ecosystem through Image Fusion Techniques. J. Appl. Remote Sens. 2014, 8, 083616. [Google Scholar] [CrossRef]
- Laba, M.; Downs, R.; Smith, S.; Welsh, S.; Neider, C.; White, S.; Richmond, M.; Philpot, W.; Baveye, P. Mapping Invasive Wetland Plants in the Hudson River National Estuarine Research Reserve Using Quickbird Satellite Imagery. Remote Sens. Environ. 2008, 112, 286–300. [Google Scholar] [CrossRef]
- Xiao, J.; Xiao, Y.; Sun, X.; Huang, J.; Wang, H. Land Cover Classification of Huixian Wetland Based on SAR and Optical Image Fusion. In Proceedings of the 2020 IEEE 3rd International Conference on Information Communication and Signal Processing (ICICSP), Shanghai, China, 12–15 September 2020; pp. 316–320. [Google Scholar]
- Wu, N.; Shi, R.; Zhuo, W.; Zhang, C.; Tao, Z. Identification of Native and Invasive Vegetation Communities in a Tidal Flat Wetland Using Gaofen-1 Imagery. Wetlands 2021, 41, 46. [Google Scholar] [CrossRef]
- Sun, N.; Zhu, W.; Cheng, Q. GF-1 and Landsat Observed a 40-Year Wetland Spatiotemporal Variation and Its Coupled Environmental Factors in Yangtze River Estuary. Estuar. Coast. Shelf Sci. 2018, 207, 30–39. [Google Scholar] [CrossRef]
- Amani, M.; Salehi, B.; Mahdavi, S.; Brisco, B. Spectral Analysis of Wetlands Using Multi-Source Optical Satellite Imagery. ISPRS J. Photogramm. Remote Sens. 2018, 144, 119–136. [Google Scholar] [CrossRef]
- Novresiandi, D.A.; Nagasawa, R. Polarimetric Synthetic Aperture Radar Application for Tropical Peatlands Classification: A Case Study in Siak River Transect, Riau Province, Indonesia. J. Appl. Remote Sens. 2017, 11, 016040. [Google Scholar] [CrossRef]
- Liu, C.; Tao, R.; Li, W.; Zhang, M.; Sun, W.; Du, Q. Joint Classification of Hyperspectral and Multispectral Images for Mapping Coastal Wetlands. IEEE J. Sel. Top. Appl. Earth Obs. Remote Sens. 2021, 14, 982–996. [Google Scholar] [CrossRef]
- Niculescu, S.; Boissonnat, J.-B.; Lardeux, C.; Roberts, D.; Hanganu, J.; Billey, A.; Constantinescu, A.; Doroftei, M. Synergy of High-Resolution Radar and Optical Images Satellite for Identification and Mapping of Wetland Macrophytes on the Danube Delta. Remote Sens. 2020, 12, 2188. [Google Scholar] [CrossRef]
- Amoakoh, A.O.; Aplin, P.; Awuah, K.T.; Delgado-Fernandez, I.; Moses, C.; Alonso, C.P.; Kankam, S.; Mensah, J.C. Testing the Contribution of Multi-Source Remote Sensing Features for Random Forest Classification of the Greater Amanzule Tropical Peatland. Sensors 2021, 21, 3399. [Google Scholar] [CrossRef]
- Corcoran, J.; Knight, J.; Brisco, B.; Kaya, S.; Cull, A.; Murnaghan, K. The Integration of Optical, Topographic, and Radar Data for Wetland Mapping in Northern Minnesota. Can. J. Remote Sens. 2011, 37, 564–582. [Google Scholar] [CrossRef]
- Mohammadimanesh, F.; Salehi, B.; Mahdianpari, M.; Brisco, B.; Motagh, M. Multi-Temporal, Multi-Frequency, and Multi-Polarization Coherence and SAR Backscatter Analysis of Wetlands. ISPRS J. Photogramm. Remote Sens. 2018, 142, 78–93. [Google Scholar] [CrossRef]
- Chen, Y.; He, X.; Xu, J.; Zhang, R.; Lu, Y. Scattering Feature Set Optimization and Polarimetric SAR Classification Using Object-Oriented RF-SFS Algorithm in Coastal Wetlands. Remote Sens. 2020, 12, 407. [Google Scholar] [CrossRef]
- Bourgeau-Chavez, L.L.; Endres, S.; Powell, R.; Battaglia, M.J.; Benscoter, B.; Turetsky, M.; Kasischke, E.S.; Banda, E. Mapping Boreal Peatland Ecosystem Types from Multitemporal Radar and Optical Satellite Imagery. Can. J. For. Res. 2017, 47, 545–559. [Google Scholar] [CrossRef]
- Mahdianpari, M.; Brisco, B.; Granger, J.; Mohammadimanesh, F.; Salehi, B.; Homayouni, S.; Bourgeau-Chavez, L. The Third Generation of Pan-Canadian Wetland Map at 10 m Resolution Using Multisource Earth Observation Data on Cloud Computing Platform. IEEE J. Sel. Top. Appl. Earth Obs. Remote Sens. 2021, 14, 8789–8803. [Google Scholar] [CrossRef]
- San Martín, L.; Morandeira, N.S.; Grimson, R.; Rajngewerc, M.; González, E.B.; Kandus, P. The Contribution of ALOS/PALSAR-1 Multi-Temporal Data to Map Permanently and Temporarily Flooded Coastal Wetlands. Int. J. Remote Sens. 2020, 41, 1582–1602. [Google Scholar] [CrossRef]
- Zhang, M.; Chen, F.; Tian, B.; Liang, D. Multi-Temporal SAR Image Classification of Coastal Plain Wetlands Using a New Feature Selection Method and Random Forests. Remote Sens. Lett. 2019, 10, 312–321. [Google Scholar] [CrossRef]
- Betbeder, J.; Rapinel, S.; Corpetti, T.; Pottier, E.; Corgne, S.; Hubert-Moy, L. Multitemporal Classification of TerraSAR-X Data for Wetland Vegetation Mapping. J. Appl. Remote Sens. 2014, 8, 083648. [Google Scholar] [CrossRef]
- Na, X.; Zang, S.; Zhang, Y.; Liu, L. Wetland Mapping and Flood Extent Monitoring Using Optical and Radar Remotely Sensed Data and Ancillary Topographical Data in the Zhalong National Natural Reserve, China. In Proceedings of the Earth Resources and Environmental Remote Sensing/GIS Applications IV, Dresden, Germany, 23–25 September 2013; SPIE: Breda, The Netherlands, 2013; Volume 8893, pp. 390–396. [Google Scholar]
- Xu, P.; Niu, Z.; Tang, P. Comparison and Assessment of NDVI Time Series for Seasonal Wetland Classification. Int. J. Digit. Earth 2018, 11, 1103–1131. [Google Scholar] [CrossRef]
- Cai, Y.; Li, X.; Zhang, M.; Lin, H. Mapping Wetland Using the Object-Based Stacked Generalization Method Based on Multi-Temporal Optical and SAR Data. Int. J. Appl. Earth Obs. Geoinf. 2020, 92, 102164. [Google Scholar] [CrossRef]
- Liu, Q.; Zhang, Y.; Liu, L.; Wang, Z.; Nie, Y.; Rai, M.K. A Novel Landsat-Based Automated Mapping of Marsh Wetland in the Headwaters of the Brahmaputra, Ganges and Indus Rivers, Southwestern Tibetan Plateau. Int. J. Appl. Earth Obs. Geoinf. 2021, 103, 102481. [Google Scholar] [CrossRef]
- Yang, X.; Qin, Q.; Yésou, H.; Ledauphin, T.; Koehl, M.; Grussenmeyer, P.; Zhu, Z. Monthly Estimation of the Surface Water Extent in France at a 10-m Resolution Using Sentinel-2 Data. Remote Sens. Environ. 2020, 244, 111803. [Google Scholar] [CrossRef]
- LeCun, Y.; Bengio, Y.; Hinton, G. Deep Learning. Nature 2015, 521, 436–444. [Google Scholar] [CrossRef] [PubMed]
- Yao, C.; Zhang, Y.; Zhang, Y.; Liu, H. Application of Convolutional Neural Network in Classification of High Resolution Agricultural Remote Sensing Images. ISPRS -Int. Arch. Photogramm. Remote Sens. Spat. Inf. Sci. 2017, 42W7, 989–992. [Google Scholar] [CrossRef]
- O’Neil, G.L.; Goodall, J.L.; Behl, M.; Saby, L. Deep Learning Using Physically-Informed Input Data for Wetland Identification. Environ. Model. Softw. 2020, 126, 104665. [Google Scholar] [CrossRef]
- Jafarzadeh, H.; Mahdianpari, M.; Gill, E.; Mohammadimanesh, F.; Homayouni, S. Bagging and Boosting Ensemble Classifiers for Classification of Multispectral, Hyperspectral and PolSAR Data: A Comparative Evaluation. Remote Sens. 2021, 13, 4405. [Google Scholar] [CrossRef]
- Zhou, Z.-H.; Feng, J. Deep Forest: Towards An Alternative to Deep Neural Networks. In Proceedings of the 2017 International Joint Conference on Artificial Intelligence, Melbourne, Australia, 19–25 August 2017; pp. 3553–3559. [Google Scholar]
- Huang, X.; Zhang, L. An SVM Ensemble Approach Combining Spectral, Structural, and Semantic Features for the Classification of High-Resolution Remotely Sensed Imagery. IEEE Trans. Geosci. Remote Sens. 2013, 51, 257–272. [Google Scholar] [CrossRef]
- Heydari, S.S.; Mountrakis, G. Meta-Analysis of Deep Neural Networks in Remote Sensing: A Comparative Study of Mono-Temporal Classification to Support Vector Machines. ISPRS J. Photogramm. Remote Sens. 2019, 152, 192–210. [Google Scholar] [CrossRef]
- Habib, T.; Inglada, J.; Mercier, G.; Chanussot, J. Support Vector Reduction in SVM Algorithm for Abrupt Change Detection in Remote Sensing. IEEE Geosci. Remote Sens. Lett. 2009, 6, 606–610. [Google Scholar] [CrossRef]
- Alonso, A.; Muñoz-Carpena, R.; Kennedy, R.E.; Murcia, C. Wetland Landscape Spatio-Temporal Degradation Dynamics Using the New Google Earth Engine Cloud-Based Platform: Opportunities for Non-Specialists in Remote Sensing. Trans. ASABE 2016, 59, 1333–1344. [Google Scholar]
- Muro, J.; Varea, A.; Strauch, A.; Guelmami, A.; Fitoka, E.; Thonfeld, F.; Diekkrüger, B.; Waske, B. Multitemporal Optical and Radar Metrics for Wetland Mapping at National Level in Albania. Heliyon 2020, 6, e04496. [Google Scholar] [CrossRef]
- Tang, Z.; Li, Y.; Gu, Y.; Jiang, W.; Xue, Y.; Hu, Q.; LaGrange, T.; Bishop, A.; Drahota, J.; Li, R. Assessing Nebraska Playa Wetland Inundation Status during 1985–2015 Using Landsat Data and Google Earth Engine. Environ. Monit. Assess. 2016, 188, 654. [Google Scholar] [CrossRef]
- Valenti, V.L.; Carcelen, E.C.; Lange, K.; Russo, N.J.; Chapman, B. Leveraging Google Earth Engine User Interface for Semiautomated Wetland Classification in the Great Lakes Basin at 10 m With Optical and Radar Geospatial Datasets. IEEE J. Sel. Top. Appl. Earth Obs. Remote Sens. 2020, 13, 6008–6018. [Google Scholar] [CrossRef]
- Farda, N.M. Multi-Temporal Land Use Mapping of Coastal Wetlands Area Using Machine Learning in Google Earth Engine. IOP Conf. Ser. Earth Environ. Sci. 2017, 98, 012042. [Google Scholar] [CrossRef]
- Sun, S.; Zhang, Y.; Song, Z.; Chen, B.; Zhang, Y.; Yuan, W.; Chen, C.; Chen, W.; Ran, X.; Wang, Y. Mapping Coastal Wetlands of the Bohai Rim at a Spatial Resolution of 10 m Using Multiple Open-Access Satellite Data and Terrain Indices. Remote Sens. 2020, 12, 4114. [Google Scholar] [CrossRef]
- Byrd, K.B.; Ballanti, L.; Thomas, N.; Nguyen, D.; Holmquist, J.R.; Simard, M.; Windham-Myers, L. A Remote Sensing-Based Model of Tidal Marsh Aboveground Carbon Stocks for the Conterminous United States. ISPRS J. Photogramm. Remote Sens. 2018, 139, 255–271. [Google Scholar] [CrossRef]
- Wu, N.; Shi, R.; Zhuo, W.; Zhang, C.; Zhou, B.; Xia, Z.; Tao, Z.; Gao, W.; Tian, B. A Classification of Tidal Flat Wetland Vegetation Combining Phenological Features with Google Earth Engine. Remote Sens. 2021, 13, 443. [Google Scholar] [CrossRef]
- Lamb, B.T.; Tzortziou, M.A.; McDonald, K.C. A Fused Radar–Optical Approach for Mapping Wetlands and Deepwaters of the Mid–Atlantic and Gulf Coast Regions of the United States. Remote Sens. 2021, 13, 2495. [Google Scholar] [CrossRef]
- Amani, M.; Mahdavi, S.; Afshar, M.; Brisco, B.; Huang, W.; Mohammad Javad Mirzadeh, S.; White, L.; Banks, S.; Montgomery, J.; Hopkinson, C. Canadian Wetland Inventory Using Google Earth Engine: The First Map and Preliminary Results. Remote Sens. 2019, 11, 842. [Google Scholar] [CrossRef]
- Zhu, Q.; Wang, Y.; Liu, J.; Li, X.; Pan, H.; Jia, M. Tracking Historical Wetland Changes in the China Side of the Amur River Basin Based on Landsat Imagery and Training Samples Migration. Remote Sens. 2021, 13, 2161. [Google Scholar] [CrossRef]
- Amani, M.; Mahdavi, S.; Kakooei, M.; Ghorbanian, A.; Brisco, B.; DeLancey, E.R.; Toure, S.; Reyes, E.L. Wetland Change Analysis in Alberta, Canada Using Four Decades of Landsat Imagery. IEEE J. Sel. Top. Appl. Earth Obs. Remote Sens. 2021, 14, 10314–10335. [Google Scholar] [CrossRef]
- Amani, M.; Brisco, B.; Afshar, M.; Mirmazloumi, S.M.; Mahdavi, S.; Mirzadeh, S.M.J.; Huang, W.; Granger, J. A Generalized Supervised Classification Scheme to Produce Provincial Wetland Inventory Maps: An Application of Google Earth Engine for Big Geo Data Processing. Big Earth Data 2019, 3, 378–394. [Google Scholar] [CrossRef]
- Fekri, E.; Latifi, H.; Amani, M.; Zobeidinezhad, A. A Training Sample Migration Method for Wetland Mapping and Monitoring Using Sentinel Data in Google Earth Engine. Remote Sens. 2021, 13, 4169. [Google Scholar] [CrossRef]
- Muro, J.; Strauch, A.; Fitoka, E.; Tompoulidou, M.; Thonfeld, F. Mapping Wetland Dynamics With SAR-Based Change Detection in the Cloud. IEEE Geosci. Remote Sens. Lett. 2019, 16, 1536–1539. [Google Scholar] [CrossRef]
- Long, X.; Li, X.; Lin, H.; Zhang, M. Mapping the Vegetation Distribution and Dynamics of a Wetland Using Adaptive-Stacking and Google Earth Engine Based on Multi-Source Remote Sensing Data. Int. J. Appl. Earth Obs. Geoinf. 2021, 102, 102453. [Google Scholar] [CrossRef]
- Mahdianpari, M.; Mohammadimanesh, F.; Brisco, B.; Homayouni, S.; Gill, E.; DeLancey, E.R.; Bourgeau-Chavez, L. Big Data for a Big Country: The First Generation of Canadian Wetland Inventory Map at a Spatial Resolution of 10-m Using Sentinel-1 and Sentinel-2 Data on the Google Earth Engine Cloud Computing Platform. Can. J. Remote Sens. 2020, 46, 15–33. [Google Scholar] [CrossRef]
- Shi, S.; Chang, Y.; Li, Y.; Hu, Y.; Liu, M.; Ma, J.; Xiong, Z.; Wen, D.; Li, B.; Zhang, T. Using Time Series Optical and SAR Data to Assess the Impact of Historical Wetland Change on Current Wetland in Zhenlai County, Jilin Province, China. Remote Sens. 2021, 13, 4514. [Google Scholar] [CrossRef]
- Amani, M.; Brisco, B.; Mahdavi, S.; Ghorbanian, A.; Moghimi, A.; DeLancey, E.R.; Merchant, M.; Jahncke, R.; Fedorchuk, L.; Mui, A.; et al. Evaluation of the Landsat-Based Canadian Wetland Inventory Map Using Multiple Sources: Challenges of Large-Scale Wetland Classification Using Remote Sensing. IEEE J. Sel. Top. Appl. Earth Obs. Remote Sens. 2021, 14, 32–52. [Google Scholar] [CrossRef]
- Campbell, A.D.; Wang, Y. Salt Marsh Monitoring along the Mid-Atlantic Coast by Google Earth Engine Enabled Time Series. PLoS ONE 2020, 15, e0229605. [Google Scholar] [CrossRef]
- Salinas, J.B.G.; Eggerth, M.K.P.; Miller, M.E.; Meza, R.R.B.; Chacaltana, J.T.A.; Acuña, J.R.; Barroso, G.F. Wetland Mapping With Multitemporal Sentinel Radar Remote Sensing In The Southeast Region Of Brazil. In Proceedings of the 2020 IEEE Latin American GRSS & ISPRS Remote Sensing Conference (LAGIRS), Santiago, Chile, 21–26 March 2020; pp. 669–674. [Google Scholar]
- Hardy, A.; Oakes, G.; Ettritch, G. Tropical Wetland (TropWet) Mapping Tool: The Automatic Detection of Open and Vegetated Waterbodies in Google Earth Engine for Tropical Wetlands. Remote Sens. 2020, 12, 1182. [Google Scholar] [CrossRef]
- Zhang, Z.; Xu, N.; Li, Y.; Li, Y. Sub-Continental-Scale Mapping of Tidal Wetland Composition for East Asia: A Novel Algorithm Integrating Satellite Tide-Level and Phenological Features. Remote Sens. Environ. 2022, 269, 112799. [Google Scholar] [CrossRef]
- Kool, J.; Lhermitte, S.; Hrachowitz, M.; Bregoli, F.; McClain, M.E. Seasonal Inundation Dynamics and Water Balance of the Mara Wetland, Tanzania Based on Multi-Temporal Sentinel-2 Image Classification. Int. J. Appl. Earth Obs. Geoinf. 2022, 109, 102766. [Google Scholar] [CrossRef]
- Gulácsi, A.; Kovács, F. Sentinel-1-Imagery-Based High-Resolution Water Cover Detection on Wetlands, Aided by Google Earth Engine. Remote Sens. 2020, 12, 1614. [Google Scholar] [CrossRef]
- Munizaga, J.; García, M.; Ureta, F.; Novoa, V.; Rojas, O.; Rojas, C. Mapping Coastal Wetlands Using Satellite Imagery and Machine Learning in a Highly Urbanized Landscape. Sustainability 2022, 14, 5700. [Google Scholar] [CrossRef]
- Wang, X.; Xiao, X.; Zou, Z.; Hou, L.; Qin, Y.; Dong, J.; Doughty, R.B.; Chen, B.; Zhang, X.; Chen, Y.; et al. Mapping Coastal Wetlands of China Using Time Series Landsat Images in 2018 and Google Earth Engine. ISPRS J. Photogramm. Remote Sens. 2020, 163, 312–326. [Google Scholar] [CrossRef] [PubMed]
- Zhu, L.; Ke, Y.; Hong, J.; Zhang, Y.; Pan, Y. Assessing Degradation of Lake Wetlands in Bashang Plateau, China Based on Long-Term Time Series Landsat Images Using Wetland Degradation Index. Ecol. Indic. 2022, 139, 108903. [Google Scholar] [CrossRef]
- Laba, M.; Blair, B.; Downs, R.; Monger, B.; Philpot, W.; Smith, S.; Sullivan, P.; Baveye, P.C. Use of Textural Measurements to Map Invasive Wetland Plants in the Hudson River National Estuarine Research Reserve with IKONOS Satellite Imagery. Remote Sens. Environ. 2010, 114, 876–886. [Google Scholar] [CrossRef]
- Wright, C.; Gallant, A. Improved Wetland Remote Sensing in Yellowstone National Park Using Classification Trees to Combine TM Imagery and Ancillary Environmental Data. Remote Sens. Environ. 2007, 107, 582–605. [Google Scholar] [CrossRef]
- Töyrä, J.; Pietroniro, A. Towards Operational Monitoring of a Northern Wetland Using Geomatics-Based Techniques. Remote Sens. Environ. 2005, 97, 174–191. [Google Scholar] [CrossRef]
- Pierre, D.; King, D.J.; Gojamme, U.D.; Lisa-Maria, R. Mapping the Dabus Wetlands, Ethiopia, Using Random Forest Classification of Landsat, PALSAR and Topographic Data. Remote Sens. 2017, 9, 1056. [Google Scholar]
- Geng, R.; Jin, S.; Fu, B.; Wang, B. Object-Based Wetland Classification Using Multi-Feature Combination of Ultra-High Spatial Resolution Multispectral Images. Can. J. Remote Sens. 2020, 46, 784–802. [Google Scholar] [CrossRef]
- Fu, B.; Xie, S.; He, H.; Zuo, P.; Sun, J.; Liu, L.; Huang, L.; Fan, D.; Gao, E. Synergy of Multi-Temporal Polarimetric SAR and Optical Image Satellite for Mapping of Marsh Vegetation Using Object-Based Random Forest Algorithm. Ecol. Indic. 2021, 131, 108173. [Google Scholar] [CrossRef]
- Campbell, A.; Wang, Y.; Christiano, M.; Stevens, S. Salt Marsh Monitoring in Jamaica Bay, New York from 2003 to 2013: A Decade of Change from Restoration to Hurricane Sandy. Remote Sens. 2017, 9, 131. [Google Scholar] [CrossRef]
- Fu, B.; Wang, Y.; Campbell, A.; Li, Y.; Zhang, B.; Yin, S.; Xing, Z.; Jin, X. Comparison of Object-Based and Pixel-Based Random Forest Algorithm for Wetland Vegetation Mapping Using High Spatial Resolution GF-1 and SAR Data. Ecol. Indic. 2017, 73, 105–117. [Google Scholar] [CrossRef]
- Ahmed, K.R.; Akter, S.; Marandi, A.; Schüth, C. A Simple and Robust Wetland Classification Approach by Using Optical Indices, Unsupervised and Supervised Machine Learning Algorithms. Remote Sens. Appl. Soc. Environ. 2021, 23, 100569. [Google Scholar] [CrossRef]
- Amani, M.; Salehi, B.; Mahdavi, S.; Granger, J.E.; Brisco, B.; Hanson, A. Wetland Classification Using Multi-Source and Multi-Temporal Optical Remote Sensing Data in Newfoundland and Labrador, Canada. Can. J. Remote Sens. 2017, 43, 360–373. [Google Scholar] [CrossRef]
- Chiu, W.-Y.; Couloigner, I. Modified Fuzzy C-Means Classification Technique for Mapping Vague Wetlands Using Landsat ETM+ Imagery. Hydrol. Process. 2006, 20, 3623–3634. [Google Scholar] [CrossRef]
- Jia, M.; Mao, D.; Wang, Z.; Ren, C.; Zhu, Q.; Li, X.; Zhang, Y. Tracking Long-Term Floodplain Wetland Changes: A Case Study in the China Side of the Amur River Basin. Int. J. Appl. Earth Obs. Geoinf. 2020, 92, 102185. [Google Scholar] [CrossRef]
- Liu, H.; Jiang, Q.; Ma, Y.; Yang, Q.; Shi, P.; Zhang, S.; Tan, Y.; Xi, J.; Zhang, Y.; Liu, B.; et al. Object-Based Multigrained Cascade Forest Method for Wetland Classification Using Sentinel-2 and Radarsat-2 Imagery. Water 2022, 14, 82. [Google Scholar] [CrossRef]
- Mohammadimanesh, F.; Salehi, B.; Mahdianpari, M.; Brisco, B.; Gill, E. Full and Simulated Compact Polarimetry SAR Responses to Canadian Wetlands: Separability Analysis and Classification. Remote Sens. 2019, 11, 516. [Google Scholar] [CrossRef]
- Mohammadimanesh, F.; Salehi, B.; Mahdianpari, M.; Motagh, M. A New Hierarchical Object-Based Classification Algorithm for Wetland Mapping in Newfoundland, Canada. In Proceedings of the IGARSS 2018—2018 IEEE International Geoscience and Remote Sensing Symposium, Valencia, Spain, 22–27 July 2018; pp. 9233–9236. [Google Scholar]
- Betbeder, J.; Rapinel, S.; Corgne, S.; Pottier, E.; Hubert-Moy, L. TerraSAR-X Dual-Pol Time-Series for Mapping of Wetland Vegetation. ISPRS J. Photogramm. Remote Sens. 2015, 107, 90–98. [Google Scholar] [CrossRef]
- Dabboor, M.; Olthof, I.; Mahdianpari, M.; Mohammadimanesh, F.; Shokr, M.; Brisco, B.; Homayouni, S. The RADARSAT Constellation Mission Core Applications: First Results. Remote Sens. 2022, 14, 301. [Google Scholar] [CrossRef]
- Thompson, A.A. Overview of the RADARSAT Constellation Mission. Can. J. Remote Sens. 2015, 41, 401–407. [Google Scholar] [CrossRef]


| # | Reference | First Author | Year | #Citation | Publication Journal | Review Type | Reviewing Period | |
|---|---|---|---|---|---|---|---|---|
| DR * | QR * | |||||||
| 1 | [This Paper] | Jafarzadeh, H. | 2022 | 0 | Remote Sensing | ✓ | ✓ | 1990–2022 |
| 2 | [27] | Czapiewski, S. | 2021 | 0 | Land | ✓ | ✓ | 2010–2021 |
| 3 | [28] | Mirmazloumi, S.M. | 2021 | 0 | Remote Sensing | ✕ | ✓ | 1976–2020 |
| 4 | [29] | Montgomery, J. | 2021 | 1 | Remote Sensing | ✓ | ✕ | N/A |
| 5 | [30] | Gxokwe, S. | 2020 | 9 | Remote Sensing | ✓ | ✕ | 2000–2020 |
| 6 | [31] | Adeli, S. | 2020 | 31 | Remote Sensing | ✕ | ✓ | 1991–2019 |
| 7 | [13] | Mahdianpari, M. | 2020 | 21 | Remote Sensing | ✕ | ✓ | 1980–2019 |
| 8 | [32] | Chasmer, L. | 2020 | 14 | Remote Sensing | ✓ | ✕ | 1973–2018 |
| 9 | [33] | Chasmer, L. | 2020 | 6 | Remote Sensing | ✓ | ✕ | 1973–2018 |
| 10 | [34] | Minasny, B. | 2019 | 34 | Earth-Science Reviews | ✓ | ✓ | N/A |
| 11 | [11] | Mahdavi, S. | 2018 | 79 | GIScience & Remote Sensing | ✓ | ✕ | N/A |
| 12 | [12] | Guo, M. | 2017 | 154 | Sensors | ✓ | ✕ | 1964–2015 |
| # | Attribute | Type | Categories |
|---|---|---|---|
| 1 | Publication Title | Free-text | - |
| 2 | Keywords | Free-text | - |
| 3 | Authors | Free-text | First Author Name |
| 4 | First Author Affiliation | Free-text | University/Organization Country |
| 5 | Publication Year | Free-text | Published Year |
| 6 | Document Type | Classes | Journal; Conference |
| 7 | Source | Free-text | Published Journal or Conference |
| 8 | Publisher | Classes | MDPI, IEEE, Elsevier, etc. |
| 9 | Citation | Numeric | - |
| 10 | Study Focus/Objective | Classes | classification, change detection, vegetation mapping, etc. |
| 11 | Study Area Country | Free-text | Countries all around the world |
| 12 | Study Area Extent | Classes | Very small, Local, Regional, Provincial, National |
| 13 | Data Type | Classes | Multispectral, Hyperspectral, SAR, etc. |
| 14 | Sensor type | Classes | Landsat, Sentinel, RADARSAT, etc. |
| 15 | Feature Type | Classes | Imagery Features, Spectral Indices, Textural metrics, etc. |
| 16 | Methodology | Classes | ensemble learning, decision tree, DL-based, etc. |
| 17 | Accuracy Assessment | Numeric | Overall Accuracies analysis based on seven factors |
| 18 | Processing Tools | Classes | ArcGIS, ENVI, Python, SNAP, etc. |
| Rank | Ref. | First Author | Total Citations | Average Citation | Publication Year |
|---|---|---|---|---|---|
| 1 | [37] | Millard, K | 260 | 37.14 | 2015 |
| 2 | [38] | Dronova, I | 176 | 16 | 2011 |
| 3 | [39] | Bwangoy, JRB | 169 | 14.08 | 2010 |
| 4 | [40] | Baker, C | 168 | 10.5 | 2006 |
| 5 | [41] | Mandianpari, M | 155 | 31 | 2017 |
| 6 | [42] | Han, XX | 147 | 21 | 2015 |
| 7 | [43] | van Beijma, S | 142 | 17.75 | 2014 |
| 8 | [44] | Liu, T | 138 | 34.5 | 2018 |
| 9 | [45] | Corcoran, JM | 130 | 14.44 | 2013 |
| 10 | [46] | Mahdianpari, M | 114 | 38 | 2019 |
| # | Study Area (Country) | #Studies | VS | L | R | P | N | # | Study Area (Country) | #Studies | VS | L | R | P | N |
|---|---|---|---|---|---|---|---|---|---|---|---|---|---|---|---|
| 1 |  | (120) | 39 | 50 | 27 | 3 | 1 | 7 |  | (6) | 5 | 1 | 0 | 0 | 0 |
| 2 |  | (66) | 34 | 21 | 8 | 2 | 1 | 8 |  | (6) | 4 | 2 | 0 | 0 | 0 |
| 3 |  | (62) | 9 | 36 | 6 | 6 | 5 | 9 |  | (5) | 1 | 2 | 2 | 0 | 0 |
| 4 |  | (12) | 5 | 3 | 4 | 0 | 0 | 10 |  | (4) | 3 | 1 | 0 | 0 | 0 |
| 5 |  | (9) | 3 | 3 | 3 | 0 | 0 | 11 |  | (4) | 3 | 1 | 0 | 0 | 0 |
| 6 |  | (9) | 4 | 3 | 2 | 0 | 0 | 12 |  | (4) | 2 | 1 | 1 | 0 | 0 |
| Satellite | Life Span | #Channels | Range | Image Type | Spatial Resolution | Repeat Cycle (Days) | #Studies | Ref. | ||
|---|---|---|---|---|---|---|---|---|---|---|
| Pan | MSI | HSI | ||||||||
| Landsat-8 | 2013–now | 12 | B1–9 (0.43–1.38) B10–11 (10.6–12.51) | ☑ | ☑ | ⊠ | 15, 30, 100 m | 16 | 74 | [7,10,42,81,88,89,90,91] |
| Landsat-5 | 1984–2013 | 8 | B1–5 (0.45–1.75) B6 (10.40–12.50) B7 (2.08–2.35) | ⊠ | ☑ | ⊠ | 30, 120 m | 16 | 62 | [7,10,42,45,81,82,92,93] |
| Sentinel-2 | 2015–now | 12 | 0.443–2.190 | ⊠ | ☑ | ⊠ | 10, 20, 60 m | 5 | 54 | [21,55,89,91,94,95,96,97,98,99] |
| Landsat-7 | 1999–now | 8 | B1–5 (0.45–1.75) B6 (10.40–12.50) B7 (2.08–2.35) | ☑ | ☑ | ⊠ | 15, 30, 60 m | 16 | 50 | [7,10,42,81,100] |
| Landsat-4 | 1982–2001 | 7 | B1–5 (0.45–1.75) B6 (10.40–12.50) B7 (2.08–2.35) | ⊠ | ☑ | ⊠ | 30, 120 m | 16 | 15 | [10,42,101,102,103] |
| RapidEye | 2008–now | 4 | 0.44–0.85 | ☑ | ☑ | ⊠ | 5 m | 1–5.5 | 14 | [104,105,106] |
| MODIS | 1999/2002–now | 36 | B1–19 (0.405–2.155) B 20–36 (3.66–14.28) | ⊠ | ☑ | ⊠ | 250,500, 1000 m | 1–2 | 12 | [107,108,109,110,111] |
| WorldView-2 | 2009–now | 8 | 0.45–0.80 | ☑ | ☑ | ⊠ | 0.52, 2.4 m | 1.1 | 12 | [2,86,112] |
| Quickbird | 2001–now | 5 | 0.45–0.9 | ☑ | ☑ | ⊠ | 0.61, 2.4 m | 1–3.5 | 8 | [83,84,85,113,114] |
| Gaofen-1 | 2013–now | 5 | 0.45–0.89 | ☑ | ☑ | ⊠ | 2, 8 m | 4 | 8 | [115,116,117] |
| ASTER | 1999–now | 14 | B1–3B (0.52–0.86) B4–B9 (1.6–2.43) B10–B14 (8.12–11.65) | ⊠ | ☑ | ⊠ | 15, 30, 90 m | 4–16 | 7 | [91,118,119] |
| SPOT-5 | 2002 | 4 | 0.5–1.75 | ☑ | ☑ | ⊠ | 2.5, 5, 10 m | 2–3 | 5 | [83,87] |
| Gaofen-5 | 2018–now | 330 | 0.39–2.51 | ⊠ | ⊠ | ☑ | 30 m | 2 | 5 | [95,120] |
| Pléiade | 2011 | 4 | 0.43–0.95 | ☑ | ☑ | ⊠ | 0.5, 2 m | 26 | 3 | [121] |
| Gaofen-2 | 2014–now | 5 | 0.45–0.89 | ☑ | ☑ | ⊠ | 0.8, 3.2 m | 4 | 3 | [5] |
| Satellite | Life Span | Polarization | Wavelength (cm)/Band | Repeat Cycle (Days) | #Studies | Ref. |
|---|---|---|---|---|---|---|
| Sentinel-1A, Sentinel-1B | 2014–Present 2016–Present | Single/Dual | 5.54/C-band | 6 | 45 | [21,82,89,96,97,115,122] |
| RADARSAT-2 | 2007–Present | Single/Dual/Quad | 5.55/C-band | 24 | 31 | [41,45,78,82,106,123,124] |
| ALOS PALSAR | 2006–2011 | Quad | 23.6/L-band | 46 | 25 | [110,124,125,126,127,128,129] |
| TerraSAR-X | 2007–Present | Quad | 3.11/X-band | 11 | 9 | [41,124,130] |
| ENVISAT ASAR | 2002–2012 | Dual | 5.63/C-band | 35 | 6 | [110,131] |
| Gaofen-3 | 2016–Present | Single/Dual/Quad | 5.4/C-band | 29 | 3 | [69] |
| Huan Jing-1C | 2012–Present | Single-VV | 3.13/S-band | 31 | 2 | [132] |
| ERS-1 | 1991–2000 | Single-VV | 5.66/C-band | 35, 3, 168 | 2 | [126] |
| ERS-2 | 1995–2011 | Single-VV | 5.66/C-band | 35 | 2 | [126] |
| # | Ref. | Application Type | Publication Date | # | Ref. | Application Type | Publication Date |
|---|---|---|---|---|---|---|---|
| 1 | [144] | Change Detection | May, 2016 | 21 | [145] | Classification | Aug, 2020 |
| 2 | [146] | Wetland Inundation Analysis | Dec, 2016 | 22 | [147] | Classification | Sep, 2020 |
| 3 | [148] | Classification | Dec, 2017 | 23 | [7] | Change Detection | Nov, 2020 |
| 4 | [22] | Classification | Dec, 2017 | 24 | [149] | Wetland Extent Extraction | Dec, 2020 |
| 5 | [150] | Carbon Content and Biomass | May, 2018 | 25 | [151] | Wetland Vegetation Mapping | Feb, 2021 |
| 6 | [46] | Classification | Jan, 2019 | 26 | [152] | Classification | Jun, 2021 |
| 7 | [153] | Classification | Apr, 2019 | 27 | [154] | Change Detection | Jun, 2021 |
| 8 | [24] | Classification | Jun, 2019 | 28 | [127] | Classification | Aug, 2021 |
| 9 | [19] | Wetland Inundation Analysis | Jul, 2019 | 29 | [155] | Change Detection | Sep, 2021 |
| 10 | [156] | Classification | Oct, 2019 | 30 | [157] | Classification and Change Detection | Oct, 2021 |
| 11 | [158] | Change Detection | Oct, 2019 | 31 | [159] | Wetland Vegetation Mapping | Oct, 2021 |
| 12 | [160] | Classification | Jan, 2020 | 32 | [161] | Change Detection | Nov, 2021 |
| 13 | [96] | Classification | Jan, 2020 | 33 | [162] | Classification | Nov, 2021 |
| 14 | [163] | Inundation analysis and Biomass | Feb, 2020 | 34 | [134] | Classification | Dec, 2021 |
| 15 | [164] | Classification | Mar, 2020 | 35 | [97] | Wetland Extent Extraction | Jan, 2022 |
| 16 | [51] | Wetland vegetation mapping | Apr, 2020 | 36 | [94] | Classification | Jan, 2022 |
| 17 | [165] | Classification | Apr, 2020 | 37 | [166] | Classification | Feb, 2022 |
| 18 | [99] | Classification | May, 2020 | 38 | [167] | Wetland Inundation Analysis | May, 2022 |
| 19 | [168] | Water Cover Detection | May, 2020 | 39 | [169] | Classification | May, 2022 |
| 20 | [170] | Classification | May, 2020 | 40 | [171] | Change Detection | Jun, 2022 |
| Category | Imagery | Indicator/Band | Ref. |
|---|---|---|---|
| Imagery Features | Optical | blue band, red band, green band, the red-edge band, near-infrared, shortwave-infrared | - |
| SAR | Backscatter Coefficient (HH, HV, VH, VV) | - | |
| Spectral Indices (vegetation/water/soil indices) | Optical | Normalized Difference Vegetation Index (NDVI) | [155,156,169,175,176,177,178,179,180] |
| Optical | Normalized Difference Water Index (NDWI) | [155,156,169,175,176,177,180,181] | |
| Optical | Enhanced Vegetation Index (EVI) | [169,175] | |
| Optical | Simple Ratio (SR) | [169] | |
| Optical | Modified Normalized Difference Water Index (MNDWI) | [177] | |
| Optical | Soil-Adjusted Vegetation Index (SAVI) | [175,176,181] | |
| Optical | Modified Soil-Adjusted Vegetation Index-2 (MSAVI2) | [175] | |
| Optical | Modified Normalized Difference Water Index (MNDWI) | [175] | |
| Optical | Tasseled-Cap Transformation Brightness (TCB) | [175,182] | |
| Optical | TC-Greenness (TCG) | [175,182] | |
| Optical | TC-Wetness (TCW) | [175,182] | |
| Optical | Green Chlorophyll Index (Clgreen) | [177] | |
| Textural Metrics (GLCM) | Optical and SAR | Mean | [169,176,178] |
| Optical and SAR | Variance | [169,176] | |
| Optical and SAR | Homogeneity | [169,176,177,178,181,183] | |
| Optical and SAR | Contrast | [169,176,178,181,183] | |
| Optical and SAR | Entropy | [169,176,178,181,183] | |
| Optical and SAR | Angular Second Moment | [169,176,183] | |
| Optical and SAR | Correlation | [177,178,181,183] | |
| Optical and SAR | Standard Deviation | [177,178] | |
| Optical and SAR | Dissimilarity | [177,183] | |
| SAR Polarimetric Features | SAR | Pauli | [125,184,185] |
| SAR | Cloude–Pottier | [3,41,45,69,73,125,184,185] | |
| SAR | Freeman–Durden | [3,41,45,72,185,186] | |
| SAR | Yamaguchi | [69,125,184,185,186] | |
| SAR | Neumann | [69,125,185] | |
| SAR | Touzi | [41,125,185,186] | |
| SAR | H/A/Alpha | [125,184,185] | |
| SAR | Single-Bounce Eigenvalue Relative Difference | [69,185] | |
| SAR | Double-Bounce Eigenvalue Relative Difference | [69,185] | |
| SAR | Shannon Entropy | [69,73,130,187] | |
| SAR | The Total Power (Span) | [21,69,99,160] | |
| SAR | Ratio | [21,99,130,160] | |
| SAR | Radar Vegetation Index | [69] | |
| Geometric/Contextual Features | Optical and SAR | Area | [176,178] |
| Optical and SAR | Shape Index | [176,183] | |
| Optical and SAR | Border Index | [176,183] | |
| Optical and SAR | Number of Pixels | [176] | |
| Optical and SAR | Perimeter | [176,183] | |
| Topographic Features | LiDAR/DEM | Elevation data | [175] |
| LiDAR/DEM | SLOP | [175] | |
| LiDAR/DEM | Topographic Wetness Index | [175] | |
| LiDAR/DEM | Terrain Surface Texture | [175] |
Publisher’s Note: MDPI stays neutral with regard to jurisdictional claims in published maps and institutional affiliations. |
© 2022 by the authors. Licensee MDPI, Basel, Switzerland. This article is an open access article distributed under the terms and conditions of the Creative Commons Attribution (CC BY) license (https://creativecommons.org/licenses/by/4.0/).
Share and Cite
Jafarzadeh, H.; Mahdianpari, M.; Gill, E.W.; Brisco, B.; Mohammadimanesh, F. Remote Sensing and Machine Learning Tools to Support Wetland Monitoring: A Meta-Analysis of Three Decades of Research. Remote Sens. 2022, 14, 6104. https://doi.org/10.3390/rs14236104
Jafarzadeh H, Mahdianpari M, Gill EW, Brisco B, Mohammadimanesh F. Remote Sensing and Machine Learning Tools to Support Wetland Monitoring: A Meta-Analysis of Three Decades of Research. Remote Sensing. 2022; 14(23):6104. https://doi.org/10.3390/rs14236104
Chicago/Turabian StyleJafarzadeh, Hamid, Masoud Mahdianpari, Eric W. Gill, Brian Brisco, and Fariba Mohammadimanesh. 2022. "Remote Sensing and Machine Learning Tools to Support Wetland Monitoring: A Meta-Analysis of Three Decades of Research" Remote Sensing 14, no. 23: 6104. https://doi.org/10.3390/rs14236104
APA StyleJafarzadeh, H., Mahdianpari, M., Gill, E. W., Brisco, B., & Mohammadimanesh, F. (2022). Remote Sensing and Machine Learning Tools to Support Wetland Monitoring: A Meta-Analysis of Three Decades of Research. Remote Sensing, 14(23), 6104. https://doi.org/10.3390/rs14236104