Review

Remote Sensing on Alfalfa as an Approach to Optimize Production Outcomes: A Review of Evidence and Directions for Future Assessments

1
Department of Agronomy, Kansas State University, 2004 Throckmorton Plant Science Center, Manhattan, KS 66506, USA
2
Department of Biological and Agricultural Engineering, Kansas State University, 1016 Seaton Hall 920 N. Martin Luther King Jr. Drive, Manhattan, KS 66502, USA
3
AGCO Corporation, 420 W Lincoln Blvd #8807, Hesston, KS 67062, USA
*
Author to whom correspondence should be addressed.
Remote Sens. 2022, 14(19), 4940; https://doi.org/10.3390/rs14194940
Submission received: 29 August 2022 / Revised: 22 September 2022 / Accepted: 27 September 2022 / Published: 3 October 2022
(This article belongs to the Special Issue Advances of Remote Sensing in Precision Agriculture)

Abstract

:
Alfalfa (Medicago sativa L.) is one of the most relevant forage crops due to its importance for livestock. Timely harvesting is critical to secure adequate forage quality. However, farmers face challenges not only to decide the optimal harvesting time but to predict the optimum levels for both forage production and quality. Fortunately, remote sensing technologies can significantly contribute to obtaining production and quality insights, providing scalability, and supporting complex farming decision-making. Therefore, we aim to develop a systematic review of the current scientific literature to identify the current status of research in remote sensing for alfalfa and to evaluate new perspectives for enhancing prediction of both biomass and quality (herein defined as crude protein and fibers) for alfalfa. Twelve papers were included in the database from a total of 198 studies included in the initial screening process. The main findings were (i) more than two-thirds of the studies focused on predicting biomass; (ii) half of the studies used terrestrial platforms, with only 33% using drones and 17% using satellite for remote sensing; (iii) no studies have used satellites assessed alfalfa quality traits; (iv) improved biomass and quality estimations were obtained when remote sensing data was combined with environmental information; (v) due to a direct relationship between biomass and quality, modeling them algorithmically improves the accuracy of estimation as well; (vi) from spectral wavelengths, dry biomass was better estimated in regions near 398, 551, 670, 730, 780, 865, and 1077 nm, wet biomass in regions near 478, 631, 670, 730, 780, 834, 933, 1034, and 1538 nm, and quality traits identified with narrow and very specific wavelengths (e.g., 398, 461, 551, 667, 712, and 1077 nm). Our findings might serve as a foundation to guide further research and the development of handheld sensors for assessing alfalfa biomass and quality.

1. Introduction

From a climate change standpoint, the development of more sustainable farming systems to reduce the overall environmental footprint from the livestock sector [1] will be even more critical to satisfy the ever increasing pressure of the growing population and calorie consumption. Animal-based foods account for 18% of worldwide calorie consumption and 25–35% of protein intake [2]. Adequate nutrition is fundamental to ruminant production and forage contributes an important nutrition component [3]. In addition, as forage quality varies broadly within and among forage species, with nutritional demands varying between animal species, supplying adequate nutrition to animals requires a balance and is a complex challenge [3]. However, the greatest challenge in finding this balance remains in obtaining spatio-temporal information on forage biomass and its quality.
Fortunately, remote sensing technologies can improve the overall prediction of forage biomass and quality prior to harvest, hence decreasing the risks and aiding in determining the ideal time to harvest and bale [4]. Moreover, increasingly available satellite images and other remote sensing technologies (e.g., proximal sensors, unmanned aerial vehicles, etc.) might assist the creation of decision support systems for monitoring the condition of main field crops [5,6,7]. The use of these platforms may enable more precise evaluations of the effects of field interventions on addressing on-farm issues, therefore helping the broader objective of achieving food security [6]. However, attempts to examine the application of remote sensing technologies are often focused on major field crops, such as soybean ( Glycine max L.), maize ( Zea mays L.), wheat ( Triticum aestivum L.), or rice ( Oryza sativa L.) [8,9,10]. Rarely are efforts devoted towards crop quality evaluation in forage crops, and among the current ones, most of them are focused on biomass productivity and not so much on quality assessment [11,12,13,14].
In recent decades, alfalfa has become more attractive due to its agronomic and nutritive value [15,16,17]. The most relevant characteristics of this crop are its adaptability to different soil and climate conditions, high nitrogen fixation capability which translates in a high-quality (15–22% protein content) forage [18]. In addition, it can be used for hay, silage, and pasture, as well as by-products for bio-fuel production, pharmaceutical compounds, enzymes, and industrial proteins [18]. As a perennial crop, alfalfa is established and then harvested in the following years (e.g., ≈3–4 years), with the potential to be harvested several times (e.g., 3–4 times) throughout the growing season [19], resulting in a more sustainable and profitable production system. There is a short window of time between the pick of biomass and full bloom where the trade-off between production and quality is maximized [20]. Therefore, it is critical to determine when to start harvesting. Non-optimal harvest timing has a detrimental effect on yield and quality, as well as plant regrowth, leading to possible failures in subsequent cycles and decreasing the longevity of alfalfa production [21,22]. Current scientific literature on the use of remote sensing in assessing alfalfa production is scarce (even with less research on crop quality) focusing on a few different platforms (e.g., terrestrial [23,24,25,26,27,28,29], UAVs [29,30,31,32], and satellites [4,33]). However, to the best of our knowledge, there is a lack of a synthesis analysis that provided a thorough revision of the current scientific literature using remote sensing platforms to assess alfalfa production and quality. Understanding the potential for spectral bands and vegetation indices to predict relevant biomass and quality (e.g., crude protein and fiber) traits can facilitate future development of new sensors and platforms to boost alfalfa farming systems and increase overall sustainability.
Following this rationale, a systematic review was conducted to outline the present state of remote sensing technologies for evaluating alfalfa biomass production and investigate the opportunities for testing quality attributes such as protein and fibers. Therefore, this review aims to: (i) analyze the use of remote sensing platforms to assess alfalfa biomass and quality; (ii) identify the most accurate wavelengths (spectral bands) and vegetation indices to predict alfalfa biomass and quality; and (iii) identify current knowledge gaps to guide future assessments.

2. Materials and Methods

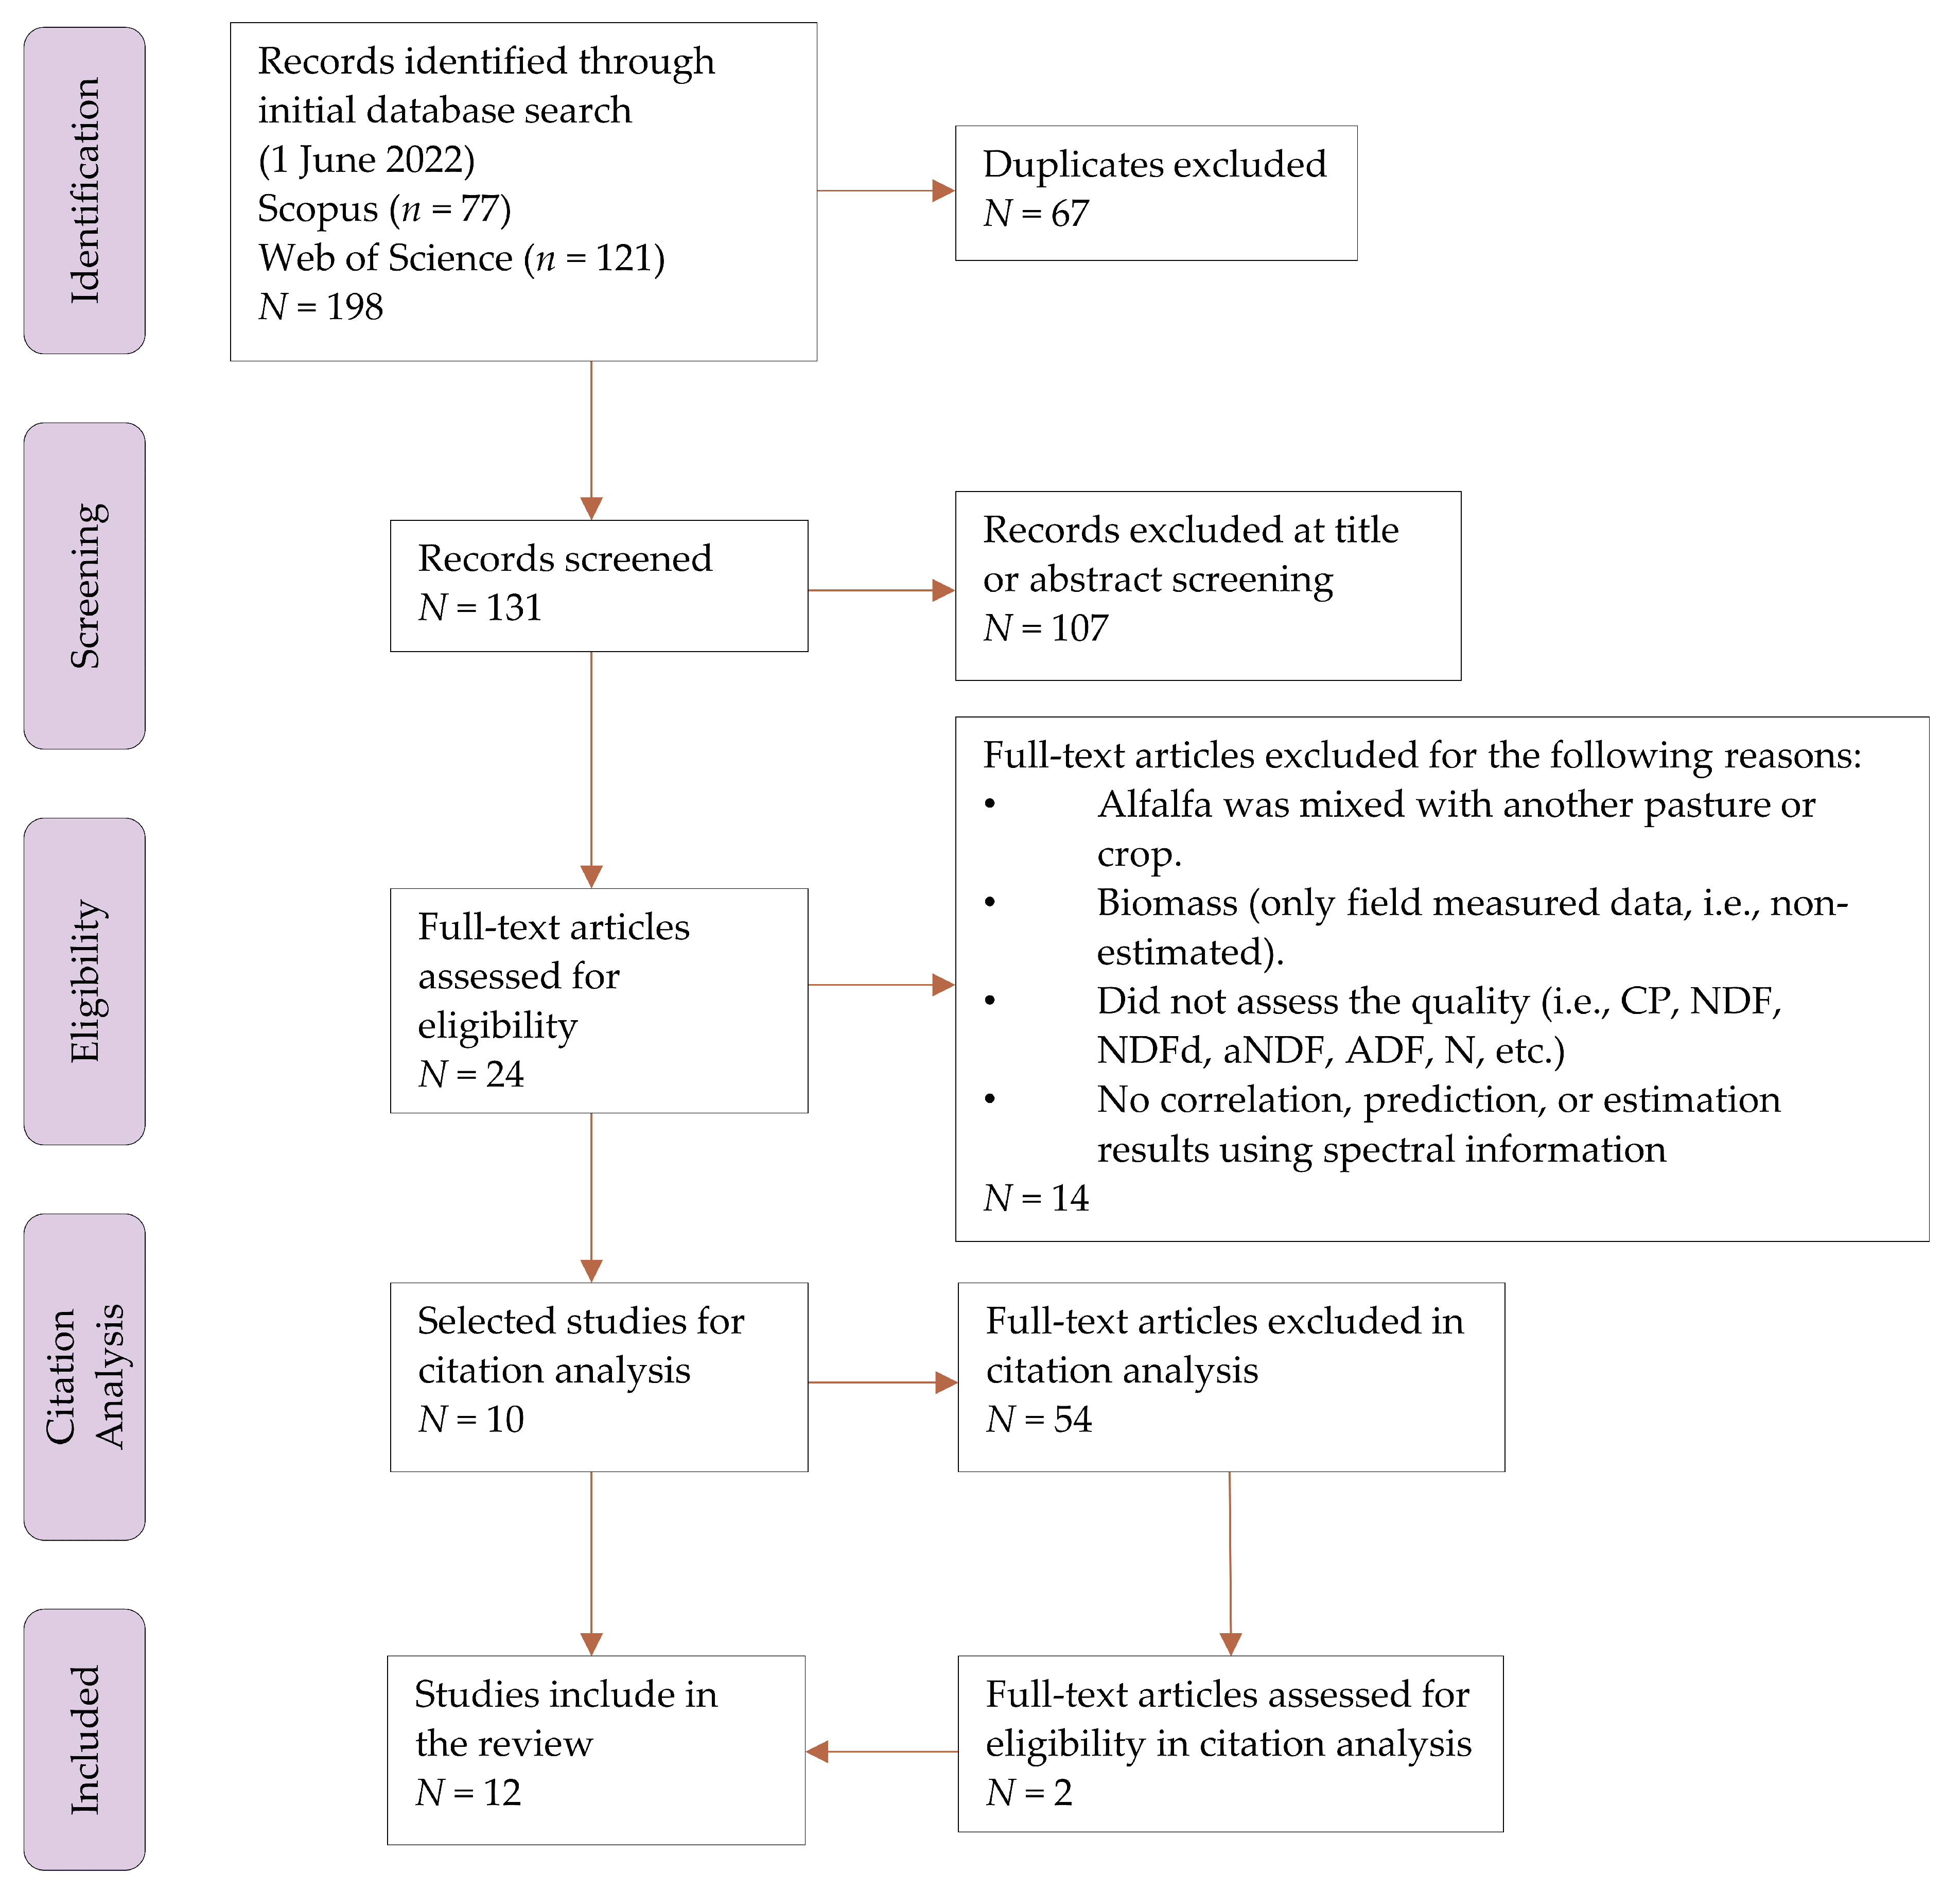
2.1. Literature Search

A systematic review of the scientific literature was conducted using Scopus and Web of Science, focusing on publications in English language from the last ten years (2013–2022). The search period was defined with the goal of focusing on the last decade of remote sensing innovation and improvement on sensors, platforms, data analysis, and development of decision support tools for this relevant forage crop. For the search equation, the terms “Remote Sensing” and “Alfalfa” or “ Medicago sativa ” were selected, resulting in a total of 131 papers after duplicate removal (67 in total). We analyzed the publications by screening their titles and abstracts and excluding those that did not discuss remote evaluation of alfalfa for biomass and/or quality traits, resulting in a total of 24 studies. From this total, we reviewed the complete text to assess whether it was possible to extract information regarding the use of spectral data for alfalfa biomass and quality attributes by identifying articles that met the criteria. Further publications, not considering the time-period mentioned previously, were derived from these manuscripts’ citations (54 new papers were reviewed), yielding two additional studies. Consequently, 12 articles were included in the final database (Table 1). The database does not include studies of alfalfa mixed with other types of forage when it was not possible to extract alfalfa-specific observations. An overview of the approach of the database search is presented in Figure 1.

2.2. Content Analysis

After reading the selected publications, productivity and quality indicators, plant phase and cutting cycle, remote sensing platforms (wavelengths and vegetation indices), and prediction and estimation methodologies were extracted. The collected dataset was summarized in a database and flow charts to illustrate the findings on (i) the use of remote sensing platforms to assess alfalfa biomass and quality traits, and (ii) wavelength and vegetation indices options to establish a potential relationship with alfalfa biomass and quality traits.

3. Results

3.1. Overview of Remote Sensing Platforms Used to Assess Alfalfa Biomass and Quality

One of the most distinct findings from the final database is related to the type of platforms used to acquire information regarding biomass and quality traits (Table 2). Here, four different platforms such as handheld sensors, embedded sensors in terrestrial vehicles, drones, and satellites were listed as the most used for this purpose. Most notably, about 50% of studies used terrestrial [23,24,25,26,27,28,29] and 33% drone platforms [29,30,31,32]. For example, in the research reported by Pittiman et al. [28], three active multispectral canopy sensors embedded in a tractor documented information such as environmental and canopy temperature, relative humidity, photosynthetic radiation, and various vegetation indices. In the same way, ref. [32] embedded multispectral and thermal sensors on a UAV to collect information regarding vegetation indices (e.g., NDVI, MNLI, EVI, GNDVI) and environmental and canopy temperature. Only 17% of the research used the satellite platform. For this, Azadbakht et al. and Kayad et al. [4,33] used images from different satellites and even combined them to improve the temporal resolution of biomass assessment. When dividing the studies based on the evaluated traits, 77% focused on predicting biomass in both wet and dry forms, while only 33% focused on quality assessment. Another important finding to highlight was the fact that quality traits assessed by satellites were not reported by any of the studies analyzed.

3.2. Assessing the Performance Prediction of Approaches for Alfalfa Biomass and Quality

Regarding the methodologies listed for evaluating the assessment performance, a broad spectrum can be depicted, from regression analysis to machine learning techniques, as well as different combinations of variables and feature space exploration. From our database, research has reported promising results when biomass production and quality have been analyzed together with environmental information. For instance, research reported by Noland et al. [26] showed coefficient of determination (R 2 ) values close to 0.87 for assessing biomass and quality using regression analysis (CP, NDF, and NDFd) (Table A1 and Table A4). In the same way, Chandel et al. [32] assessed dry biomass using CWSI and MNL indices based on canopy and air temperature and wavelengths, scored R 2 equal to 0.68 (Table A2).
In addition, research using only spectral information has also found promising results. For example, the research reported by Azadbakht et al. [33] showed that a time series capturing variations on vegetation indices (LSWI, NDVI, SR, EVI2, OSAVI) along the crop cycle provides useful indicators for overall prediction of biomass. The authors used machine learning techniques such as ridge regression, Gaussian process, random forest, and support vector regressions among others to explore the best model to estimate yields, resulting in an R 2 greater 0.89 (Table A3). In another example reported by Feng et al. [30], the use of an ensemble approach of support vector regression, K- nearest neighbors and random forest for 25 vegetation indices resulted in an R 2 equal to 0.87 (Table A2). Most recently, the same authors [31] found that assessing quality traits simultaneously (CP, aNDF, ADF) by multi-target learning outperformed single-target methods (Table A5).

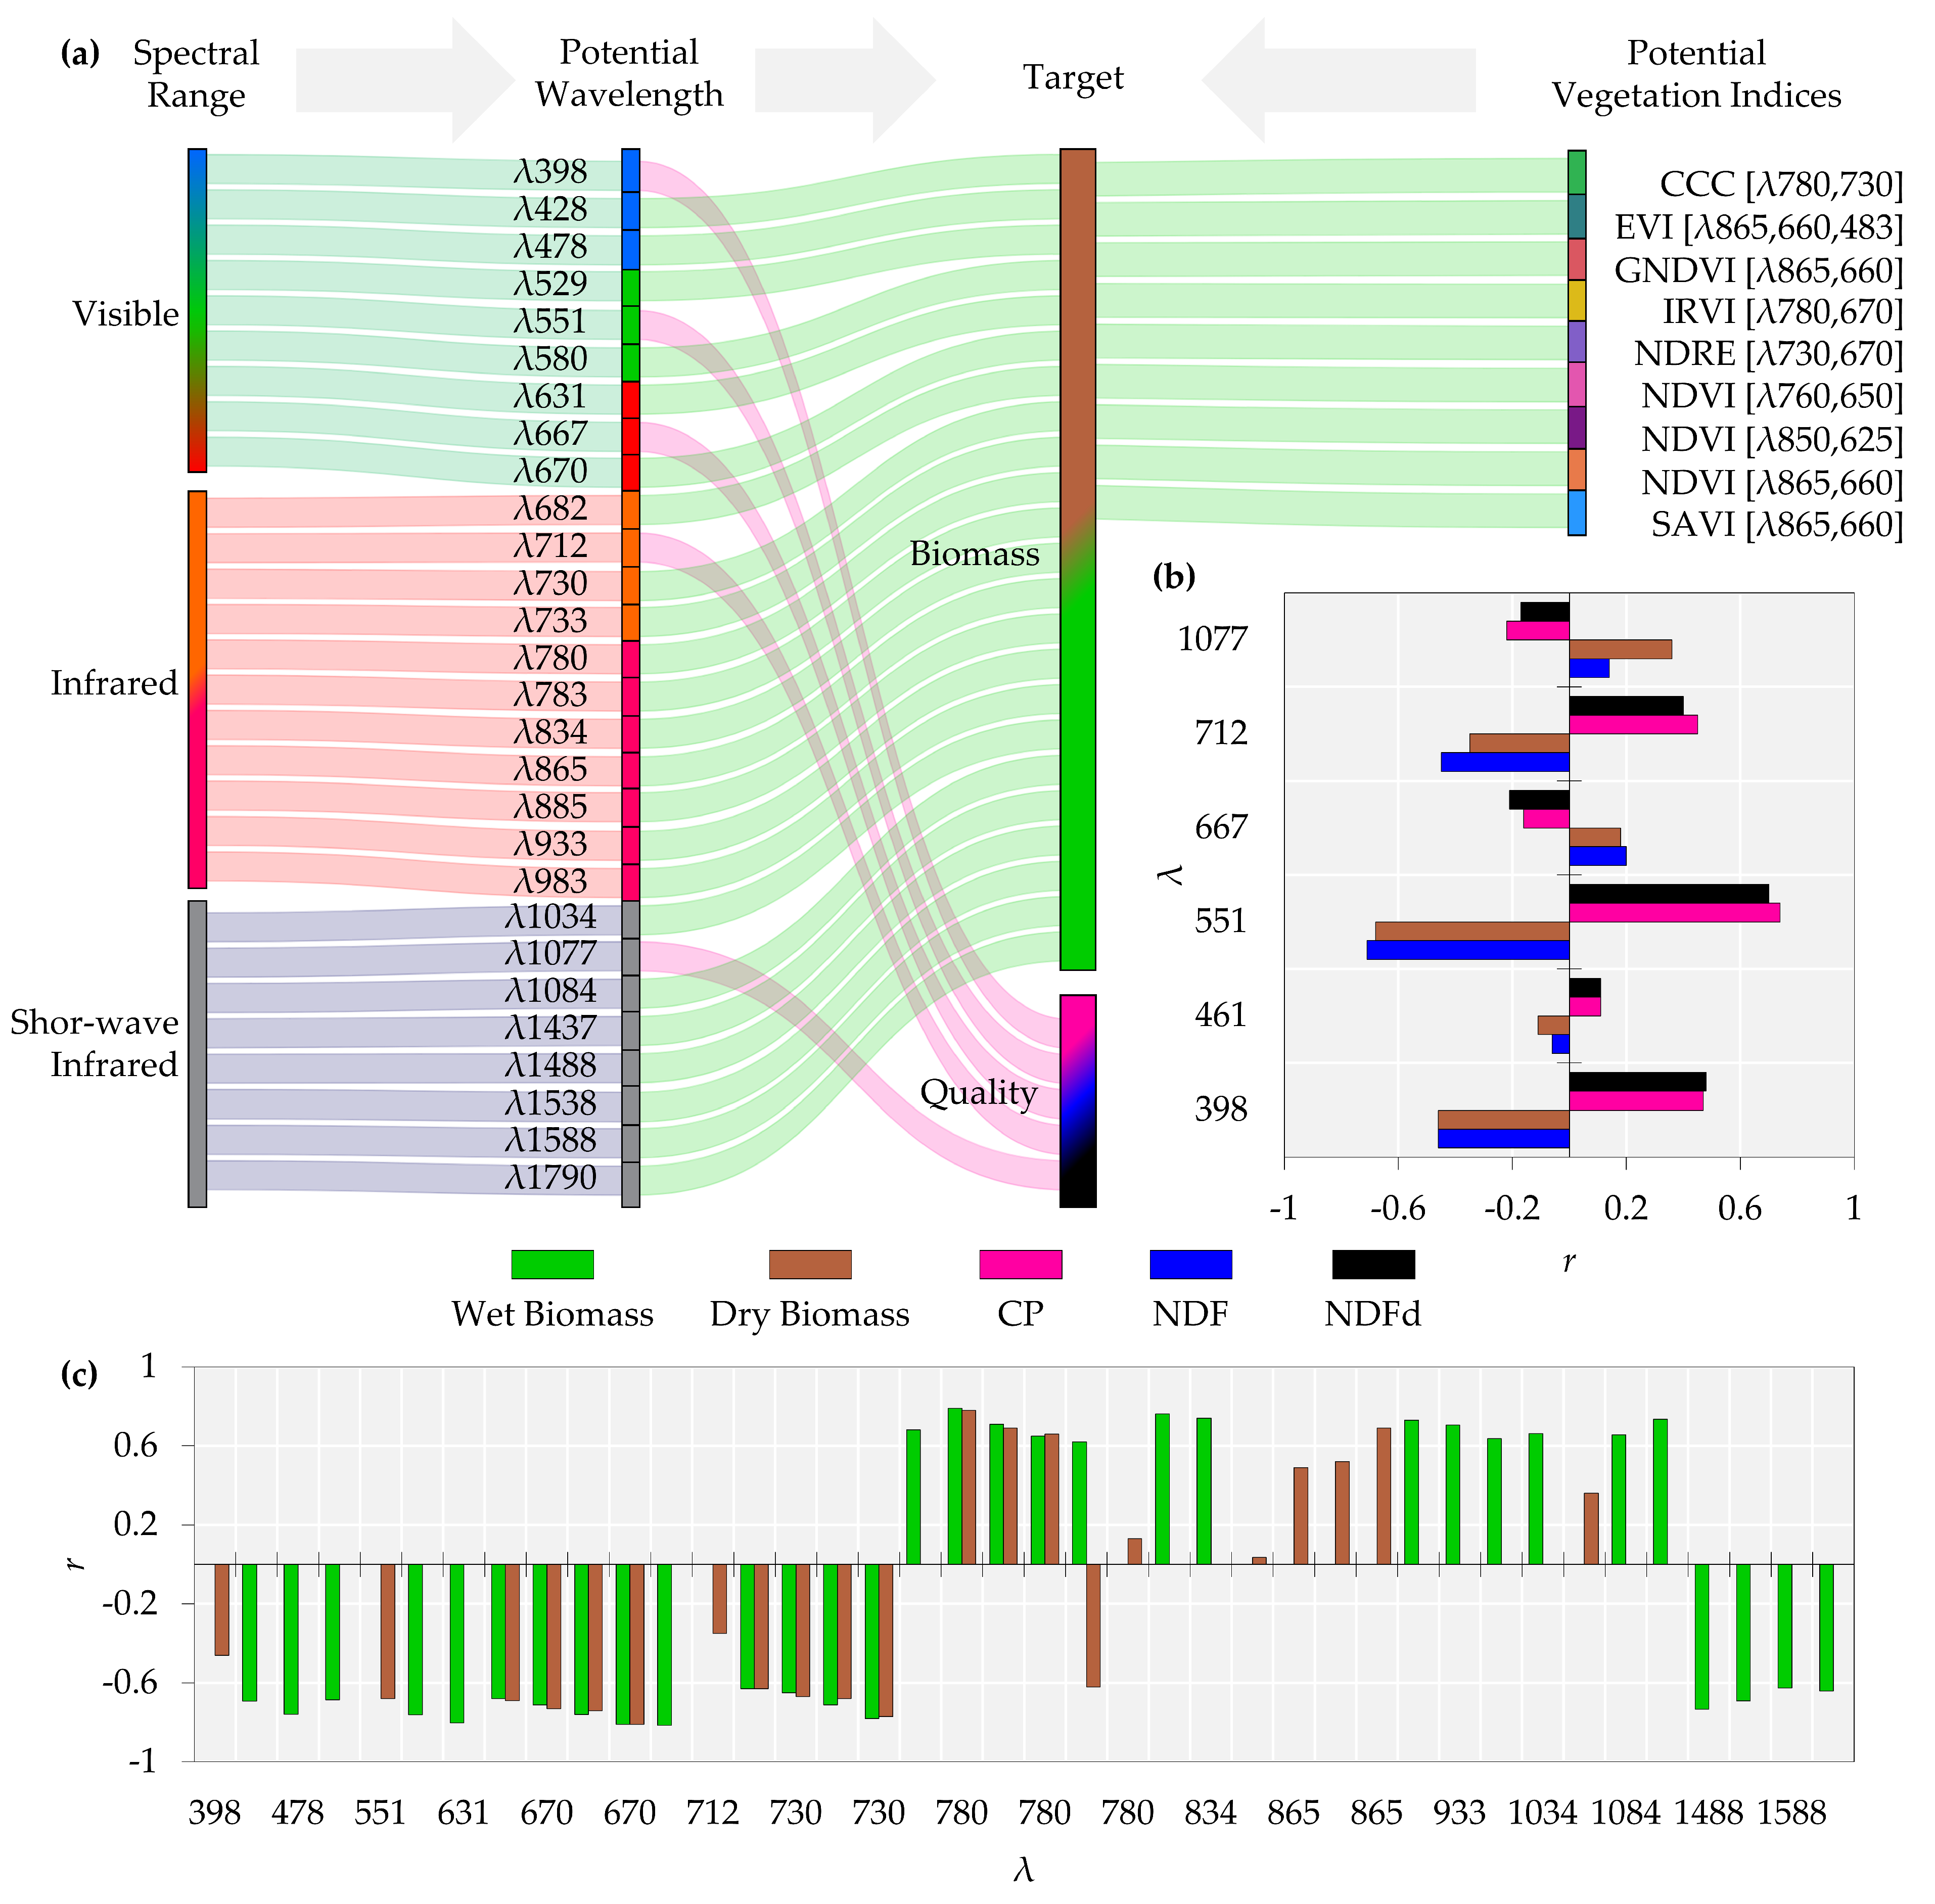
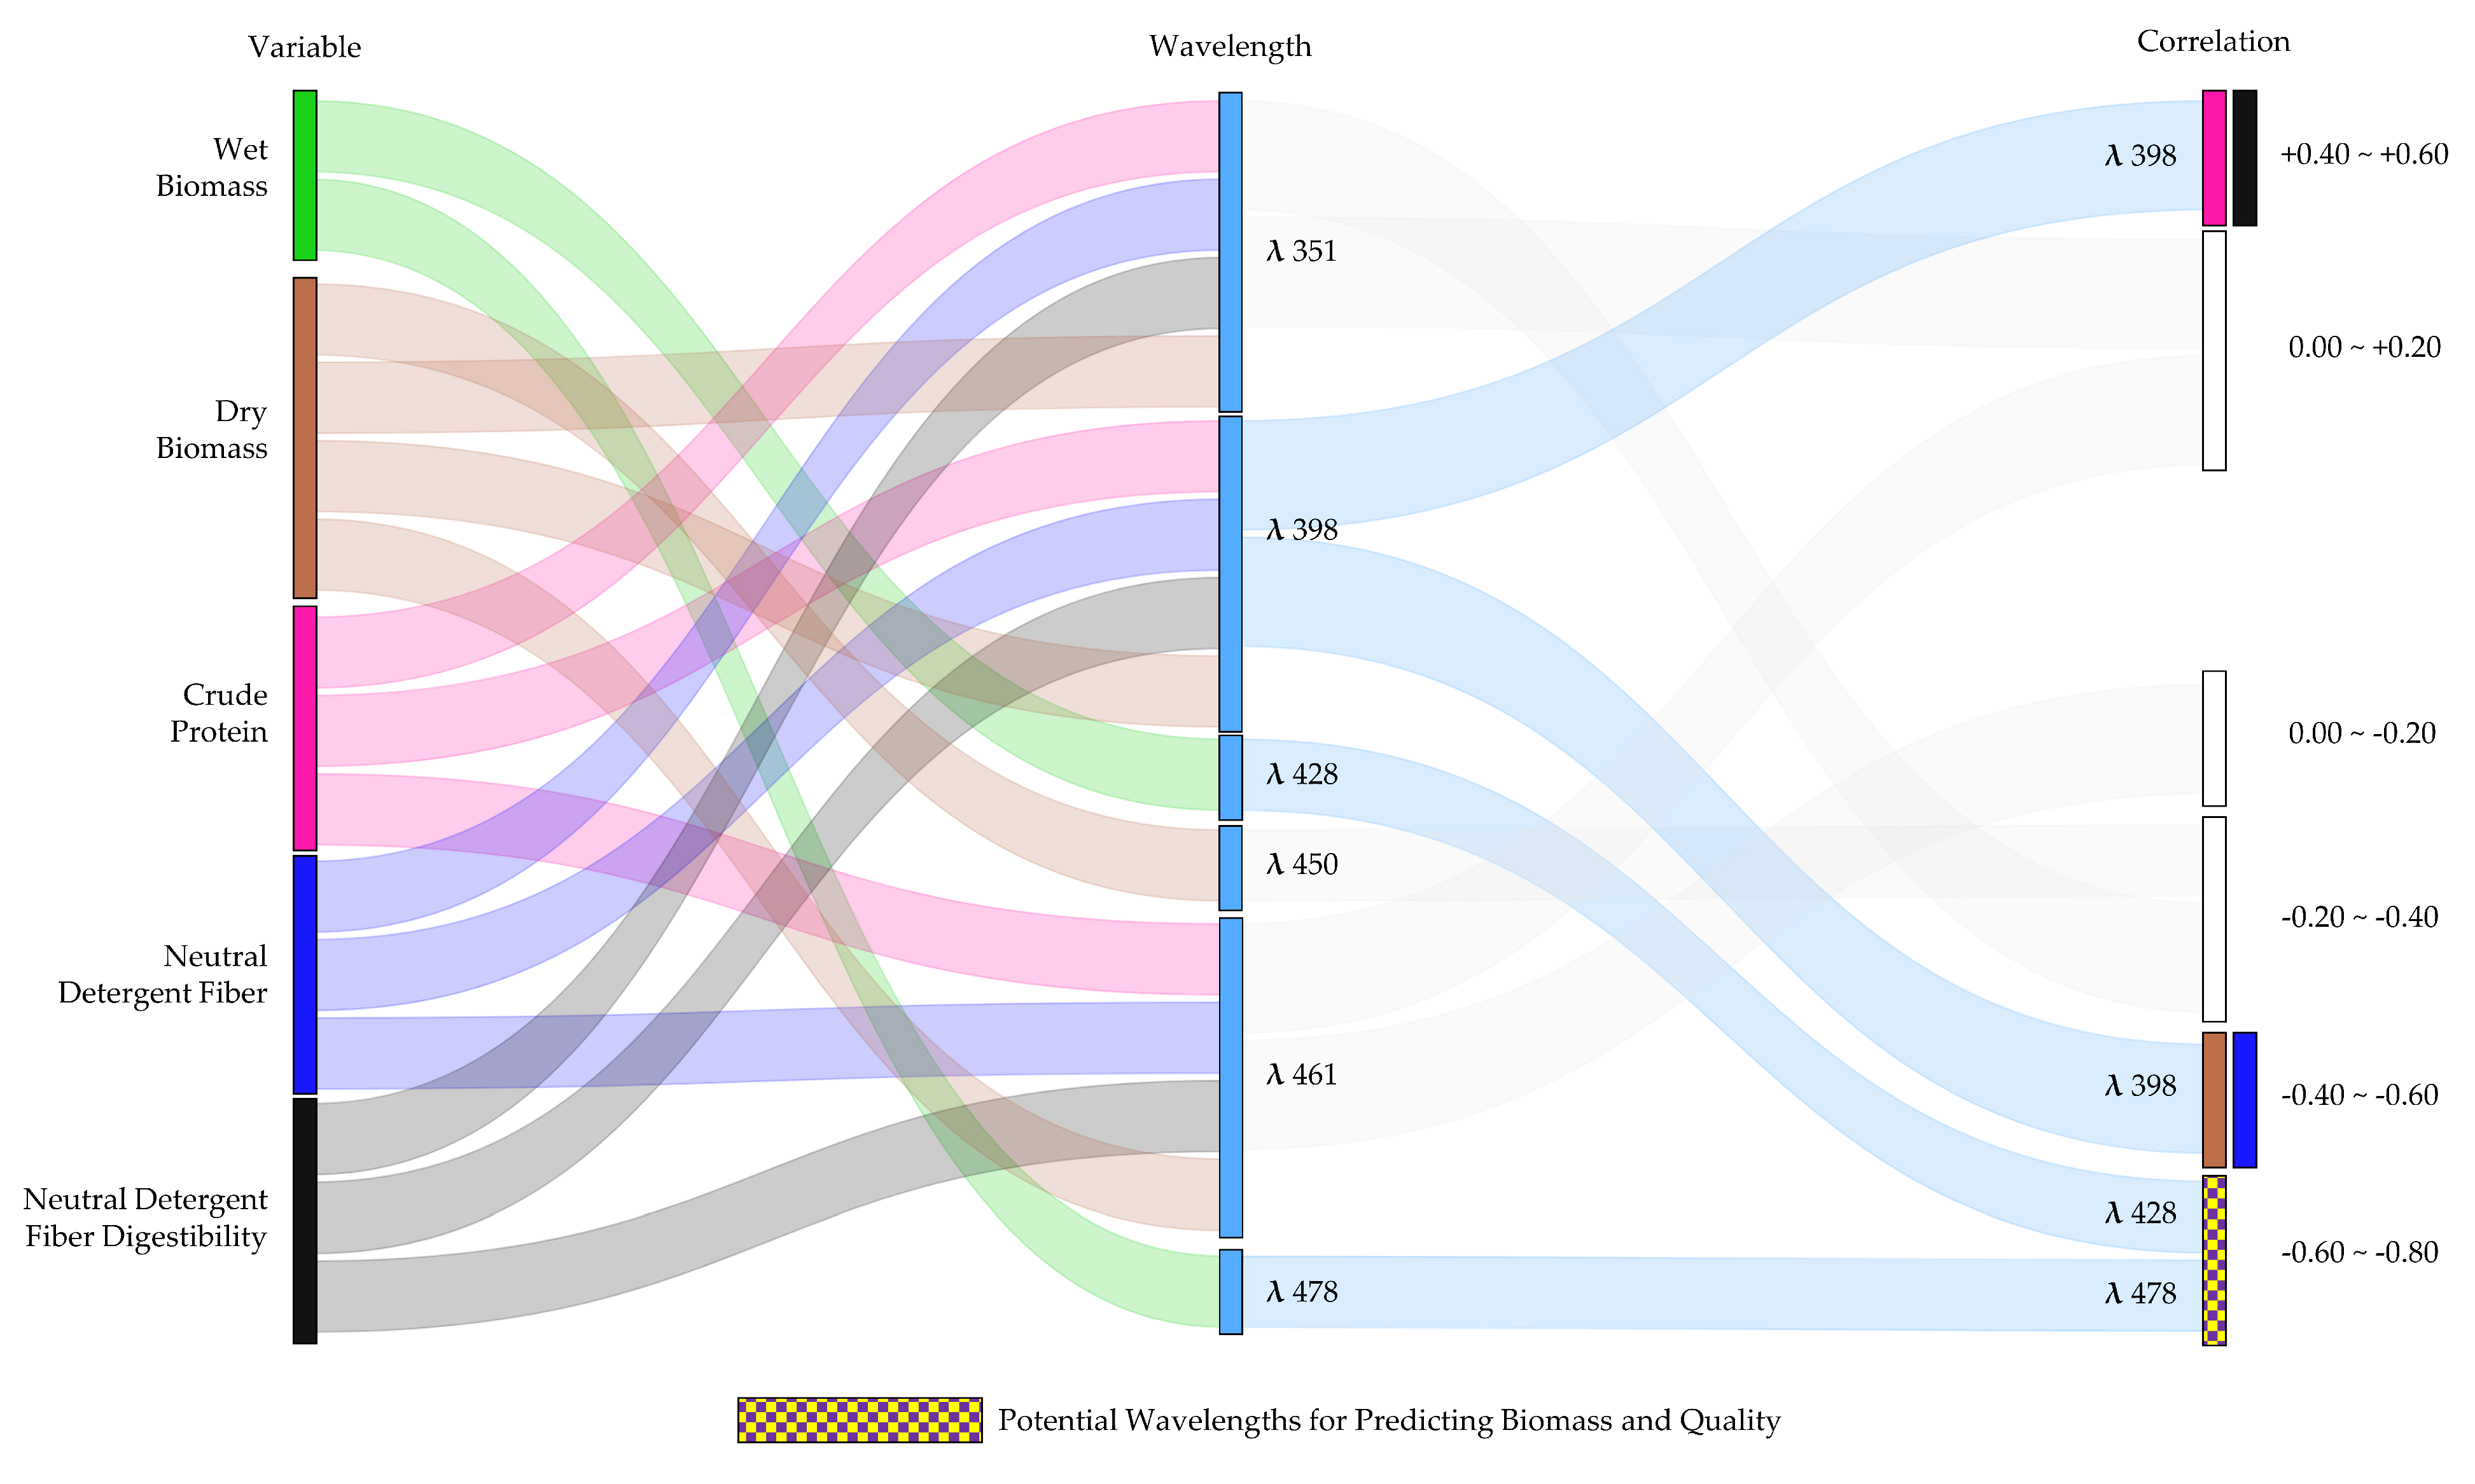
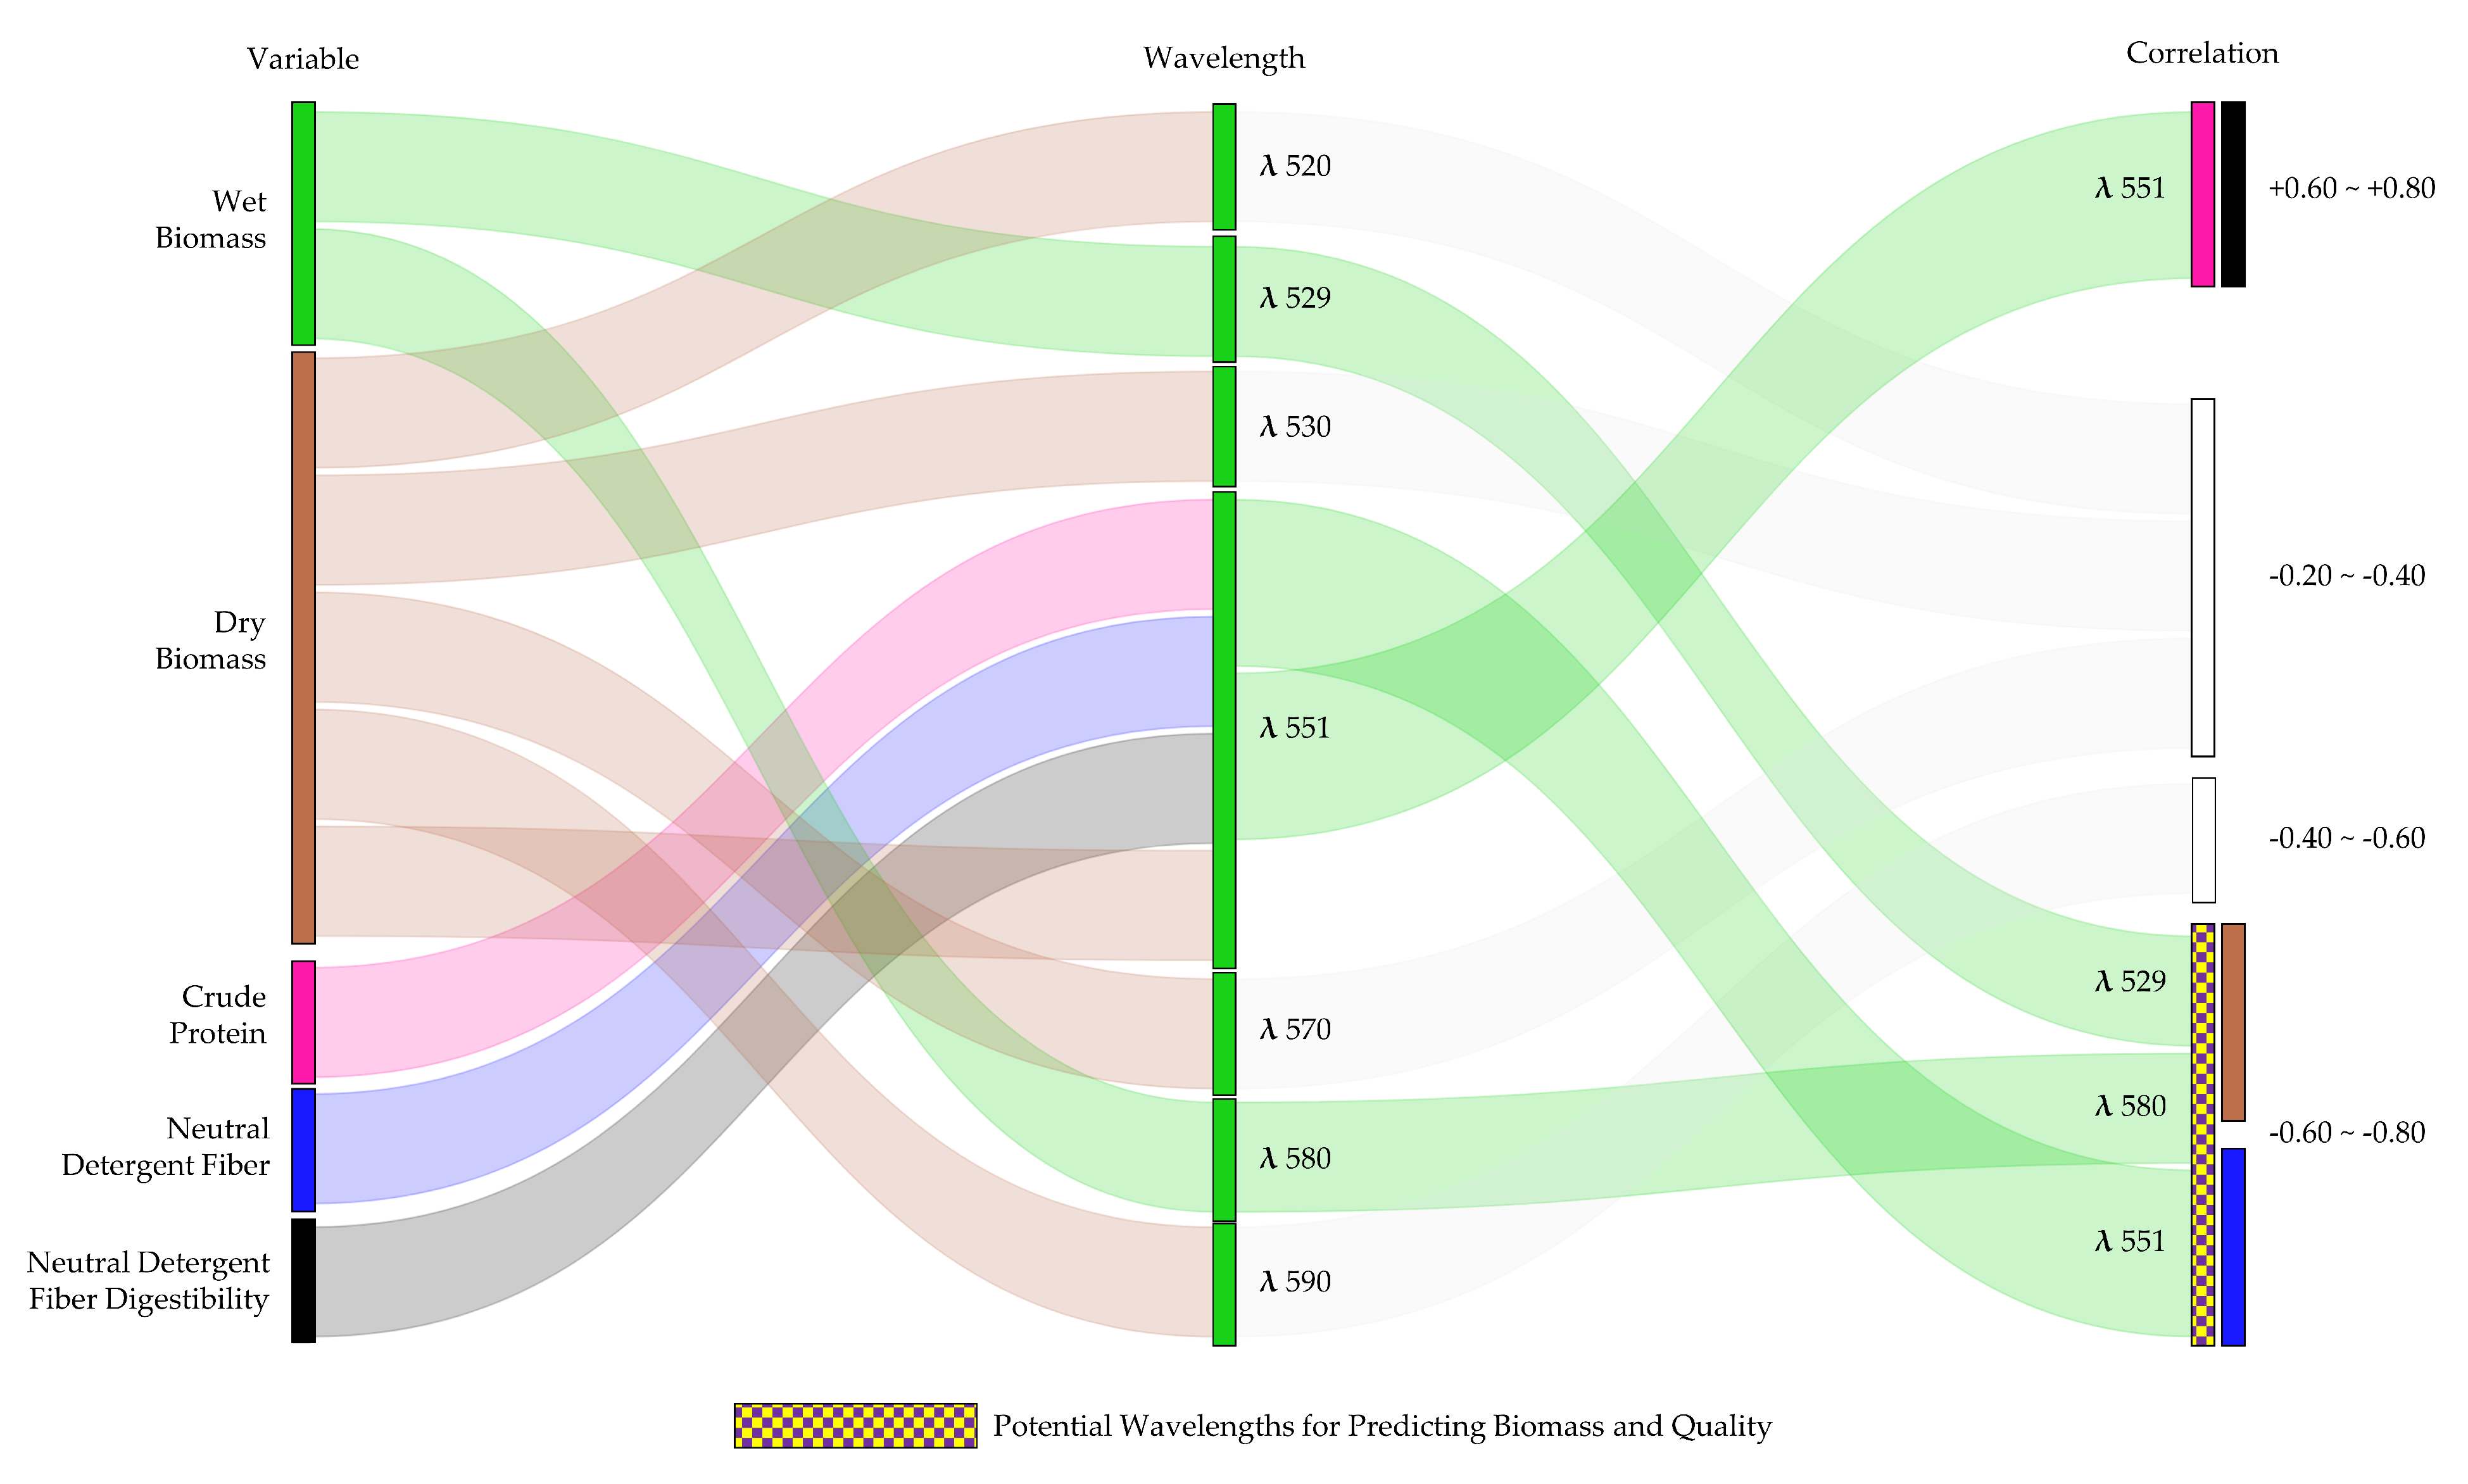
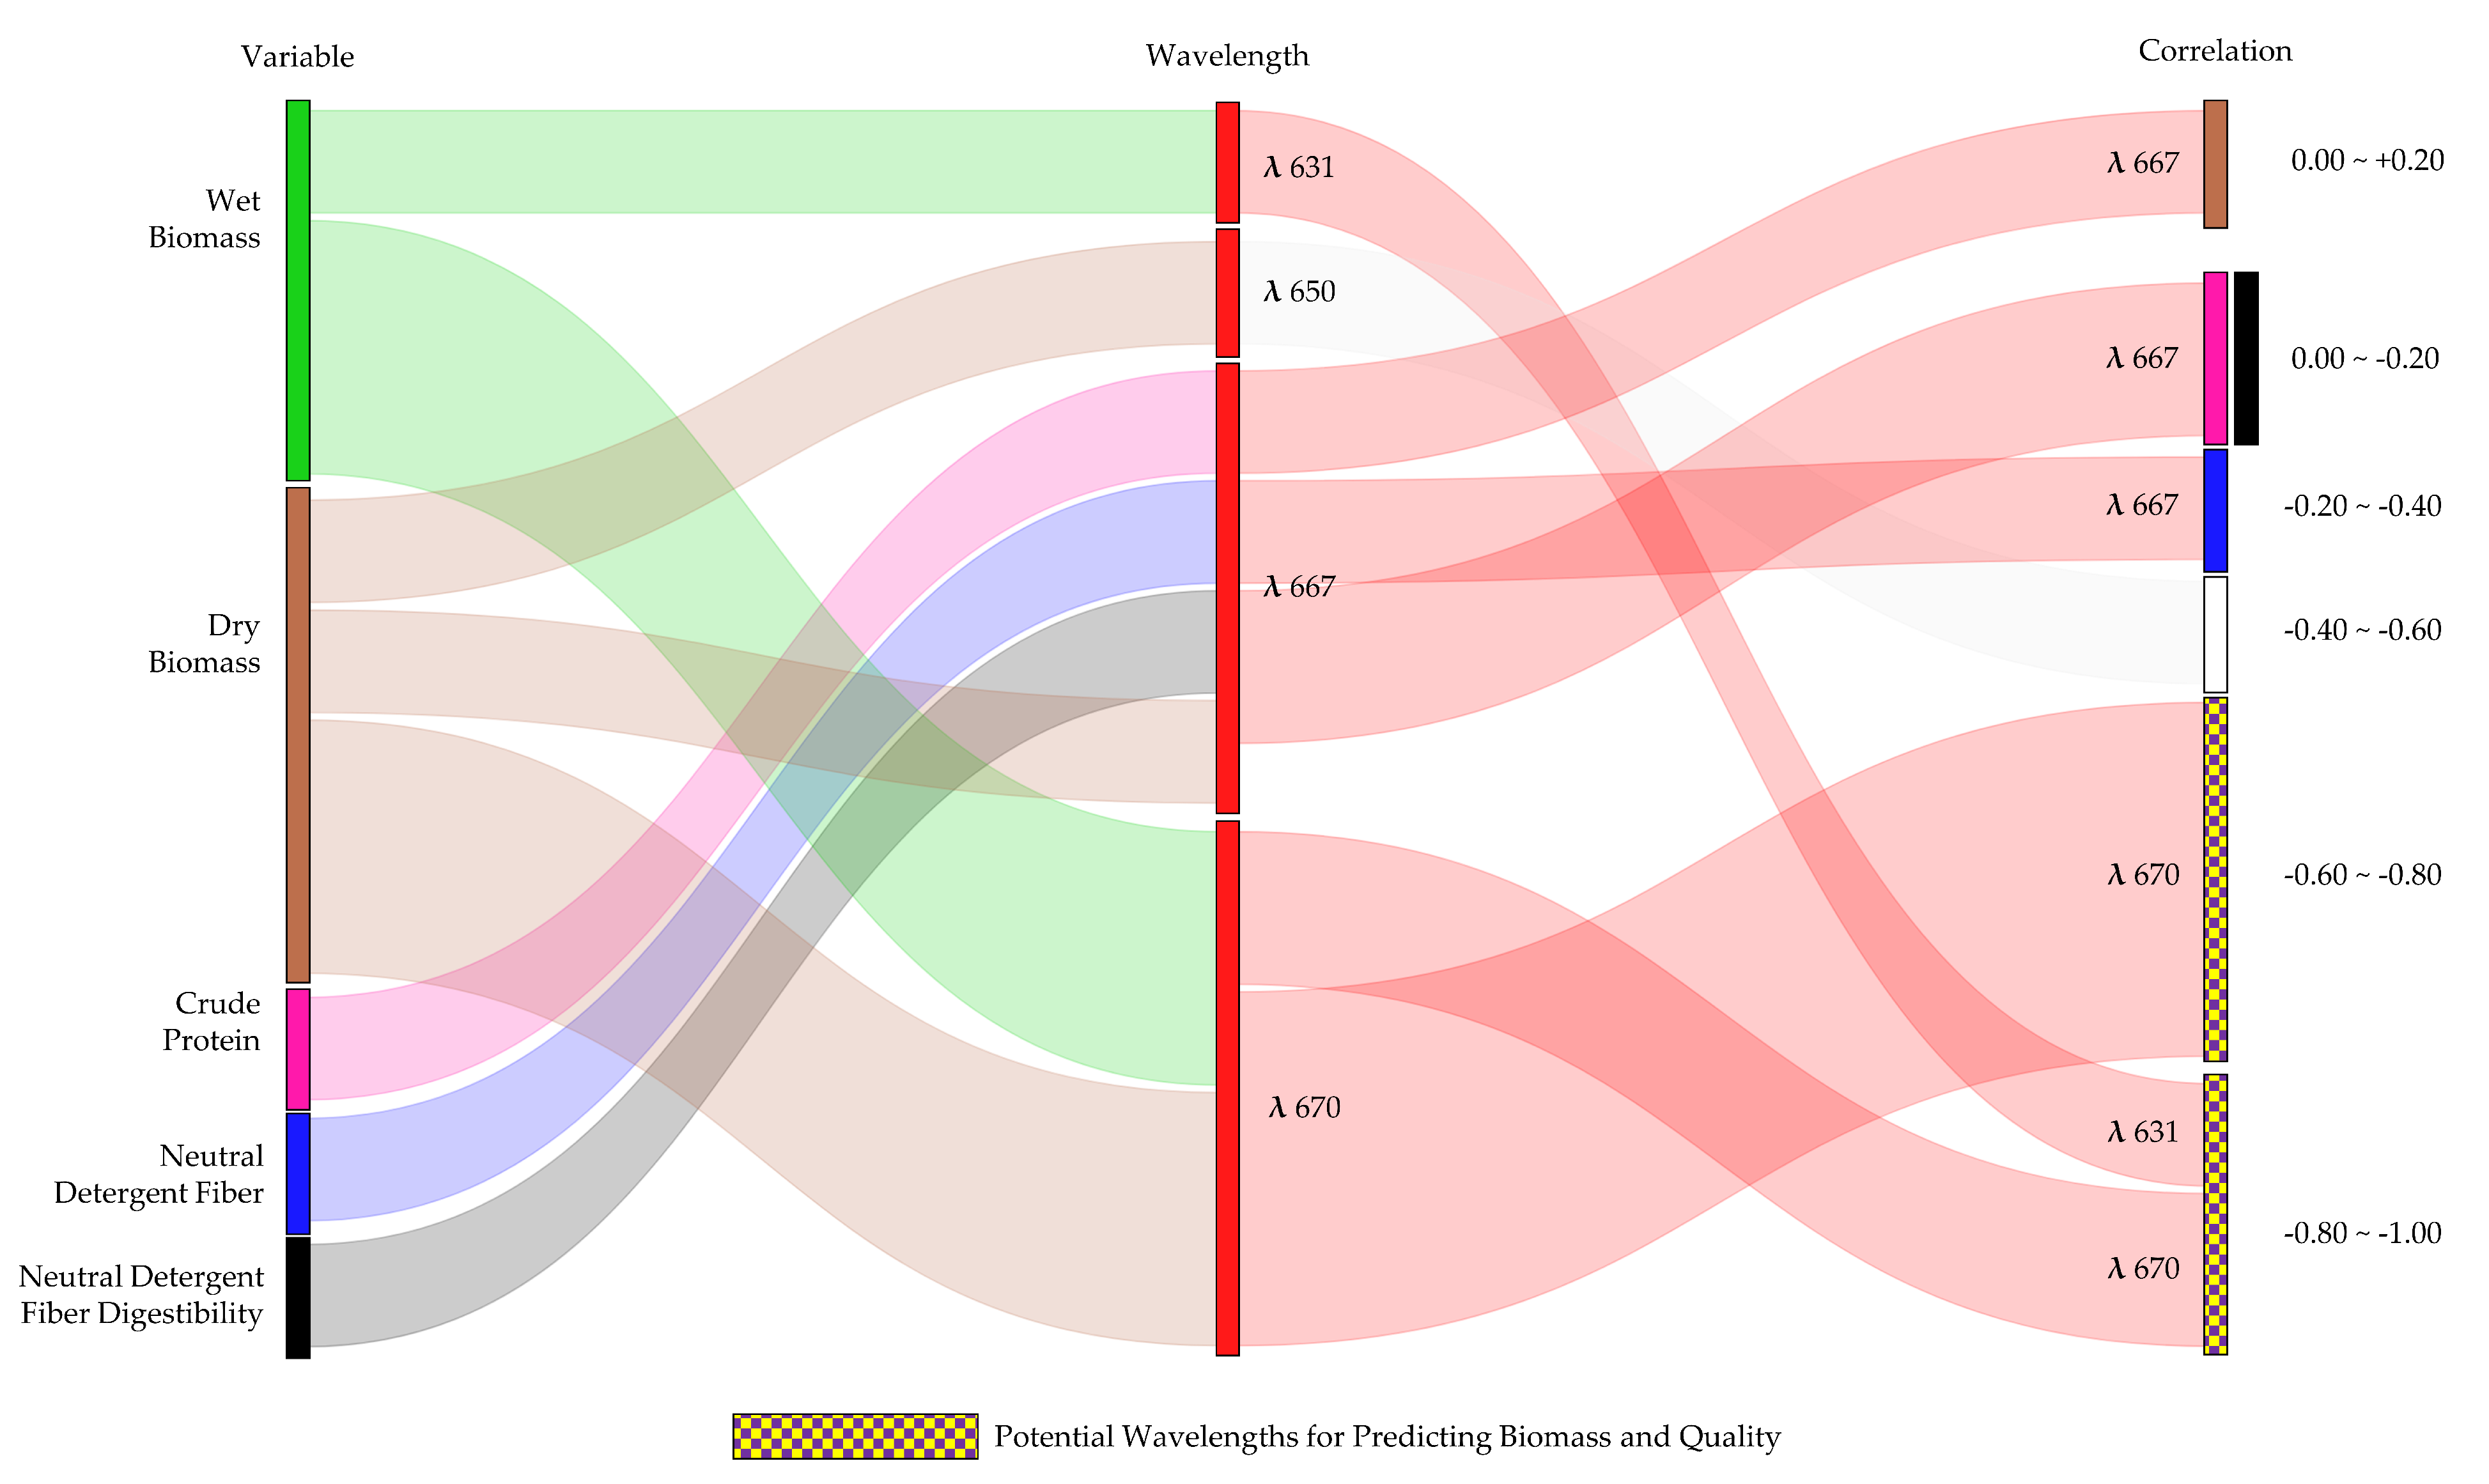
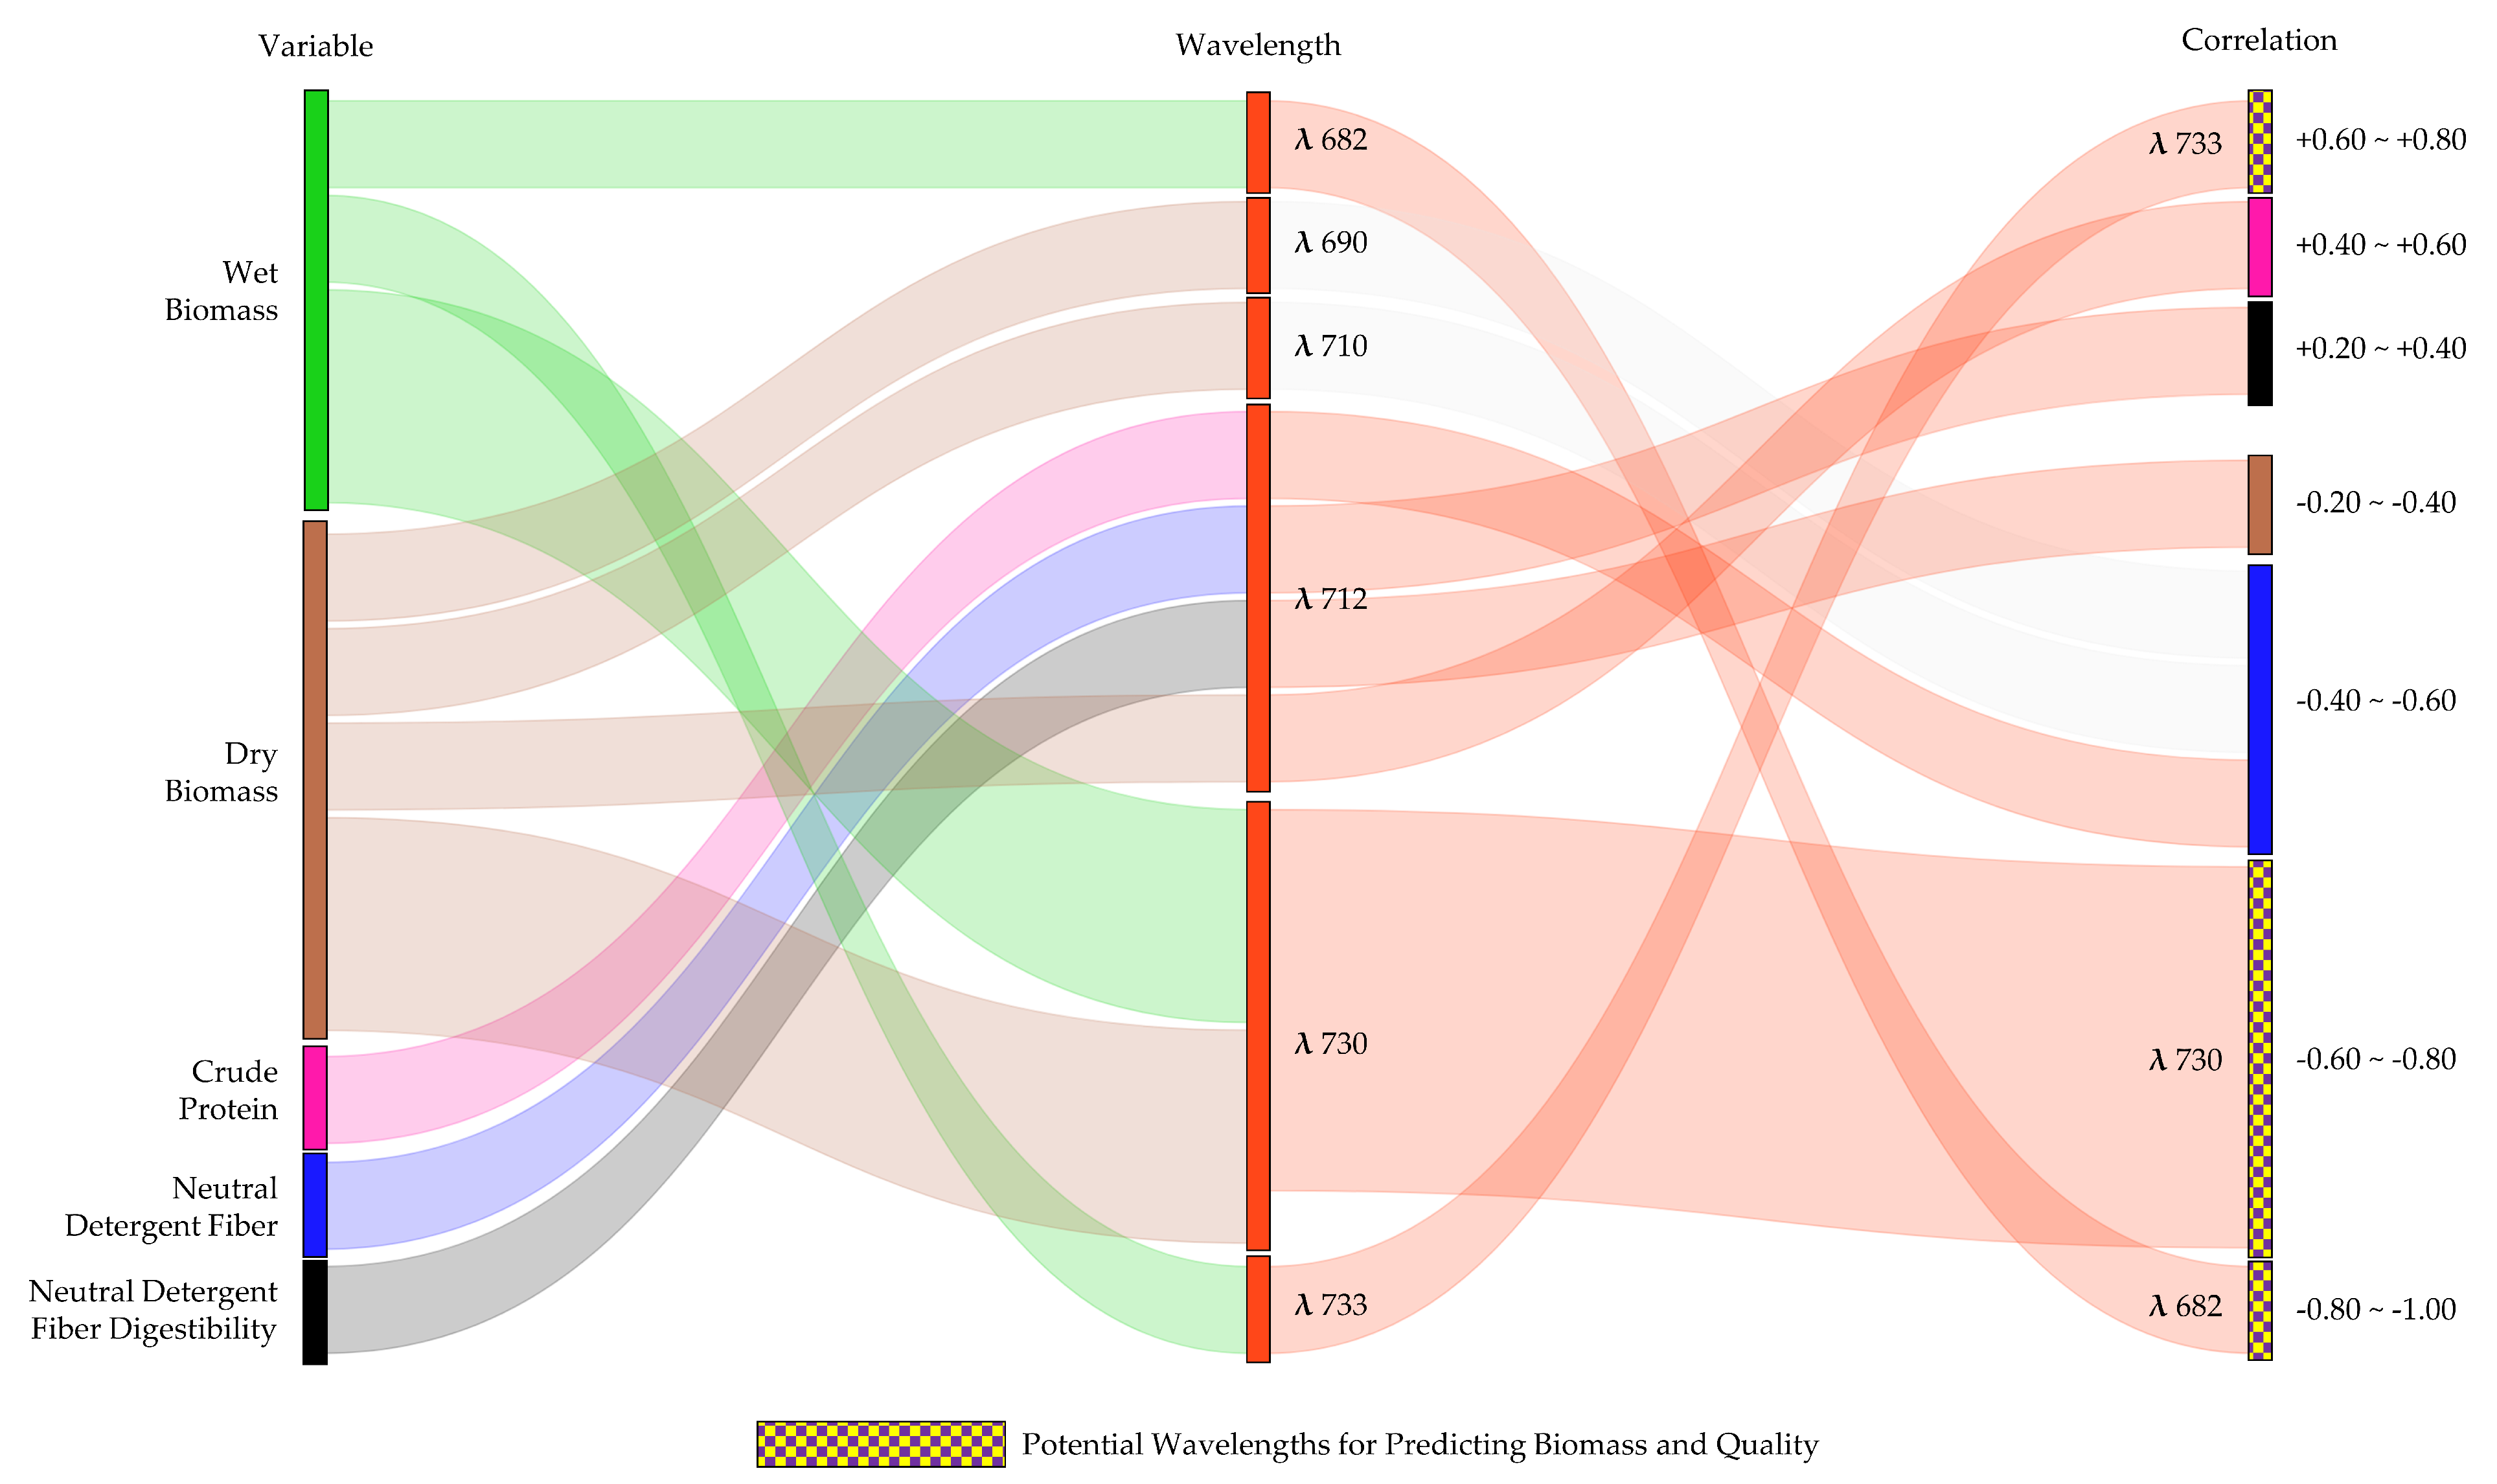
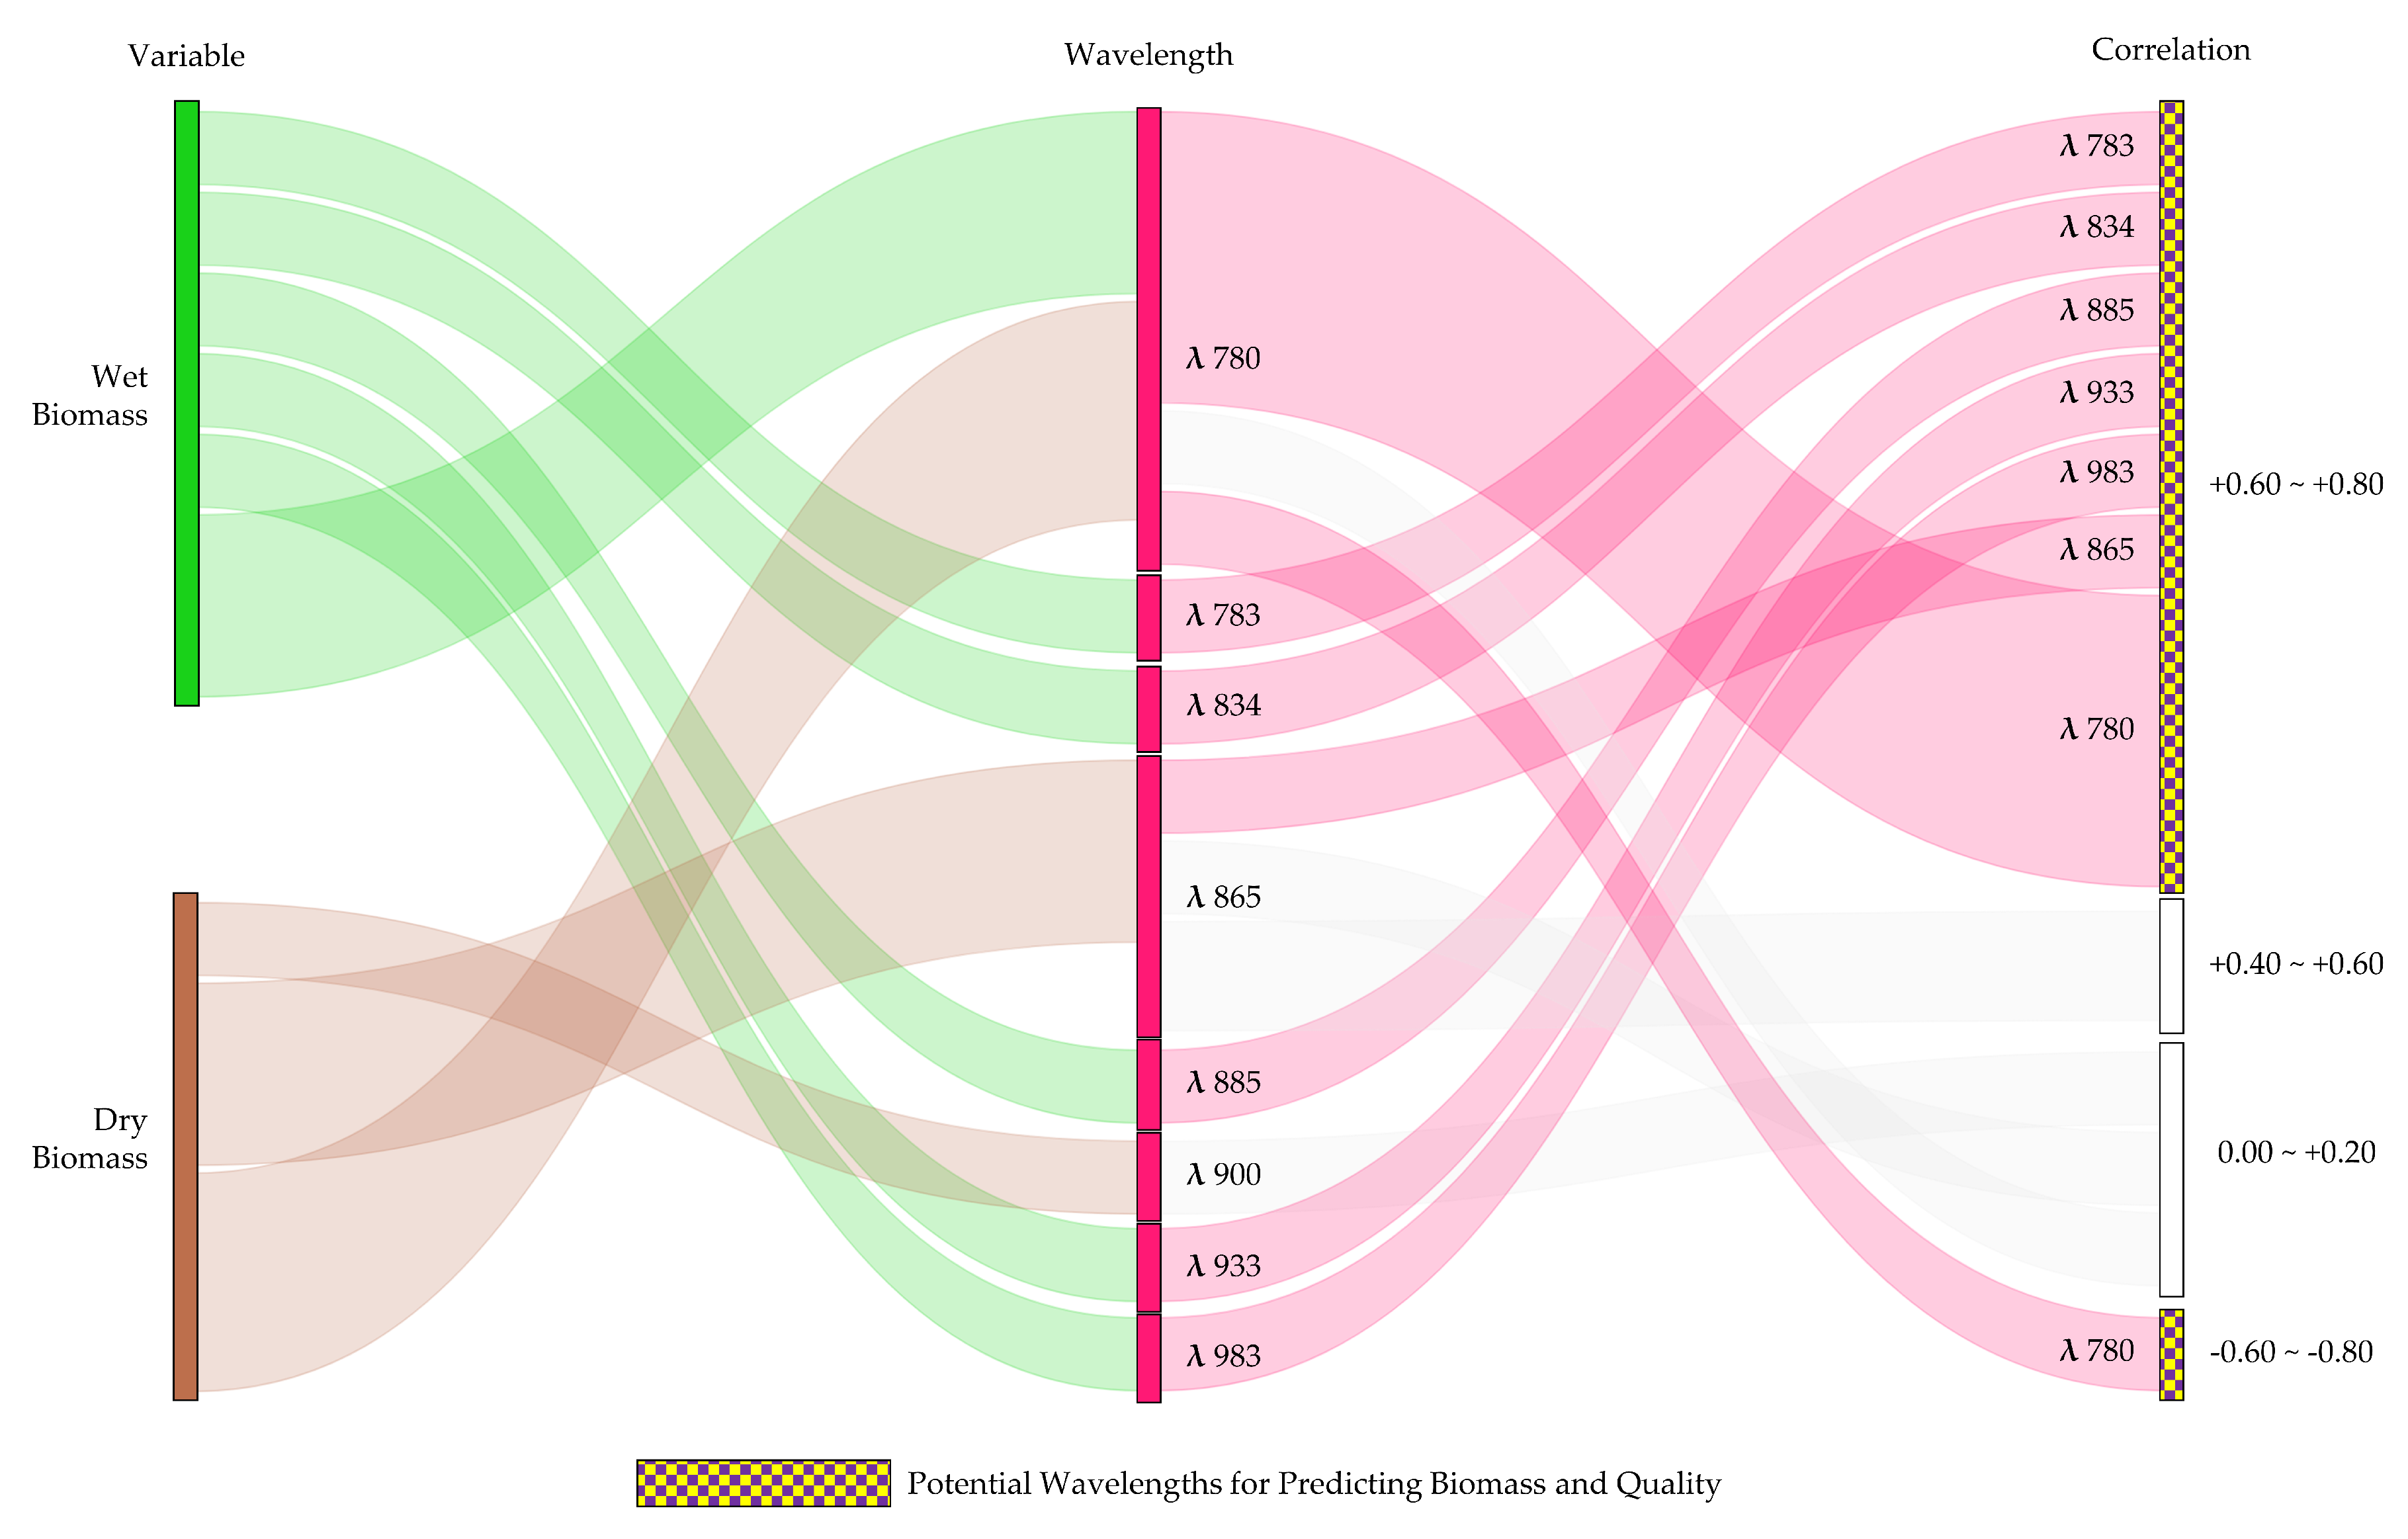
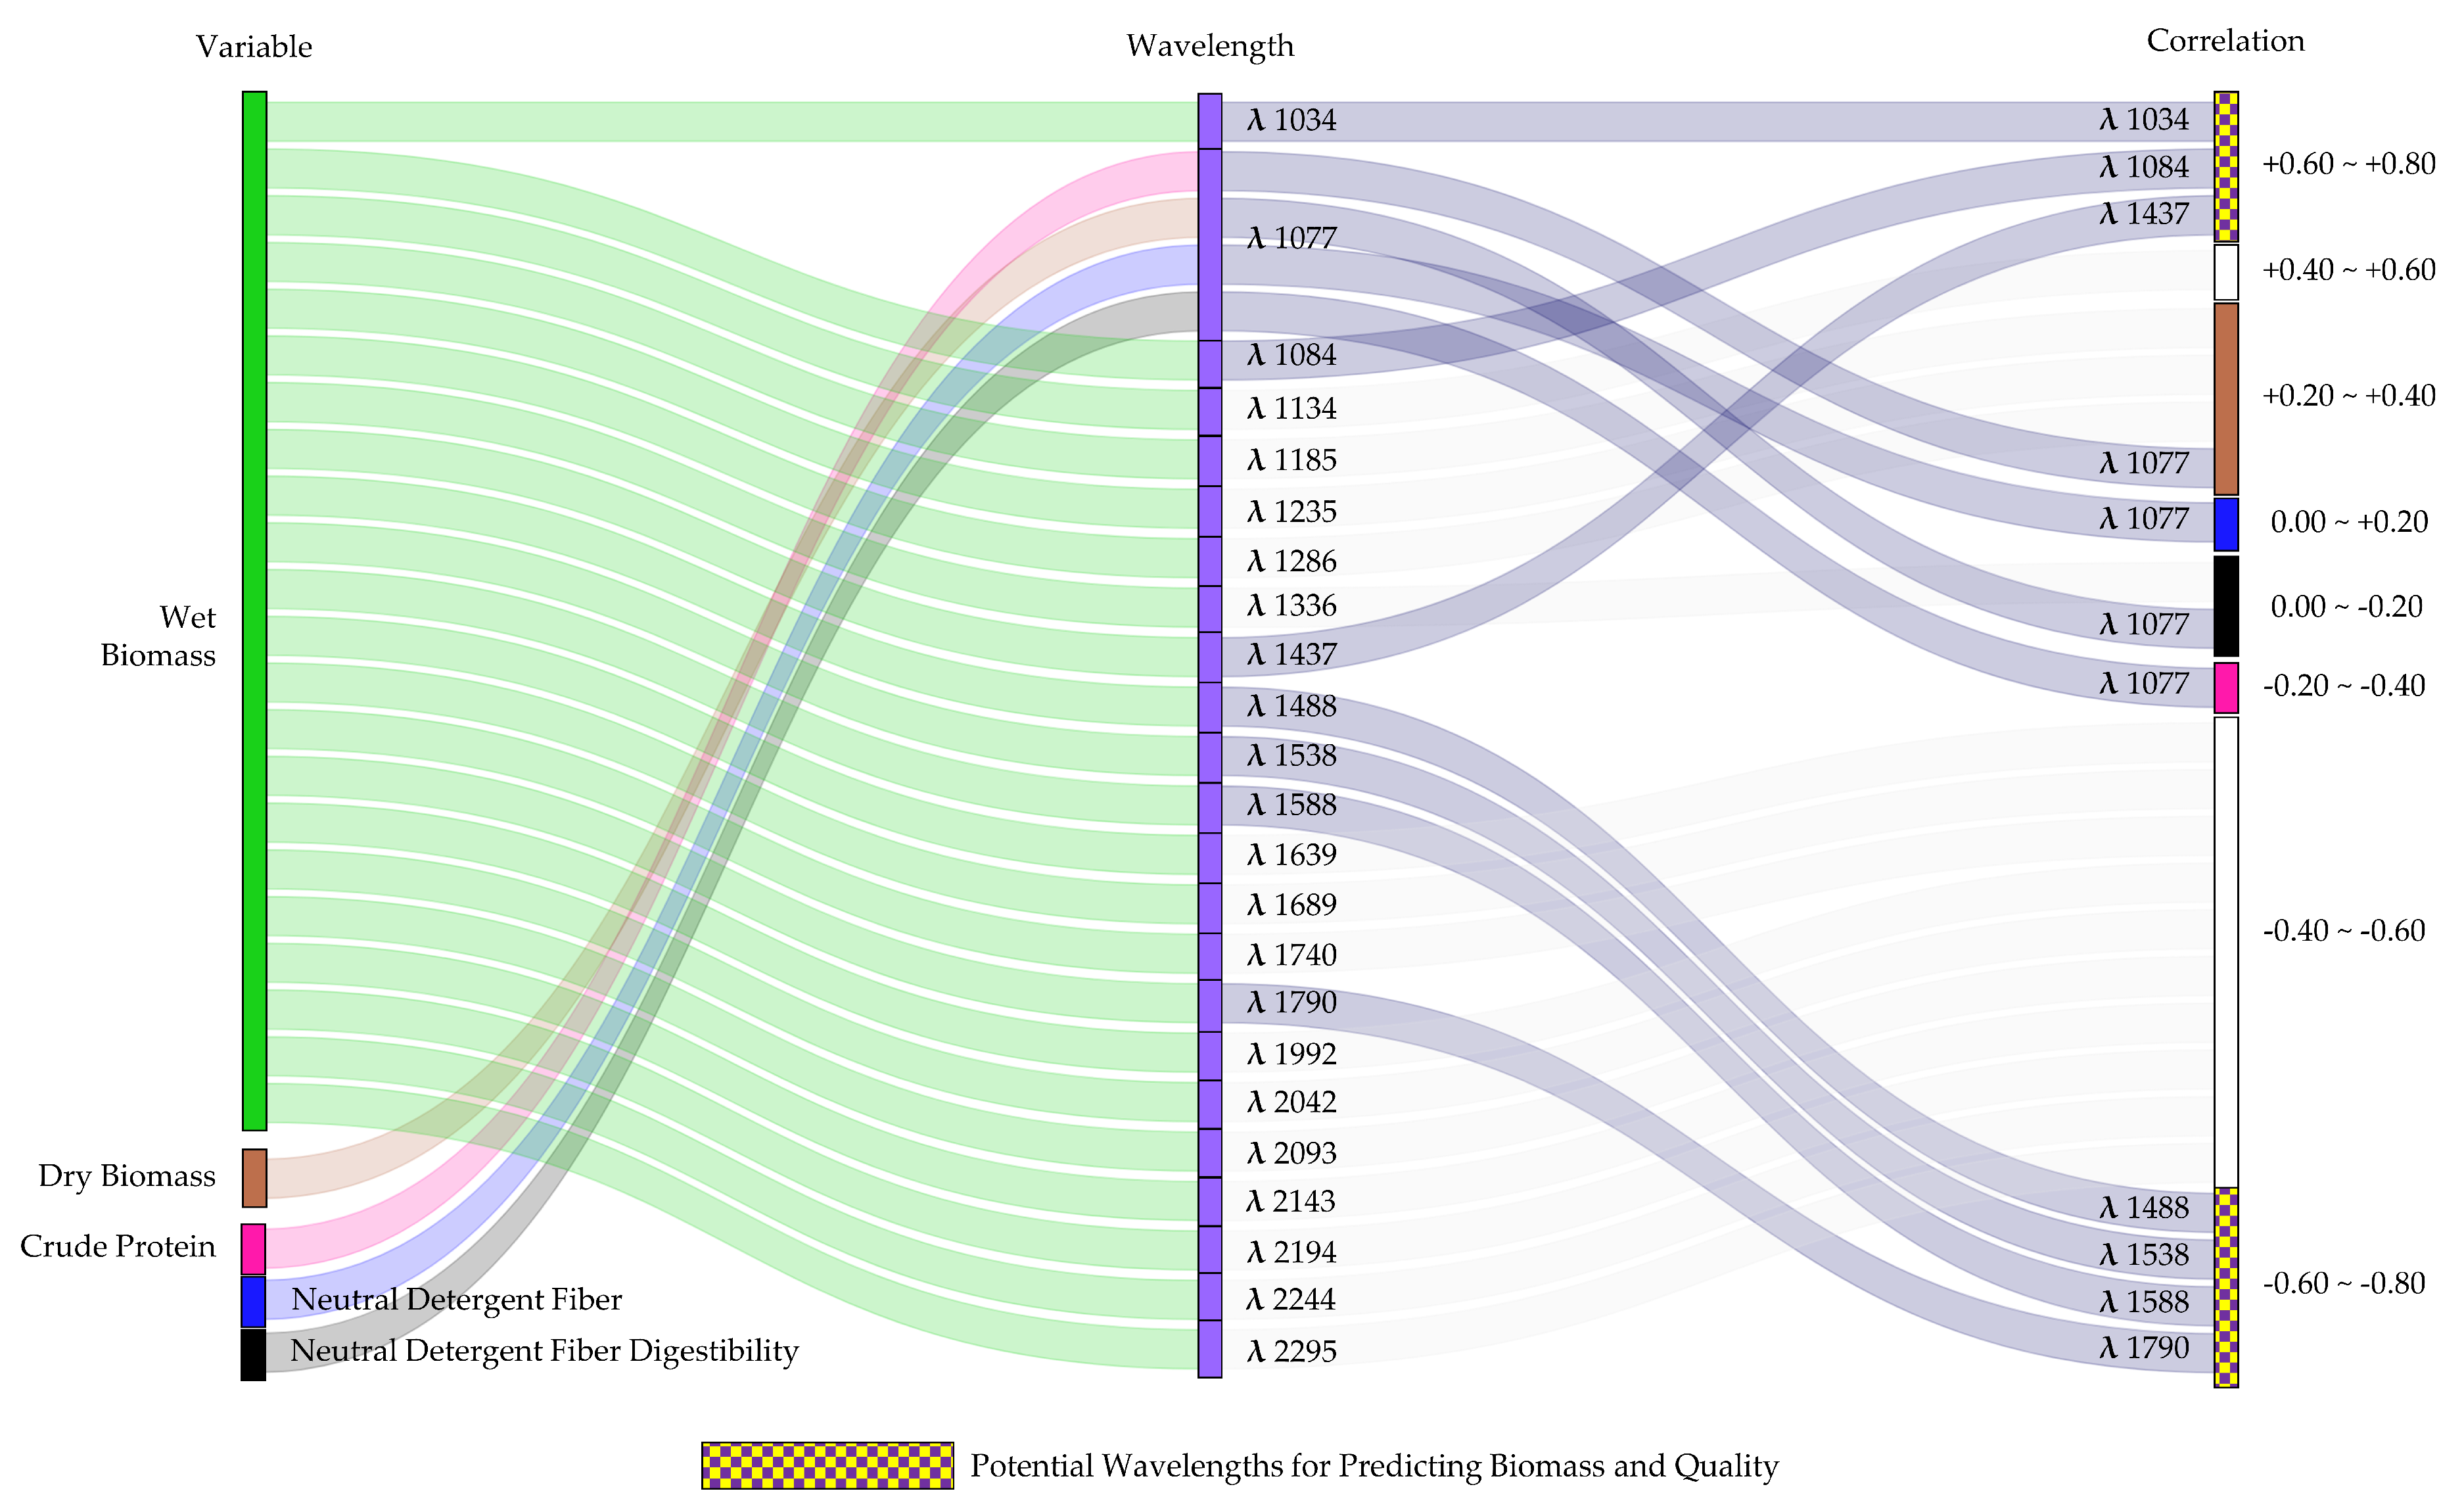
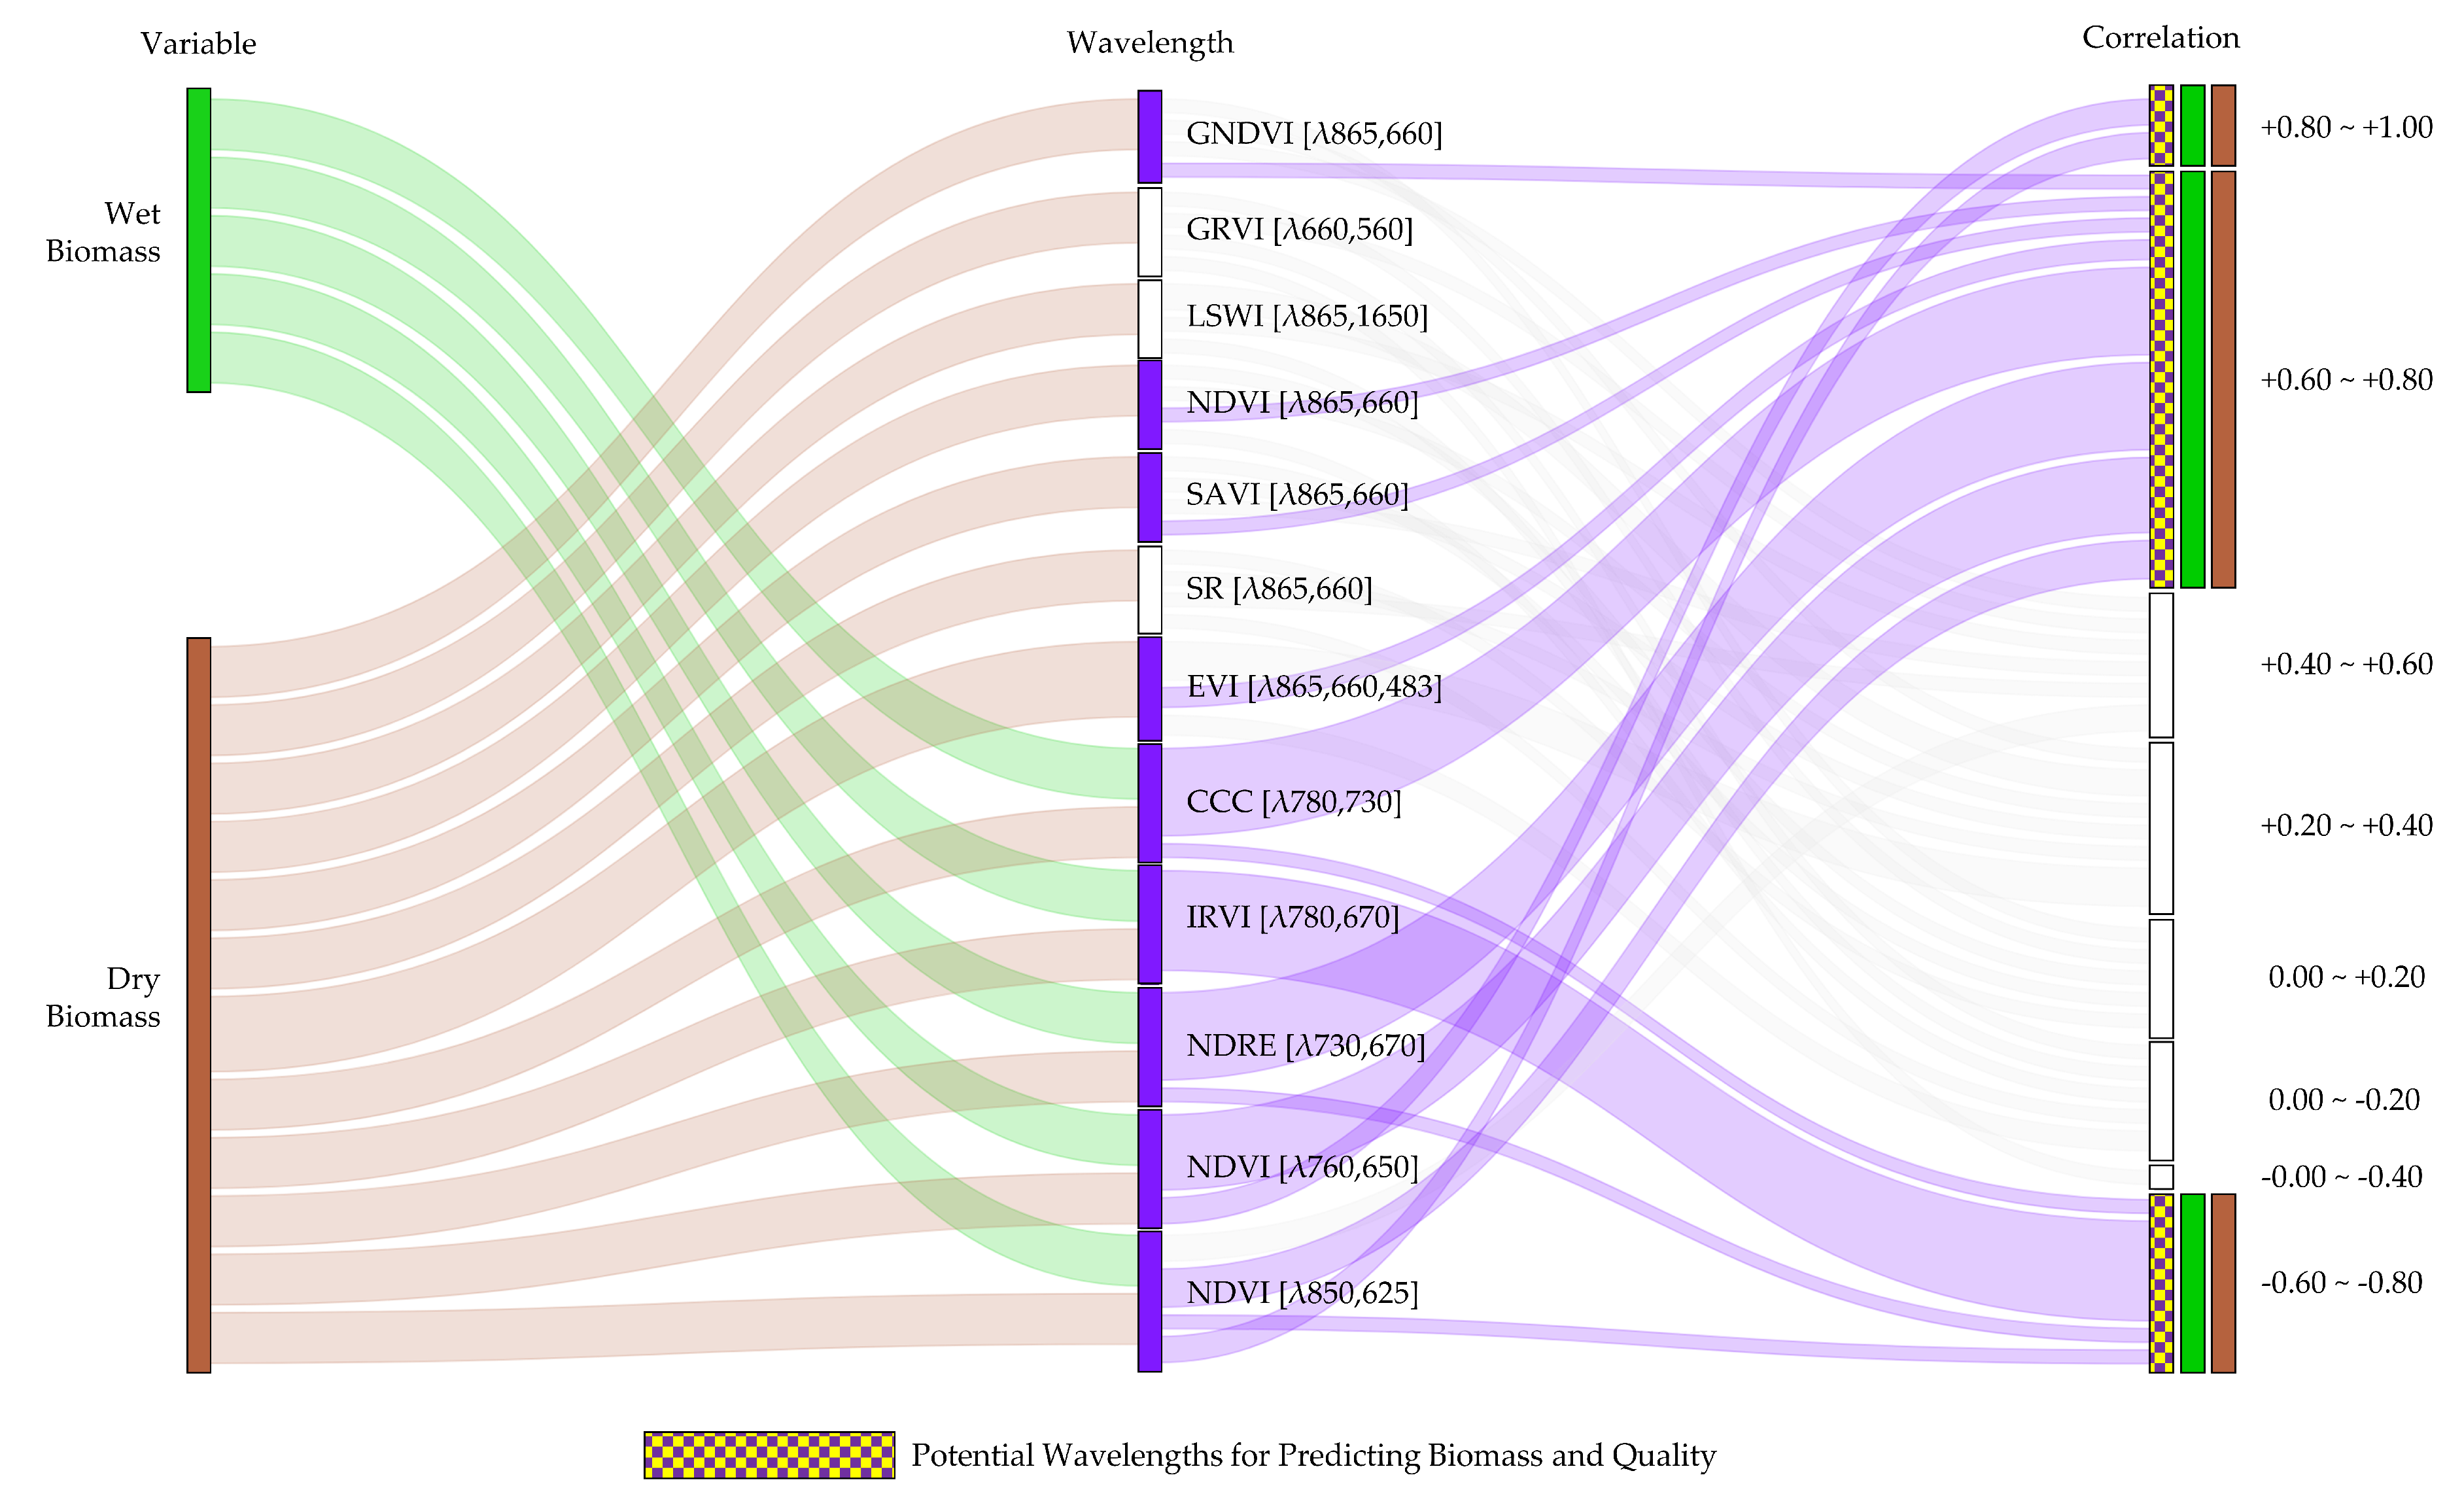
3.3. Potential Wavelengths and Vegetation Indices for Assessing Alfalfa Biomass and Quality

The literature has shown that one of the main goals of applying remote sensing to alfalfa is to offer an alternative to traditional laboratory methods for measuring alfalfa quality traits on the farm. This can be achieved with a handheld sensor, a sensor on a drone or satellite, or a combination of the three.
In this way, most authors used a combination of hyperspectral sensors embedded in terrestrial [23,24,25,26,27,28] and UAV [30,31] platforms. An example of this can be found in Marshall et al. [23], where they evaluated the relationship between each wavelength in the λ 400–2500 nm range with biomass (dry and wet), to obtain the wavelength that better correlates to this feature. In the same way, Feng et al. [30] created several vegetation indices based on information in the range of 400–1000 nm to predict biomass supported on different machine learning techniques. However, identifying wavelengths related to quality traits was reported only by Noland et al. [26], but no clear information regarding the plant development stage and crop cycle was provided. About 36% of studies did not report the cutting cycle during data collection. In the same way, about 36% did not report the plant stage during data collection.
A summary of the main spectral bands and vegetation indices investigated in the relationship between biomass and quality for alfalfa based on revised articles [4,23,26,28,29] was presented in Figure 2. The research reported by Noland et al. [26], demonstrated that dry biomass and NDF have the same behavior as CP and NDFd but are inversely related (Figure 2a). This finding shed light on the possibility of using additional wavelengths and vegetation indices not yet used to assess quality traits. For example, results discovered by Kayad et al., Marshall et al., Pittiman et al., and Cazenave et al. [4,23,28,29] provided evidence that dry biomass is related to wet biomass (Figure 2b), regardless of the type of sensors and platforms. Therefore, by optimizing sensing platforms by embedding sensors with more capability to predict biomass and/or quality, farmers and decision-makers will benefit most from using them.
In this way, we can consider the following wavelengths to assess alfalfa biomass and quality traits: in the blue region ( λ 398, λ 428, and λ 478 nm) (Figure A1); in the green region (529, λ 551, and λ 580 nm) (Figure A2); in the red region ( λ 631, λ 667, and λ 670 nm) (Figure A3); in the red-edge region ( λ 682, λ 712, λ 730, and λ 733 nm) (Figure A4); in near-infrared ( λ 780, λ 783, λ 834, λ 885, λ 933, λ 983 nm) (Figure A5); and in short-wave infrared ( λ 1034, λ 1077, λ 1084, λ 1437, λ 1488, λ 1538, λ 1588, λ 1790 nm) (Figure A6). As well as, the following vegetation indices: CCC [ λ 780, λ 730 nm], EVI [ λ 865, λ 660, λ 483 nm], GNDVI [ λ 865, λ 660 nm], IRVI [ λ 780, λ 670 nm], NDRE [ λ 730, λ 670 nm], NDVI [ λ 865, λ 660 nm], NDVI [ λ 760, λ 650 nm], NDVI [ λ 850, λ 625 nm] and SAVI [ λ 865, λ 660 nm] (Figure A7).

4. Discussion

This study discussed the current status of remote sensing technologies used to quantify alfalfa biomass and investigate quality traits during the last decade. Our study showed the possible wavelengths and vegetation indicators, as well as methodologies for reliable alfalfa biomass and quality trait forecasts, which are widely dispersed in scientific literature. Field inspection using remote sensing platforms can help farmers not only optimize the timing for bailing but achieve better quality [34].
From the remote sensing platforms, it was not surprising to find that most research related to assessing alfalfa biomass and quality relates to using sensors embedded in terrestrial equipment. Terrestrial platforms are accessible and capable of being configured to embed a diversified range of sensors from handhelds (multi-bands) to hyperspectral [7]. However, these platforms are labor intensive and time consuming to physically inspect the on-farm alfalfa crop. Therefore, its use should be well-planned to overcome these challenges. The use of UAVs can outperform the limitations of terrestrial platforms. However, it is relatively more expensive and can only be used under the appropriate weather conditions [35,36]. On the other hand, satellite platforms provide insights into large-scale production monitoring. Unfortunately, it is not yet used to assess alfalfa quality traits. Fortunately, this could change as new platforms and missions with higher temporal and spatial resolutions are being deployed. However, there are still gaps to explore regarding knowing the best combination of spectral information and methods to make alfalfa biomass and quality predictions using these platforms.
Spectral information is powerful in extracting plant traits. For example, in green vegetation, the visible region (400–700 nm) is dominated by light absorption by photosynthetic pigments, near-infrared (700–1100 nm) by dry matter, and SWIR (1100–2500 nm) by water [37]. However, it is not enough just to have a good relationship between spectral information and alfalfa biomass and quality. It is also necessary to model the relationships by adding climatic data in order to enable inferences into a new growing season. Considering the results in Noland et al. [26], it is evident that biomass and quality traits are correlated (Figure 2b). Therefore, multi-target learning can contribute to modeling production and quality simultaneously. Feng et al. [31] provided an example of the multi-target learning approach to predict three quality traits: CP, ADF (cellulose and lignin), and aNDF (total fiber such as cellulose, hemicellulose, and lignin, without ash). However, for this study as well as others reviewed, spectral data acquisition was always collected very close or right at harvesting time, which could be late for a proactive response by farmers. Therefore, research needs to create methods to make these predictions as early as possible before harvesting alfalfa. In addition, multi-target learning is rarely used in research to assess crop quality and less to potentially identify the optimal time for sensing during the crop season.
To improve the predictions for forage biomass and quality, the temporal scale of the available optical satellite imagery will play a critical role, with the possibility of securing daily data during the critical period between forage harvest times. When environmental conditions present a challenge (e.g., cloud coverage), active sensors can provide relevant data as well, and its was proven by Zhou et al. [38], reporting on monitoring alfalfa harvest frequency. In this way, optical-and-radar image fusion can further improve the predictive capability for forage plant traits. Future approaches integrating agro-climatic data (soil-plant traits) with remote sensing will assist in improving the prediction of both alfalfa forage quantity and quality with the goal of enhancing a more sustainable and profitable farming system under climate change and variability. In addition, integrating crop growth models can also assist in providing relevant data on crop phenology and leaf area progress, linked to biomass and N status for alfalfa. Crop growth models have been already tested to simulate alfalfa growth, yield, crude protein, and fiber under climatic and environmental conditions [39,40]. In addition, El-Hajj et al. [41] explored the combination of crop models with optical and radar images in hay crops to make assimilation of irrigation regimes. However, a major limitation of crop growth models is the lack of spatio-temporal information about the actual conditions at farm level [42]. Multi-source remote sensing might help in this regard updating the crop simulation by using vegetation indices or specific wavelengths and automatically correcting alfalfa biomass and quality predictions on a time scale at pixel level. Therefore, combining multi-source remote sensing, crop modeling, and agro-climatic data is the clear path forward to re-design the alfalfa systems and provide timely actionable items to assist farmers in taking relevant decisions within a short timeframe.

5. Conclusions

Our evaluation may be a starting point for strategic innovation in alfalfa production using remote sensing platforms, as well as suggesting future research possibilities. Regardless of the remote sensing platform, we discovered good findings for measuring both biomass and quality characteristics. The literature findings indicate that multi-target learning is a promising approach for analyzing both forage quantity and quality. In addition, combining specific information extracted from different spectral regions from spectral bands with environmental data is the most accurate feature in making predictions. These findings might serve as a foundation for the development of new research and portable sensors to be used directly in the field or embedded in aerial and orbital platforms. Among the deficiencies highlighted by this synthesis analysis, none of the studies evaluated alfalfa quality using satellite imagery. Satellite images with high spatial and temporal resolution would aid in the modeling of the relationship between biomass production and quality. These advances in technology will assist alfalfa production, management, and utilization by enabling farmers to act in a timely manner and make alfalfa production more sustainable.

Author Contributions

Conceptualization, D.T., L.N., C.H., J.F.R., and I.A.C.; methodology, D.T., C.H. and I.A.C.; investigation and data curation, D.T.; formal analysis, D.T. and I.A.C.; writing—original draft preparation, D.T., L.N. and I.A.C.; writing—review and editing, D.T., L.N., D.M., A.S. and I.A.C.; visualization, C.H., J.F.R. and K.J.H.; supervision, project administration and funding acquisition, I.A.C. All authors have read and agreed to the published version of the manuscript.

Funding

Contribution no. 23-072-J from the Kansas Agricultural Experiment Station.

Data Availability Statement

Data is contained within the article.

Conflicts of Interest

Author K.J.H is employed by the company AGCO. The remaining authors declare that the research was conducted in the absence of any commercial or financial relationships that could be construed as a potential conflict of interest. The sponsors had no role in the design, execution, interpretation or writing of the study.

Abbreviations

The following abbreviations are used in this manuscript:
Production and quality indicators
DBDry biomass
WBWet biomass
CPCrude protein
NDFNeutral detergent fiber
NDFdNeutral detergent fiber digestibility
aNDFAsh-corrected neutral detergent fiber
ADFAcid detergent fiber
Methods for prediction or estimation
ANNArtificial neural networks
BRTBoosted regression trees
GPRGaussian process regression
KNNRK-nearest neighbor regression
LASSOLeast absolute shrinkage and selection operator
LRLinear regression
MLRMultiple linear regression
MPLSRModified partial least squares regression
MTLMulti-target learning
NLRNon-linear regression
PLSRPartial least squares regression
RFRRandom forest regression
RIDGERidge regression
SLRStepwise linear regression
STLSingle-target learning
SVRSupport vector regression
Boruta, GS, RReliefFFeature selection method
Non-spectral data
T Temperature
M, U and LIndicates the measured upper limit and lower limits [32]
GDUbase-5 and GDUALTCumulative growing degree units [26]
meanG and medianGChromatic greenness [23]
Remote sensing data
α Levels of a near-infrared reflectance scalar [25]
λ Wavelength, nm
BNDVIBlue normalized difference vegetation index
BWDRVIBlue-wide dynamic range vegetation index
CARIChlorophyll absorption ratio index
CARTECarter index
CICurvature index
CWSICrop water stress index
DATTDouble difference index
DCNIDouble peak canopy nitrogen index
EVIEnhanced vegetation index
GITELSONGitelson index
GNDVIGreen normalized difference vegetation index
IPVIInfrared percentage vegetation index
MBVIMultiple-band vegetation index
MCARIModified chlorophyll absorption ratio index
MCARI/OSAVICombined MCARI/OSAVI
MND705Modified normalized difference vegetation index
MNLIModified non-linear index
MSRModified simple ratio
MSR705Modified simple ratio index
MSRIModified simple ratio index
MTCIMeris terrestrial chlorophyll index
MTVIModified triangular vegetation index
NDCINormalized difference cloud index
NDLINormalized difference lignin index
NDNINormalized difference nitrogen index
NDRENormalized difference red edge
NDSINormalized difference spectral index
NDTINormalized difference tillage index
NDVINormalized difference vegetation index
NVINew vegetation index
OSAVIOptimized soil-adjusted vegetation index
PHORIPhotochemical reflectance index
PHYRIPhysiological reflectance index
RDVIRenormalized difference vegetation index
RERed edge
REIPRed edge inflection point
REPRed edge position index
SPVISpectral polygon vegetation index
SRISimple ratio index
TBVITwo-band vegetation index
TCARITransformed chlorophyll absorption in reflectance index
TCARI/OSAVICombined TCARI/OSAVI
TDVITransformed difference vegetation index
TGITriangular greenness index
VIOPTOptimal vegetation index
VOGVogelmann index
WDRVIWide dynamic range vegetation index

Appendix A

Table A1. Most accurate features for predicting alfalfa biomass using terrestrial platforms.
Biomass—Terrestrial Platform
VariableYearCutting
Cycle
Plant PhaseFeature
Input
WavelengthNon-SpectralMethodPerformance
R2
Citation
DB20052nd10% bloomWDRVI α = 0.1770, 660 nm-NLR0.38[25]
3rd10% bloomBWDRVI α = 0.05770, 450 nm0.26
4th25% bloomWDRVI α = 0.01770, 660 nm0.85
2nd,
3rd,
4th
10–25%
bloom
NDVI770 ± 15,
660 ± 10 nm
0.68
DB2014,
2015
--551, 711, 712,
1073, 1077, 1087 nm
-GDUALTSLR0.85[26]
DB2012,
2015
-35 cm height
and 10% bloom
NDSI
RE
NDSI
DD
940, 1122 nm
λ 670, λ 780 nm
940, 1122 nm
749, 720,
701, 672 nm
-NLR0.65
0.11
0.47
0.33
[24]
WB2011,
2012
-Sprouting
and
Flowering
1528, 438,
499, 458,
1508 and 448 nm
[First Derivative]
-meanG
and
medianG
LR0.89[23]
Table A2. Most accurate features for predicting alfalfa biomass using UAV platforms.
Biomass—UAV Platform
VariableYearCutting
Cycle
Plant PhaseFeature
Input
WavelengthNon-SpectralMethodPerformance
R2
Citation
DB2020--Datt1, MCARI1, MTCI2,
MCARI/OSAVI1,MTCI1,
REP2, PRI[531,570],
SR[675,700], NDVI[521,689],
NDVI[717,732], REP1,
TCARI/OSAVI1, NVI2,
TCARI2, TCARI/OSAVI2
NDVI[720,820], Carte4,
NDVI[734,750], VOG3,
PRI[528,567], VOG2,
NDRE, SRI[533,565],
EVI, SRI[720,735]
400–1000 nm-Ensemble0.87[30]
WB20181st, 2ndFirst BloomCSWL, MNL668 ± 5, 840 ± 20 nm,
T canopy, T air,
M, U and L
-MLR0.68[32]
Table A3. Most accurate features for predicting alfalfa biomass using satellite platforms.
Biomass—Satellite Platform
VariableYearCutting
Cycle
Plant PhaseFeature
Input
WavelengthNon-SpectralMethodPerformance
R2
Citation
DB2014--Sum(LSWI), AUC(LSWI),
SumPeaks(LSWI)
837 ± 24, 1603 ± 32 nm-GPR-Boruta0.91[33]
Sum(NDVI),
AUC(NDVI)
837 ± 24, 655 ± 41 nm
AUC(SR),
Sum+Slopes(SR)
837 ± 24, 655 ± 41 nm
SumPeaks(EVI2),
Sum| Slopes| (EVI2),
Sum+Slopes(EVI2)
837 ± 24, 655 ± 41 nm
2015--Sum(LSWI), #Peaks(LSWI)837 ± 24, 1603 ± 32 nm-GPR-GS0.92
Sum(NDVI)837 ± 24, 655 ± 41 nm
AUC(EVI2), Sum + Slopes(EVI2),
Sum| Slopes| (EVI2), Sum(EVI2)
837 ± 24, 655 ± 41 nm
Sum(OSAVI), Sum+Slopes(OSAVI),
Sum|Slopes|(OSAVI)
837 ± 24, 655 ± 41 nm
2016--AUC(LSWI), Sum(LSWI),
SumPeaks(LSWI), #Peaks(LSWI)
λ 837 ± 24, λ 1603 ± 32 nm-GPR-RReliefF0.89
AUC(NDVI), Sum(NDVI) λ 837 ± 24, λ 655 ± 41 nm
AUC(OSAVI), Sum(OSAVI) λ 837 ± 24, λ 655 ± 41 nm
Sum(EVI2), Sum+Slopes(EVI2) λ 837 ± 24, λ 655 ± 41 nm
Table A4. Most accurate features for predicting alfalfa quality traits using terrestrial platforms.
Biomass—Terrestrial Platform
VariableYearCutting
Cycle
Plant PhaseFeature
Input
WavelengthNon-SpectralMethodPerformance
R2
Citation
CP2014–
2015
--551, 711,
712,1073,
1077, 1087 nm   
-GDUALTSLR0.91[26]
NDF2014–
2015
--551, 711,
712, 1073,
1077, 1087 nm
-GDUALTSLR0.87
2005–
2008
-Late bud
to 10th Flower  
400–1349 nm--MPLSR0.77[27]
NDFd2014–
2015
--551, 711,
712, 1073,
1077, 1087 nm    
-GDUALTSLR0.87[26]
ADF2005–
2008
-Late bud
to 10th
 Flower
400–1349 nm--MPLSR0.83[27]
Table A5. Most accurate features for predicting alfalfa quality traits using UAV platforms.
Biomass—UAV Platform
VariableYearCutting
Cycle
Plant PhaseFeature
Input
WavelengthNon-SpectralMethodPerformance
R2
Citation
CP20192nd-400–1000 nm--SVR0.75[31]
3rdRFR0.81
4thSVR0.77
2nd, 3rd, 4thMTL0.84
aNDF20192nd-400–1000 nm--SVR0.54
3rdRFR0.54
4thSVR0.54
2nd, 3rd, 4thMTL0.66
ADF20192nd-400–1000 nm--SVR0.60
3rdRFR0.58
4thSVR0.53
2nd, 3rd, 4thMTL0.69

Appendix B

Figure A1. Sankey diagram illustrates the wavelengths in the blue region ( λ 350−490) most correlated with alfalfa biomass and quality traits. The flow chart intuitively displays bars and paths drawn in proportion to the amount of information used. The larger the bars, the more times this information has been used. Colored pathways assign the connections between alfalfa biomass and quality traits and its usage in remote sensing data (i.e., wavelengths or vegetation indices) as well as its response to the strength of the correlation. When wavelength or vegetation indices have the potential to be used to establish a relationship with biomass and quality traits, they are marked. The colors of each correlation bar are linked to the biomass and quality traits. When it is white, it is because it has no potential to be used. However, when the bar is colored and checkered, it indicates that although it has not been used to study its relationship with quality, it has the potential to predict it assuming its correlation with biomass.
Remotesensing 14 04940 g0a1
Figure A2. Sankey diagram illustrates the wavelengths in the green region ( λ 520−590) most correlated with alfalfa biomass and quality traits. The flow chart intuitively displays bars and paths drawn in proportion to the amount of information used. The larger the bars, the more times this information has been used. Colored pathways assign the connections between alfalfa biomass and quality traits and its usage in remote sensing data (i.e., wavelengths or vegetation indices) as well as its response to the strength of the correlation. When wavelength or vegetation indices have the potential to be used to establish a relationship with biomass and quality traits, they are marked. The colors of each correlation bar are linked to the biomass and quality traits. When it is white, it is because it has no potential to be used. However, when the bar is colored and checkered, it indicates that although it has not been used to study its relationship with quality, it has the potential to predict it assuming its correlation with biomass.
Remotesensing 14 04940 g0a2
Figure A3. Sankey diagram illustrates the wavelengths in the red region ( λ 620−670) most correlated with alfalfa biomass and quality traits. The flow chart intuitively displays bars and paths drawn in proportion to the amount of information used. The larger the bars, the more times this information has been used. Colored pathways assign the connections between alfalfa biomass and quality traits and its usage in remote sensing data (i.e., wavelengths or vegetation indices) as well as its response to the strength of the correlation. When wavelength or vegetation indices have the potential to be used to establish a relationship with biomass and quality traits, they are marked. The colors of each correlation bar are linked to the biomass and quality traits. When it is white, it is because it has no potential to be used. However, when the bar is colored and checkered, it indicates that although it has not been used to study its relationship with quality, it has the potential to predict it assuming its correlation with biomass.
Remotesensing 14 04940 g0a3
Figure A4. Sankey diagram illustrates the wavelengths in the red edge region ( λ 680−730) most correlated with alfalfa biomass and quality traits. The flow chart intuitively displays bars and paths drawn in proportion to the amount of information used. The larger the bars, the more times this information has been used. Colored pathways assign the connections between alfalfa biomass and quality traits and its usage in remote sensing data (i.e., wavelengths or vegetation indices) as well as its response to the strength of the correlation. When wavelength or vegetation indices have the potential to be used to establish a relationship with biomass and quality traits, they are marked. The colors of each correlation bar are linked to the biomass and quality traits. When it is white, it is because it has no potential to be used. However, when the bar is colored and checkered, it indicates that although it has not been used to study its relationship with quality, it has the potential to predict it assuming its correlation with biomass.
Remotesensing 14 04940 g0a4
Figure A5. Sankey diagram illustrates the wavelengths in the near-infrared region ( λ 760−1000) most correlated with alfalfa biomass and quality traits. The flow chart intuitively displays bars and paths drawn in proportion to the amount of information used. The larger the bars, the more times this information has been used. Colored pathways assign the connections between alfalfa biomass and quality traits and its usage in remote sensing data (i.e., wavelengths or vegetation indices) as well as its response to the strength of the correlation. When wavelength or vegetation indices have the potential to be used to establish a relationship with biomass and quality traits, they are marked. The colors of each correlation bar are linked to the biomass and quality traits. When it is white, it is because it has no potential to be used. However, when the bar is colored and checkered, it indicates that although it has not been used to study its relationship with quality, it has the potential to predict it assuming its correlation with biomass.
Remotesensing 14 04940 g0a5
Figure A6. Sankey diagram illustrates the wavelengths in the short-wave infrared region ( λ 1000−2300) most correlated with alfalfa biomass and quality traits. The flow chart intuitively displays bars and paths drawn in proportion to the amount of information used. The larger the bars, the more times this information has been used. Colored pathways assign the connections between alfalfa biomass and quality traits and its usage in remote sensing data (i.e., wavelengths or vegetation indices) as well as its response to the strength of the correlation. When wavelength or vegetation indices have the potential to be used to establish a relationship with biomass and quality traits, they are marked. The colors of each correlation bar are linked to the biomass and quality traits. When it is white, it is because it has no potential to be used. However, when the bar is colored and checkered, it indicates that although it has not been used to study its relationship with quality, it has the potential to predict it assuming its correlation with biomass.
Remotesensing 14 04940 g0a6
Figure A7. Sankey diagram illustrates the vegetation indices most correlated with alfalfa biomass and quality traits. The flow chart intuitively displays bars and paths drawn in proportion to the amount of information used. The larger the bars, the more times this information has been used. Colored pathways assign the connections between alfalfa biomass and quality traits and its usage in remote sensing data (i.e., wavelengths or vegetation indices) as well as its response to the strength of the correlation. When wavelength or vegetation indices have the potential to be used to establish a relationship with biomass and quality traits, they are marked. The colors of each correlation bar are linked to the biomass and quality traits. When it is white, it is because it has no potential to be used. However, when the bar is colored and checkered, it indicates that although it has not been used to study its relationship with quality, it has the potential to predict it assuming its correlation with biomass.
Remotesensing 14 04940 g0a7

References

  1. Hoque, M.; Akash; Mondal, S.; Adusumilli, S. Chapter Eighteen—Way forward for sustainable livestock sector. In Emerging Issues in Climate Smart Livestock Production; Mondal, S., Singh, R.L., Eds.; Academic Press: New York, NY, USA, 2022; pp. 473–488. [Google Scholar] [CrossRef]
  2. Mottet, A.; Haan, C.; Falcucci, A.; Tempio, G.; Opio, C.; Gerber, P. Livestock: On our plates or eating at our table? A new analysis of the feed/food debate. Glob. Food Secur. 2017, 14, 1–8. [Google Scholar] [CrossRef]
  3. Cheng, M.; McCarl, B.; Fei, C. Climate Change and Livestock Production: A Literature Review. Atmosphere 2022, 13, 140. [Google Scholar] [CrossRef]
  4. Kayad, A.G.; Al-Gaadi, K.A.; Tola, E.; Madugundu, R.; Zeyada, A.M.; Kalaitzidis, C. Assessing the Spatial Variability of Alfalfa Yield Using Satellite Imagery and Ground-Based Data. PLoS ONE 2016, 11, e0157166. [Google Scholar] [CrossRef] [PubMed] [Green Version]
  5. Benami, E.; Jin, Z.; Carter, M.R.; Ghosh, A.; Hijmans, R.J.; Hobbs, A.; Kenduiywo, B.; Lobell, D.B. Uniting remote sensing, crop modelling and economics for agricultural risk management. Nat. Rev. Earth Environ. 2021, 2, 140–159. [Google Scholar] [CrossRef]
  6. Jung, J.; Maeda, M.; Chang, A.; Bhandari, M.; Ashapure, A.; Landivar-Bowles, J. The potential of remote sensing and artificial intelligence as tools to improve the resilience of agriculture production systems. Curr. Opin. Biotechnol. 2021, 70, 15–22. [Google Scholar] [CrossRef]
  7. Tao, H.; Xu, S.; Tian, Y.; Li, Z.; Ge, Y.; Zhang, J.; Wang, Y.; Zhou, G.; Deng, X.; Zhang, Z.; et al. Proximal and remote sensing in plant phenomics: 20 years of progress, challenges, and perspectives. Plant Commun. 2022, 100344. [Google Scholar] [CrossRef]
  8. Yu, H.; Kong, B.; Hou, Y.; Xu, X.; Chen, T.; Liu, X. A critical review on applications of hyperspectral remote sensing in crop monitoring. Exp. Agric. 2022, 58, e26. [Google Scholar] [CrossRef]
  9. Ali, A.M.; Abouelghar, M.; Belal, A.; Saleh, N.; Yones, M.; Selim, A.I.; Amin, M.E.; Elwesemy, A.; Kucher, D.E.; Maginan, S.; et al. Crop Yield Prediction Using Multi Sensors Remote Sensing (Review Article). Egypt J. Remote Sens. Space Sci. 2022, 25, 711–716. [Google Scholar] [CrossRef]
  10. Zhao, R.; Li, Y.; Ma, M. Mapping Paddy Rice with Satellite Remote Sensing: A Review. Sustainability 2021, 13, 503. [Google Scholar] [CrossRef]
  11. Hanna, M.M.; Steyn-Ross, D.A.; Steyn-Ross, M. Estimating Biomass for New Zealand Pasture Using Optical Remote Sensing Techniques. Geocarto Int. 1999, 14, 89–94. [Google Scholar] [CrossRef]
  12. Schut, A.G.T.; Ketelaars, J.J.M.H. Monitoring grass swards using imaging spectroscopy. Grass Forage Sci. 2003, 58, 276–286. [Google Scholar] [CrossRef]
  13. Lu, D.; Batistella, M.; Moran, E. Satellite Estimation of Aboveground Biomass and Impacts of Forest Stand Structure. Photogramm. Eng. Remote Sens. 2005, 71, 967–974. [Google Scholar] [CrossRef] [Green Version]
  14. Calvão, T.; Palmeirim, J.M. Mapping Mediterranean scrub with satellite imagery: Biomass estimation and spectral behaviour. Int. J. Remote Sens. 2004, 25, 3113–3126. [Google Scholar] [CrossRef]
  15. Elfanssi, S.; Ouazzani, N.; Mandi, L. Soil properties and agro-physiological responses of alfalfa (Medicago sativa L.) irrigated by treated domestic wastewater. Agric. Water Manag. 2018, 202, 231–240. [Google Scholar] [CrossRef]
  16. Wang, S.; Guo, K.; Ameen, A.; Fang, D.; Li, X.; Liu, X.; Han, L. Evaluation of Different Shallow Groundwater Tables and Alfalfa Cultivars for Forage Yield and Nutritional Value in Coastal Saline Soil of North China. Life 2022, 12, 217. [Google Scholar] [CrossRef]
  17. Zhang, J.; Wang, Q.; Pang, X.P.; Xu, H.P.; Wang, J.; Zhang, W.N.; Guo, Z.G. Effect of partial root-zone drying irrigation (PRDI) on the biomass, water productivity and carbon, nitrogen and phosphorus allocations in different organs of alfalfa. Agric. Water Manag. 2021, 243, 106525. [Google Scholar] [CrossRef]
  18. Diatta, A.A.; Min, D.; Jagadish, S.K. Advances in Agronomy. Chapter Two—Drought Stress Responses in Non-Transgenic and Transgenic Alfalfa—Current Status and Future Research Directions; Academic Press: New York, NY, USA, 2021; Volume 170, pp. 35–100. [Google Scholar] [CrossRef]
  19. Gou, J.; Debnath, S.; Sun, L.; Flanagan, A.; Tang, Y.; Jiang, Q.; Wen, J.; Wang, Z.Y. From model to crop: Functional characterization of SPL8 in M. truncatula led to genetic improvement of biomass yield and abiotic stress tolerance in alfalfa. Plant Biotechnol. J. 2018, 16, 951–962. [Google Scholar] [CrossRef] [Green Version]
  20. Lorenzo, C.D.; García-Gagliardi, P.; Antonietti, M.S.; Sánchez-Lamas, M.; Mancini, E.; Dezar, C.A.; Vazquez, M.; Watson, G.; Yanovsky, M.J.; Cerdán, P.D. Improvement of alfalfa forage quality and management through the down-regulation of MsFTa1. Plant Biotechnol. J. 2020, 18, 944–954. [Google Scholar] [CrossRef]
  21. Jiang, X.G.; Zhang, F.; Wang, Z.; Long, R.C.; Li, M.N.; He, F.; Yang, X.J.; Yang, C.F.; Jiang, X.; Yang, Q.C.; et al. Detection of quantitative trait loci (QTL) associated with spring regrowth in alfalfa (Medicago sativa L.). J. Integr. Agric. 2022, 21, 812–818. [Google Scholar] [CrossRef]
  22. Beeri, O.; Tarshish, R.; Pelta, R.; Shilo, T. Utilizing Optical Satellite Imagery to Monitor Temporal and Spatial Changes of Crop Water Stress: A Case Study in Alfalfa. Water 2022, 14, 1676. [Google Scholar] [CrossRef]
  23. Marshall, M.; Thenkabail, P. Developing in situ Non-Destructive Estimates of Crop Biomass to Address Issues of Scale in Remote Sensing. Remote Sens. 2015, 7, 808–835. [Google Scholar] [CrossRef] [Green Version]
  24. Garriga, M.; Ovalle, C.; Espinoza, S.; Lobos, G.A.; Pozo, A. Use of Vis–NIR reflectance data and regression models to estimate physiological and productivity traits in lucerne (Medicago sativa). Crop Pasture Sci. 2020, 71, 90. [Google Scholar] [CrossRef]
  25. Hancock, D.W.; Dougherty, C.T. Relationships between Blue- and Red-based Vegetation Indices and Leaf Area and Yield of Alfalfa. Crop Sci. 2007, 47, 2547–2556. [Google Scholar] [CrossRef]
  26. Noland, R.L.; Wells, M.S.; Coulter, J.A.; Tiede, T.; Baker, J.M.; Martinson, K.L.; Sheaffer, C.C. Estimating alfalfa yield and nutritive value using remote sensing and air temperature. Field Crop. Res. 2018, 222, 189–196. [Google Scholar] [CrossRef]
  27. Starks, P.J.; Brown, M.A.; Turner, K.E.; Venuto, B.C. Canopy Visible and Near-infrared Reflectance Data to Estimate Alfalfa Nutritive Attributes Before Harvest. Crop Sci. 2016, 56, 484–496. [Google Scholar] [CrossRef]
  28. Pittman, J.; Arnall, D.; Interrante, S.; Moffet, C.; Butler, T. Estimation of Biomass and Canopy Height in Bermudagrass, Alfalfa, and Wheat Using Ultrasonic, Laser, and Spectral Sensors. Sensors 2015, 15, 2920–2943. [Google Scholar] [CrossRef] [Green Version]
  29. Cazenave, A.B.; Shah, K.; Trammell, T.; Komp, M.; Hoffman, J.; Motes, C.M.; Monteros, M.J. High-Throughput Approaches for Phenotyping Alfalfa Germplasm under Abiotic Stress in the Field. Plant Phenome J. 2019, 2, 1–13. [Google Scholar] [CrossRef]
  30. Feng, L.; Zhang, Z.; Ma, Y.; Du, Q.; Williams, P.; Drewry, J.; Luck, B. Alfalfa Yield Prediction Using UAV-Based Hyperspectral Imagery and Ensemble Learning. Remote Sens. 2020, 12, 2028. [Google Scholar] [CrossRef]
  31. Feng, L.; Zhang, Z.; Ma, Y.; Sun, Y.; Du, Q.; Williams, P.; Drewry, J.; Luck, B. Multitask Learning of Alfalfa Nutritive Value From UAV-Based Hyperspectral Images. IEEE Geosci. Remote Sens. Lett. 2022, 19, 1–5. [Google Scholar] [CrossRef]
  32. Chandel, A.K.; Khot, L.R.; Yu, L.X. Alfalfa (Medicago sativa L.) crop vigor and yield characterization using high-resolution aerial multispectral and thermal infrared imaging technique. Comput. Electron. Agric. 2021, 182, 105999. [Google Scholar] [CrossRef]
  33. Azadbakht, M.; Ashourloo, D.; Aghighi, H.; Homayouni, S.; Shahrabi, H.S.; Matkan, A.; Radiom, S. Alfalfa yield estimation based on time series of Landsat 8 and PROBA-V images: An investigation of machine learning techniques and spectral-temporal features. Remote Sens. Appl. Soc. Environ. 2022, 25, 100657. [Google Scholar] [CrossRef]
  34. Jain, M.; Balwinder-Singh; Rao, P.; Srivastava, A.K.; Poonia, S.; Blesh, J.; Azzari, G.; McDonald, A.J.; Lobell, D.B. The impact of agricultural interventions can be doubled by using satellite data. Nat. Sustain. 2019, 2, 931–934. [Google Scholar] [CrossRef]
  35. Ashapure, A.; Jung, J.; Yeom, J.; Chang, A.; Maeda, M.; Maeda, A.; Landivar, J. A novel framework to detect conventional tillage and no-tillage cropping system effect on cotton growth and development using multi-temporal UAS data. ISPRS J. Photogramm. Remote Sens. 2019, 152, 49–64. [Google Scholar] [CrossRef]
  36. Cavalaris, C.; Karamoutis, C.; Markinos, A. Efficacy of cotton harvest aids applications with unmanned aerial vehicles (UAV) and ground-based field sprayers – A case study comparison. Smart Agric. Technol. 2022, 2, 100047. [Google Scholar] [CrossRef]
  37. Mishra, P.; Asaari, M.S.M.; Herrero-Langreo, A.; Lohumi, S.; Diezma, B.; Scheunders, P. Close range hyperspectral imaging of plants: A review. Biosyst. Eng. 2017, 164, 49–67. [Google Scholar] [CrossRef]
  38. Zhou, Y.; Flynn, K.C.; Gowda, P.H.; Wagle, P.; Ma, S.; Kakani, V.G.; Steiner, J.L. The potential of active and passive remote sensing to detect frequent harvesting of alfalfa. Int. J. Appl. Earth Obs. Geoinf. 2021, 104, 102539. [Google Scholar] [CrossRef]
  39. Malik, W.; Boote, K.J.; Hoogenboom, G.; Cavero, J.; Dechmi, F. Adapting the CROPGRO Model to Simulate Alfalfa Growth and Yield. Agron. J. 2018, 110, 1777–1790. [Google Scholar] [CrossRef] [Green Version]
  40. Hu, Y.; Kang, S.; Ding, R.; Zhao, Q. A crude protein and fiber model of alfalfa incorporating growth age under water and salt stress. Agric. Water Manag. 2021, 255, 107037. [Google Scholar] [CrossRef]
  41. HAJJ, M.E.; Baghdadi, N.; Cheviron, B.; Belaud, G.; Zribi, M. Integration of remote sensing derived parameters in crop models: Application to the PILOTE model for hay production. Agric. Water Manag. 2016, 176, 67–79. [Google Scholar] [CrossRef]
  42. Kasampalis, D.; Alexandridis, T.; Deva, C.; Challinor, A.; Moshou, D.; Zalidis, G. Contribution of Remote Sensing on Crop Models: A Review. J. Imaging 2018, 4, 52. [Google Scholar] [CrossRef]
Figure 1. Workflow diagram outlining the systematic review process. The left-hand panels show the five phases of the review, and the center and right-hand boxes show the number of articles for each step.
Remotesensing 14 04940 g001
Figure 2. (a) Sankey diagram illustrates the potential wavelengths and vegetation indices for establishing relationships with biomass and quality in alfalfa. (b) Only in the study developed by Noland et al. [26] was it possible to obtain information about the relationship between biomass and quality for the same wavelength, the bar graph shows that CP and NDFd have a relation among themselves and, as well as dry biomass and NDF, both sets with an inverse relationship. (c) The remaining studies focused their evaluations only on biomass, where it is possible to observe in the bar graph that dry biomass is related to wet biomass.
Remotesensing 14 04940 g002
Table 1. State-of-the-art of remote sensing for assess alfalfa production and quality.
YearCitationStudy
Region
PlatformArticle TitleSource Title
2007[25]Kentucky, USATerrestrialRelationships between Blue- and Red-based vegetation indices and leaf area and yield of alfalfaCrop Science
2015[23]California, USATerrestrialDeveloping in situ non-destructive estimates of crop biomass to address issues of scale in remote sensingRemote Sensing
2015[28]Oklahoma, USATerrestrialEstimation of biomass and canopy height in bermudagrass, alfalfa, and wheat using ultrasonic, laser, and spectral sensorsSensors
2016[27]Oklahoma, USATerrestrialCanopy visible and near-infrared reflectance data to estimate alfalfa nutritive attributes before harvestCrop Science
2016[4]Eastern Province
of Saudi Arabia
SatelliteAssessing the spatial variability of alfalfa yield using
satellite imagery and ground-based data
Plos One
2018[26]Minnesota, USATerrestrialEstimating alfalfa yield and nutritive value using remote sensing and air temperatureField Crops Research
2019[29]Oklahoma, USATerrestrial
and UAV
High-throughput approaches for phenotyping alfalfa germplasm under abiotic stress in the fieldPlant Phenome Journal
2020[30]Wisconsin, USAUAVAlfalfa yield prediction using uav-based hyperspectral imagery and ensemble learningRemote Sensing
2020[24]Mediterranean
central-south, Chile
TerrestrialUse of Vis-NIR reflectance data and regression models to estimate physiological and productivity traits
in lucerne (Medicago sativa)
Crop and Pasture Science
2021[32]Washington, USAUAVAlfalfa ( Medicago sativa L.) crop vigor and yield characterization
using high-resolution aerial multispectral and
thermal infrared imaging technique
Computers and Electronics
in Agriculture
2022[31]Wisconsin, USAUAVMultitask learning of alfalfa nutritive value from
uav-based hyperspectral images
IEEE Geoscience and
Remote Sensing Letters
2022[33]Oklahoma, USASatelliteAlfalfa yield estimation based on time series of Landsat 8 and PROBA-V images:
An investigation of machine learning
 techniques and spectral-temporal features
Remote Sensing Applications:
Society and Environment
Table 2. Studies using data from remote sensing platforms for developing methods to assess alfalfa biomass and quality traits.
Production
Indicator
Quality
Indicator
Cutting
Cycle
Plant PhasePlatformSpectral InputsNon-Spectral
Inputs
MethodCitation
DB-1st, 2nd,
3rd, 4th
10% bloom,
25% bloom
TerrestrialNDVI, BNDVI, WDRVI α , BWDRVI α ,
α = 0.1, 0.05 and 0.01
-NLR[25]
WB--Sprouting and
Flowering
TerrestrialMBVI, TBVI, λ 1528, λ 438, λ 499, λ 458,
λ 1508, λ 448 nm
meanG,
medianG
LR[23]
DB--10% bloomTerrestrialNDVI, λ 450, λ 520, λ 530, λ 570, λ 590,
λ 650, λ 690, λ 710, λ 780, λ 900 nm
-Correlation[28]
-NDF,
ADF
-Late bud to
10th flower
Terrestrial λ 400–1349 nm-MPLSR[27]
DB-8th, 9th,
10th, 11th
10% bloom,
30% bloom,
50% bloom
SatelliteEVI, GNDVI, GRVI, LSWI, NDVI, NIR,
SAVI, λ 865 ± 30 nm
Yield MonitorCorrelation[4]
DBCP,
NDF,
NDFd
--TerrestrialNDVI, GNDVI, REIP, MTCI, PHORI, CARI,
NDLI, NDNI, λ 460, λ 550, λ 551, λ 650,
λ 711, λ 712, λ 780, λ 1073, λ 1077, λ 1087 nm
GDUBASE-5,
GDUALT
SLR[26]
DB,WB---Terrestrial
UAV
CCC, IRVI, NDVI, NDRE, λ 670, λ 730, λ 780 nm
NDVI
-Correlation[29]
DB--35 cm height
and 10% bloom
TerrestrialNDSI, NDTI, DATT, RE, DD-NLR[24]
DB---UAVNDVI, PHYRI, NDRE, MND705 nm,
GNDVI, RDVI, NDCI, CI, DATT,
DD, DCNI, GITELSON, CARTE,
SRI, MSRI, MSR705, MSR,
NVI, EVI, TCARI, MCARI,
OSAVI, TGI, TCARI/OSAVI,
MCARI/OSAVI, MTVI, MTCI,
SPVI, REP, VOG, VIOPT
-SVR, KNNR,
RFR, Ensemble
[30]
WB-1st, 2nd1st bloomUAVNDVI, IPVI, MSR, OSAVI, GNDVI,
TDVI, EVI, MNLI, CWSI
T canopy,
T air,
M, U, L
LR, MLR, SLR,
PLSR, LASSO
[32]
-CP,
aNDF,
ADF
2nd, 3rd, 4th-UAV λ 400–1349 nm-SVR, RFR, ANN,
STL, MTL
[31]
DB---SatelliteSR, NDVI, EVI2, OSAVI, LSWI-BRT, GPR, RFR,
SVR, RIDGE, LASSO
[33]
Publisher’s Note: MDPI stays neutral with regard to jurisdictional claims in published maps and institutional affiliations.

