Article

Road Network Extraction from SAR Images with the Support of Angular Texture Signature and POIs

1
College of Surveying & Geo-Informatics, Tongji University, Shanghai 200092, China
2
The Shanghai Key Laboratory of Space Mapping and Remote Sensing for Planetary Exploration, Tongji University, Shanghai 200092, China
*
Author to whom correspondence should be addressed.
Remote Sens. 2022, 14(19), 4832; https://doi.org/10.3390/rs14194832
Submission received: 12 July 2022 / Revised: 13 September 2022 / Accepted: 21 September 2022 / Published: 28 September 2022
(This article belongs to the Special Issue Advances in SAR Image Processing and Applications)

Abstract

:
Urban road network information is an important part of modern spatial information infrastructure and is crucial for high-precision navigation map production and unmanned driving. Synthetic aperture radar (SAR) is a widely used remote-sensing data source, but the complex structure of road networks and the noises in images make it very difficult to extract road information through SAR images. We developed a new method of extracting road network information from SAR images by considering angular (A) and texture (T) features in the sliding windows and points of interest (POIs, or P), and we named this method ATP-ROAD. ATP-ROAD is a sliding window-based semi-automatic approach that uses the grayscale mean, grayscale variance, and binary segmentation information of SAR images as texture features in each sliding window. Since POIs have much-duplicated information, this study also eliminates duplicated POIs considering distance and then selects a combination of POI linkages by discerning the direction of these POIs to initially determine the road direction. The ATP-ROAD method was applied to three experimental areas in Shanghai to extract the road network using China’s Gaofen-3 imagery. The experimental results show that the extracted road network information is relatively complete and matches the actual road conditions, and the result accuracy is high in the three different regions, i.e., 89.57% for Area-I, 96.88% for Area-II, and 92.65% for Area-III. Our method together with our extraction software can be applied to extract information about road networks from SAR images, providing an alternative for enriching the variety of road information.

1. Introduction

Urban road network information is an important component of modern spatial information infrastructure, which is crucial for high-precision navigation map production and unmanned driving in the era of big data [1,2]. Satellite remote sensing is widely used for road extraction due to its large number of data sources and rich spectral and geometric information [3], of which synthetic aperture radar (SAR) images have full day-and-night operational capability [4] and are a widely used type of remote-sensing data [5]. Due to the superimposed masking, shrinkage, and shadowing in acquiring information on surface entities with side-looking SAR imaging, as well as the complexity of microwave scattering from various objects, it is more difficult to acquire road information from these complex SAR images compared with multispectral orthoimages [6,7]. Moreover, due to the influence of noises in SAR images and the complexity of road network structures, the road network information extracted from high-resolution SAR images is usually not satisfactory. Combining remote-sensing data with points of interest (POIs) for the high-precision extraction of earth surface features is the current frontier in the field of remote sensing, and road extraction is an important issue of concern for many scientists. In recent years, voluntary geographic information has become increasingly abundant, and it is generally used to represent feature points (e.g., place names, roads, outdoor cameras, shopping malls, schools, hospitals, and hundreds of other types), and POIs are the main form of the above information [8]. These POIs indicate that much of the information is associated with road networks, thus providing effective auxiliary information for identifying and extracting road information from SAR images. Therefore, a key issue that urgently needs to be addressed is the combination of POIs and SAR images to achieve the accurate extraction of road networks in big cities.
The road extraction methods using remote-sensing images are usually classified as manual, semi-automatic, or automatic according to the presence of human intervention, where the manual method is to draw the road network manually, the semi-automatic methods are the automation of road extraction while providing a low level of manual inputs, and the automatic methods do not require any manual inputs [9,10,11]. Although manual methods can produce highly correct processing results, they suffer from the disadvantages of high workload and low efficiency and subjectivity [12,13]. Manual extraction as mostly used in the early years for updating topographic map databases, where the road information in the database was extracted or modified by visual interpretation. With the development of remote sensing, computer, and artificial intelligence, the semi-automatic and automatic extraction techniques have become the mainstream of current road extraction.
Typical automatic methods include feature fusion, classification, mathematical morphology, line detection and global connectivity, and multi-scale [14,15,16]. Among these, the feature fusion approach can improve the extraction accuracy of roads by taking into account the advantages of multiple features, where the fusion can be either the fusion of data before extraction or the fusion of various road features [17,18]. Classification can be used to derive spectral and morphological information in large-scale scenes, thus enabling the extraction of road information [19]. In particular, algorithms such as artificial neural networks, Markov random fields, and support vector machines have been incorporated into remote-sensing image processing to improve the accuracy of acquired road information [20,21,22]. With the advent of deep learning techniques, investigators have used deep neural networks or improved networks to extract image features and semantic information from labeled data, enabling information-based learning and end-to-end road extraction training [23]. According to the particular road characteristics, mathematical morphology can be used to smooth the road edges and ensure line linkages [24]. Once the line primitives of the road are captured, the global connectivity of the roads can be achieved using heuristic methods such as genetic algorithms in combination with prior knowledge or background information [25,26]. Multiscale extraction combines contextual information to extract coarse road information on low-resolution images while deriving detailed road information on high-resolution images [27]. Due to the complexity of roads, most of the road lines or networks derived by automatic extraction methods require post-editing before they can be used for map production or applications.
Semi-automatic extraction is a better choice because it greatly frees up labor and makes better use of human knowledge about images [28,29]. We are aware that semi-automatic extraction methods rely on the input of seed points, and according to the different methods of determining these seed points, semi-automatic road extraction methods can be divided into overall feature-based fitting optimization approaches and local feature-based matching tracking approaches [30,31]. The definition of the seed-based sliding window needs to consider the morphological characteristics of the roads, while rectangular window, T-shaped window, and contour feature window are the commonly used configurations [32,33,34]. Among these, the rectangular window is rotated to derive texture features corresponding to the road information at different angles in the image, and the information can be variance, mean, and entropy [35]. However, the imaging mode of SAR images leads to weakened image texture features [36], which increases the difficulty of road extraction; when road extraction methods for the optical image are used for road extraction from SAR images, it may lead to problems such as low integrity of the extracted road network [37,38]. Therefore, if the road extraction methods can be improved while making full use of voluntary geographic information data, better road extraction results may be achieved.
With the development of big data, POIs provide convenience for geographical information analysis and feature extraction due to their large volume, wide coverage, and easy access [39]. If POI information can be combined with road extraction, the advantages of POIs can be used to improve road extraction accuracy [40]. For POIs, there are many types of information related to roads, e.g., the names and addresses of places on the AutoNavi® website that provides the mapping, navigation, and location services, and AutoNavi POIs include several subcategories such as the entrances and exits of highways, bridges, and intersection names. This information is closely related to the road and can be used as key information for road extraction; however, not much of this information has been used for road extraction in the existing research.
This research aims to solve the following two issues: (1) how to accurately extract the road networks from SAR images while maintaining the network integrity and (2) how to directly use POIs to assist the process of SAR images to achieve road network extraction. To address the first issue, we proposed a semi-automatic extraction method (ATP-ROAD) to derive road network information using sliding windows. The movement of the rectangular sliding window has a linking function and therefore ensures the integrity of the road network. Specifically, we proposed an improved ATP-ROAD to extract road information from SAR images considering image angular (A) and texture (T) features. For the second issue, we used POIs at intersections to assist with identifying the direction of the roads. In this study, we selected experimental areas in Gaofen-3 satellite images to validate the extraction method and evaluated the results. Since road extraction is a complex task, our study provides new thoughts on fusing multisource SAR and POI data for road extraction.
The introduction is followed by Section 2, which describes the extraction workflow and the pre-processing methods for SAR images and POIs. The section also describes how the ATP-ROAD method works and how the accuracy of the extracted results is evaluated. In Section 3, experiments on road extraction from Gaofen-3 images using ATP-ROAD are presented, and the results are evaluated in detail. After that, the paper further discusses these methods and results in Section 4. Finally, conclusions were drawn from the extraction methods and experimental results.

2. Methods

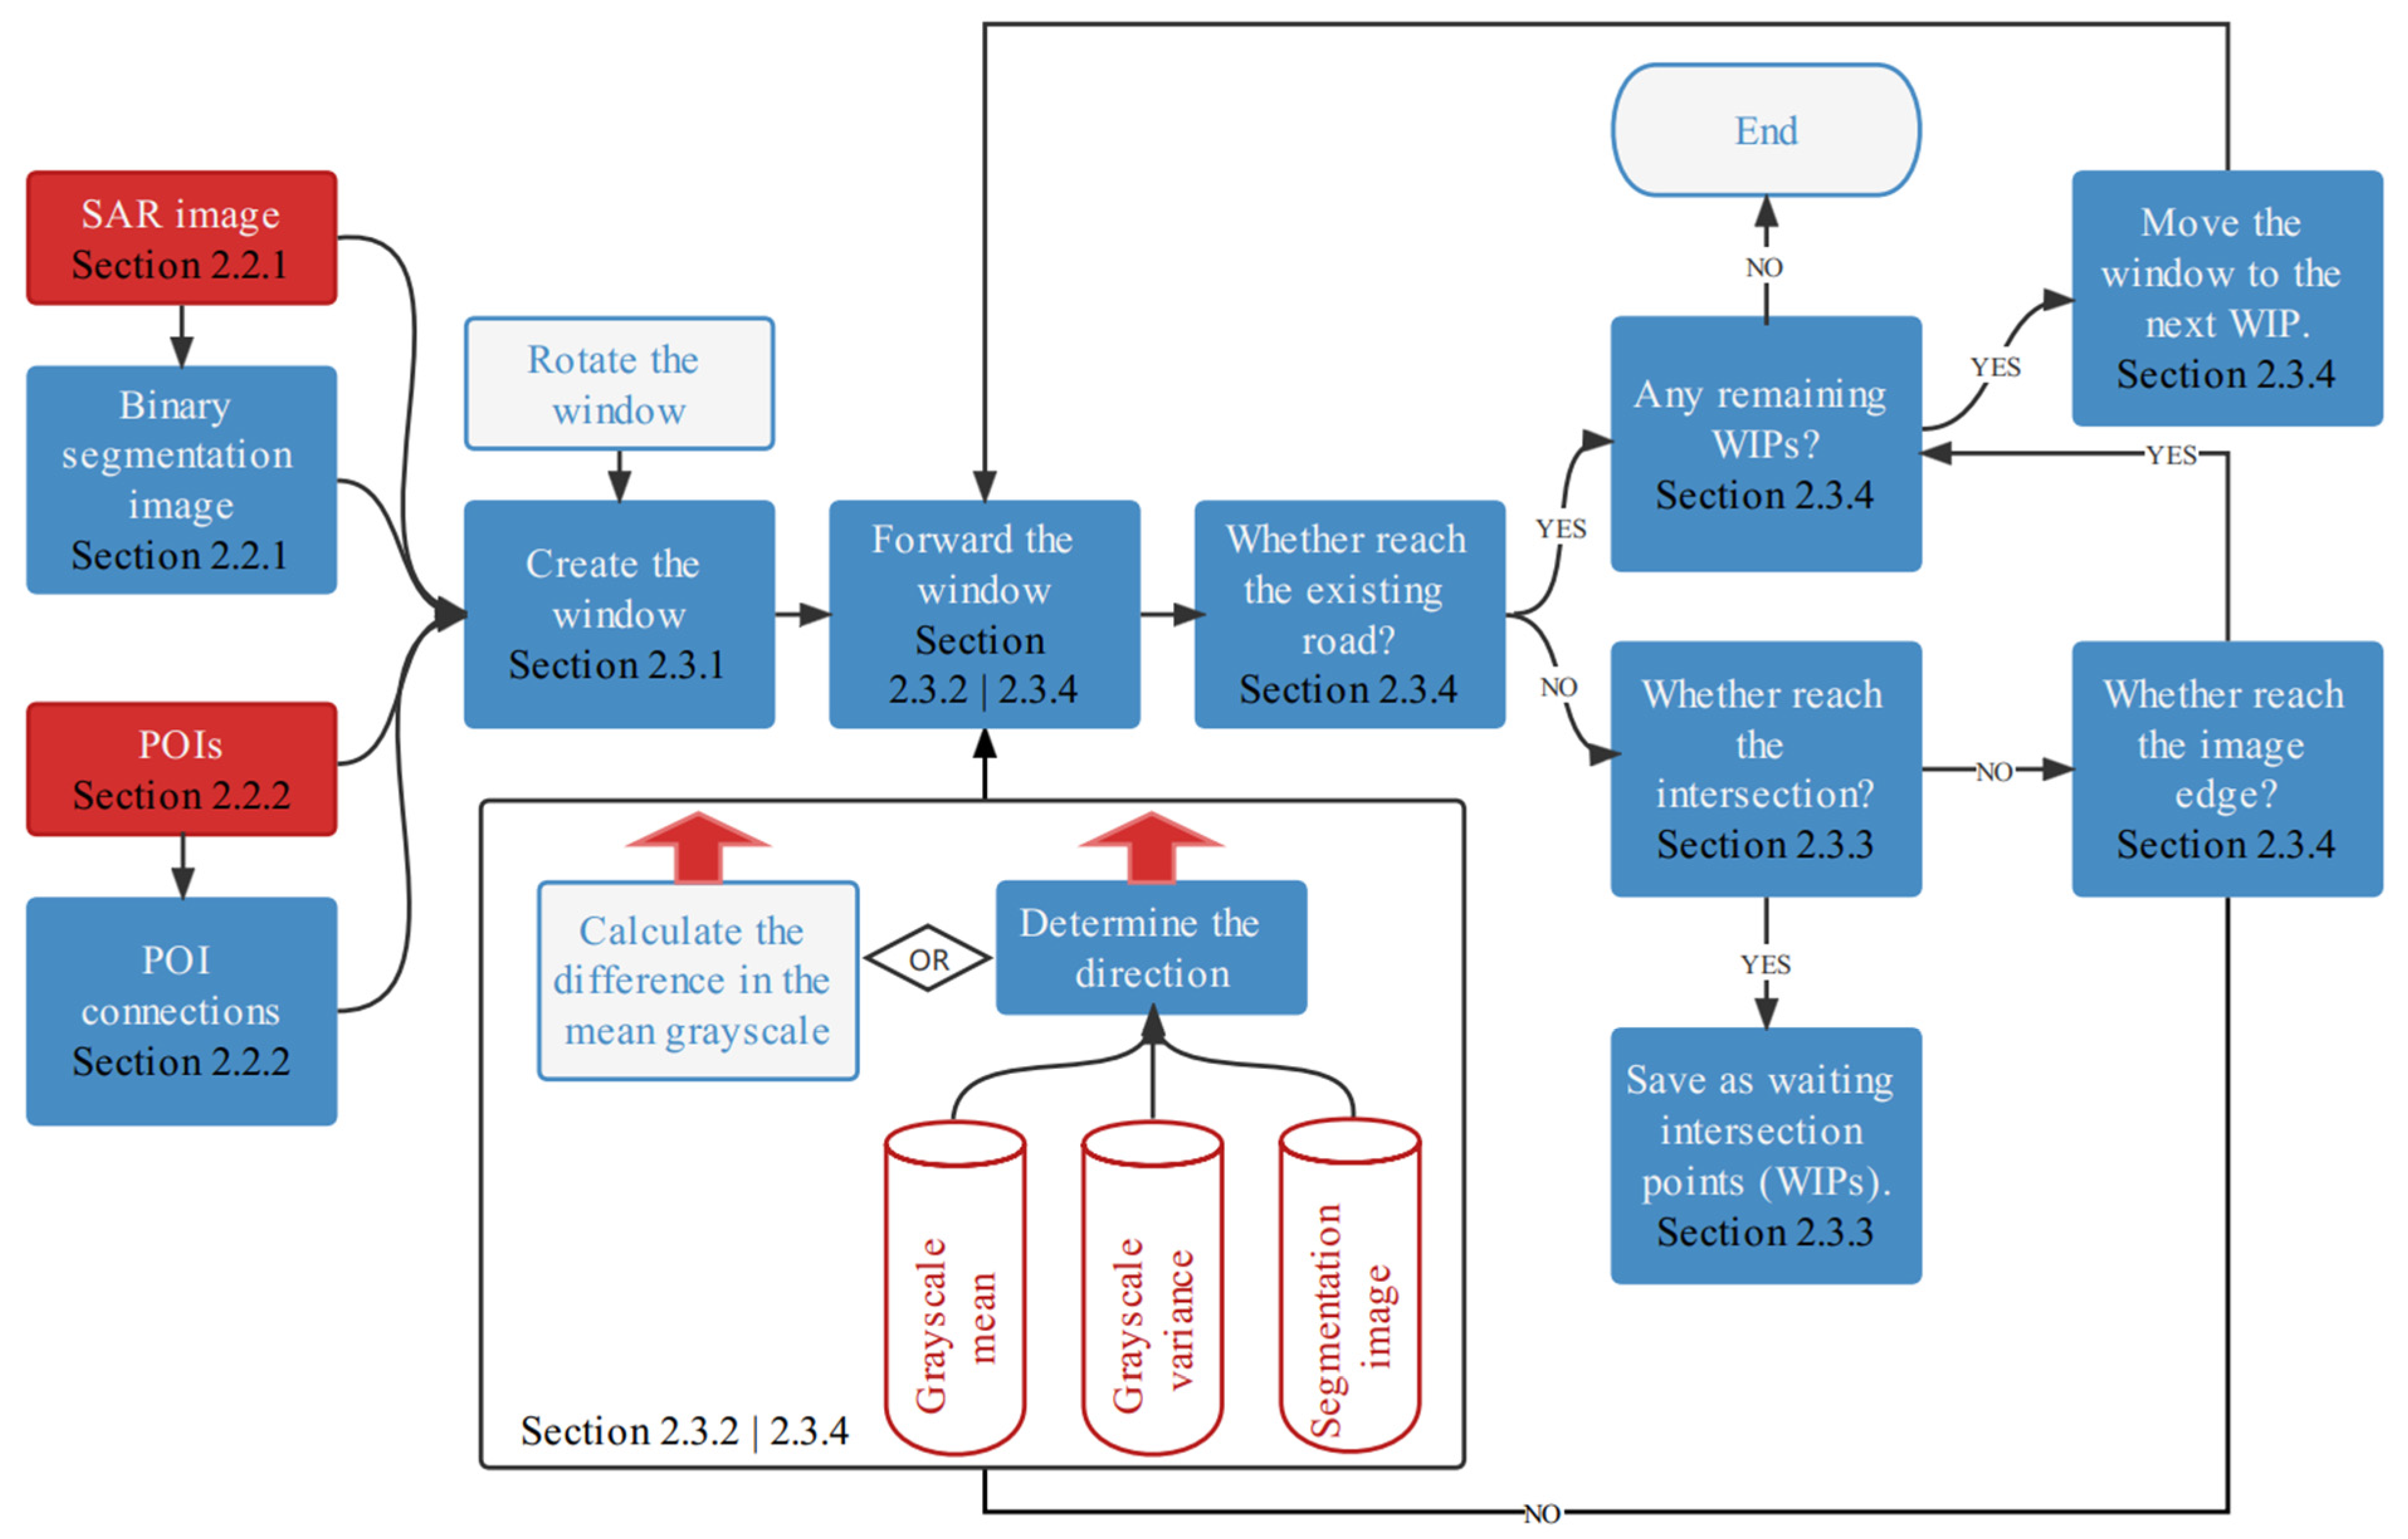
2.1. The Extraction Workflow

In our study, we proposed an ATP-ROAD method for road network extraction that we constructed using angular texture features, where the binary segmented image, the gray mean and variance in a sliding window, and some POIs along the road are considered. In ATP-ROAD, we applied a semi-automatic extraction scheme of the sliding window, with the support of POIs that were used to identify the road intersections to link the road intersections, thus ensuring the integrity of the road networks.
Figure 1 shows that there are two data sources including a SAR image and POIs along the roads. An initial sliding window is created in the image that moves along a road according to the integrated effects of the grayscale mean, the grayscale variance, and a binary segmentation image. We used the traversed roads on the window’s forward route as the basis for determining the next operation. The intersections are recorded as candidates waiting for inspection (CWIs) when the window crosses them, and they will be removed from the CWI list when the extraction of a road corresponding to the CWI is finished. Then, the window will move to another candidate CWI to restart the road extraction. Additionally, if the window reaches the image edge, then it in turn moves to another CWI. The extraction processing is based on the window’s movement, which stops until the whole road network finishes the extraction (i.e., there are no candidate CWIs left).

2.2. Data Preprocessing

2.2.1. SAR Image Preprocessing and Segmentation

Because the coordinates of the original SAR images are different from those of the POIs, we performed geometric corrections of the images using their orbit file and external digital elevation model (DEM) data. Meanwhile, for the POIs close to the road intersections, we moved them to the center of the road intersection in the SAR image. This resulted in the geometric match between the image and the POIs. After extensive tests, we applied an image segmentation threshold of 0.16 to segment the SAR images according to the grayscale of scattering amplitude, then produced a new binary segmentation image that differentiates the roads and their surrounding features. In the binary segmentation image, the roads, water, and shaded areas were classified into black (value 0) areas, while the other areas were classified into white (value 1) areas. In the road extraction, the black areas were used to guide the sliding window, and the white areas were used as the restricted regions for the window movement. Please note that 0.16 is only applicable to our chosen study area, while in other areas we need to retest.

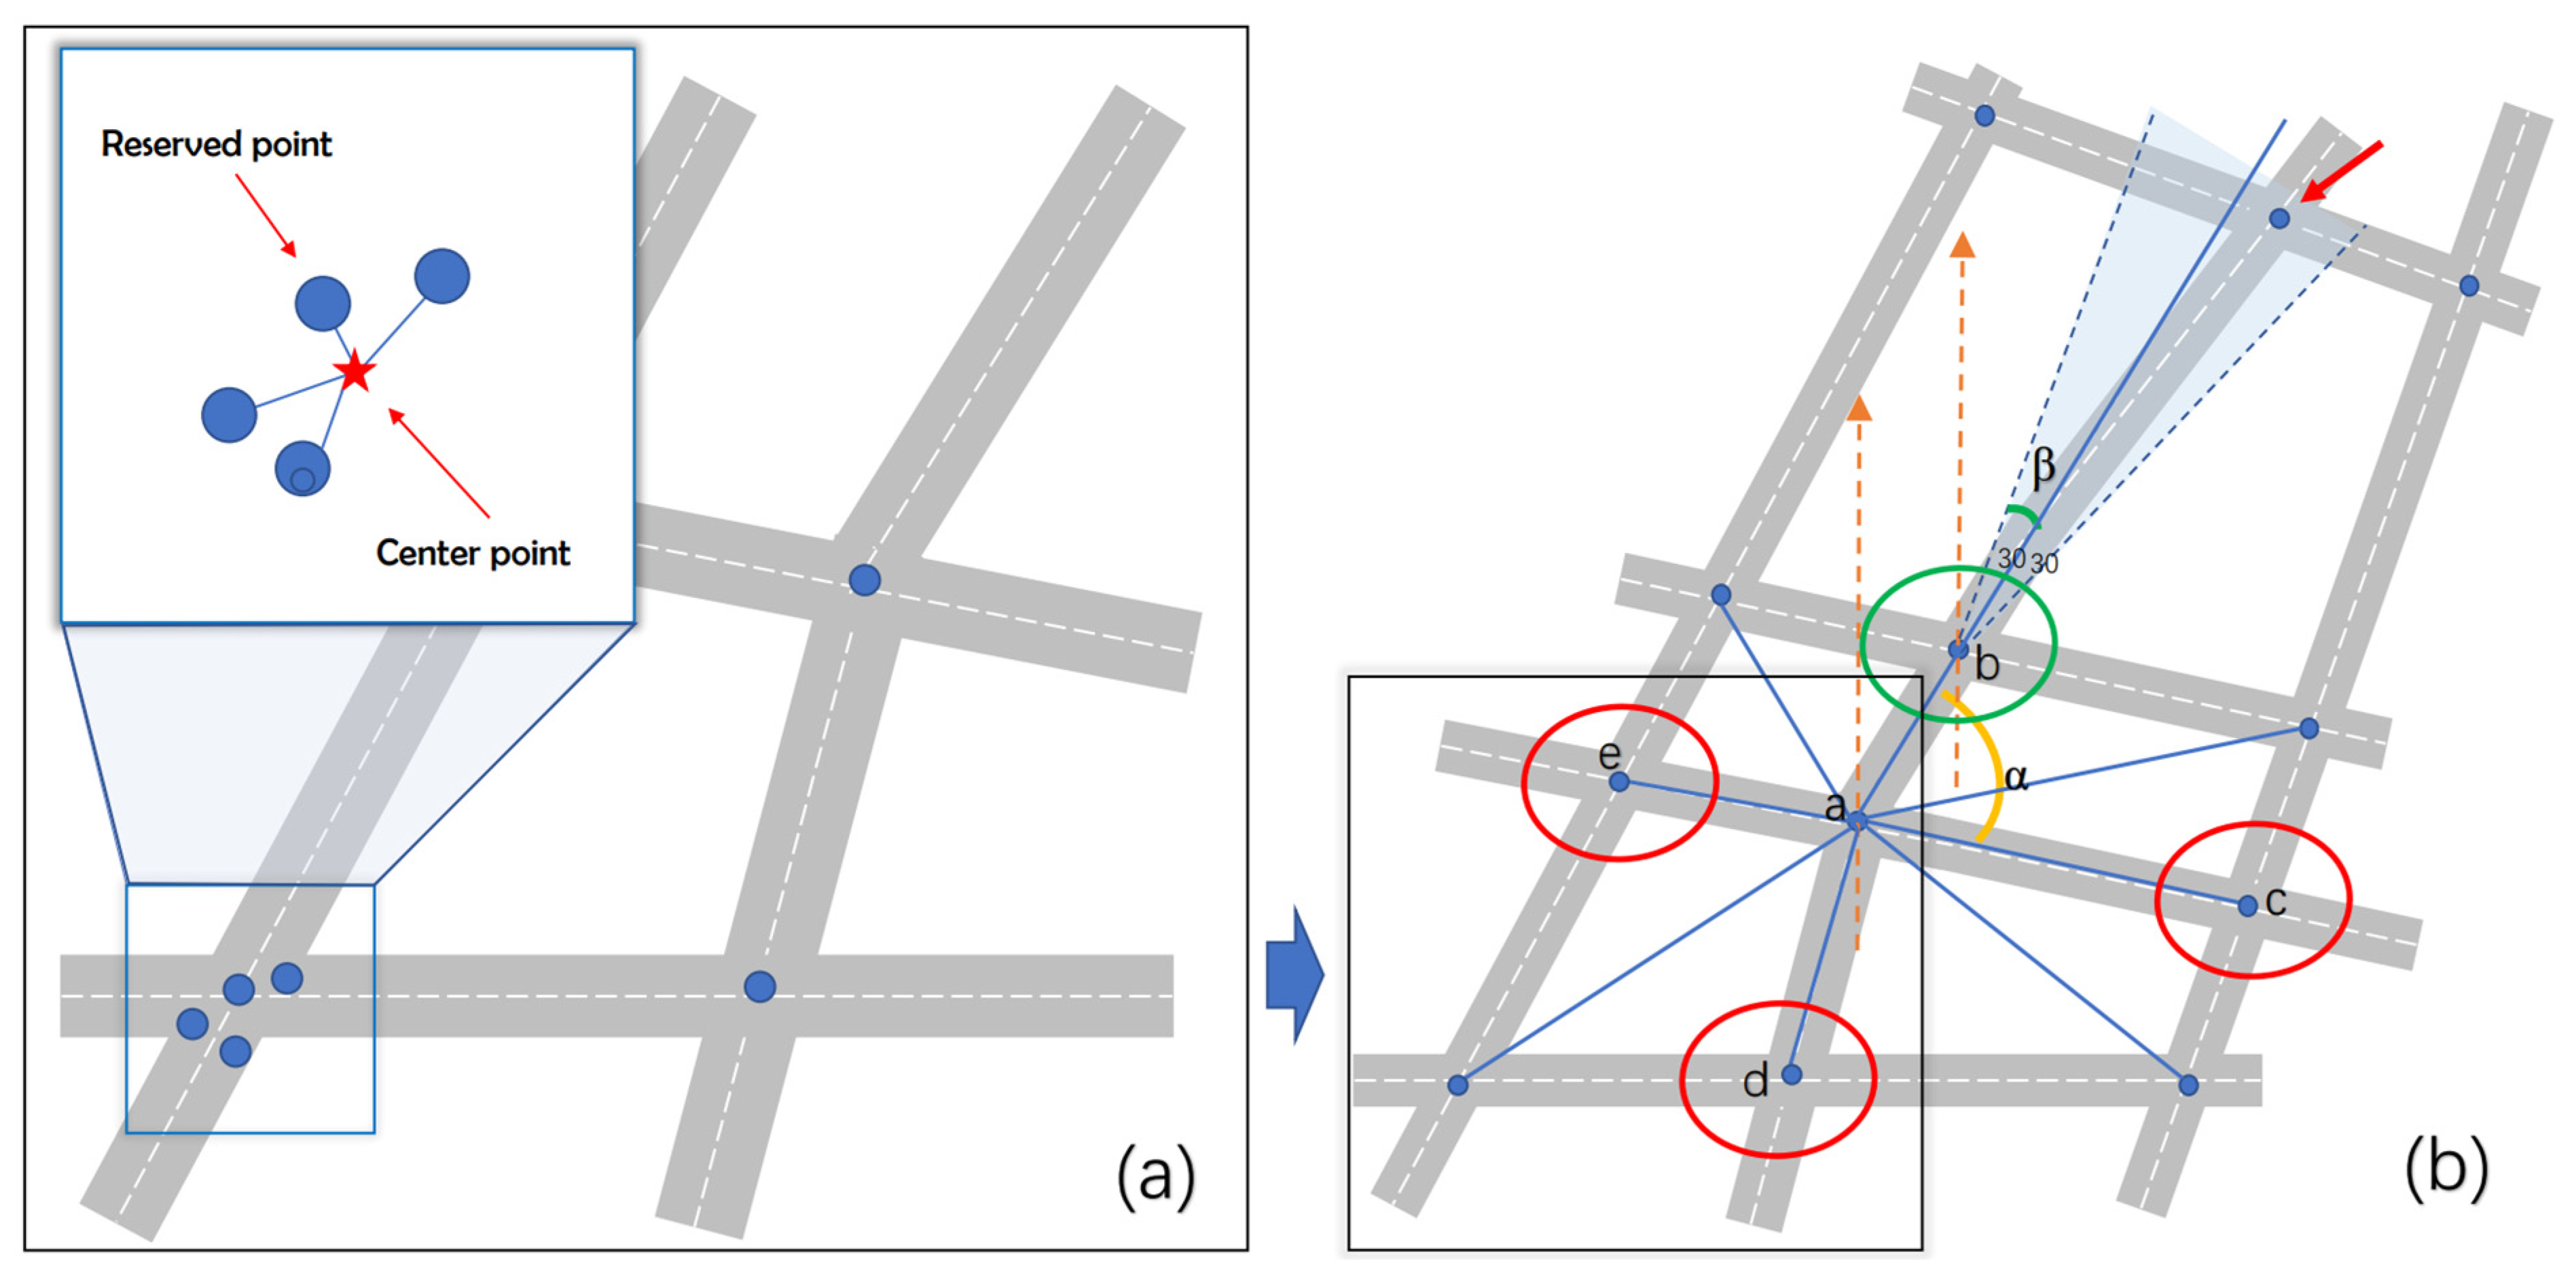
2.2.2. POI Processing and Linking

In this study, we used only the POIs of the “intersection” type since the research aim was to detect road networks using SAR images. To label the intersections, we extracted the intersection POIs from the AutoNavi Map POIs that include schools, hospitals, shops, bus stops, and traffic intersections, to name a few. Since the POIs have been collected spontaneously by the public and uploaded to OpenStreetMap, the accuracy of these data is inconsistent, and some POIs may be more credible than others [41]. According to the assessment in the literature, the POI data in China provided by OpenStreetMap have high positional accuracy of up to ten meters [42]; in particular, the POI data for roads and hospitals have the highest accuracy [43]. Therefore, inconsistencies in the accuracy of the POIs had only a small impact on the intersections we employed them to find. Because the original intersection POIs contain many duplicates, we applied a 100 m × 100 m sliding window to delete the duplicates, and each sliding window reserved only one POI, the nearest one to the geometric center of all POIs in the sliding window. A point is reserved randomly if there are only two points in the sliding window. In the computation, the window moves forward by 10 m each time. The processing can be given by:
{ c x = 1 2 ( m a x { x P 1 , x P 2 , , x P n } m i n { x P 1 , x P 2 , , x P n } ) c y = 1 2 ( m a x { y P 1 , y P 2 , , y P n } m i n { y P 1 , y P 2 , , y P n } )
d i = ( x P i c x ) 2 + ( y P i c y ) 2
where (cx, cy) are the coordinates of the sliding window center; (xPi, yPi) are the coordinates of the point Pi in the window; di is the distance from point Pi to the center; and i is the serial number (n > 2) of POIs.
Figure 2a illustrates a case of deleting the duplicates from four POIs (the blue circles) that are located near a road intersection. The red pentagram represents the center of all POIs within the sliding window, and the point at the northwest is reserved consequently because it is the closest one to the pentagram among the four points. This method removes duplicate POIs by considering the distance between POIs and is very suitable for intersections with dense POIs. In this study, we applied only the intersection POIs since the aim was to detect road networks using SAR images. Therefore, only distance information was considered when we condensed the POIs of many intersections into a single point.
At each intersection, there is only one reserved POI that in turn can be applied to identify the road intersections. The POIs can be automatically linked into many different networks, where if one of the linked networks correctly matches the real roads, then it can be used to determine the road direction to assist the window movement and road extraction. In most cases, roads can generally be considered continuous linear features with low curvature, and most intersections (except overpasses or special roads) extend in no more than four directions. We then proposed a linking method using straight lines to link the POIs, thus identifying the rough road directions.
Assume that point a (Figure 2b) is the first point that needs to be linked to other POIs (e.g., points b, c, d, & e). We calculated the distance between point a and every other point and arranged them in ascending order, with pairs of points having smaller distances being considered more correctly linked. Figure 2b shows that we used line a–b as the initial test, and if another POI fell within 30° (offset angle β) along line a–b, then that line could be used as the benchmark direction, and the new POI could be linked to point b correctly. In other cases, we used the line related to the shortest distance as the benchmark direction instead. We then determined the direction of the road that intersected the benchmark direction, and if a new POI formed a big crossover angle (α) with another POI on line a–b that was greater than a threshold (60°), then the linkage between these two POIs was correct. We linked POIs following the above method until the POI network reflected the directions of the road network. Widened lines with a radius of 5 m were generated for the POI network to make it easier to be tracked by the sliding window.

2.3. The ATP-ROAD Method

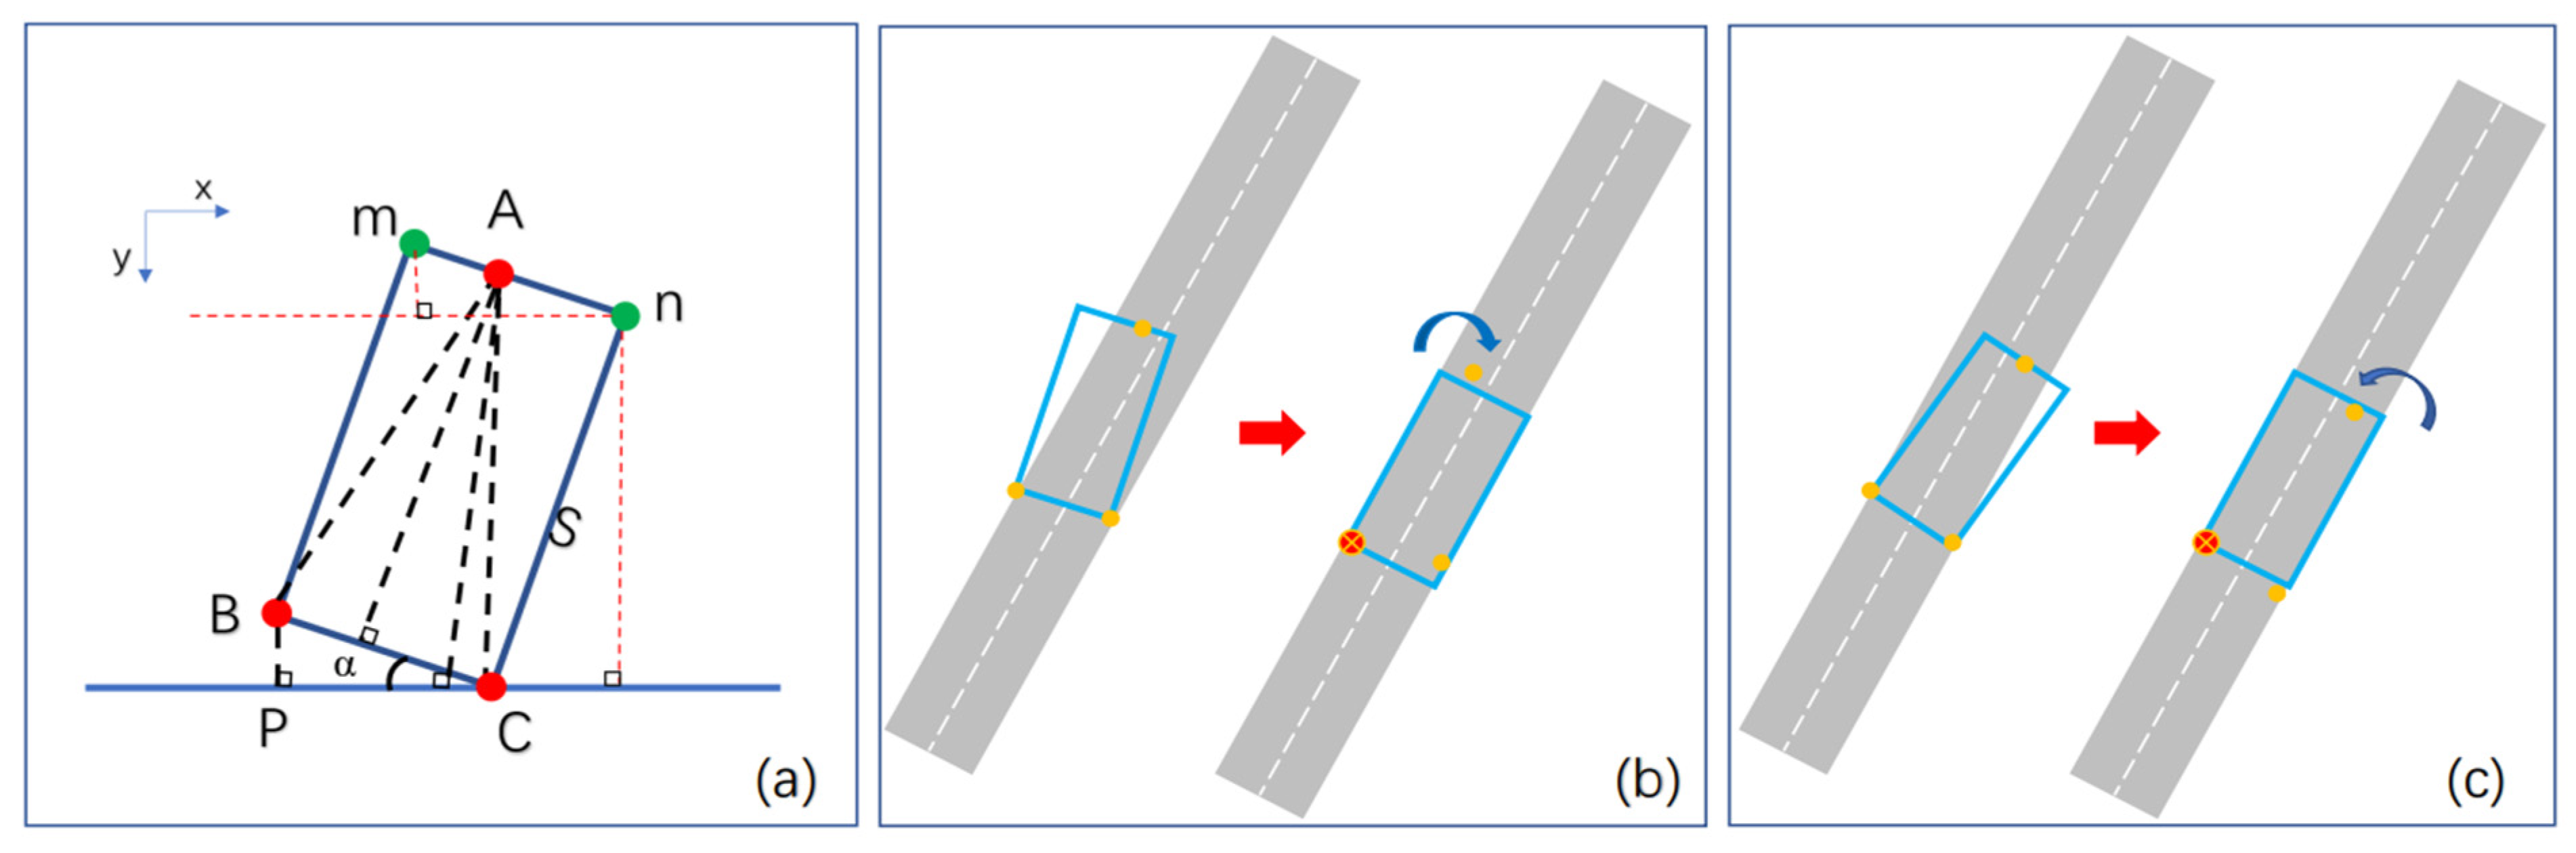
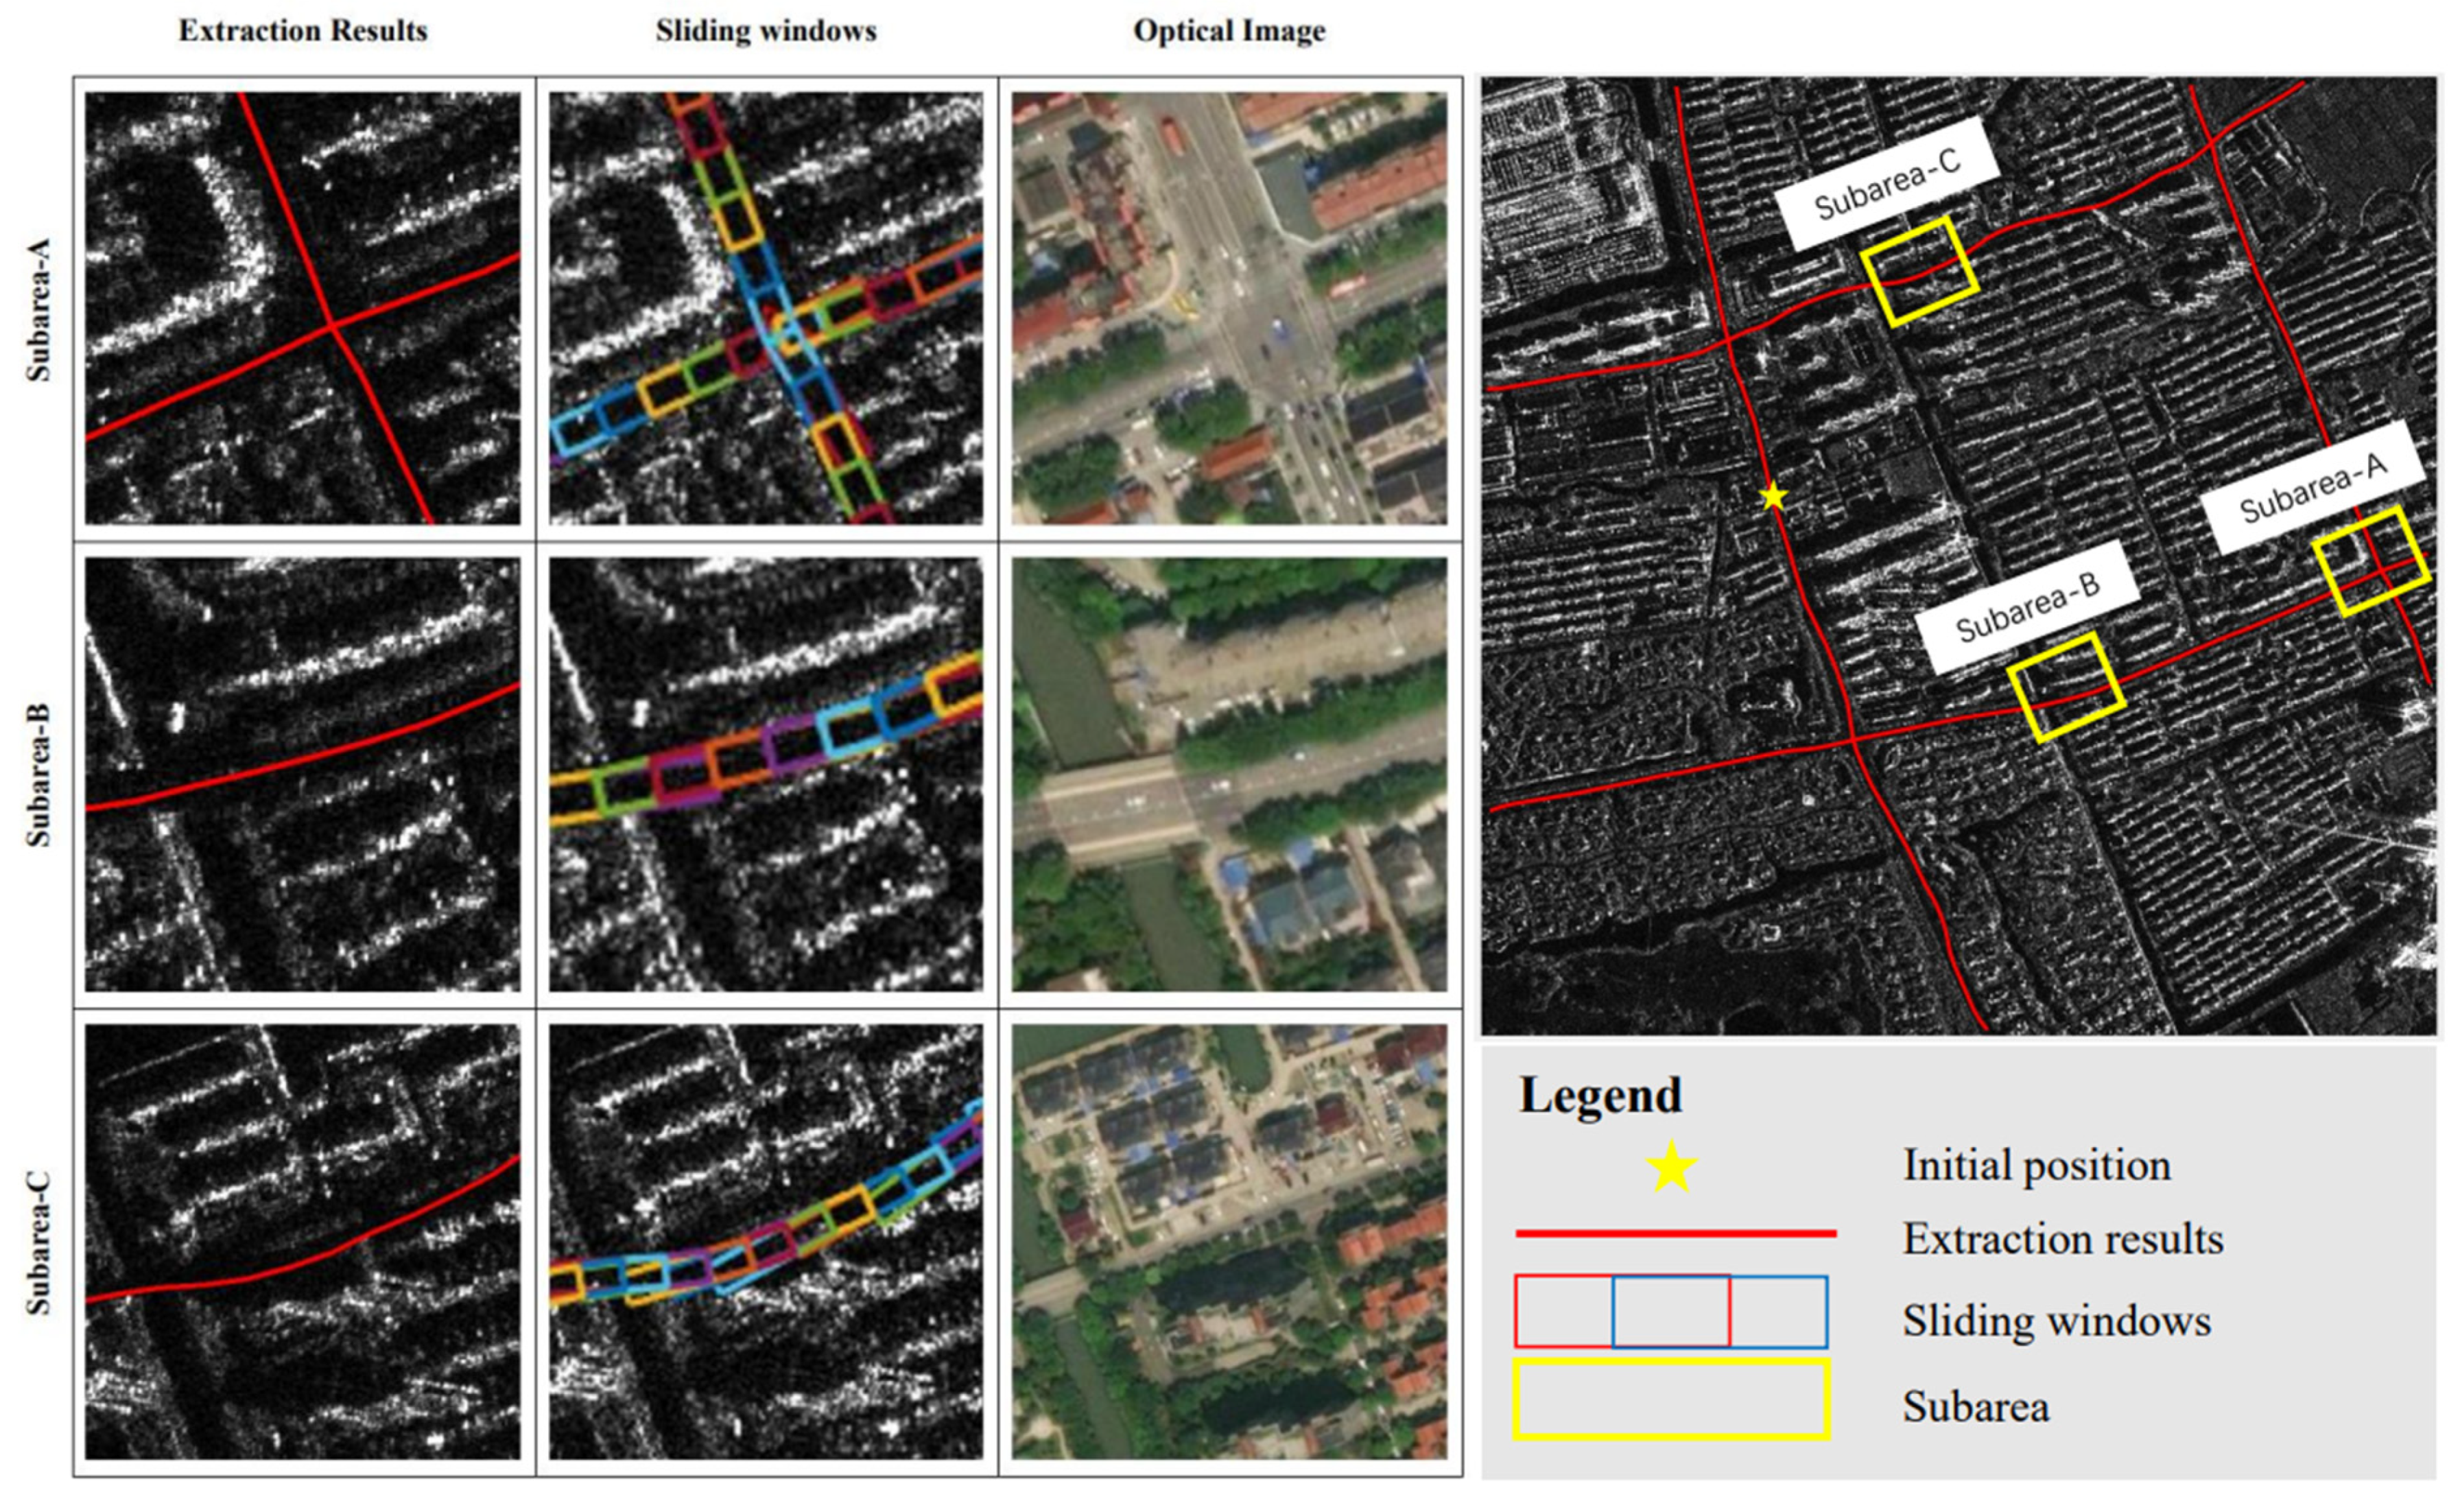
2.3.1. Definition of the Initial Window

We defined the initial window as a rectangle that keeps the width and length during the processing. The size and position of the initial window are determined using the geometric relationships of three predefined points (the red dots in Figure 3a). Point A in the middle of the road ensures that the window is in the direction of the road. Point B and point C, which are selected on both sides, define the bottom edge (i.e., width) of the window. In general, the length should be more than twice the width. Point B should be positioned on the edge of the road, which is also used as the rotation center to adjust the window’s direction. Figure 3b,c show two cases of the defined windows that tilt to the left and right, respectively, and then are adjusted to the road direction. The coordinates of the four corners are most important for determining the window, where the coordinates of point B and point C are known. Thus, the coordinates of the remaining two corners can be calculated as:
α = tan 1 Y C Y B X C X B
S = ( X C X A ) · [ Y C Y A ( X C X A ) · tan α ] ( X C X A ) 2 + [ ( X C X A ) · tan α ] 2
X n = X C + S · sin α
Y n = Y C S · cos α
X m = X n B C · cos α
Y m = Y n B C · sin α
where (XA, YA), (XB, YB), (XC, Y C), (Xm, Ym), and (Xn, Yn) are the coordinates of the five points in Figure 3a; S is the distance between points C and n; and α is the angle ∠BCP.

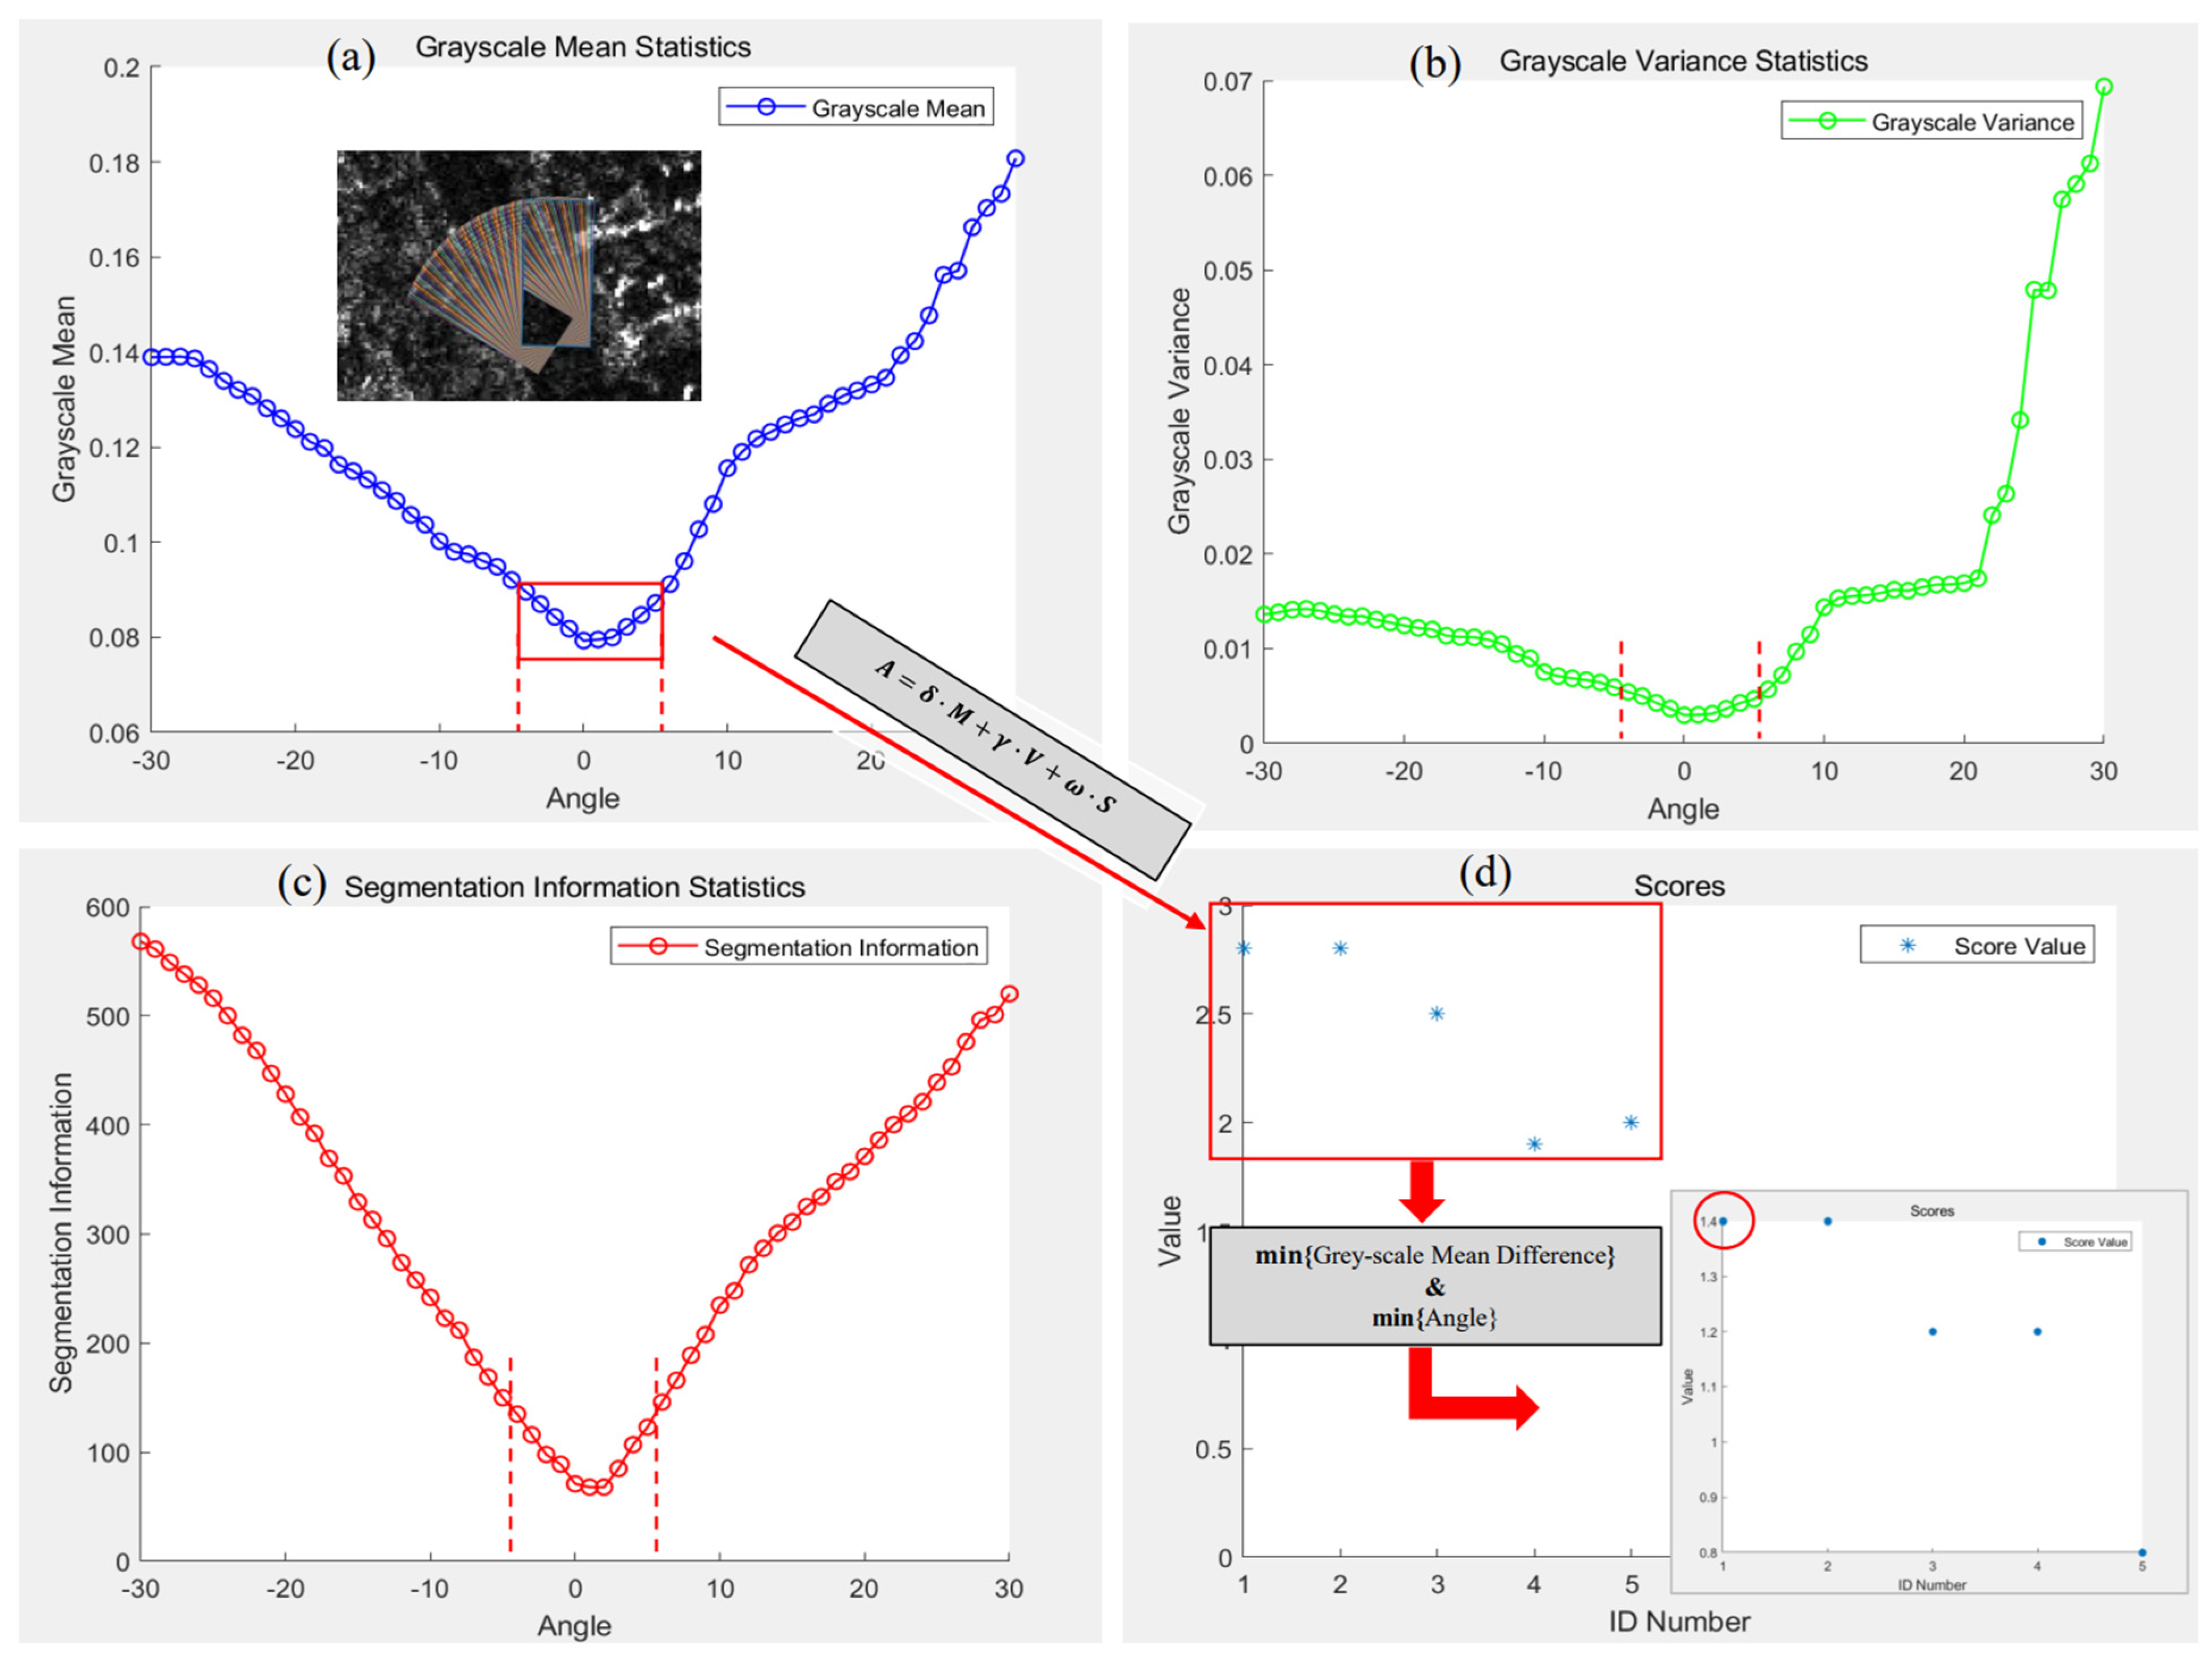
2.3.2. The Window Sliding Strategy

The road network extraction method here is based on the angular texture signature and POIs. In SAR images, the pixel values (digital numbers or DNs) of the roads are generally smaller than those of the surrounding features. In earlier publications, the angular texture signature usually included grayscale mean and grayscale variance [44,45,46]. In addition to these signatures, we included a binary segmentation SAR image to differentiate the roads from the surrounding features. Our new method incorporates three types of information (i.e., grayscale mean, grayscale variance, and binary segmentation), which were computed in sliding windows. A set of sliding windows can be defined as:
S i l d W i n d o w [ ] = ( α , M , V , S )
where α is a set of rotation angles of the sliding window; M is a set of grayscale means; V is a set of grayscale variances in the sliding window; and S is the sum of all pixel values within the sliding window of the binary segmentation image, where 1 represents a non-road pixel and 0 represents a possible road pixel. When the sliding window is rotated from one angle (αi) to another, we have the signatures
{ α = ( α 1 , , α i , , α n ) M = ( m 1 , , m i , , m n ) V = ( v 1 , , v i , , v n ) S = ( s 1 , , s i , , s n )
where n is the total times of rotation, with an angle interval of 1°; (M) αi is the ith angle; (M) mi is the ith grayscale mean of the SAR image; (V) vi is the ith grayscale variance of the SAR image; and (S) si is the sum of the pixel values in a binary segmentation image for the ith rotation. These three statistics are somewhat correlated, but they are still different and have their advantages.
Our ATP-ROAD method simultaneously considers three factors (M, V, S) where not every factor can be optimal in the same window, so we designed an approach to combining the three factors to achieve the best performance. In this method, smaller M, V, and S indicate better factors related to the roads. We selected the 10 best values from each of the three factors to identify the best sliding window. The overall metric for identifying the best window can be given by
{ A = δ · M + γ · V + ω · S s o r t ( A ) A
where A is the comprehensive metric considering the three factors; A′ is the sorted A in descending order; and δ, γ, and ω are the coefficients ranging from 0 to 1. These three factors were considered at equal weights, i.e., they were all 1 in this study. Based on the overall metric, we then selected the 5 best windows from the 10 candidate windows. We finally applied the best window from these five windows by comprehensively considering the difference in grayscale mean and the rotation angle between the sliding window and the road. The difference indicates the changes in the grayscale mean of a window from a time step to the next time step.
To extract the road information, the ATP-ROAD method considers the significance of each factor as determined by the factor ranking. Figure 4 shows that for each movement step, a window can rotate from −30° to 30°, although only those from −5° to 5° were selected in this case. Under these rotation angles, the grayscale mean (Figure 4a), grayscale variance (Figure 4b), and pixel sum in the segmentation image (Figure 4c) were input into Equation (11), resulting in the 10 best windows. At each movement step, among the 10 candidate windows, we selected 5 according to the grayscale mean difference and angle, where the candidate with the highest direction score was selected as the final window (i.e., the point marked in red in Figure 4d).

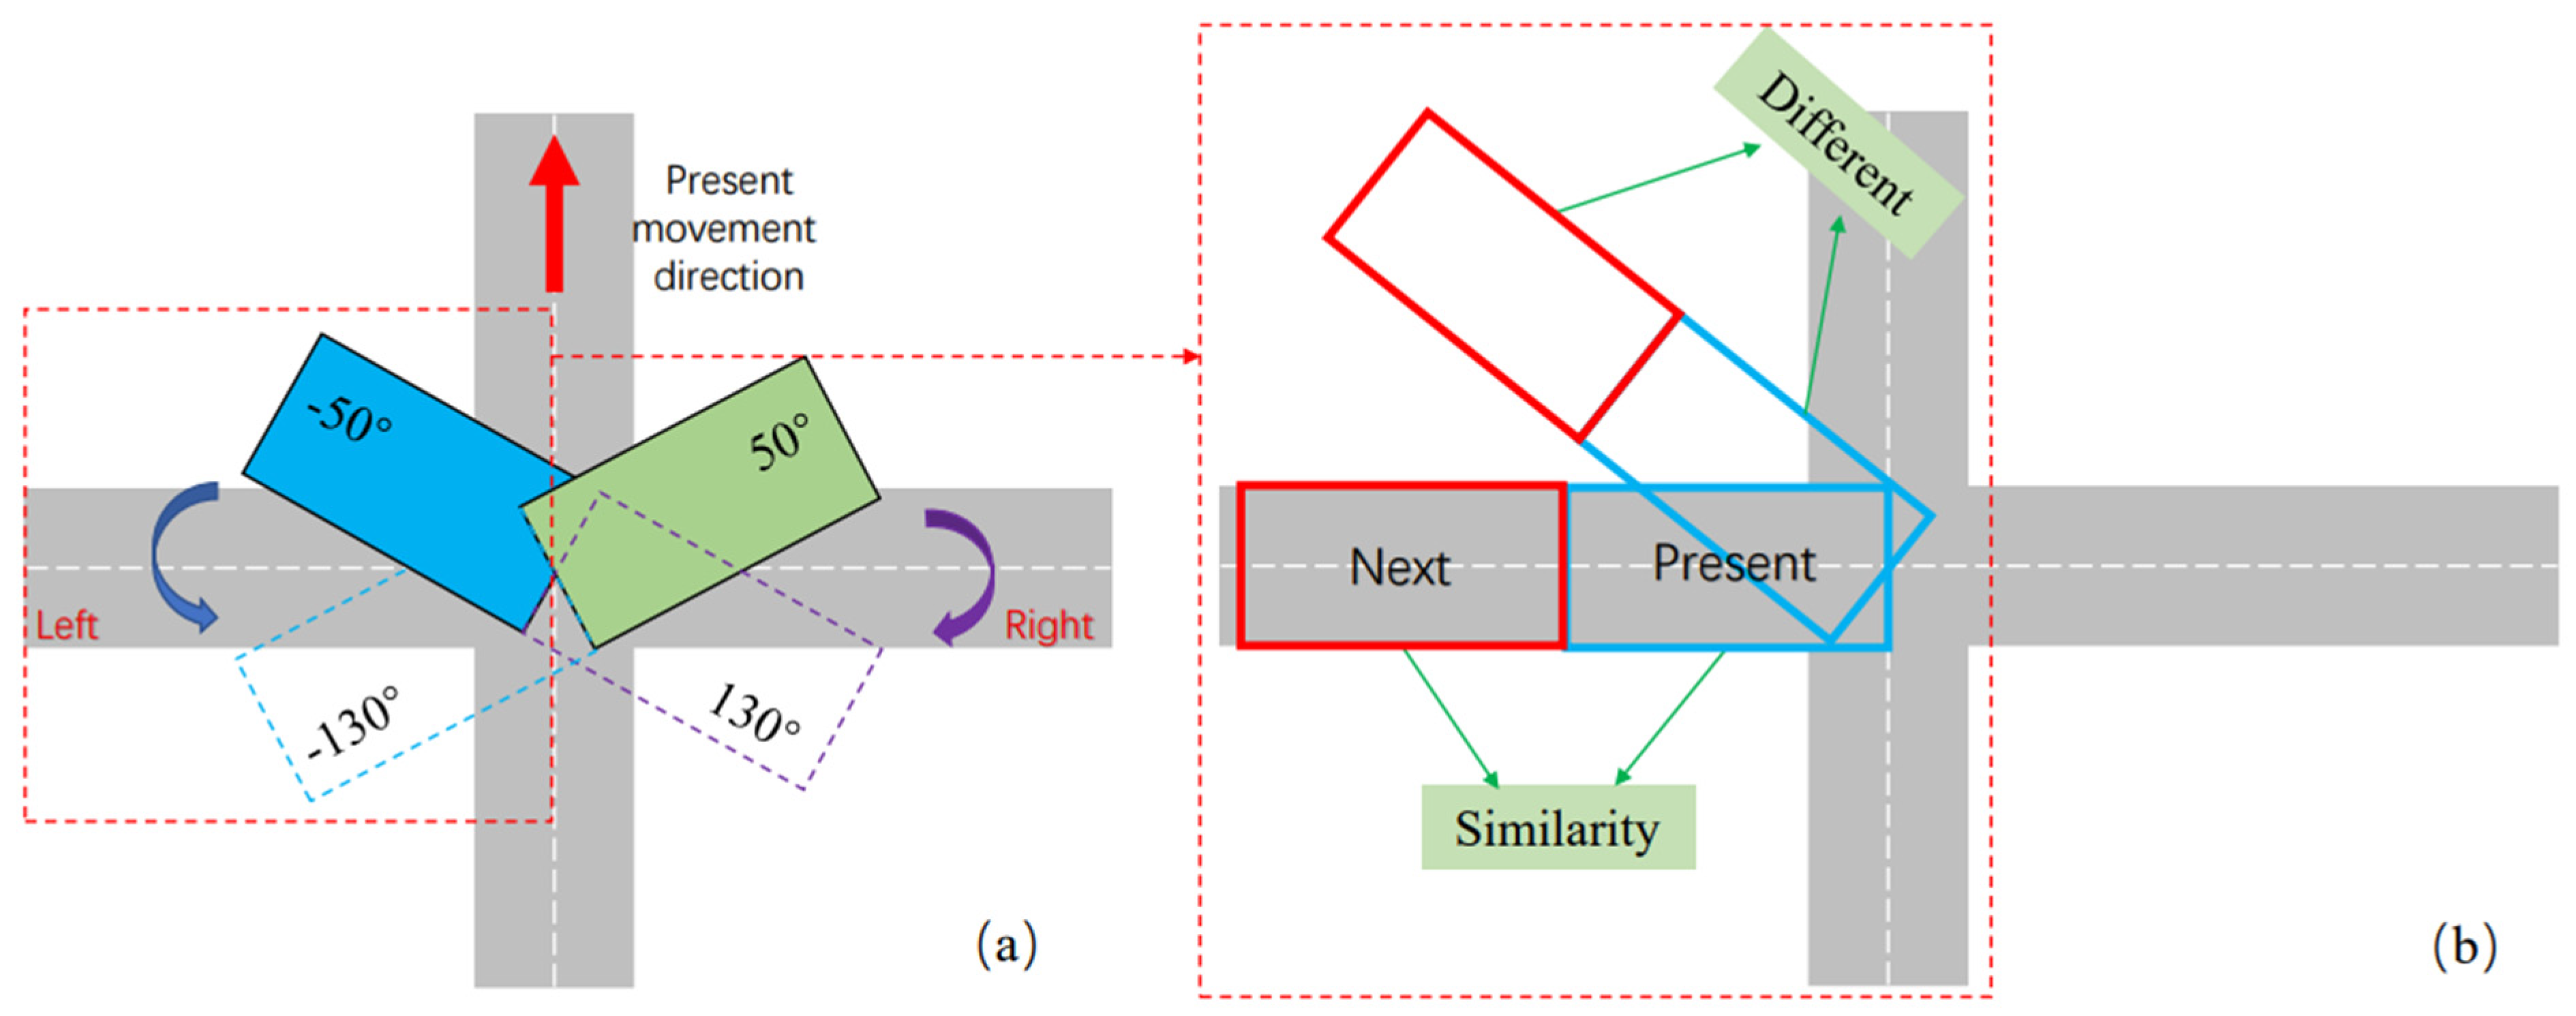
2.3.3. Intersection Recognition Method

During the window movement, it should identify what type (e.g., three- or four-way streets) of intersection each POI belongs to. For a four-way intersection, along the current road, the moving window only records the left and right sides that need to be extracted after the current road extraction is completed. Figure 5a shows that when the window moves to the horizontal road, it has two directions to identify. The window is adjusted by rotation angles from −50° to −130° for the left and from 50° to 130° for the right (Figure 5a). This means the window needs to examine 81 directions (each for 1°) for each side because the angle interval is 1°. Among the 81 directions, we need to record the best direction in the list, and its selection requires a certain criterion (e.g., a comprehensive metric). In addition, a single static window could not well determine the optimal direction, and we therefore used a present window at the intersection and its next window in the same direction to jointly determine if this direction is suitable (Figure 5b). We calculated its comprehensive metric (A; see Equation (11)) based on the difference in grayscale mean between the present and next windows. The greatest value of the comprehensive metric indicates the best direction that should be recorded consequently.
After the POI linking was completed, we used two means to ensure that the correct linkage was retained. First, we used the angle formed by the linking line and the known road to make our decision; if this angle is smaller than 50°, the linking is generally considered to be wrong; vice versa, it is probably correct. Second, if the direction of the minimum of the average value of the road grayscale within the sliding window is the same as the direction of the POI linking line, it is considered correct. If an incorrect POI linkage is chosen, the extracted road is completely incorrect; however, our subsequent experiments show that the three test areas in Shanghai justified our assessment and diagnosis of the correctness of the linkages.
POI linking lines can be used as road identification conditions at intersections for more accurate road extraction. When there is an error in linking the POIs, instead of using the linking line, the method shown in Figure 4 is used to extract the road information. In the case of correct POI linkages, the window counts the pixels in the POI linkages (i.e., 5 m buffer) covering the road; among the 81 directions, we selected the 10 with the most pixels to be the candidate directions. For the 10 directions (related to 10 windows), we obtained the grayscale mean, grayscale variance, and binary segmentation information, then applied the window movement strategy mentioned in the above section to extract the road information.

2.3.4. Movement Strategies

The distance that the window moves each time is half of its length. When the difference in grayscale means between the current window and the window after two steps is smaller than a predefined threshold, the window keeps the sliding direction. This threshold should be tested and defined according to the study area. In accordance with the three statistics specified in Equation (10), it is ensured that the sliding window proceeds along a broad road area, and during the proceeding, we calculated the difference in the grayscale means of the SAR images between the previous and the next sliding windows. For this difference, if this difference is greater than a predefined threshold, the forward direction of this sliding window is incorrect; otherwise, the ATP-ROAD method is used to slide the window along the current direction. Theoretically, this threshold should be very small due to the extremely small differences in the microwave scattering characteristics of the roads within a given region. For a specific study area, we conducted iterative tests to determine an optimal threshold by visual inspection for identifying the similarity between the extracted road network and the actual road network. In this study, the thresholds were 0.015 for Area-I, 0.02 for Area-II, and 0.029 for Area-III. For a study area, there are two factors for the information extraction window to stop sliding, i.e., the window reaches the edge of the image or reaches any of the extracted roads. When either of these two cases occurs, we need to determine if there are still any internal intersections to be extracted. If there are still unextracted intersections, the program continues; if all internal intersections have been extracted, the program terminates.

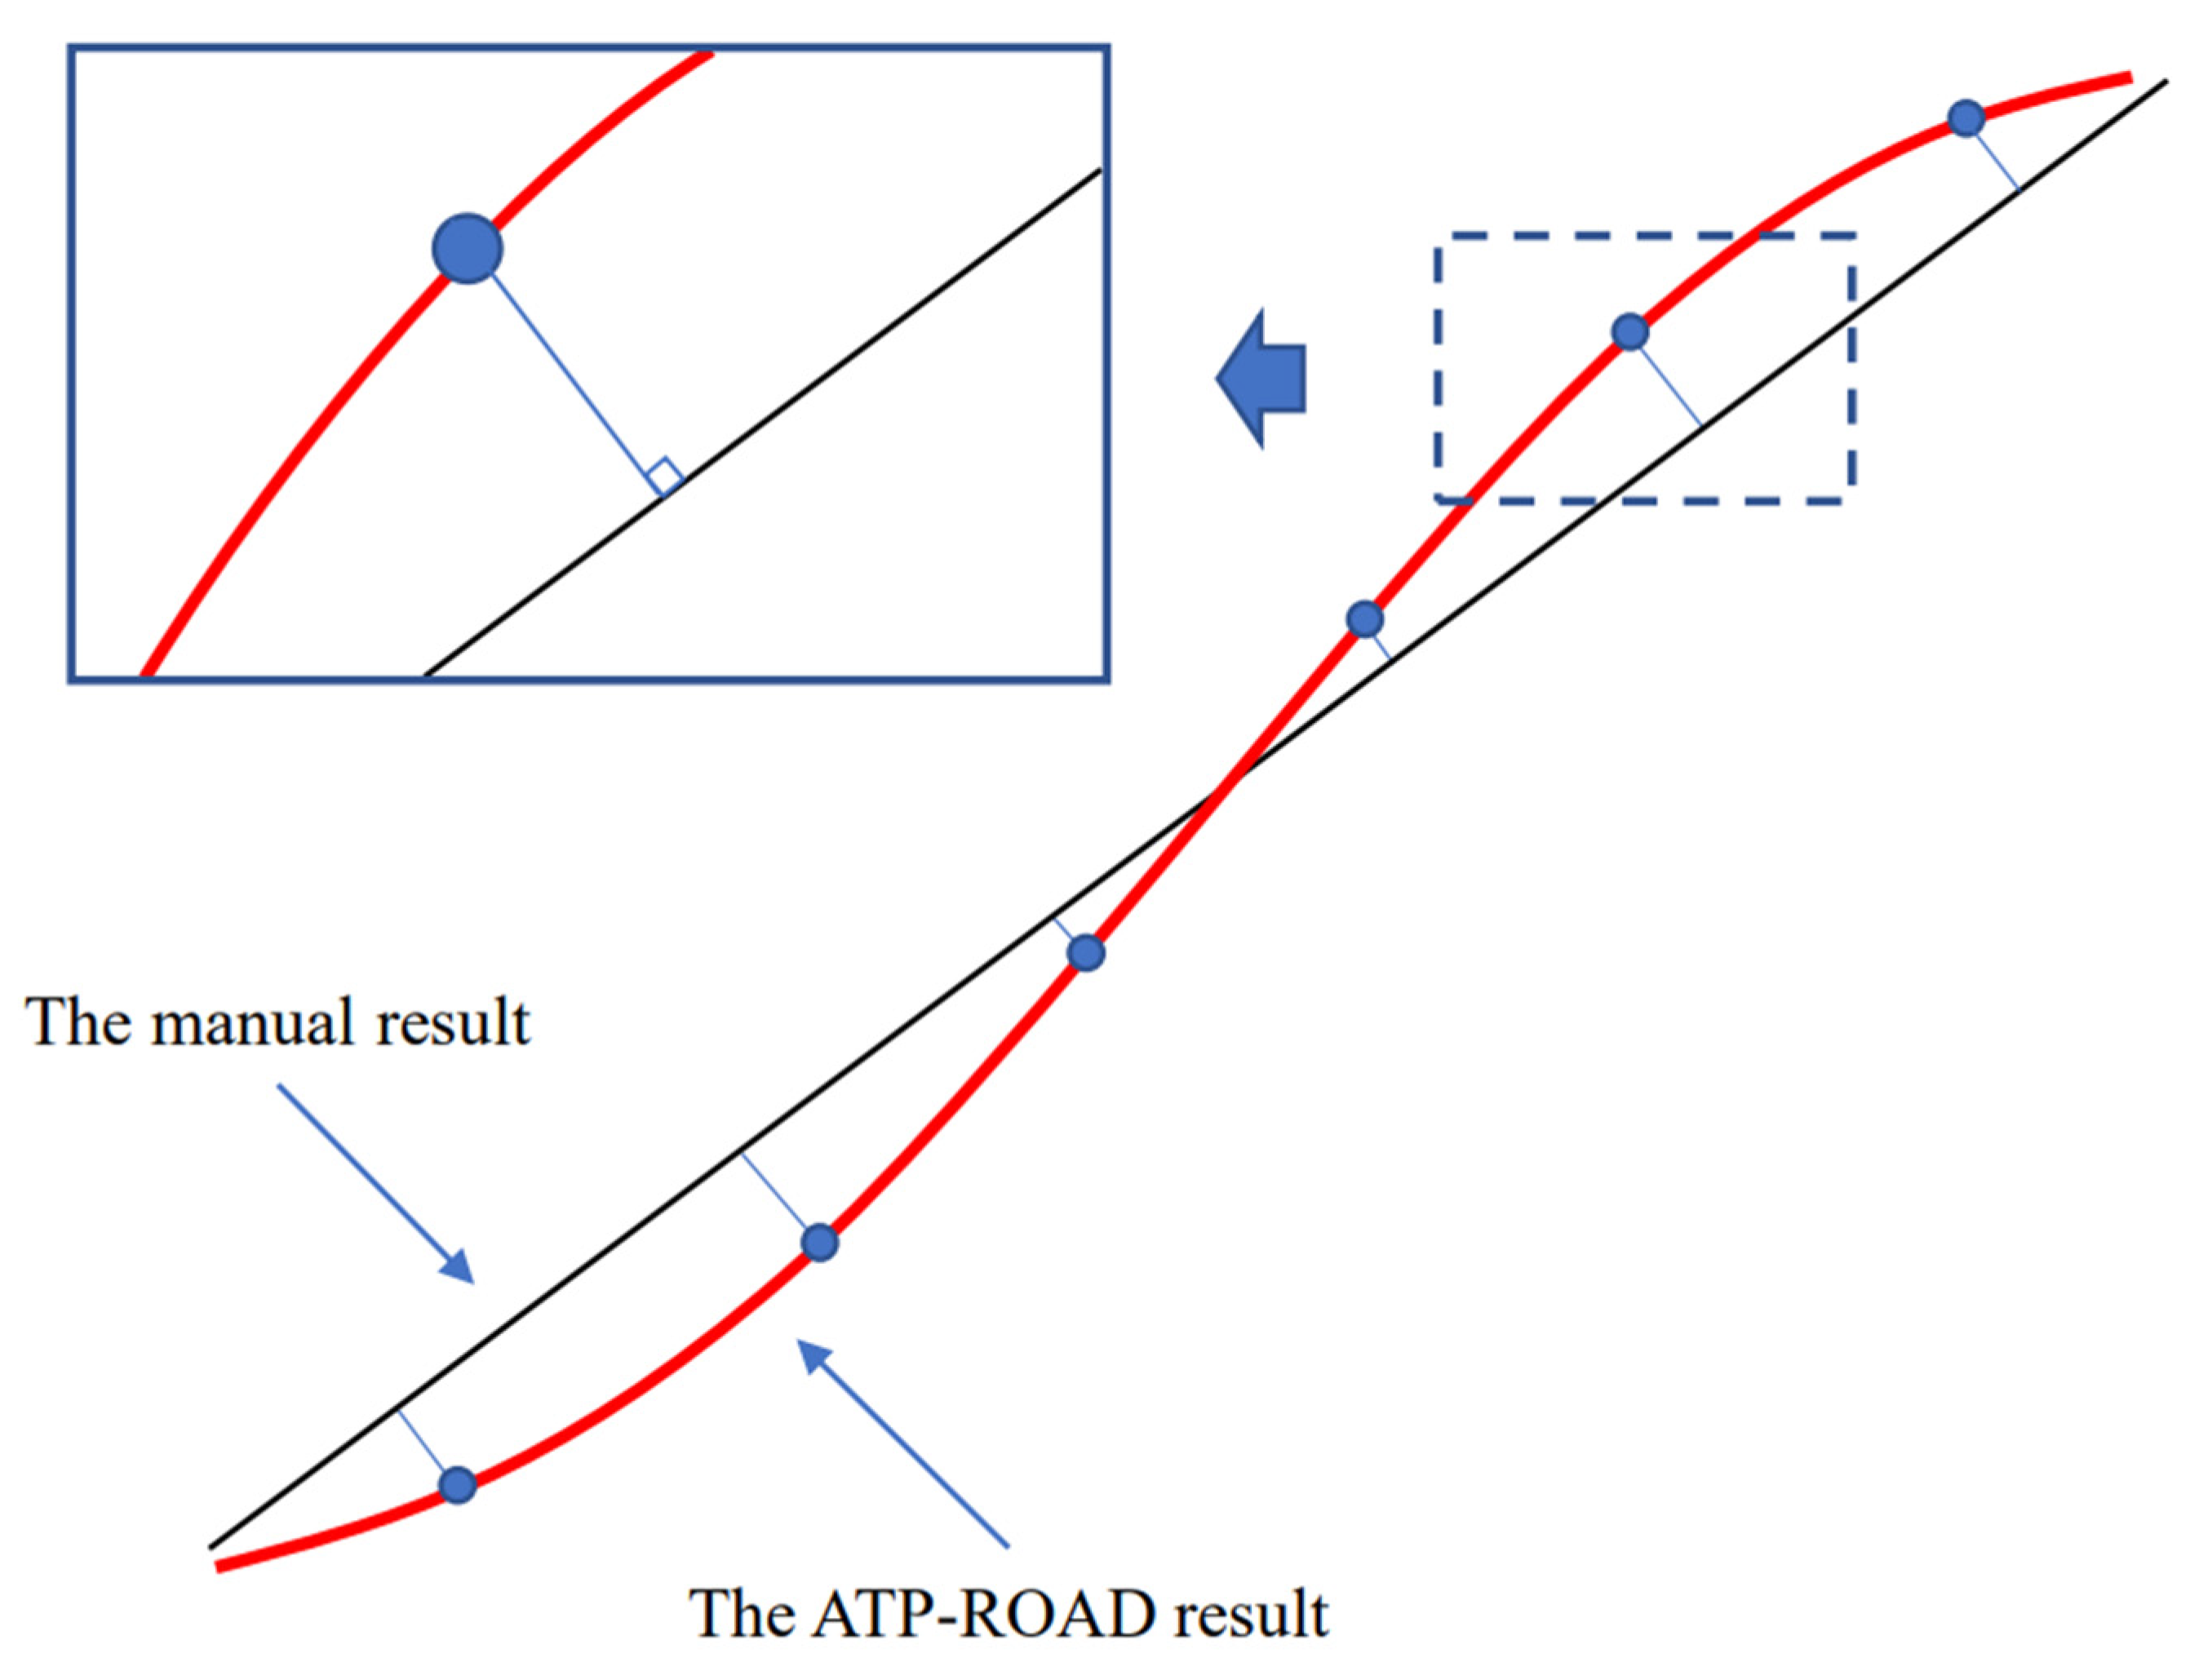
2.4. Accuracy Assessment Method

The extraction results produced by the above semi-automatic methods need to be evaluated from multiple perspectives for correctness, completeness, accuracy and efficiency [47]. Road information identification and result assessment are performed simultaneously in the road extraction processing, thus ensuring the correctness and integrity of the roads. In terms of the extraction methods, the sliding window is created by inputting only three known points, thus improving the automation of the method and the accuracy of the results compared with manual extraction methods. In terms of the results, roads extracted with our method were compared using manually extracted roads as a benchmark. The distance between two roads (produced by our method and manual) is one of the most effective measures of their proximity, and this distance can be used to generate assessment statistics (Figure 6). These statistics include maximum distance, minimum distance, average distance, and standard deviation. Considering that it is extracting the centerline of the road, a major concern is whether the extracted line falls on the road in the SAR image. Therefore, we used half of the width of the narrowest road (6.5 m) as the threshold, and if the distance between the manually extracted road and the ATP-ROAD-extracted road is greater than the threshold, we considered that the extracted road is Incorrect.

3. Experiments and Results

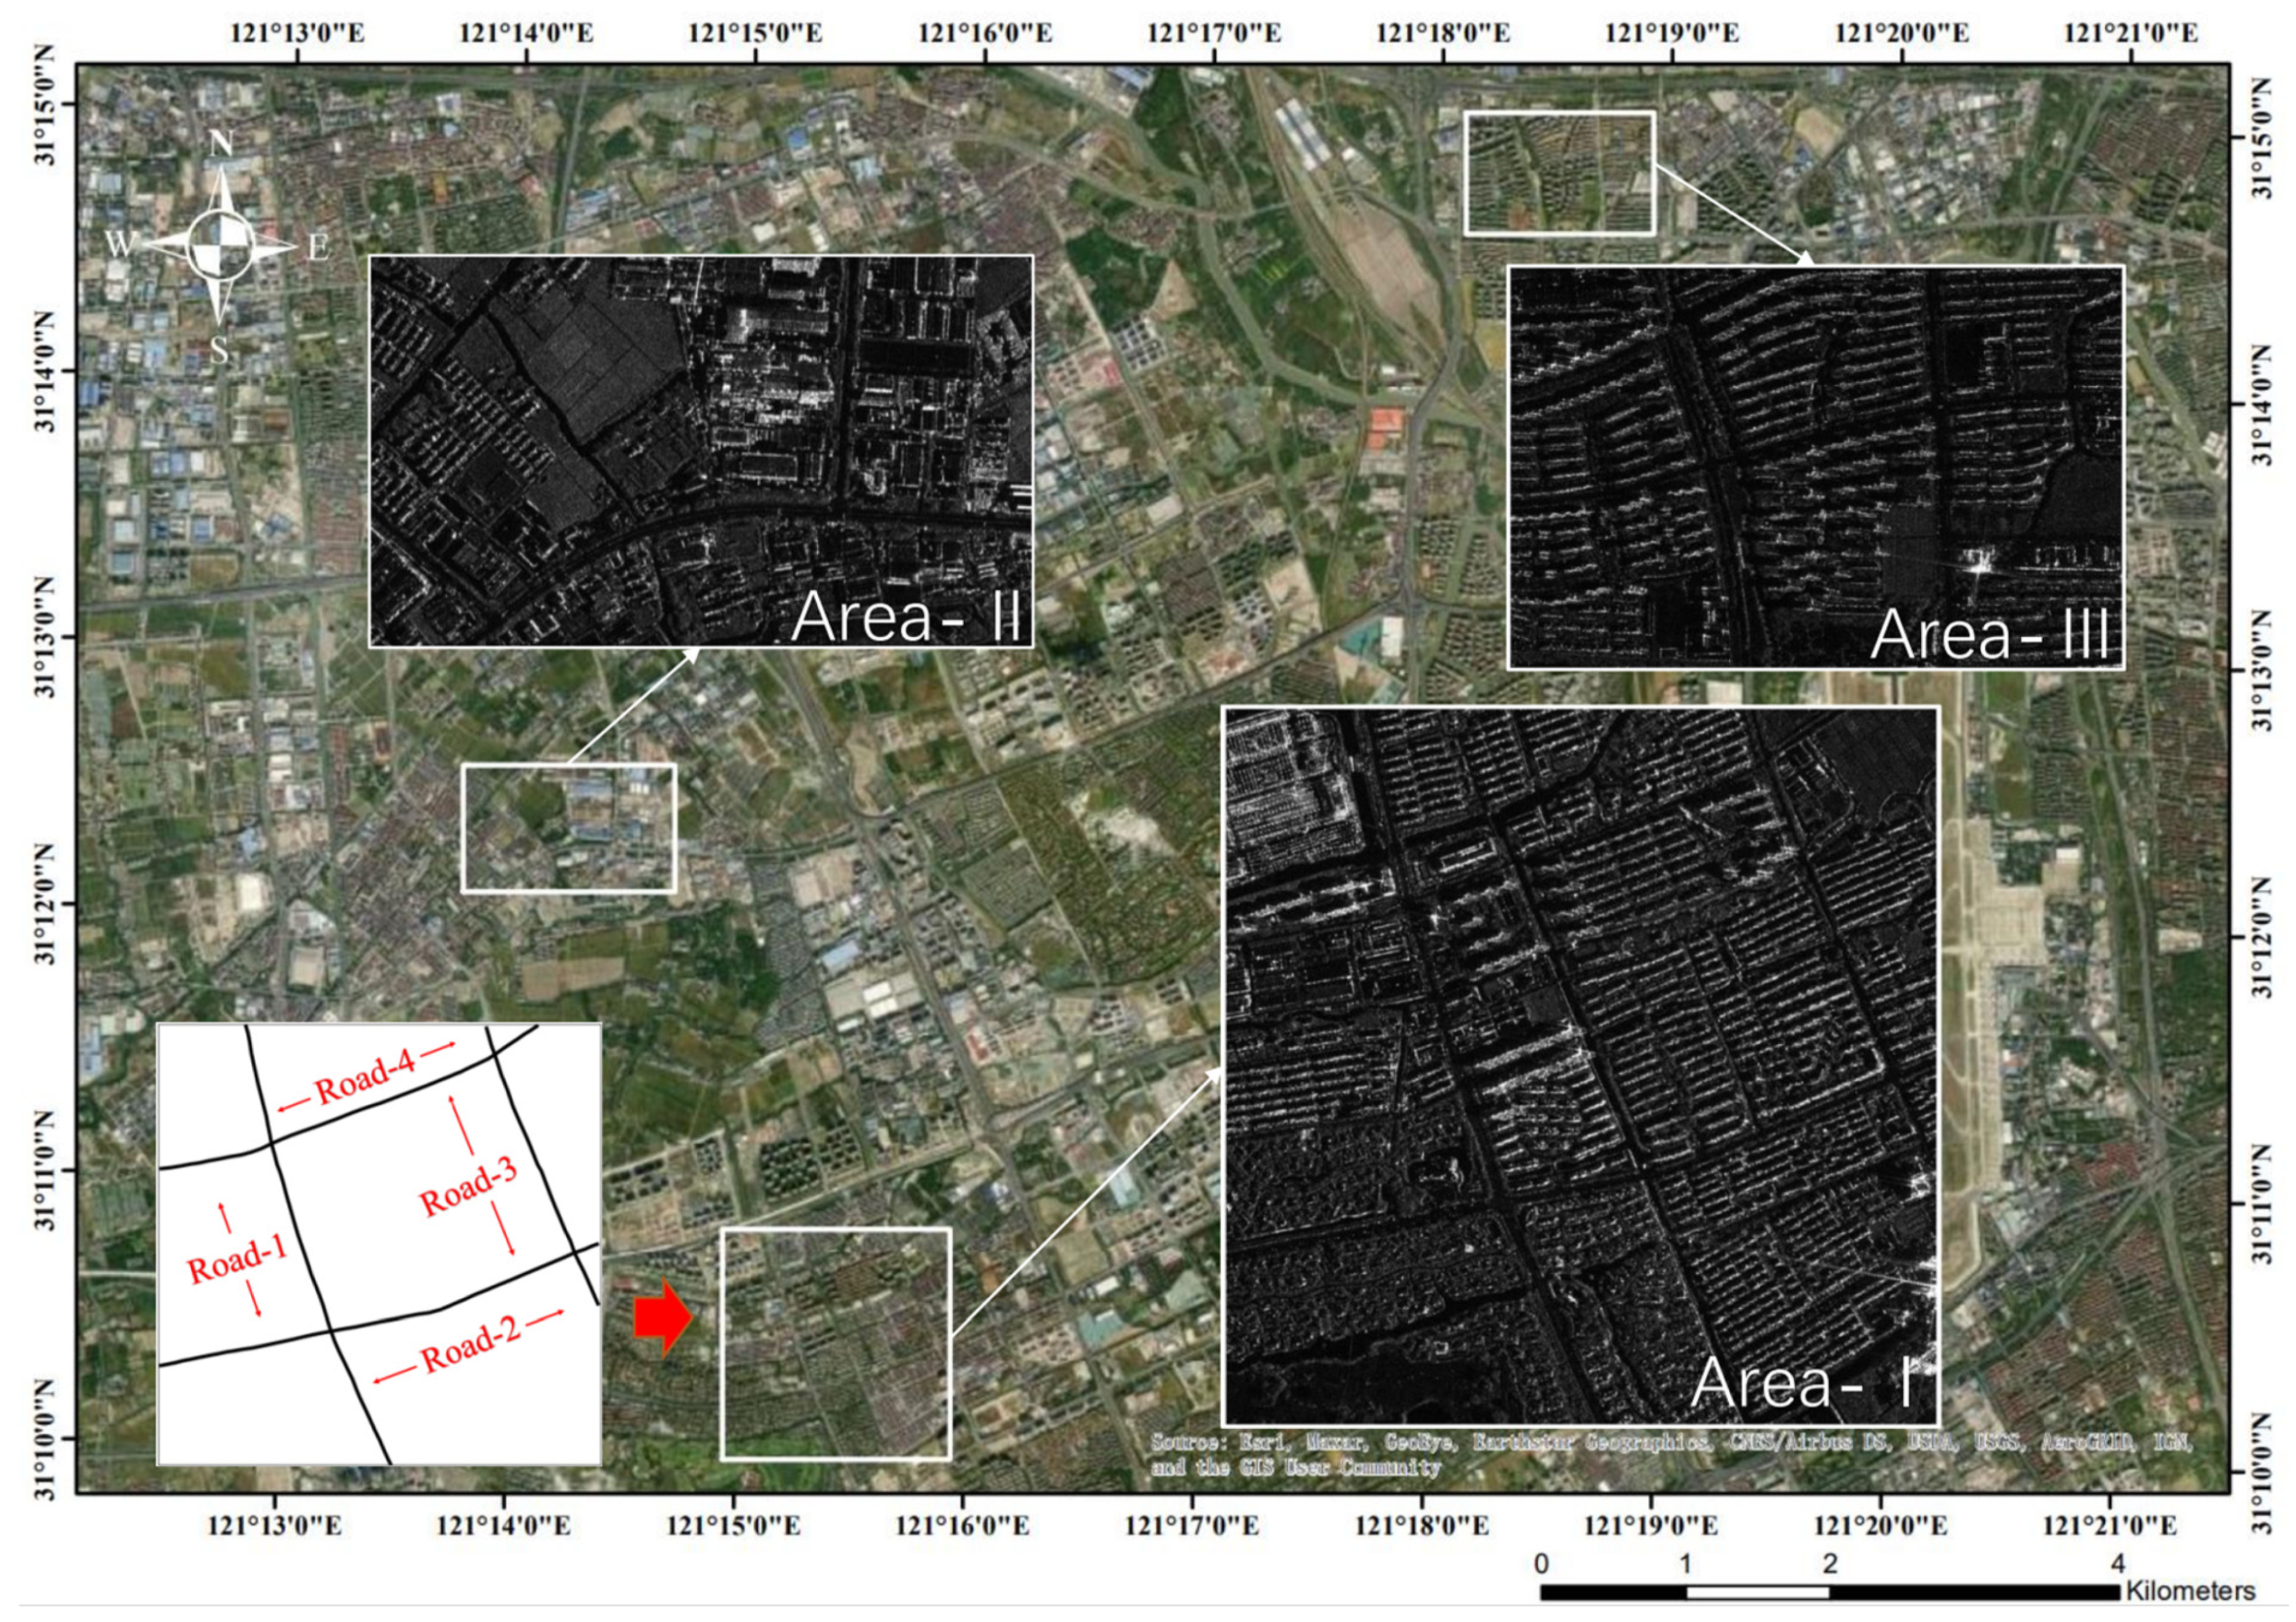
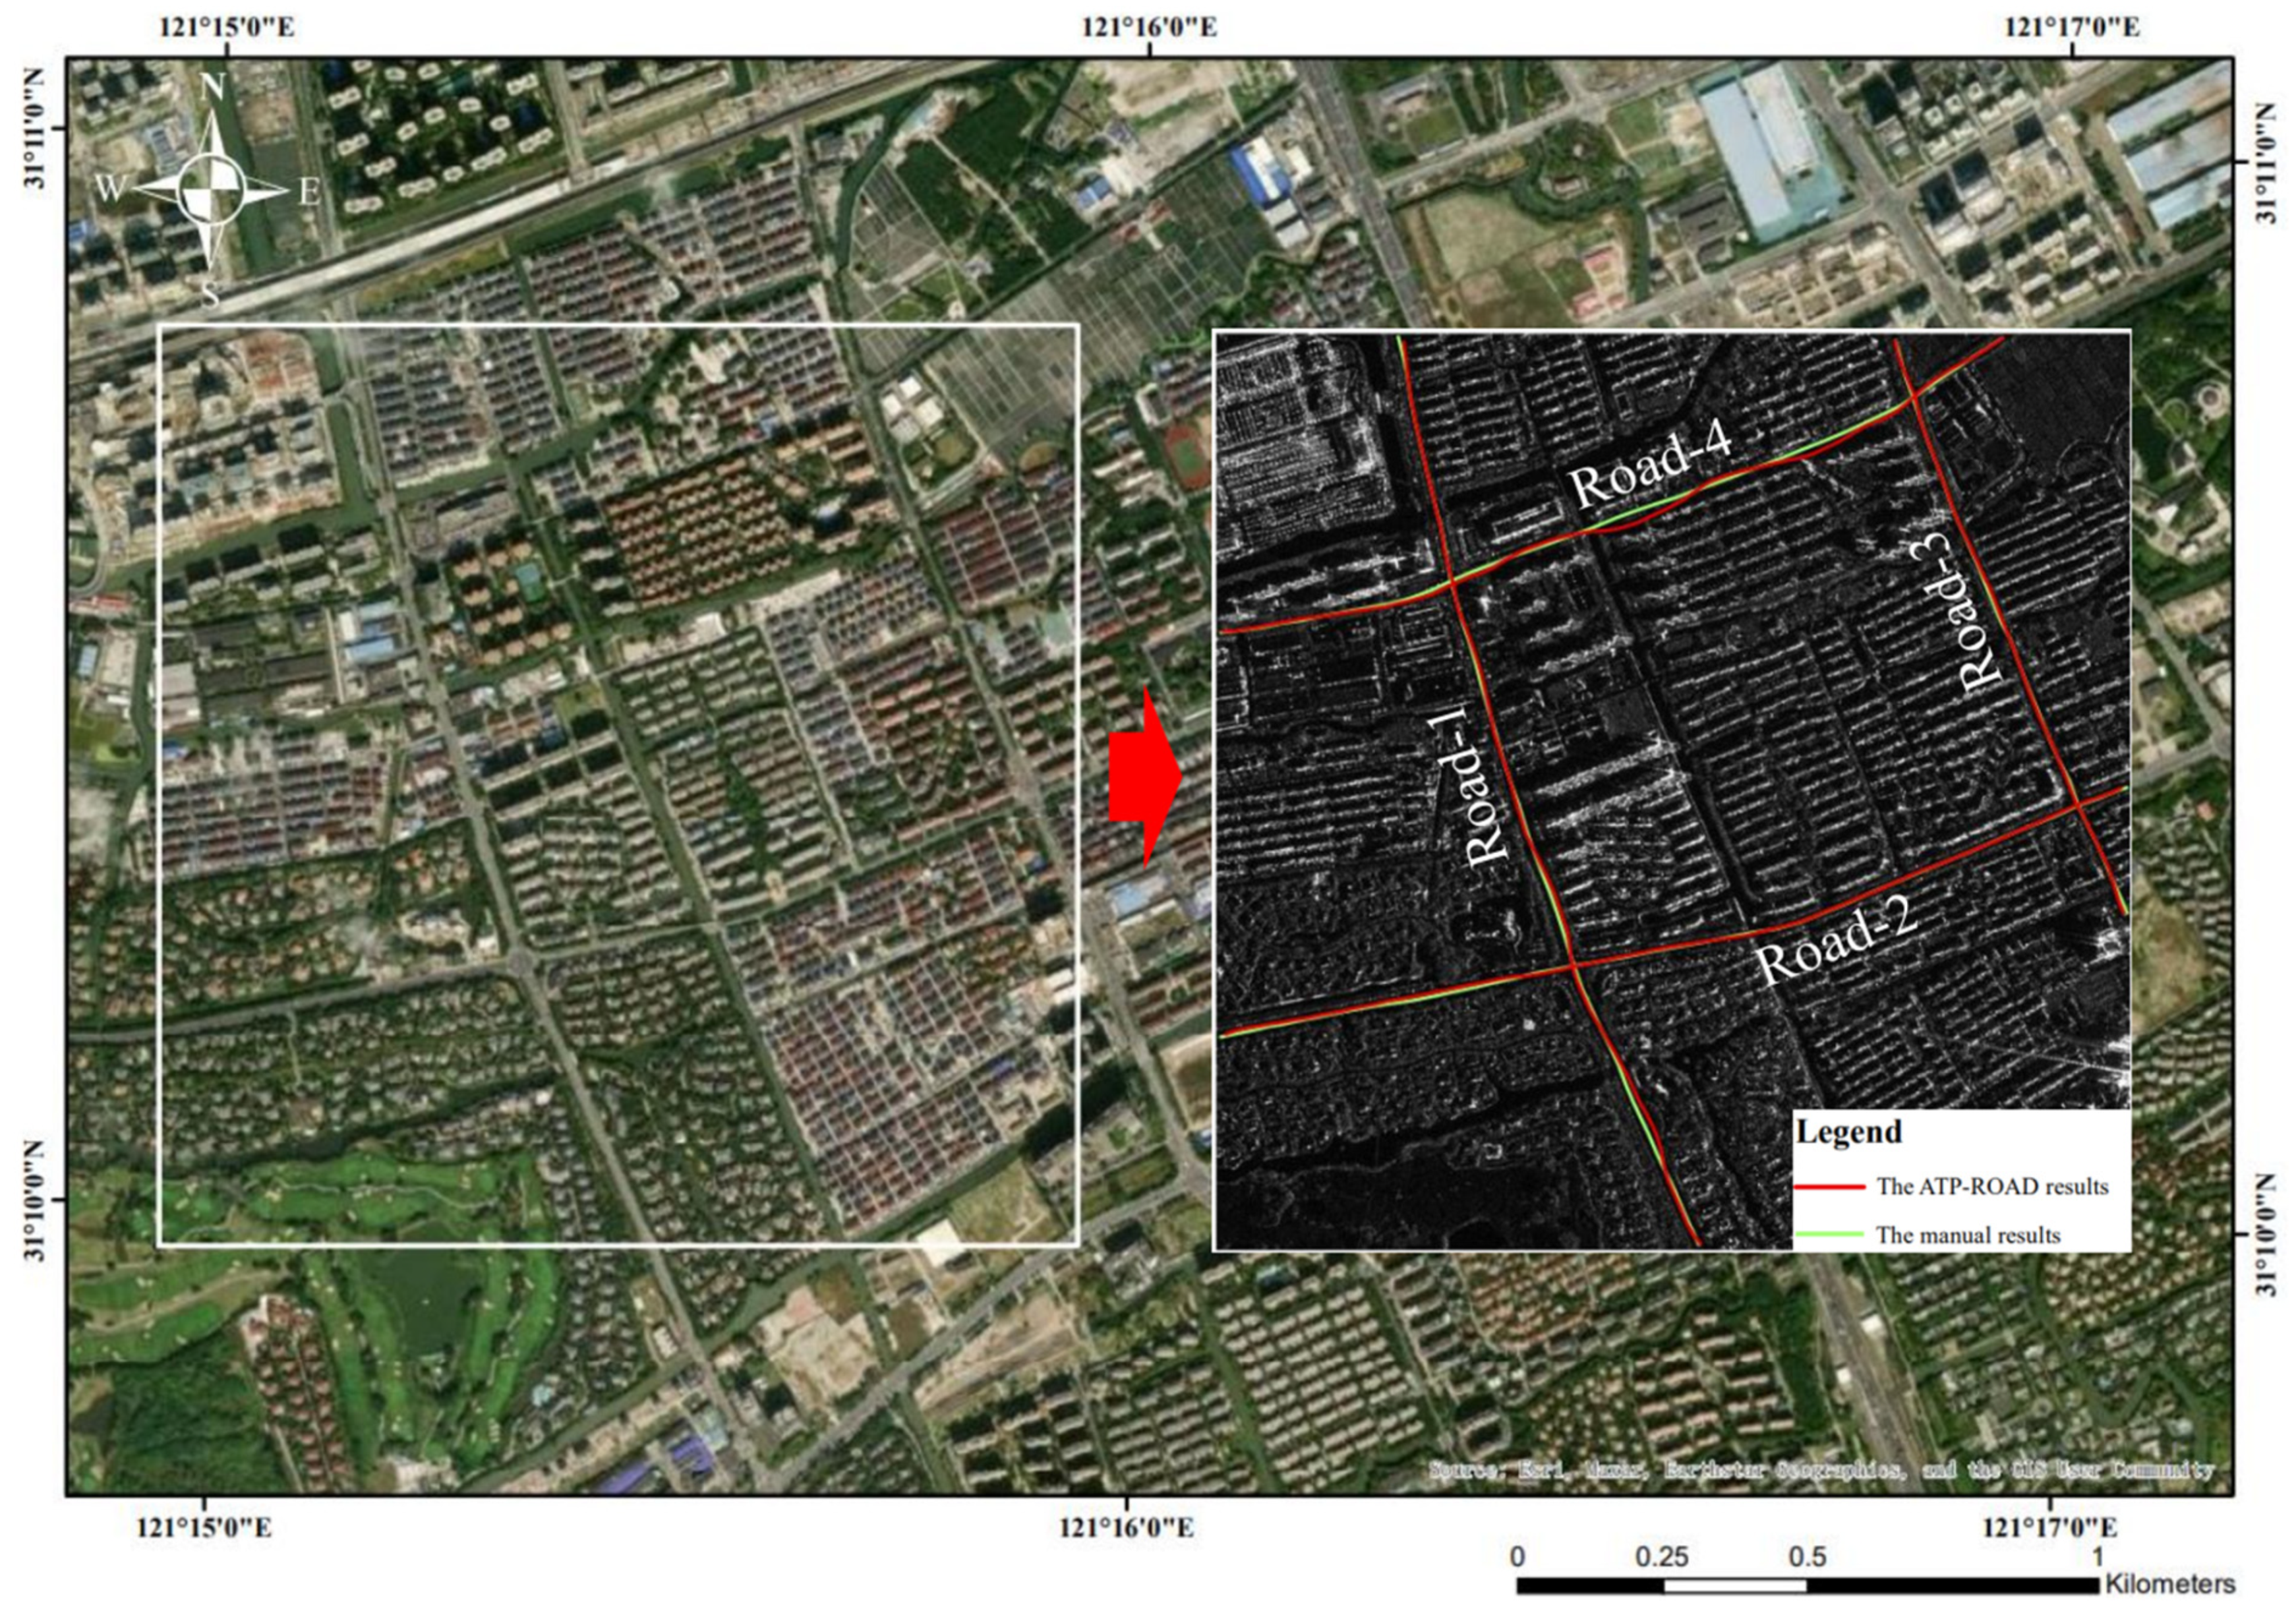
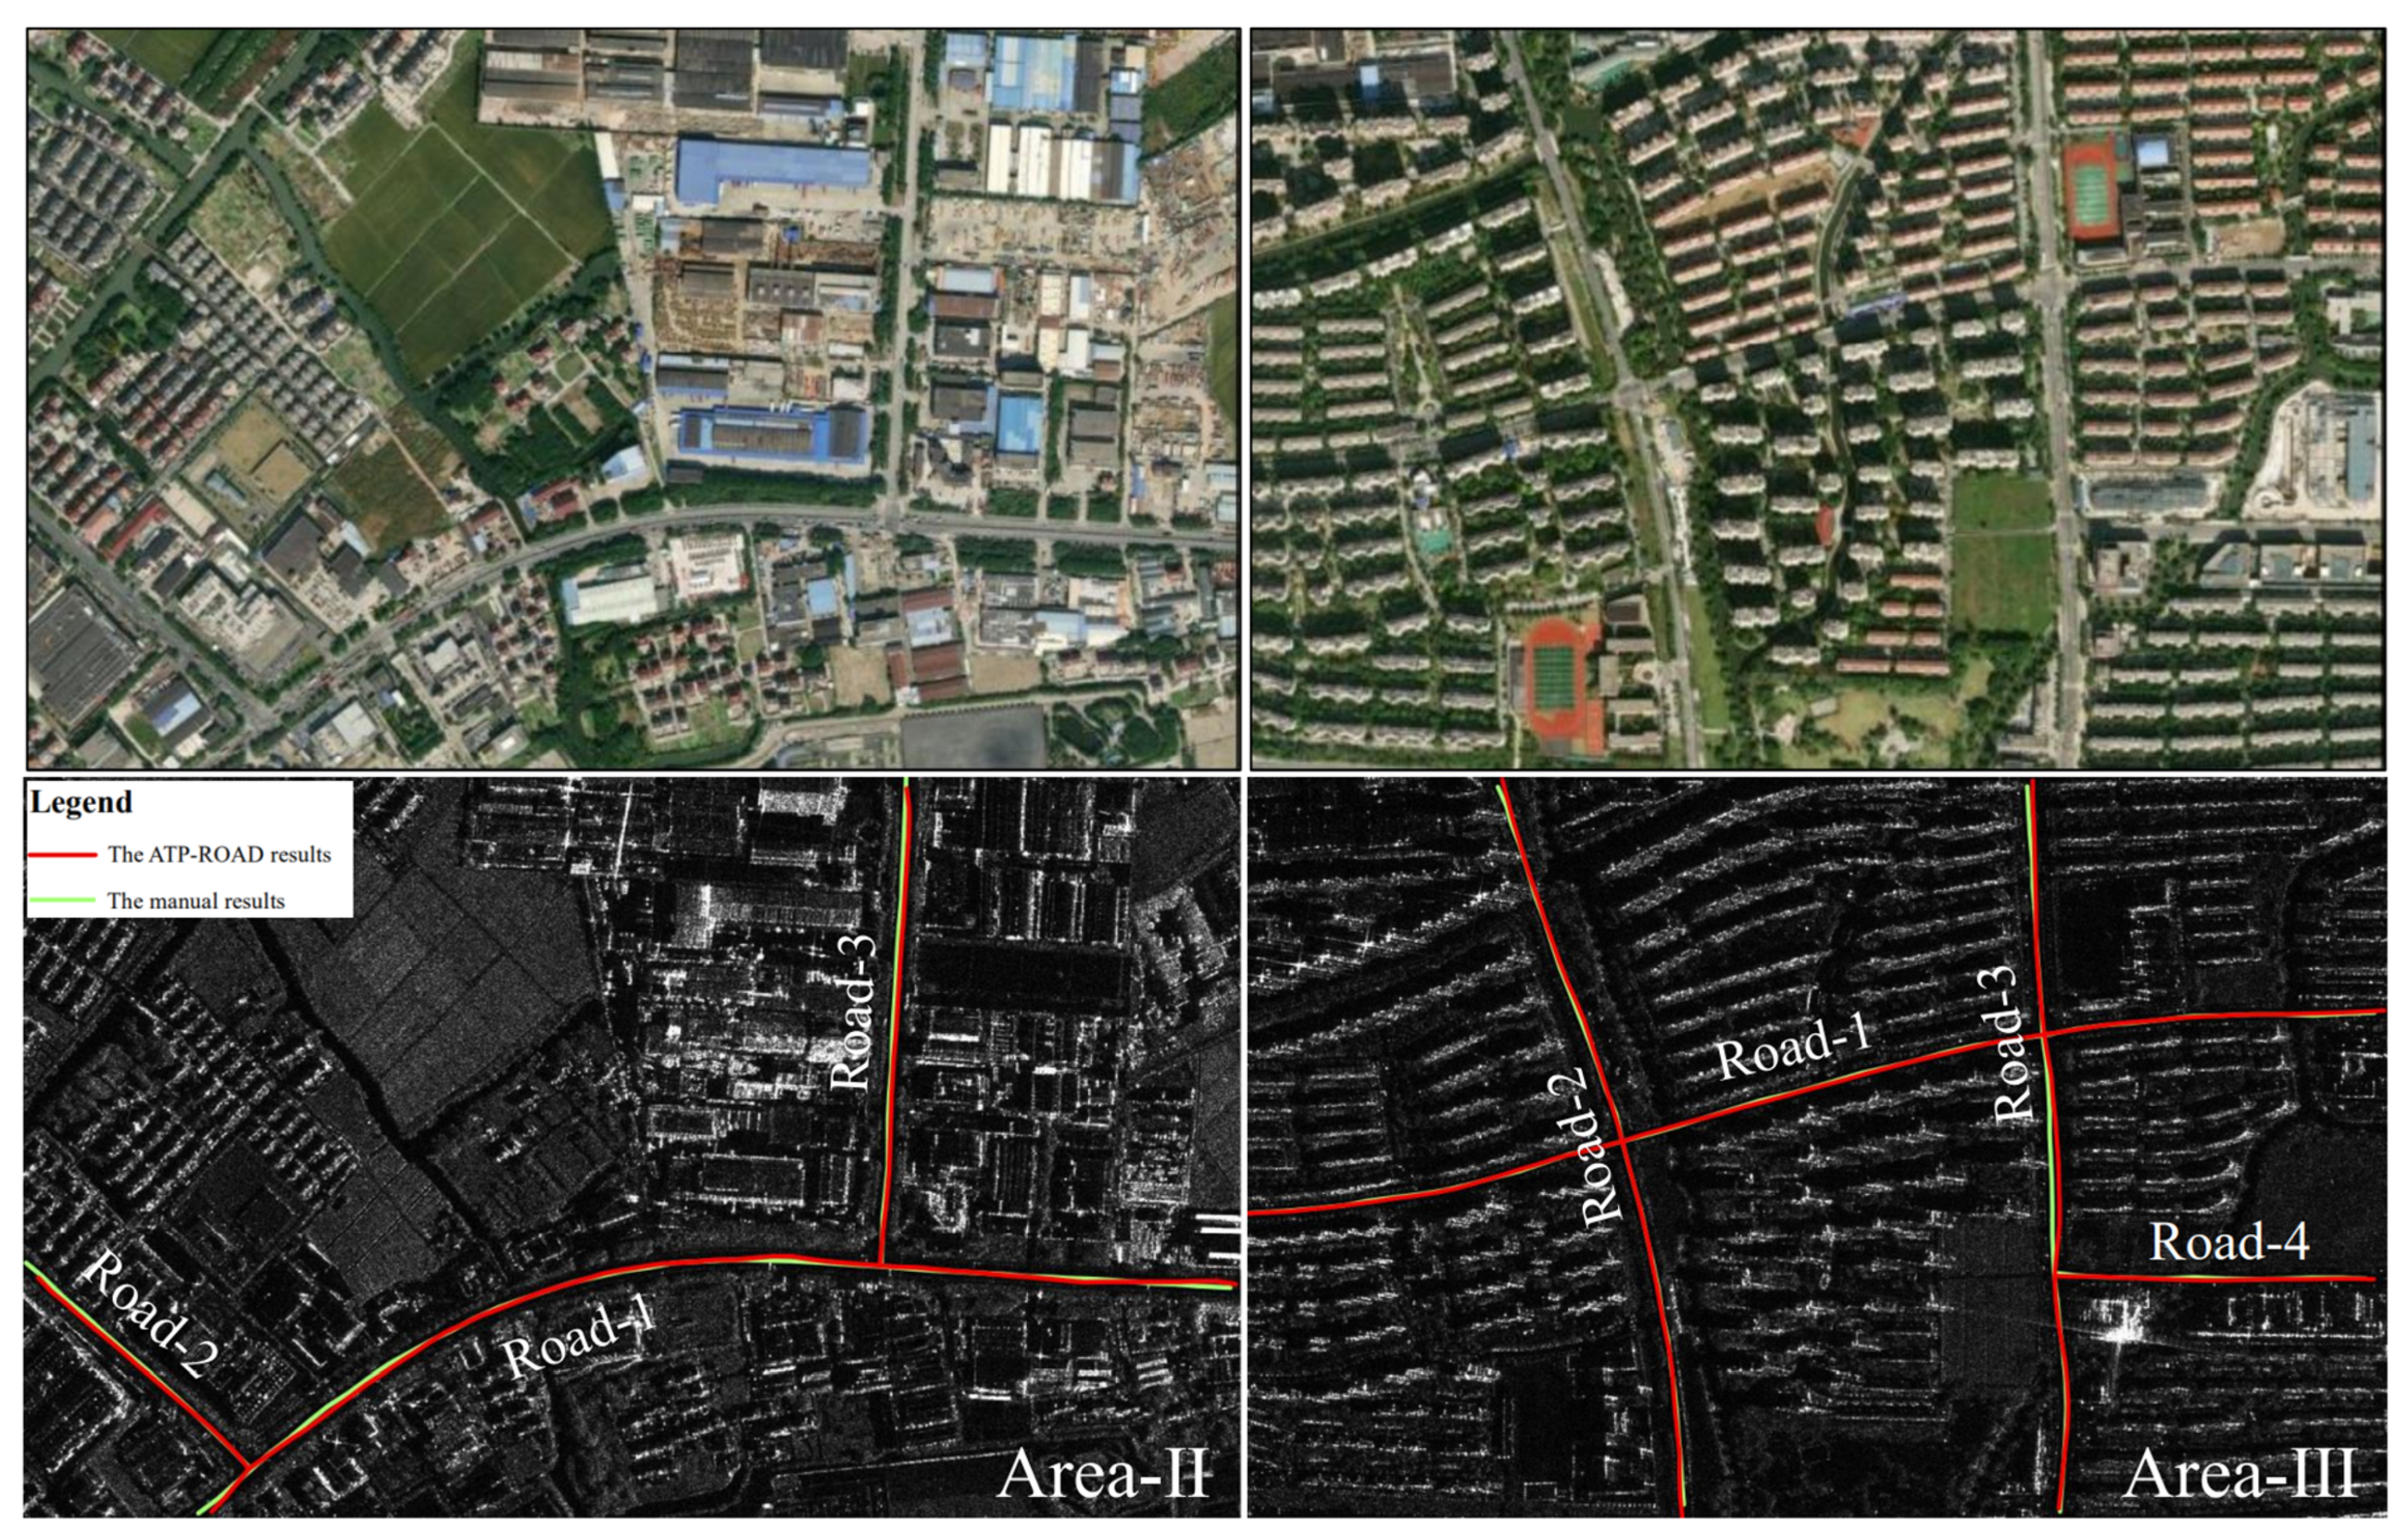
3.1. Experimental Areas and Datasets

Our experimental areas are located in Shanghai, China, where the urban expansion driven by road construction is faster than in other areas. In the city and district centers, the roads are relatively narrow and lush with trees, or there are many tall buildings on both sides. In urban fringe areas, the roads are relatively wide, and trees are less lush. In general, because roads in Shanghai are somewhat curved and complex, it is relatively difficult to extract road network information. Three areas were selected to test the ATP-ROAD method, where Area-I and Area-III are in the Qingpu district center, and Area-II is in the Jiading urban fringe areas (Figure 7). We used the sliding spotlight mode and single-polarized SAR images of China’s Gaofen-3 satellite as the experimental data (Table 1). The three areas have the same resolution of images, different coverages, and different types of roads. In Area-I, the four roads consist of a tic-tac-toe road network having intersections with each other, which is a typical network for testing the proposed ATP-ROAD method. In Area-II and Area-III, we verified the generality of ATP-ROAD, where Area-II has a main road with a large curvature, accompanied by two branches extending from the same side, while Area-III has a road network irregularly distributed. Compared with optical images, it is more difficult to extract road network information using SAR images because road backscattering information may be influenced by surrounding features [48,49]; however, testing and validation in these complex regions will facilitate the application of our method elsewhere. The ground truth of the road networks used to evaluate the results was extracted manually.
POIs are mostly distributed on the roads or on both sides of the roads, which can help with the road extraction. In general, POI categories are various, and we selected POIs of road intersections as auxiliary information for road extraction. The POIs used in the experiments were taken from the data published online by AutoNavi® in 2021 (Table 2). There are 23 categories of POIs such as road feature, transportation service, and place name and address. The intersection POI data is a subcategory of the place names and addresses, which were provided by the AutoNavi® website (lbs.amap.com/api/webservice/download, accessed on 11 July 2022).

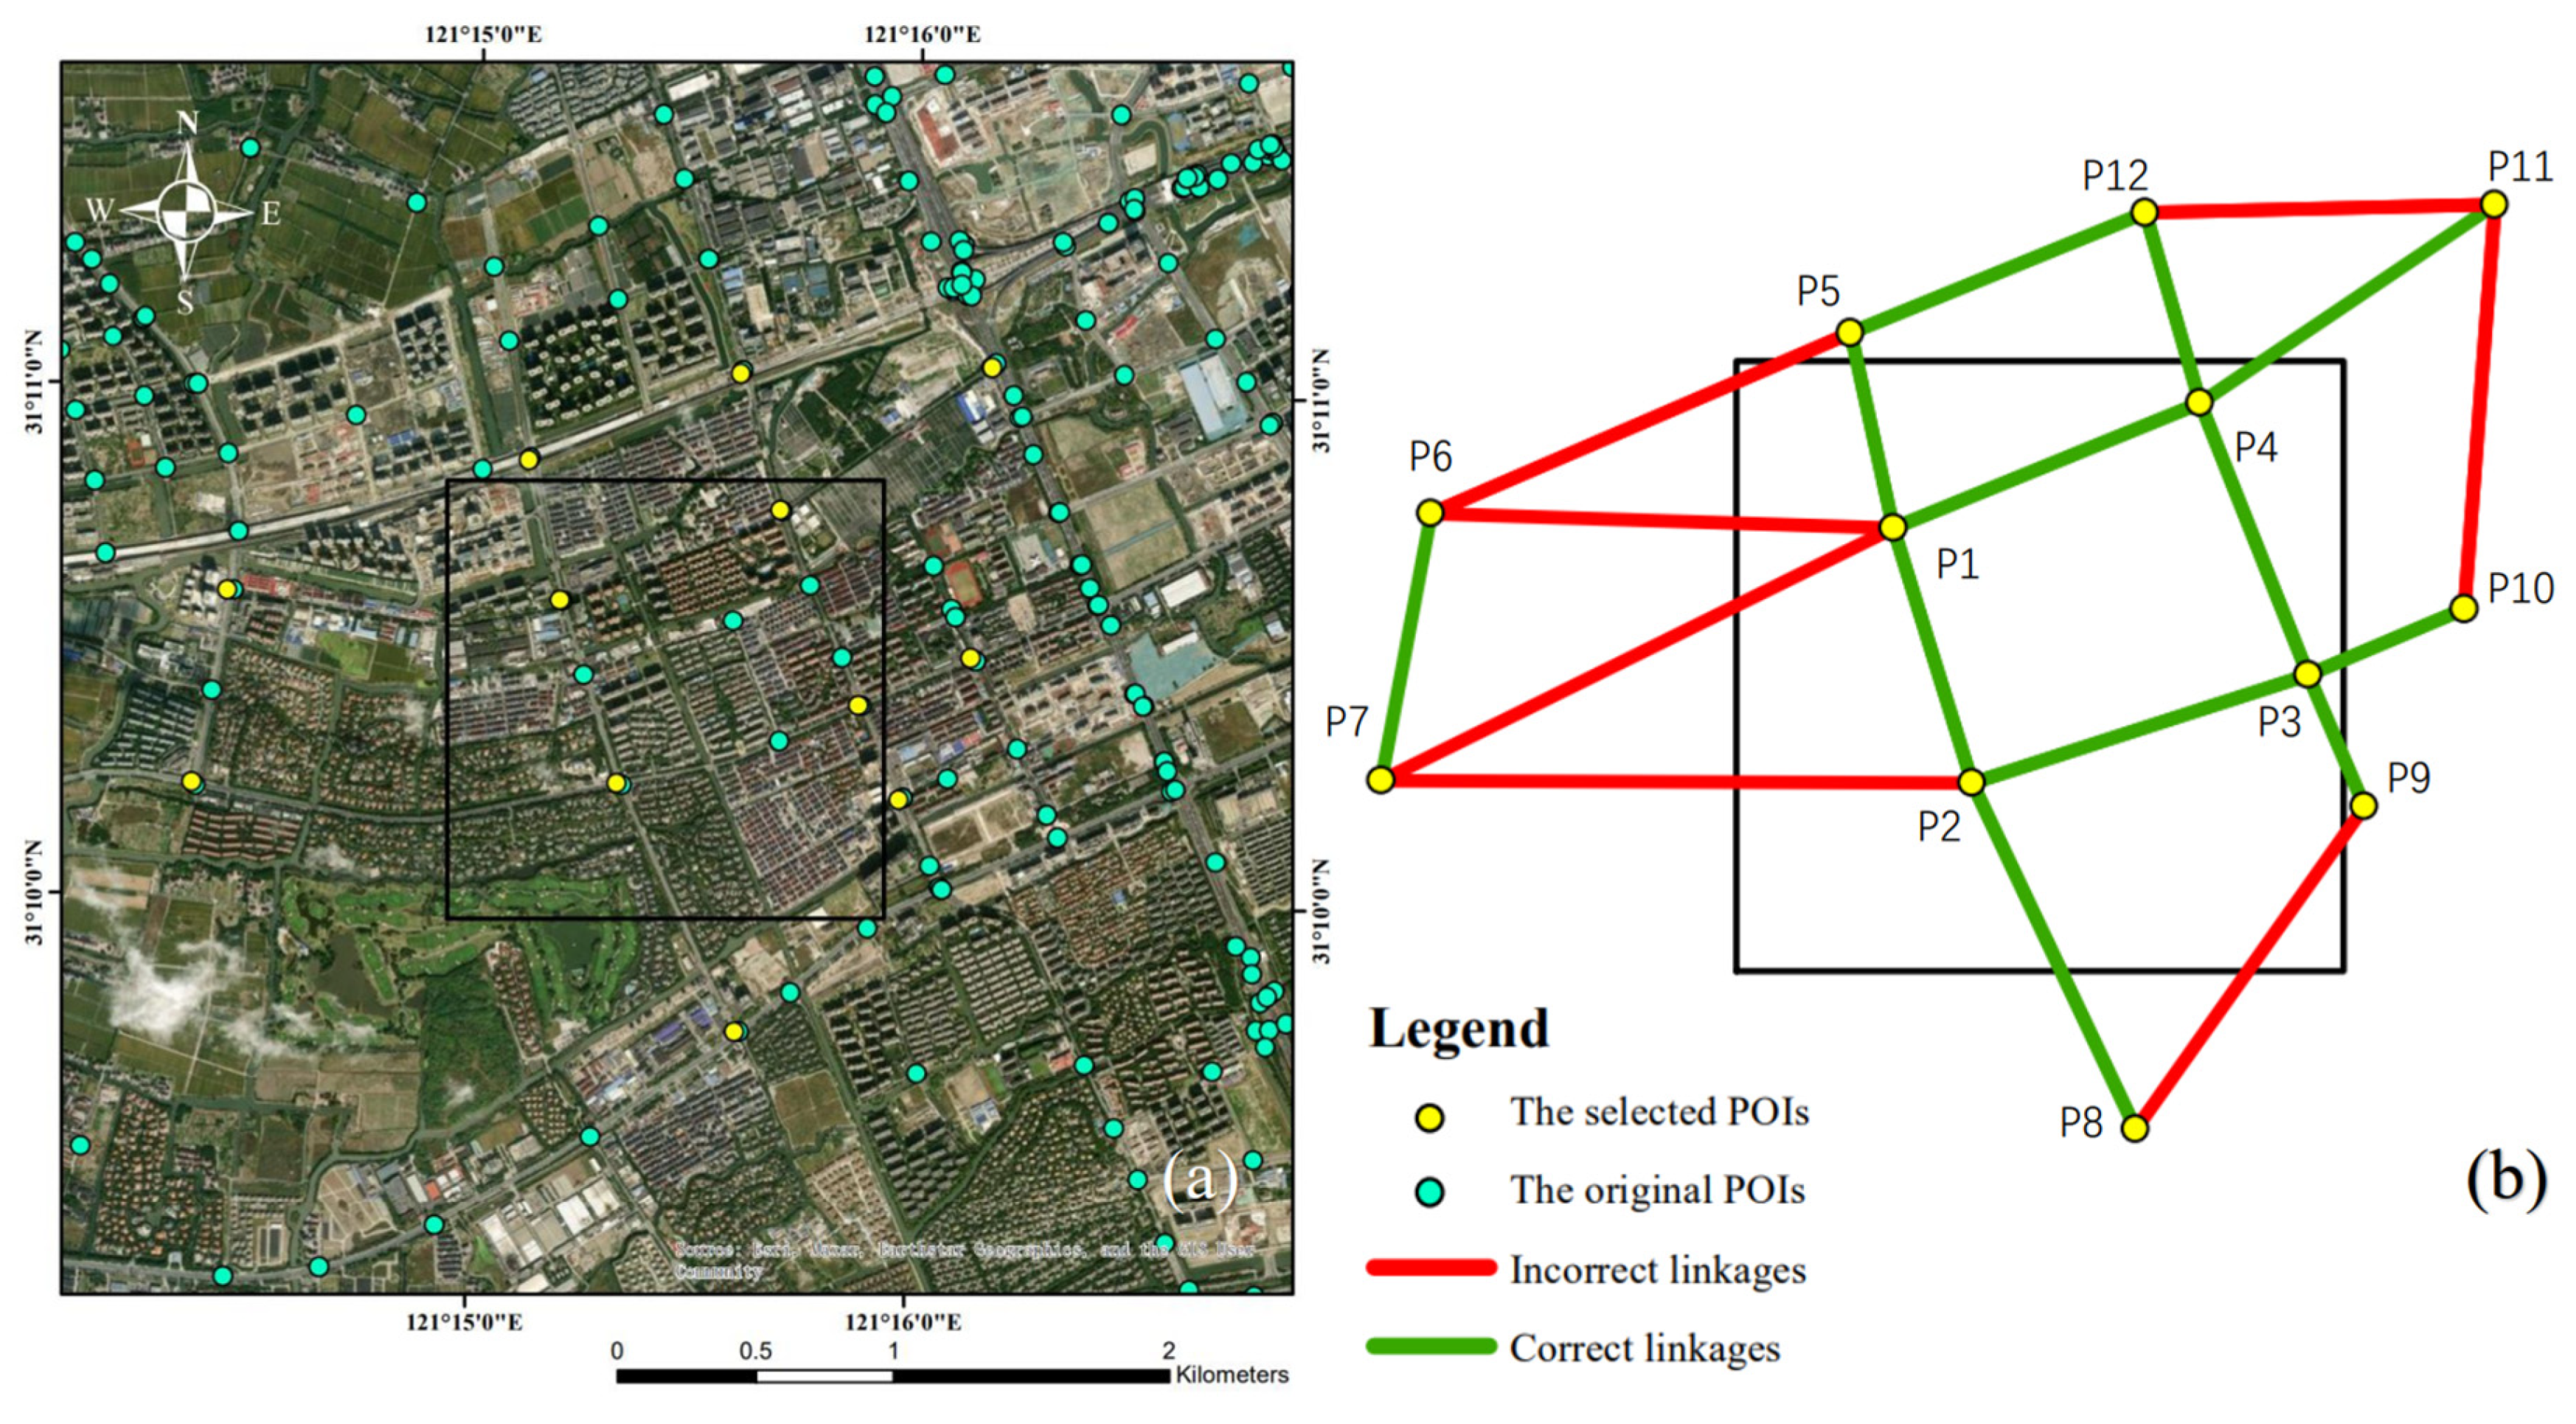
3.2. POIs Processing Results

Here, we use Area-I as an example to explain the process and results of POI processing. To ensure that POIs can be used for road extraction in the study area after point linking, the area used for POI selection needs to cover Area-I completely. In Area-I, we collected 16 POIs about the roads (Figure 8a); among these only a few were needed for the road linking to guide the window sliding and road extraction.
Based on the POI processing and linking method described in Section 2.2.2., we extracted 12 valid POIs that were used for road line linking (Figure 8b). For example, although we collected 12 POIs for Area-I, only 4 valid POIs were used for road information extraction in Area-I (i.e., the black box in Figure 8b). The linkages between POIs are complex, for example, P1 can be linked to the five nearest POIs, and some of these linkages are incorrect (e.g., the P1–P6 and P1–P7 lines). These incorrect linkages were excluded using the method described in Figure 5, and the remaining valid POI linkages were then used for further assistance in road information extraction.

3.3. Extraction of Road Networks

Our ATP-ROAD extraction approach was implemented using MATLAB code that we developed. In the MATLAB code, SAR images, binary segmentation images, selected POIs, and the POI linkages were used as input data for the road network extraction. Table 3 shows a summary of the parameters and the thresholds used in this study. Although different roads have different widths, we presented the extracted roads as lines without width for display purposes. In terms of the line shape, the extracted lines in Area-I are complete and consistent with the real roads, without dis-linkages or mis-linkages (Figure 9). In the experiment for Area-I, we created the initial window by entering 3 points and automatically extracted 278 road points to form the road network. In the road extraction experiment, we applied the manually extracted results as a benchmark for comparison (Table 4). Our program runs on a computer that has a processor 11th Gen InteI) Core i5, RAM 16.0 GB, and Windows 10 ×64 operating system.
Table 4 shows the assessment of the ATP-ROAD-extracted results for Area-I using distance statistics including total point pairs, total incorrect points, maximum, minimum, average, and standard deviation. Among all 278 points, 29 are incorrect because the distances are greater than 6.5 m; thus, the total extraction accuracy is 89.57%. Of the four roads, all distances between point pairs for Road-3 are within 6.5 m (i.e., correct) and 25.35% of the distances for Road-4 are greater than 6.5 m (i.e., incorrect). As proved by the average distance and standard deviation, Road-3 has the best results, followed by Road-2, Road-1, and Road-4. Although such extraction results are not considered satisfactory, it is difficult to extract road information from SAR images, and we have achieved better results compared with the literature.
We further selected three subareas for analyzing the performance of the ATP-ROAD method: one intersection and two road sections (Figure 10). For subarea-A, our method well extracted the information on the road intersections; although the extraction result also has a slight defect, it is consistent with the actual road alignment. Subarea-B has a clear image of the road surface without tall buildings on either side or their resulting shadow areas, so the road surface is well extracted using the ATP-ROAD method. The optical images show that even though this road section crosses water bodies, our method successfully extracted the correct road information, and the extraction was not influenced by the water body. Subarea-C has a greater curvature of the road than the other areas; the optical image shows tall buildings forming shadows, and the SAR image shows building shadows mixed with the road. This caused difficulties for the ATP-ROAD method in identifying the roads, resulting in higher evaluation distances (cf. Table 4’s Road-4).

3.4. Further Tests in other Areas

To verify the applicability of the ATP-ROAD method, we conducted experiments on road extraction in two other areas of Shanghai (Figure 11). Area-II is located to the west of Shanghai Hongqiao Railway Station, which is mainly a factory area with complex radar reflection signals. Area-III is located to the north of Shanghai Hongqiao Railway Station, which is mainly a residential area with relatively simple radar reflection signals. Figure 11 shows that the extracted results match the road centerlines with no breaks or incorrect linkages, especially the T-shaped intersections that were well identified. Table 5 shows that for Area-II, only Road-1 has incorrect points; the total extraction accuracy is 96.88%, and the average distance between the three extracted roads and the manual results is 2.504 m. For Area-III, only 10 points are incorrect among all 136 points; the total extraction accuracy is 92.65%, and the average distance between the three extracted roads and the manual results is only 1.313 m. Compared with Area-II, Area-III has more incorrect points, but the overall average distance and standard deviation are smaller.

4. Discussion

The challenge in extracting roads from SAR images is that road information is highly affected by speckle noise and thus is easily confused with surrounding objects [50]. In this study, a semi-automatic extraction method (ATP-ROAD) was proposed that assists with road recognition by applying multisource (POI) information while preserving the complete road structure. Experimental results in three different areas of Shanghai show that this ATP-ROAD method is feasible.
To compare our method with available methods, we also tried to process our data using Hough transform, Bayesian filter, and optical image-oriented approaches. Hough transform is a commonly applied line detection method that does not require connectivity of co-linear points [51], and it can retrieve the road information from the extracted boundary (line) information. We performed road extraction for the data in Area-I using the procedure accompanying the Hough transform method [52], but no valid road network information was generated. This was because in Area-I, water bodies and building shadows were associated spatially, and both were shown as black areas in SAR images, whose grayscales were very close to those of the roads. This makes a large number of incorrect boundaries around the roads extracted by the Hough transform method after edge extraction. Methods based on data statistics and Bayesian estimation are an important class of road extraction methods [53]. For further comparison, we also used a fully automated Bayesian filtering method [54] to extract the road network in Area-I. Since there are numerous buildings in the area, a large amount of building boundary information appears after edge detection. This information interferes with the acquisition of the road’s boundaries, making the method unable to acquire a better initial point in our study area. We also applied an optical image-oriented approach to retrieve road information, mainly considering the color and morphology of the images [55]. However, the roads in SAR images are not as clear as in optical images due to speckle noise. The advantage of color in this method cannot be fully exploited, and therefore, information about the roads cannot be acquired. Using the data for Area-I, all three methods mentioned above fail to give results that can be displayed, so a direct comparison with the ATP-ROAD results is not possible; this offers evidence for the validation of our ATP-ROAD method.
The selection of sliding windows is the key to road extraction from SAR images. The advantage of the rectangular window in the ATP-ROAD method is that it can preserve the maximum information about the road and make the calculated statistics of the road grayscale information and reflection intensity more reasonable. However, the premise of this method is that the width of the extracted road does not vary significantly in space, and once the width of the extracted road varies too much, the effect and accuracy of road extraction will be reduced. The window we used in this paper is rectangular, but the length and width of the rectangle are not fixed, so the specific shape of the rectangle is not unique [56]; additionally, the window can be different shapes such as circular [57,58]. The choice of the window type for road extraction needs to be adapted according to the actual situation of the dataset. A rectangular window is more appropriate for roads with relatively clear edges that retain the original shape of the road; however, for traffic circles or overpasses, a circular window may be more appropriate.
Crowd-sourced geographic information and spatial big data are new types of data that assist in feature extraction and the classification of remotely sensed features. The POIs used in this study are only a small category of many geographic information categories, whose advantages are the abundance of information, the availability of locations, and the wide coverage [59], while there are also disadvantages such as location inaccuracy and redundancy that require effective preprocessing [60]. We noticed these issues and then preprocessed the POIs using operations including position movement, filtering, and linking. This study demonstrates that processed POIs can be used for road extraction and can ensure more accurate road information. Our aim is not only to apply POIs but also to attempt a new approach of applying crowdsourced geographic information data for road extraction, providing more possibilities for the extraction of information about important ground features.
SAR images carry information such as intensity, amplitude, and polarization, and the polarization information is mostly used for classification [61,62,63] or target identification [64]. If the polarization information of SAR images can be used for road extraction, it will undoubtedly enrich the road extraction methods [65]. However, since road information is easily confused with water information in SAR images, it is difficult to acquire good results by classification only. The SAR dataset in this study is mono-polarized, and the grayscale information is affected by noise, which makes it difficult to derive good road information by classification methods. We therefore used binary segmentation information to improve the identification effect by combining it with grayscale mean and grayscale variance. For future high-resolution SAR data, polarization information will become more abundant, and using polarization information for road extraction is a better choice.

5. Conclusions

Urban road network information is an important part of spatial information infrastructure, and acquiring road information using various ways and updating it in time is a key concern that needs to be addressed in the era of remote-sensing big data. We proposed a sliding window-based road extraction method of ATP-ROAD that extracts road network information from SAR images by combining the angular texture features of SAR images and voluntary geographic information POIs. We used the grayscale mean, grayscale variance, and binary segmentation information of SAR images as texture features in its sliding window. Because ATP-ROAD requires only three initial points to be input, it is almost a fully automatic road extraction method. Compared with existing studies, the developed ATP-ROAD method fully combines information from SAR images and POIs to effectively identify roads while ensuring the structural integrity of the road network.
The ATP-ROAD method was applied to three experimental areas in Shanghai, China, for road network extraction from China’s Gaofen-3 imagery. The experimental results show that the method extracts relatively complete road networks that match the actual road conditions, and the accuracy of the method was high in all three different areas, i.e., 89.57% for Area-I, 96.88% for Area-II, and 92.65% for Area-III. The ATP-ROAD method together with the MATLAB code can be applied to extract information about road networks from SAR images, providing an alternative to enriching the variety of road information. In future work, we should use the proposed method for the road extraction of a large area to test the computational capability and robustness of our method.

Author Contributions

Methodology, N.S. and Y.F.; software and validation, N.S.; formal analysis and investigation, N.S. and Y.F.; writing—original draft preparation, N.S.; writing editing, N.S. and Y.F.; review, Y.F., X.T., Z.L., S.C., C.W., X.X. and Y.J.; supervision, project administration, funding acquisition, Y.F. and X.T. All authors have read and agreed to the published version of the manuscript.

Funding

This research was funded by the National Natural Science Foundation of China, grant number 42071371 and the National Key R & D Program of China, grant number 2021YFB3900105-2.

Data Availability Statement

Data are available at the request of readers.

Conflicts of Interest

The authors declare no conflict of interest.

References

  1. Liu, J.; Wu, H.; Guo, C.; Zhang, H.; Zuo, W.; Yang, C. Progress and Consideration of High Precision Road Navigation Map. Eng. Sci. 2018, 20, 99–105. [Google Scholar] [CrossRef]
  2. Jo, K.; Sunwoo, M. Generation of a Precise Roadway Map for Autonomous Cars. IEEE Trans. Intell. Transp. Syst. 2014, 15, 925–937. [Google Scholar] [CrossRef]
  3. Mena, J.B. State of the Art on Automatic Road Extraction for Gis Update: A Novel Classification. Pattern Recognit. Lett. 2003, 24, 3037–3058. [Google Scholar] [CrossRef]
  4. Feng, Y.; Zhou, Y.; Chen, Y.; Li, P.; Xi, M.; Tong, X. Automatic Selection of Permanent Scatterers-Based Gcps for Refinement and Reflattening in Insar Dem Generation. Int. J. Digit. Earth 2022, 1–21. [Google Scholar] [CrossRef]
  5. Feng, Y.; Lei, Z.; Tong, X.; Xi, M.; Li, P. An Improved Geometric Calibration Model for Spaceborne Sar Systems with a Case Study of Large-Scale Gaofen-3 Images. IEEE J. Sel. Top. Appl. Earth Obs. Remote Sens. 2022, 15, 6928–6942. [Google Scholar] [CrossRef]
  6. Henry, C.; Azimi, S.M.; Merkle, N. Road Segmentation in Sar Satellite Images with Deep Fully Convolutional Neural Networks. IEEE Geosci. Remote Sens. Lett. 2018, 15, 1867–1871. [Google Scholar] [CrossRef]
  7. Wessel, B. Road Network Extraction from Sar Imagery Supported by Context Information. Int. Arch. Photogramm. Remote Sens. Spat. Inf. Sci. 2004, 35, 360–366. [Google Scholar]
  8. Cai, L.; Xu, J.; Liu, J.; Ma, T.; Pei, T.; Zhou, C. Sensing Multiple Semantics of Urban Space from Crowdsourcing Positioning Data. Cities 2019, 93, 31–42. [Google Scholar] [CrossRef]
  9. Li, G.; Hu, Y. Road Feature Extraction from High Resolution Remote Sensing Images: Review and Prospects. Remote Sens. Inf. 2008, 1, 91–95. [Google Scholar]
  10. Lian, R.; Wang, W.; Mustafa, N.; Huang, L. Road Extraction Methods in High-Resolution Remote Sensing Images: A Comprehensive Review. IEEE J. Sel. Top. Appl. Earth Obs. Remote Sens. 2020, 13, 5489–5507. [Google Scholar] [CrossRef]
  11. Li, Y.; Xu, L.; Piao, H. Semi-Automatic Road Extraction from High-Resolution Remote Sensing Image: Review and Prospects. In Proceedings of the 9th International Conference on Hybrid Intelligent Systems (HIS 2009), Shenyang, China, 12–14 August 2009; pp. 204–209. [Google Scholar]
  12. Bakhtiari, H.R.R.; Abdollahi, A.; Rezaeian, H. Semi Automatic Road Extraction from Digital Images. Egypt. J. Remote Sens. Space Sci. 2017, 20, 117–123. [Google Scholar] [CrossRef]
  13. Wang, P.; Wang, L.; Feng, X.; Xiao, P. Review of Road Extraction from Remote Sensing Images. Remote Sens. Technol. Appl. 2009, 24, 284–290. [Google Scholar] [CrossRef] [Green Version]
  14. Kahraman, I.; Karas, I.; Akay, A.E. Road Extraction Techniques from Remote Sensing Images: A Review. In Proceedings of the International Conference On Geomatic & Geospatial Technology (Ggt 2018): Geospatial And Disaster Risk Management; IOP: Kuala Lumpur, Malaysia, 2018. [Google Scholar]
  15. Liu, P.; Wang, Q.; Yang, G.; Li, L.; Zhang, H. Survey of Road Extraction Methods in Remote Sensing Images Based on Deep Learning. PFG–J. Photogramm. Remote Sens. Geoinf. Sci. 2022, 90, 135–159. [Google Scholar] [CrossRef]
  16. Patil, D.; Jadhav, S. Road Extraction Techniques from Remote Sensing Images: A Review. Innov. Data Commun. Technol. Appl. 2021, 663–677. [Google Scholar]
  17. Wessel, B.; Wiedemann, C. Analysis of Automatic Road Extraction Results from Airborne Sar Imagery. Int. Arch. Photogramm. Remote Sens. Spat. Inf. Sci. 2003, 34, 105–112. [Google Scholar]
  18. Cao, Y.; Wang, Z.; Shen, L.; Xiao, X.; Yang, L. Fusion of Pixel-Based and Object-Based Features for Road Centerline Extraction from High-Resolution Satellite Imagery. Acta Geod. Cartogr. Sin. 2016, 45, 1231–1240. [Google Scholar]
  19. Abdollahi, A.; Pradhan, B. Integrated Technique of Segmentation and Classification Methods with Connected Components Analysis for Road Extraction from Orthophoto Images. Expert Syst. Appl. 2021, 176, 114908. [Google Scholar] [CrossRef]
  20. Buslaev, A.; Seferbekov, S.; Iglovikov, V.; Shvets, A. Fully Convolutional Network for Automatic Road Extraction from Satellite Imagery. In Proceedings of the IEEE Conference on Computer Vision and Pattern Recognition Workshops, Salt Lake City, UT, USA, 18–22 June 2018; pp. 207–210. [Google Scholar]
  21. Lyu, Y.; Hu, X. Road Extraction by Incremental Markov Random Field Segmentation from High Spatial Resolution Remote Sensing Images. Remote Sens. Land Resour. 2018, 30, 76–82. [Google Scholar]
  22. Song, M.; Civco, D. Road Extraction Using Svm and Image Segmentation. Photogramm. Eng. Remote Sens. 2004, 70, 1365–1371. [Google Scholar] [CrossRef]
  23. Xu, Y.; Xie, Z.; Feng, Y.; Chen, Z. Road Extraction from High-Resolution Remote Sensing Imagery Using Deep Learning. Remote Sens. 2018, 10, 1461. [Google Scholar] [CrossRef]
  24. Maurya, R.; Gupta, P.; Shukla, A.S. Road Extraction Using K-Means Clustering and Morphological Operations. In Proceedings of the 2011 International Conference on Image Information Processing, Shimla, India, 3–5 November 2011; pp. 1–6. [Google Scholar]
  25. Jeon, B.K.; Jang, J.H.; Hong, K.S. Road Detection in Spaceborne Sar Images Using a Genetic Algorithm. IEEE Trans. Geosci. Remote Sens. 2002, 40, 22–29. [Google Scholar] [CrossRef]
  26. Jia, C.; Zhao, L.; Wu, Q.; Kuang, G. Automatic Road Extraction from Sar Imagery Based on Genetic Algorithm. J. Image Graph. 2008, 13, 1134–1142. [Google Scholar]
  27. Baumgartner, A.; Hinz, S. Multi-Scale Road Extraction Using Local and Global Grouping Criteria. Int. Arch. Photogramm. Remote Sens. 2000, 33, 58–65. [Google Scholar]
  28. Lin, X.; Jixian, Z.; Zhengjun, L. Semi-Automatic Extraction of Ribbon Road Form High Resolution Remotely Sensed Imagery by Improved Profile Matching Algorithm. Sci. Surv. Mapp. 2009, 34, 64–66, 126. [Google Scholar]
  29. Zhao, J.; Yang, J.; Li, P.; Deng, S.; Li, X.; Lu, J. Semi-Automatic Road Extraction from Sar Images Using an Improved Profile Matching and Ekf. Geomat. Inf. Sci. Wuhan Univ. 2017, 42, 1144–1150. [Google Scholar]
  30. Hu, X.Y.; Zhang, Z.X.; Tao, C.V. A Robust Method for Semi-Automatic Extraction of Road Centerlines Using a Piecewise Parabolic Model and Least Square Template Matching. Photogramm. Eng. Remote Sens. 2004, 70, 1393–1398. [Google Scholar] [CrossRef]
  31. Chen, G.; Sui, H.; Tu, J.; Song, Z. Semi-Automatic Road Extraction Method from High Resolution Remote Sensing Images Based on P-N Learning. Geomat. Inf. Sci. Wuhan Univ. 2017, 42, 775–781. [Google Scholar]
  32. Kim, T.J.; Park, S.R.; Kim, M.G.; Jeong, S.; Kim, K.O. Tracking Road Centerlines from High Resolution Remote Sensing Images by Least Squares Correlation Matching. Photogramm. Eng. Remote Sens. 2004, 70, 1417–1422. [Google Scholar] [CrossRef]
  33. Lin, X.; Zhang, J.; Liu, Z.; Shen, J. Semi-Automatic Extraction of Ribbon Roads from High Resolution Remotely Sensed Imagery by T-Shaped Template Matching. In Proceedings of the Geoinformatics 2008 and Joint Conference on GIS and Built Environment: Classification of Remote Sensing Images, SPIE, Guangzhou, China, 28–29 June 2008; p. 71470J. [Google Scholar]
  34. Vosselman, G.; Knecht, J.D. Road Tracing by Profile Matching and Kaiman Filtering. In Automatic Extraction of Man-Made Objects from Aerial and Space Images; Springer: Berlin, Germany, 1995; pp. 265–274. [Google Scholar]
  35. Zhang, Q.; Couloigner, I. Benefit of the Angular Texture Signature for the Separation of Parking Lots and Roads on High Resolution Multi-Spectral Imagery. Pattern Recognit. Lett. 2005, 27, 937–946. [Google Scholar] [CrossRef]
  36. Lotte, R.G.; Sant’Anna, S.J.S.; Almeida, C.M. Roads Centre-Axis Extraction in Airborne Sar Images: An Approach Based on Active Contour Model with the Use of Semi-Automatic Seeding. In Proceedings of the International Society for Photogrammetry and Remote Sensing Hannover Workshop, Hannover, Germany, 21–24 May 2013; pp. 207–212. [Google Scholar]
  37. Cheng, J.; Gao, G.; Ku, X.; Sun, J. Review of Road Network Extraction from Sar Images. J. Image Graph. 2013, 18, 11–23. [Google Scholar]
  38. Zhou, Y.; Cheng, J.; Liu, T.; Wang, Y.; Chen, M. Review of Road Extraction for High-Resolution Sar Images. Comput. Sci. 2020, 47, 124–135. [Google Scholar]
  39. Jonietz, D.; Zipf, A. Defining Fitness-for-Use for Crowdsourced Points of Interest (Poi). ISPRS Int. J. Geo-Inf. 2016, 5, 149. [Google Scholar] [CrossRef]
  40. Lu, H.C.; Chen, H.S.; Tseng, V.S. An Efficient Framework for Multirequest Route Planning in Urban Environments. IEEE Trans. Intell. Transp. Syst. 2017, 18, 869–879. [Google Scholar] [CrossRef]
  41. Yang, S.; Shen, J.; Konecny, M.; Wang, Y.; Stampach, R. Study on the Spatial Heterogeneity of the Poi Quality in Openstreetmap. In Proceedings of the 7th International Conference on Cartography and GIS, Sozopol, Bulgaria, 18–23 June 2018; pp. 286–295. [Google Scholar]
  42. Chang, S.; Wang, Z.; Mao, D.; Liu, F.; Lai, L.; Yu, H. Identifying Urban Functional Areas in China’s Changchun City from Sentinel-2 Images and Social Sensing Data. Remote Sens. 2021, 13, 4512. [Google Scholar] [CrossRef]
  43. Zheng, S.; Zheng, J. Assessing the Completeness and Positional Accuracy of Openstreetmap in China. In Thematic Cartography for the Society; Springer: Berlin, Germany, 2014; pp. 171–189. [Google Scholar]
  44. Haverkamp, D. Extracting Straight Road Structure in Urban Environments Using Ikonos Satellite Imagery. Opt. Eng. 2002, 41, 2107–2110. [Google Scholar] [CrossRef]
  45. Rui, Z.; Jixian, Z.; Haitao, L.I. Semi-Automatic Extraction of Ribbon Roads from High Resolution Remotely Sensed Imagery Based on Angular Texture Signature and Profile Match. J. Remote Sens. 2008, 12, 224–232. [Google Scholar]
  46. Lin, X.; Tian, L.; Wang, J.; Zhu, X.; Li, K. Extraction of Ribbon Roads from High-Resolution Remotely Sensed Imagery with Improved Angular Texture Signature. Sci. Surv. Mapp. 2015, 40, 55–59. [Google Scholar]
  47. Zhou, J.; Bischof, W.F.; Caelli, T. Road Tracking in Aerial Images Based on Human–Computer Interaction and Bayesian Filtering. ISPRS J. Photogramm. Remote Sens. 2006, 61, 108–124. [Google Scholar] [CrossRef]
  48. Tupin, F.; Houshmand, B.; Datcu, M. Road Detection in Dense Urban Areas Using Sar Imagery and the Usefulness of Multiple Views. IEEE Trans. Geosci. Remote Sens. 2002, 40, 2405–2414. [Google Scholar] [CrossRef]
  49. Xiao, F.; Tong, L.; Luo, S. A Method for Road Network Extraction from High-Resolution Sar Imagery Using Direction Grouping and Curve Fitting. Remote Sens. 2019, 11, 2733. [Google Scholar] [CrossRef]
  50. He, W.; Song, H.; Yao, Y.; Jia, X. A Multiscale Method for Road Network Extraction from High-Resolution Sar Images Based on Directional Decomposition and Regional Quality Evaluation. Remote Sens. 2021, 13, 1476. [Google Scholar] [CrossRef]
  51. Jia, C.L.; Ji, K.F.; Jiang, Y.M.; Kuang, G.Y. Road Extraction from High-Resolution Sar Imagery Using Hough Transform. In Proceedings of the 25th IEEE International Geoscience and Remote Sensing Symposium (IGARSS 2005), Seoul, Korea, 25–29 July 2005; pp. 336–339. [Google Scholar]
  52. Fantasy, L. (lostFantasy1996) Road Extraction from Sar Image. November 2014. Available online: https://github.com/CityU-HAN/graduation-project (accessed on 1 September 2022).
  53. Movaghati, S.; Moghaddamjoo, A.; Tavakoli, A. Road Extraction from Satellite Images Using Particle Filtering and Extended Kalman Filtering. IEEE Trans. Geosci. Remote Sens. 2010, 48, 2807–2817. [Google Scholar] [CrossRef]
  54. Pourghasemy, S. Fully Automatic Road Extraction from Sar Imagery with Bayesian Filter. March 2020. Available online: https://github.com/saeed85416009/Matlab-RoadExtraction-SAR-BayesianFilter (accessed on 1 September 2022).
  55. Achanta, S.T. Road Extraction from High Resolution Satellite Image. December 2017. Available online: https://github.com/VIRUS-ATTACK/Road-extraction-from-satellite-images (accessed on 1 September 2022).
  56. Lin, X.; Zhang, J.; Liu, Z.; Shen, J.; Duan, M. Semi-Automatic Extraction of Road Networks by Least Squares Interlaced Template Matching in Urban Areas. Int. J. Remote Sens. 2011, 32, 4943–4959. [Google Scholar] [CrossRef]
  57. Fu, G.; Zhao, H.; Li, C.; Shi, L. A Method by Improved Circular Projection Matching of Tracking Twisty Road from Remote Sensing Imagery. Acta Geod. Cartogr. Sin. 2014, 43, 724–730, 738. [Google Scholar]
  58. Fu, G.; Zhao, H.; Li, C.; Shi, L. Road Detection from Optical Remote Sensing Imagery Using Circular Projection Matching and Tracking Strategy. J. Indian Soc. Remote Sens. 2013, 41, 819–831. [Google Scholar] [CrossRef]
  59. Lou, G.; Chen, Q.; He, K.; Zhou, Y.; Shi, Z. Using Nighttime Light Data and Poi Big Data to Detect the Urban Centers of Hangzhou. Remote Sens. 2019, 11, 1821. [Google Scholar] [CrossRef] [Green Version]
  60. Zhang, Y.; Yang, B.; Luan, X. Integrating Urban Poi and Road Networks Based on Semantic Knowledge. Geomat. Inf. Sci. Wuhan Univ. 2013, 38, 1229–1233. [Google Scholar]
  61. Arai, K.; Wang, J. Polarimetric Sar Image Classification with the Maximum Curvature of the Trajectory in the Eigen Space Converted from the Polarization Signature. Adv. Space Res. 2007, 39, 149–154. [Google Scholar] [CrossRef]
  62. Xiang, H.; Liu, S.; Zhuang, Z.; Zhang, N. A Classification Algorithm Based on Cloude Decomposition Model for Fully Polarimetric Sar Image. In Proceedings of the 6th Digital Earth Summit, Beijing, China, 7–8 July 2016. [Google Scholar]
  63. Mahdianpari, M.; Mohammadimanesh, F.; McNairn, H.; Davidson, A.; Rezaee, M.; Salehi, B.; Homayouni, S. Mid-Season Crop Classification Using Dual-, Compact-, and Full-Polarization in Preparation for the Radarsat Constellation Mission (Rcm). Remote Sens. 2019, 11, 1582. [Google Scholar] [CrossRef]
  64. Perissin, D.; Ferretti, A. Urban-Target Recognition by Means of Repeated Spaceborne Sar Images. IEEE Trans. Geosci. Remote Sens. 2007, 45, 4043–4058. [Google Scholar] [CrossRef]
  65. Sun, N.; Zhang, J.; Huang, G.; Zhao, Z. A Semi-Automatic Extraction of Ribbon Roads from Sar Image. Sci. Surv. Mapp. 2014, 39, 7. [Google Scholar]
Figure 1. The workflow of the proposed ATP-ROAD method of extracting road networks using SAR images and POIs.
Remotesensing 14 04832 g001
Figure 2. The removal of duplicate POIs using a sliding window (a) and the linkage of different POIs (b).
Remotesensing 14 04832 g002
Figure 3. The definition of the initial window (a) and two cases of adjusting the positions of the initial window (b,c), where points A, B, and C are determined manually.
Remotesensing 14 04832 g003
Figure 4. Identifying the best window based on the overall metric considering grayscale mean, grayscale variance, and binary segmentation information.
Remotesensing 14 04832 g004
Figure 5. The window is rotated to search for the road direction and whether the road is a one-sided or bilateral intersection. (a) The range of search angles for sliding the window and (b) the calculation of image homogeneity to determine the direction.
Remotesensing 14 04832 g005
Figure 6. The distance between a road extracted by ATP-ROAD and a road by manual extraction.
Remotesensing 14 04832 g006
Figure 7. Area-I selected for testing the metho, and Area-II and Area-III selected for validating the method. The background color map is a GeoEye optical image provided by ArcMap, the three gray maps are China’s Gaofen-3 SAR images, and the line graph that includes four roads is labeled for analyzing the extraction results.
Remotesensing 14 04832 g007
Figure 8. The original POIs overlaid on a GeoEye image in Area-I (a) and the selected POIs for road linkages (b), where the black box indicates the Area-I under study.
Remotesensing 14 04832 g008
Figure 9. The extracted roads of Area-I overlaid the SAR image where the background map is a GeoEye multispectral image.
Remotesensing 14 04832 g009
Figure 10. Demonstration of the road extraction in Area-I, where subarea-A and subarea-B are typically correct extractions while subarea-C is an extraction that is not exactly correct.
Remotesensing 14 04832 g010
Figure 11. The extracted roads of both Area-II and Area-III with a comparison with the GeoEye multispectral images.
Remotesensing 14 04832 g011
Table 1. The Gaofen-3 SAR images (1 m resolution) for the three selected study areas.
NameLocationRange
Dimension (m)
Azimuth
Dimension (m)
Level-1
Resolution (m)
Image Width (km)Selected Image Scope (Pixels)
Area-IQingpu0.360.561101643 × 1637
Area-IIJiading0.360.56110911 × 1517
Area-III Qingpu0.360.56110875 × 1342
Table 2. The intersection POIs in three areas and their attributes.
NameIntersection NumberOriginal NumberRemained
Number
UsedIntersection Detail
Area-I4161244 tic-tac-toes
Area-II27622 triples
Area-III3141432 tic-tac-toes and 1 triple
Table 3. A summary of the parameters and the thresholds used in this study.
IDParameterValueSection
1Image segmentation threshold0.16Section 2.2.1
2Offset angle (β) for linking POIs30°Section 2.2.2
(Figure 2b)
3Crossover angle (α) for linking POIs60°Section 2.2.2
(Figure 2b)
4RadI (R) of the widened POI linkages5 mSection 2.2.2
5The coefficient (weight; δ ) of the grayscale mean1Section 2.3.2
6The coefficient (weight; γ ) of the grayscale variance1Section 2.3.2
7The coefficient (weight; ω ) of the pixel sum of the binary segmentation image1Section 2.3.2
8An angle for determining the direction of the road at a new road intersection50° to 130°Section 2.3.3
(Figure 5a)
9Threshold for the difference of the mean of grayscales of SAR images between two adjacent sliding windows0.05Section 2.3.4
10The distance threshold for comparing the extracted results and the actual results6.5 mSection 2.4
Table 4. Assessment of the ATP-ROAD-extracted results for Area-I using distance statistics.
RoadTotal Point Pairs (Line Segments)Total
Incorrect Points
Maximum Distance (m)Minimum Distance (m)Average Distance (m)Standard Deviation (m)
Road-178106.4200.0212.1741.746
Road-27916.0820.0742.0211.715
Road-35006.0300.0141.4661.357
Road-471186.3160.0452.9161.847
All roads278296.4200.0142.1421.753
Table 5. Assessment of the ATP-ROAD-extracted results for Area-II and Area-III using distance statistics.
AreaRoadTotal Point Pairs (Line Segments)Total
Incorrect Points
Maximum Distance (m)Minimum Distance (m)Average Distance (m)Standard Deviation (m)
Area-IIRoad-15536.2060.0092.1711.786
Road-21605.5770.0202.3851.684
Road-32505.8770.3433.2731.362
All roads9636.2060.0092.5041.730
Area-IIIRoad-15413.37000.9560.684
Road-23424.4410.0131.4311.078
Road-33366.4330.0442.0951.719
Road-41513.0860.0020.8880.824
All roads136106.43301.3131.187
Publisher’s Note: MDPI stays neutral with regard to jurisdictional claims in published maps and institutional affiliations.

