


Building Function Type Identification Using Mobile Signaling Data Based on a Machine Learning Method

Abstract
:1. Introduction
2. Previous Work
3. Study Area and Data Source
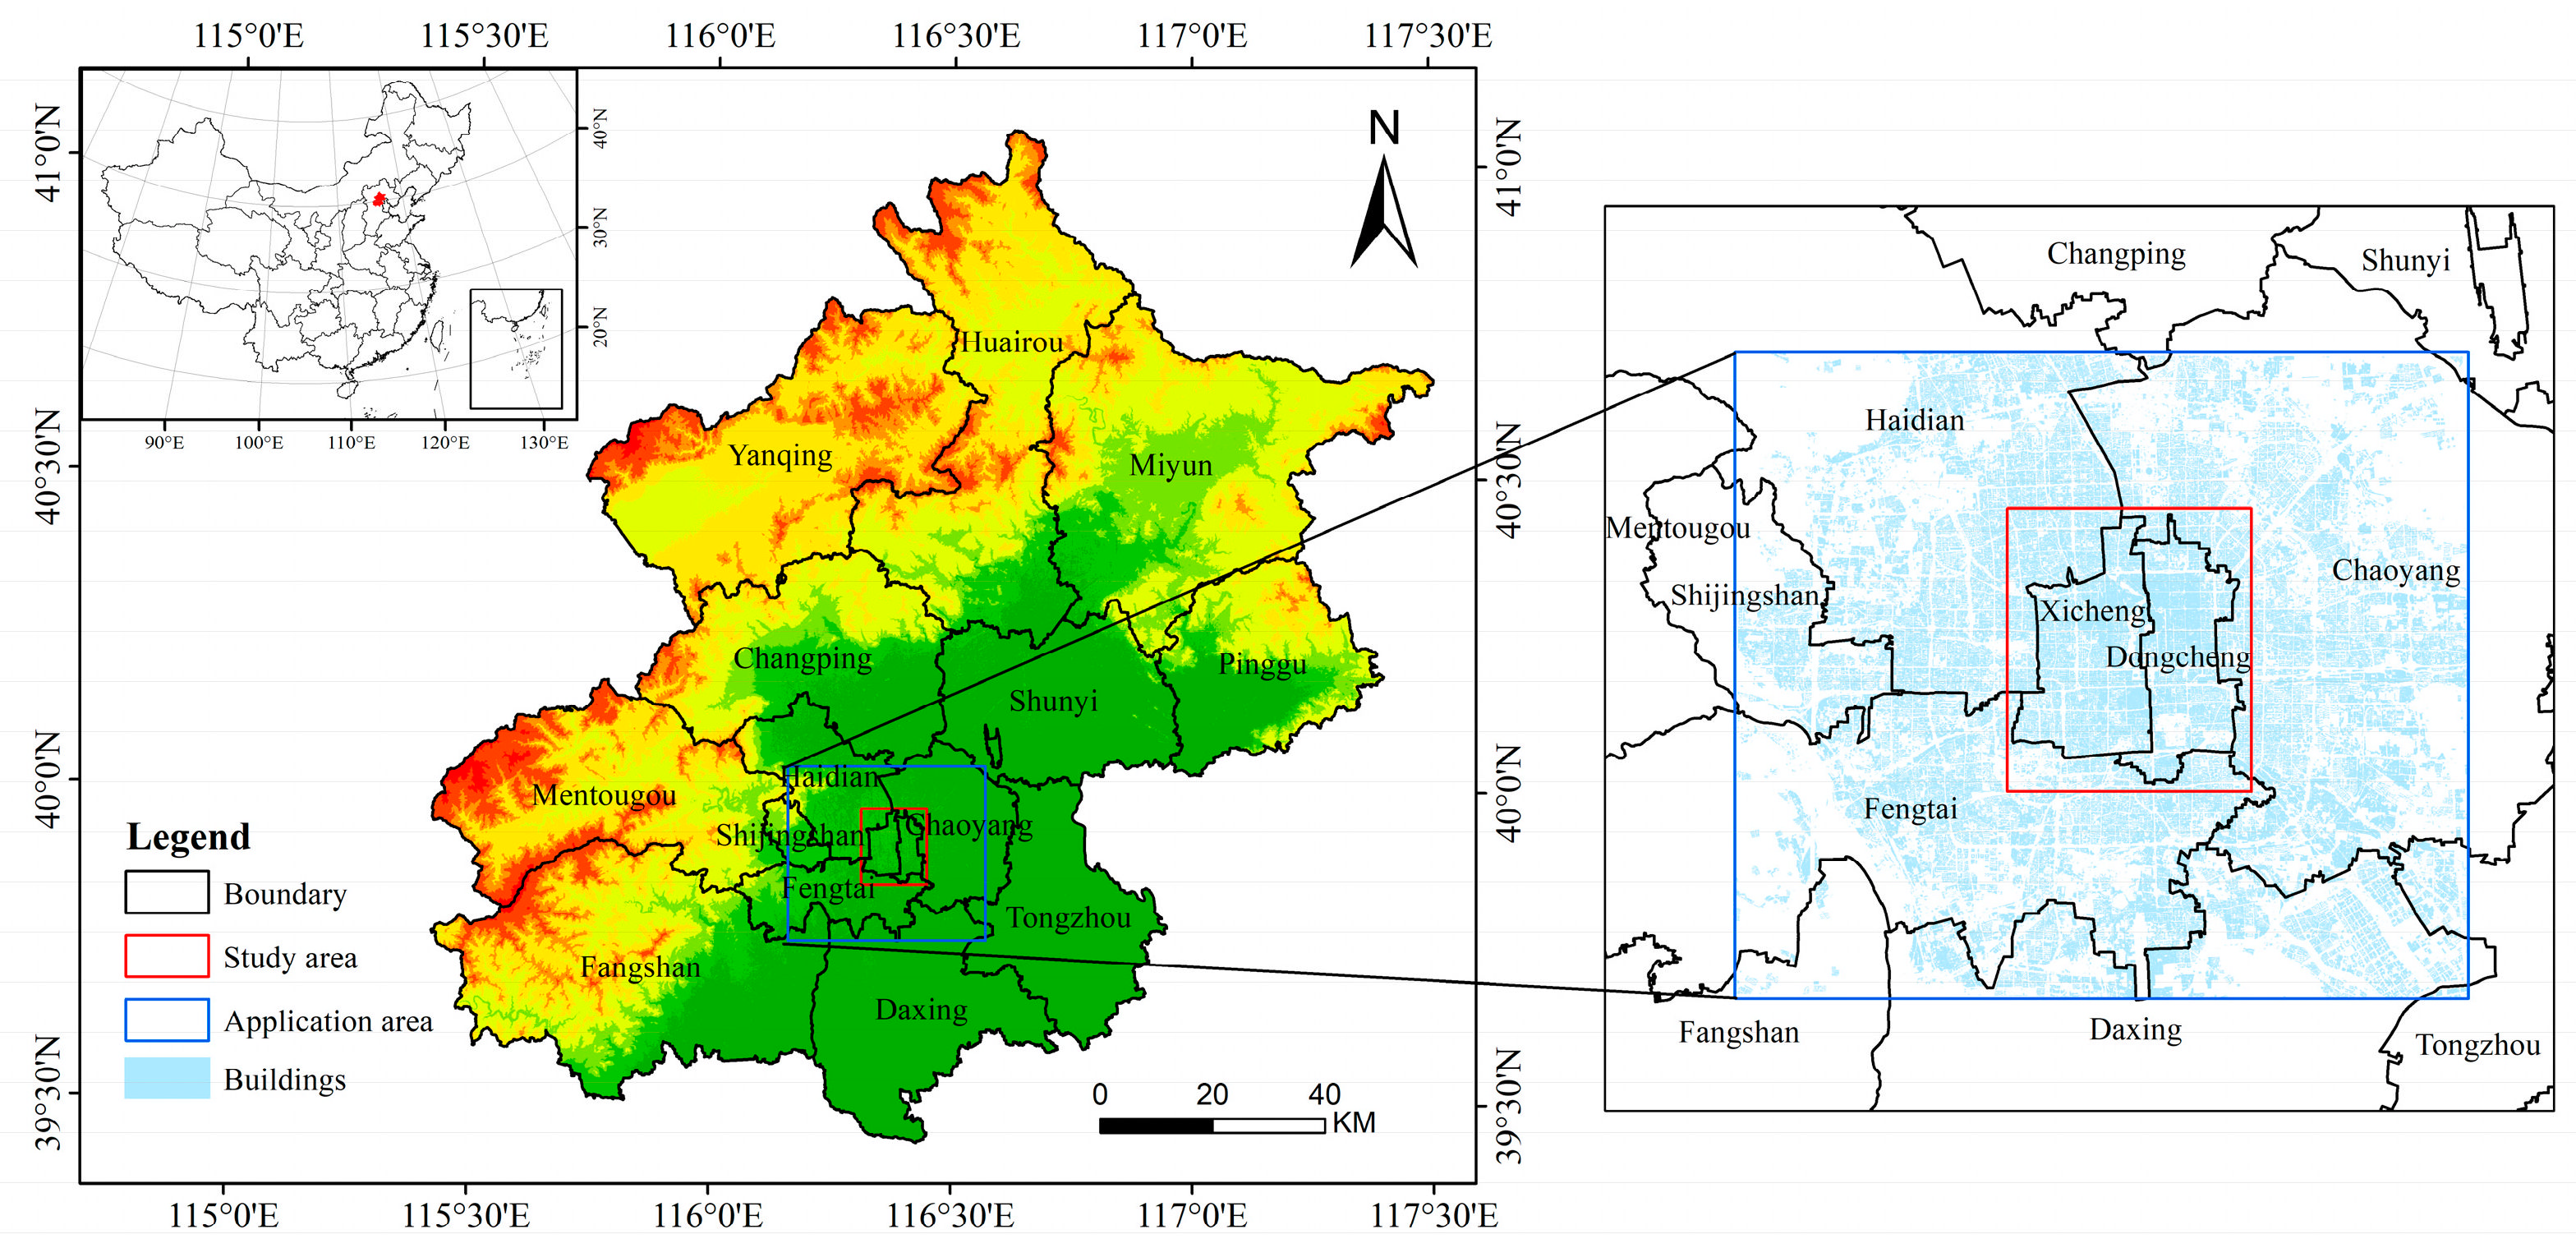
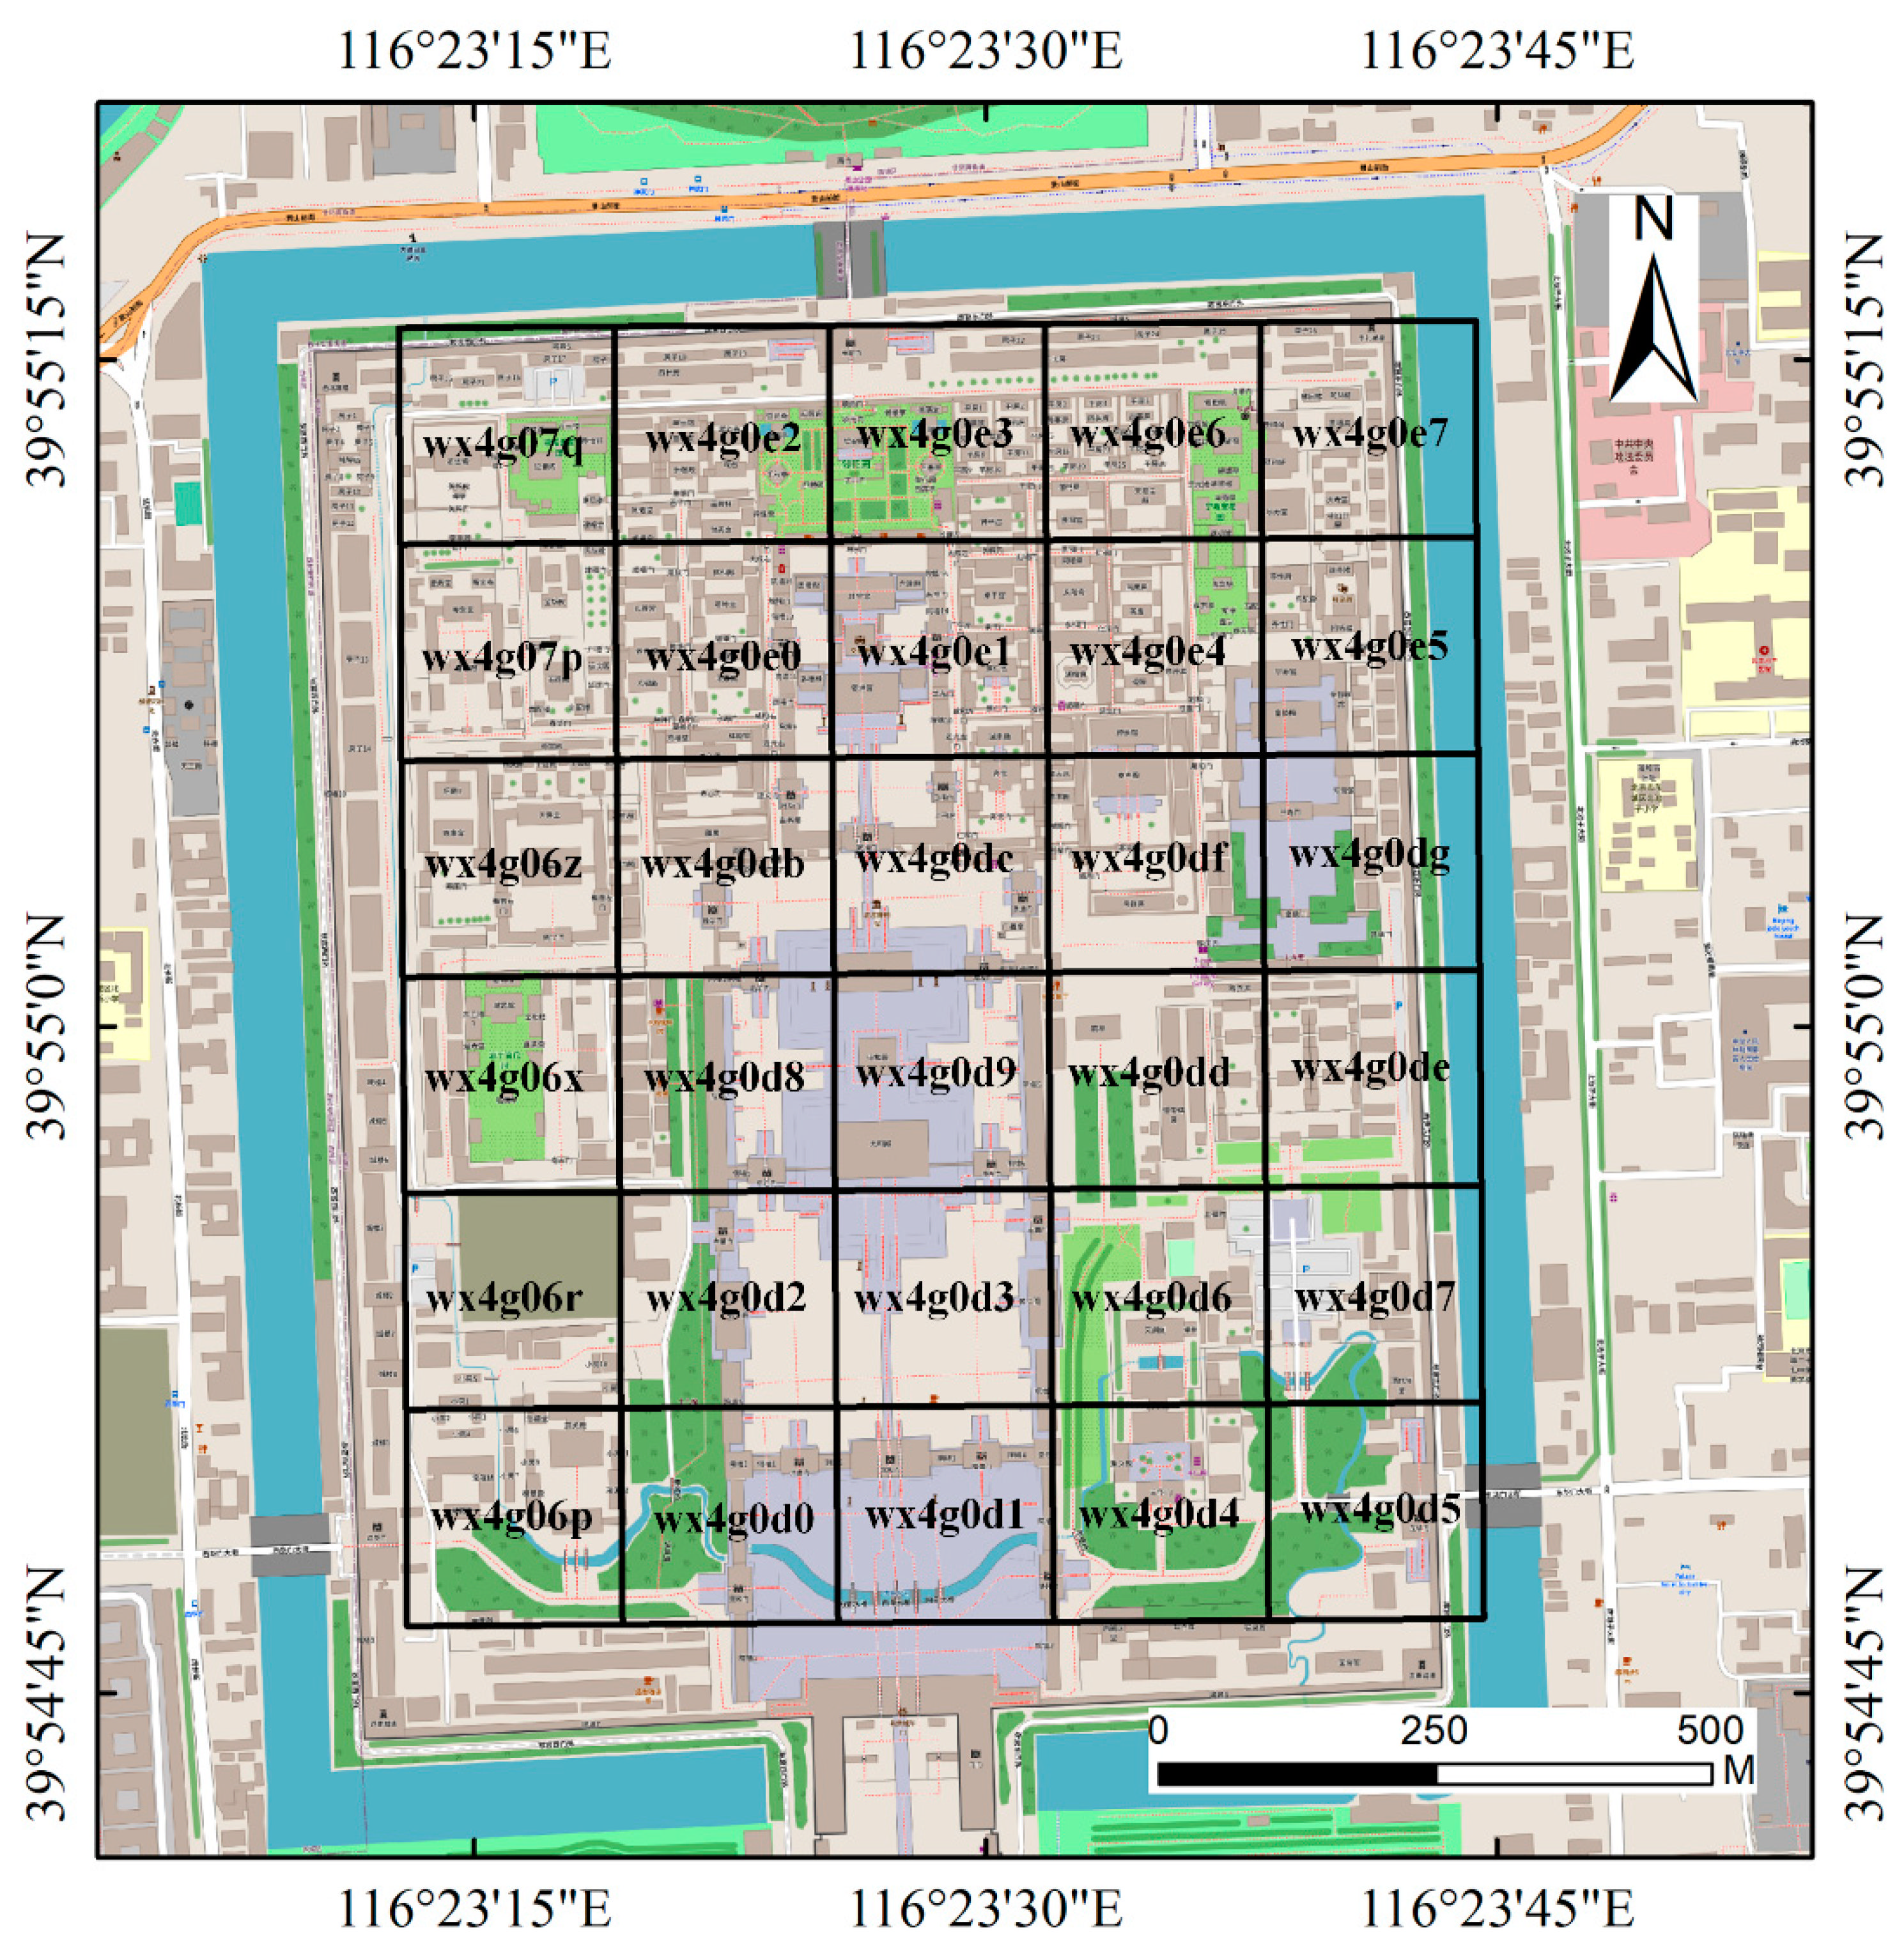
3.1. Study Area
3.2. Data Source
3.2.1. Building Function Type Data
3.2.2. Mobile Signaling Data
- (1)
- Station
- (2)
- Gid
- (3)
- Wifimac
- (4)
- Loginmac
3.2.3. Sentinel-2 Data
4. Method
4.1. Definition of Building Function Types
- (1)
- R represents buildings holding residential properties, such as houses, apartments, and student dormitories. Generally, residents wake up in the morning, move to other functional buildings based on their daily activities from approximately 7:00 to 9:00 a.m., and return to their own residences from approximately 18:00 to 19:00 p.m. There are relatively few people in residential areas during working hours. Thus, on the one hand, the population dynamics in the BFT of R-type buildings generally show an obvious diurnal variation on working days. The population dynamics on weekends, on the other hand, generally show a gentler variation with respect to those on weekdays.
- (2)
- W represents working or studying places, such as commercial/government office buildings and teaching buildings. W-type buildings are more densely populated during the daytime on weekdays and sparsely populated during the evening and on weekends.
- (3)
- E stands for buildings used for entertainment. As compared with W-type buildings, E-type buildings commonly have relatively longer and optional opening hours each day and later opening and closing times. These buildings include shopping malls, cinemas, bars, and restaurants. The corresponding time of the population peak in E-type buildings is later than that in W-type buildings. Different from W, E have more people on weekends than on weekdays.
- (4)
- V is a group of recreational buildings of a visiting or educational nature, such as tourist attractions, museums, and art galleries. Different from E-type buildings, V-type buildings generally have fixed opening hours and do not open during the night. V-type buildings have a similar character to W-type buildings during weekdays. Similar to E, V-type buildings are more densely populated on weekends than on weekdays.
- (5)
- H stands for the collection of buildings with a medical nature, such as hospitals and clinics. These buildings have some similarities with W-type buildings. The population is denser during the daytime on weekdays and sparser on weekday evenings and on weekends. However, there is a special pattern in which the maximum population occurs from 8:00 a.m. to 10:00 a.m. and drops substantially after 10:00 a.m. This is because people tend to arrive at the hospital earlier in the day.
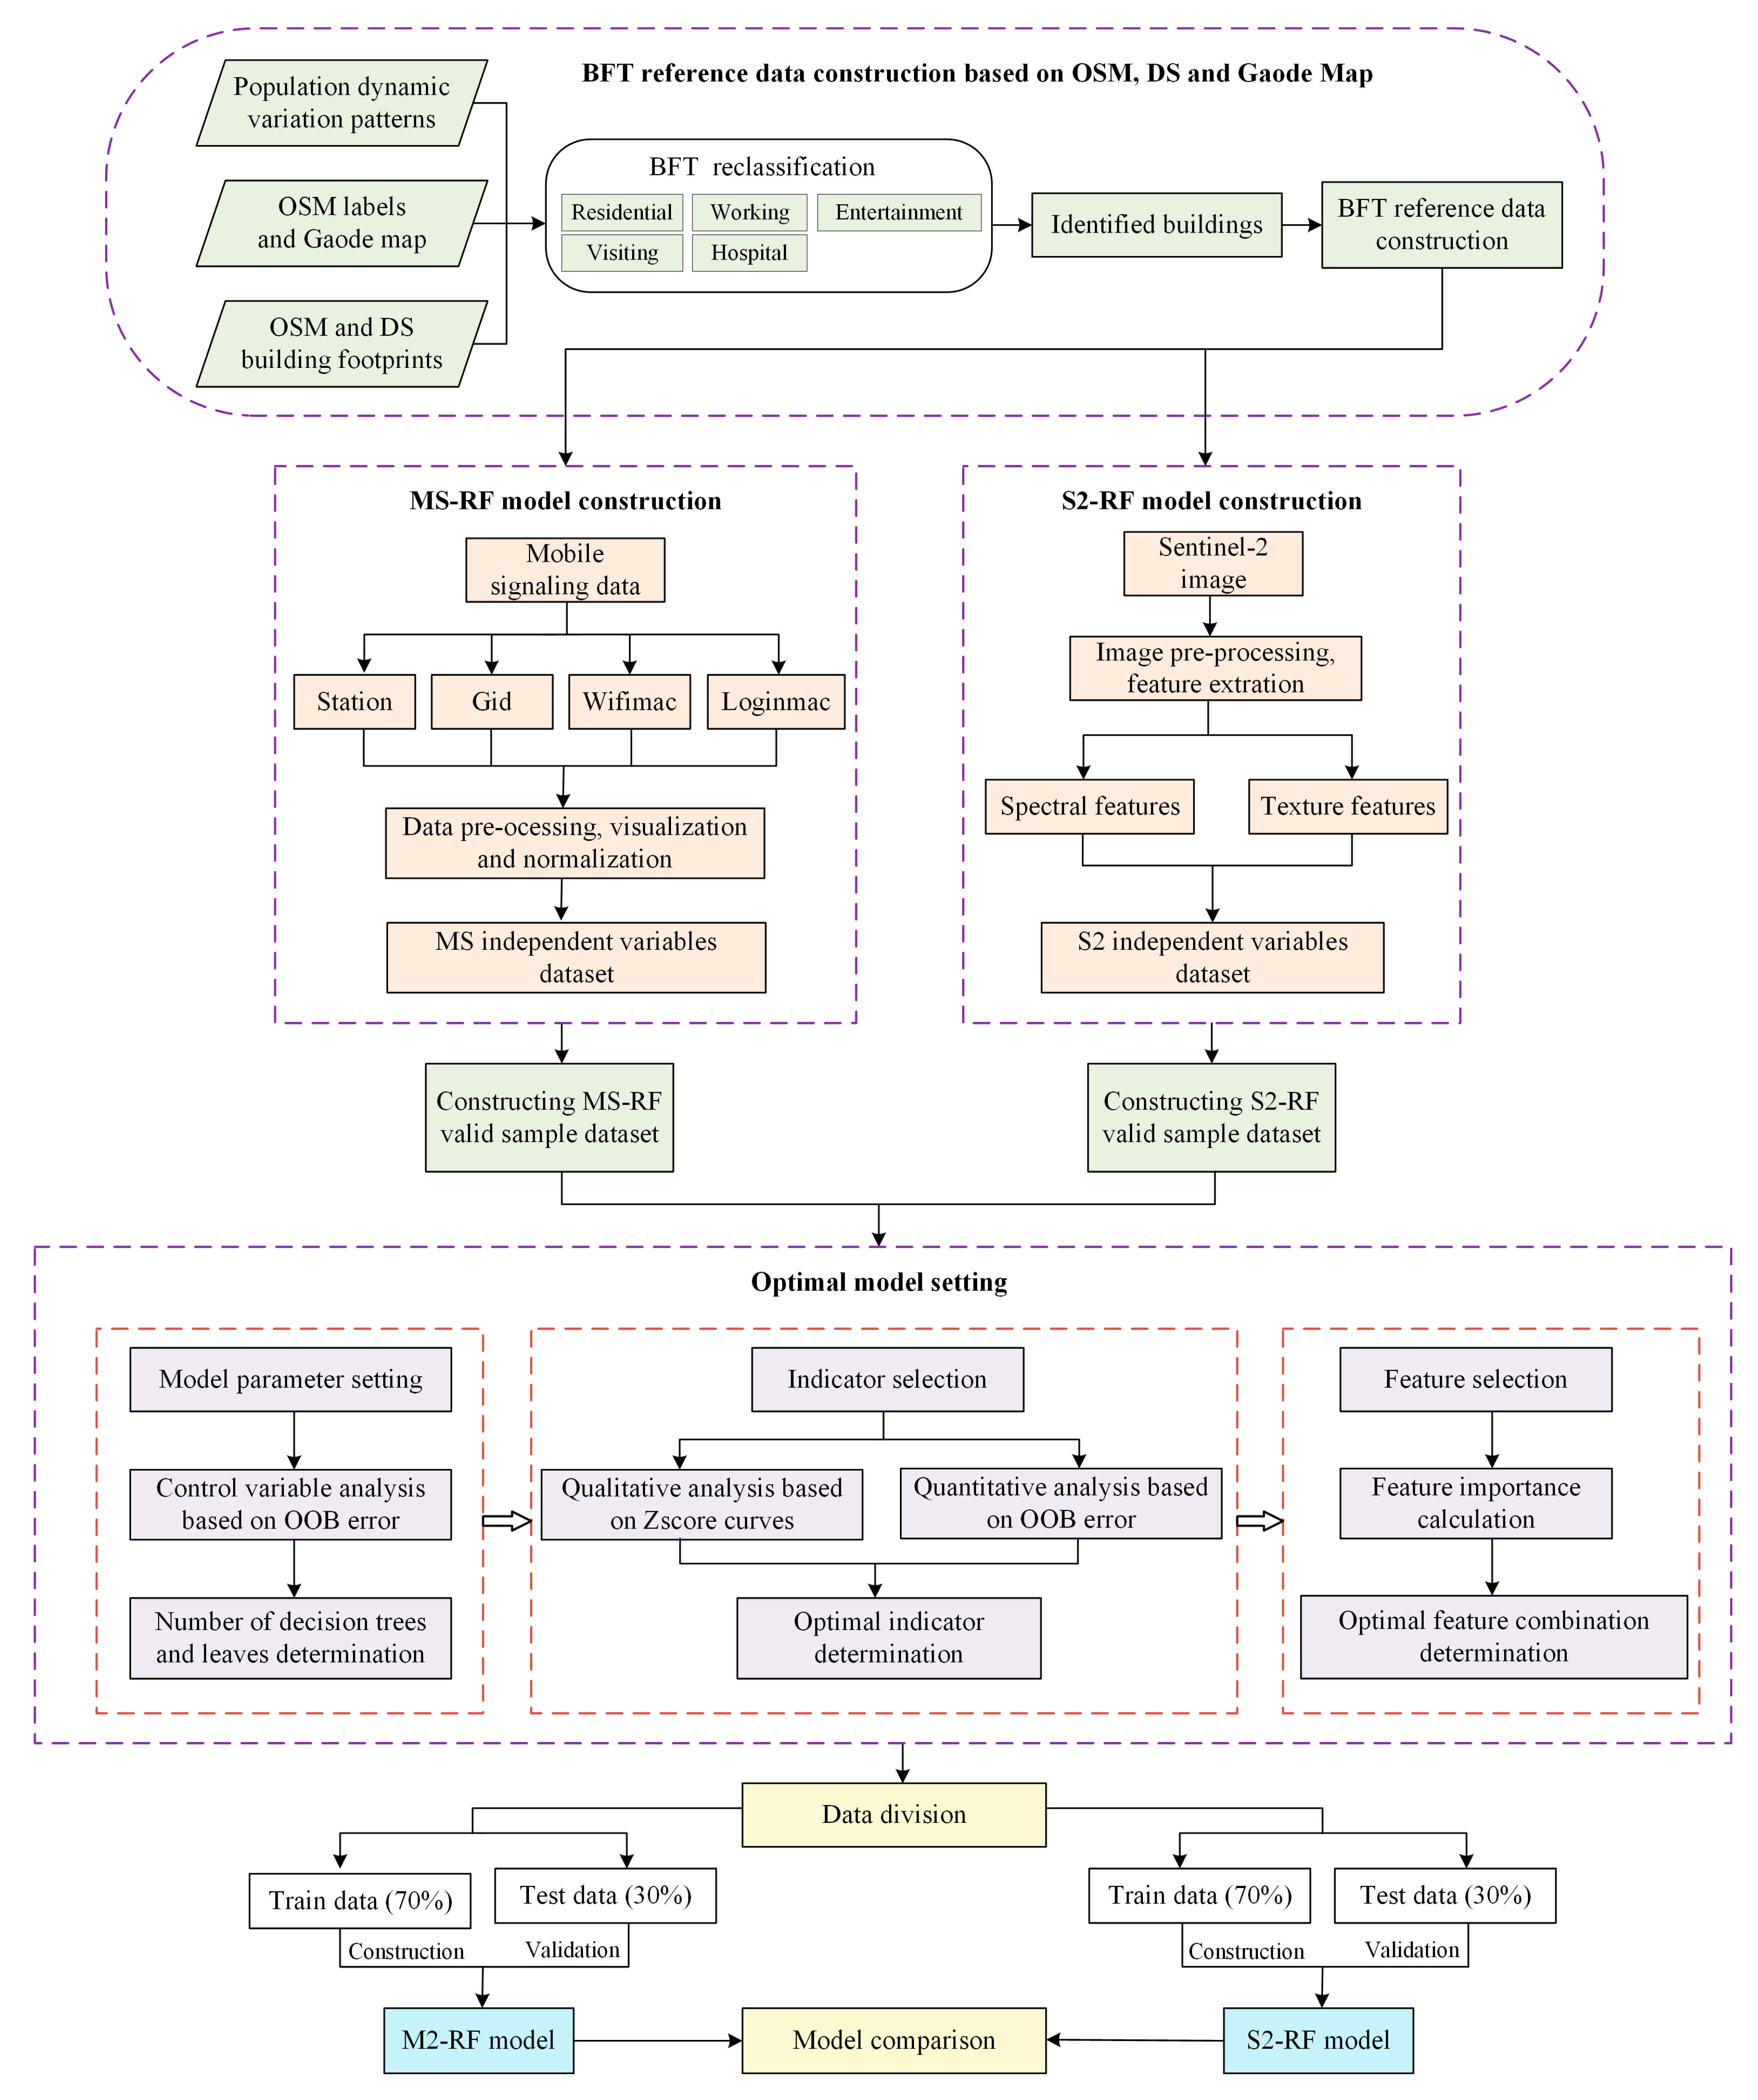
4.2. Data Processing
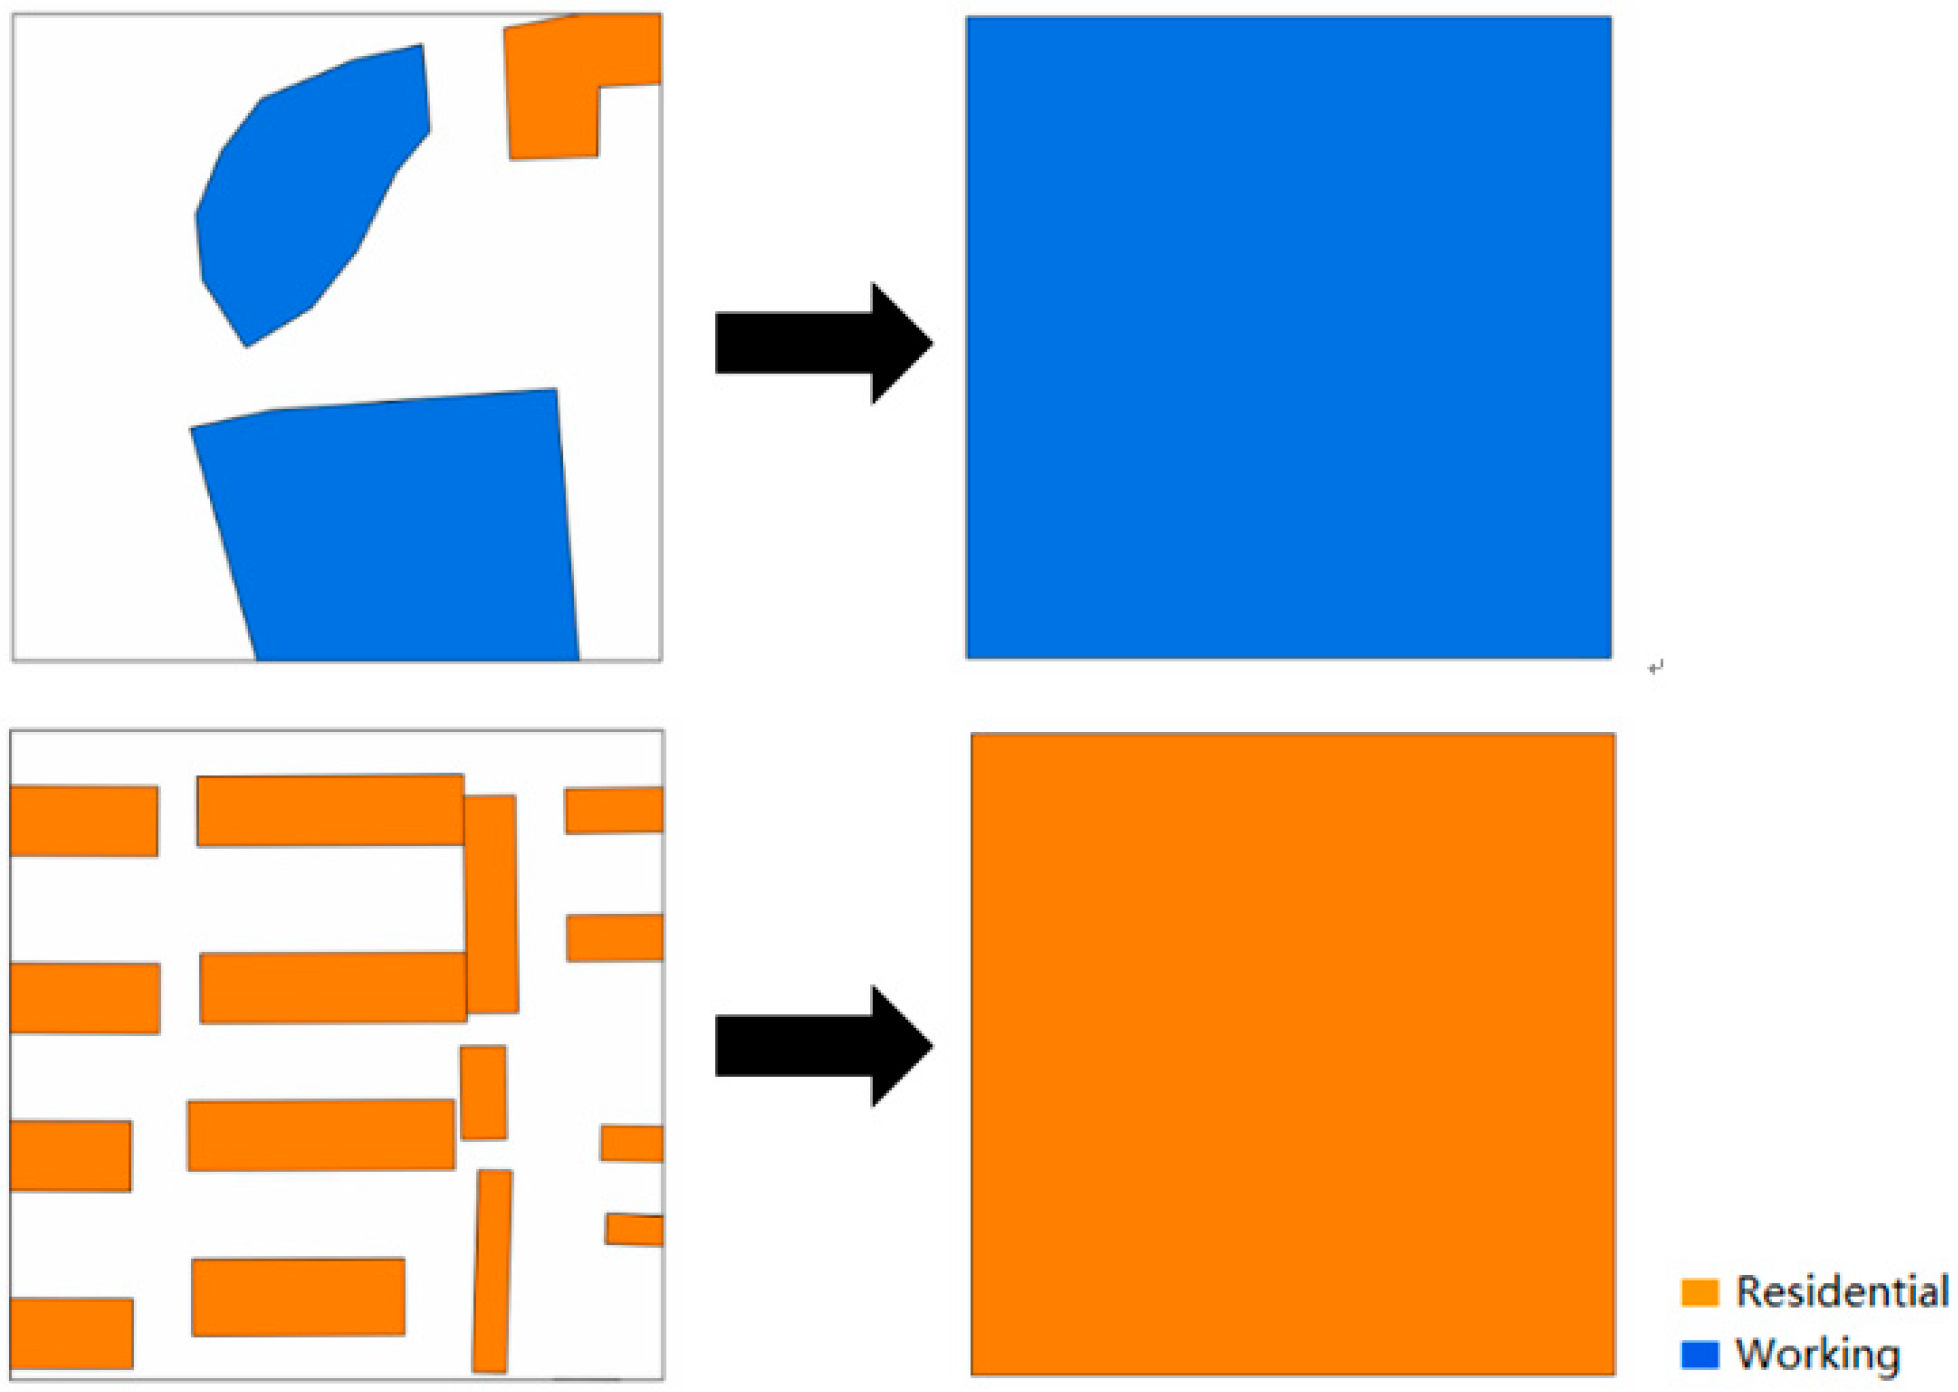
4.2.1. Reference Data Construction
4.2.2. Mobile Signaling Data
- (1)
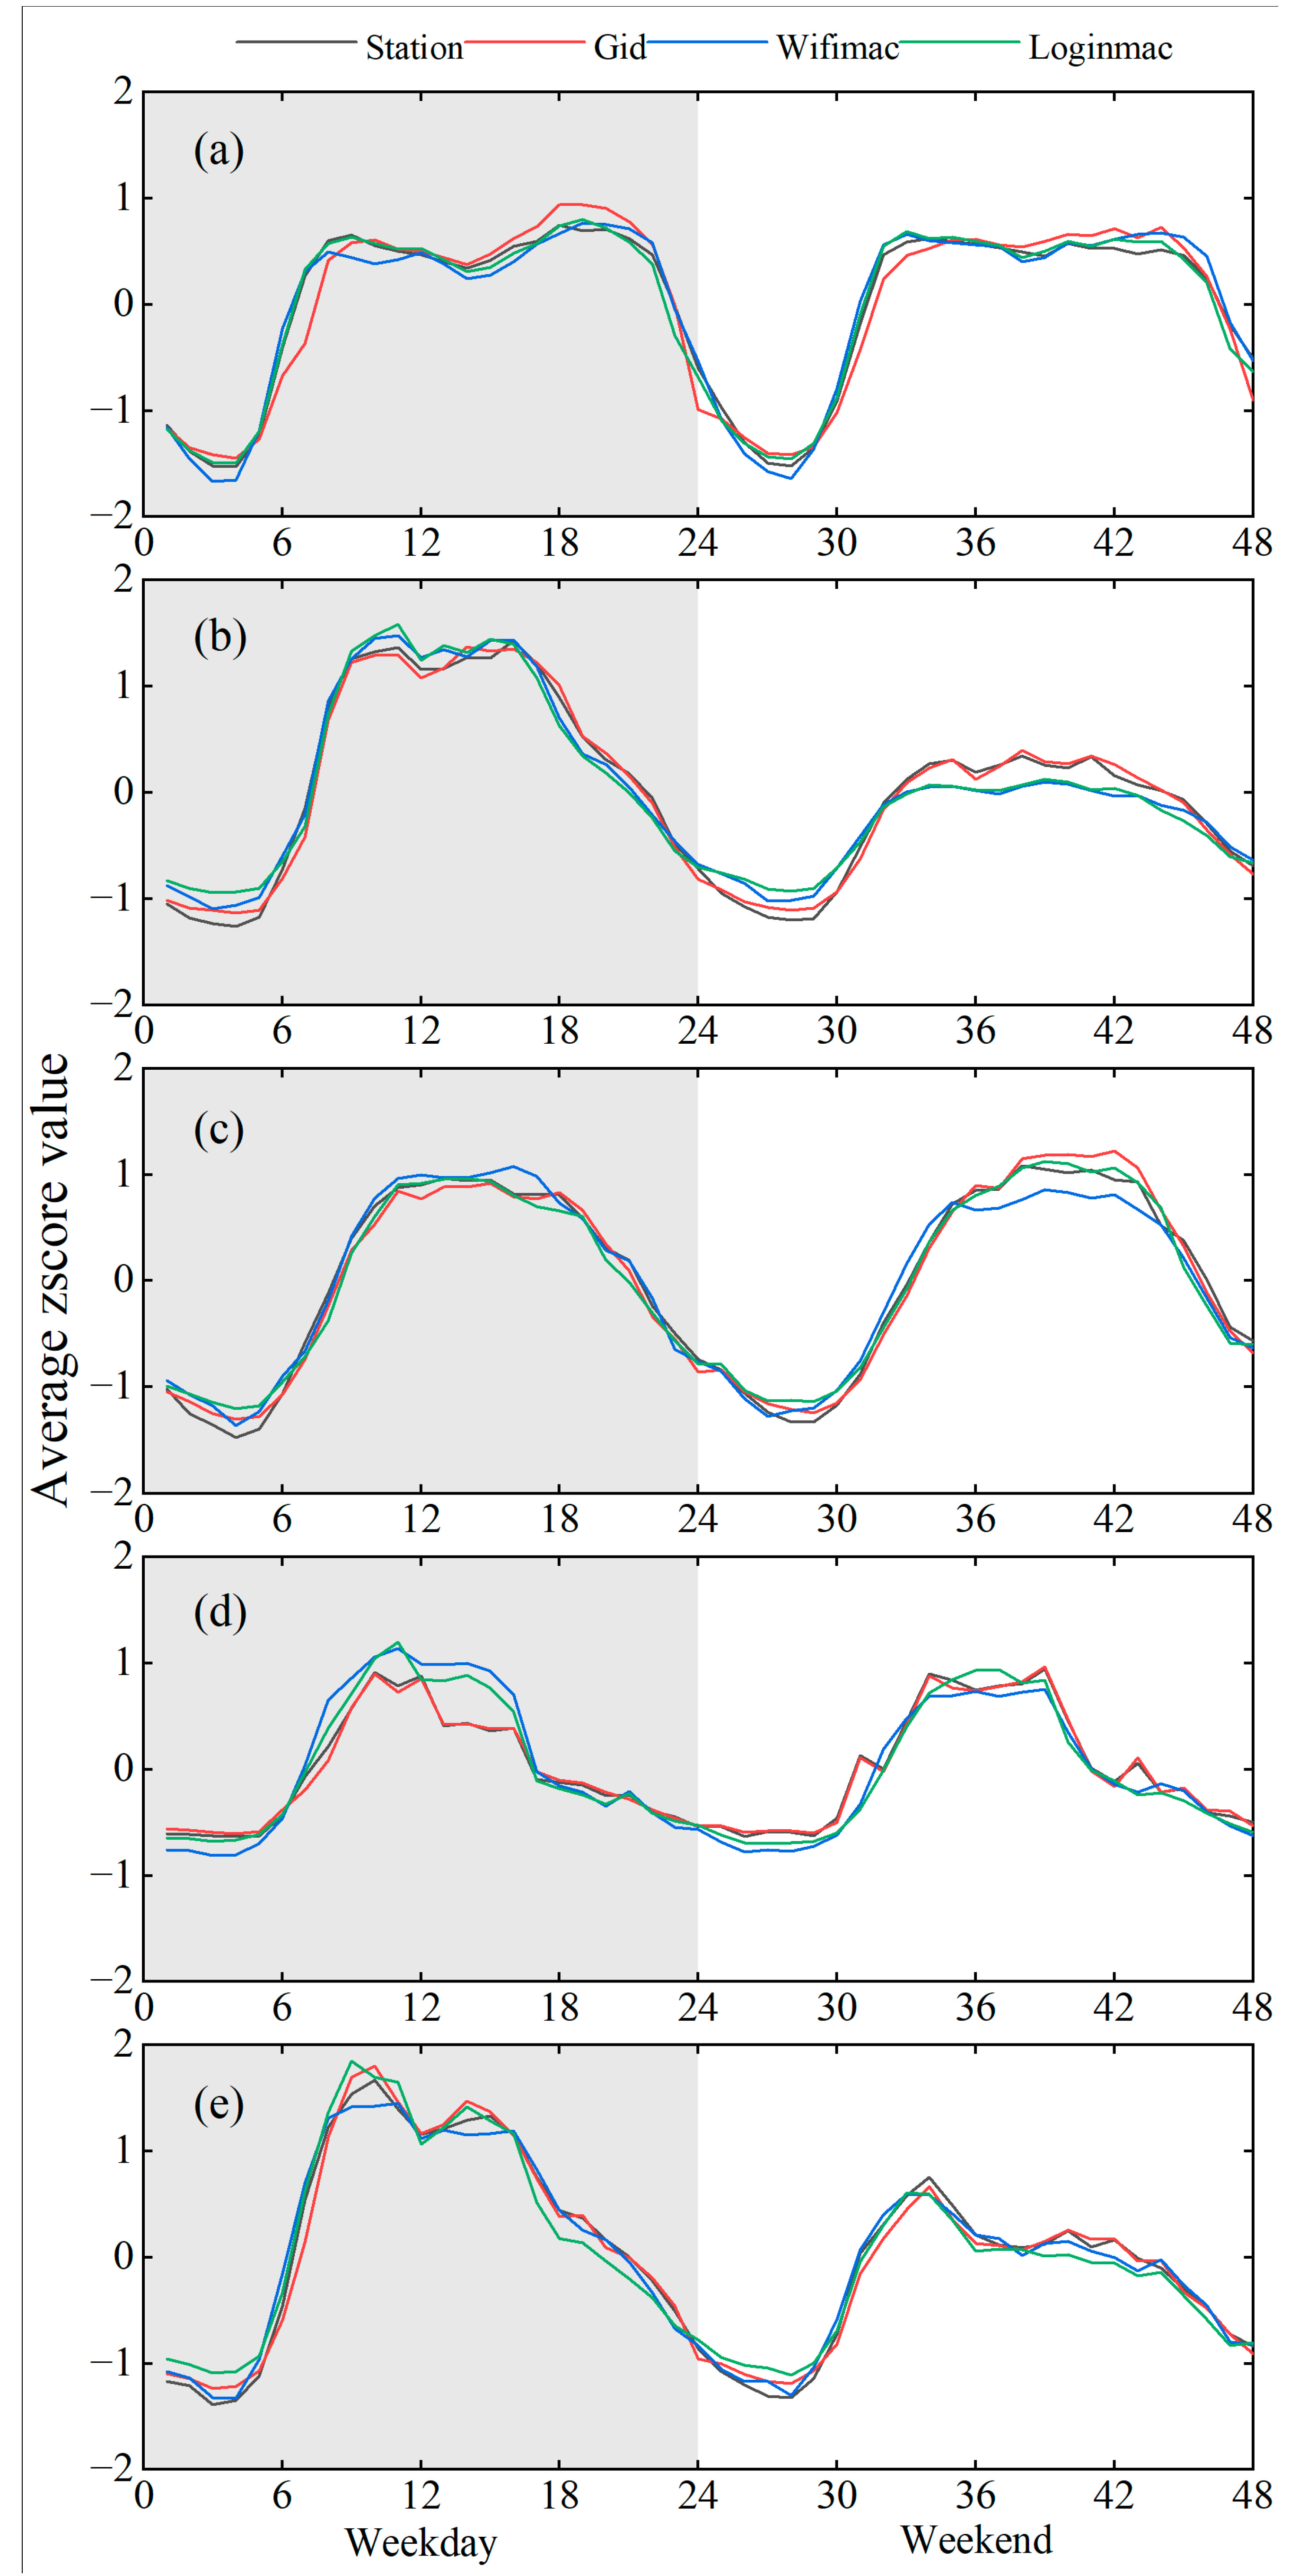
- Figure 5a shows that R-type buildings have higher MS activity in the early morning hours and late at night on weekdays, and the peaks occur between 7:00 and 9:00 a.m. and 18:00 and 21:00 p.m. On the weekend, MS activity shows a more moderate variation.
- (2)
- In Figure 5b, W-type buildings have higher MS activity between 9:00 a.m. and 17:00 p.m. on weekdays and generally have a short period at approximately 12:00 a.m. (lunch time). As compared with weekdays, MS activity within W-type buildings is significantly lower on the weekend.
- (3)
- In Figure 5c, MS activity in E-type buildings is concentrated between 10:00 a.m. and 18:00 p.m. on weekdays, while the MS data peak plateau tends to be delayed to between 12:00 p.m. and 22:00 p.m. on the weekend, and there is more MS activity on the weekend than on weekdays.
- (4)
- In Figure 5d, MS activity within V-type buildings is concentrated between 9:00 a.m. and 16:00 p.m. on both weekdays and weekends, the difference being that there is more activity on weekends.
- (5)
- Figure 5e shows that MS activity in H-type buildings is greater during weekdays and sparser on weekends and weekday evenings. In addition, there is a special peak period between 8:00 a.m. and 10:00 a.m. on both weekdays and weekends.
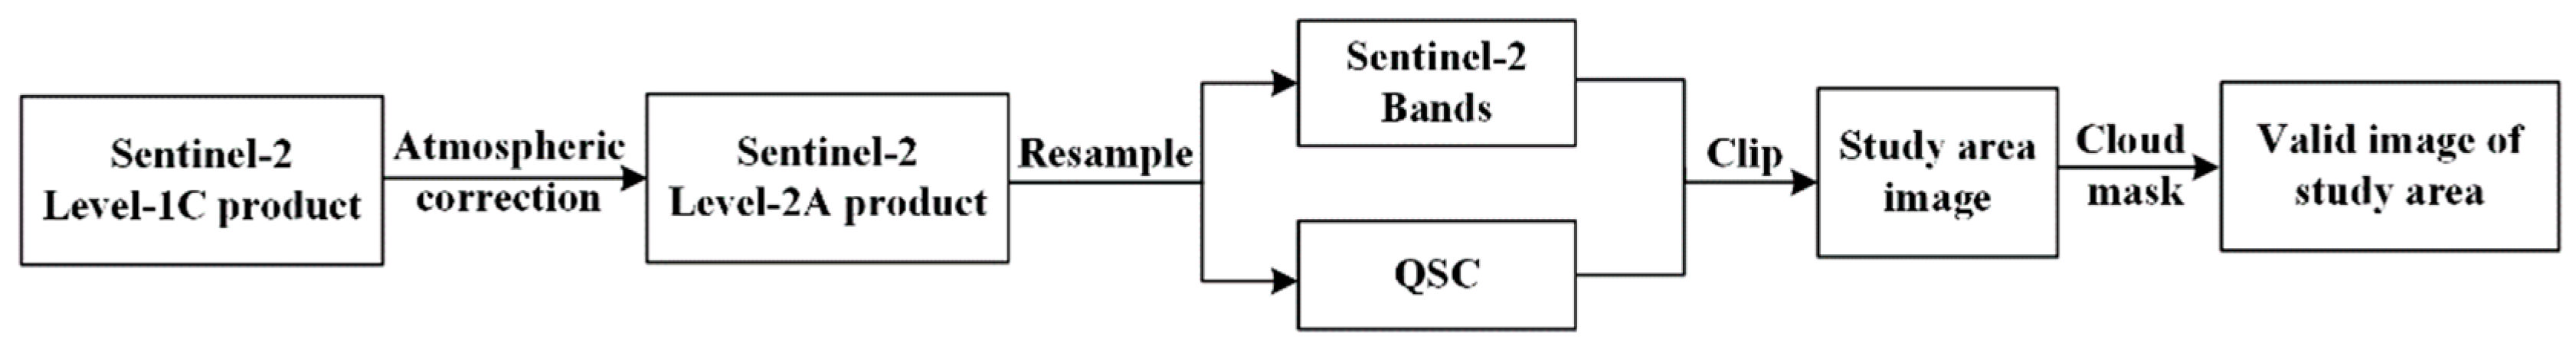
4.2.3. Sentinel-2 Data
- (1)
- Image preprocessing
- (2)
- Feature extraction
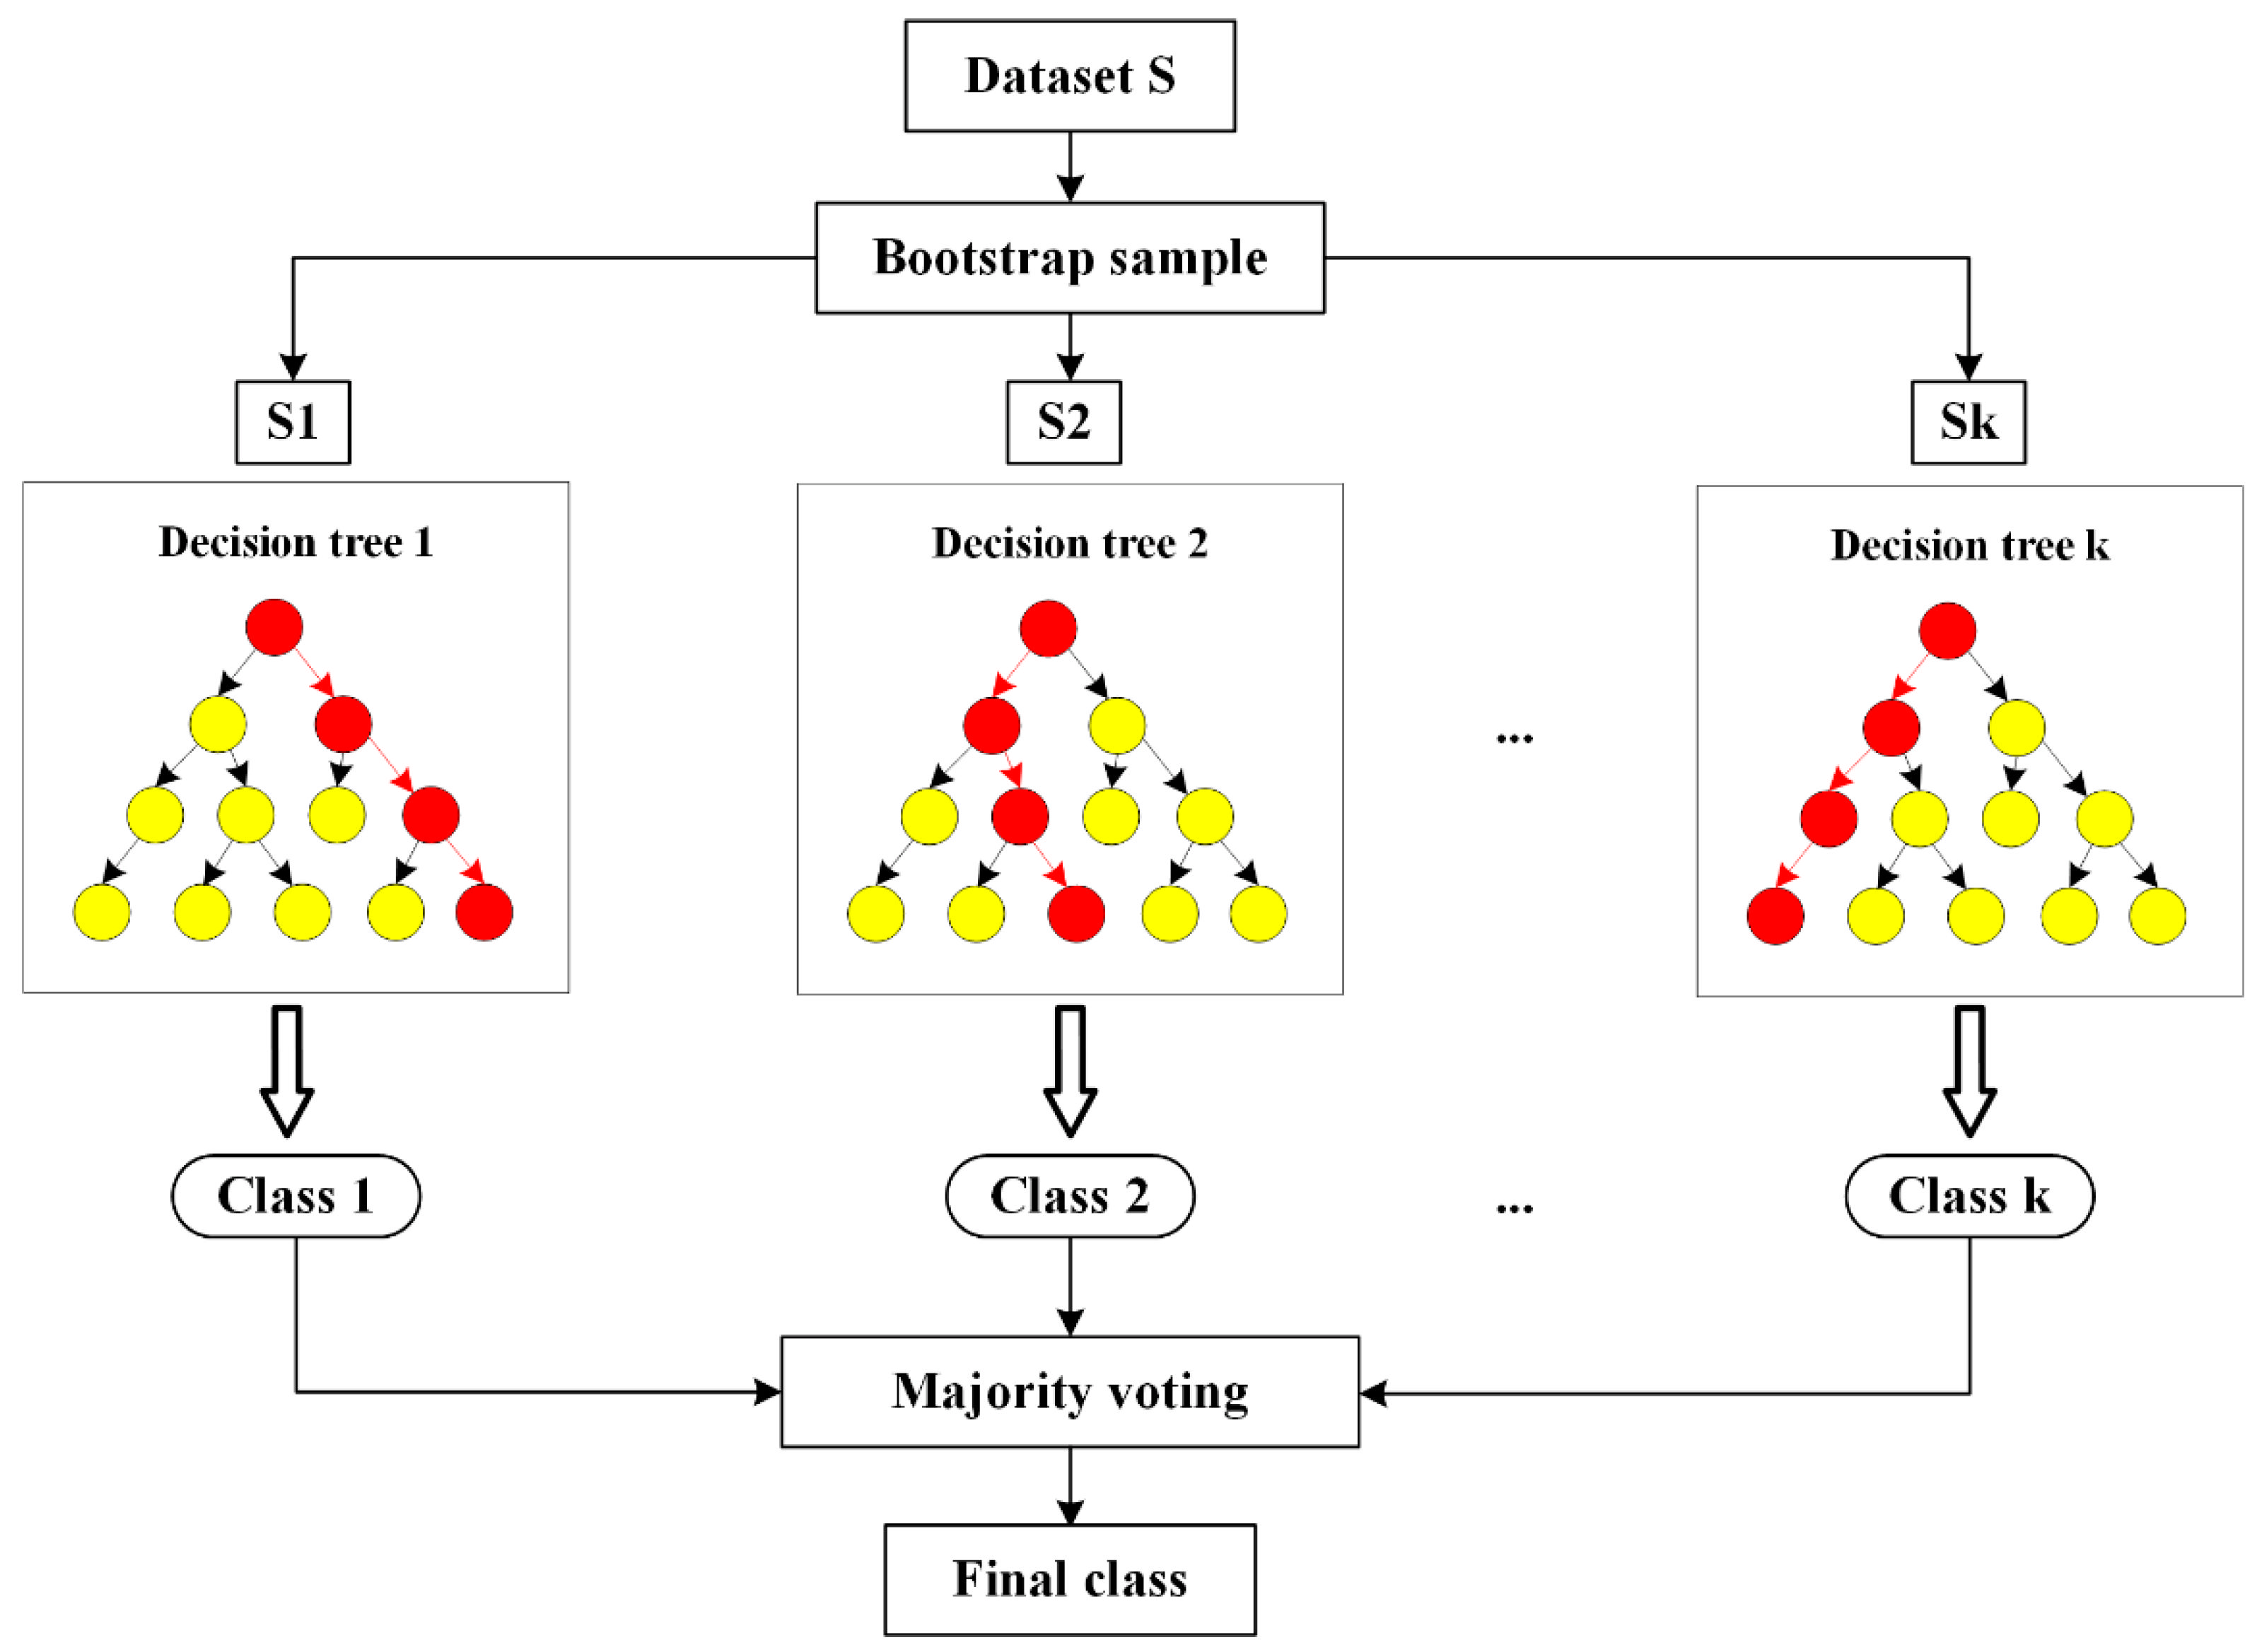
4.3. Random Forest Model
4.3.1. Parameter Setting
- (1)
- Parameter setting
- (2)
- Feature selection
4.3.2. RF Model Construction
5. Results
5.1. Classification Results of Different Model Settings
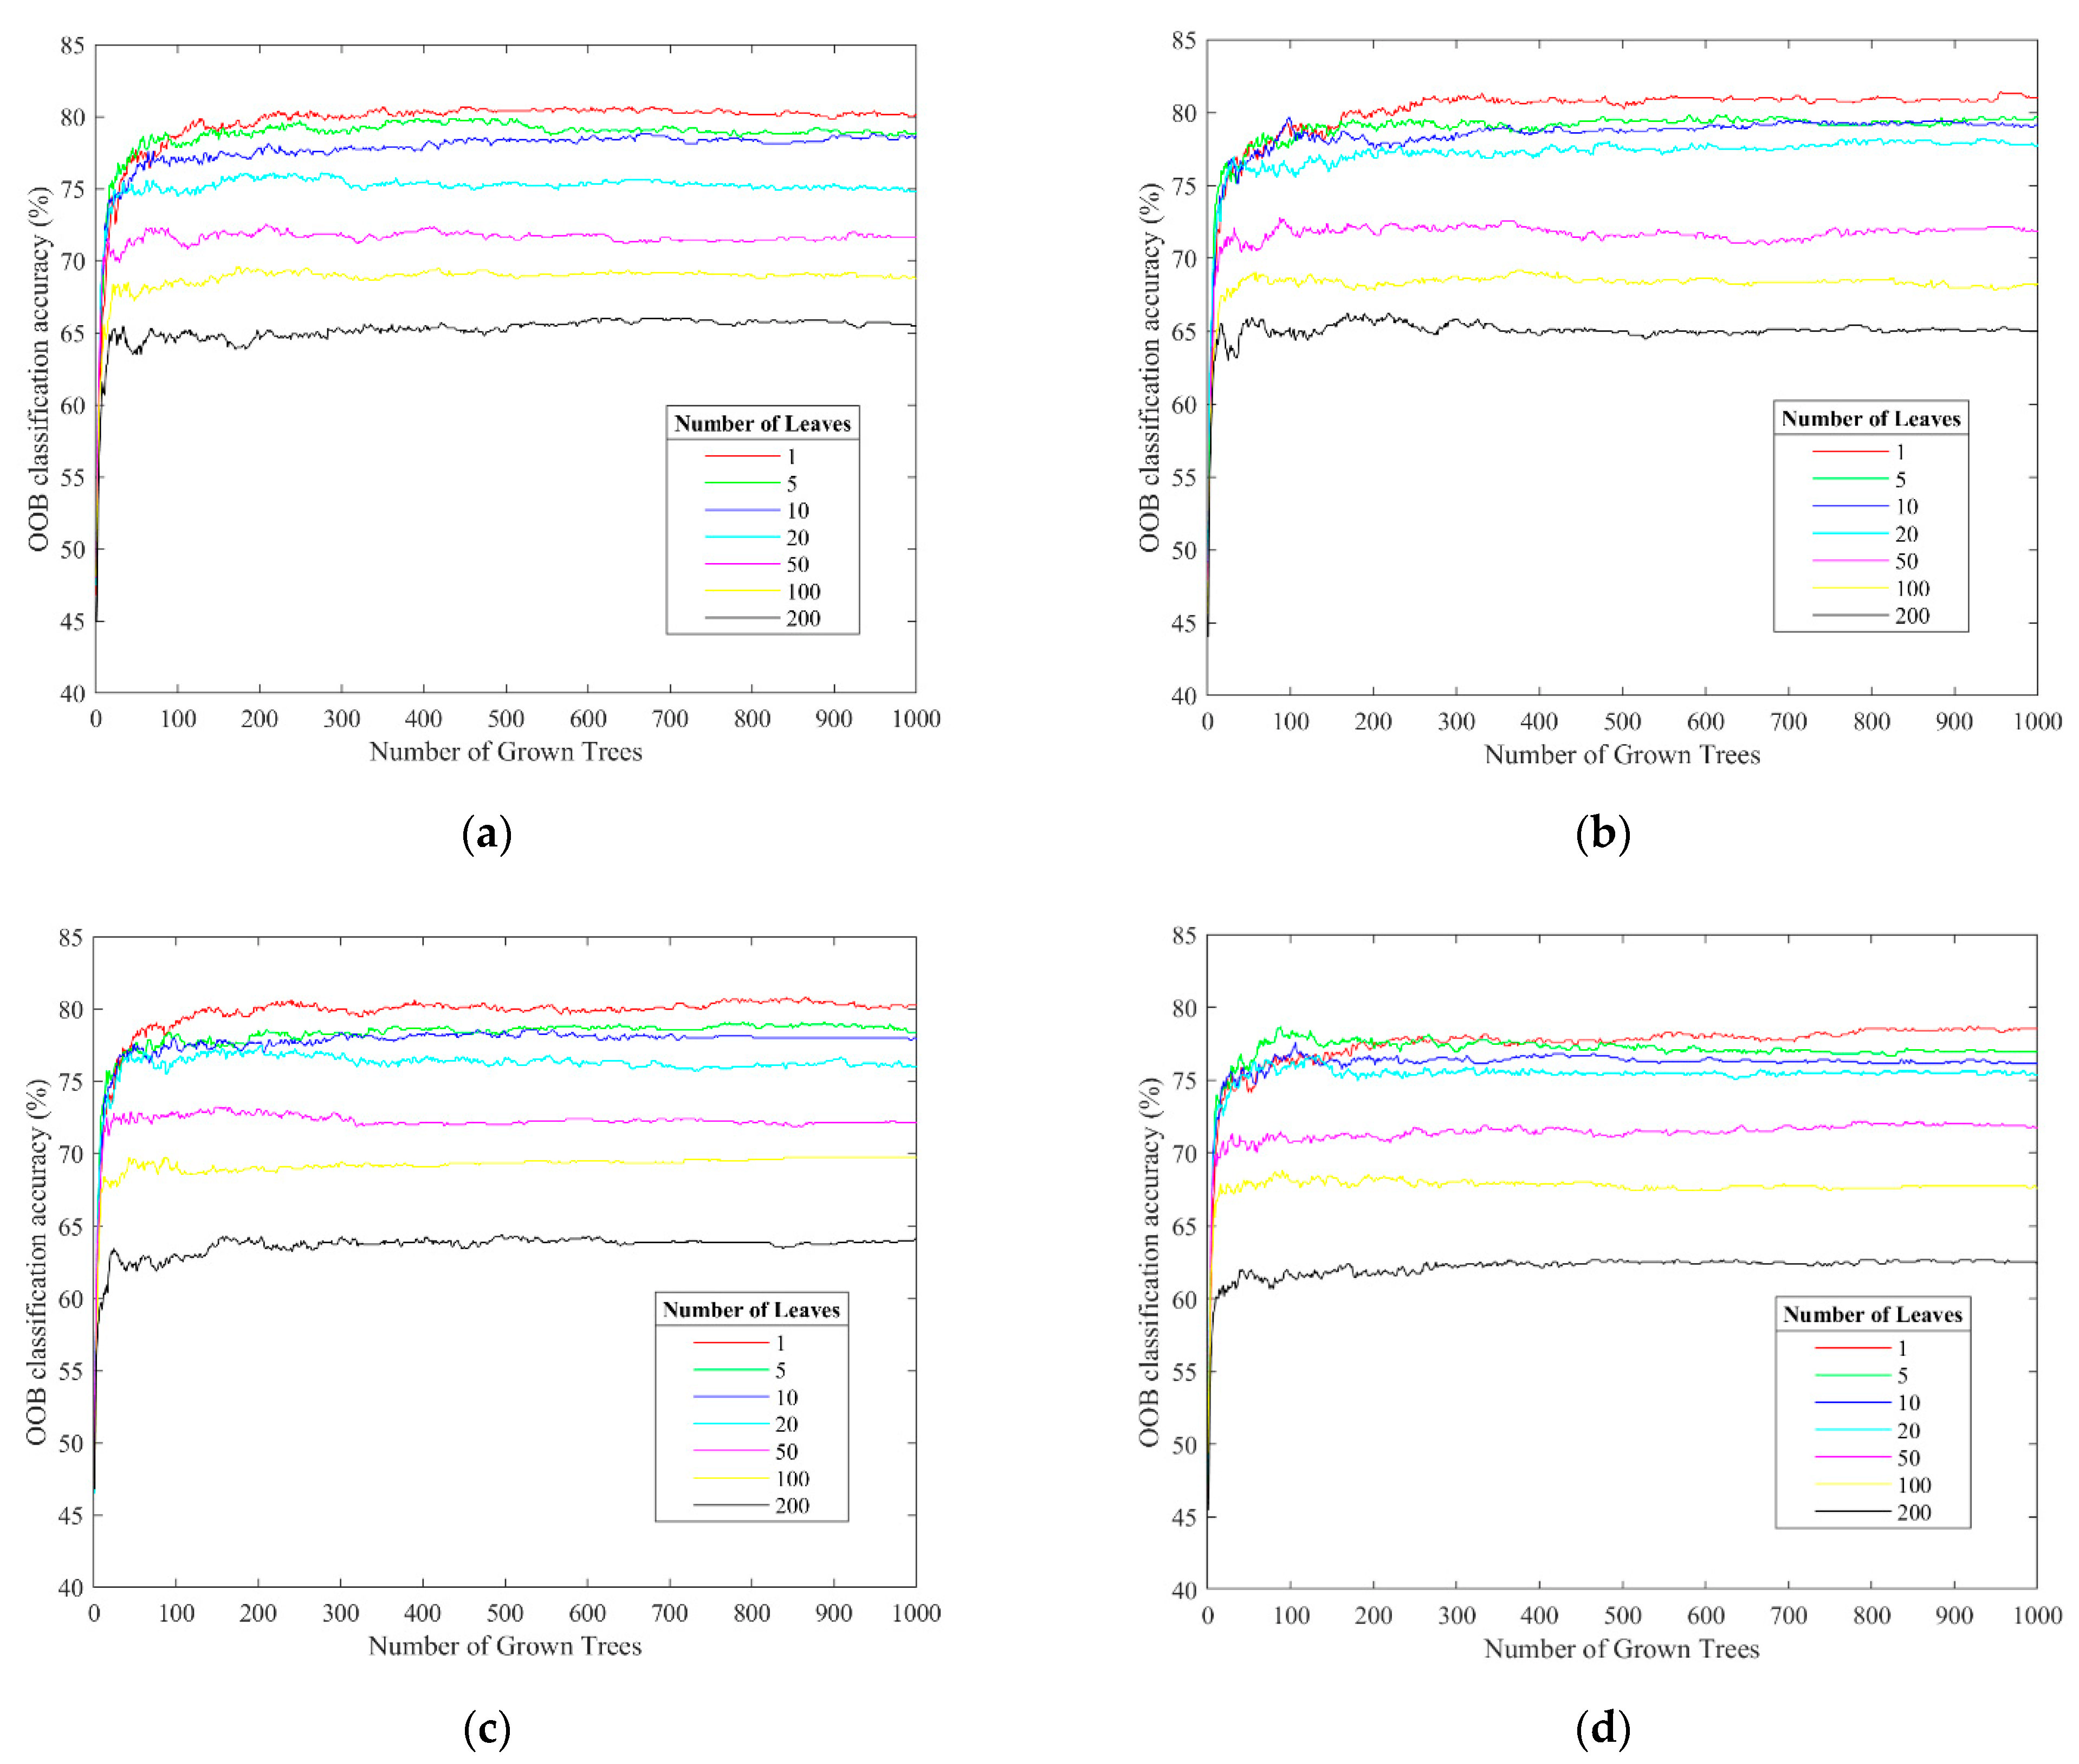
5.1.1. Classification Accuracy with Different Numbers of Trees and Leaves
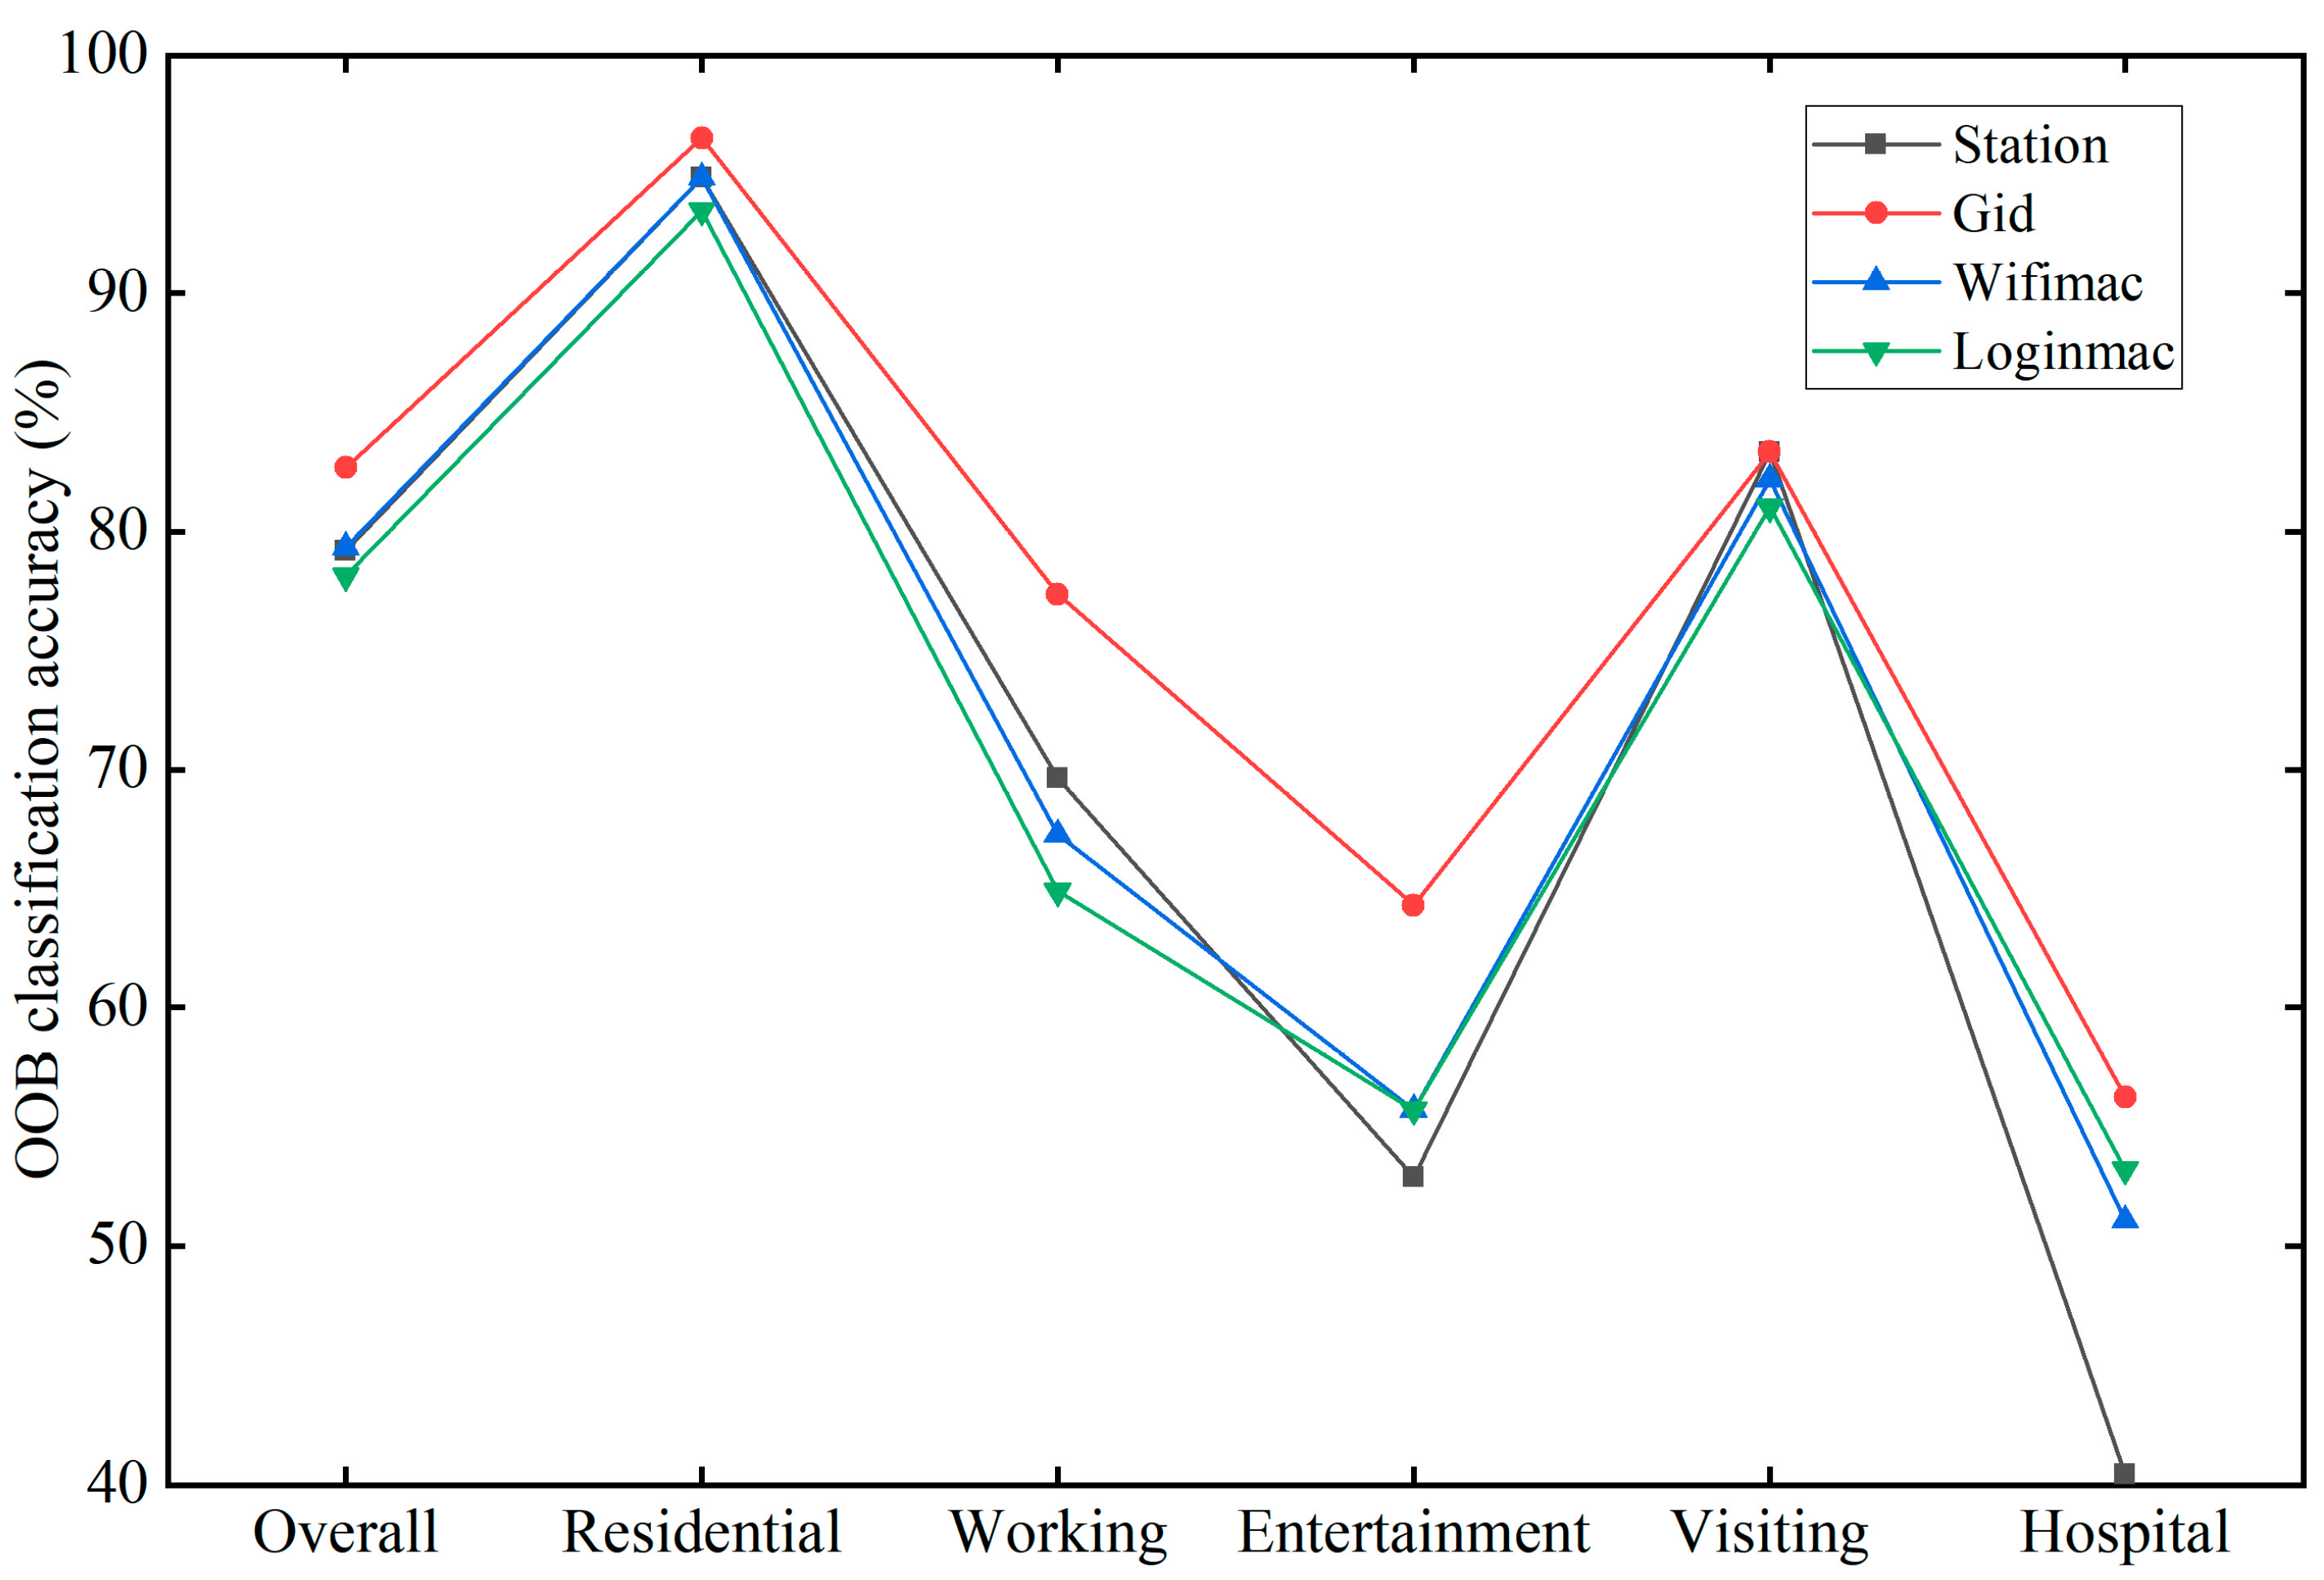
5.1.2. MS Indicator Selection Results
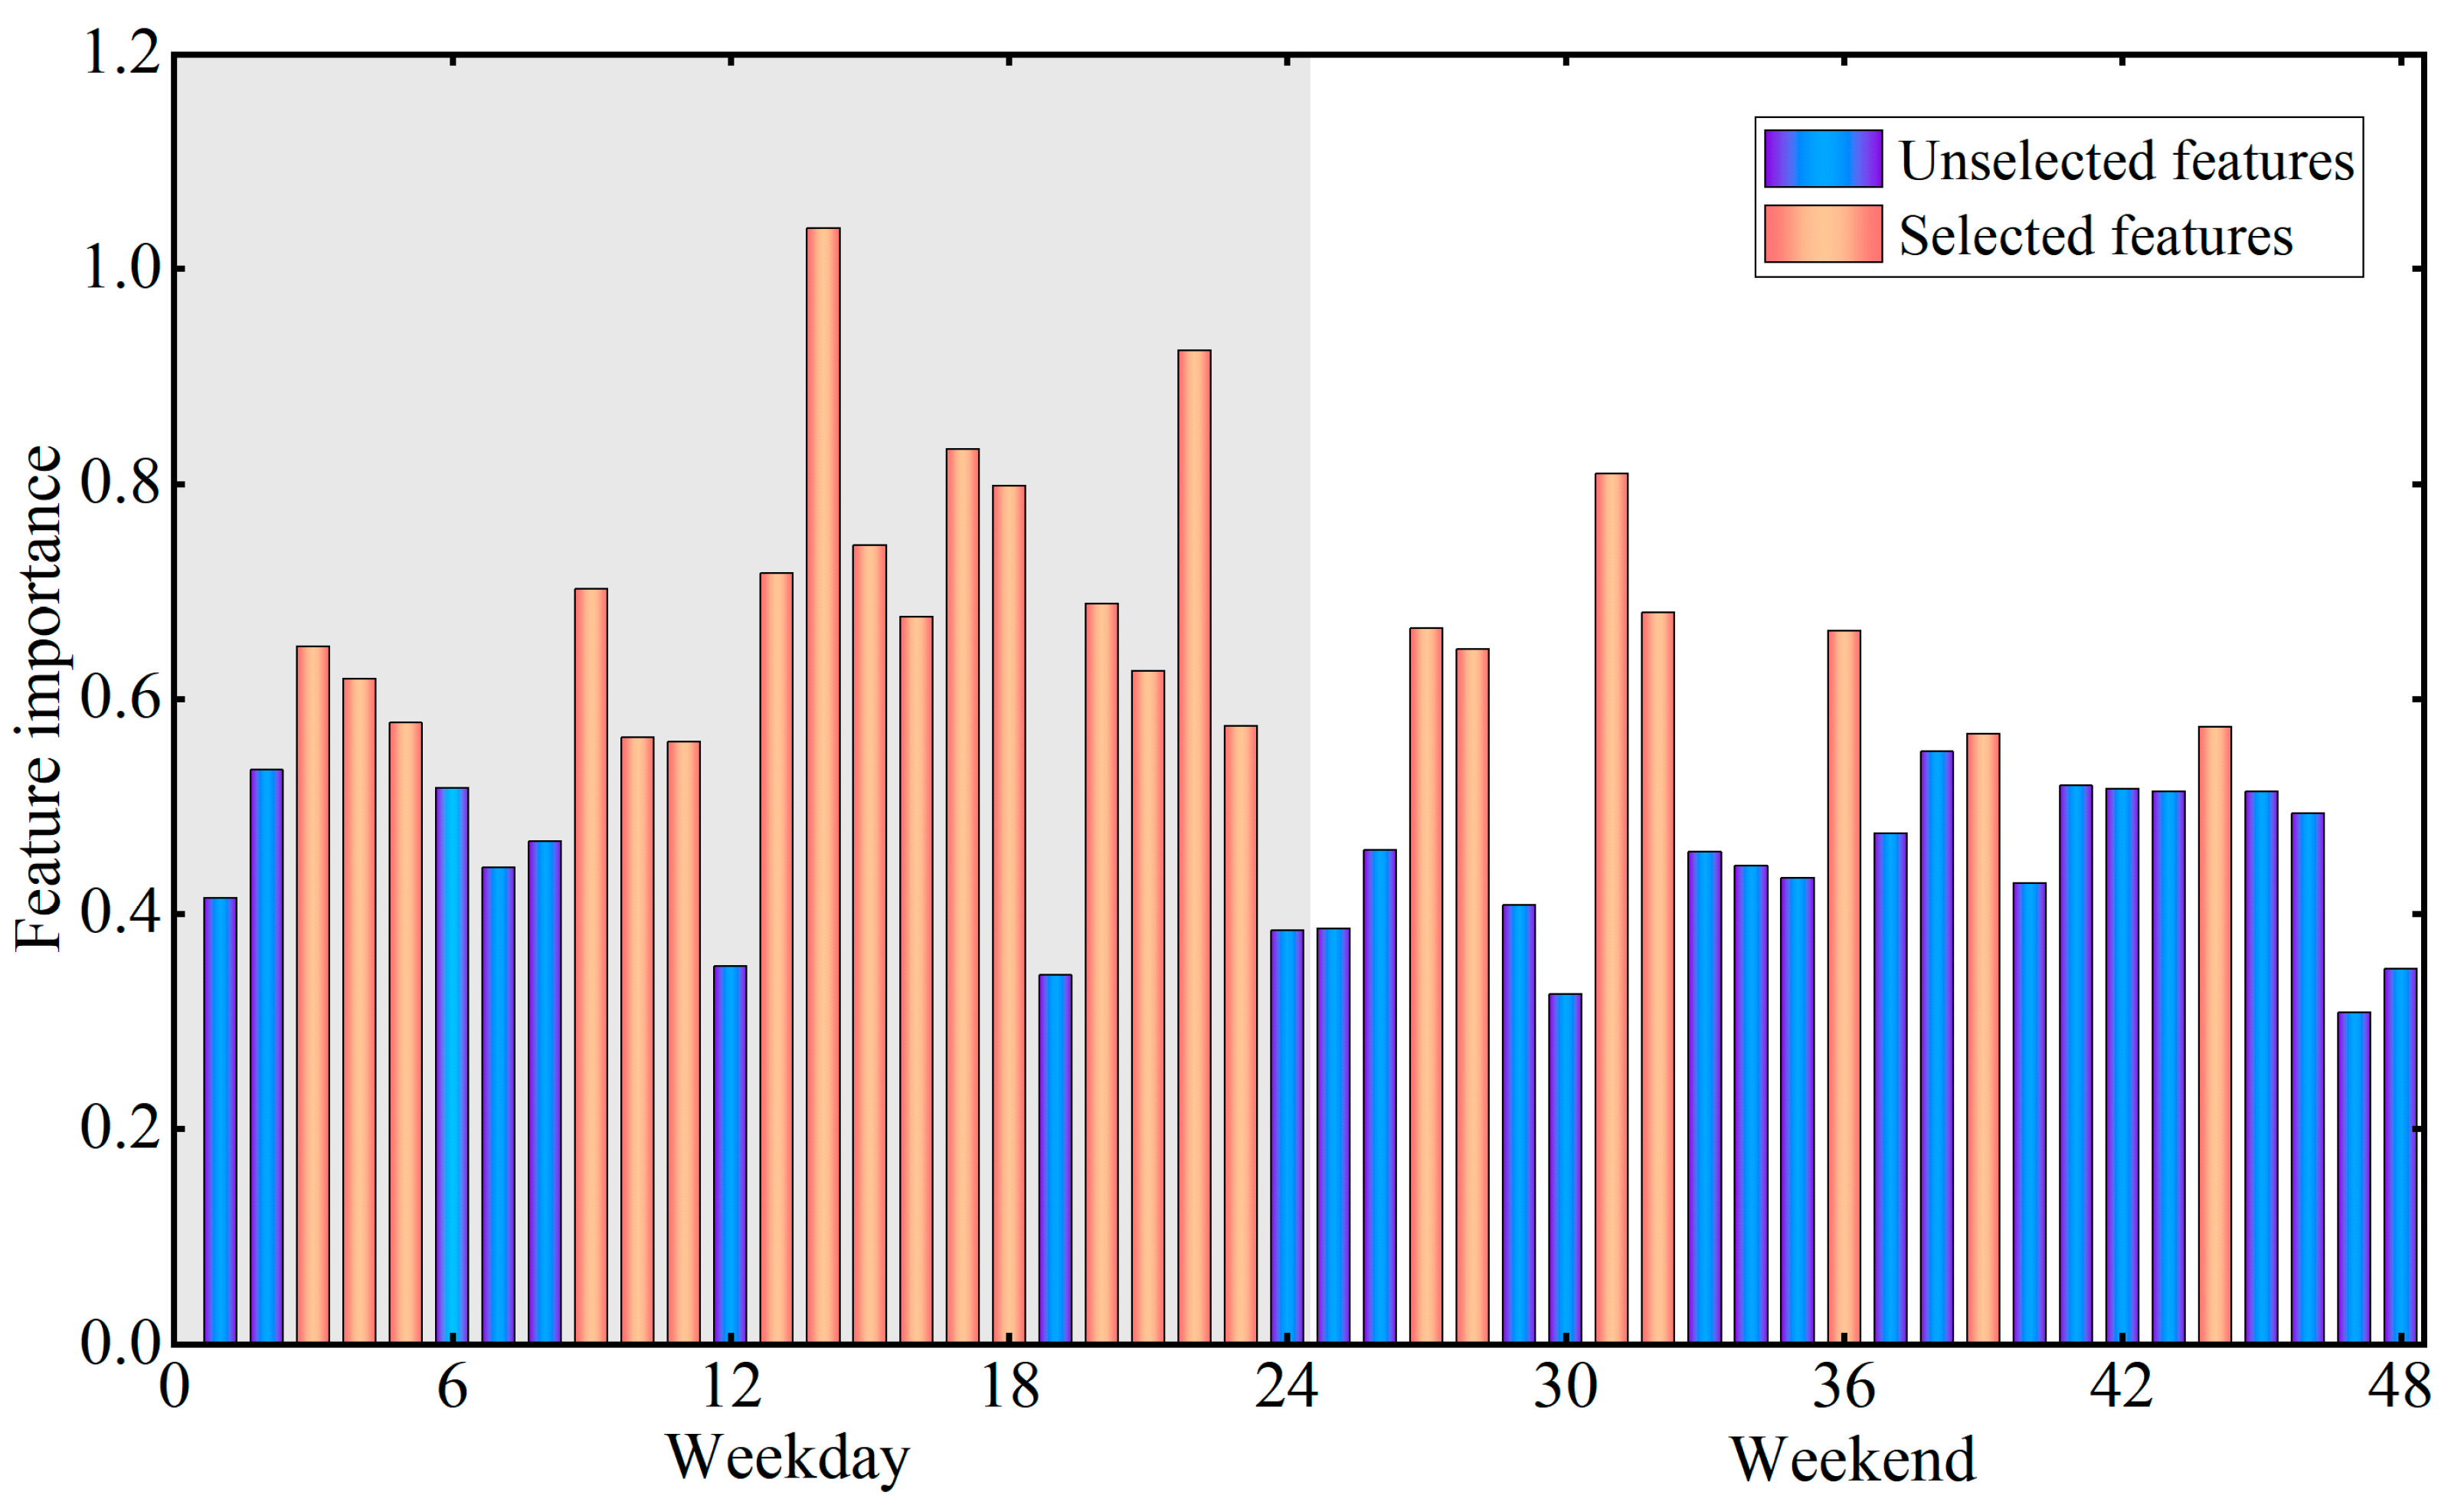
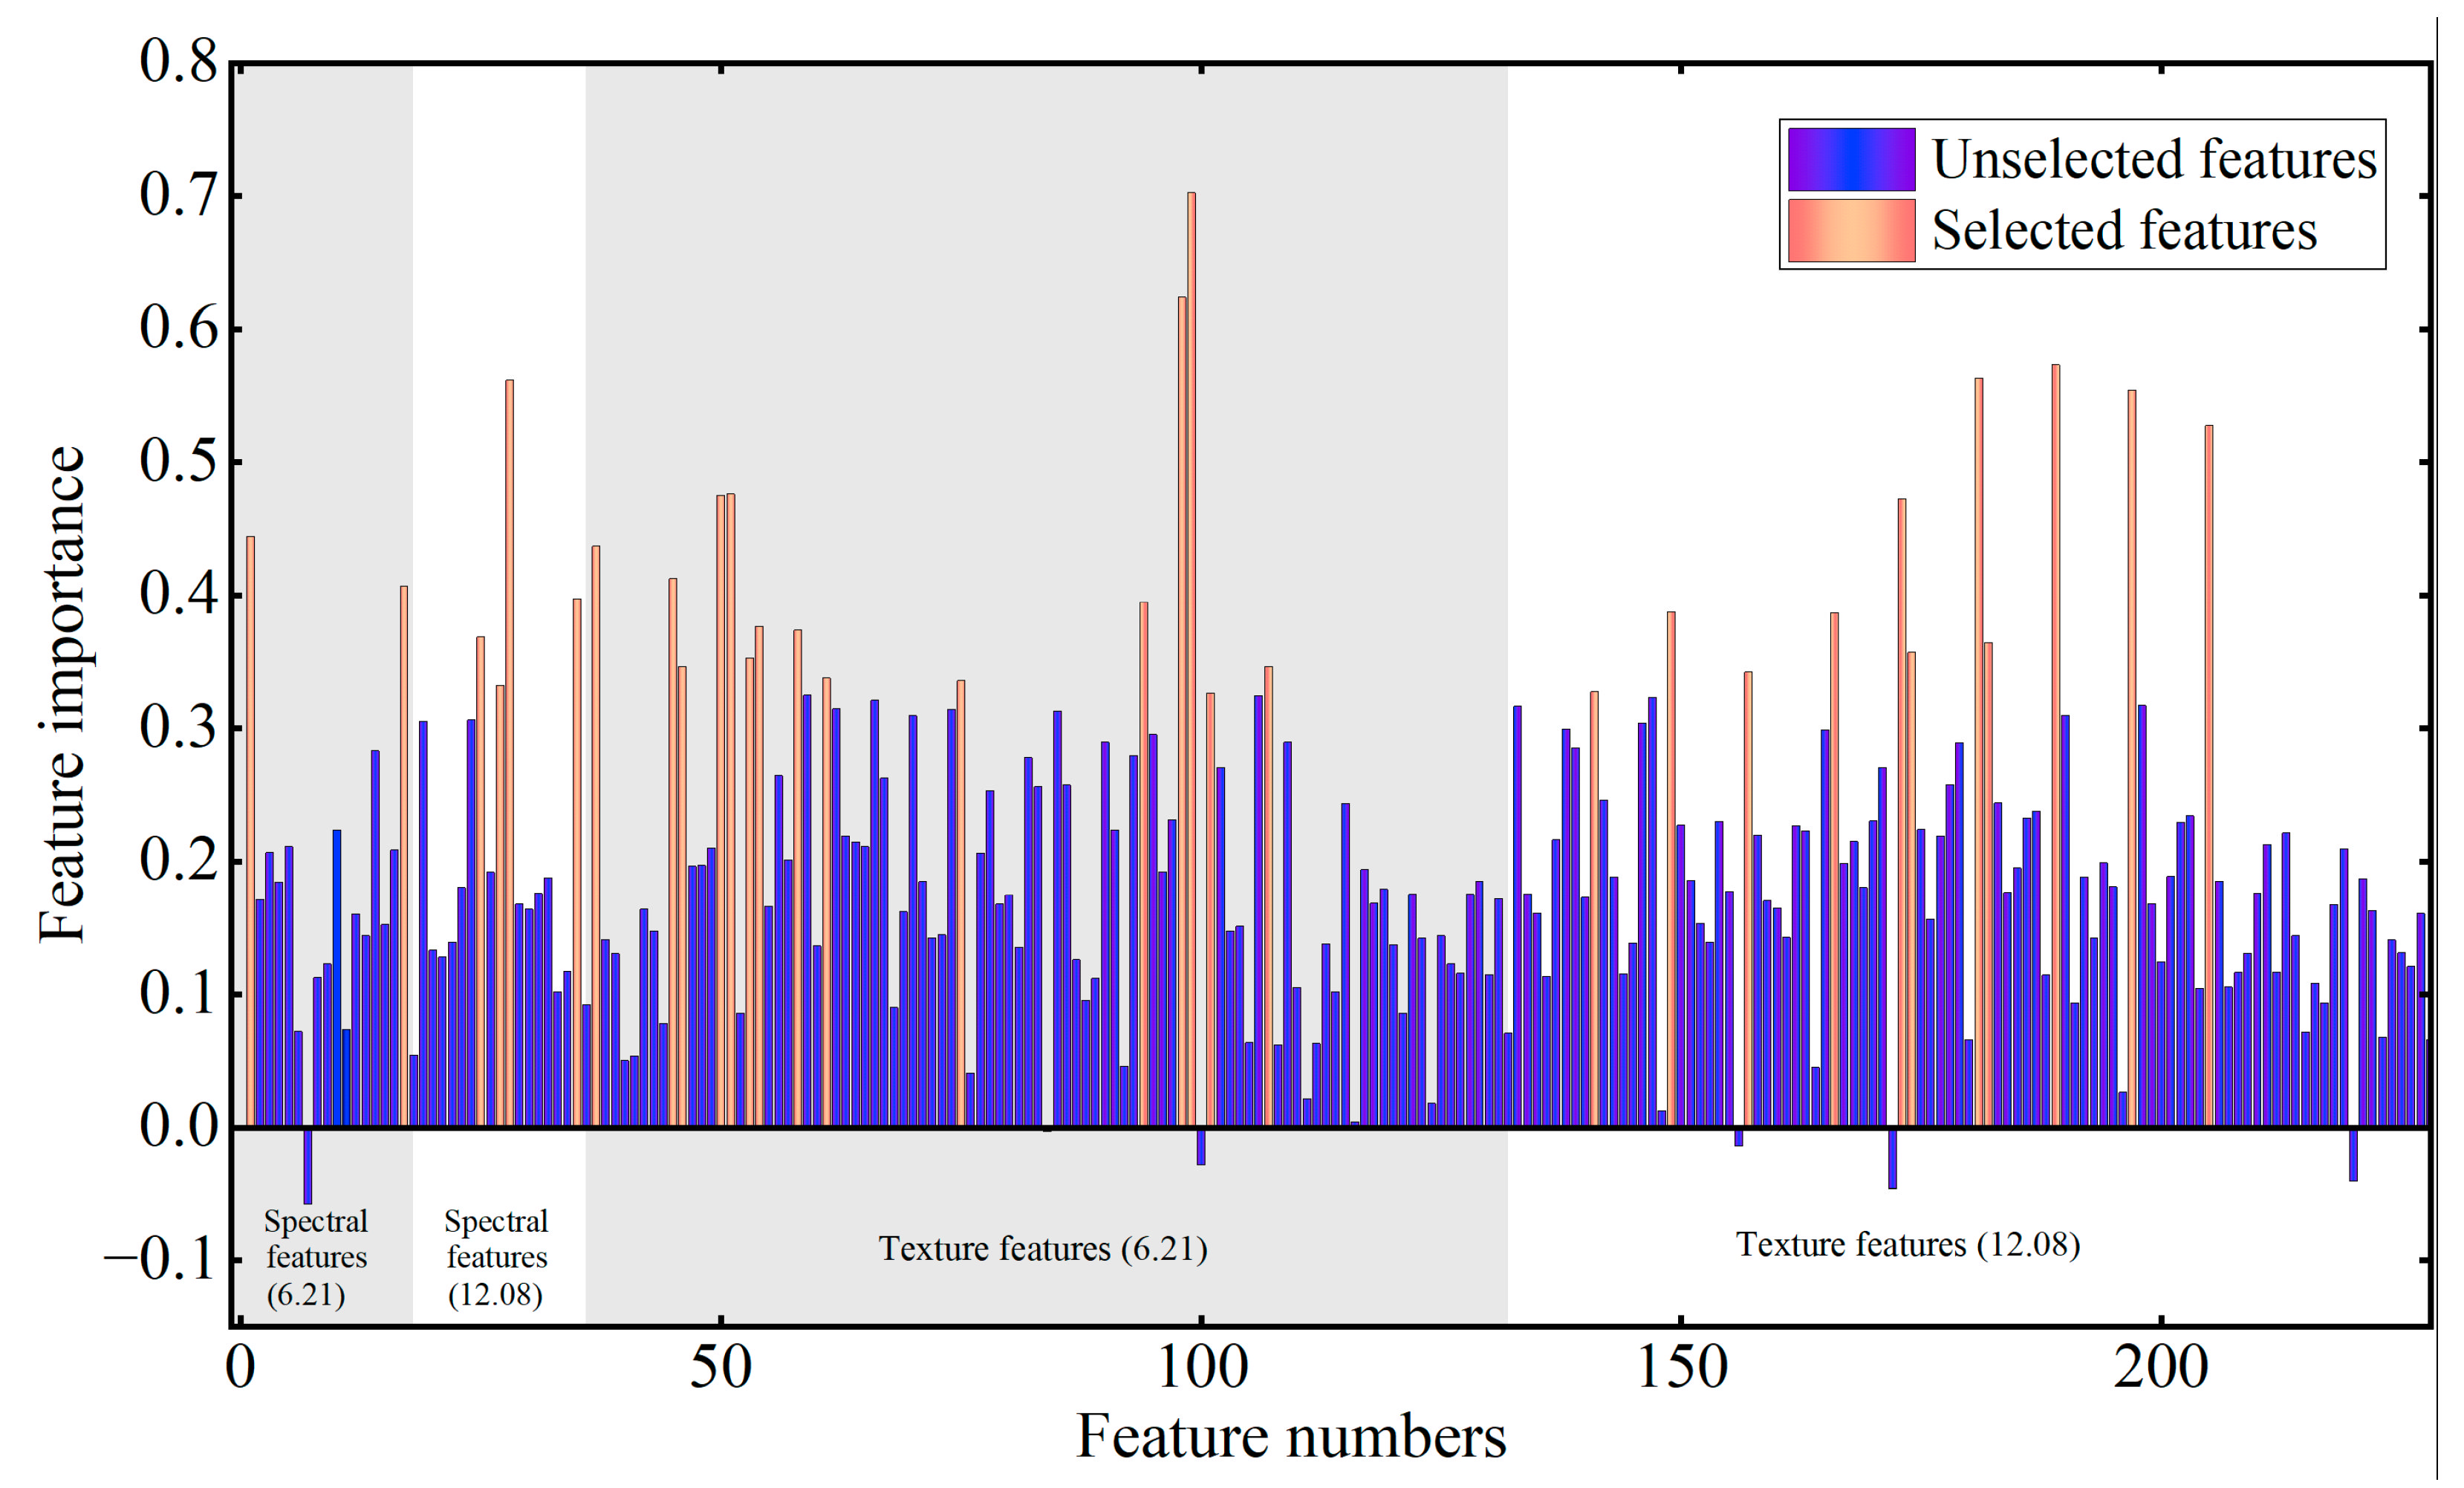
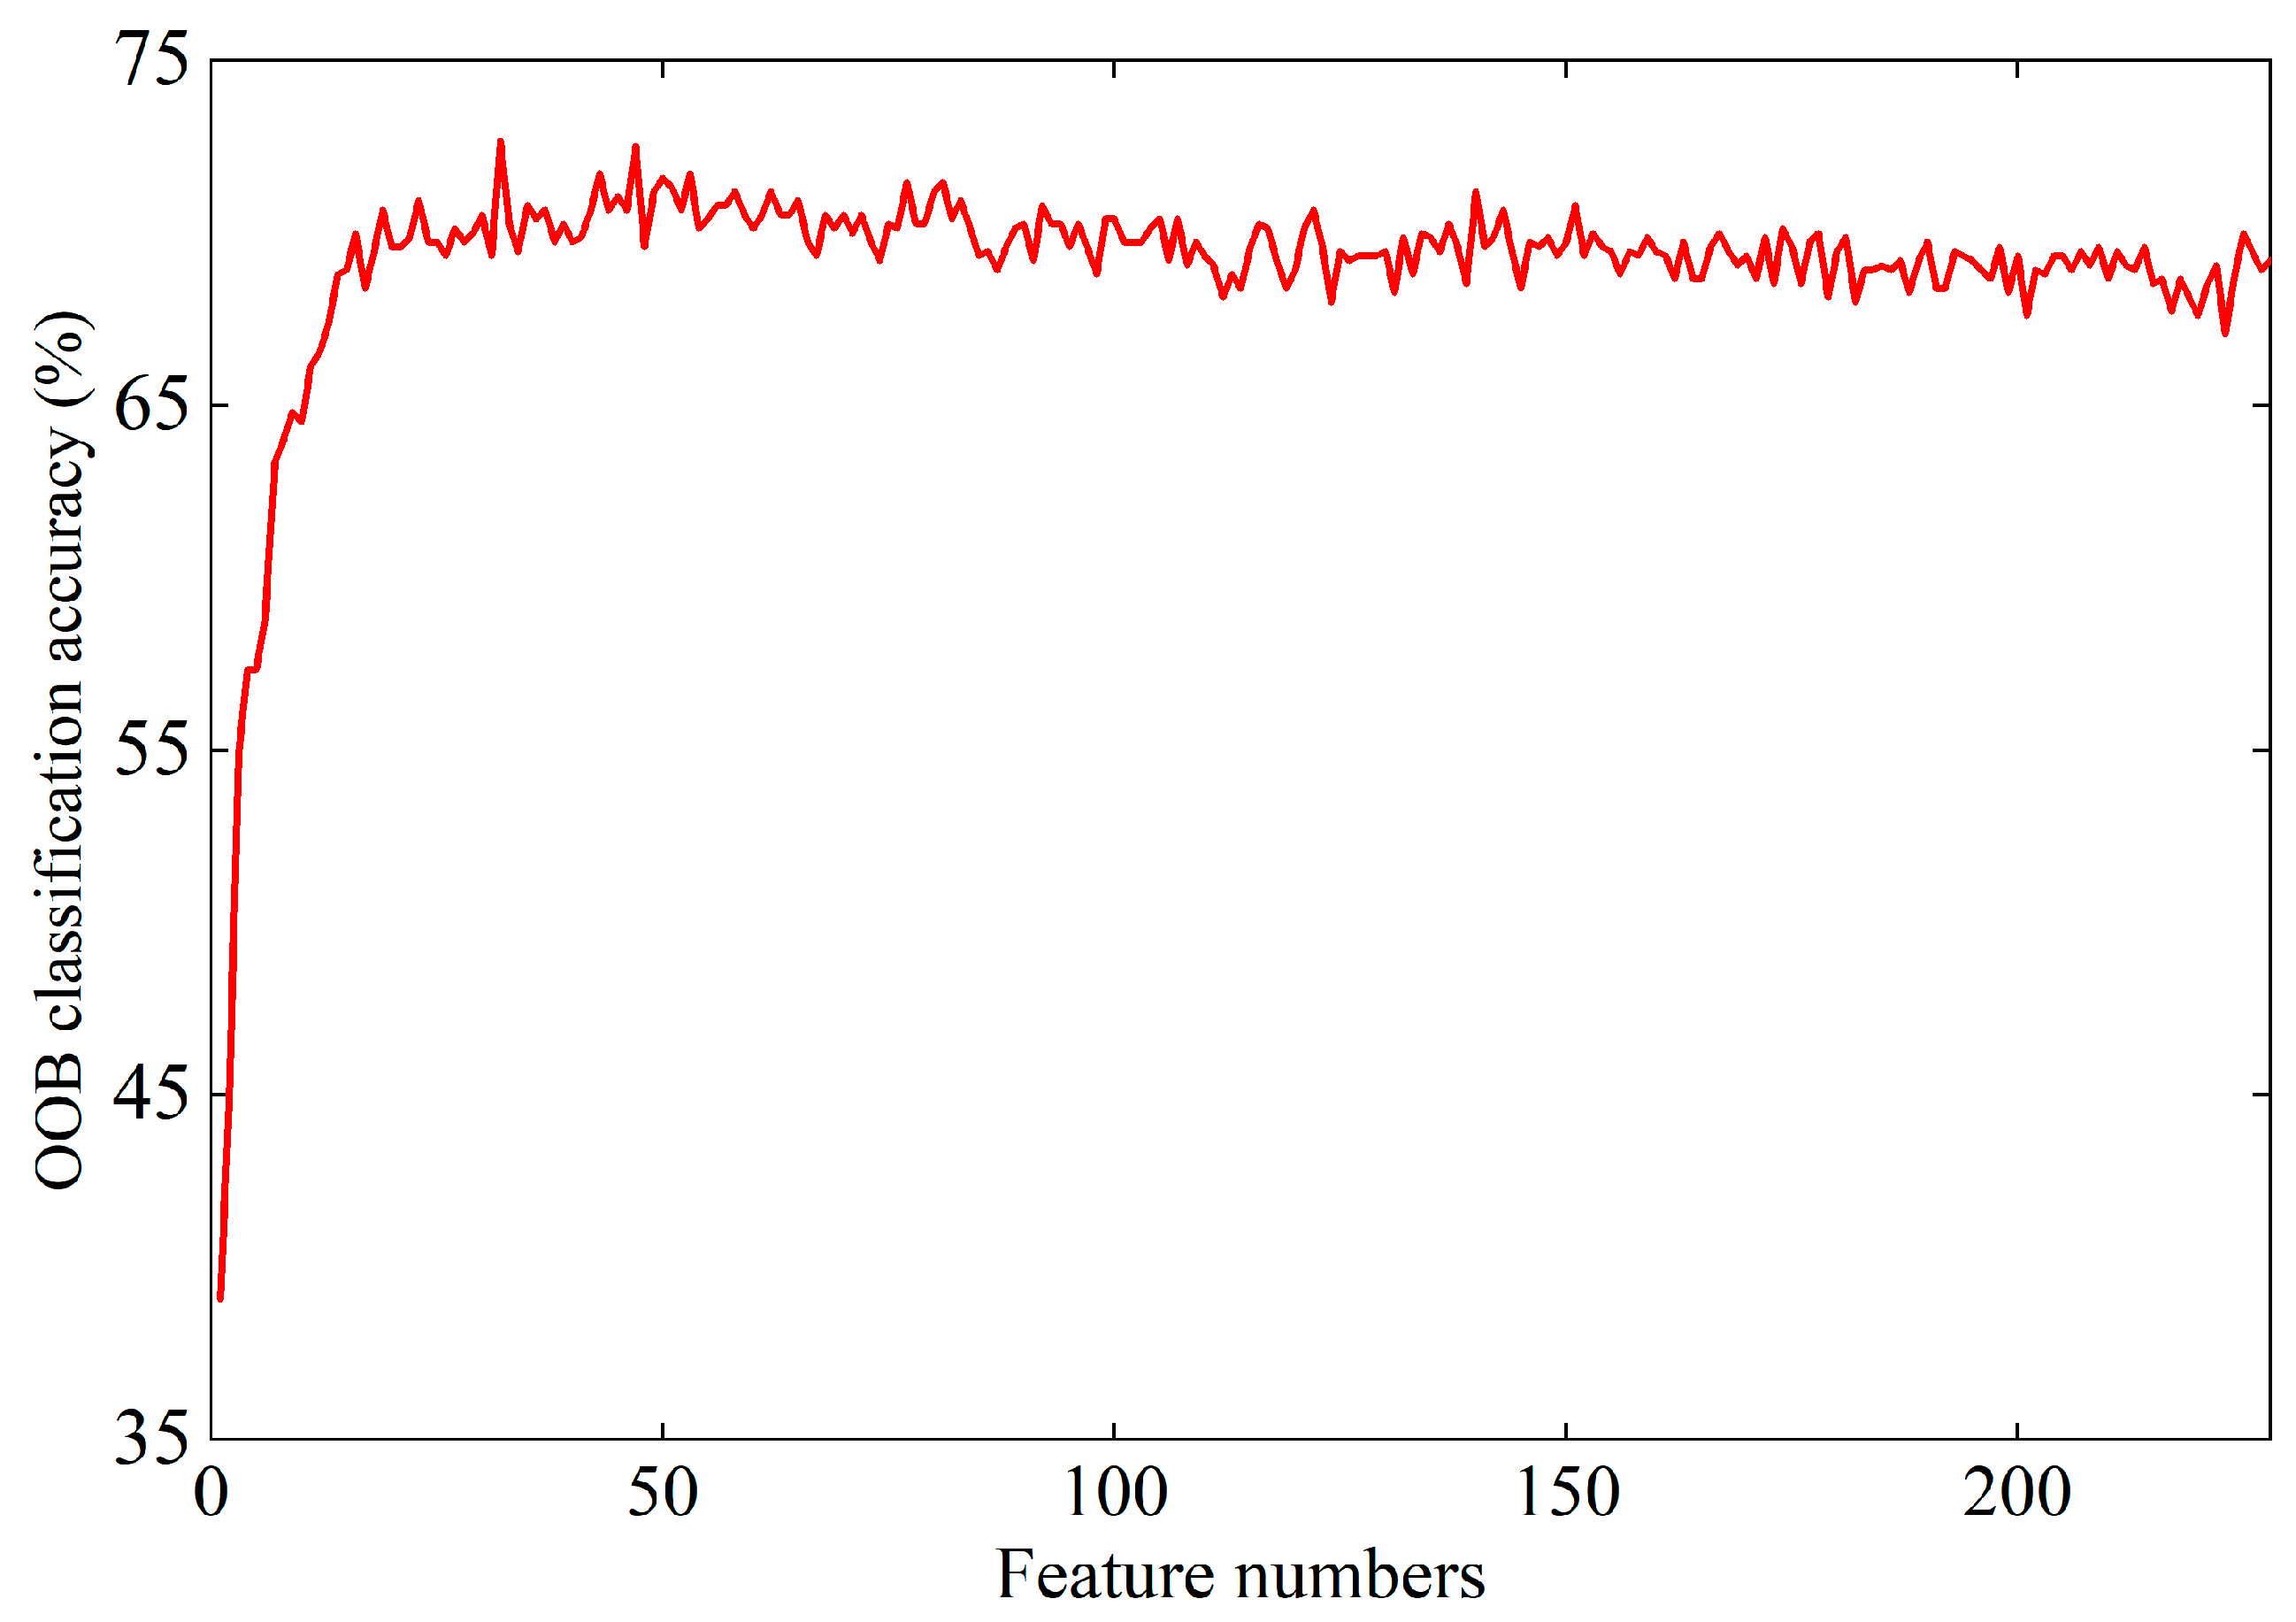
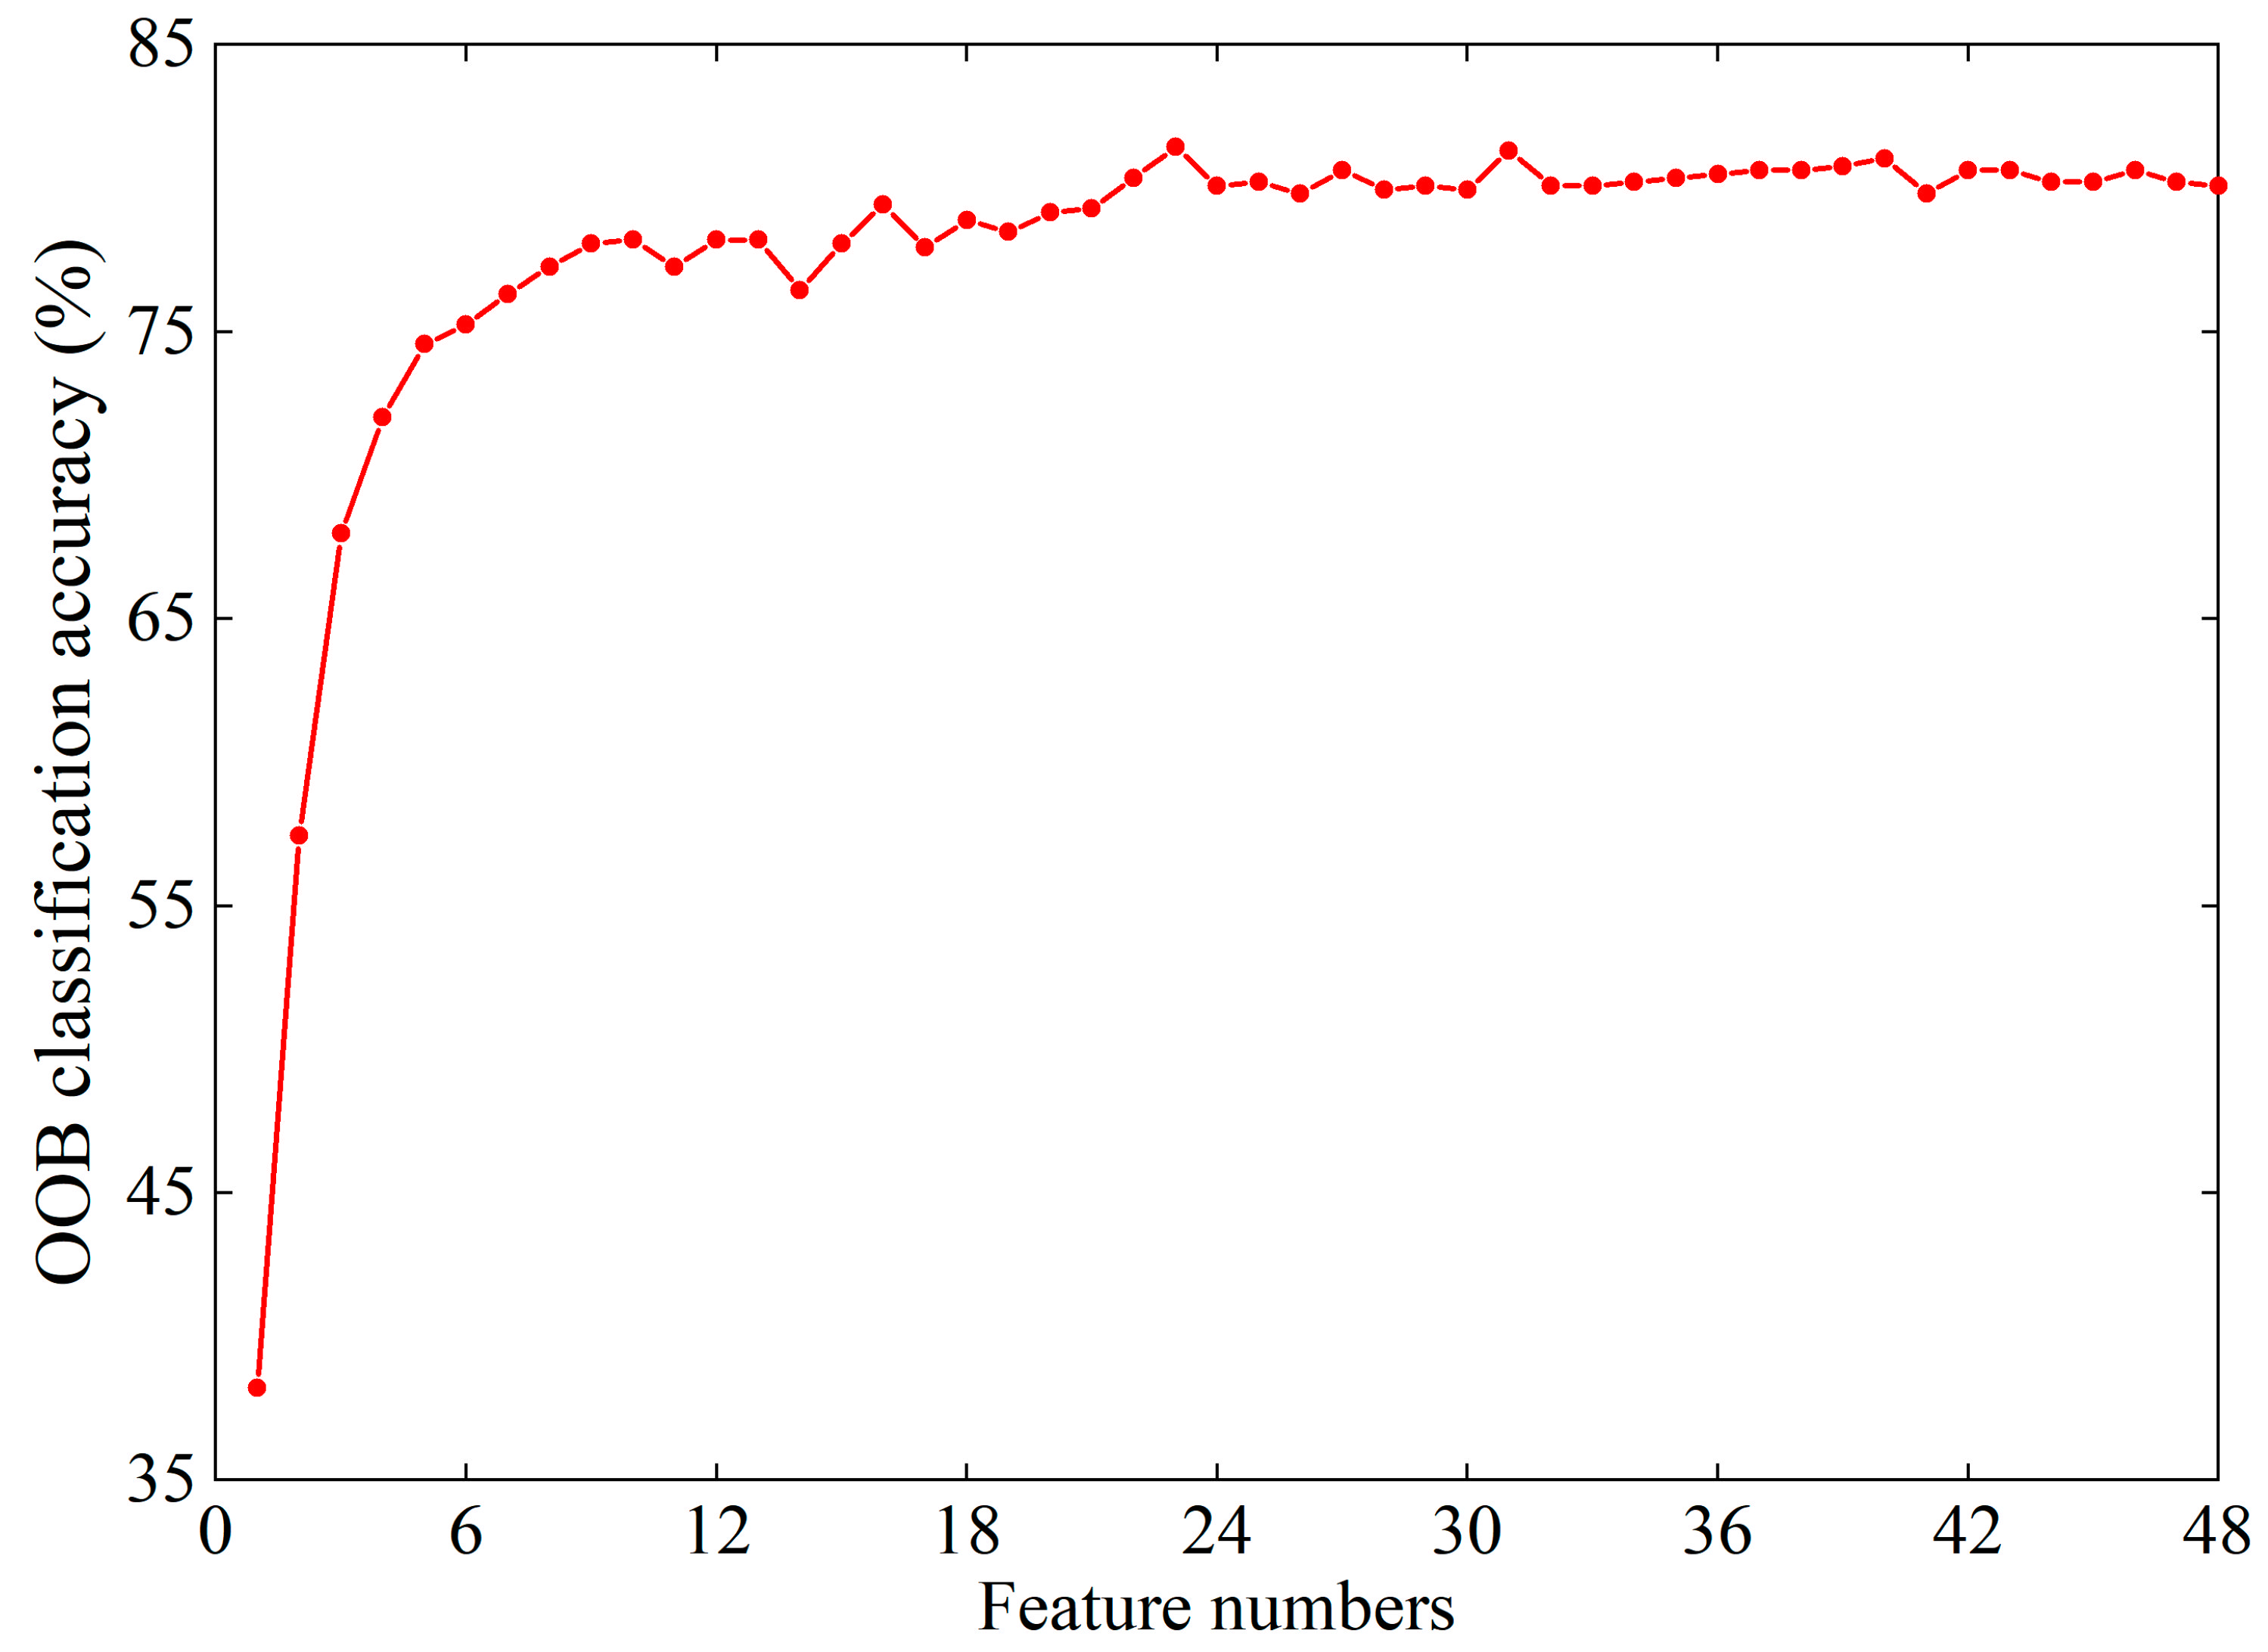
5.1.3. Feature Selection Results
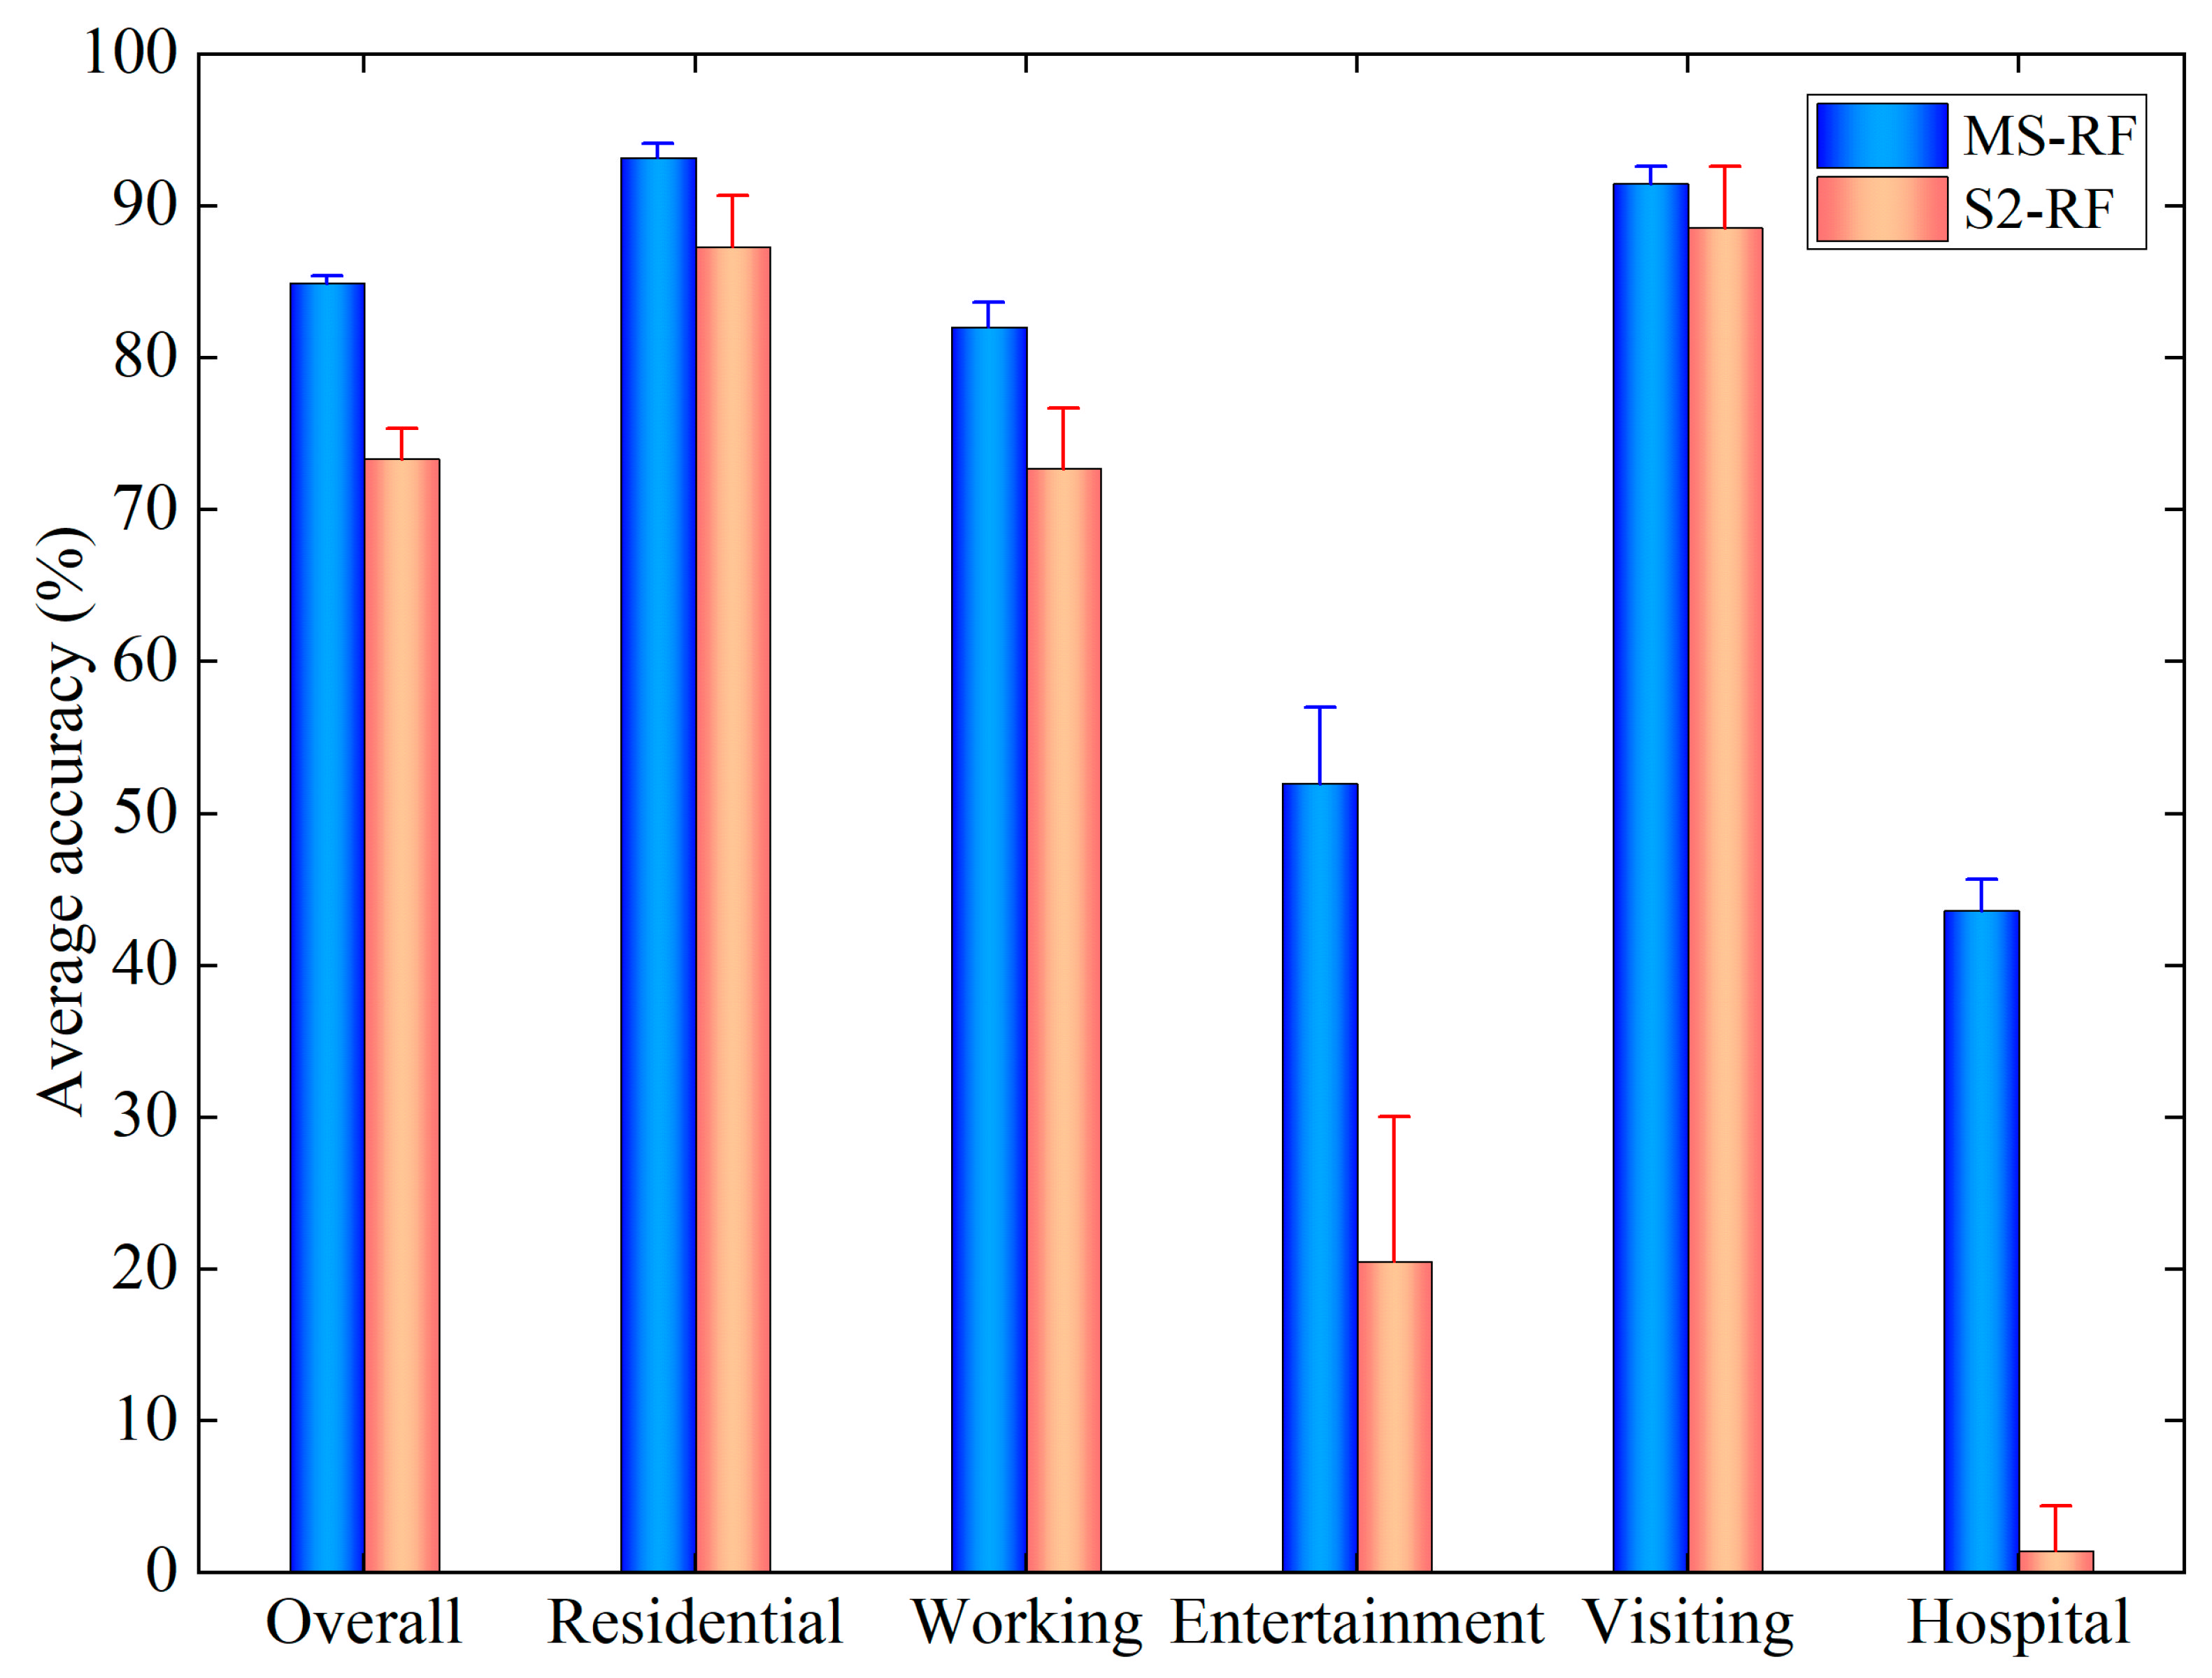
5.2. BFT Classification Accuracy Assessment Using MS Data
5.3. Comparison with S2 Data
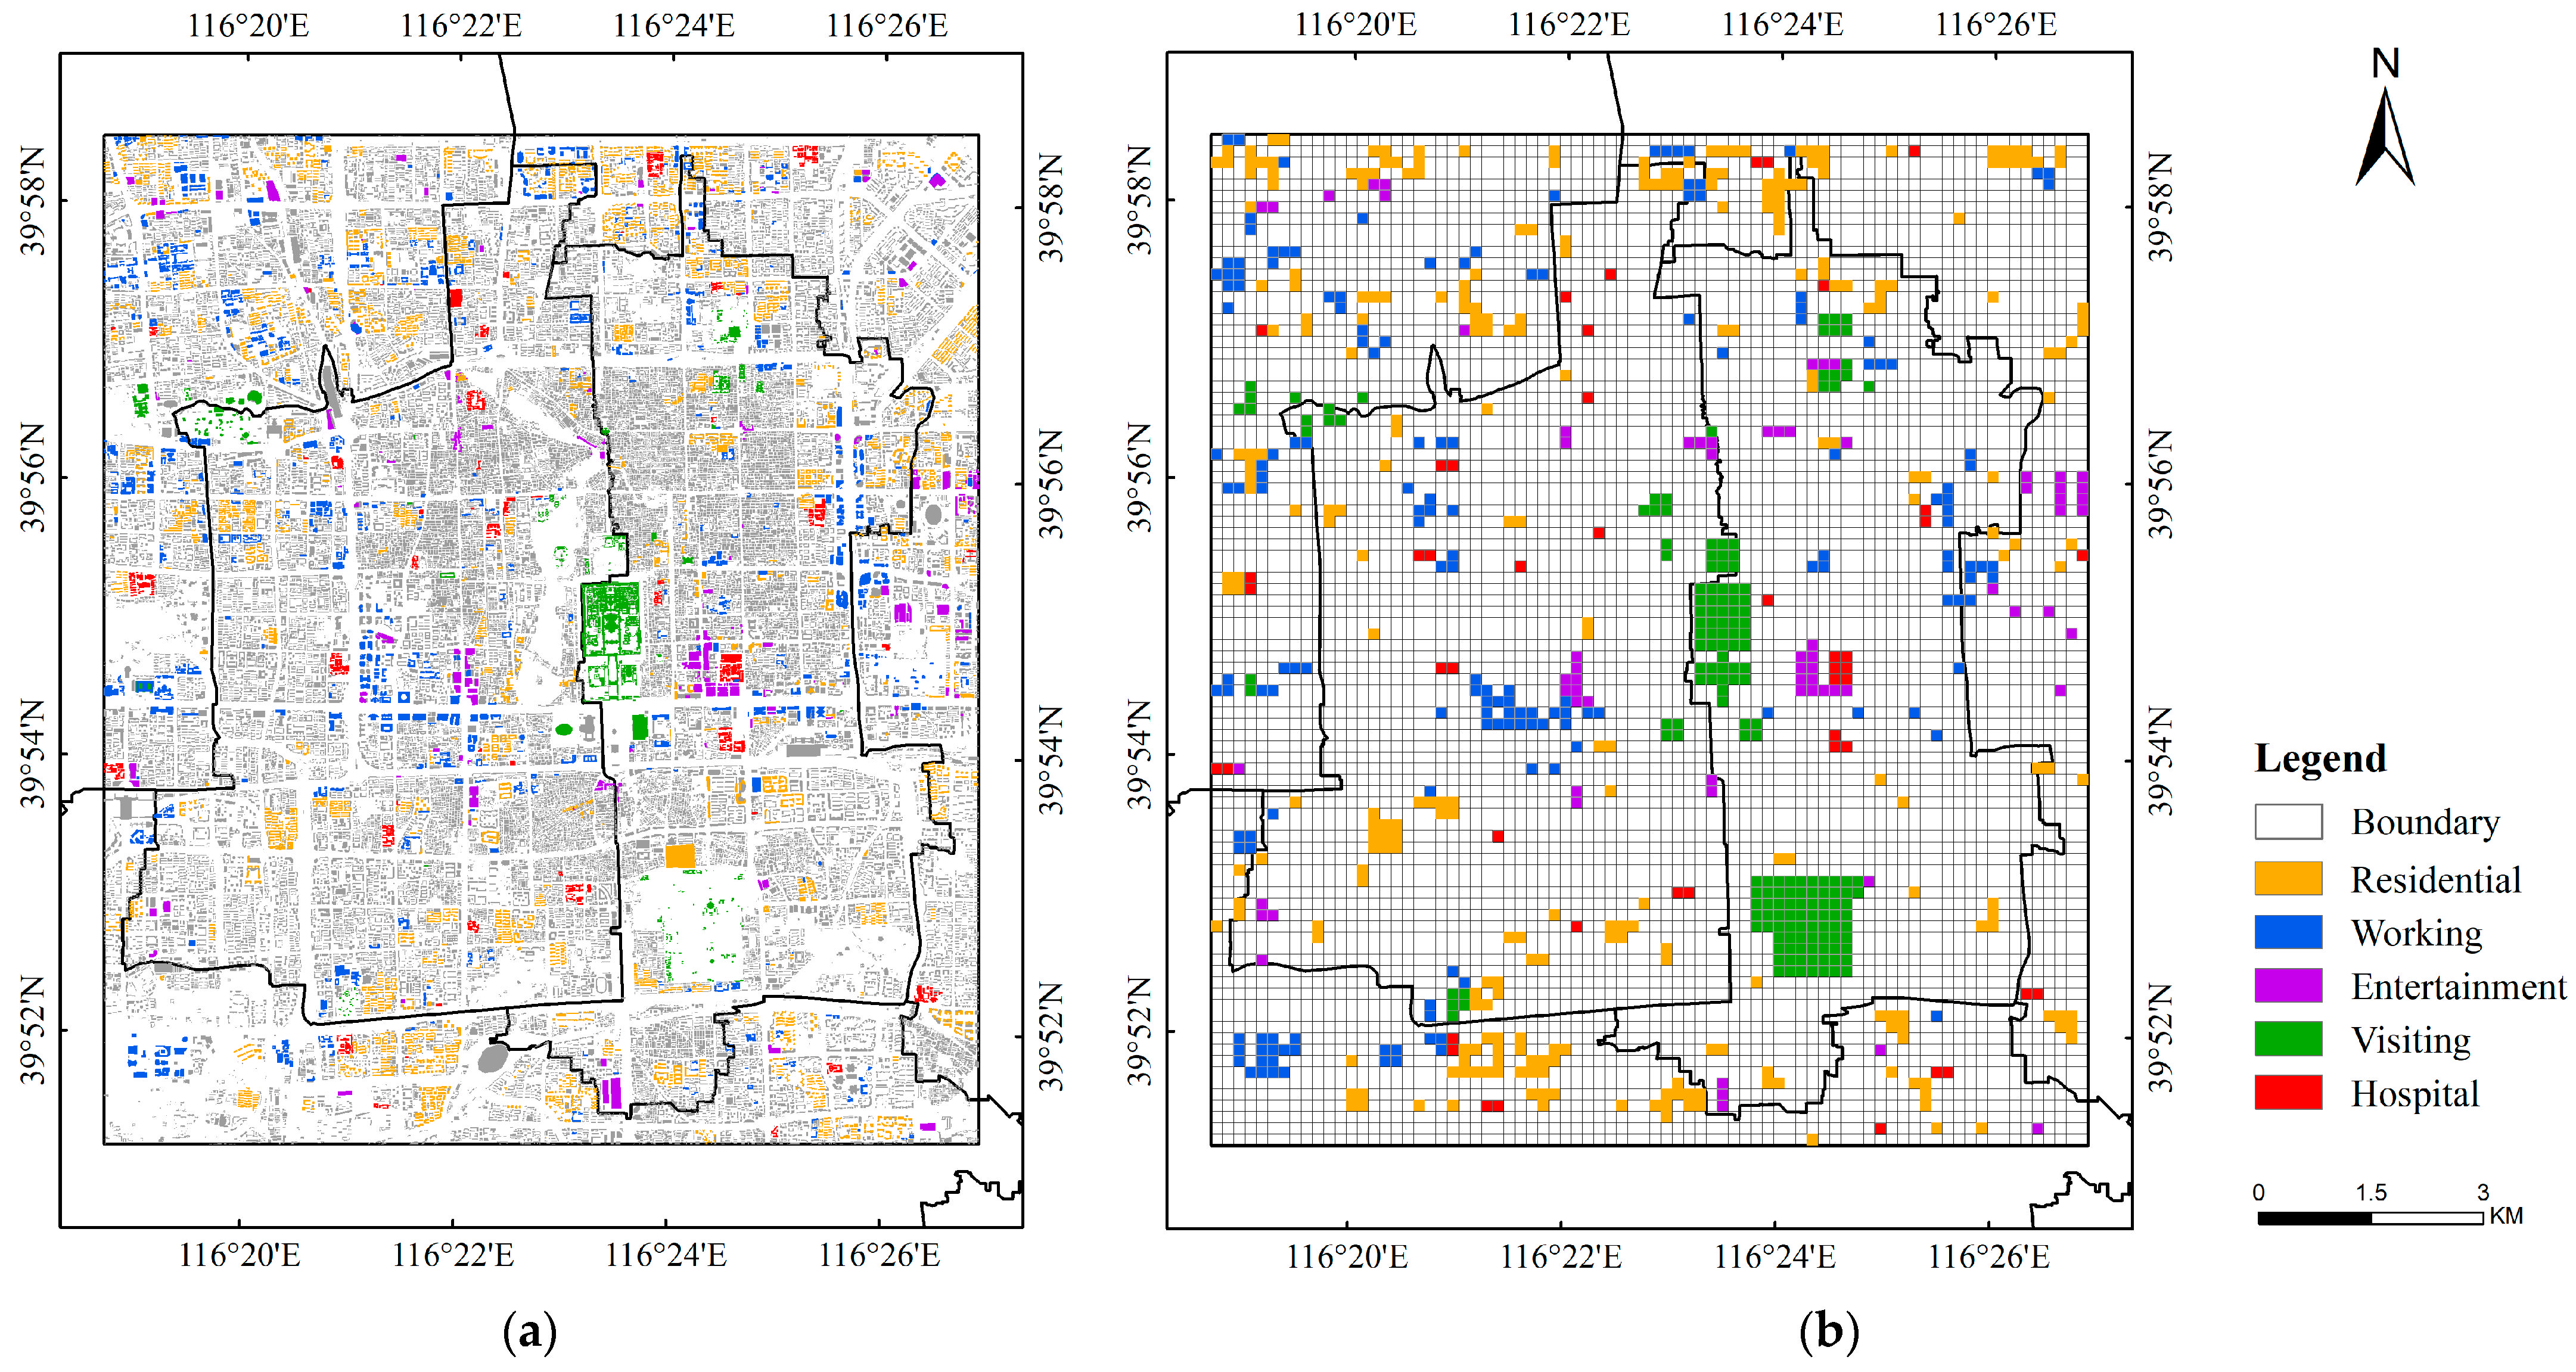
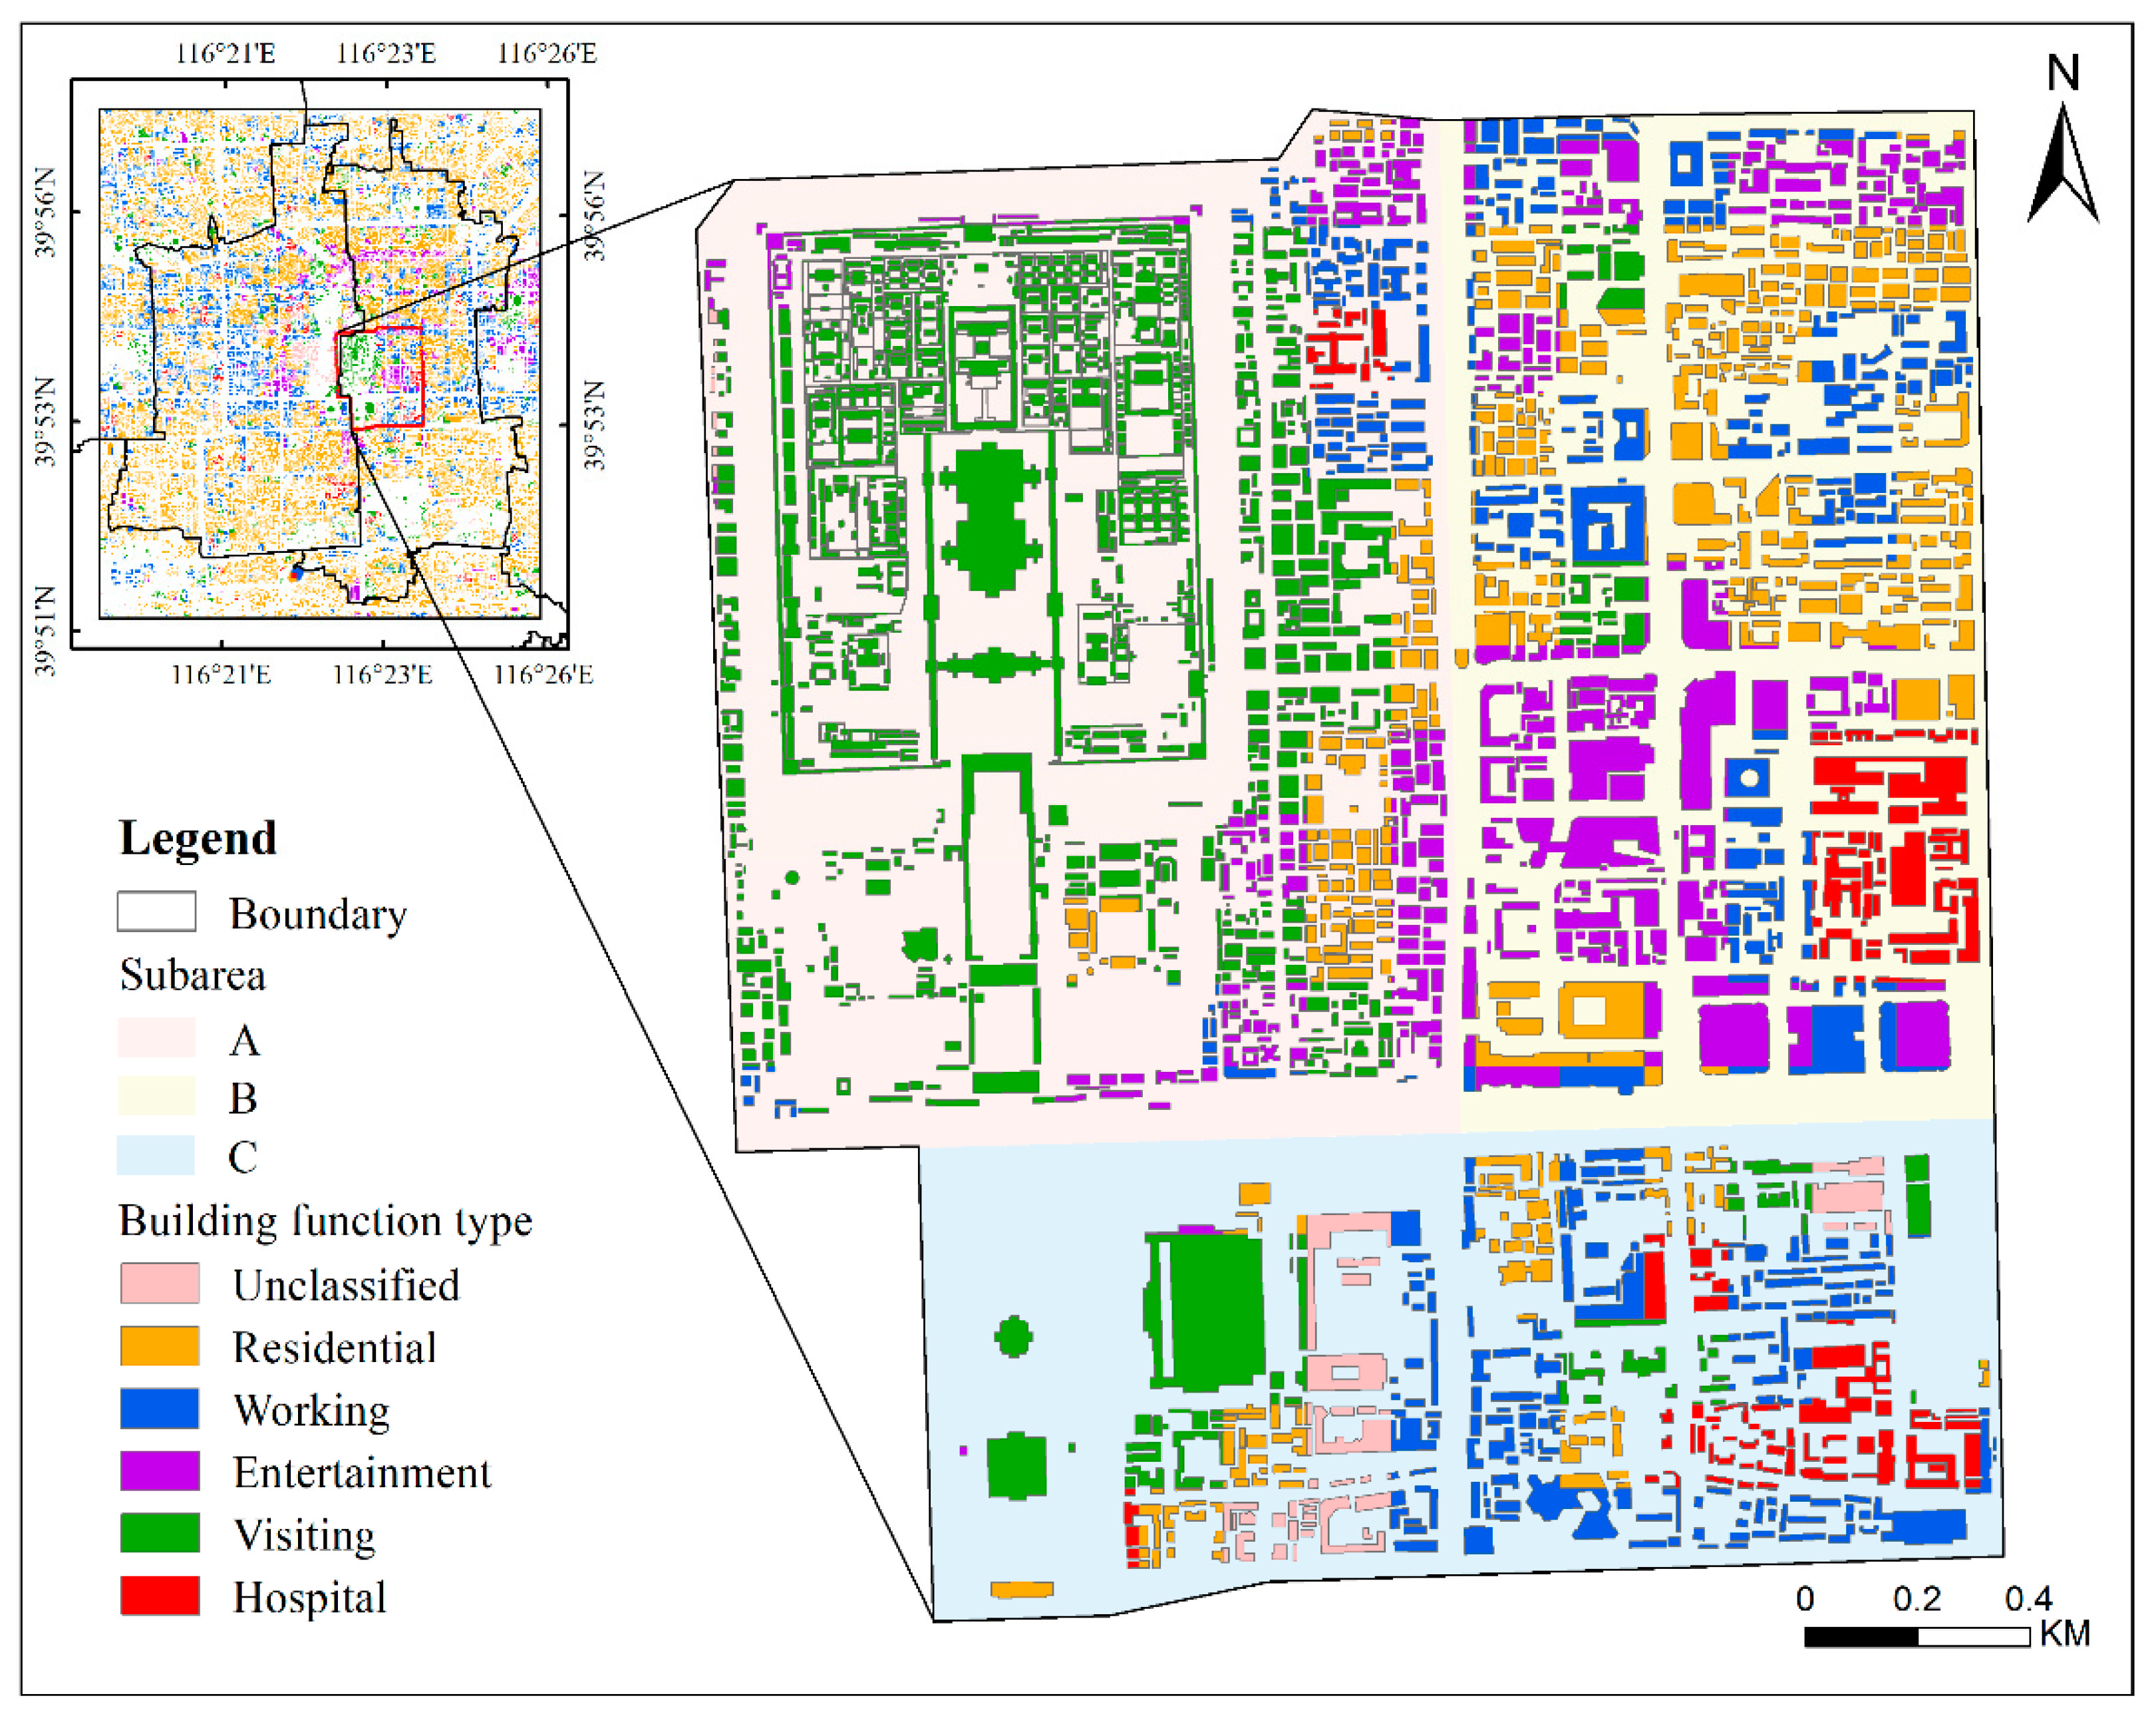
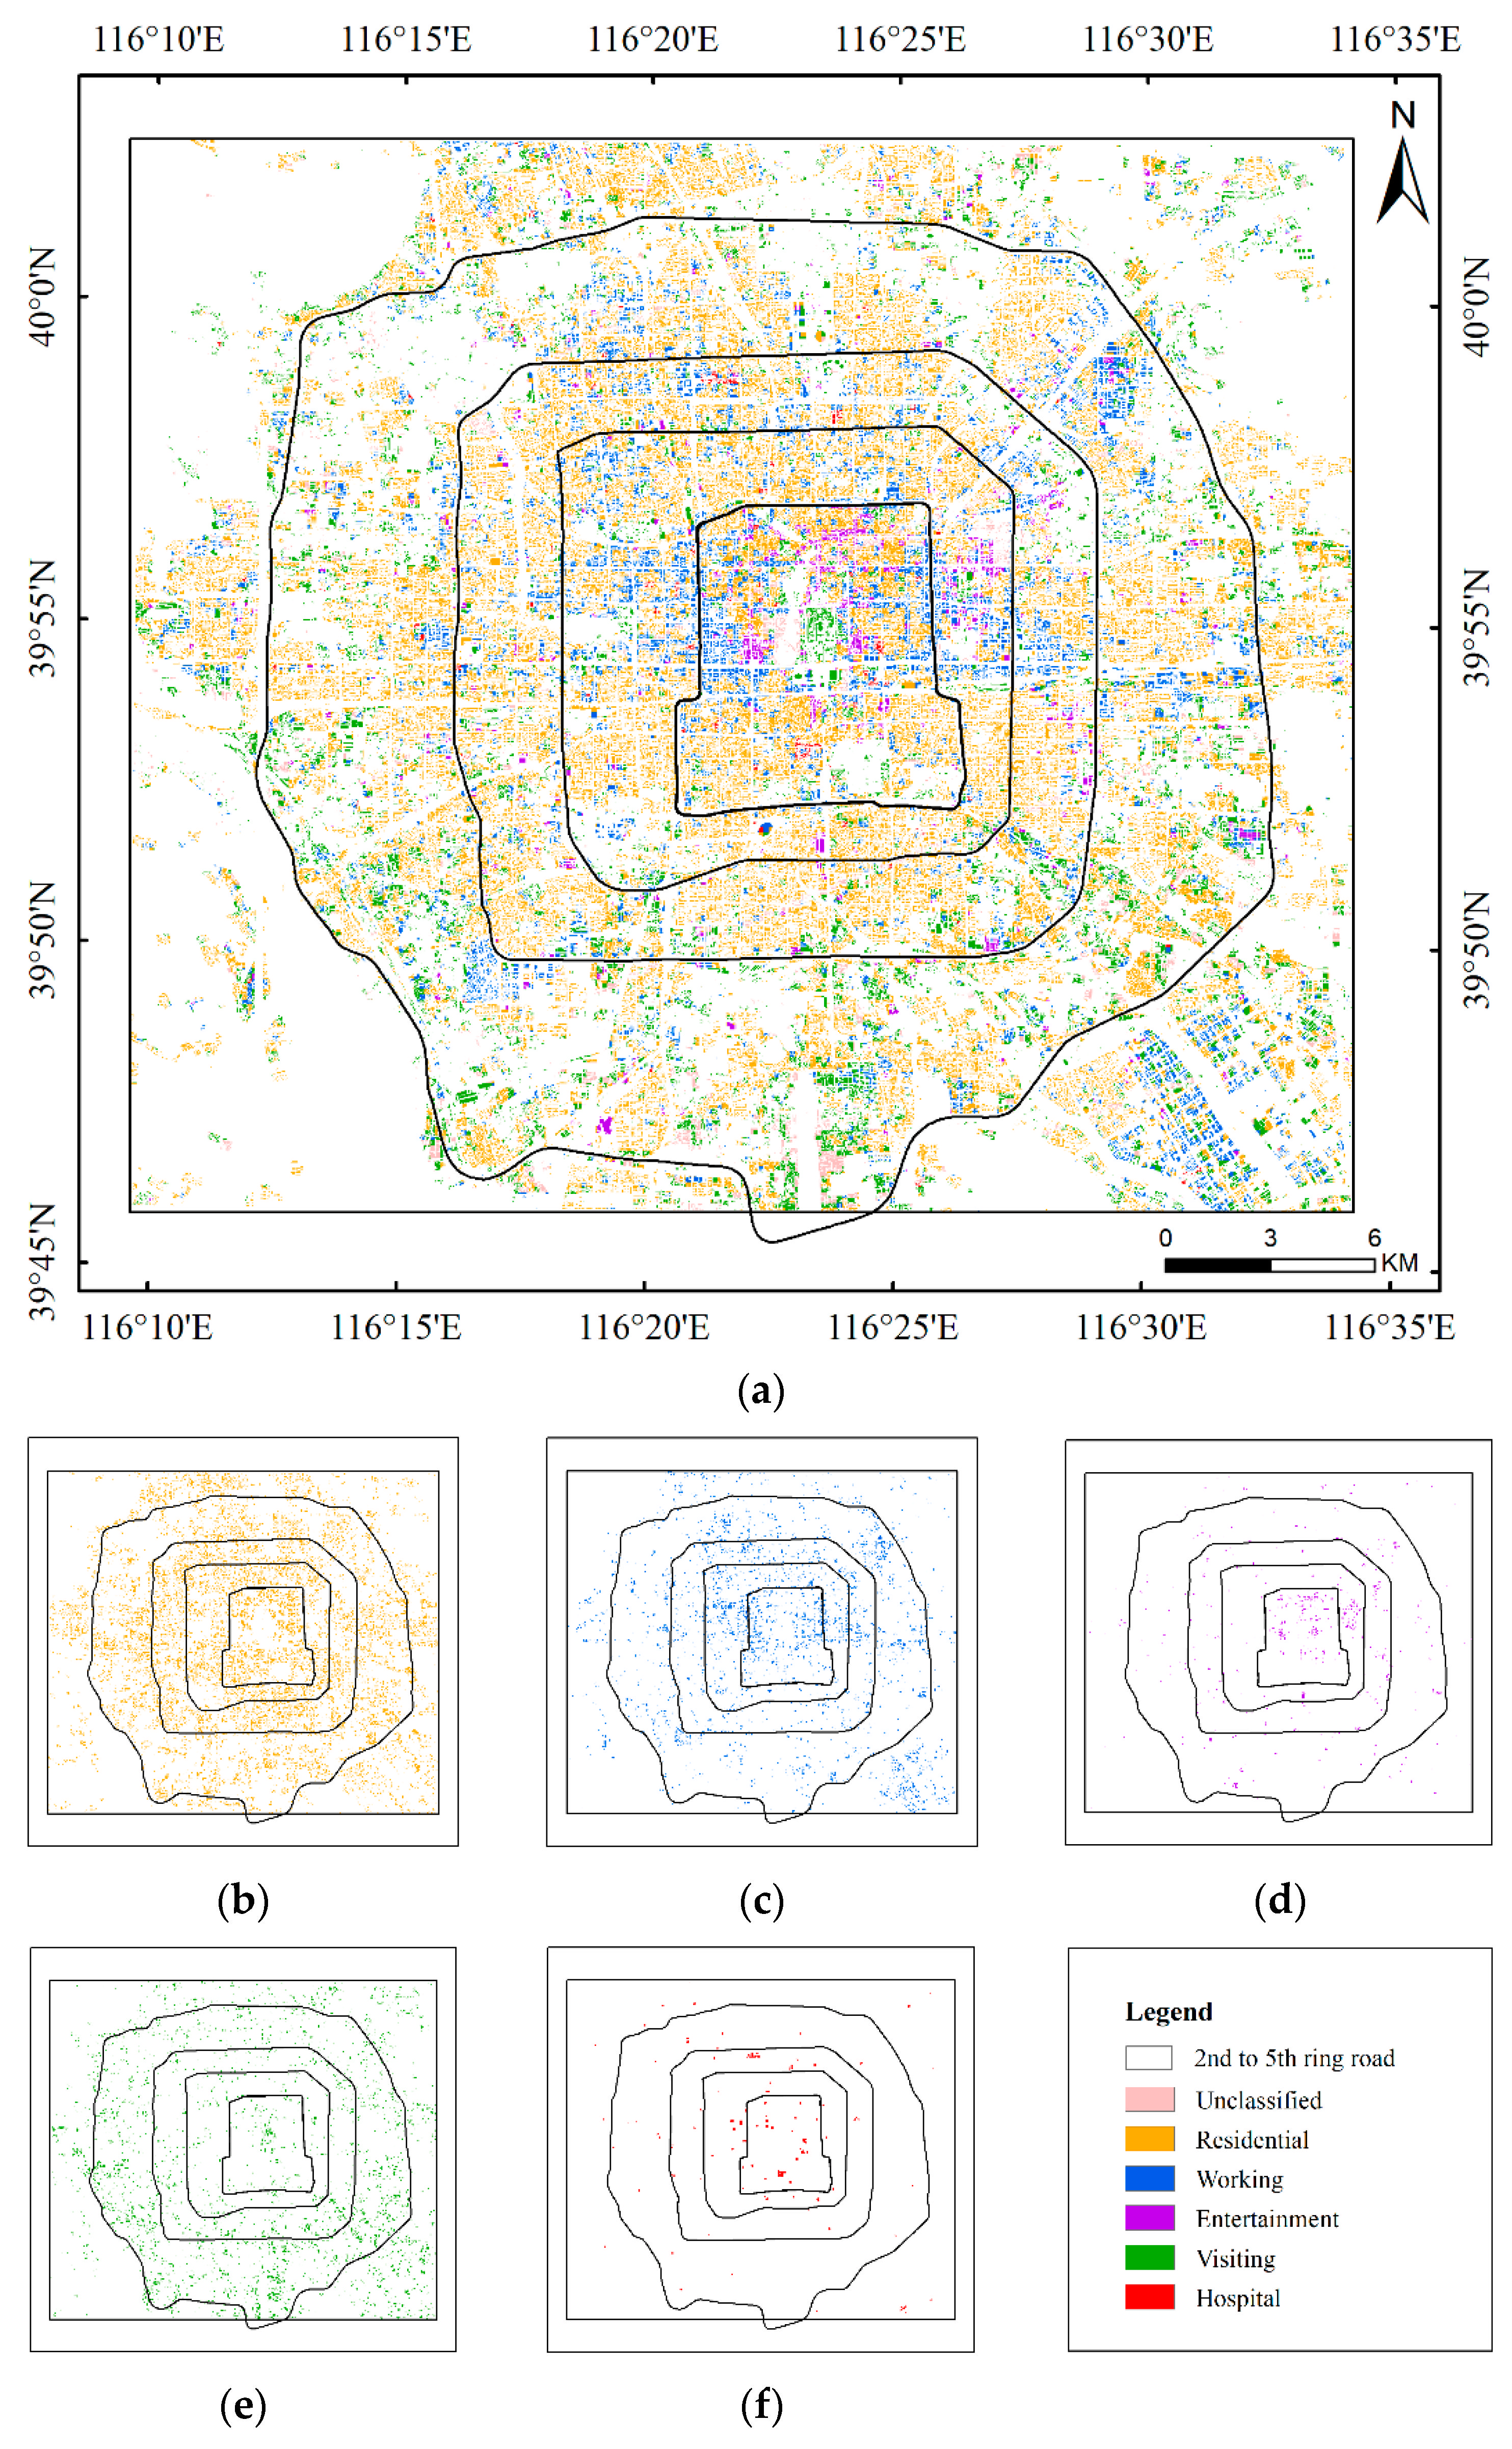
5.4. Model Application
6. Discussion
7. Conclusions
Author Contributions
Funding
Conflicts of Interest
Abbreviations
| BFT | Building function type |
| MS | Mobile signaling |
| R | Residential |
| W | Working |
| E | Entertainment |
| V | Visiting |
| H | Hospital |
| RF | Random forest |
| OA | Overall accuracy |
| S2 | Sentinel-2 |
| Station | Number of active communication stations |
| Gid | Number of online mobile devices |
| Wifimac | Number of Active Wi-Fi Hotspots |
| Loginmac | Number of connected devices in wireless networks |
| OSM | Open Street Map |
| POI | Point of interest |
| SDK | Software development kit |
| VGI | Volunteered Geographic Information |
| DS | Data sharing |
| ESA | European Space Agency |
| API | Application Programming Interface |
| TOA | Top-of-atmosphere |
| BOA | Bottom-of-atmosphere |
| NDBI | Normalized difference built-up index |
| MNDWI | Modified normalized difference water index |
| NDVI | Normalized difference vegetation index |
| TCB | Tasseled cap brightness |
| TCG | Tasseled cap greenness |
| TCW | Tasseled cap wetness |
| TCT | Tasseled cap transformation |
| GLCM | Gray level co-occurrence matrix |
| N | Number of decision trees |
| L | Number of leaves |
| OOB | Out-of-bag |
| MS-RF | Mobile Signaling Random Forest Classification Model |
| S2-RF | Sentinel-2 Random Forest Classification Model |
| PA | Producer’s accuracy |
| UA | User accuracy |
References
- Tu, W.; Hu, Z.; Li, L.; Cao, J.; Jiang, J.; Li, Q.; Li, Q. Portraying urban functional zones by coupling remote sensing imagery and human sensing data. Remote Sens. 2018, 10, 141. [Google Scholar] [CrossRef]
- Niu, N.; Liu, X.; Jin, H.; Ye, X.; Liu, Y.; Li, X.; Chen, Y.; Li, S. Integrating multi-source big data to infer building functions. Int. J. Geog. Inf. Sci. 2017, 31, 1871–1890. [Google Scholar] [CrossRef]
- Liu, X.; Niu, N.; Liu, X.; Jin, H.; Ou, J. Characterizing mixed-use buildings based on multi-source big data. Int. J. Geog. Inf. Sci. 2018, 32, 738–756. [Google Scholar] [CrossRef]
- Deng, Y.; Chen, R.; Yang, J.; Li, Y.; Jiang, H.; Liao, W.; Sun, M. Identify urban building functions with multisource data: A case study in Guangzhou, China. Int. J. Geog. Inf. Sci. 2022, 1–26. [Google Scholar] [CrossRef]
- Xie, J.; Zhou, J. Classification of Urban Building Type from High Spatial Resolution Remote Sensing Imagery Using Extended MRS and Soft BP Network. IEEE J. Sel. Top. Appl. Earth Obs. Remote Sens. 2017, 10, 3515–3528. [Google Scholar] [CrossRef]
- Zhuo, L.; Shi, Q.; Zhang, C.; Li, Q.; Tao, H. Identifying building functions from the spatiotemporal population density and the interactions of people among buildings. ISPRS Int. J. Geo-Inf. 2019, 8, 247. [Google Scholar] [CrossRef]
- Toole, J.L.; Ulm, M.; González, M.C.; Bauer, D. Inferring land use from mobile phone activity. In Proceedings of the ACM SIGKDD International Workshop on Urban Computing—UrbComp ’12, Beijing, China, 12 August 2012. [Google Scholar] [CrossRef]
- Mężyk, M.; Chamarczuk, M.; Malinowski, M. Automatic Image-Based Event Detection for Large-N Seismic Arrays Using a Convolutional Neural Network. Remote Sens. 2021, 13, 389. [Google Scholar] [CrossRef]
- Harirchian, E.; Jadhav, K.; Kumari, V.; Lahmer, T. ML-EHSAPP: A prototype for machine learning-based earthquake hazard safety assessment of structures by using a smartphone app. Eur. J. Environ. Civ. Eng. 2021, 25, 1–21. [Google Scholar] [CrossRef]
- Su, J.; Bai, Y.; Wang, X.; Lu, D.; Zhao, B.; Yang, H.; Koshimura, S. Technical Solution Discussion for Key Challenges of Operational Convolutional Neural Network-Based Building-Damage Assessment from Satellite Imagery: Perspective from Benchmark xBD Dataset. Remote Sens. 2020, 12, 3808. [Google Scholar] [CrossRef]
- Jane, J. The Death and Life of Great American Cities; Eandom House: New York, NY, USA, 1961. [Google Scholar]
- Rodrigue, J.P.; Comtois, C.; Slack, B. The Geography of Transport Systems; Routledge: London, UK, 2013. [Google Scholar] [CrossRef]
- Zhong, C.; Huang, X.; Müller Arisona, S.; Schmitt, G.; Batty, M. Inferring building functions from a probabilistic model using public transportation data. Comput. Environ. Urban Syst. 2014, 48, 124–137. [Google Scholar] [CrossRef]
- Lu, Z.; Im, J.; Rhee, J.; Hodgson, M. Building type classification using spatial and landscape attributes derived from LiDAR remote sensing data. Landsc. Urban Plann. 2014, 130, 134–148. [Google Scholar] [CrossRef]
- Du, S.; Zhang, F.; Zhang, X. Semantic classification of urban buildings combining VHR image and GIS data: An improved random forest approach. ISPRS J. Photogramm. Remote Sens. 2015, 105, 107–119. [Google Scholar] [CrossRef]
- Hu, Q.; Zhen, L.; Mao, Y.; Zhou, X.; Zhou, G. Automated building extraction using satellite remote sensing imagery. Autom. Constr. 2021, 123, 103509. [Google Scholar] [CrossRef]
- Hoffmann, E.J.; Wang, Y.; Werner, M.; Kang, J.; Zhu, X. Model Fusion for Building Type Classification from Aerial and Street View Images. Remote Sens. 2019, 11, 1259. [Google Scholar] [CrossRef]
- Cerovecki, A.; Gharahjeh, S.; Harirchian, E.; Ilin, D.; Okhotnikova, K.; Kersten, J. Evaluation of Change Detection Techniques using Very High Resolution Optical Satellite Imagery. Preface 2015, 2, 20. [Google Scholar]
- Gašparović, M.; Jogun, T. The effect of fusing Sentinel-2 bands on land-cover classification. Int. J. Remote Sens. 2017, 39, 822–841. [Google Scholar] [CrossRef]
- Ruiz Hernandez, I.E.; Shi, W. A Random Forests classification method for urban land-use mapping integrating spatial metrics and texture analysis. Int. J. Remote Sens. 2017, 39, 1175–1198. [Google Scholar] [CrossRef]
- Zhang, C.; Sargent, I.; Pan, X.; Li, H.; Gardiner, A.; Hare, J.; Atkinson, P.M. An object-based convolutional neural network (OCNN) for urban land use classification. Remote Sens. Environ. 2018, 216, 57–70. [Google Scholar] [CrossRef]
- Haghighattalab, A.; Mohammadzadeh, A.; Zoej, M.J.V. Post-earthquake road damage assessment using region-based algorithms from high-resolution satellite images. Proc. SPIE 2010, 7830, 439–447. [Google Scholar] [CrossRef]
- Belgiu, M.; Tomljenovic, I.; Lampoltshammer, T.J.; Blaschke, T.; Höfle, B. Ontology-based classification of building types detected from airborne laser scanning data. Remote Sens. 2014, 6, 1347–1366. [Google Scholar] [CrossRef]
- Chen, W.; Zhou, Y.; Wu, Q.; Chen, G.; Huang, X.; Yu, B. Urban Building Type Mapping Using Geospatial Data: A Case Study of Beijing, China. Remote Sens. 2020, 12, 2805. [Google Scholar] [CrossRef]
- Ilieva, R.T.; McPhearson, T. Social-media data for urban sustainability. Nat. Sustain. 2018, 1, 553–565. [Google Scholar] [CrossRef]
- Shaw, S.L.; Tsou, M.H.; Ye, X. Editorial: Human dynamics in the mobile and big data era. Int. J. Geog. Inf. Sci. 2016, 30, 1687–1693. [Google Scholar] [CrossRef]
- Zhang, X.; Li, W.; Zhang, F.; Liu, R.; Du, Z. Identifying Urban Functional Zones Using Public Bicycle Rental Records and Point-of-Interest Data. ISPRS Int. J. Geo-Inf. 2018, 7, 459. [Google Scholar] [CrossRef]
- Lin, A.; Sun, X.; Wu, H.; Luo, W.; Wang, D.; Zhong, D.; Wang, Z.; Zhao, L.; Zhu, J. Identifying Urban Building Function by Integrating Remote Sensing Imagery and POI Data. IEEE J. Sel. Top. Appl. Earth Obs. Remote Sens. 2021, 14, 8864–8875. [Google Scholar] [CrossRef]
- Häberle, M.; Hoffmann, E.J.; Zhu, X. Can linguistic features extracted from geo-referenced tweets help building function classification in remote sensing? ISPRS J. Photogramm. Remote Sens. 2022, 188, 255–268. [Google Scholar] [CrossRef]
- Zhong, Y.; Su, Y.; Wu, S.; Zheng, Z.; Zhao, J.; Ma, A.; Zhu, Q.; Ye, R.; Li, X.; Pellikka, P.; et al. Open-source data-driven urban land-use mapping integrating point-line-polygon semantic objects: A case study of Chinese cities. Remote Sens. Environ. 2020, 247, 111838. [Google Scholar] [CrossRef]
- Gong, P.; Chen, B.; Li, X.; Liu, H.; Wang, J.; Bai, Y.; Chen, J.; Chen, X.; Fang, L.; Feng, S.; et al. Mapping essential urban land use categories in China (EULUC-China): Preliminary results for 2018. Sci. Bull. 2020, 65, 182–187. [Google Scholar] [CrossRef]
- Tu, W.; Zhu, T.; Xia, J.; Zhou, Y.; Lai, Y.; Jiang, J.; Li, Q. Portraying the spatial dynamics of urban vibrancy using multisource urban big data. Comput. Environ. Urban Syst. 2019, 80, 101428. [Google Scholar] [CrossRef]
- Pang, X.; Nie, G.; Zhang, X.; Li, H.; Xia, C.; Fan, X.; Wei, B. Selection of earthquake disaster indicators based on cell phone location data. Earthq. Res. China 2019, 35, 144–157. [Google Scholar]
- Gonzalez, M.C.; Hidalgo, C.A.; Barabasi, A.L. Understanding individual human mobility patterns. Nature 2008, 453, 779–782. [Google Scholar] [CrossRef] [PubMed]
- Song, C.; Qu, Z.; Blumm, N.; Barabási, A.L. Limits of predictability in human mobility. Science 2020, 327, 1018–1021. [Google Scholar] [CrossRef]
- Zhai, Y.; Wu, H.; Fan, H.; Wang, D. Using mobile signaling data to exam urban park service radius in Shanghai: Methods and limitations. Comput. Environ. Urban Syst. 2018, 71, 27–40. [Google Scholar] [CrossRef]
- Li, D.; Chen, H.; Shen, W.; Ye, M. An analysis of the temporal and spatial gathering and dispersion patterns of crowds at the community level after the 2020 M5.1 Tangshan Guye earthquake. Int. J. Disaster Risk Reduct. 2021, 61, 102331. [Google Scholar] [CrossRef]
- Xia, C.; Nie, G.; Fan, X.; Zhou, J. Research on the estimation of the real-time population in an earthquake area based on phone signals: A case study of the Jiuzhaigou earthquake. Earth Sci. Inf. 2019, 13, 83–96. [Google Scholar] [CrossRef]
- Montgomery, J. Making a city: Urbanity, vitality and urban design. J. Urban Des. 1998, 3, 93–116. [Google Scholar] [CrossRef]
- Tu, W.; Cao, J.; Yue, Y.; Shaw, S.L.; Zhou, M.; Wang, Z.; Chang, X.; Xu, Y.; Li, Q. Coupling mobile phone and social media data: A new approach to understanding urban functions and diurnal patterns. Int. J. Geo.-Inf. Sci. 2017, 31, 2331–2358. [Google Scholar] [CrossRef]
- Agard, B.; Morency, C.; Trépanier, M. Mining public transport user behaviour from smart card data. In Proceedings of the 12th IFAC Symposium on Information Control Problems in Manufacturing—INCOM 2006, Saint-Etienne, France, 17–19 May 2006. [Google Scholar] [CrossRef]
- Bagchi, M.; White, P.R. The potential of public transport smart card data. Transp. Policy 2005, 12, 464–474. [Google Scholar] [CrossRef]
- Liu, L.; Hou, A.; Biderman, A.; Ratti, C.; Chen, J. Understanding individual and collective mobility patterns from smart card records: A case study in Shenzhen. In Proceedings of the 12th International IEEE Conference on Intelligent Transportation Systems, St. Louis, MI, USA, 3–7 October 2009. [Google Scholar] [CrossRef]
- Park, J.Y.; Kim, D.J.; Lim, Y. Use of smart card data to define public transit use in Seoul⁄ South Korea. Transp. Res. Rec. 2008, 2063, 3–9. [Google Scholar] [CrossRef]
- Harirchian, E.; Lahmer, T.; Rasulzade, S. Earthquake hazard safety assessment of existing buildings using optimized multi-layer perceptron neural network. Energies 2020, 13, 2060. [Google Scholar] [CrossRef]
- Valentijn, T.; Margutti, J.; van den Homberg, M.; Laaksonen, J. Multi-Hazard and Spatial Transferability of a CNN for Automated Building Damage Assessment. Remote Sens. 2020, 12, 2839. [Google Scholar] [CrossRef]
- Kavzoglu, T.; Colkesen, I. A kernel functions analysis for support vector machines for land cover classification. Int. J. Appl. Earth Obs. Geoinf. 2009, 11, 352–359. [Google Scholar] [CrossRef]
- Kranjčić, N.; Medak, D.; Župan, R.; Rezo, M. Support Vector Machine Accuracy Assessment for Extracting Green Urban Areas in Towns. Remote Sens. 2019, 11, 655. [Google Scholar] [CrossRef]
- Breiman, L. Random forests. Mach. Learn. 2001, 45, 5–32. [Google Scholar] [CrossRef]
- Belgiu, M.; Drăguţ, L. Random forest in remote sensing: A review of applications and future directions. ISPRS J. Photogramm. Remote Sens. 2016, 114, 24–31. [Google Scholar] [CrossRef]
- Haklay, M. How good is volunteered geographical information? A comparative study of OpenStreetMap and ordnance survey datasets. Environ. Plan. B 2014, 37, 682–703. [Google Scholar] [CrossRef]
- Hong, Y.; Yao, Y. Hierarchical community detection and functional area identification with OSM roads and complex graph theory. Int. J. Geog. Inf. Sci. 2019, 33, 1569–1587. [Google Scholar] [CrossRef]
- Li, X.; Wang, L.; Cheng, Q.; Wu, P.; Gan, W.; Fang, L. Cloud removal in remote sensing images using nonnegative matrix factorization and error correction. ISPRS J. Photogramm. Remote Sens. 2019, 148, 103–113. [Google Scholar] [CrossRef]
- Zhu, Z.; Wang, S.; Woodcock, C.E. Improvement and expansion of the Fmask algorithm: Cloud, cloud shadow, and snow detection for Landsats 4–7, 8, and Sentinel 2 images. Remote Sens. Environ. 2015, 159, 269–277. [Google Scholar] [CrossRef]
- Zhang, Y.; Qin, K.; Bi, Q.; Cui, W.; Li, G. Landscape patterns and building functions for urban land-use classification from remote sensing images at the block level: A case study of Wuchang district, Wuhan, China. Remote Sens. 2020, 12, 1831. [Google Scholar] [CrossRef]
- Ratti, C.; Richens, P. Urban texture analysis with image processing techniques. In Proceedings of the Eighth International Conference on Computer Aided Architectural Design Futures held at Georgia Institute of Technology, Atlanta, GA, USA, 7–8 June 1999. [Google Scholar] [CrossRef]
- Pesaresi, M. Texture Analysis for Urban Pattern Recognition Using Fine-resolution Panchromatic Satellite Imagery. Geogr. Environ. Model 2000, 4, 43–63. [Google Scholar] [CrossRef]
- Dekker, R.J. Texture analysis and classification of ERS SAR images for map updating of urban areas in the Netherlands. IEEE Trans. Geosci. Remote Sens. 2003, 41, 1950–1958. [Google Scholar] [CrossRef]
- Duque, J.C.; Patino, J.E.; Ruiz, L.A.; Pardo-Pascual, J.E. Measuring intra-urban poverty using land cover and texture metrics derived from remote sensing data. Landsc. Urban Plann. 2015, 135, 11–21. [Google Scholar] [CrossRef]
- Haralick, R.M.; Shanmugam, K.; Dinstein, I. Textural Features of Image Classification. IEEE Trans. Syst. Man Cybern. 1973, 3, 610–621. [Google Scholar] [CrossRef]
- Anys, H.; Bannari, A.; He, D.; Morin, D. Cartographie des zones urbaines a l’aide des images aeroportees MEIS-II. Int. J. Remote Sens. 1998, 19, 883–894. [Google Scholar] [CrossRef]
- Breiman, L. Bagging predictors. Mach. Learn. 1996, 24, 123–140. [Google Scholar] [CrossRef]
- Rodriguez-Galiano, V.F.; Ghimire, B.; Rogan, J.; Chica-Olmo, M.; Rigol-Sanchez, J.P. An assessment of the effectiveness of a random forest classifier for land-cover classification. ISPRS J. Photogramm. Remote Sens. 2012, 67, 93–104. [Google Scholar] [CrossRef]
- Hughes, G. On the mean accuracy of statistical pattern recognizers. IEEE Trans. Inf. Theory 1968, 14, 55–63. [Google Scholar] [CrossRef]
- Adelabu, S.; Mutanga, O.; Adam, E. Evaluating the impact of red-edge band from Rapideye image for classifying insect defoliation levels. ISPRS J. Photogramm. Remote Sens. 2014, 95, 34–41. [Google Scholar] [CrossRef]
- Xia, C.; Nie, G.; Fan, X.; Zhou, J.; Pang, X. Research on the application of mobile phone location signal data in earthquake emergency work: A case study of Jiuzhaigou earthquake. PLoS ONE 2019, 14, e0215361. [Google Scholar] [CrossRef]


| Sentinel-2 Bands | Central Wavelength (nm) | Bandwidth (nm) | Spatial Resolution (m) |
|---|---|---|---|
| Band 1—Coastal aerosol | 443 | 20 | 60 |
| Band 2—Blue | 490 | 65 | 10 |
| Band 3—Green | 560 | 35 | 10 |
| Band 4—Red | 665 | 30 | 10 |
| Band 5—Vegetation Red Edge | 705 | 15 | 20 |
| Band 6—Vegetation Red Edge | 740 | 15 | 20 |
| Band 7—Vegetation Red Edge | 783 | 20 | 20 |
| Band 8—NIR | 842 | 115 | 10 |
| Band 8A—Vegetation Red Edge | 865 | 20 | 20 |
| Band 9—Water vapour | 945 | 20 | 60 |
| Band 10—SWIR—Cirrus | 1375 | 30 | 60 |
| Band 11—SWIR | 1610 | 90 | 20 |
| Band 12—SWIR | 2190 | 180 | 20 |
| Authors | Function Types |
|---|---|
| [2] | Residential, urban villages, office, shopping centers, hotels, hospitals, schools |
| [3] | The mixed type of office, residential, recreation, shopping |
| [4] | Residential, commercial, office, warehouse, public service, mixed-function |
| [17] | Commercial, residential, public, industrial |
| [24] | Hospital, hotel, office, residence, restaurant, retail, school |
| Function Type | OSM Types | Supplemented by Gaode |
|---|---|---|
| Residential (R) | Residential, apartments, dormitory, hotel, house | College/university dormitory |
| Working (W) | Office, company, industrial, school, kindergarten, warehouse | Bank, financial center, office, Factory, teaching building |
| Entertainment (E) | Retail | Shopping mall, cinema, bar |
| Visiting (V) | Church, parking, place of interest | museum, gallery |
| Hospital (H) | Hospital | Clinic, medical treatment |
| Name | Calculation formula |
|---|---|
| Normalized difference built-up index | NDBI = (B11 − B8)/(B11 + B8) |
| Modified normalized difference water index | MNDWI = (B3 − B11)/(B3 + B11) |
| Normalized difference vegetation index | NDVI = (B8 − B4)/(B8 + B4) |
| Tasseled cap brightness | TCB = 0.3510·B2 + 0.3813·B3 + 0.3437·B4 + 0.7196·B8 + 0.2396·B11 + 0.1949·B12 |
| Tasseled cap greenness | TCG = −0.3599·B2 − 0.3533·B3 − 0.4737·B4 + 0.6633·B8 + 0.0087·B11 − 0.2856·B12 |
| Tasseled cap wetness | TCW = 0.2578·B2 + 0.2305·B3 + 0.0883·B4 + 0.1071·B8 − 0.7611·B11 − 0.5308·B12 |
| Texture Feature | Calculation Formula |
|---|---|
| Mean | |
| Variance | |
| Homogeneity | |
| Contrast | |
| Dissimilarity | |
| Entropy | |
| Second Moment | |
| Correlation |
| Residential | Working | Entertainment | Visiting | Hospital | UA (%) | OA (%) | |
|---|---|---|---|---|---|---|---|
| Residential | 89 | 6 | 3 | 2 | 1 | 88.12 | 84.89 |
| Working | 6 | 36 | 2 | 2 | 4 | 72.00 | |
| Entertainment | 1 | 0 | 11 | 1 | 0 | 84.62 | |
| Visiting | 1 | 2 | 1 | 49 | 1 | 90.74 | |
| Hospital | 0 | 1 | 0 | 0 | 6 | 85.71 | |
| PA (%) | 91.75 | 80.00 | 64.70 | 90.74 | 50.00 |
| Residential | Working | Entertainment | Visiting | Hospital | UA (%) | OA (%) | |
|---|---|---|---|---|---|---|---|
| Residential | 78 | 7 | 6 | 1 | 3 | 82.11 | 84.89 |
| Working | 3 | 50 | 4 | 2 | 1 | 83.33 | |
| Entertainment | 1 | 1 | 10 | 2 | 0 | 71.43 | |
| Visiting | 1 | 2 | 0 | 50 | 0 | 94.34 | |
| Hospital | 0 | 0 | 0 | 0 | 3 | 100.00 | |
| PA (%) | 93.98 | 83.33 | 50.00 | 90.90 | 42.86 |
| Residential | Working | Entertainment | Visiting | Hospital | UA (%) | OA (%) | |
|---|---|---|---|---|---|---|---|
| Residential | 71 | 10 | 4 | 4 | 3 | 77.17 | 73.33 |
| Working | 9 | 41 | 9 | 3 | 3 | 63.08 | |
| Entertainment | 1 | 6 | 4 | 0 | 0 | 36.36 | |
| Visiting | 2 | 3 | 3 | 48 | 0 | 85.71 | |
| Hospital | 0 | 0 | 0 | 0 | 1 | 100.00 | |
| PA(%) | 85.54 | 68.33 | 20.00 | 87.27 | 14.29 |
Publisher’s Note: MDPI stays neutral with regard to jurisdictional claims in published maps and institutional affiliations. |
© 2022 by the authors. Licensee MDPI, Basel, Switzerland. This article is an open access article distributed under the terms and conditions of the Creative Commons Attribution (CC BY) license (https://creativecommons.org/licenses/by/4.0/).
Share and Cite
Nie, W.; Fan, X.; Nie, G.; Li, H.; Xia, C. Building Function Type Identification Using Mobile Signaling Data Based on a Machine Learning Method. Remote Sens. 2022, 14, 4697. https://doi.org/10.3390/rs14194697
Nie W, Fan X, Nie G, Li H, Xia C. Building Function Type Identification Using Mobile Signaling Data Based on a Machine Learning Method. Remote Sensing. 2022; 14(19):4697. https://doi.org/10.3390/rs14194697
Chicago/Turabian StyleNie, Wenyu, Xiwei Fan, Gaozhong Nie, Huayue Li, and Chaoxu Xia. 2022. "Building Function Type Identification Using Mobile Signaling Data Based on a Machine Learning Method" Remote Sensing 14, no. 19: 4697. https://doi.org/10.3390/rs14194697
APA StyleNie, W., Fan, X., Nie, G., Li, H., & Xia, C. (2022). Building Function Type Identification Using Mobile Signaling Data Based on a Machine Learning Method. Remote Sensing, 14(19), 4697. https://doi.org/10.3390/rs14194697