1. Introduction
Since the Operational Linescan System (OLS) was issued and used by the Defense Meteorological Satellite Program (DMSP) in the 1970s, the stable nighttime light images have been widely used for monitoring socio-economic development [
1,
2,
3], urban development [
4,
5], natural disasters [
6,
7], environmental quality [
8], and the effects of war and disease in regional scales [
9,
10]. Although DMSP is not a professional nighttime light remote sensing satellite, it has the advantages of providing high spatial resolution (1km × 1km), long-period (1992–2013), and global spatial coverage data. Compared with traditional statistical data, DMSP is time-sensitive and economical to serve as an ideal data source for related studies. The first application of DMSP-OLS nighttime light data was reported by Elvidge et al., who used the DMSP-OLS nighttime light data to obtain the lit area and explored the development potential of nighttime light data in estimating socio-economic parameters [
11]. Since then, nighttime light images have been widely used in social, environmental, and economic fields [
12,
13,
14]. Furthermore, nighttime light images were inherently associated with human activity and urban development. In recent years as the quality of nighttime light images responding to urban evolution improved, DMSP-OLS nighttime light data has been widely applied to monitor urbanization [
15,
16,
17].
However, previous studies found that long time series DMSP/OLS nighttime light data has poor continuity and stability at spatial and temporal scales [
18,
19]. Additionally, the uncalibrated processed data are not directly comparable [
20,
21]. Currently, the DMSP/OLS data have the following drawbacks:
Due to the lack of spaceborne radiant calibration of the OLS sensor, the total DN value of lit pixels in consecutive years obtained by the same sensor has abnormal fluctuation. There are many unstable lit pixels between images in the same sensor in successive years [
22,
23].
As the performance of sensors degrades over time and the image acquisition is interfered with by many factors, the total DN values of lit pixels obtained by different sensors in the same year are different, and the DN values of lit pixels at the same location are different [
24,
25].
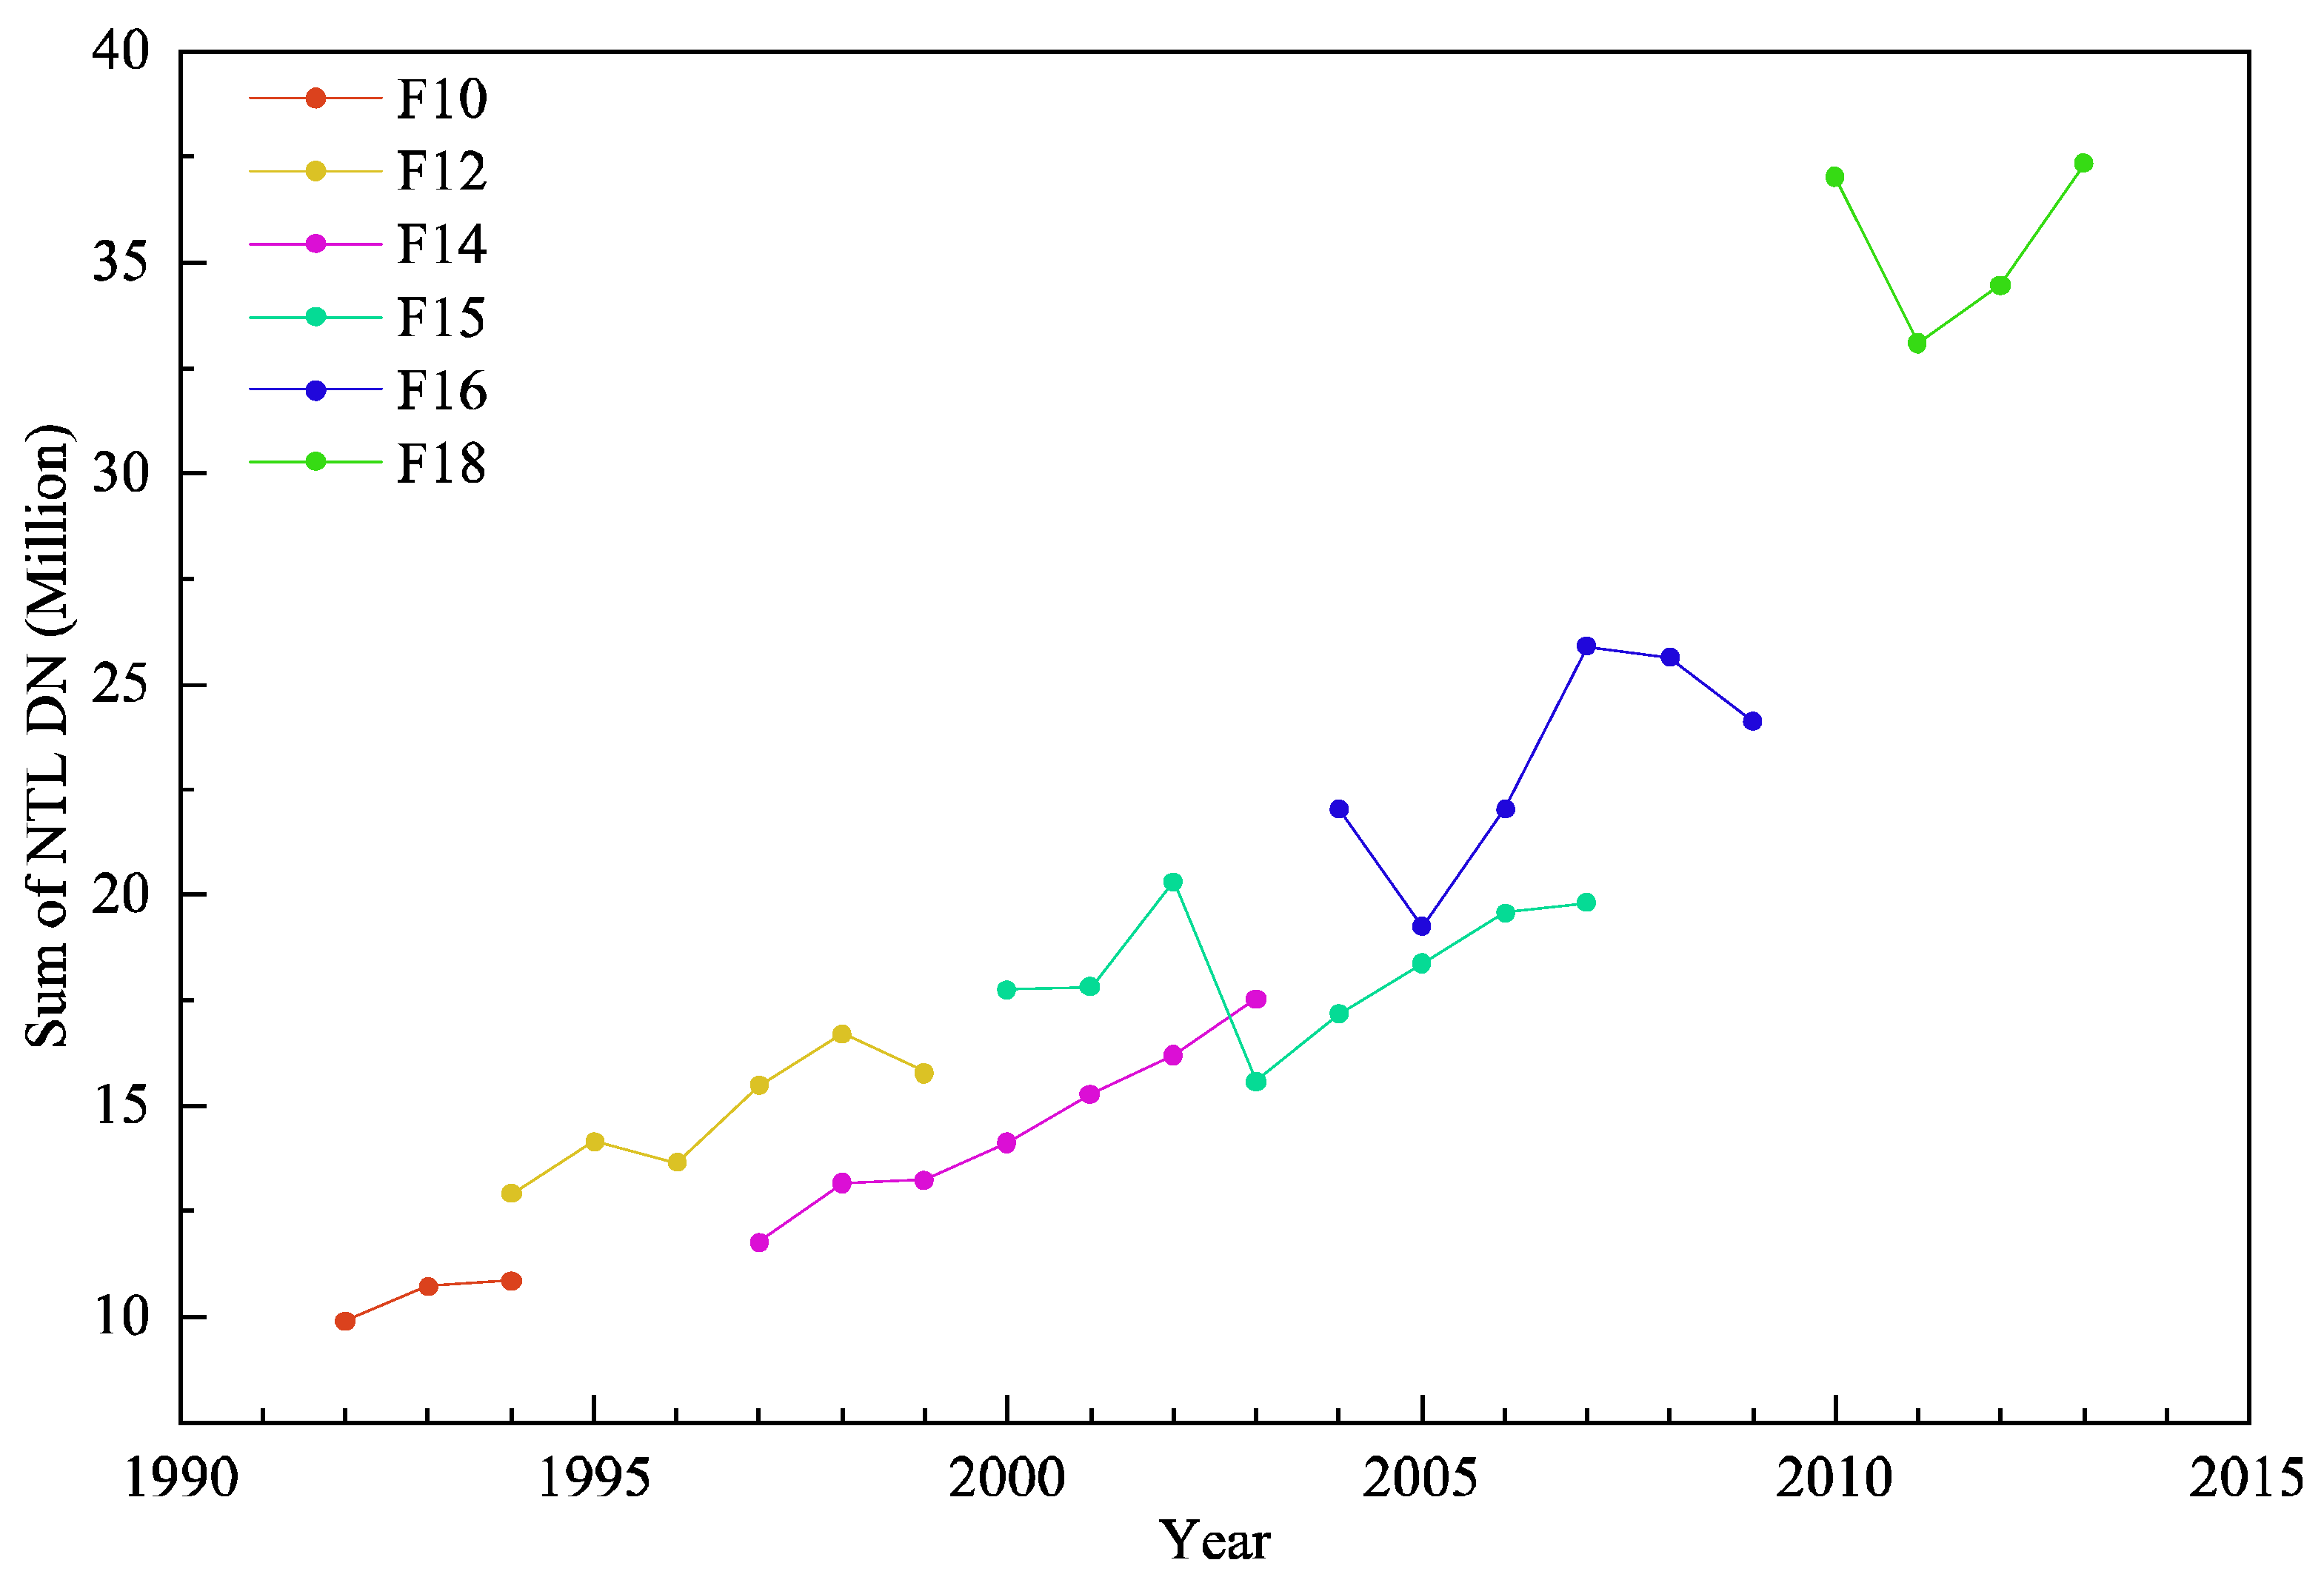
The long time series DMSP-OLS images of 34 periods are obtained from 6 sensors (F10–F18). The differences in detection performance of different sensors lead to inconsistent and poor data continuity between various sensors and large fluctuations and poor data stability within their respective sensors. These make the data incomparable among years [
26].
Given the above problems of DMSP/OLS data, various methods such as inter-sensor mutual calibration, intra-sensor continuity calibration, and inter-annual calibration have been proposed to obtain a long time series of nighttime light image sets with higher accuracy, better continuity, and stability. The invariant target region method proposed by Elvidge et al. applies to the calibration of nighttime light images on a global scale [
23]. As the most commonly used method in the nighttime light data calibration, this method corrects the nighttime light images by selecting certain fixed regions as the invariant target region and defaulting the DN value of its lit pixel does not result in change in the time sequence. Since then, scholars have derived many improved methods at regional and field scales [
21,
27]. Nevertheless, the DN value of lit pixels in certain fixed regions cannot remain unchanged during a long time series according to the law of urbanization development. For studies in the same region, scholars choose the invariant target region differently, making the calibrated nighttime light data results differ significantly [
5,
25].
Since then, Liu et al. proposed a new method for nighttime light image calibration in China by referring to the invariant target region method and effectively reducing the anomalous differences of stable lit pixels [
5]. This method is widely used in urban expansion monitoring [
28]. However, it has been shown that the nighttime light data obtained from this method does not correlate well with GDP, leading to low efficiency in explaining social economy and urbanization [
29]. Li et al. proposed a stepwise calibration method to make the nighttime light dataset more consistent with temporal trends by systematically improving the underestimation and overestimation of the nighttime light images in specific satellites and years [
21]. The nighttime light time series curves processed by this method have apparent advantages in correlation with socio-economic parameters. Still, the stepwise calibration method calibrates for the global scale, and the application effect of the regional scale is insignificant. Currently, the calibration research of nighttime light data focuses on improving the calibrated data quality.
Several drawbacks limit the development of the relevant research to a certain extent, for example, apparent inconsistency of the data results after calibration by different calibration methods. Therefore, we proposed an improved stepwise calibration (ISC) method to calibrate all the nighttime light images of Chinese regions to overcome these drawbacks. Meanwhile, we applied this method to construct the 1992–2013 Chinese regional DMSP-OLS nighttime light calibration image set with higher accuracy, efficiency, and consistency. This method provides possibilities to understand the development of small- and medium-sized nighttime light centers such as towns and villages from a nighttime light perspective and facilitates the explanation of the deeper reasons affecting socio-economic development. Our study could provide new implications for many fields, such as social economy, urban development, public safety, energy and environmental protection, and ecological environment management.
3. Methods
In this study, two principles were followed when we pre-processed the DMSP-OLS nighttime light data: (1) the lit pixels in the previous year’s image should remain lit at the same position as the following year’s image. Additionally, the DN values of lit pixels in the last year should not be greater than the DN value of lit pixels at the same position in the next year [
25]. (2) The lit pixels of the same year acquired by different sensors should be consistent in quantity, geographical location, and the DN value of the same pixel [
5,
22]. If the above two principles are not satisfied, it is considered an instable lit pixel with abnormal nighttime light in the DN value. The flowchart of the improved stepwise calibration (ISC) method is shown in
Figure 2.
The flowchart clearly shows the ISC data processing flow. Step 3 is the key to the whole calibration process. From the perspective of numerical constancy, we propose the constant lit pixels method to perform the hybrid calibration for F16. This is the core of the ISC method. The calibrated nighttime light data retain the most abundant and complete information in the original data. The time series curves have better stability and continuity, and the trend was more consistent. The following subsections describe each step of the ISC method in detail.
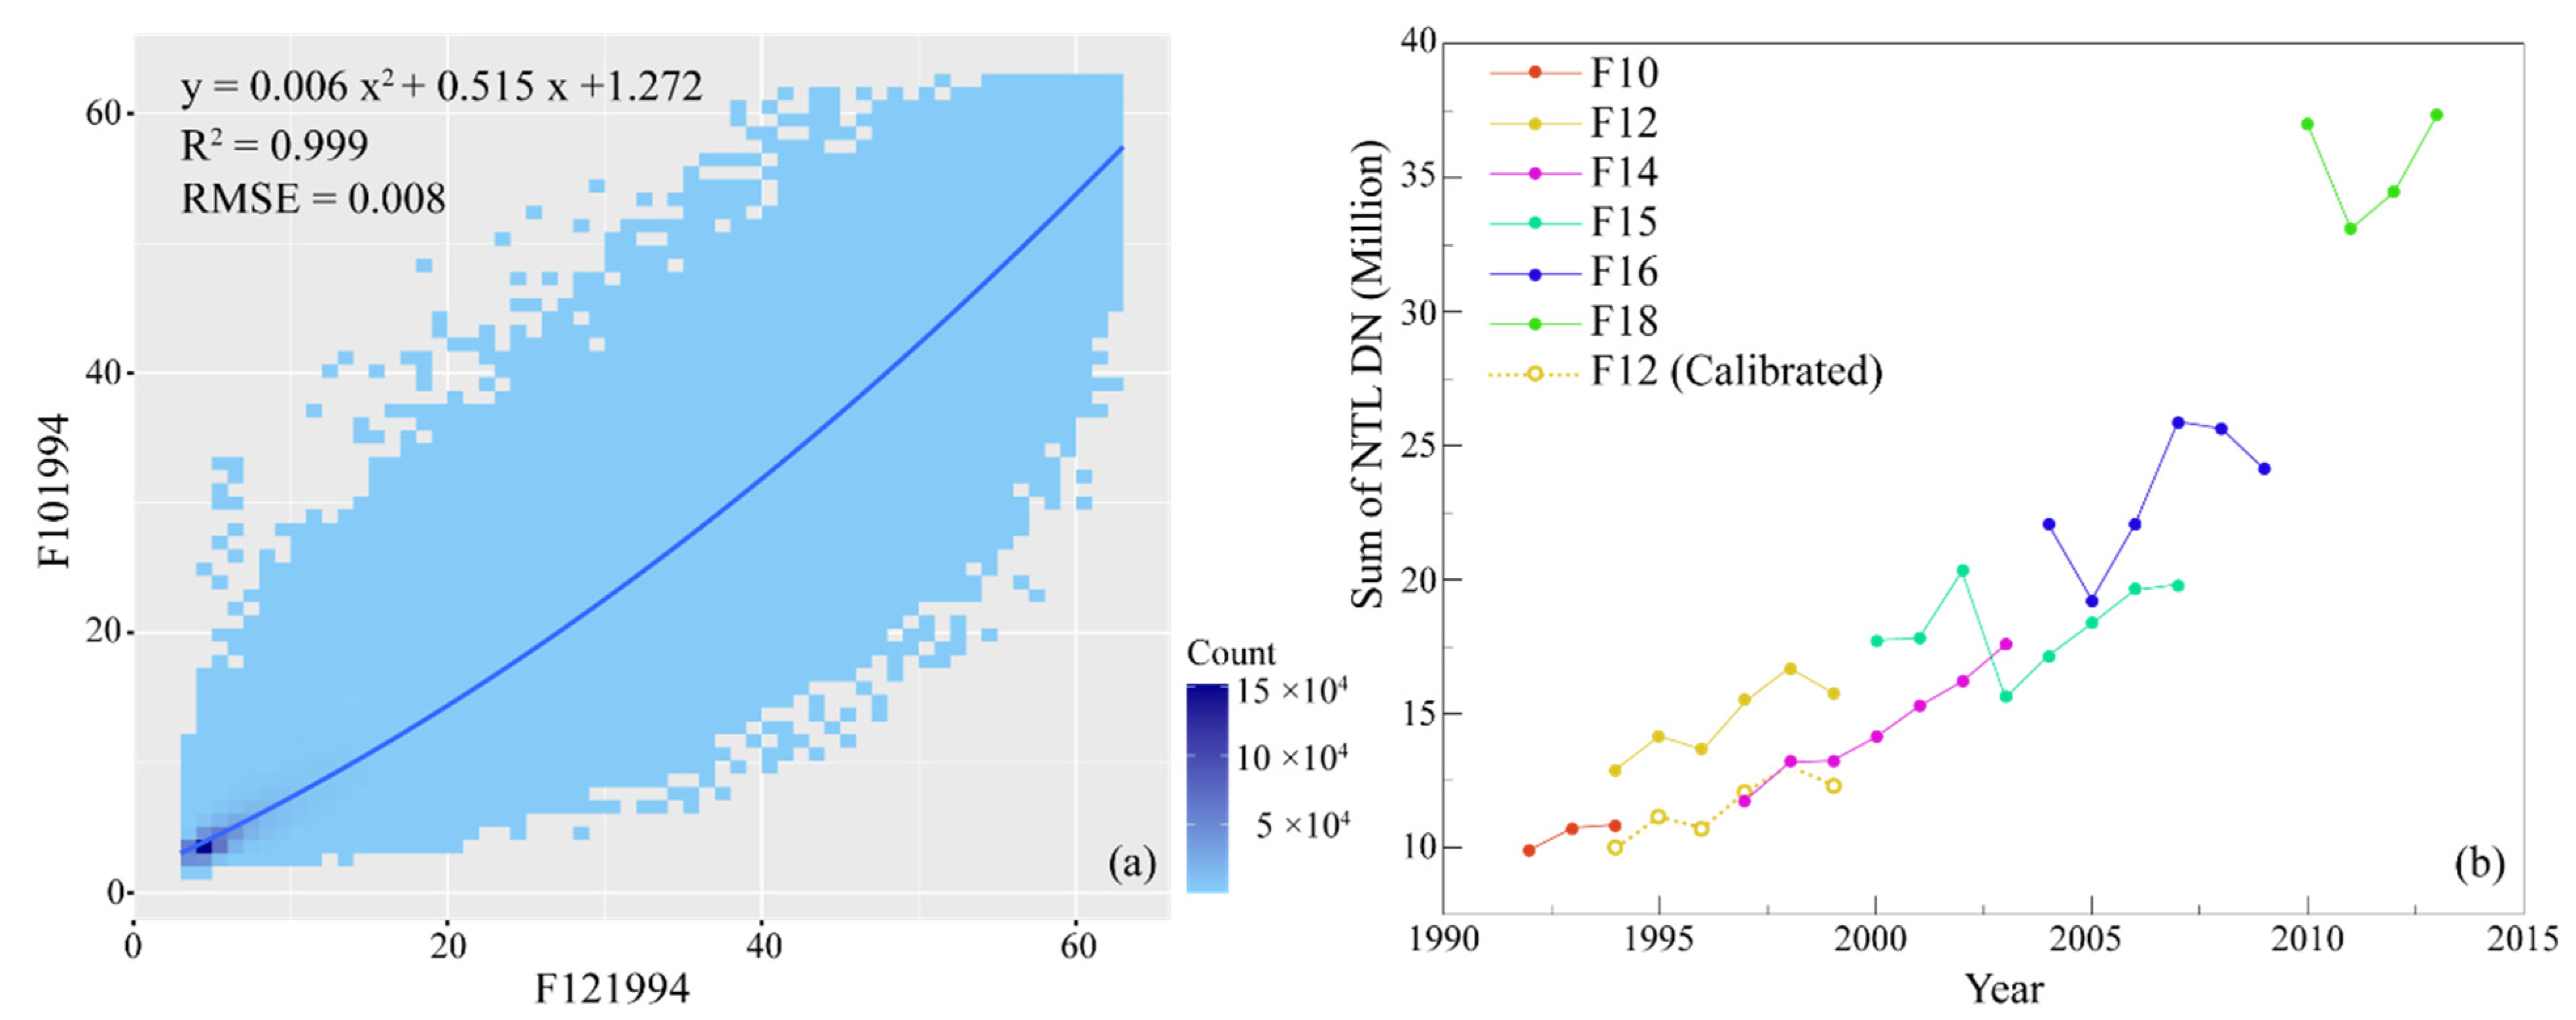
3.1. Step 1: Systematic Calibration of F12
First, we adjusted the systematic overestimation of F12 so that the trend of the total DN value of lit pixels was consistent with that of F10 and F14. Here, we assumed that the total DN values of lit pixels of F10 and F14 were reliable for several reasons: (1) from the acquisition years of F10 and F12, there are no other overlapping years except 1994, which is the last year of F10 sensor operation and the first year of F12 sensor operation, respectively. If the F10 and F12 sensors are used as the reference to reconstruct the nighttime light time-series curves, the system consistency is inevitably limited, and high inconsistency between F10 and F12 can be expected [
27]; (2) the variation trend of the total DN value of F14 lit pixels is more stable and less volatile than that of F12 lit pixels. Thus, F10 and F14 were selected as the calibration benchmarks to align with the actual changes in nighttime light.
In the study of mutual calibration, we adopted backwards calibration in the calibration process, considering the degradation of the sensors’ performance. The backward calibration of F12 using F10 obtained the minimum error and made the total DN values of lit pixels between F12 and F14 closer after calibration. If F14 was used for forwarding correction of F12, the total DN values of the calibrated F12 lit pixels were much higher than that of F10 in 1994, resulting in poor data continuity. To sum up, we used a second-order regression model to construct the relationship between F10 and F12, as shown in Equation (1):
where
DNref and
DN represent the DN value of lit pixels derived from F10 and F12, respectively;
a,
b, and
c are the fitting parameters of the second-order regression model. The obtained fitting parameter and the variation trend of the total DN value of calibrated lit pixels are shown in
Figure 3.
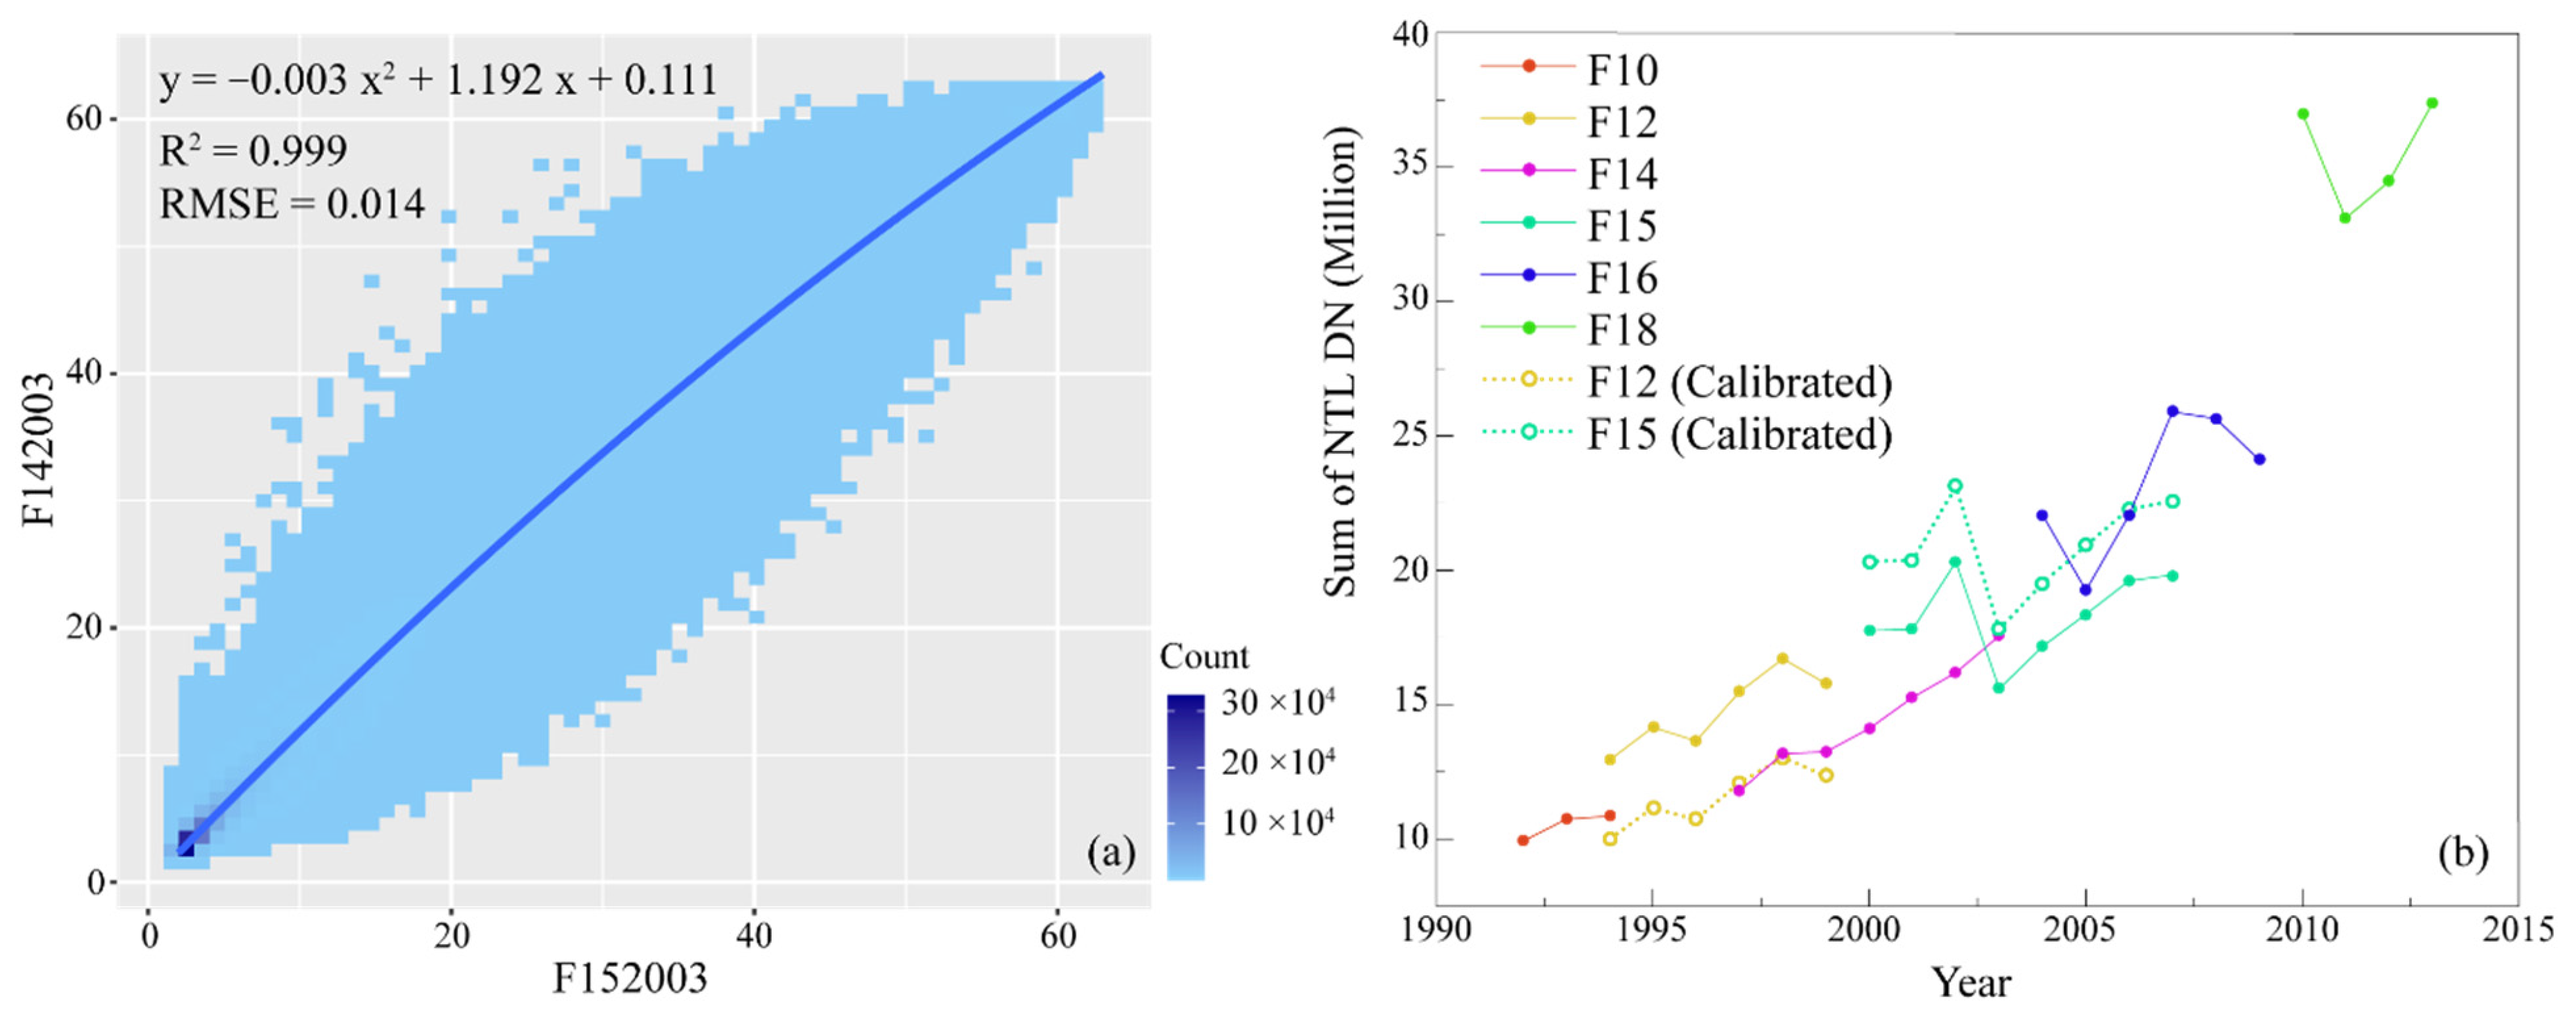
3.2. Step 2: F14-Based F15 Inter-Calibration
Compared with the overlapping years of F14, we found that the variation trend of the total DN value of F15 lit pixels was volatile before 2003 (
Figure 1), and abnormal data fluctuations led to poor availability in F152000–2002. Furthermore, the total DN values of F152003–2007 lit pixels were systematically underestimated [
5]. In order to maintain consistency with the trend of nighttime light changes during the historical period, we constructed a second-order regression model using the DN values of the lit pixels of F142003 and F152003. The DN values of the lit pixels with the minimum mutual error among the overlapping years were used as the calibration benchmark, and the obtained model fitting parameters were used to calibrate the systematic underestimation in the F15 back-end data (2003–2007). The obtained fitting parameters and the variation trend of the total DN value of calibrated lit pixels are shown in
Figure 4.
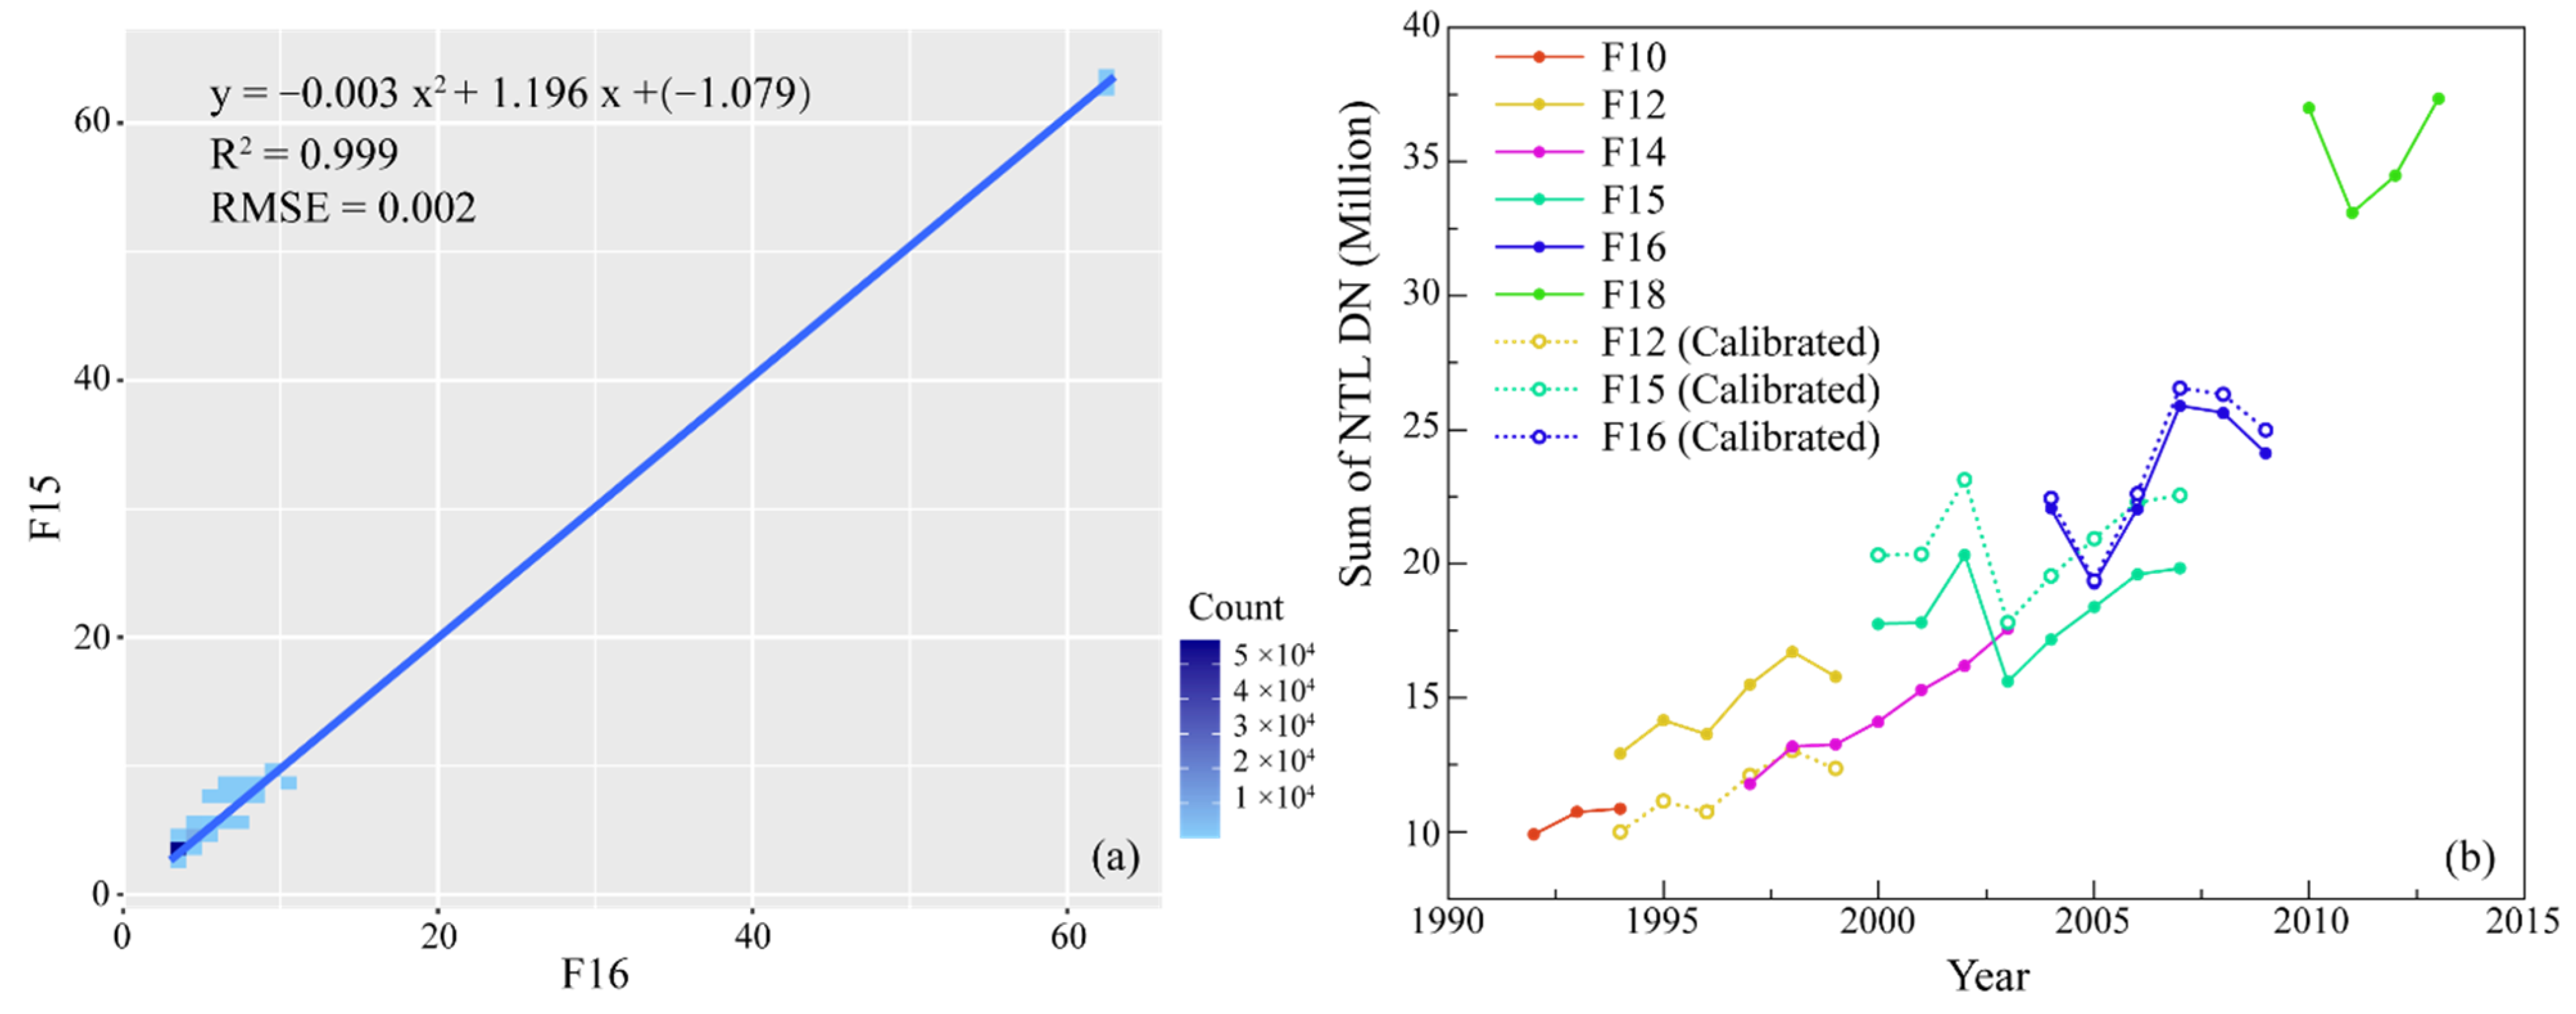
3.3. Step 3: A Hybrid Calibration of F16
Observing the trend of the total DN value of F16 lit pixels, we found no apparent consistency. The data within the sensor fluctuates greatly and has poor stability, making it challenging to fully utilize the F16 data for calibration. It was observed that there were apparent abnormal fluctuations in F162008–2009. So, it was necessary to calibrate the data for these two years. Therefore, we proposed the constant lit pixels method for calibration, which was different from the screening method of the invariant target region method. The invariant target region method uses the DN value of lit pixels in the region that does not change with time as the base for correction. This method is a theoretical constant method. However, this method has some drawbacks, since it is impossible for the DN value of lit pixels in certain fixed regions selected as an invariant target region to have no luminance variation in the study of long time series. In this paper, we used the constant lit pixels regions for many years as the invariant target region from the perspective of numerical constancy.
First, we extracted the calibrated F152003–2007 to calculate the variance. All lit pixel regions with zero variance and non-zero total DN values were considered invariant target regions I. We repeated the above steps to extract the calibrated F162005–2007 and calculate the variance. After calculating the variance, the lit pixel regions were considered invariant regions II according to the above discriminant rule. After that, the invariant target regions I and II were intersected to obtain a constant lit pixel region between different sensors for many years, regarded as the invariant target regions III.
Using the invariant target regions III as the boundary, we extracted F152005–2007 obtained by steps 2 and F162005–2007, respectively. The total DN values of the above lit pixels were introduced into the second-order regression model as the calibration benchmark to obtain the fitting parameters by inversion. These parameters were applied to the calibration of F162008–2009. The obtained fitting parameter and the variation trend of the total DN value of calibrated lit pixels are shown in
Figure 5.
3.4. Step 4: F182010 Calibration Using the Constant Lit Pixels Method
Observing the variation trend of the total DN value of F18 lit pixels, we found anomalous overestimation in 2010. Moreover, previous studies also found many deviations and noises in the 2010 nighttime light image [
24]. Therefore, F182010 is considered an anomalous observation in this paper. Only the anomalous overestimation of F182010 needed to be corrected, and the data for the remaining years remained unchanged. Using the invariant target regions III as the boundary, we used the constant lit pixels method to extract F162009 obtained from steps 3 and F182010. After that, the total DN values of the above two lit pixels were introduced into the second-order regression model as the calibration benchmark to obtain the fitting parameters by inversion. Then, we applied these parameters to the correction of F182010. The obtained fitting parameter and the variation trend of the total DN value of calibrated lit pixels are shown in
Figure 6.
3.5. Step 5: Long Time Series Nighttime Light Dataset Reconstruction and Continuity Calibration
In order to ensure that the corrected nighttime light brightness is ever-increasing, we launched a comprehensive screening of the data to obtain a new nighttime light dataset. This dataset consisted of F10, corrected F121995–1996, F14, corrected F152004–2007, corrected F162008–2009, corrected F182010, and F182011–2013, as shown in
Figure 7.
According to the two principles in the method, combined with the relationship between the development of urbanization and the nighttime light brightness in China, we found that the reconstructed nighttime light data set did not conform to the principles for some years. In order to ensure the continuity and stability of the reconstructed nighttime light dataset, the continuity calibration at the pixel scale was performed as in Equation (2):
where
n = 1992, 1993, ..., 2011, 2012;
DNn is the total DN value of lit pixels in the previous year; and
DNn+1 is the total DN value of lit pixels in the following year. The Chinese regional DMSP-OLS satellite long time series nighttime light reconstruction dataset based on the ISC method was obtained, as shown in
Figure 8.
4. Results
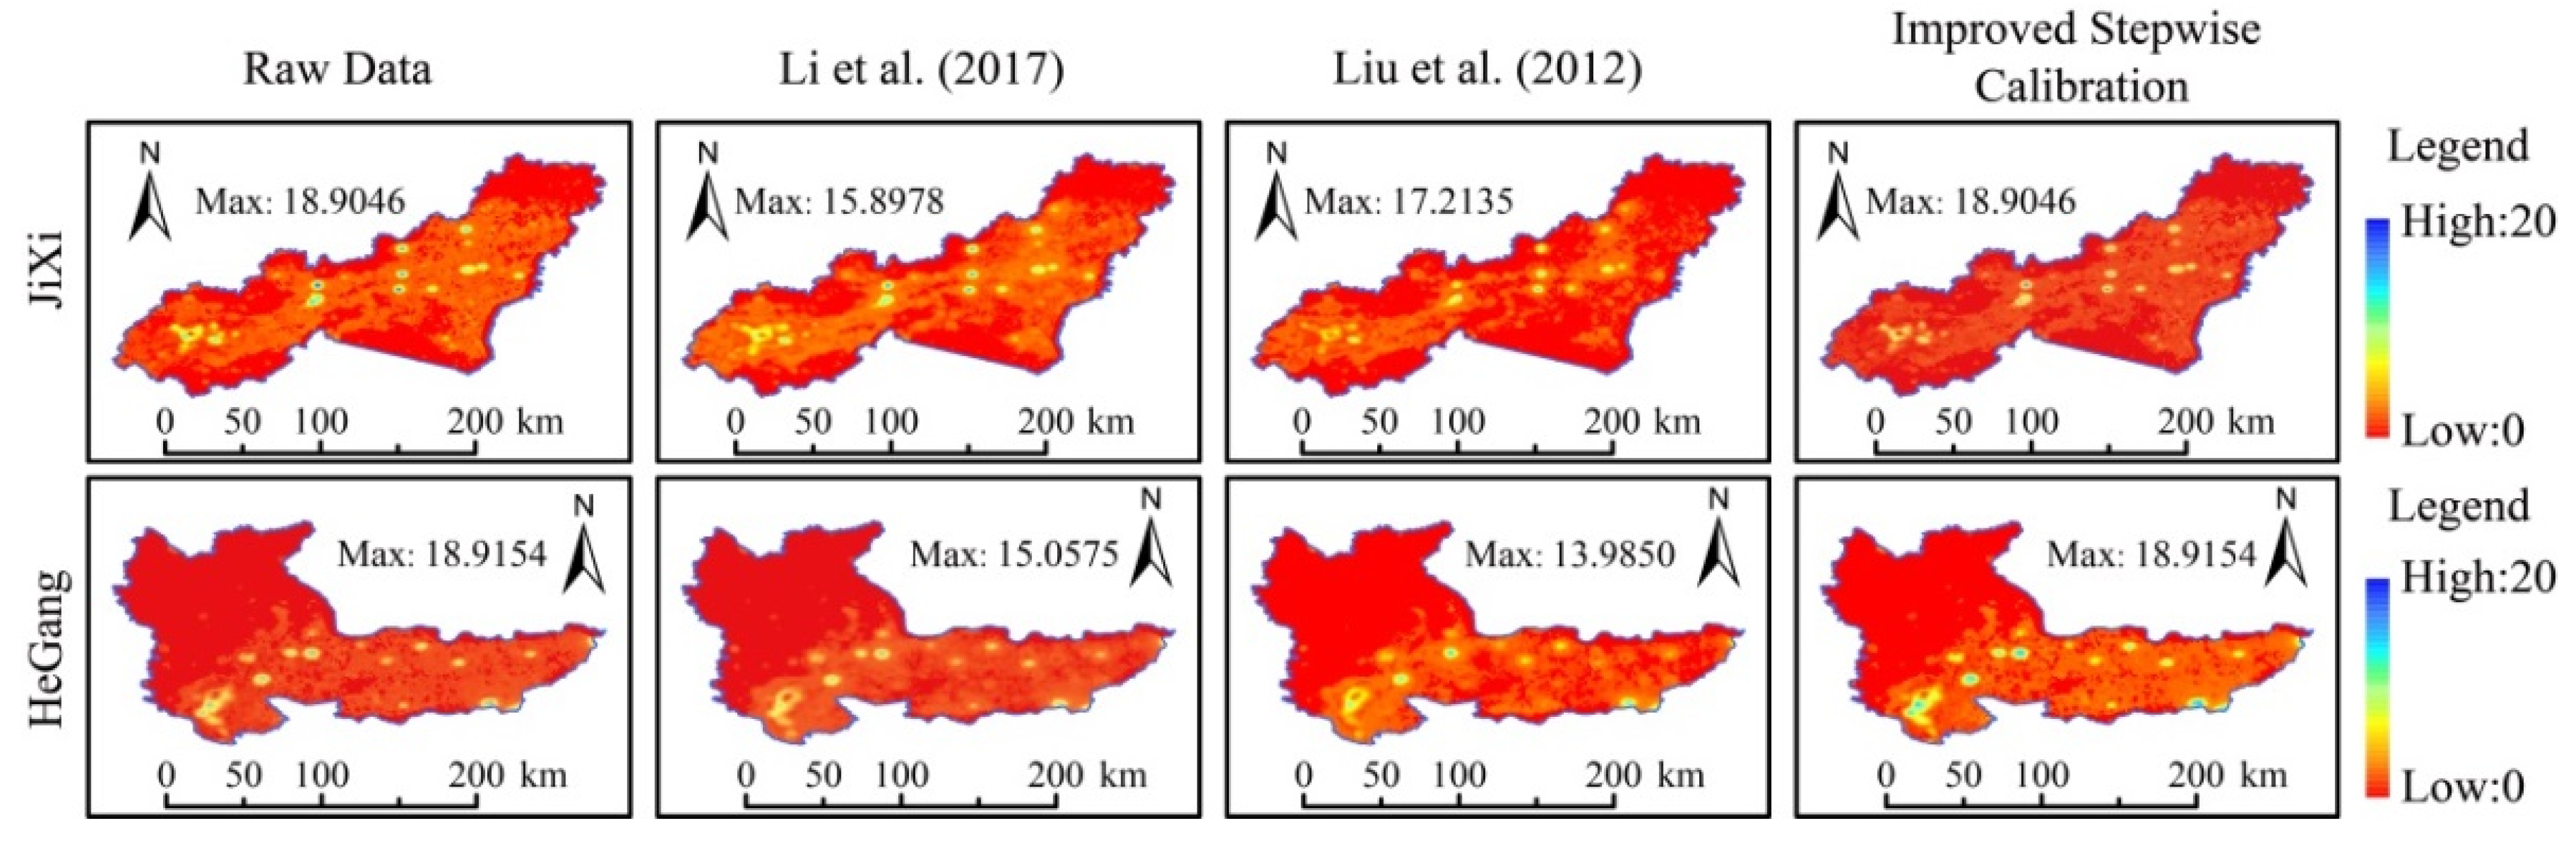
4.1. Analysis of the Differences in Calibration Methods in a Traditional Invariant Target Region
Many studies of nighttime light calibration often chose Sicily, Italy, as the invariant target region for the global scale, and Jixi or Hegang City was frequently selected as the invariant target region for the Chinese regional scale [
21,
27]. Therefore, we selected Jixi and Hegang cities as the traditional invariant target regions to analyze the differences in calibration methods. In order to analyze the differences between the constant lit pixels method (using in ISC method) and the invariant target region method (Liu et al. & Li et al.), we performed a full-time series comparison of the global-scale correction method, the Chinese regional-scale correction method, and the improved stepwise calibration (ISC) method [
5,
21]. In this paper, the global-scale correction method and the Chinese regional-scale correction method were proposed by Li et al. and Liu et al., respectively [
5,
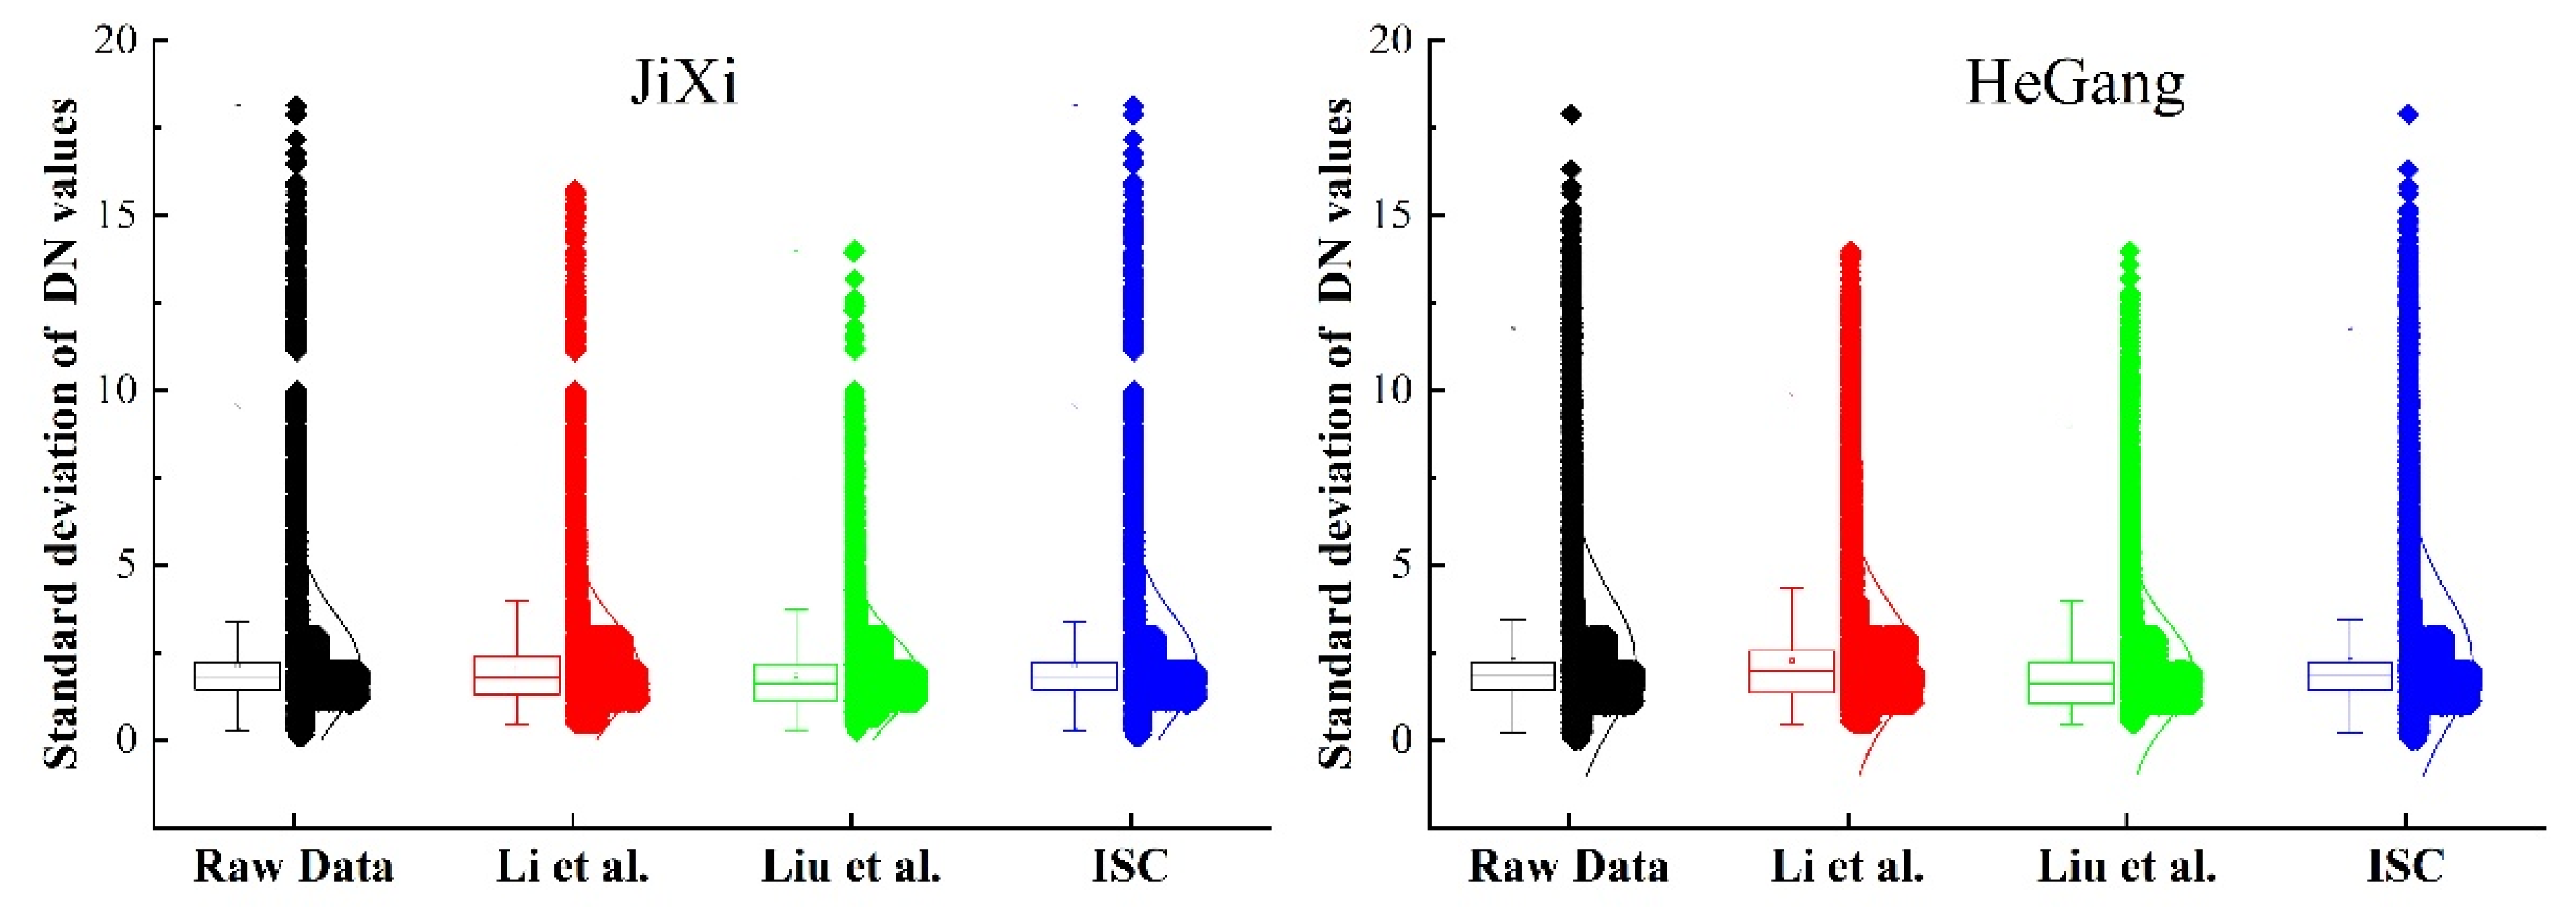
21]. We used the standard deviation maps to show the advantages and disadvantages of each calibration method. The results are shown in
Figure 9 and
Figure 10.
The maximum standard deviation of the global-scale correction method (Li et al.) was lower than that of the regional-scale correction method (Liu et al. & ISC method), suggesting that the regional-scale correction method performed better in preserving nighttime light variability over a long time. The maximum standard deviation of the ISC method was consistent with the original data and greater than the other two correction methods at the same regional scale. Moreover, the ISC method can maintain the temporal variability of nighttime light variation over many years to the greatest extent. This variability not only performed well in the sharply varying high-light regions but responded much better than other correction methods in the low-light regions. Overall, the ISC method responded significantly better to the low-light regions, confirming that nighttime light brightness changed between 1992 and 2013 in Jixi and Hegang cities. Therefore, we believed it was undesirable to assume that the nighttime light brightness of certain fixed regions is constant in a long time series study.
In summary, the constant lit pixels method used in the ISC method was more scientific than the invariant target region method in screening stable lit pixels. The reconstructed multi-year nighttime light variation curve was more suitable for the development reality of the urbanization process in China. Regardless of the global or regional scale, the ISC method using the constant lit pixels method was better than other existing correction methods using the invariant target region method. Therefore, the selection of certain fixed regions as the invariant target region should be carefully considered when correcting nighttime light data in the future to prevent unsatisfactory research results caused by data correction errors.
4.2. Analysis of Multi-Year Nighttime Light Variation Characteristics in Typical Cities
In order to better demonstrate regional spatial heterogeneity, we took the four most representative cities in China (Beijing, Shanghai, Guangzhou, and Shenzhen) during 1992–2013 as examples. We compared different calibration methods horizontally from the perspective of spatial and temporal changes. We presented the comparison results in
Figure 11 and
Figure 12 using the standard deviation maps.
From the perspective of urban development, the brightness of nighttime light in the four cities changed dramatically, and the overall nighttime light region kept increasing, all showing a continuous expansion trend. However, geological and geomorphological conditions, surface water systems, and policy orientation have led to inconsistent expansion directions for different urban developments. According to the variation of nighttime light brightness during the past 20 years, we found that Beijing mainly took the middle part as the center of the circle and gradually expanded outward to form a “ring” shape. Beijing’s overall development was disorderly, with the most significant expansion, especially in the city’s northeast, northwest, and southeast. Shanghai had been expanding to the southern part for years while the northeast part had been developing more slowly due to natural obstructions caused by surface water systems and other natural factors. Nevertheless, the development mode of Shanghai has gradually changed from along-river to cross-river development in recent years. The development trend of Guangzhou mainly centered on the middle part and expanded to the northern, eastern, and southern parts to form the spatial pattern of “one heart and multiple cores”. The development pattern was mainly attributed to the strategic goals of “expanding south, optimizing north, advancing east and connecting west” in Guangzhou’s first urban spatial development strategic plan in 2000. As one of the first special economic zones in China, the urban development of Shenzhen depended heavily on policy orientation. Its development center of gravity is located in the southern coastal region. Nevertheless, the dramatic change in nighttime light brightness in the fast-developing areas such as the east and northwest may be closely related to developing innovative and high-tech industries and other emerging industries. Beijing, Shanghai, and Guangzhou showed more apparent boundaries between urban centers and rapid development areas. However, Shenzhen had a multi-point development trend along its coastal border with no specific urban centers, so the boundaries between its urban centers and rapid development areas were difficult to define.
Using standard deviation mapping, the city’s central area can be effectively distinguished from the area of rapid development, and the details of the urban core boundary can be better reflected. Regarding the effectiveness of the representation of urban development details, the improved stepwise calibration (ISC) method outperformed both the correction methods of Li et al. and Liu et al. [
5,
21]. Additionally, the correction method proposed by Li et al. outperformed the method proposed by Liu et al. [
5,
21]. The ISC method performed a more sensitive response to urban changes and a more explicit and detailed portrayal than other correction methods. The ISC method performed significantly better in the response effect in the low-light high-variation region and high-light low-variation region. There was no significant difference between the correction method of Li et al. and that of Liu et al. [
5,
21]. Although the correction method of Liu et al. can maintain a particular variation pattern in the high-light low-variation region, it was not as effective as that of Li et al. for discerning the boundary of the urban center area [
5,
21].
The correction results of the three methods were similar in the time series. The total DN values of lit pixels increased in all four cities. Nevertheless, the change processes were different, and there was a certain degree of overestimation or underestimation among the different methods. Some methods showed reverse growth trends in specific years, which obviously contradict urban development law. The ISC method was significantly more stable, with fewer abnormal fluctuations between data. Meanwhile, the abnormally high values obtained by the F18 sensor led to a certain degree of underestimation in all the other calibration methods. Only the ISC method proposed in this study solved this problem better.
In brief, the ISC method can maintain a high consistency with the original data, ensure the stable increase of nighttime light brightness over the time series, and consider the response to the high-light low-variation regions and low-light high-variation regions. It shows that this method has great potential for application in urban research and provides new possibilities for further understanding the development of small- and medium-sized nighttime light centers such as villages and towns from a nighttime light perspective, which is rare among other corrections methods.
4.3. Correlation Analysis of Nighttime Light Data and Socio-Economic Data
The results of the correlation coefficients of China’s nighttime light data obtained by different correction methods with GDP and EC are shown in
Figure 13. Among the three correction methods, the improved stepwise calibration (ISC) method could produce the results that had the best correlation with GDP and EC, with correlation coefficient values of 0.9695 and 0.9923, respectively. Regarding the correlation between GDP and EC, the correction method proposed by Li et al. was more advantageous than that of Liu et al. [
5,
21]. The correlation between the correction method proposed by Li et al. and GDP and EC was 0.9152 and 0.9684, respectively [
21]. The correlation between the correction method proposed by Liu et al. and GDP and EC was 0.8701 and 0.9436, respectively [
5]. In addition, the ISC method was closer to the 1:1 line than other correction methods, indicating that this method can minimize the ‘overestimation’ problem of the nighttime light data.
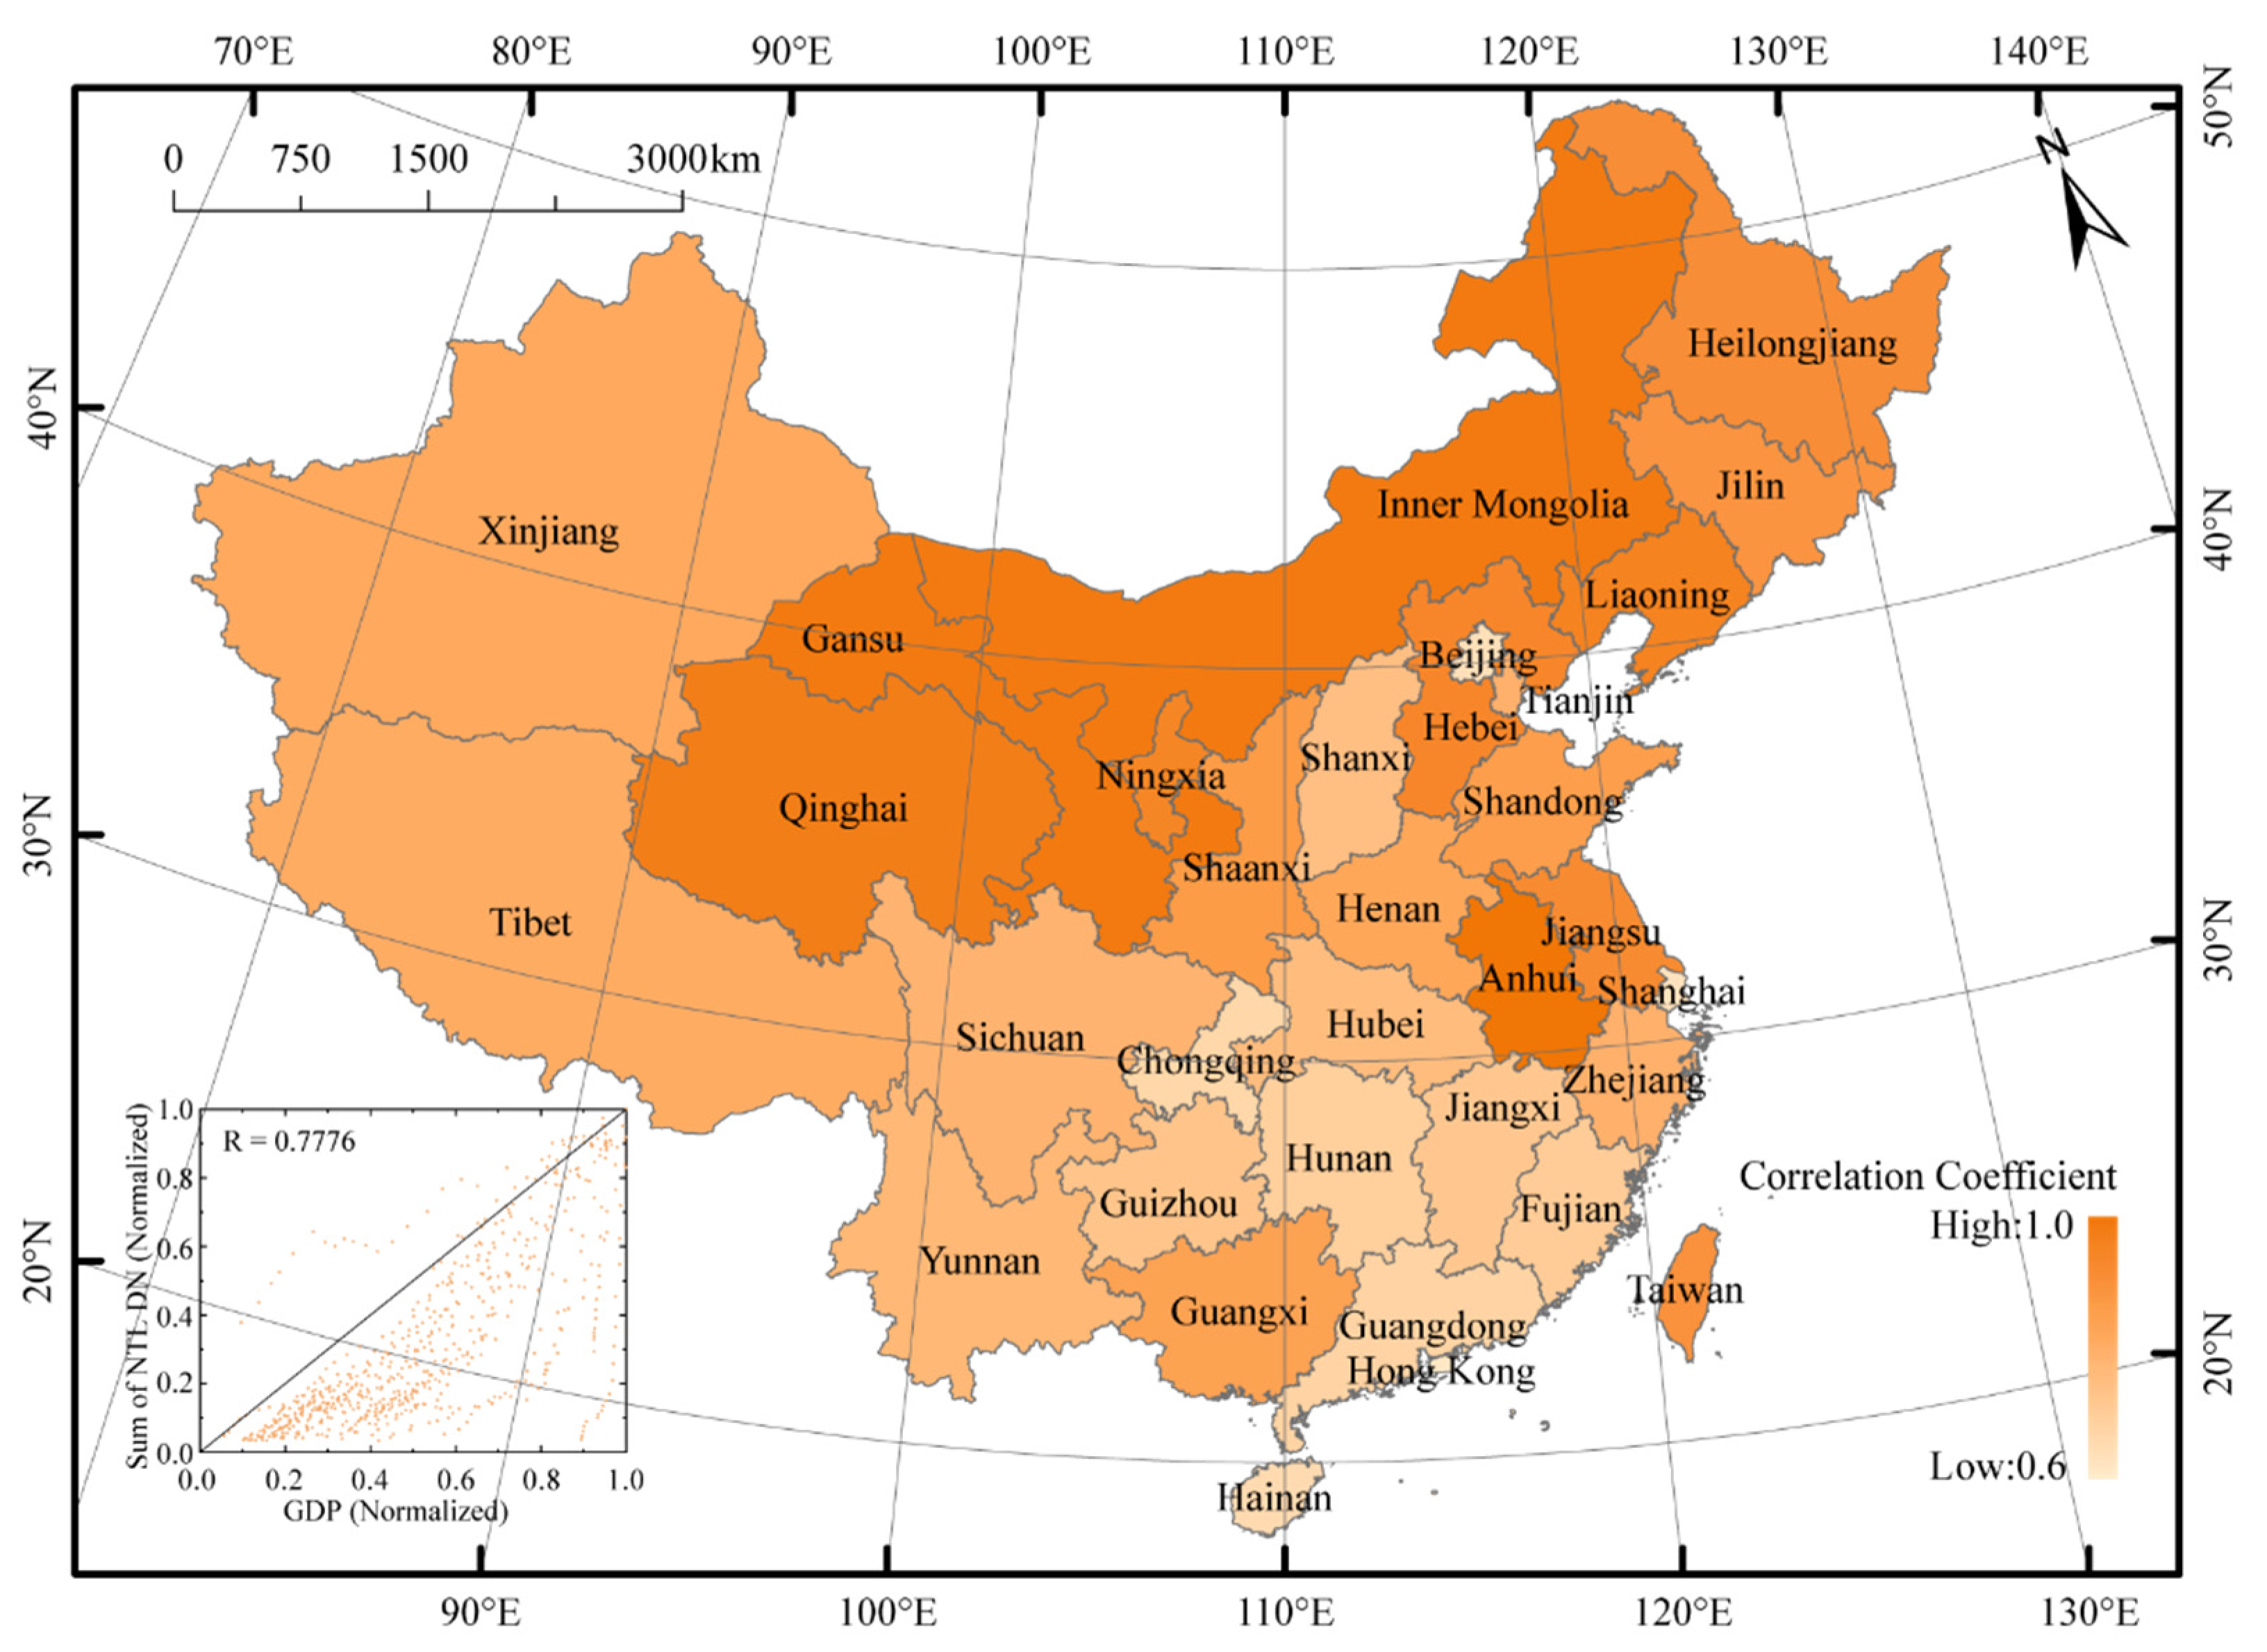
Further correlation analysis was carried out between the reconstructed nighttime light data and GDP of provinces in mainland China, and the results are shown in
Figure 14. It shows that the correlation coefficients between the nighttime light dataset corrected by the ISC method and GDP of provinces were different. However, R was higher than 0.6802, and the average R reached 0.9679, which is generally a high level. It can be observed that the nighttime light under long time sequences changed dramatically in northern regions, especially in Qinghai, Gansu, and Ningxia in northwest China; Hebei and Inner Mongolia in north China; and Liaoning, Jilin, and Heilongjiang in northeast China, most prominently. While the nighttime light variation in the southern coastal regions and most inland provinces was relatively smooth and steady, only Jiangsu, Anhui, Guangxi, and other provinces changed significantly. Meanwhile, the variation may be closely related to industrial restructuring, land use type change, policy shift, and other reasons.
6. Conclusions
We proposed an improved stepwise calibration (ISC) method in this study. This method adopted the second-order regression model as the base calibration model, which had achieved good calibration results in many studies. From the perspective of numerical constancy, we innovatively proposed a constant lit pixels method different from the existing invariant target region method in the calibration stage F16 and F18 sensors. This method is the key to the ISC method. We obtained the corrected nighttime light image set over a long time series by screening the stable lit pixels and then reconstructed the variation curve of nighttime light for many years.
The main conclusions are as follows: (1) As far as the screening method of stable lit pixels is concerned, the constant lit pixels method adopted by the ISC method is more scientific than the invariant target region method. Numerical constancy is more reasonable than theoretical constancy. The variation curve of reconstructed multi-year nighttime light is more consistent with the actual situation. (2) Compared with the global-scale-based correction method, the regional-scale-based correction method is better at preserving the variability of nighttime lights under long time series. The ISC method performs the best at the same regional scale. This method maintains the temporal variability of nighttime light over the years to the maximum extent and preserves the original data’s most abundant and complete information. (3) The ISC method is more sensitive to the response of urban development changes. The details of urban development are more clearly portrayed, especially in the low-light high-variation regions and high-light low-variation regions. The significant advantages of the ISC method in these regions offer new possibilities for understanding the development of small- and medium-sized nighttime light centers such as towns and villages from a nighttime light perspective. This is an advantage that other calibration methods do not offer. Hence, this method is more suitable for application in urbanization research. (4) The multi-year nighttime light dataset obtained by the ISC method correlates best with the socio-economic data. The correlation coefficients with GDP and EC are 0.9695 and 0.9923, respectively. This method can provide better reliability for explaining human socio-economic activities compared to previous methods. Moreover, our proposed improved stepwise calibration (ISC) method is also not perfect. Currently, in many nighttime light calibration studies based on DMSP-OLS data, different calibration methods contain different implicit assumptions, and the ISC method is no exception. Although these assumptions cannot be verified, better calibration results can be obtained. Therefore, our proposed ISC method strongly depends on the data itself. The calibrated nighttime light may differ from the actual nighttime light and is not an entirely realistic representation of the surface nighttime light.
In summary, the ISC method proposed in this study is simple and easy to implement to obtain an accurate and reliable multi-year nighttime light dataset, which provides new possibilities to understand the development of small- and medium-sized nighttime light centers such as towns and villages from a nighttime light perspective. Furthermore, due to the apparent advantages of the method at the regional scale, it helps explain the more profound reasons affecting socio-economic development and provides a new data correction method for subsequent application to the urban field.


 ,
, 


