Technical Note

Patagonian Andes Landslides Inventory: The Deep Learning’s Way to Their Automatic Detection

by
Bastian Morales
1,
Angel Garcia-Pedrero
2,
Elizabet Lizama
1,
Mario Lillo-Saavedra
3,
Consuelo Gonzalo-Martín
2,
Ningsheng Chen
4 and
Marcelo Somos-Valenzuela
1,5,*
1
Butamallin Research Center for Global Change, Universidad de La Frontera, Av. Francisco Salazar 01145, Temuco 4780000, Chile
2
Department of Computer Architecture and Technology, Universidad Politécnica de Madrid, 28660 Boadilla del Monte, Spain
3
Facultad de Ingeniería Agrícola, Universidad de Concepción, Chillán 3812120, Chile
4
Key Laboratory of Mountain Hazards and Earth Surface Processes, Institute of Mountain Hazards and Environment, Chinese Academy of Sciences, Chengdu 610041, China
5
Department of Forest Sciences, Faculty of Agriculture and Environmental Sciencies, Universidad de La Frontera, Av. Francisco Salazar 01145, Temuco 4780000, Chile
*
Author to whom correspondence should be addressed.
Remote Sens. 2022, 14(18), 4622; https://doi.org/10.3390/rs14184622
Submission received: 14 August 2022 / Revised: 8 September 2022 / Accepted: 9 September 2022 / Published: 16 September 2022

Abstract

:
Landslide inventories are crucial to studying the dynamics, associated risks, and effects of these geomorphological processes on the evolution of mountainous landscapes. The production of landslide maps is mainly based on manual visual interpretation methods of aerial and satellite images combined with field surveys. In recent times, advances in machine learning methods have made it possible to explore new semi-automated landslide detection methodologies using remotely detected images. In this sense, developing new artificial intelligence models based on Deep Learning (DL) opens up an excellent opportunity to automate this arduous process. Although the Andes mountain range is one of the most geomorphologically active areas on the planet, the few investigations that use DL mainly focus on mountain ranges in Europe and Asia. One of the main reasons is the low density of landslide data available in the Andean areas, making it difficult to experiment with DL models requiring large data volumes. In this work, we seek to narrow the existing gap in the availability of landslide inventories in the area of the Patagonian Andes. In addition, the feasibility and efficiency of DL techniques are studied to develop landslide detection models in the Andes from the generated datasets. To achieve this goal, we generated in a manual process a datasets of 10,000 landslides for northern Chilean Patagonia (42–45°S), being the largest freely accessible landslide datasets in this region. We implement a machine learning model, through DL, to detect landslides in optical images of the Sentinel-2 constellation using a model based on the DeepLabv3+ architecture, a state-of-the-art deep learning network for semantic segmentation. Our results indicate that the algorithm detects landslides with an accuracy of 0.75 at the object level. For its part, the segmentation reaches a precision of 0.86, a recall of 0.74, and an F1-score of 0.79. The correlation of the segmentation measured through the Matthews correlation coefficient shows a value of 0.59, and the geometric similarity of the correctly detected landslides measured through the Jaccard score reaches 0.70. Although the model shows a good response in the testing area, errors are generated that can be explained by geometric and spectral relationships, which should be solved through new training approaches and data sets.

1. Introduction

The Andes in Patagonia has a relief in constant evolution susceptible to environmental disturbances such as earthquakes, volcanic eruptions, and climatic events [1,2,3]. The interaction of these processes at different levels of intensity has generated a response from the landscape, increasing landslide activity and, as a consequence, in danger for the communities that inhabit these mountainous localities [1,2,3,4]. In order to study the susceptibility to landslides and the evolution of landscapes through model adjustment, it is necessary to have landslide inventories that allow the relationship between climate and local geomorphological conditions [5]. However, due to the difficulty of access, these inventories are scarce in mountainous areas, particularly with low population density.
Traditionally, the production of landslide maps was based on the visual interpretation of stereoscopic aerial photographs combined with field surveys. These production methods are limited by the high consumption of both human and technical resources, making it challenging to massify them [5]. On the other hand, the access to remote sensing data from satellite platforms has allowed the development of semi-automatic analysis strategies for different satellite images, optical (panchromatic and multispectral), and synthetic aperture radar (SAR), thus reducing the high consumption of human resources.
The massification and free access of remotely detected data, together with the strong development of artificial intelligence techniques, particularly machine learning, have allowed the exploration of different methods for the classification or zoning of landslides. Among the methods, the most common are logistic regression algorithms, support vector machines, decision trees, random trees, among others [6,7]. However, environmental changes limit the transferability of these models to other areas of study post-training [8].
Recently, a handful of investigations have used deep learning (DL) models based on convolutional neural networks (CNN) to develop landslide inventories with promising results. Compared to machine learning methods, CNNs have been a breakthrough for remote sensing data analysis. Unlike conventional classification techniques, CNNs are capable of autonomously recognizing the most noticeable features that it uses for the classification process [9]. For example, [7] used high-resolution images from the RapidEye satellite combined with topographic information to train a DL model for landslide detection. Network models with residual connections (ResNet) have also been implemented to map landslides using aerial images with topographic information from LIDAR data [10]. Other efforts have been focused on introducing networks of the U-Net type combined with ResNet to perform semantic segmentation of landslides from topographic features derived from LIDAR data [11].
Additionally, different variants of U-Net have been used in multiple studies to map landslides from optical images. These studies adopt a conventional supervised learning workflow in which a model is trained first on a region and then reused to generate a landslide map of its surroundings with comparable geoenvironmental characteristics [12,13]. Recently, a new landslide detection approach immediately after an extreme event has been proposed. In this approach, the authors propose a combined training strategy to build a generalized CNN-based semantic segmentation model to identify changes associated with landslide activity using a set of pre and post-slide satellite images [14].
From the analyzed literature, it can be established that one of the main limitations detected in the current investigations is that they focus exclusively on mountain ranges in Europe and Asia, leaving aside the Andes mountain systems. This is probably because the Andes have a low density of landslide data set available, which makes it challenging to generate models based on artificial intelligence (e.g., machine learning and DL) that require large data sets for their training. This lack of information is even more critical in the Patagonian Andes [2], where the potential of freely accessible satellite data such as that provided by the Sentinel-2 constellation has not been fully exploited.
Therefore, the objective of this work is to develop an automatic landslides detection model for the Patagonian Andes. The model is conveyed through a DL strategy trained with a datasets of 10,000 manually labeled landslides. As an operational results of this work, the Patagonian Andes landslides datasets is available trough the link https://doi.org/10.5281/zenodo.7057656 (accessed on 8 September 2022) to train new models that allows to improve and advance the state of the art in landslide detection and prediction.
This work aims to close the existing gap in the availability of landslide inventories in the Patagonian Andes and to study the feasibility and efficiency of DL techniques to develop landslide detection models in the Andes from the Andes datasets generated. Furthermore, we seek to provide a methodology that allows to automatically create landslide datasets using freely available images and a deep-learning network for semantic segmentation algorithm. These datasets, which are not available everywhere, are crucial to recognizing what triggers or enables landslides and to moving forward in landslides’ early detection systems.

2. Materials and Methods

2.1. Datasets Generation

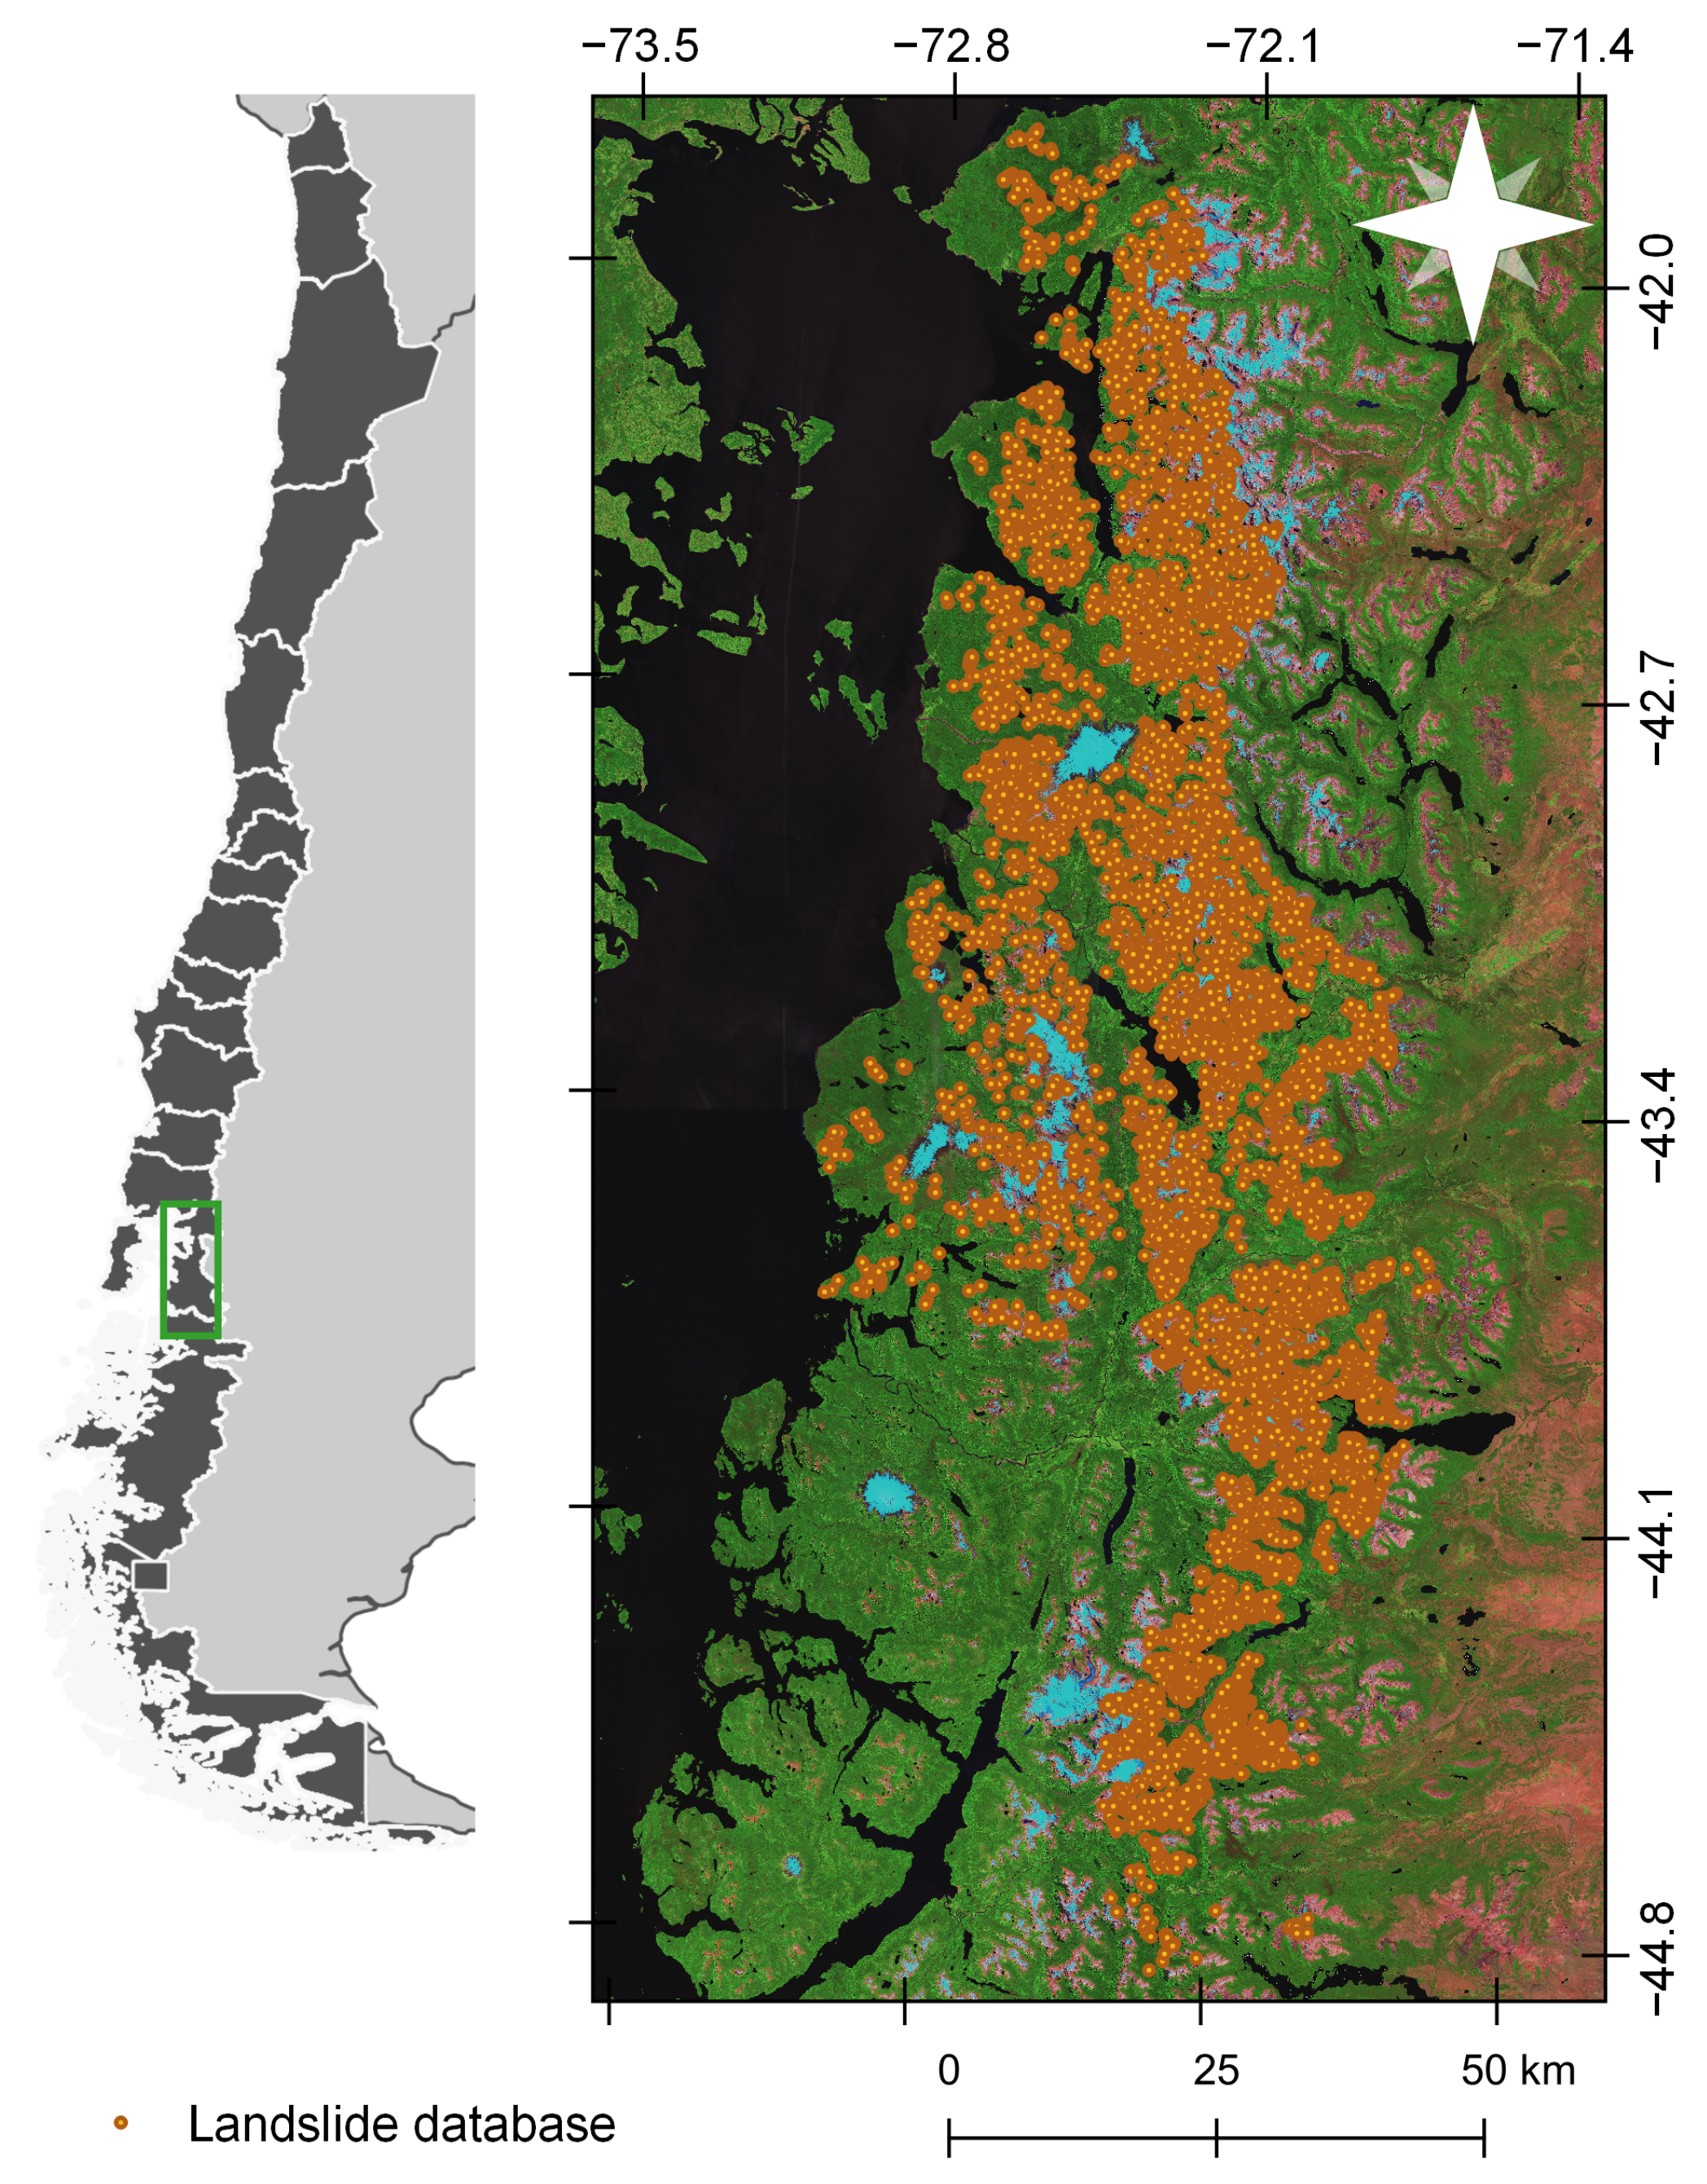
In order to have enough information for training a CNN model, we manually generated a landslide datasets for the Patagonian Andes (42–45°S) (Figure 1). We included all the landslide types (rockfall, slides, debris flow) as landslides since we did not seek at this stage to differentiate them, which would have needed more extensive fieldwork for validation. In the first stage, we compiled 722 landslides in point-type vectorial format, inventoried by [2] through temporary changes of Normalized Difference Vegetation Index from Landsat images and terrain campaigns. We delineated these landslides and systematically filled in the missing removals in the study area. The delineation of the removals extends from the escarpment to the deposit area; we used the open-source software QGIS 3.10. We performed this procedure on six Sentinel-2 image tiles (Table 1) from the 2020–2021 summer season, and additionally, on high-resolution images provided by the Google Earth and Bing Maps mapping services. The morphological characteristics considered for identifying the landslides were: patches of no forest in forested areas with bare escarpments that show lobe-shaped displaced soil and/or rock. The datasets created includes the geometry, position, and area of landslides.
The primary information used for the generation of the training datasets comes from the image bands of the Sentinel-2 constellation. The images were downloaded from the Copernicus Open Access Hub (https://scihub.copernicus.eu/) (accessed on 20 March 2021). Images with cloudiness less than 5% acquired during the summer of the years 2020–2021 were filtered. Sentinel-2 images correspond to level-2A atmospherically corrected. Their tile number and dates details are shown in Table 1.
We excluded bands 1, 9, and 10, which provide atmospherics information (aerosol, water vapor, and cirrus, respectively), from the selected tiles; the remaining bands were resampled to 10 m resolution using the bilinear interpolation technique in QGIS 3.10. To speed up the subsequent execution of the DL algorithm, we converted the spectral information of the bands to 16-bit integer data. We then indexed all bands to a range of [ 0 , 1 ] .

2.2. Pre-Processing Datasets for DL Training

In order to feed the CNN model, each Sentinel-2 image was cropped into patches of 224 × 224 pixels. In addition, data augmentation techniques [15] were performed during training. In particular, vertical and horizontal flipping operations, and rotation with 45 and 45 angles were used. Finally, each data patch was indexed in a range [ 0 , 1 ] . Shapefiles with manually delineated landslides were rasterized obtaining binary masks (with the same resolution as Sentinel-2 images) where the 1s represent the landslides and the zeros represent the background. These masks underwent the same processes as the data patches, except for indexation; therefore, the data patches and masks match.

2.3. Convolutional Neural Network (CNN)

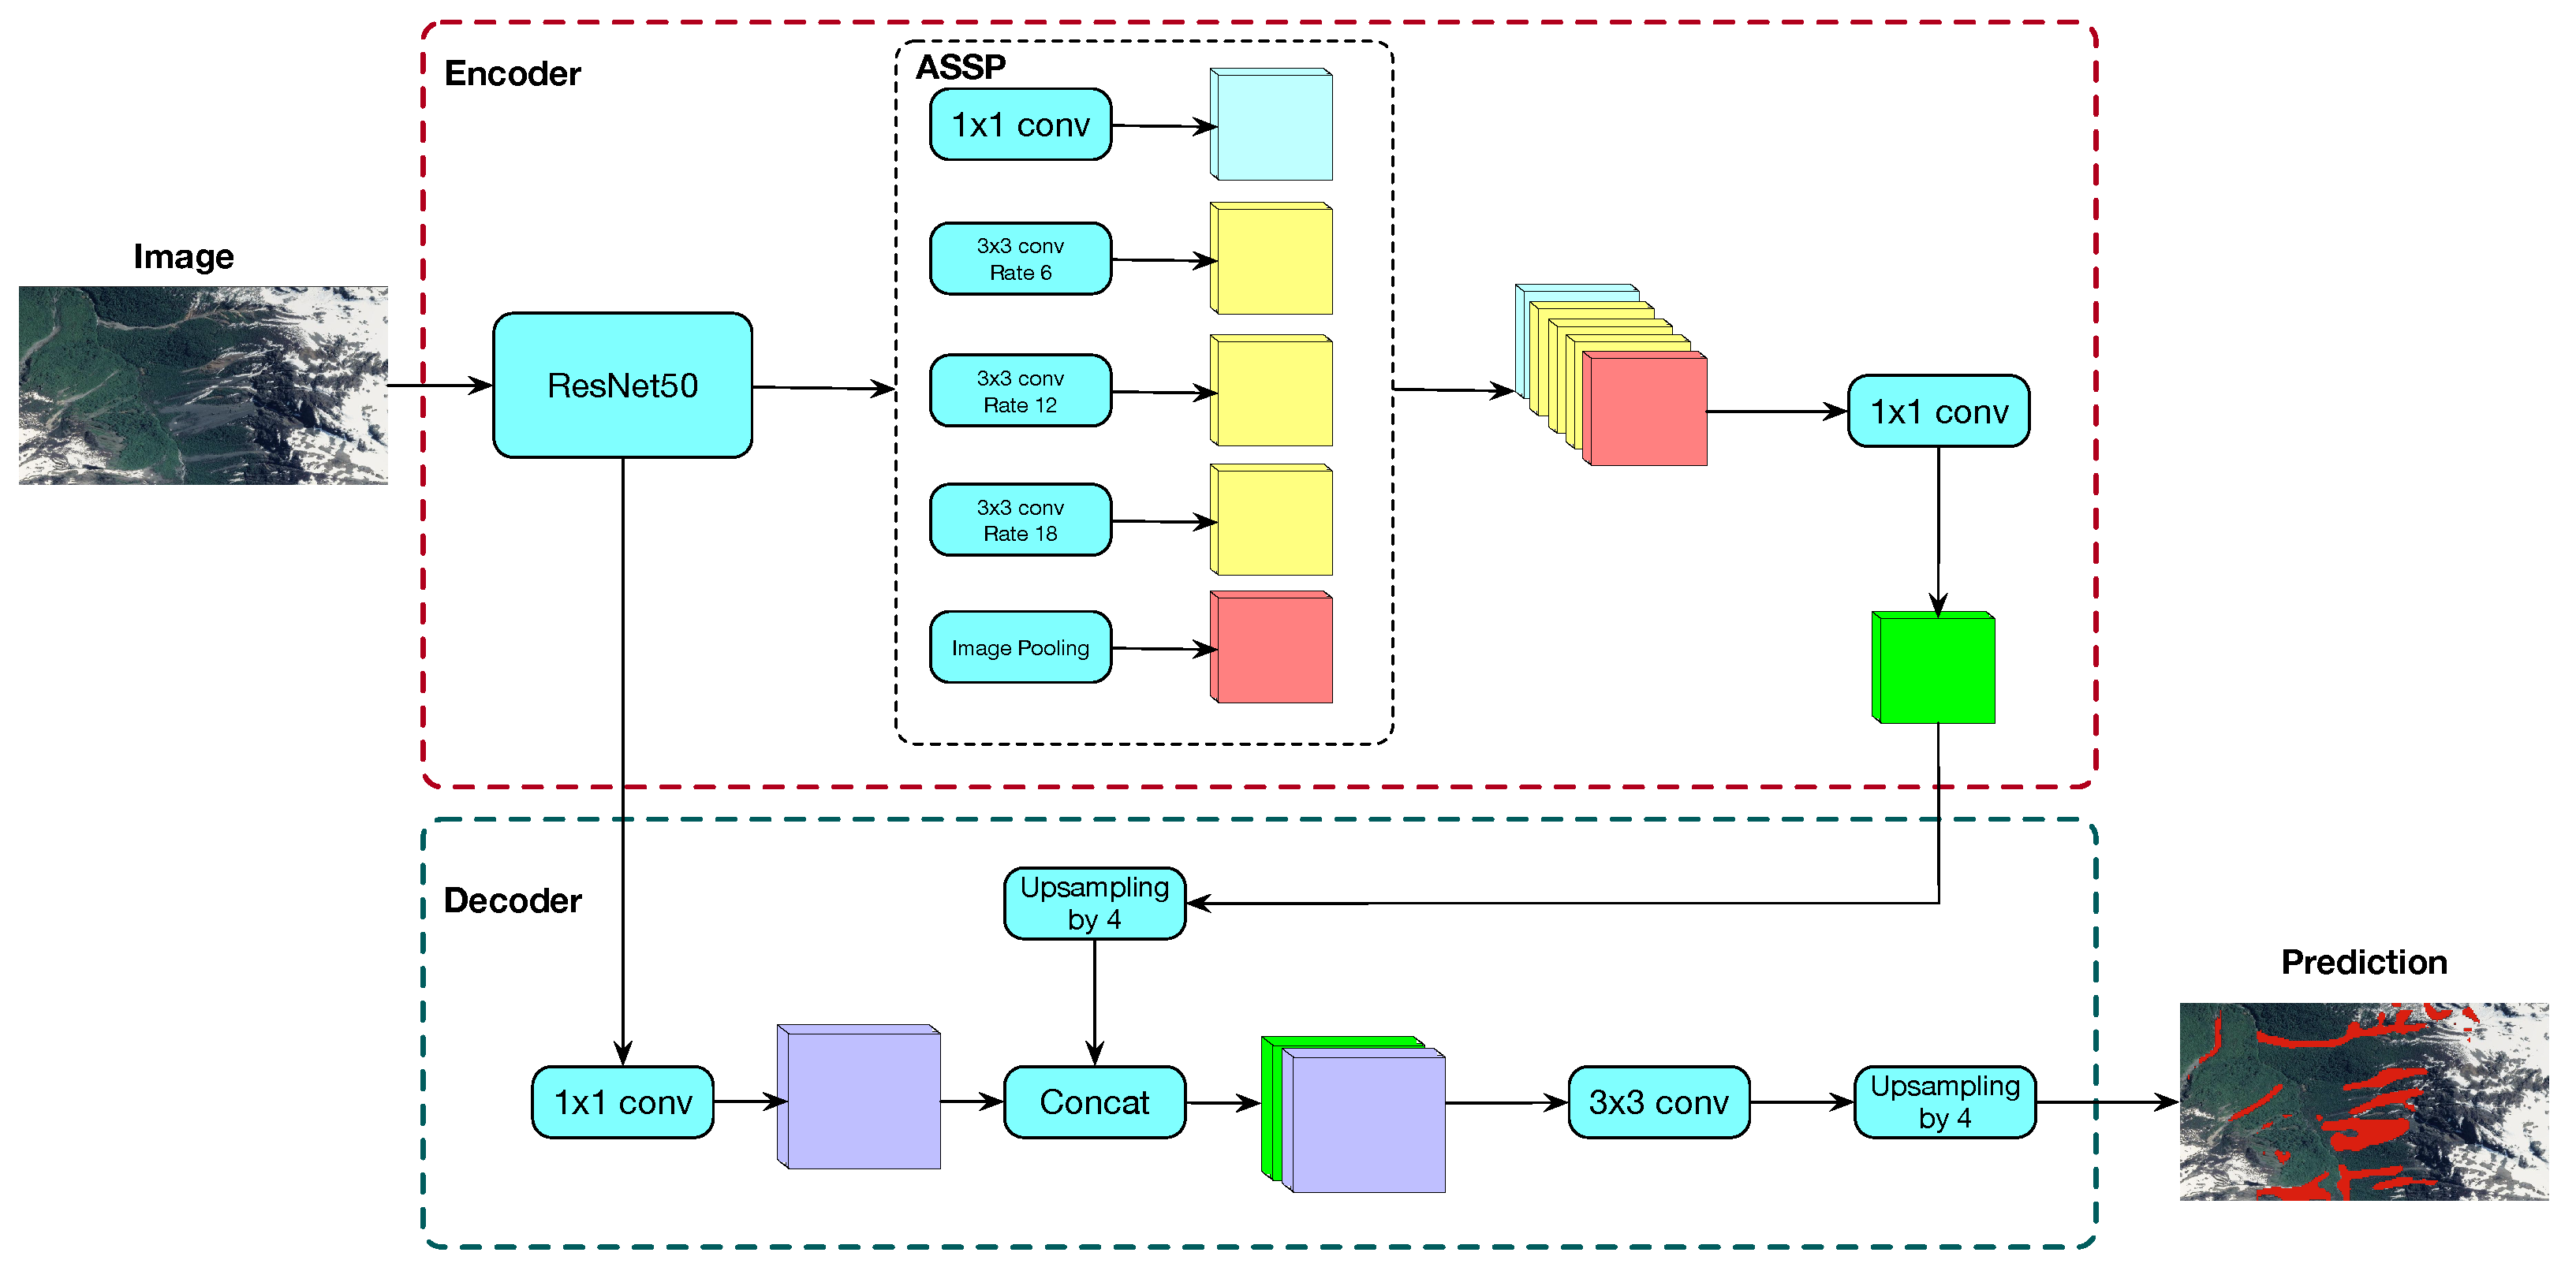
DeepLabv3+, introduced by [16], is a state-of-the-art deep learning network for semantic segmentation, i.e., to assign semantic labels to every pixel in an image. DeepLabv3+ consists of an encoder-decoder architecture with an à trous spatial pyramid pooling (ASPP) structure and bilinear upsampling (Figure 2). The encoder part consists of a pre-trained ResNet50 [17] followed by the ASpp. The ASPP consists of four parallel à trous convolutions with different à trous rates generating feature maps that capture high multiscale information accurately and efficiently. These feature maps are concatenated and then converted to a channel number by means 1 × 1 convolution layer. At the decoder part, encoder’s feature map is upsampled it by a factor of 4 and concatenated with the output of the ResNet50 followed by an 1 × 1 convolution. Concatenated feature maps are then processed by means of a 3 × 3 convolution layer and finally upsampled by a factor of 4. This final output agrees in shape with the mask. In this work, an sigmoid was used as the output activation function.

2.4. Loss Function

To train the CNNs, we used Focal Tversky Loss [18] as the loss function, which is given as:
L ( Y , Y ^ ) = 1 i y i y ^ i i y i y ^ i + α i y i ( 1 y ^ i ) + β i ( 1 y i ) y ^ i + ϵ γ
where y i Y and y ^ i Y ^ denote the ground-truths and the predicted probabilities of i th pixel image for the class c respectively, and ϵ is a smoothing factor used to avoid zero division error. In this work, the following values were used: α = 0.7 , β = 0.3 , γ = 0.75 , and ϵ = 1 e 12 . This configuration has been used with success when dealing with unbalanced datasets, as is the case of the landslides. Training was performed using the Adam optimizer [19] during 100 epochs using a batch size of 32.
In order to handle input images with multiple channels (more than 3 corresponding to RGB images), we modified the size of the input layer filter. In this case, instead of having an input of [B, 3, 224, 224] (for RGB images, 3 channels) in the input layer, it has a size of [B, 10, 224, 224], where 10 is the number of channels of Sentinel-2 used and B represents the number of images in the batch. In the case of the output layer, the size is [B, 1, 224, 224], corresponding to a single class (landslides). The rest of the network remains the same as the original. The changes in the filter of the input layer are needed, as we said to deal with images of more than 3 channels, as provided by Sentinel-2.

2.5. Post-Processing

During prediction stage, an overlap-tile strategy was applied in order to obtain a prediction for an entire Sentinel-2 tile. This means that the sub-images overlap to some extent, in our case, 90%. The output’s network are averaging over the overlapping pixels. Similar to [20], a test-time-augmentation (TTA) strategy was applied to improve the changes of detecting the landslides. In particular, geometric transformations beloging to dihedral group of order 4 were used as TTA augmentations obtaining 8 different versions of a same sub-image. The final segmentation is obtained by calculating the maximum response of the 8 values corresponding to the same pixel’s location. A pixel is considered to belong to belong to a landslide if it exceeds a threshold of 0.5.

2.6. Model Evaluation

We used six tiles (Table 1) to train the model and one tile to test the output (T18GYS). Before evaluating the model, we manually filtered the elements associated with roads and populated areas in the tile selected for validation. Then, we randomly select 10% of the landslides predicted by the algorithm in the test tile. We evaluated the predicted datasets by identifying true positives (TP) and false positives (FP) at the object level. TPs that had not been previously considered in the training datasets was incorporated as ground truth. Subsequently, using QGIS 3.10, a binary map (0-1) of the predicted landslides and the ground truth was generated to evaluate the semantic segmentation.
The model was evaluated with different performance metrics using the following approach: (1) evaluation of object-level detection by calculating accuracy. (2) evaluation of the semantic segmentation between the binary map of the predicted landslides and the ground truth using the metrics precision, recall, and F1-score. (3) evaluation of the semantic segmentation correlation using the Matthews correlation coefficient and similarity by the Jaccard score, the latter applied exclusively to TP detected landslides. Metrics were calculated based on TP, FP, false negative (FN) that are landslides that were not detected by the algorithm, and true negative (TN), corresponding to the areas without landslides correctly detected.
We also performed an exploratory analysis of the geometric characteristics of landslides correctly and incorrectly detected by the model. We considered the area–perimeter ratio and length–width ratio since they provide essential information on the geometry and complexity of the landslide shape. These four geometry descriptive elements (area, perimeter, width, length) were calculated in QGIS 3.10. To estimate length–width, we use the tool provided by QGIS called oriented minimum bounding box.

3. Results

We generated the first large-scale landslide datasets between 42–45°S spanning approximately 20,000 km2. Ten thousand landslides were delimited and used to train and evaluate the CNN model. Our results are summarized in the Table 2. The algorithm reaches a 0.75 accuracy to detect landslides at the object level. When we evaluated the segmentation of the predicted landslides, we obtained an accuracy of 0.86, a recall of 0.74, and an F1-score of 0.79 between the binary map of predicted landslides and the ground truth. When we evaluated the correlation of the segmentation using the Matthews correlation coefficient, the model reached a value of 0.59 and a Jaccard score of 0.70, which in this case represents the similarity of the segmentation between the TPs.
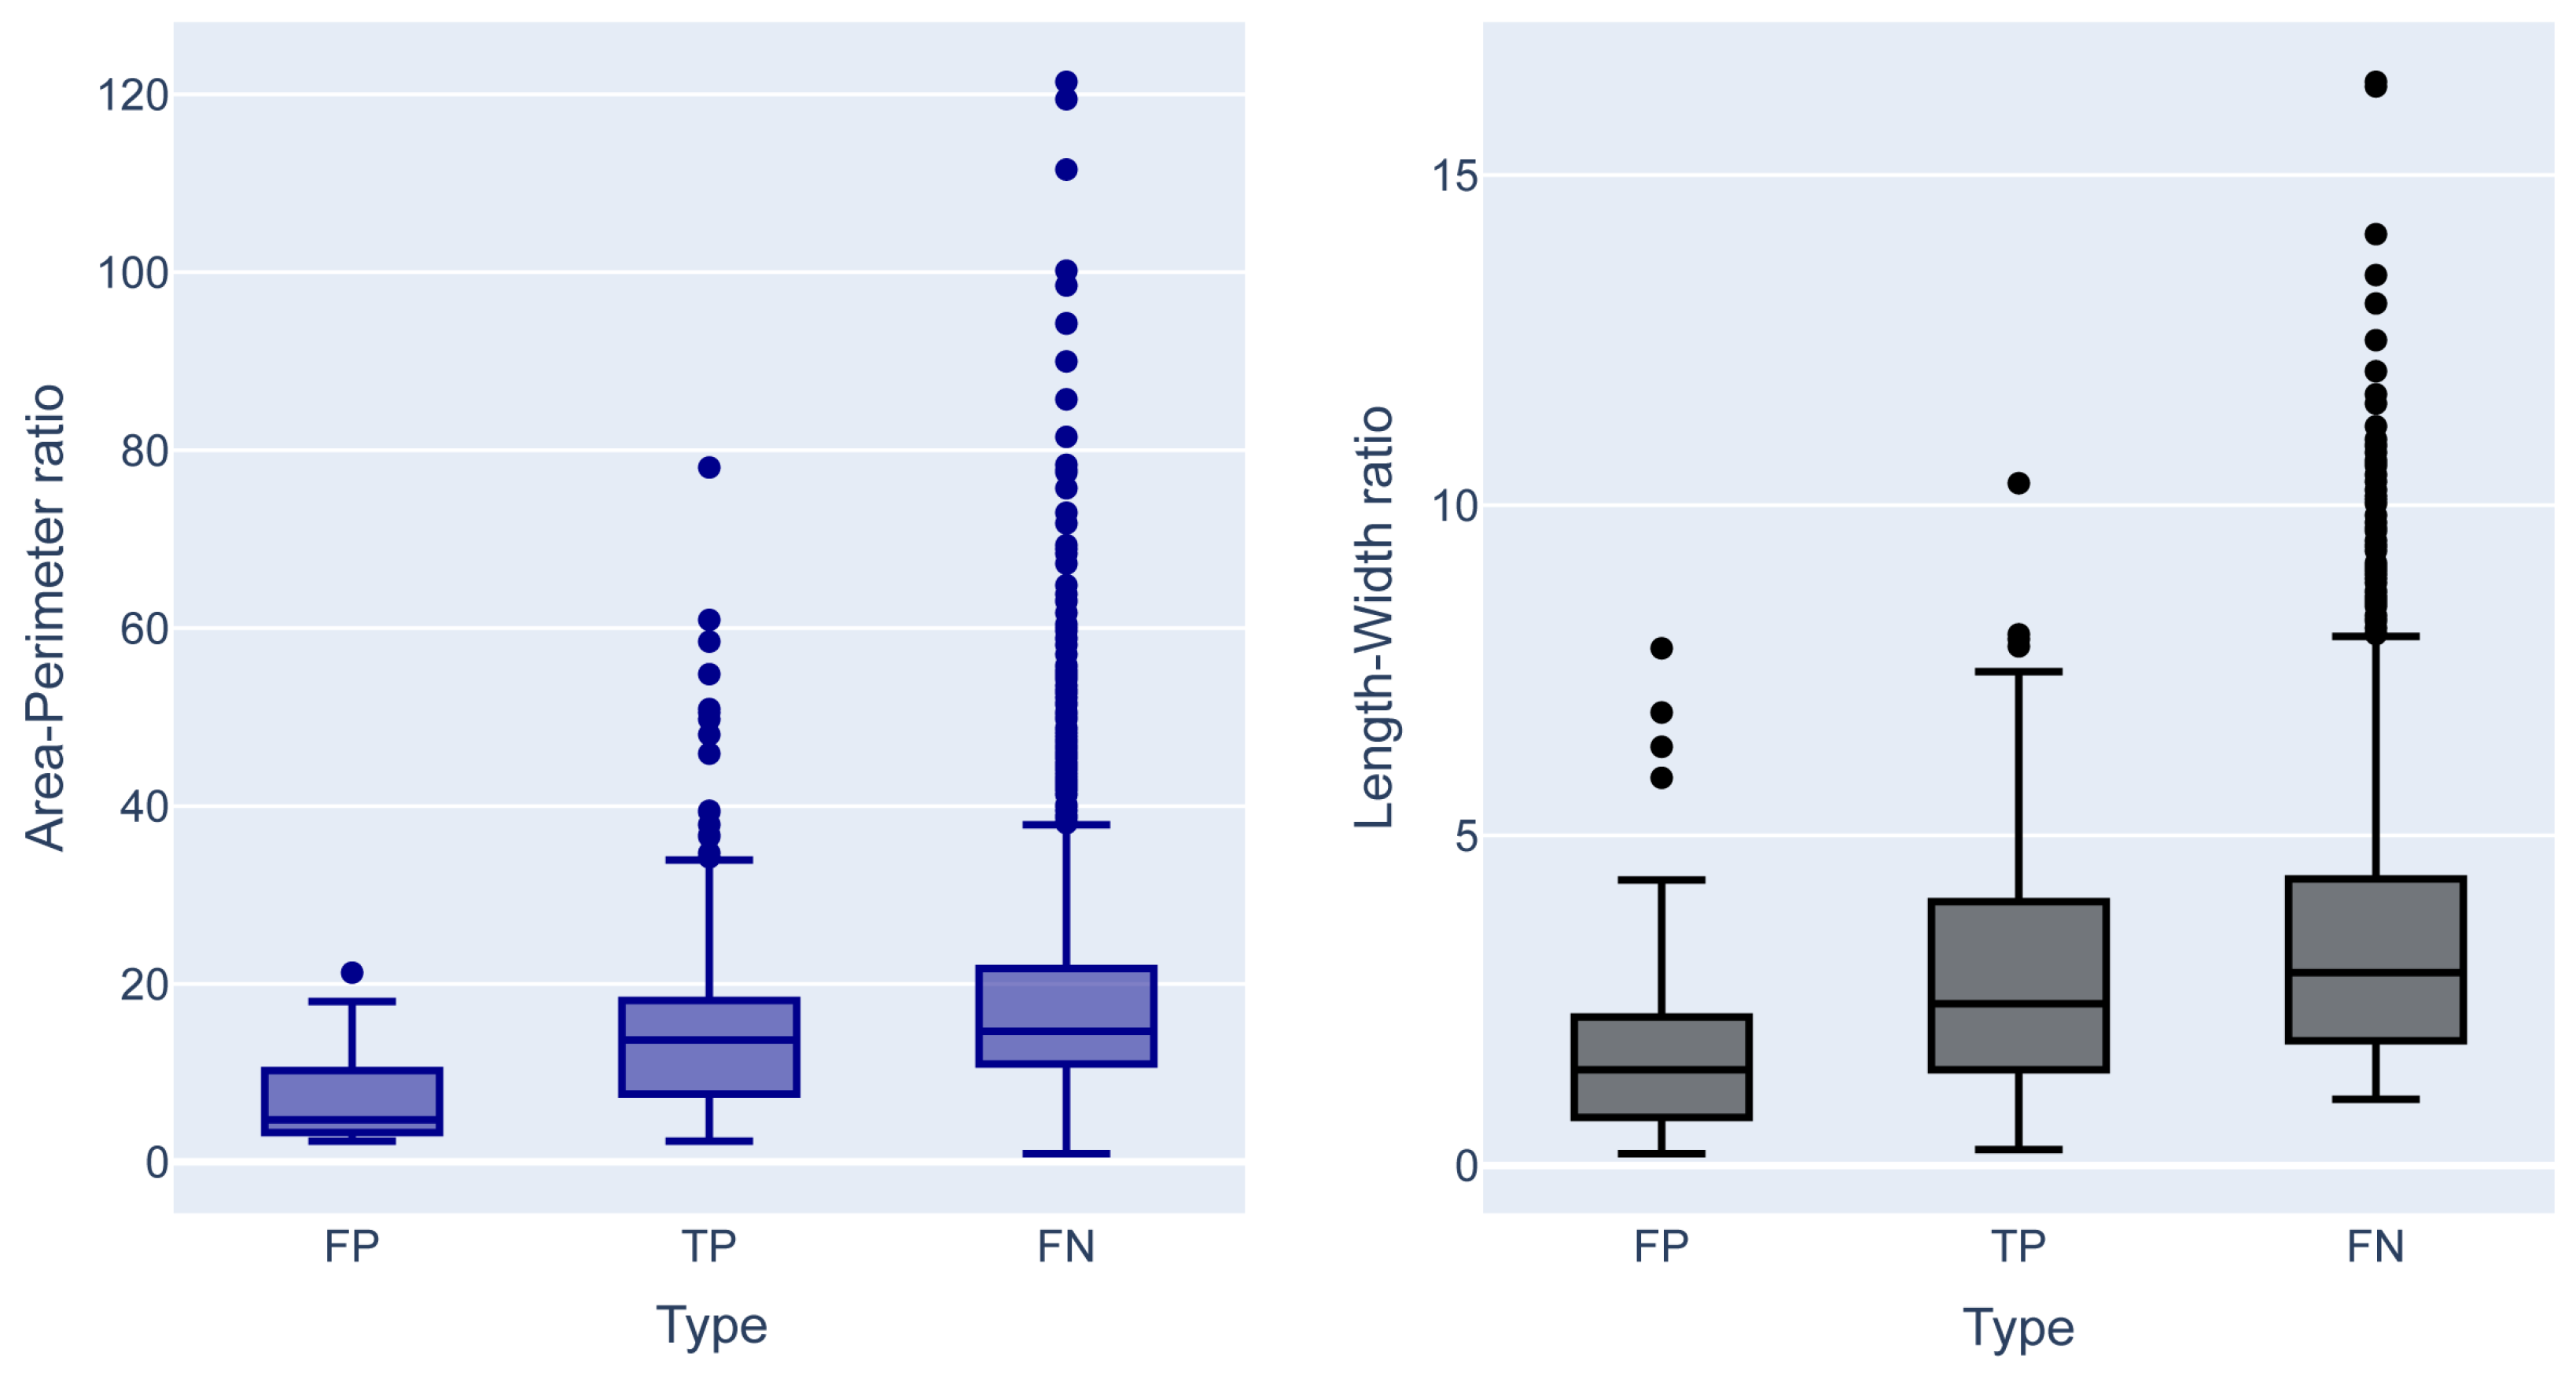
Based on the exploratory analysis, we observed apparent morphological differences between the FP, TP, and FN (Figure 3).
For instance, the TPs present higher length–width and area–perimeter ratios than the FPs and correspond mainly to elongated morphologies but with less complexity (Figure 4). While, FPs have low length–width and area–perimeter ratios and are mainly associated with small morphologies that can be complex in shape (Figure 5).
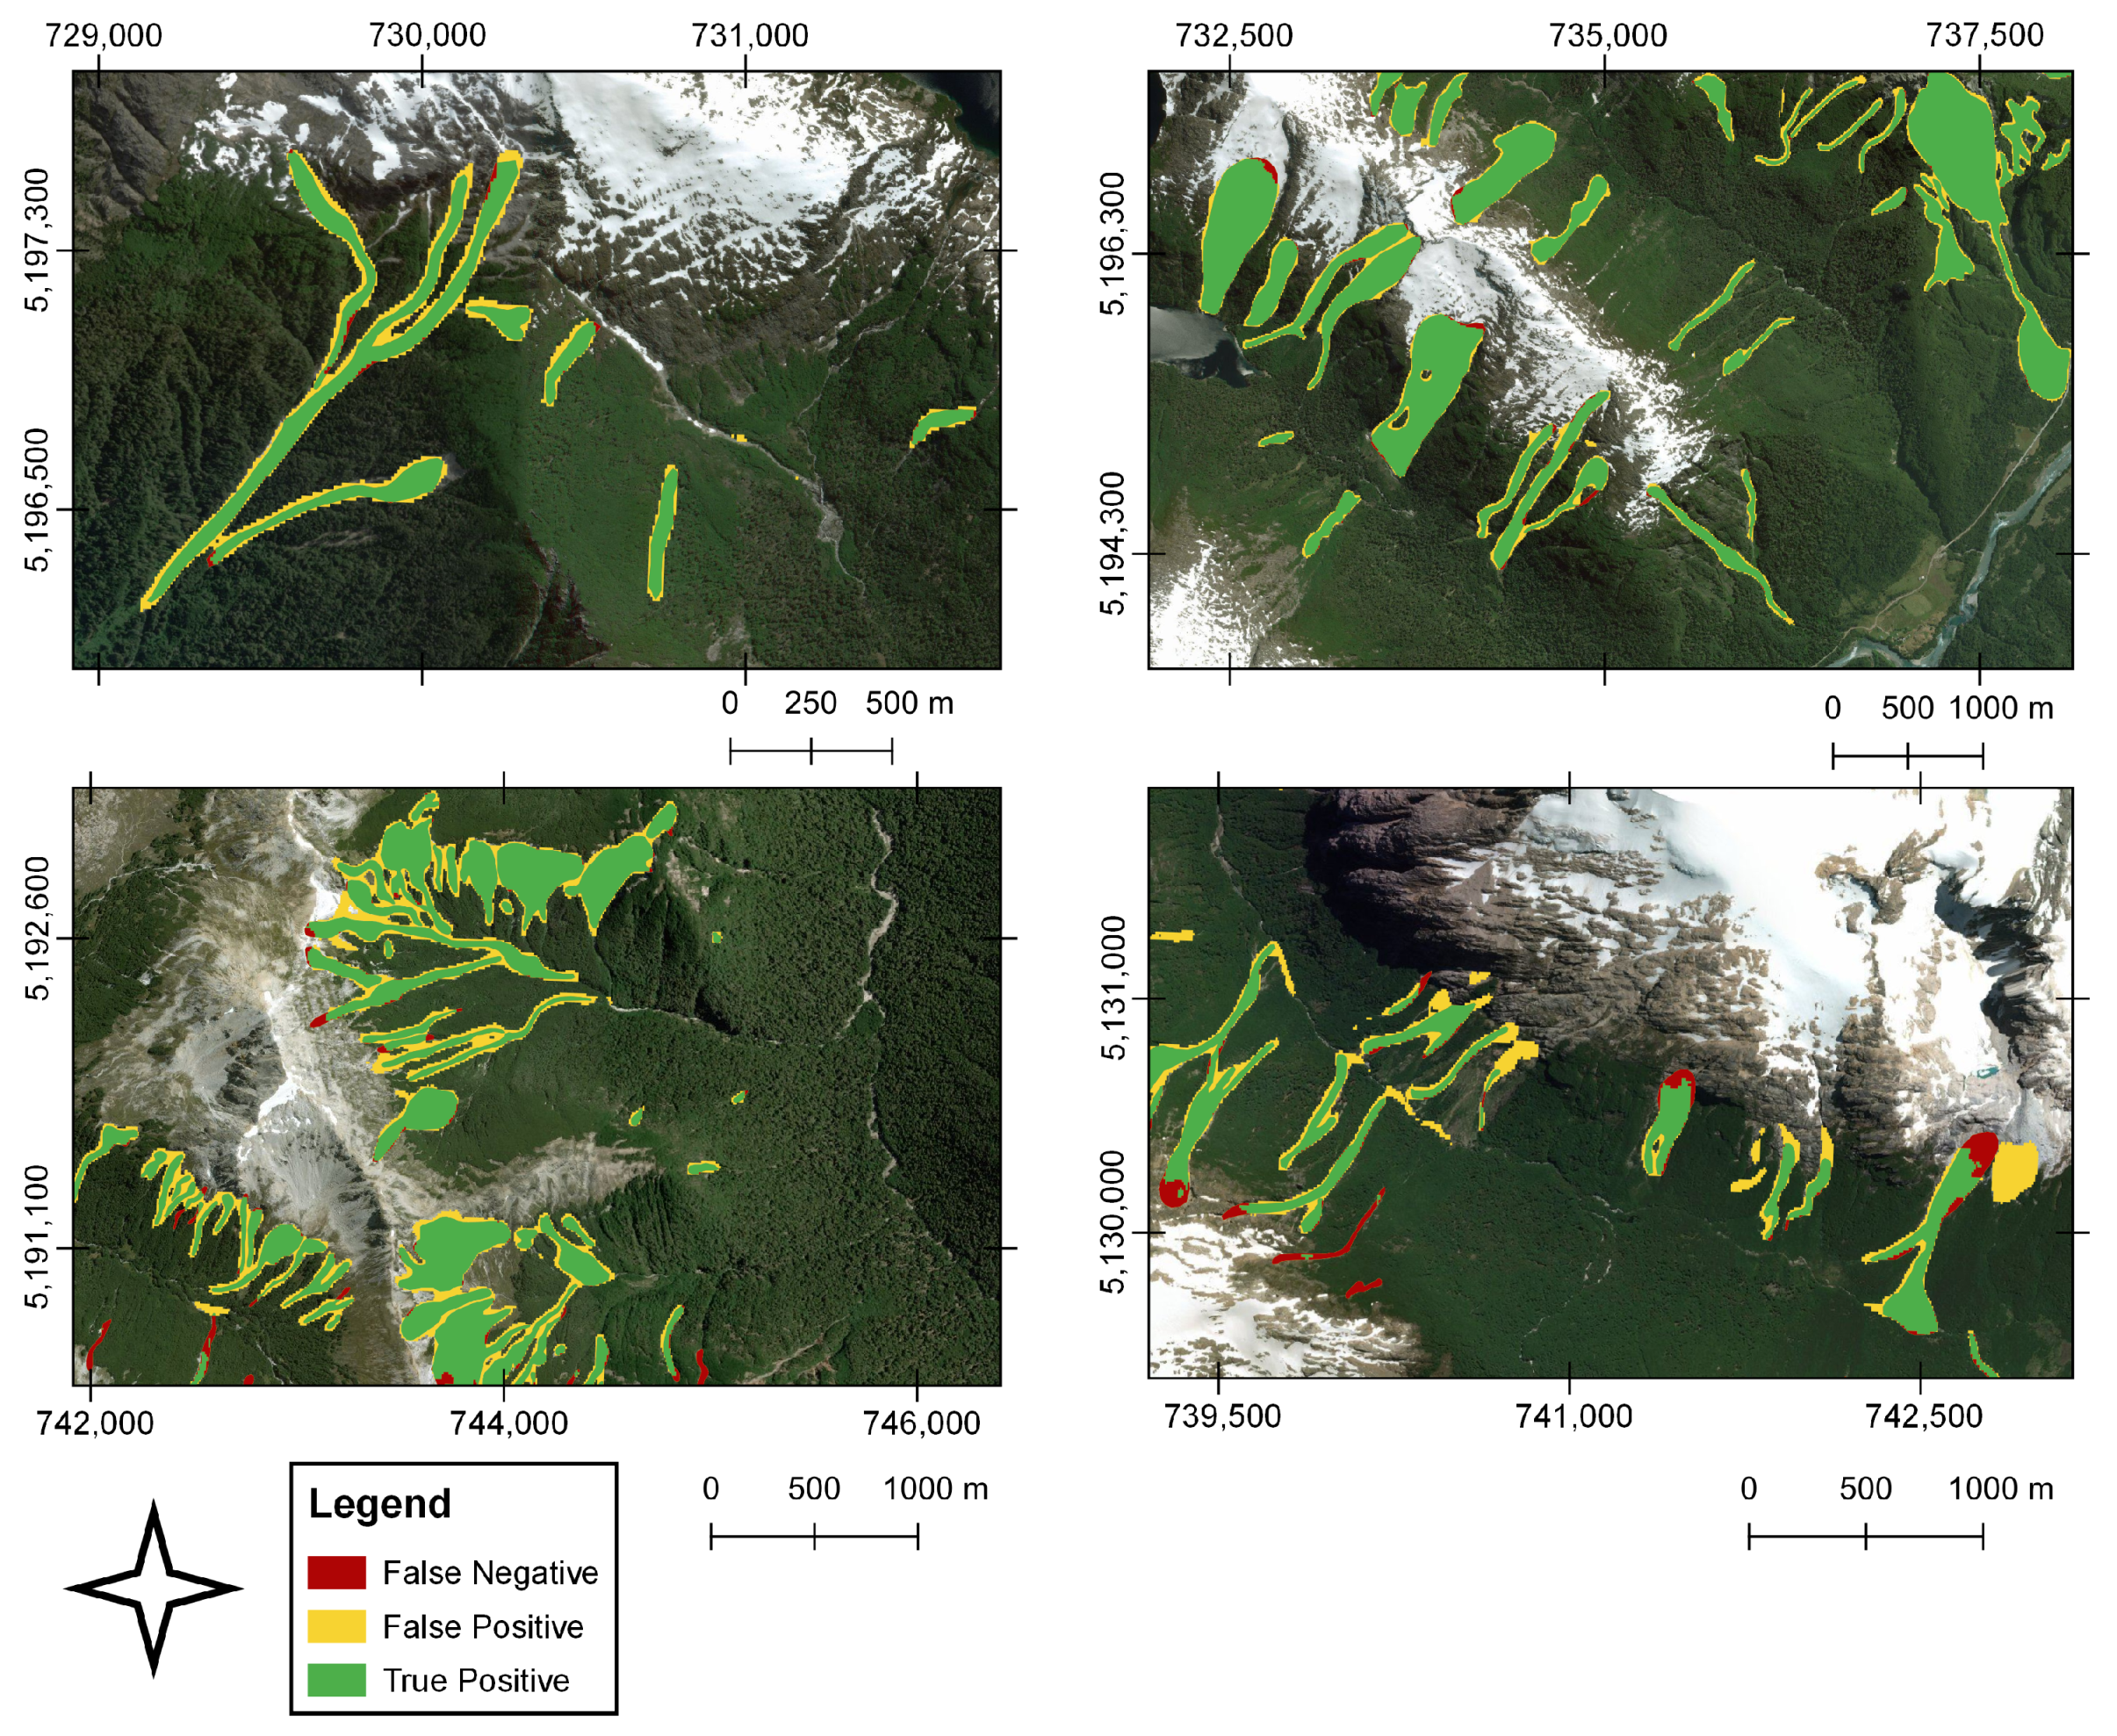
As a result of the high contrast between landslides and the land cover, there is a greater landslide segmentation (
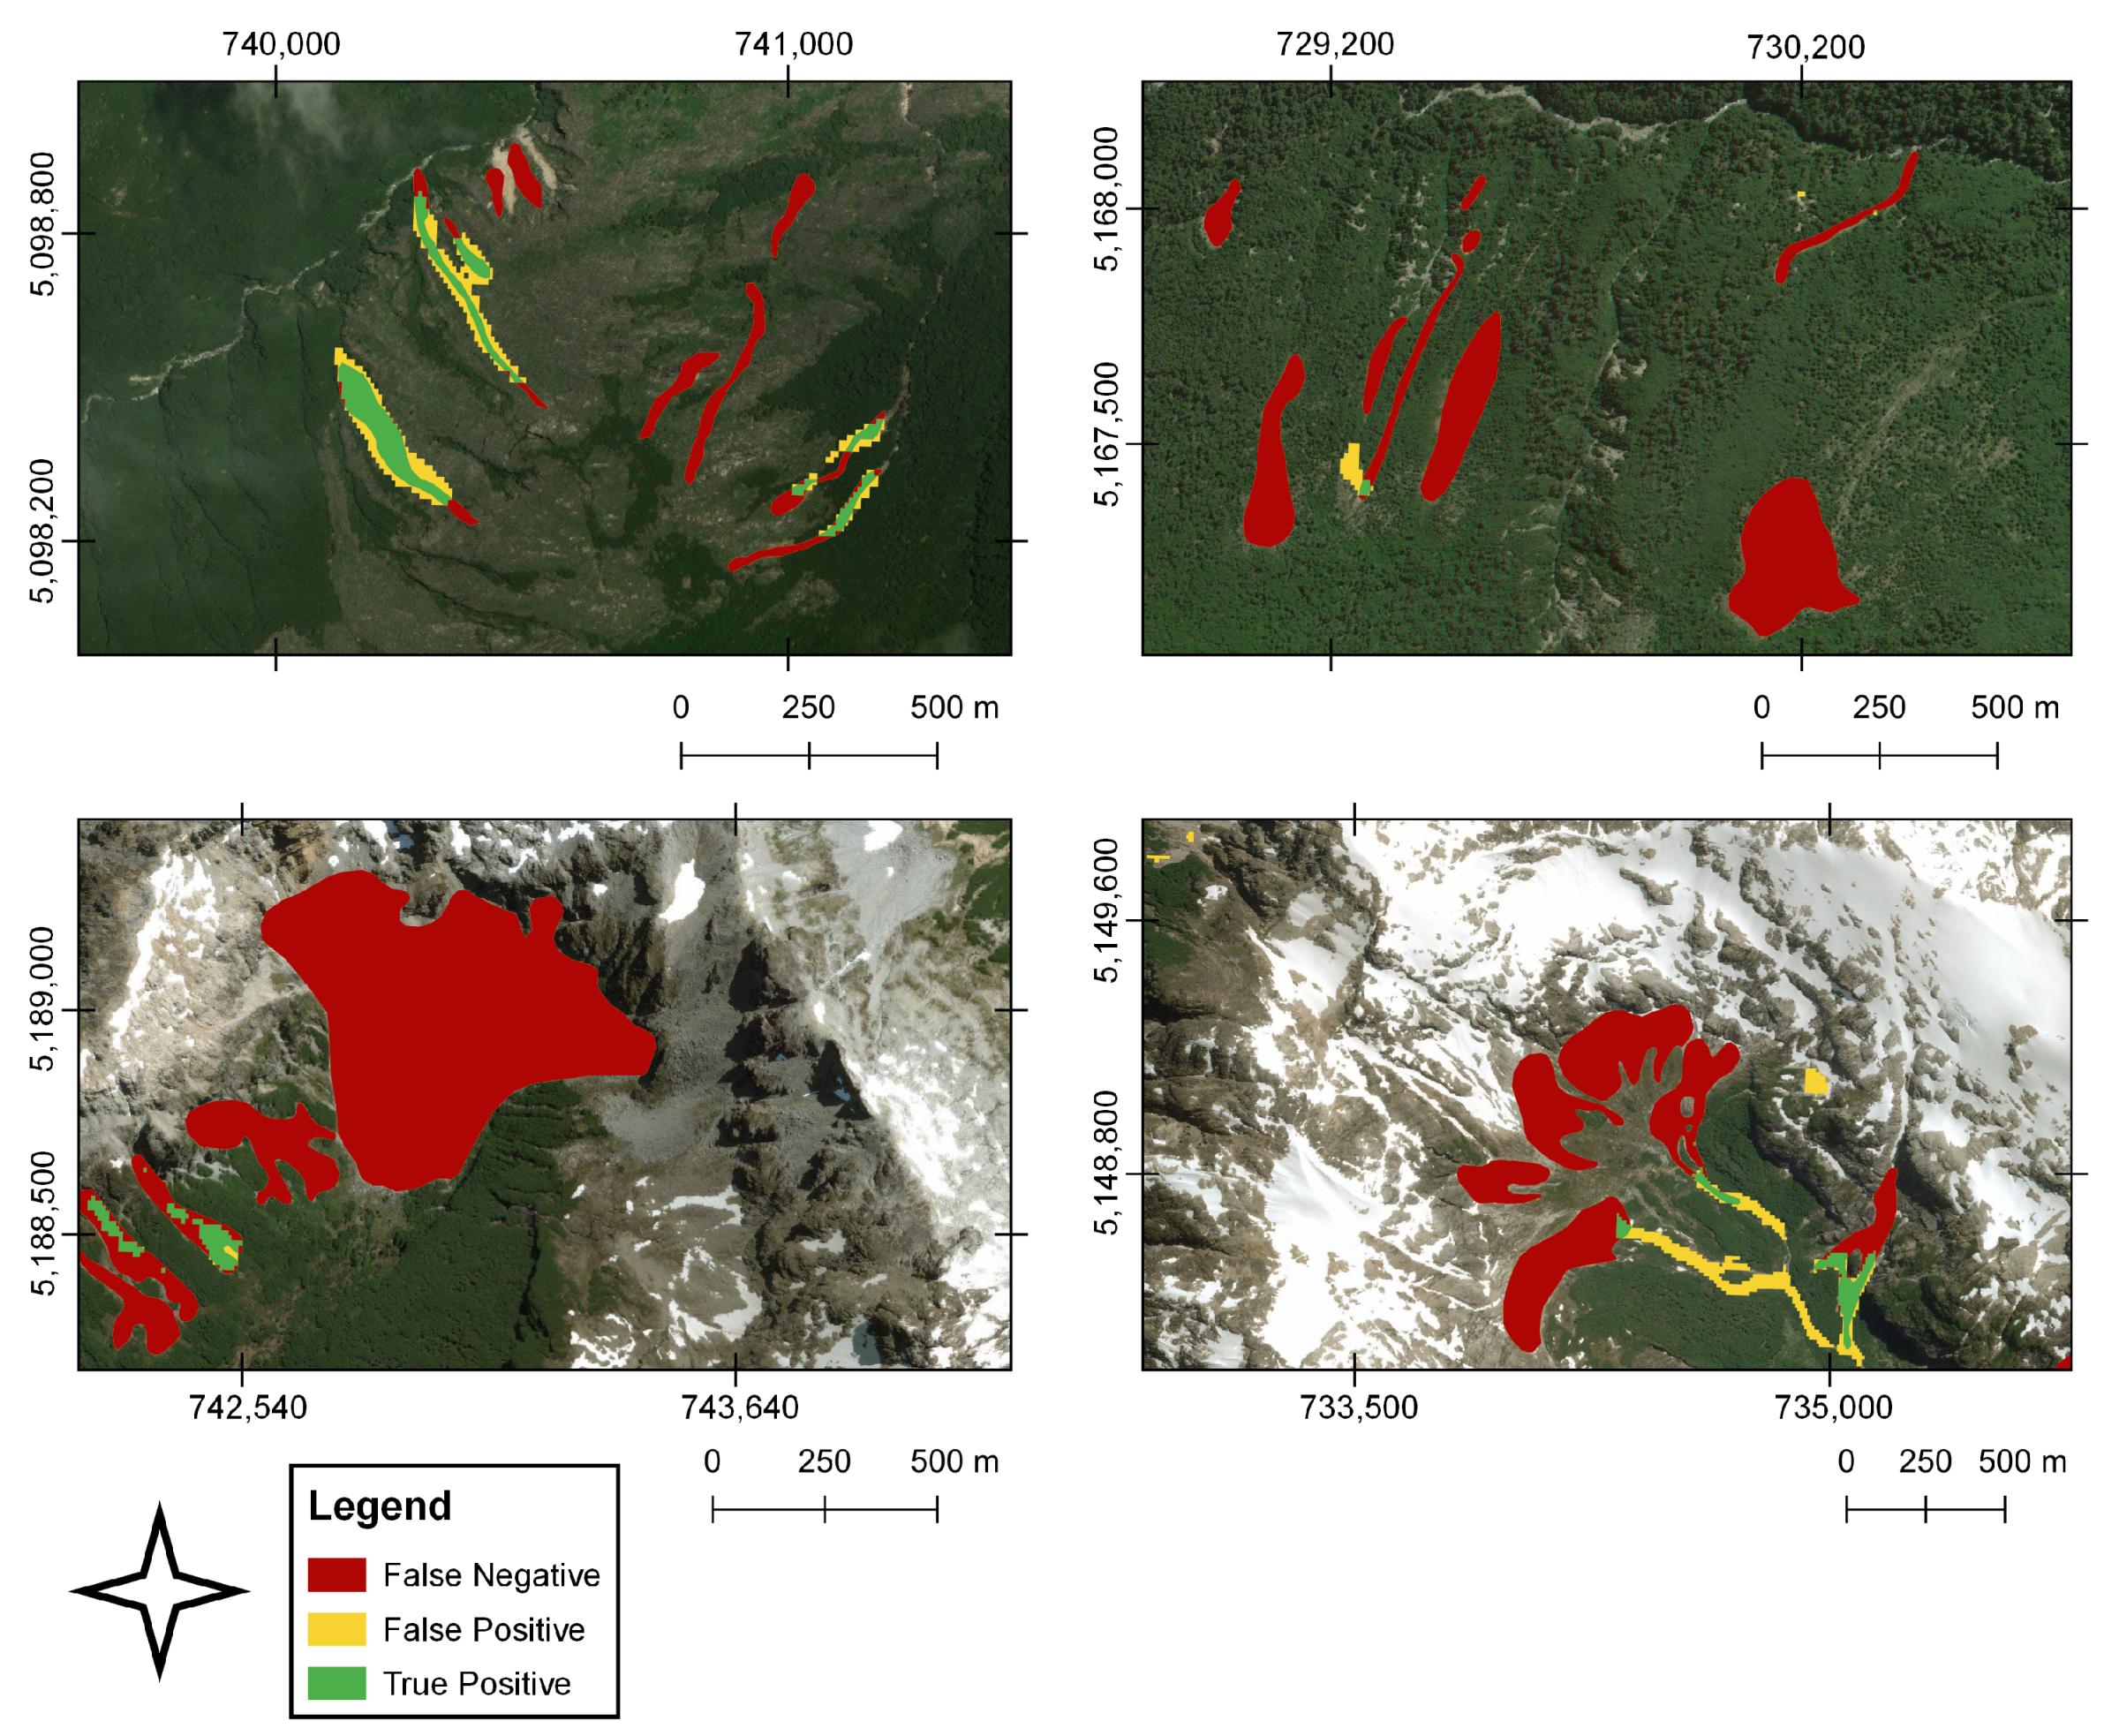
Figure 4). On the other hand, the FN, the landslides that were not detected by the algorithm but found in the training datasets, showed high length–width and area–perimeter ratios and, in general, correspond to landslides that present a more significant run-out and elongation, substantially exceeding in some cases, the ratios of the correctly identified landslides. We identified some errors associated with the segmentation of correctly detected landslides in areas with low or no surrounding vegetation cover. This occurs mainly in the escarpment of landslides that start above 1000 m altitude, where the soil cover corresponds to bare rock (Figure 5 bottom panels). Likewise, a limited prediction capacity was identified on snowy slopes, and to a lesser extent, on riverbanks, dirt roads-highways, constructions, and on the edge of landslides. These errors may be associated with reflectance effects that increased the number of FPs.

4. Discussion

4.1. Landslide Detection in the Patagonian Andes

We developed the first large-scale landslide detection model for the Patagonian Andes covering approximately 20,000 km2, making it one of the largest areas to train DL models for landslide detection. We seek to train a DL model to detect generic landslides. The idea is to evaluate if the DL model can improve our ability to automatically map such events in a large domain. One of the applications that we see is to use this trained model to detect landslides from two different dates, and by subtracting them, we would know the events that occurred between those dates. The DeepLabv3+ architecture used in our research has not been previously implemented for semantic landslide detection and segmentation. According to our results, the approach carried out through this DL architecture allows us to detect landslides with good levels of precision only using the spectral information derived from Sentinel-2 images (Table 2). Generally, the works carried out in other areas of the world use high-resolution images whose comparative advantages are limited by the cost of access to this type of data [7,12]. Based on our results, we observed similar performances when compared with recent research carried out in other mountainous regions of the world that have implemented similar deep learning architectures and images of the Sentinel-2 constellation [14,21,22,23]. We believe that our results successfully develop a new landslide detection model with open access data in a previously unassessed mountain range at the scale presented here.
Recent studies in different mountainous regions show performances similar to those obtained in our research using Sentinel-2 optical images; however, the data set tends to be complemented with topographic information from digital elevation models [14,21,23,24]. For example, landslide segmentation with an MCC of 0.69 [14] was achieved using the U-Net architecture. For its part, using a ResU-Net architecture, an F1-score of 0.73 [21], 0.68 [23] and 0.66 [24] was reached. On the other hand, using the ResU-Net-OBIA architecture, an F1-score of 0.76 [23] and 0.84 [24] was obtained. More recently, Schönfeldt et al. [25] used Sentinel-2 images to semantic segment landslides in basaltic plateaus to the east of the Andean Patagonia, reaching an F1-score of 0.51 with the AlexNet architecture and 0.45 using the U-Net architecture [25].

4.2. Model Implications

The landscape of Patagonia, like many of the world’s mountains, is situated in a complex and changing context with complex climatic conditions and increasingly unprecedented extremes in recent history [26]. On the other hand, a tectonic context with the capacity to generate earthquakes and eruptions that can induce significant changes in the landscape at different temporal and spatial scales [1,2,3]. We believe that the results presented here are an advance for implementing landslide monitoring and prediction models in Patagonian Andes. In this sense, although the results of the research have an ex post character, this methodology can be the basis for developing landslide detection models based on artificial intelligence that allow the generation of updated automated maps of landslides after the event disasters. It also makes it possible to explore the temporal reconstruction of these events and the environmental conditions that induce the instability of the slopes in Patagonian Andes. Training detection models with free access data and global coverage, such as Sentinel-2, allow the methodology to be scaled to other mountainous areas. In this sense, having a pre-trained model facilitates incorporating new data, allowing the algorithm to be easily transferred to another area of interest. On the other hand, it makes possible the continuous improvement of the model over time from corrections of the outputs.

4.3. Limitations and Challenges

The study area is part of an extensive biodiversity hotspot [27], which is why much of the training data corresponds to areas with vegetation affected by these disturbances. However, above 1000 m a.s.l. in which the vegetation is practically null, we observed important mapping errors in landslides detection (Figure 5). Similar problems have also recently been highlighted in the segmentation process when there is no vegetation [14]. In this sense, we agree that it is a significant challenge to be addressed in future works. The model also shows minor errors with riverbanks, dirt roads, and construction, but these are generally not significant problems and can be easily removed with filtering techniques. According to the exploratory analysis carried out on the evaluation data set, we observed that there are errors that may be associated with the shape and size characteristics of landslides; for example, FP are concentrated in complex and small shapes (Figure 3 and Figure 5). On the other hand, the FN corresponds to landslides that present run-out and elongation that in some cases substantially exceed the ratios of the correctly identified landslides. These results suggest that the information provided by the training datasets does not contain enough elements with these characteristics, so these deficiencies can be solved in future works with the incorporation of landslides with such geometries and, if necessary, with new approaches of training.
One of the main challenges to be addressed is the limitation associated with optical data. The model was trained using images with less than 5% cloudiness; these atmospheric conditions are only obtainable in summer seasons. The meteorological conditions of Patagonia would make it difficult to monitor these natural hazards using only optical data constantly. This could be addressed using SAR radar images such as those from Sentinel-1, whose properties are not affected by cloudy conditions [28]. However, the use of SAR images combined with artificial intelligence algorithms for landslide detection is still incipient [29]. Going in this direction is vital to strengthen the monitoring of landslides in the Andes and other regions of the world.

5. Conclusions

In this study, we manually generated the largest freely accessible landslide datasets in the Patagonian Andes (42–45°S), totaling 10,000 landslides in 20,000 km2. The landslide datasets especially delineated on Sentinel-2 images, allowed to train a model using the DeepLabv3+ DL network for semantic segmentation. We achieved a 0.75 accuracy for detecting landslides at the object level through the approach implemented in our investigation. The semantic segmentation reached a precision, recall, and F1-Score of 0.86, 0.74, and 0.79. When we evaluated the correlation of the predicted landslides and the manual datasets in terms of semantic segmentation, the model achieved a Matthews correlation coefficient of 0.59. In contrast, the geometric similarity of the correctly detected landslides measured through the Jaccard score reaches 0.70. After an in-depth analysis of the results, we observed errors associated with the geometric characteristics of the landslides and spectral properties of the landscape, whose effects can be addressed by incorporating new data sets that allow the collection of a broad spectrum of geomorphological characteristics and landslide spectra. Although we do not have a reference point for landslide detection models based on deep learning in the Andes, the results obtained reach values of quality indexes similar to those obtained in recent works developed in other mountainous regions of the world, using data sets generated from optical satellite images. The generated model and free access to data will reduce the time and resources needed for the compilation and systematic updating of landslide inventories in the Andes or other regions of the world, will allow the automated generation of landslide maps after disasters. It will be a tool that will promote the development of predictive landslide models. Finally, we believe that despite the results presented being promising, the temporal factor and cloudy conditions are critical challenges to be addressed; in this sense, everything indicates that SAR images will be a vital support for the development of more sophisticated models.

Author Contributions

B.M., A.G.-P., M.S.-V. and M.L.-S. designed the methods; A.G.-P. and M.L.-S. preformed the experiments; B.M., E.L., M.S.-V. and M.L.-S. interpreted the results; M.S.-V., M.L.-S., C.G.-M., N.C. and E.L. supervised; B.M., A.G.-P., M.S.-V., M.L.-S. and E.L. wrote the original draft; M.S.-V. acquired funding. All authors have read and agreed to the published version of the manuscript.

Funding

This research was funded by by the Chilean Science Council (ANID) through the Program of International Cooperation (PII-180008), Anillo (ACT210080), PATSER (ANID/R20F0002), and Water Research Center For Agriculture and Mining, CRHIAM (ANID/FONDAP/15130015).

Informed Consent Statement

Not applicable.

Data Availability Statement

The generated landslide datasets is provided as a shapefile that includes the geometries, centroid coordinates, and Sentinel-2 satellite images used to map each landslide. The landslide datasets generated by the DL algorithm in the test zone is provided as a shapefile, along with the information associated with the model evaluation. Access to this data set can be made through the link https://doi.org/10.5281/zenodo.7057656 (accessed on 8 September 2022) to the Zenodo platform. The Sentinel-2 images used in this research can be obtained directly from the European Space Agency (ESA) Copernicus Open Access Hub download platform (https://scihub.copernicus.eu/) (accessed on 20 March 2021).

Acknowledgments

We would like to thank the research unit at the University of La Frontera for their support with the English review and support.

Conflicts of Interest

The authors declare no conflict of interest.

References

  1. Korup, O.; Seidemann, J.; Mohr, C.H. Increased landslide activity on forested hillslopes following two recent volcanic eruptions in Chile. Nat. Geosci. 2019, 12, 284–289. [Google Scholar] [CrossRef]
  2. Morales, B.; Lizama, E.; Somos-Valenzuela, M.A.; Lillo-Saavedra, M.; Chen, N.; Fustos, I. A comparative machine learning approach to identify landslide triggering factors in northern Chilean Patagonia. Landslides 2021, 18, 2767–2784. [Google Scholar] [CrossRef]
  3. Sepúlveda, S.A.; Serey, A.; Lara, M.; Pavez, A.; Rebolledo, S. Landslides induced by the April 2007 Aysén Fjord earthquake, Chilean Patagonia. Landslides 2010, 7, 483–492. [Google Scholar] [CrossRef]
  4. Somos-Valenzuela, M.A.; Oyarzún-Ulloa, J.E.; Fustos-Toribio, I.J.; Garrido-Urzua, N.; Chen, N. The mudflow disaster at Villa Santa Lucía in Chilean Patagonia: Understandings and insights derived from numerical simulation and postevent field surveys. Nat. Hazards Earth Syst. Sci. 2020, 20, 2319–2333. [Google Scholar] [CrossRef]
  5. Guzzetti, F.; Mondini, A.C.; Cardinali, M.; Fiorucci, F.; Santangelo, M.; Chang, K.T. Landslide inventory maps: New tools for an old problem. Earth-Sci. Rev. 2012, 112, 42–66. [Google Scholar] [CrossRef]
  6. Mohan, A.; Singh, A.K.; Kumar, B.; Dwivedi, R. Review on remote sensing methods for landslide detection using machine and deep learning. Trans. Emerg. Telecommun. Technol. 2021, 32, 1–23. [Google Scholar] [CrossRef]
  7. Ghorbanzadeh, O.; Blaschke, T.; Gholamnia, K.; Meena, S.; Tiede, D.; Aryal, J. Evaluation of Different Machine Learning Methods and Deep-Learning Convolutional Neural Networks for Landslide Detection. Remote Sens. 2019, 11, 196. [Google Scholar] [CrossRef]
  8. Bacha, A.S.; Van Der Werff, H.; Shafique, M.; Khan, H. Transferability of object-based image analysis approaches for landslide detection in the Himalaya Mountains of northern Pakistan. Int. J. Remote Sens. 2020, 41, 3390–3410. [Google Scholar] [CrossRef]
  9. LeCun, Y.; Bengio, Y.; Hinton, G. Deep learning. Nature 2015, 521, 436–444. [Google Scholar] [CrossRef]
  10. Sameen, M.I.; Pradhan, B. Landslide Detection Using Residual Networks and the Fusion of Spectral and Topographic Information. IEEE Access 2019, 7, 114363–114373. [Google Scholar] [CrossRef]
  11. Prakash, N.; Manconi, A.; Loew, S. Mapping Landslides on EO Data: Performance of Deep Learning Models vs. Traditional Machine Learning Models. Remote Sens. 2020, 12, 346. [Google Scholar] [CrossRef]
  12. Yi, Y.; Zhang, W. A New Deep-Learning-Based Approach for Earthquake-Triggered Landslide Detection From Single-Temporal RapidEye Satellite Imagery. IEEE J. Sel. Top. Appl. Earth Obs. Remote Sens. 2020, 13, 6166–6176. [Google Scholar] [CrossRef]
  13. Qi, W.; Wei, M.; Yang, W.; Xu, C.; Ma, C. Automatic Mapping of Landslides by the ResU-Net. Remote Sens. 2020, 12, 2487. [Google Scholar] [CrossRef]
  14. Prakash, N.; Manconi, A.; Loew, S. A new strategy to map landslides with a generalized convolutional neural network. Sci. Rep. 2021, 11, 9722. [Google Scholar] [CrossRef] [PubMed]
  15. Buslaev, A.; Iglovikov, V.I.; Khvedchenya, E.; Parinov, A.; Druzhinin, M.; Kalinin, A.A. Albumentations: Fast and Flexible Image Augmentations. Information 2020, 11, 125. [Google Scholar] [CrossRef]
  16. Chen, L.C.; Zhu, Y.; Papandreou, G.; Schroff, F.; Adam, H. Encoder-decoder with atrous separable convolution for semantic image segmentation. In Proceedings of the European Conference on Computer Vision (ECCV), Munich, Germany, 8–14 September 2018; pp. 801–818. [Google Scholar]
  17. He, K.; Zhang, X.; Ren, S.; Sun, J. Deep residual learning for image recognition. In Proceedings of the IEEE Conference on Computer Vision and Pattern Recognition, Las Vegas, NV, USA, 27–30 June 2016; pp. 770–778. [Google Scholar]
  18. Abraham, N.; Khan, N.M. A novel focal tversky loss function with improved attention u-net for lesion segmentation. In Proceedings of the 2019 IEEE 16th International Symposium on Biomedical Imaging (ISBI 2019), Venice, Italy, 8–11 April 2019; pp. 683–687. [Google Scholar]
  19. Kingma, D.P.; Ba, J. Adam: A method for stochastic optimization. arXiv 2014, arXiv:1412.6980. [Google Scholar]
  20. Gonzalo-Martín, C.; García-Pedrero, A.; Lillo-Saavedra, M. Improving deep learning sorghum head detection through test time augmentation. Comput. Electron. Agric. 2021, 186, 106179. [Google Scholar] [CrossRef]
  21. Ghorbanzadeh, O.; Crivellari, A.; Ghamisi, P.; Shahabi, H.; Blaschke, T. A comprehensive transferability evaluation of U-Net and ResU-Net for landslide detection from Sentinel-2 data (case study areas from Taiwan, China, and Japan). Sci. Rep. 2021, 11, 14629. [Google Scholar] [CrossRef]
  22. Shahabi, H.; Rahimzad, M.; Tavakkoli Piralilou, S.; Ghorbanzadeh, O.; Homayouni, S.; Blaschke, T.; Lim, S.; Ghamisi, P. Unsupervised Deep Learning for Landslide Detection from Multispectral Sentinel-2 Imagery. Remote Sens. 2021, 13, 4698. [Google Scholar] [CrossRef]
  23. Ghorbanzadeh, O.; Shahabi, H.; Crivellari, A.; Homayouni, S.; Blaschke, T.; Ghamisi, P. Landslide detection using deep learning and object-based image analysis. Landslides 2022, 19, 929–939. [Google Scholar] [CrossRef]
  24. Ghorbanzadeh, O.; Gholamnia, K.; Ghamisi, P. The application of ResU-net and OBIA for landslide detection from multi-temporal sentinel-2 images. Big Earth Data 2022, 6, 1–26. [Google Scholar] [CrossRef]
  25. Schönfeldt, E.; Winocur, D.; Pánek, T.; Korup, O. Deep learning reveals one of Earth’s largest landslide terrain in Patagonia. Earth Planet. Sci. Lett. 2022, 593, 117642. [Google Scholar] [CrossRef]
  26. Cai, W.; McPhaden, M.J.; Grimm, A.M.; Rodrigues, R.R.; Taschetto, A.S.; Garreaud, R.D.; Dewitte, B.; Poveda, G.; Ham, Y.G.; Santoso, A.; et al. Climate impacts of the El Ni no–Southern Oscillation on South America. Nat. Rev. Earth Environ. 2020, 1, 215–231. [Google Scholar] [CrossRef]
  27. Myers, N.; Mittermeier, R.A.; Mittermeier, C.G.; da Fonseca, G.A.B.; Kent, J. Biodiversity hotspots for conservation priorities. Nature 2000, 403, 853–858. [Google Scholar] [CrossRef]
  28. Handwerger, A.L.; Huang, M.H.; Jones, S.Y.; Amatya, P.; Kerner, H.R.; Kirschbaum, D.B. Generating landslide density heatmaps for rapid detection using open-access satellite radar data in Google Earth Engine. Nat. Hazards Earth Syst. Sci. 2022, 22, 753–773. [Google Scholar] [CrossRef]
  29. Nava, L.; Bhuyan, K.; Meena, S.R.; Monserrat, O.; Catani, F. Rapid Mapping of Landslides on SAR Data by Attention U-Net. Remote Sens. 2022, 14, 1449. [Google Scholar] [CrossRef]
Figure 1. Location of the area of study. The points represent the datasets of landslides generated between 42–45°S along the Patagonian Andes.
Remotesensing 14 04622 g001
Figure 2. DeepLabV3+ Architecture.
Remotesensing 14 04622 g002
Figure 3. Exploratory analysis of the model results considering the geometry of landslides correctly and incorrectly detected by the algorithm.
Remotesensing 14 04622 g003
Figure 4. Landslide mapping using the trained model in a test area in Patagonian Andes. The best model results are highlighted.
Remotesensing 14 04622 g004
Figure 5. Landslide mapping using the trained model in a test area in Patagonian Andes. The main errors of the automatic mapping are highlighted.
Remotesensing 14 04622 g005
Table 1. Tiles number and dates of Sentinel-2 images used in this work.
Tile NumberRelative Orbit NumberDate
T19GBP5320200220
T18GXS20210204
T18GXU20210207
T18GYR20210224
T18GYS20210130
T18GXT20210209
T18GYT20210209
Table 2. Performance of the algorithm in the testing area.
Model EvaluationMetricsScoringNumber (TP/FP)
DetectionPrecision0.75265/90
SegmentationPrecision0.86-
Recall0.74-
F1-score0.79-
Correlation and similarityMatthews correlation coefficient0.59-
Jaccard score0.70-
Publisher’s Note: MDPI stays neutral with regard to jurisdictional claims in published maps and institutional affiliations.

